Preprint
Article

DSC Phase Transition Profiles Analysed by Control Charts to Determine Markers for the Authenticity and Deterioration of Flaxseed Oil during Storage

Altmetrics

Downloads

117

Views

28

Comments

0

A peer-reviewed article of this preprint also exists.

Submitted:

12 July 2023

Posted:

13 July 2023

You are already at the latest version

Alerts
Abstract
An approach of implementing X-bar and R control charts as a statistical control tool to monitor changes in the melting profile of fresh and stored flaxseed oils by differential scanning calorimetry (DSC) was used. Phase transition melting profiles were collected after 0, 2, 4, 6 months of storing flaxseed oils, originated from five different cultivars. Four peaks at around -36, -30, -25, -12 °C were identified using the deconvolution analysis procedure, which enabled data to be collected on peak temperature (T), peak height (h) and the peak area (A), as well as the ratio calculated from these parameters. Control charts of DSC parameters, linked to the second peak (h2, A2) and calculated ratios of those parameters showed an increasing or decreasing trend within the storage time, thus were considered to be indicators of oil deterioration. Since DSC parameters related to the first peak (h1, A1) and third peak (h3, A3) remained unchanged within storage, they were established as the markers of flaxseed oil authenticity.
Keywords: 
Subject: Biology and Life Sciences  -   Food Science and Technology

1. Introduction

One of the most popular cold-pressed plant oils, found almost on the shelf of every supermarket, is flaxseed oil. The unique profile of fatty acids ranked this oil among the healthiest edible oils in terms of the content of polyunsaturated fatty acids (PUFA), especially from the n-3 (omega-3) group. Also called linseed, this multipurpose plant belongs to the Linaceae family, and grows well in the temperate climate zone. According to FAOSTAT’s report from 2020, annually 738,940 thousand tons of flaxseed oil are been produced to meet the increasing demand, with China dominating production, followed by Belgium, United States, Germany, and India [1]. Research has demonstrated that the quality and utility of products obtained from this plant depends on the variety [2], climate [3] seeds maturity [4] and extraction process [5]. Reasonably, edible flaxseed oil is formulated by the cold-pressing process, which enables the retention of an outstanding combination of triacylglycerols (TAG’s) and acylglycerols (mono- and diacylglycerol), and other bioactive compounds (i.e. phenols, sterols, tocopherols, phospholipids, lignans, pigments). Thus, cold-pressing of seeds has become popular nowadays, and some of these valuable compounds, e.g. tocopherols and phenols, play a role in the stability of the oils and exert significant antioxidant properties upon consumption. Primarily, cold-pressed flaxseed oils have been acknowledged as the richest plant source of α-linolenic fatty acid (ALA; C18:3, n-3;) and linoleic acid (LA; C18:2, n-6;), being polyunsaturated fatty acids (PUFA’s) up to 50%-63% and 16%-26% respectively [2,6], which are crucial for the human diet. Accompanied to the fatty acids, the presence of fat-soluble vitamins like vitamin E (mainly as γ-tocopherol), phyto-estrogenic lignans (secoisolariciresinol diglucoside; SDG), and dietary fiber has made this non-traditional oil very popular amongst researchers, due to its manifold applications [7,8,9]. Here it is worth noting that flaxseed oils are used not only as edible oils in bottles but also in pharmacies as a carrier of fat-soluble supplements (e.g. vitamin D). Meanwhile, the benefits of cold-pressed flaxseed oil come with an inevitable oddity, since the presence of many PUFAs make this oil very prone to peroxidation, which can additionally be accelerated by other natural compounds present in oil, such as chlorophylls or phospholipids. Thus, ongoing anti- and pro-oxidant interactions makes cold-pressed oils less predictable in terms of their shelf life stability [10]. Although the regular shelf life for vegetable oils has been accepted as 6 to 12 months [10], instructions from flaxseed oil producers clearly state the oxidation proneness of this oil, as the stability time has been pinned down at 5 weeks to 3 months [11]. This uncertain shelf-life assumption urged researchers to find the reasons and indicators responsible for the deterioration of flaxseed oil quality. In chemical analysis, alongside p-anisidine (p-AV), acid (AV) and peroxide (PV) values are the most common indicators for observing the stage of rancidity. However, other methods were also used, for instance, conjugated diene (CD) and triene (CT) values [12,13], Rancimat analysis [14], and isothermal and dynamic analysis by DSC [13].
With the furtherance of achievements in food science, the ultimate strategy for nowadays was to use instruments which are supposed to be not only ecological and environment-friendly but also a time-saver. Recent advancements in thermo-analytical assessment have contributed substantially to the analysis of fats and oils characterization. Differential scanning calorimetry (DSC) is an advanced analytical instrument which has broad applications dedicated to explaining the thermal behavior of lipid compounds, and is thus able to provide significant data regarding the authenticity and stability profiles of fats and oils [15]. Compared to conventional chemical analyses, assessment by DSC offers a significant database, expressed as the exothermic/endothermic phase transition phenomena manifested by curve changes as a function of temperature, which is related to the lipids composition of the oil. Thus, unique and specific DSC curves for flaxseed oils can also be obtained as the cooling and melting profile [2,16]. Bearing in mind that such a crystallization or melting profile could be used as a fingerprint to assess authenticity and to ensure the safety and quality of this oil, it is important to investigate whether these profiles are stable over the shelf life of the oils. So far, there have been no such studies showing how the crystallization or melting profile changes within the storage time. Considering that flaxseed oil may be nutritionally degraded due to adulteration with other less expensive oils or due to rancidity, it is important to monitor for both of these risks. Thus, in this study, the aim was to evaluate changes in the DSC melting profiles of flaxseed oil of various cultivars over their shelf life using a control chart as one of the statistical process control tools.

2. Materials

2.1. Materials

Flaxseed oils were obtained from three cultivars of flax i.e. Bukoz (FL BU), Dolguniec (FL DL), Szafir (FL SZA, FL SZB) and one sample of unknown variety (FL NN). All the samples are brown-seeded flaxseed varieties, procured in 2020. The seeds were pressed to obtain the oils, while keeping the temperature under 50°C. The pressed oils were left for 24 h for decantation and stored in brown glass bottles. Storage analysis was carried out for the samples from the fresh condition until the sixth month of shelf life. During the shelf life, the samples were kept air-tight at room temperature (23-25°C) under natural light exposure.

2.2. Methods

2.2.1. Fatty Acid Composition

Gas chromatography-Flame Ionization Detector (GC-FID) was employed for the determination of fatty acid composition. 15 mg of oil was dissolved in 1 mL of hexane (for HPLC, Sigma Aldrich) and 1 mL of 0.4 N sodium methoxide was added. The samples were stirred and left for 15 minutes, then 5 mL of distilled water was added, and the top layer was taken off. By following the AOCS official method [17], fatty acid methyl esters were analysed using a Trace 1300 chromatograph (Thermo Fisher Scientific, Waltham, Massachusetts, USA). Separation was performed on a Supelcowax 10 capillary column (30 m × 0.2 mm × 0.2 μm), and injection was performed in split less mode. The sample volume was 1 µL. Hydrogen was used as the carrier gas. The initial furnace temperature was 160 °C, and was increased from 12 °C/min to 220 °C. The temperature of 220 °C was maintained for 20 minutes. Fatty acid methyl esters were identified based on the retention times and comparison with the standard of 37-Component FAME Mix (Supelco, Sigma Aldrich). All the samples were analysed in two replications.

2.2.2. Chemical Analyses Oxidative Stability of Fresh and Stored Flaxseed Oil

Acid value (AV) was determined by a volumetric titration formula following the standard AOCS method [18]. Peroxide value (PV) was measured by determining the milliequivalents of excess active oxygen content in the oil samples by following the standard ISO method [19]. Secondary oxidation products were determined by measuring the p-Anisidine values (p-AV) according to the standard [20]. The total oxidation rate of the oil samples was expressed as TOTOX value and calculated from the formula based on reported p-Anisidine and peroxide value data, TOTOX = p-AV + 2PV [19]

2.2.3. Melting Phase Transition Analysis by Differential Scanning Calorimetry (DSC) of Flaxseed Oil during Storage

Melting analysis of flaxseed oils was carried out with modifications according to the method used for butterfat [21]. A Perkin Elmer differential scanning calorimeter DSC 8500 PerkinElmer (Waltham, Massachusetts, USA), equipped with an Intracooler II and running with Pyris software (Perkin Elmer, Waltham, Massachusetts, USA), was used. Samples of ca. 6-7 mg were weighed into aluminium pans of 20 µL (Perkin Elmer, No. 0219-0062, Waltham, Massachusetts, USA) and hermetically sealed. The reference was an empty, hermetically sealed aluminium pan and nitrogen (99.999% purity) was used as the purge gas. Analysis started with cooling the oil sample at a scanning rate 2 °C/min from a temperature of 30 °C to -65 °C, after which it was heated at scanning rates 5 °C/min from -65 °C to 30 °C. For each measurement at a given scanning rate, the calibration procedure was completed with the correct scanning rate. After the analysis, the DSC files were converted to the ASCII format and were analysed using Origin Pro software, version 2020 (OriginLab Corporation, Northampton, MA, USA). The temperature of each peak (T), amplitude (peak height) and area of each peak of the transition (A) were determined from curves by use of the fitting procedures. The multicomponent DSC curves were deconvoluted with PeakFit, using the nonlinear least squares fitting procedure included in the Origin Pro software. All measurements were performed in duplicate for each sample.

2.2.4. Statistical Analysis

The results were presented in the form of mean and standard deviation. Statistical analysis of recorded results was performed using Statistica 13.3 software (TIBCO Software Inc. USA) at a significance level of α=0.05. The first stage in the statistical analysis consisted in verifying variance homogeneity using the Hartley-Cochran-Bartlett test. In the case of variance homogeneity, one-way analysis of variance (ANOVA) was used, and Tukey’s test was applied to create statistically homogeneous groups. In turn, when variances were not homogeneous, non-parametric tests were used, i.e. ANOVA and the Kruskal-Wallis rank test. Additionally, principal component analysis (PCA) was performed to show the relationships between variables and detect some patterns between variables and objects. X-Bar and R (arithmetic mean and range) control charts were used to test the stability of selected melting profile parameters. The X-bar and R control chart were used with continuous/variable data when subgroup or sample size was between 2 and 15. The X bar chart is based on a calculation of the average level of the parameter being monitored, while the R chart showed the range i.e. difference between the smallest and largest value in each sample at each time point of storage, revealing the variability of the variation.

3. Results

3.1. Physicochemical Characteristics of Fresh and Stored Flaxseed Oils

Physicochemical characteristics of fresh (0 month) and stored (6th month) flaxseed oils included the fatty acid composition and chemical analyses of oxidative stability (AV, PV, p-AV, TOTOX).

3.1.1. Fatty Acid Content

The abundance of PUFA (up to 73%) with 16% of monounsaturated fatty acids (MUFA) and 8% of saturated fatty acids (SFA) was determined in all flaxseed oils, as shown in Figure 1. The predominant fatty acid was α-linolenic acid (ALA, C18:3, n-3), which contributed up to 63% of the total fatty acids. Between oil samples, FL_NN showed the lowest quantity of ALA (55%), of which FL_SZA showed the highest quantity of 63%. This quantity is comparatively higher than that found in other studies on commercial oils from the same region [14]. Despite the presence of three unsaturated carbon bonds, this fatty acid remained stable and showed no significant differences (p > 0.05) for all oil samples after six months’ storage. Next, abundant PUFA, linoleic acid (C18:2, LA), was detected as the highest 16% for the Bukoz variety. The data obtained is comparable to the results of other researchers [22]. Of the MUFAs, oleic acid is distributed amongst varieties in a range from 14% to 18% of total FA and no significant differences were observed between 0 and 6 months of storage for all the oil samples (p > 0.05). The presence of two SFAs, i.e. palmitic acid (C16:0) and stearic acid (C18:0), up to 4% and 3% respectively was observed. Summing up the entire data set for 0 and 6 months of oil storage showed that there are no significant differences in the composition of fatty acids between fresh and stored oils (p> 0.05). This finding about the changes in fatty acids after storage time analysis can be compared with the another study on flaxseeds stored for 128 days, which found no changes in fatty acid composition after the storage time [23]. Also, another study showed that, cold pressed flaxseed oils stored for six months in room condition exhibited no significant differences for SFA, MUFA or PUFA, which is linear to data found from our study [24].

3.1.2. Oxidative Stability Analysis of Flaxseed Oil

Conventional chemical analysis was carried out to detect any deterioration of oil samples after six months’ shelf life. Acid value (AV) measurement results, expressing the amount of free fatty acids, are shown in Table 1. Analyzed samples from different varieties showed increased hydrolytic phenomena after six months, as the values increased for all of them, particularly the highest AV was found for the sample FL_NN, which was 3.25, (statistically significant at p ≤ 0.05) after shelf life. However, none of the samples exceeded the standard limit (4.0 mg KOH/g Oil) provided by Codex Alimentarius [25]. Similar propensity was assessed for peroxide values and p-Anisidine values obtained for all varieties. Peroxide values measured primary oxidation compound formation in samples like aldehydes and ketones, which gradually generates a musty smell and promotes rancidity. After shelf life, the FL_SZB sample produced the highest (p ≤ 0.05) level of primary oxidation product (15.57), which is still within the range of the acceptable limit from the given standard (up to 15 milliequivalents of active oxygen/kg oil) [25]. For storage time analysis, p-Anisidine values are considered more reliable, as they provide information about secondary oxidation products (e.g. 2-alkenals and 2,4-alkadienals as a result of hydroperoxide decomposition, and unsaturated aldehydes) [26]. As an indicator of oxidative rancidity, the p-AV values presented in Table 1 show that all samples presented an increased level of secondary oxidation phenomena, where the FL_NN sample was the highest at 2.47 (p ≤ 0.05). The overall oxidation state can be assessed by means of the TOTOX value, where the sample FL_SZB exhibits the highest level of oxidation (33.61) amongst all varieties after the shelf-life period. Changes in oxidation states determined by other authors can be compared with this study. Similar results were found by authors who stored flaxseed oils at room temperature and presented a significant rise in oxidative status determined by AV, PV and p-AV values [12]. Authors from the same region [14] performed storage analysis of commercial oils after storing them in a refrigerator (4 ± 2℃). Their results show significant level of increase for all AV, PV, p-AV values after six month of shelf life.
The unexpected results showing no changes in the percentage of individual fatty acids after 6 months of storage (Figure 1) and significant changes in oxidative stability indicators (Table 1), may suggest that the oxidative changes that occur in the oils come from the fraction of free fatty acids or mono- or diacylglycerols,. It should be noted here that the procedure for determining fatty acids includes extraction with hexane, which dissolves only the TAG, unlike the free fatty acids and the rest of the acylglycerols.

3.2. Analysis of the DSC Melting Profiles of Flaxseed Oils during Shelf Life

3.2.1. DSC Melting Profile Changes during Storage of Flaxseed Oil

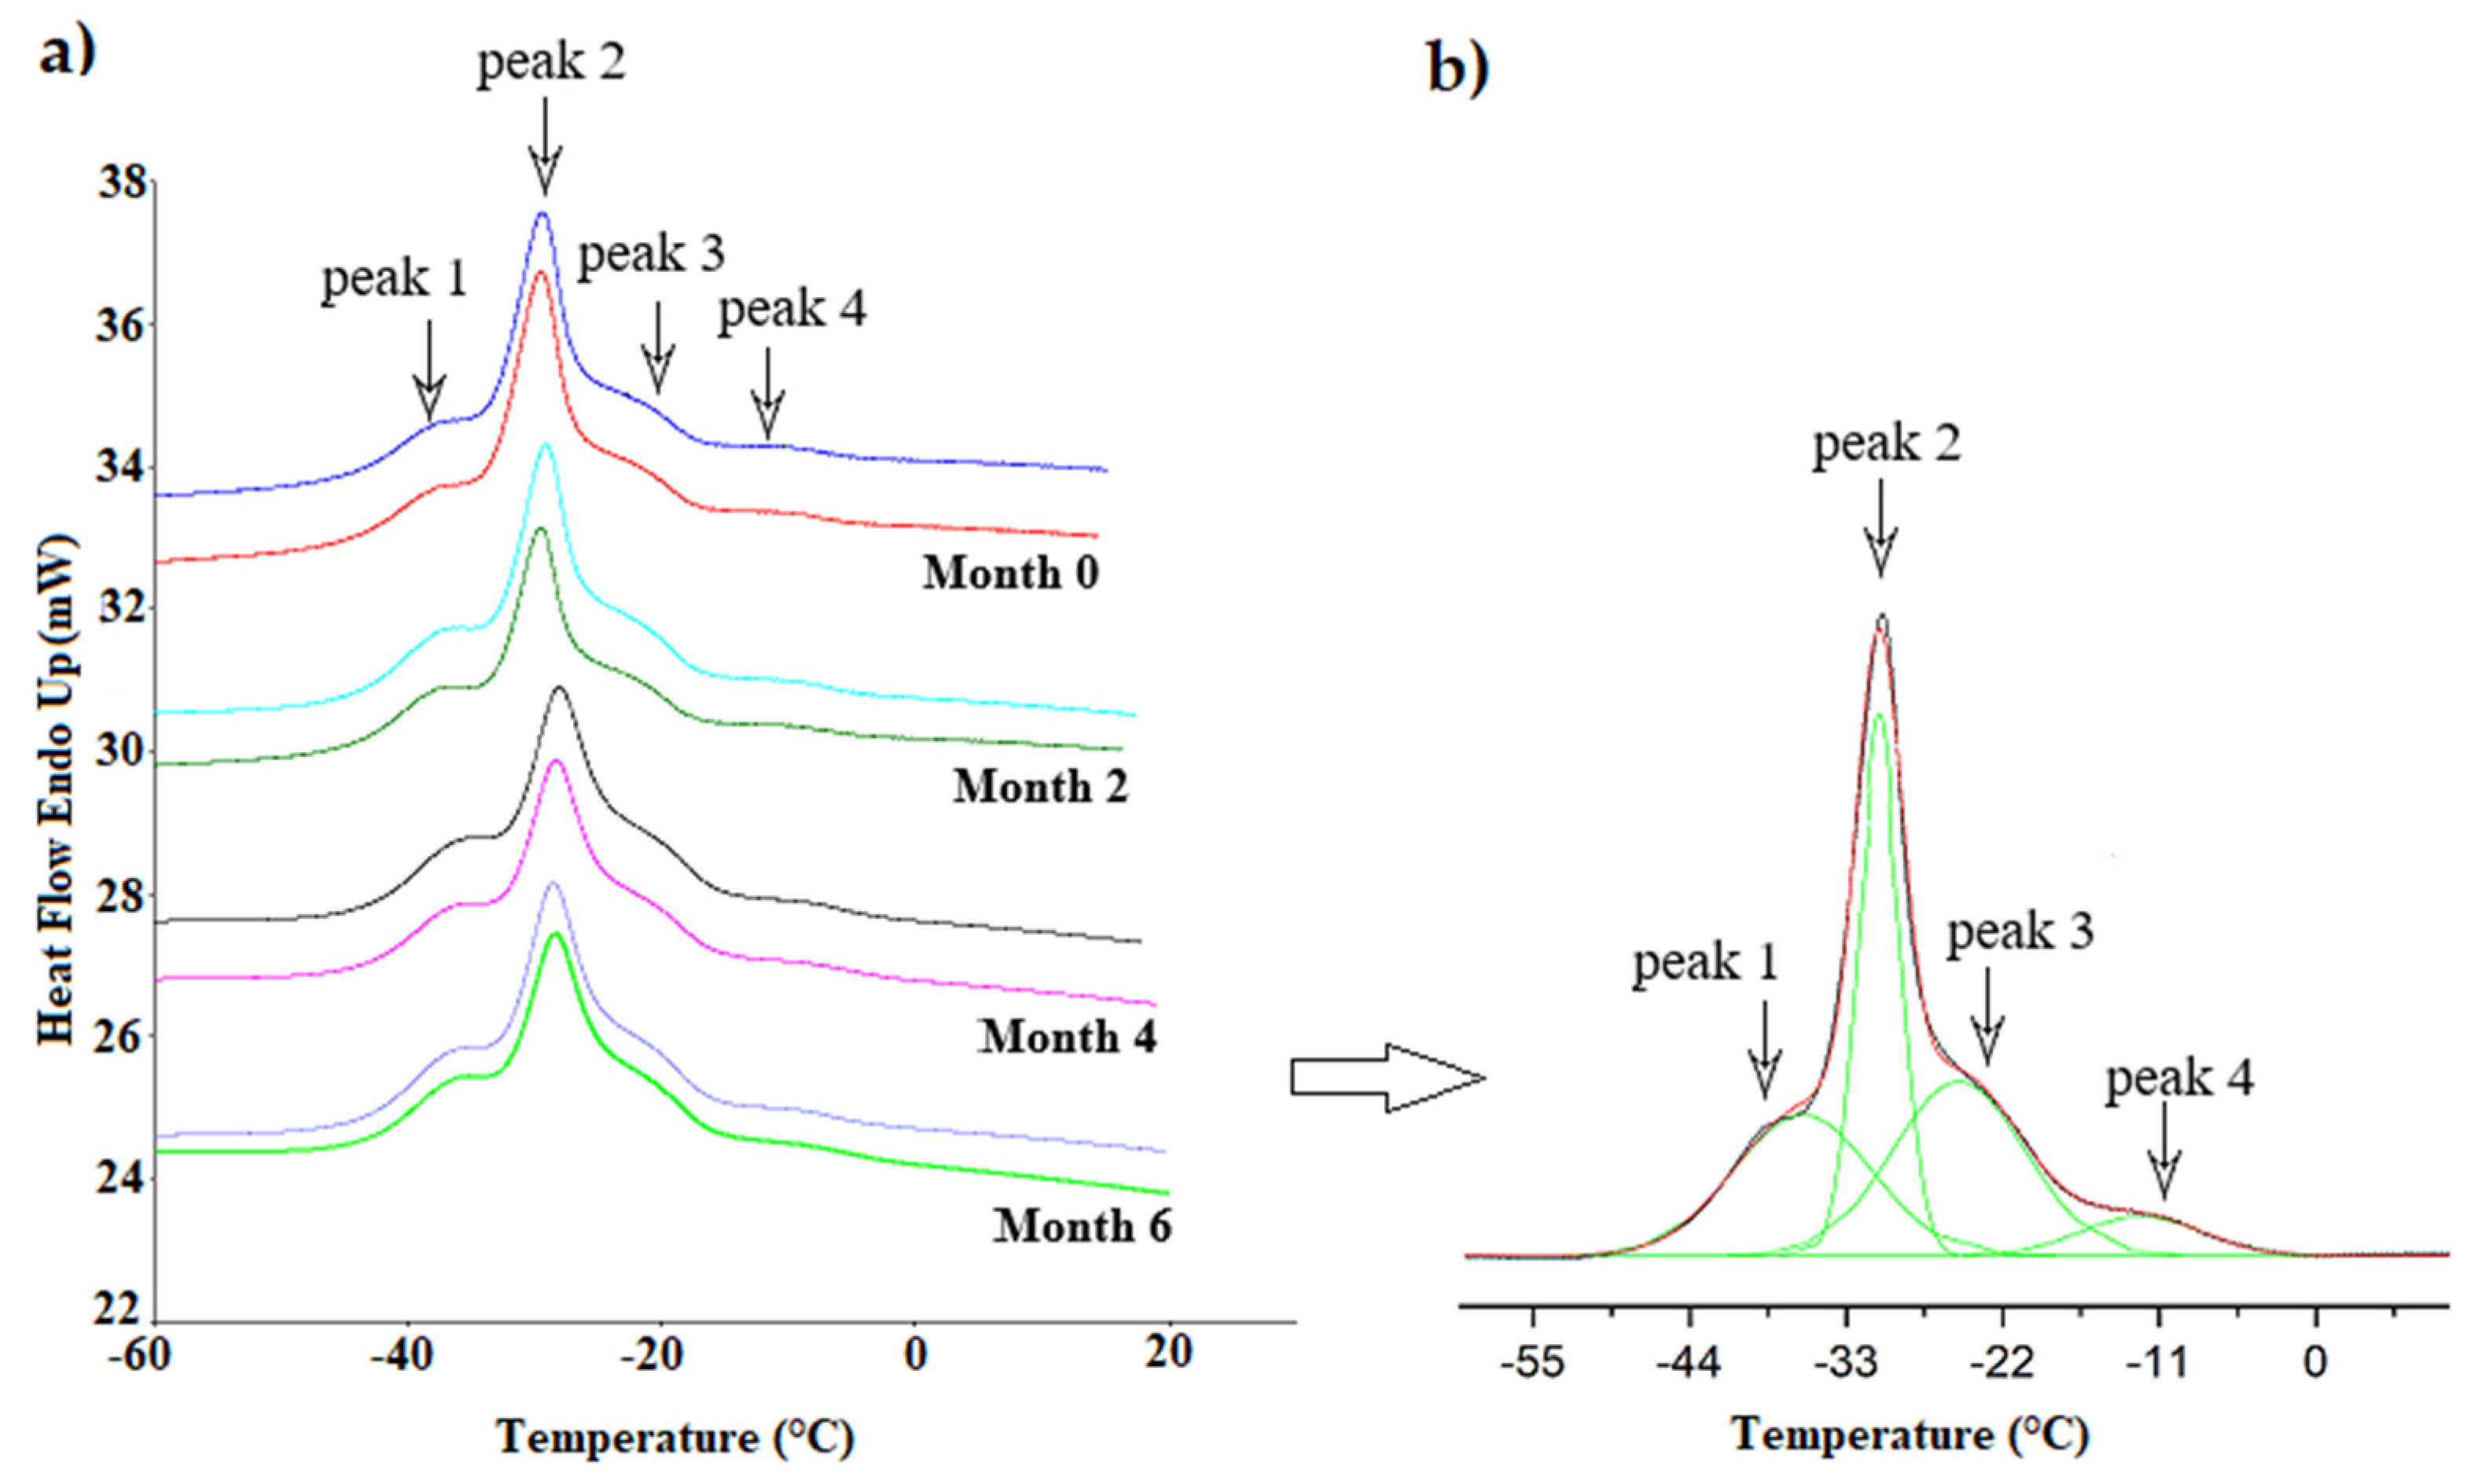
DSC analysis of melting profiles was carried out for all flaxseed oil varieties throughout the shelf life (0, 2, 4, 6 months) to determine the stability of the thermodynamic parameters. Figure 2a, illustrates the endothermic curves generated from phase transition of melting a flaxseed oil sample of the Szafir variety. The melting process for the samples was followed by prior crystallization of the samples at -65 °C with cooling at a scanning rate of 2 °C/min, after which the sample was heated with a scanning rate of 5 °C/min. Due to the complexity of the melting curves, which appear to be multicomponent, as the plethora of lipid components melt sequentially according to their increasing melting point, there was a need to use a peak deconvolution procedure as shown in Figure 2b. For all the varieties, four peaks were identified during the melting process occurring from -65 °C to 30 °C. From the DSC curves presented in Figure 2, it is clear that the melting temperature initiated at around -40 °C and the phase transition finished after the formation of four encompassing peaks till the temperature reached around 0 °C. Among these four peaks, the second was considered to be the major peak, which occurred at around -30 °C. There are three more shoulder peaks along with the second peak, where the first peak can be detected at around -36 °C, and the comparatively smaller third and fourth peaks appeared at temperatures of approx. -25 °C and -12 °C, respectively. The melting behavior of flaxseed oil is inluenced by the composition of fatty acids that are bound in acylglycerols, mainly DAG and TAG. As was shown in a lipidomic study, 39 DAGs and 110 TAGs in flaxseed oil were identified [27], which differ in their melting points. The position of unsaturated bonds and the length of fatty acid chains regulates the energy involves in the phase transition of the polymorph [28]. The appearance of multiple peaks can be the consequence of two simultaneously occurring phenomena i.e. complex distribution of TAGs and polymorphic rearrangement of crystals, which can especially take place during the slow melting of lipid components [29]. In this study, a fast scanning rate (5 °C/min) was used, which limits polymorphic transitions. Furthermore, the distribution of TAG’s as polymorphs cannot be surmised using DSC curves, and research rather suggests that the X-ray diffraction method might be an effective tool to understand in-depth cognition of each crystals packed in a TAG molecule and their discrete melting behavior [30,31]. However, DSC curves can provide us with the paradigm of heat transition from one physical state to another [32].
In order to assess the parameters describing the melting curves, a deconvolution procedure was carried out to separate the four peaks. Over the decades, a computational method using deconvolution algorithm has been employed by authors to analyze complex DSC profiles [33,34]. Several parameters were taken under consideration to access the melting phase transition occurring in the flaxseed oil samples i.e. peak temperature, peak height, peak area and percentage of area. As a result, various parameters of each peak were obtained i.e. peak temperatures (T1, T2, T3 and T4), which are shown in Table 2; peak height (h1, h2, h3 and h4), presented in Table 3; peak area (A1, A2, A3 and A4), and calculated percentage of peak area (P A1, P A2, P A3 and P A4), shown in Table 4.
Table 2 presents the peak temperatures data of four peaks identified for five fresh and stored (2, 4, 6 months) different flaxseed oils samples. Four endothermic peaks appeared around the same temperature range for all varieties, which confirms the similarity of the thermal profiles for flaxseed oils. Statistical exploration was based on a comparison of variances between the varieties and between the different storage times. Generally, the comparison of varieties for fresh oils showed that the temperatures of peaks T2, T3, T4 were significantly higher only for sample FL_SZB than for the rest samples (p ≤ 0.05), although these differences were not greater than 2 °C. Temperature peak differences among the varieties are associated with the composition of PUFA, MUFA and SFA in flaxseed oils. As is shown in Table 2, samples FL_SZB and FL_NN were characterized by the lowest content of PUFA, which justifies the highest peak temperatures for those varieties with a lower count of unsaturated C=C bonds (i.e. MUFA and PUFA). Other authors also stated that for canola oil those peaks which represent a lower temperature transition are associated with the melting of unsaturated fatty acids [30]. Additionaly, four peak temperatures throughout the storage time (0, 2, 4, 6 months) were compared, as presented in Table 2. This data shows that the main peak (T2) always gradually shifted towards a higher temperature until the six-month (significantly, p ≤ 0.05), except for the FL_NN sample, for which the parameters T2 increassed with time, but the changes were not significant (p>0.05). The peak temperature T4 was significantly higher for all oil samples after six months (p ≤ 0.05). In comparison, T1 and T3 seemed to be more stable throughout the storage time analysis, since no significant changes took place for the measurements taken in different months (p>0.05).
Table 3 presents the results of the measurement of the peak height of four peaks calculated from DSC curves. The parameter of peak height expresses in the DSC analysis the intensity of the phase transition phenomena, which is dependent on the scanning rate used, the higher the scanning rate, the higher the peak height [2]. Thus, the parameters of peak height obtained with the same scanning rate can only be compared, since the peak height is proportional to the rate of the heat transfer, which was also confirmed by other authors [35,36]. Generally, the parameters of peak height (h1, h2, h3, h4) for the fresh flaxseed oils did not differ significantly between the oil varieties, except for sample FL_BU, for which h1 was significantly different from the rest of oils varieties (p ≤ 0.05). Among all the flaxseed oils samples, the peak height of the main peak (h2) and the last peak (h4) were significantly (p ≤ 0.05) lowered after six months of storage. On the other hand, two other minor peaks, h1 and h3, were quite stable during the storage period.
Table 4 presents the results of calculations of the peak area of four peaks (A1, A2, A3, A4) determined by deconvolution analysis. Comparing the parameters of peak area between the oil samples, it can be seen that the area of second peak (A2), determined between 2.2 and 2.7 for fresh oils, makes the greatest contribution to the melting phenomena of complex TAG structures. For the fresh flaxseed oils A2 did not differ significantly between the oil varieties (p > 0.05).
Analyzing the influence of the storage time, it can be seen that the area of the first and third peaks (A1, A3) did not change significantly within the six months of storage, in contrast to the values for the second (A2) and fourth (A4) peaks, for which significant lowering of values was observed within the storage time (p ≤ 0.05). It is noticeable that the changes in the area of peaks (A2, A4) observed during storage are in line with changes in peak height values (h2, h4). As shown in Table 4, the percentage of each peak area was also calculated based on the accumulated values of the total area of the endothermic peaks of the melting curves. Comparing the values of the percentage of the area within the storage time, it can be seen that for the first, second and third peaks parameters P A1 and P A3 increased significantly (p ≤ 0.05), while PA2 decreased after six months. This is because the values of the peak areas (A1, A2, A3, A4) expressed absolute values and the percentages of the area (P A1, P A2, P A3, P A4) are relative values, depending on changes in the area of other peaks. The difference between area and percentage of area is visible in the example of the first and third peaks (A1, A3), which did not change significantly within the six months of storage, whereas the percentage of peak area (P A1, P A3) increased, due to the decrease in the area of the second peak (A2). This observation implies that changes in the percentage of area (P A) should be considered only when all peaks are analyzed together.

4. Discussion

4.1. Determination of DSC Parameters as Markers of Authenticity and Deterioration of Flaxseed Oil

For the purposes of this study, control charts were used to select the DSC parameters which remained stable throughout the shelf-life period, which can be used for fingerprinting as authenticity markers. On the other hand, all DSC parameters changing within the time of storage can be recognized as indicators of deterioration. Control charts are a common statistical tool for monitoring the conformity of products or processes with a reference value. Control charts, invented by Walter Shewart, are one of the most widely used Statistical Process Control (SPC) tools in the food industry [37,38]. The control chart is constructed of three main lines: the centre line (CL), the upper control limit line (ULC) and the lower control limit line (LCL). The upper and lower control limits are within three standard deviations from the level of the mean (±3σ of the centre line). When the monitored parameter has a normal distribution, about 99.7% of the parameter values are within the control limits, which means that there is a risk level of 0.3% that the process parameters can go outside the control limits, assuming the stability of the monitored parameter. Referring to the study conducted on the stability of the DSC profile, monitoring with a control chart means that if the storage time does not affect the changes of selected parameters, its level will not exceed the control limits (±3σ), and it will then be considered as a stable parameter during storage. Therefore, it appears reasonable to suggest the possibility of determining the limits that these parameters can reach regardless of the storage time of oils. They will be characteristic for different types of oils. In this study, X Bar and R (arithmetic mean and range) control charts were used to test the stability of selected melting profile parameters. The X bar chart and the R chart are actually two different graphs that must be considered in tandem to understand the behaviour of the parameter being measured. The X bar chart shows the average level of the parameter being monitored, while the R chart shows the range, i.e. the difference between the smallest and largest value in each sample, at each time point of storage, thus explaining the variability of the variation. In fact, to the best of the authors’ knowledge, there is no published research where a control chart was used to monitor the changes in parameters within the storage time of cold-pressed oils. Using control charts 16 variables, determined from melting curves (T, h, A, P A for four peaks), and 18 variables, as ratios calculated for parameters h, A, P A were tested by using X-bar charts and the R charts.

4.1.1. Determination of Stable DSC Parameters as Markers of Oils’ Authenticity during Storage

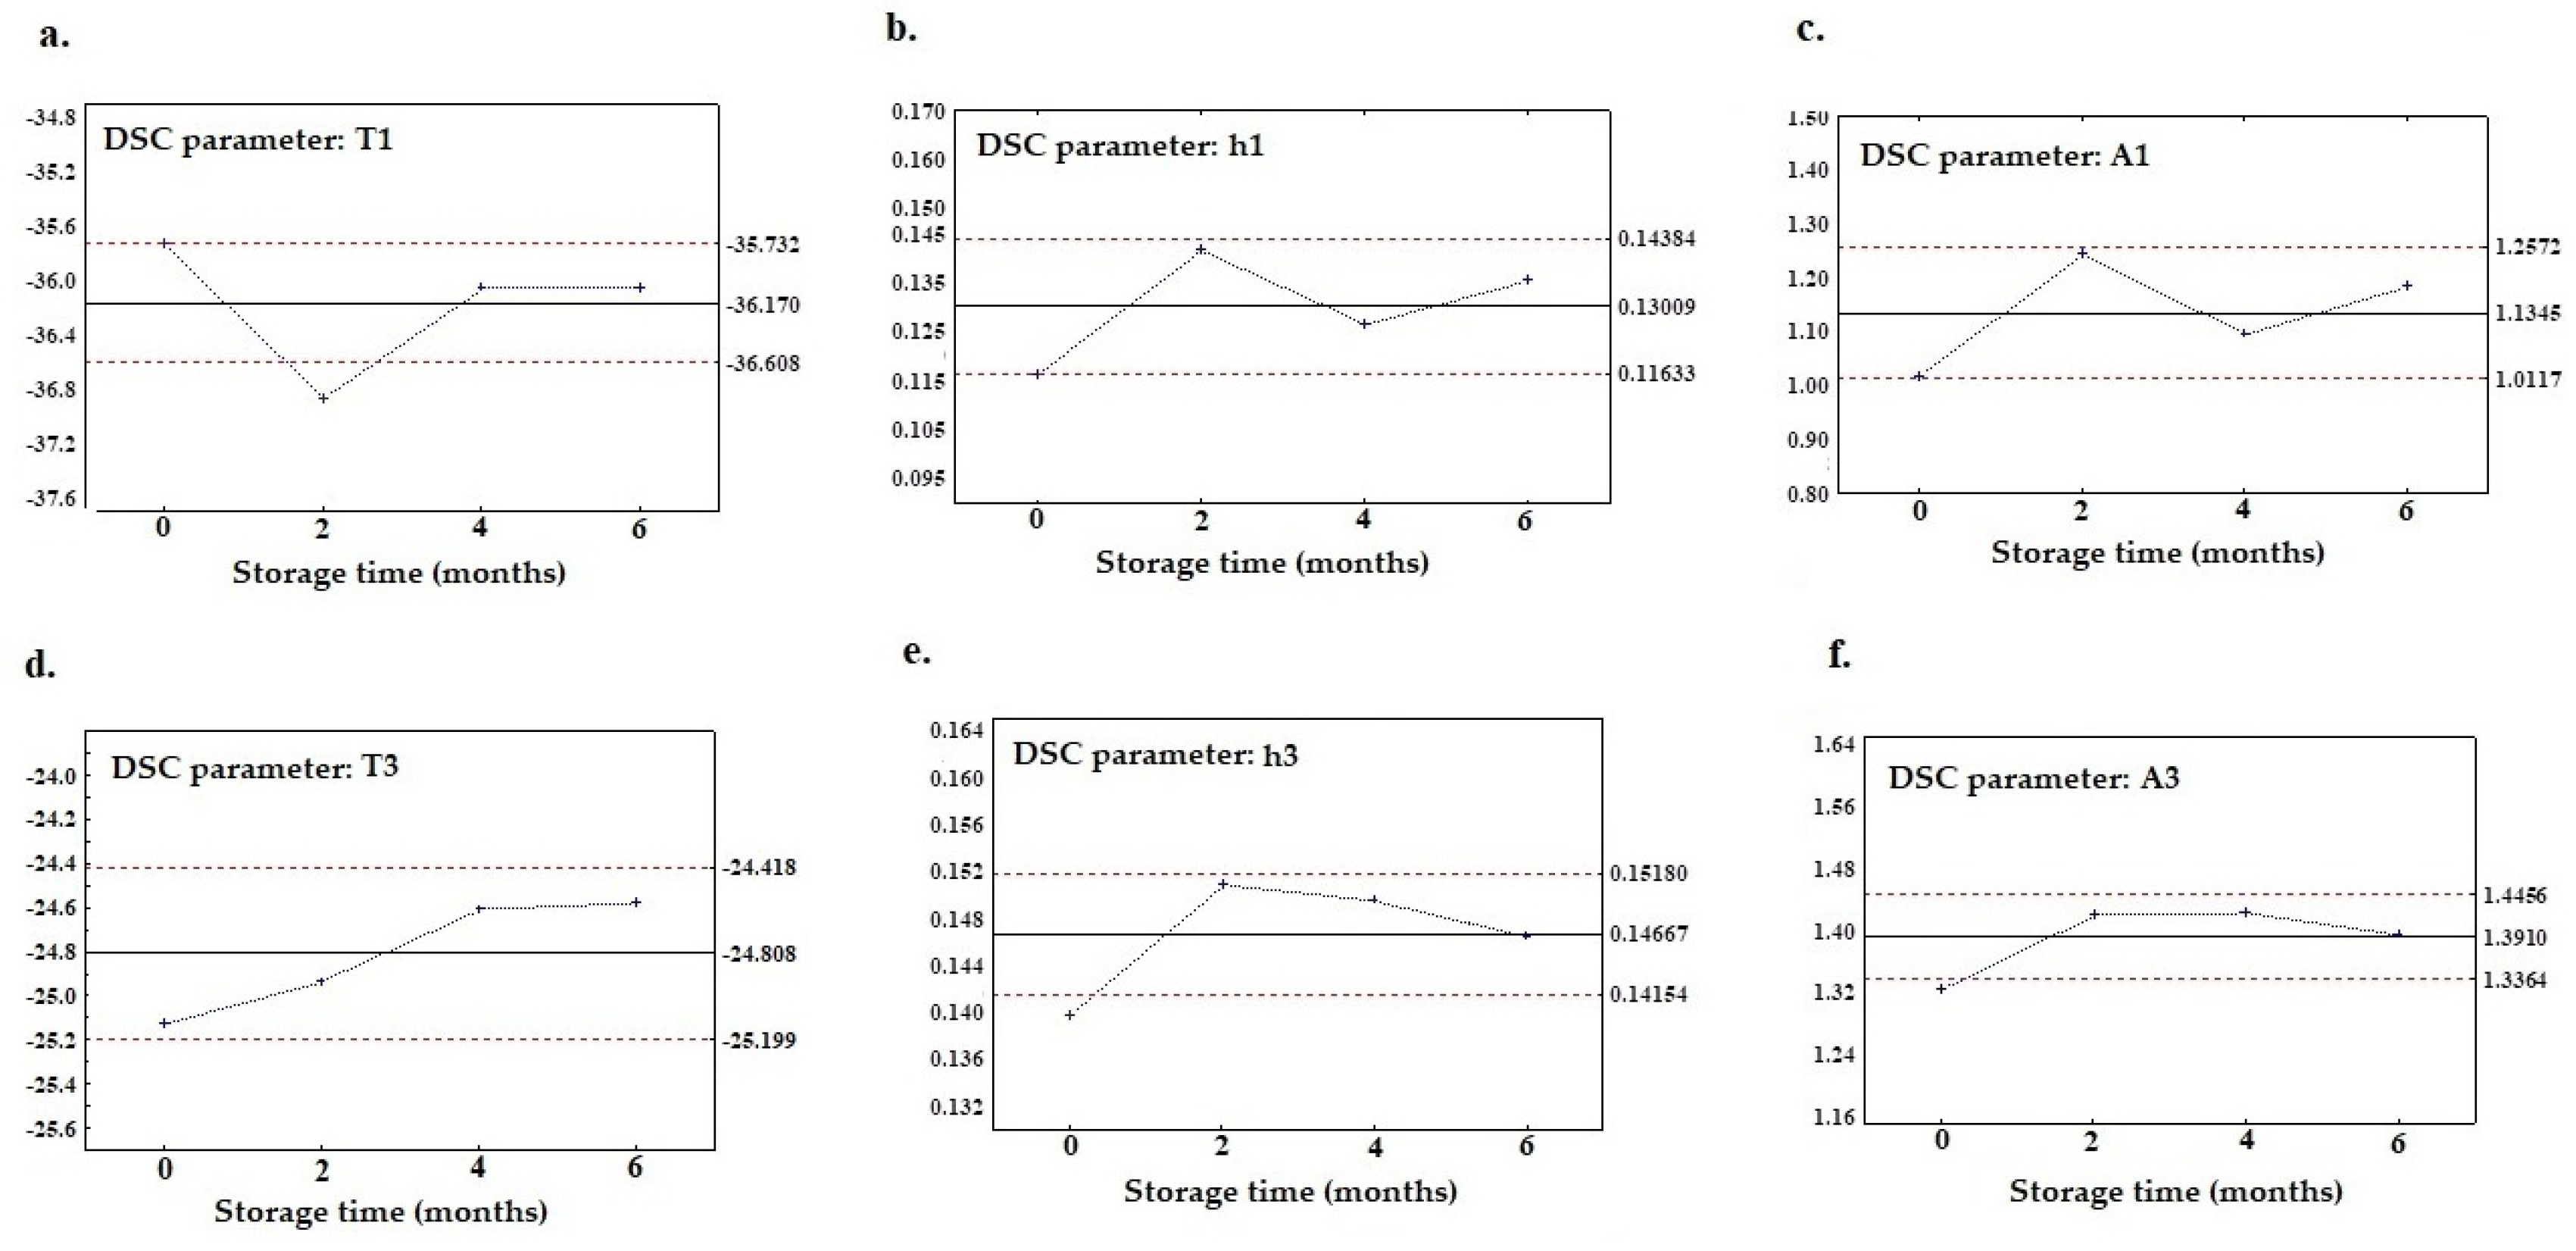
As it was shown in Table 2, Table 3 and Table 4, various parameters of melting curve for flaxseed oils i.e. peak temperature (T1, T2, T3, T4), peak height (h1, h2, h3, h4), peak area (A1, A2, A3, A4), percentage of peak area (P A1, P A2, P A3, P A4) were analyzed within six months storage. It was shown that for the first and third peaks, all DSC parameters (T, h, A, P A) were not changing significantly within storage time (p> 0.05). From total amount of 16 variables (4 DSC parameters x 4 peaks) analysed, parameters remaining anchored within the control limit in the X bar chart were selected and denoted as ‘stable parameters’. Figure 3. shows control charts for these parameters found to be stable during storage, which are pertinent for all oil samples. No point exceeded the control lines on either the X Bar charts or on the R charts between “0 month” and “6 monts” storage. This means that the average level of the parameter, as well as its variability, was stable throughout the storage period. The control limits on the X Bar charts can therefore be considered as a range that is characteristic and not changeable during storage for a particular melting profile parameter of flaxseed oil. In Figure 3 a-c, stable parameters associated with the first peak are presented (i.e. T1, h1, A1), while Figure 3 d-f illustrate the parameters for the third peak (i.e. T3, h3, A3). Based on data acquired from the melting curves, these multivariate X Bar charts show that first and third peaks area, height and temperature did not cross the limits between the upper control limit line (ULC) and the lower control limit line (LLC), except for the T1, h3 and A3 parameters, where one control points appeared outside the range. However, after careful observation of those points, it can be seen that the differences between ULC and LLC are extraordinarily minimal compared to the range of the undisputed parameters like A1, h1 and T3.
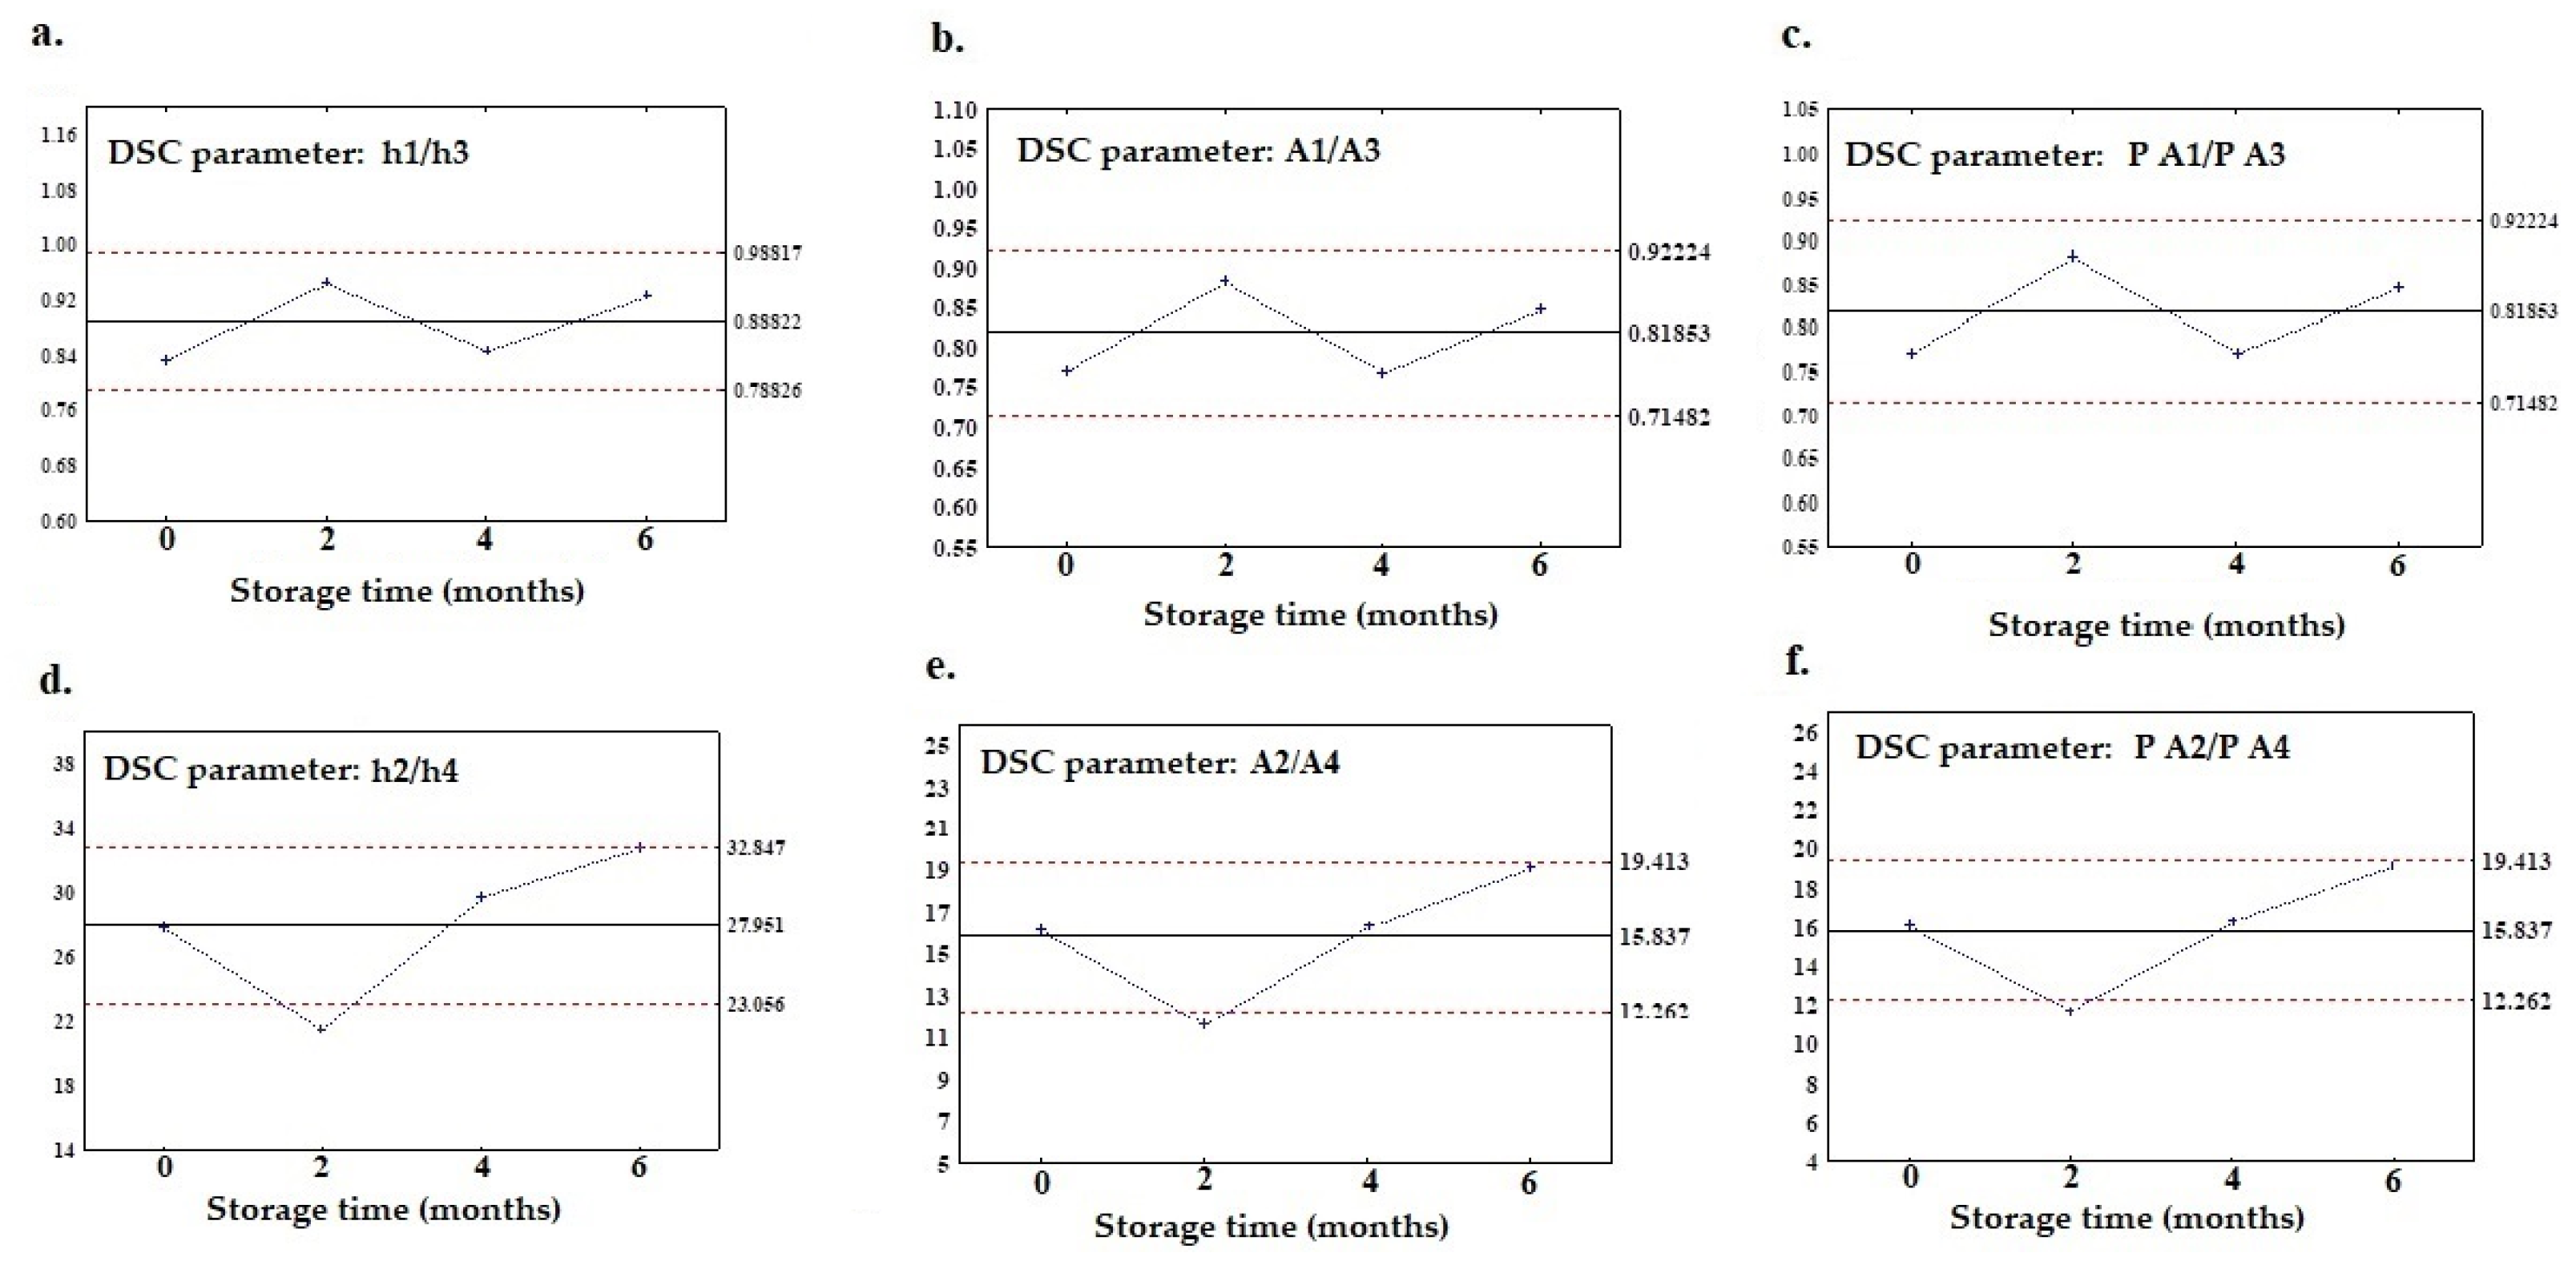
Meanwhile, Figure 4 (a-f) also shows a graph with X bar control charts prepared on the basis of the calculated ratio of DSC parameters. It can be observed that in addition to the ratio of parameters calculated for first anf third peak i.e. h1/h3, A1/A3, P A1/P A3), (Figure 4 a-c), there are other parameters fitting to the control limits like h2/h4, A2/A4 and P A2/PA4 calculated for the second and fourth peak (Figure 4 d-f). It can be seen the pivotal role of the first and third peaks regarding authenticity analysis, and also the ratio of the parameters for these two peaks persistently framed within the control limits. Furthermore, Figure 4 shows that the ratio calculated for the second and fourth peaks also abides by the rules to be considered as stable parameters (h2/h4, A2/A4 and P A2/P A4), despite the fact that these parameters considered individually were not stable. It is worth noting that the parameters accountable to percentage of area (P A) do not have coherent properties when analysed separately, since they depend on the other peaks, but the ratio calculated from parameters P A appeared to be a better option in this respect.

4.1.2. Detection of Flaxseed Oil Deterioration by Unstable DSC Parameters during Storage

The second purpose of this study was to recognize DSC melting profile parameters that change within the storage time. However only parameters with increasing or decreasing trends indicating changes caused by storage were considered. In order to establish these, control charts were analyzed in terms of parameters for which the two control lines for fresh and stored oils were exceeded by crossing the ULC and LLC from both ends. Figure 5 (a-c) illustrates the control charts with the parameters of the main peak height and area (h2, A2, PA2) for which values decrease throughout the shelf life of oil. From Table 3 and 4, it is clearly seen that for all flaxseed oil varieties, the values h2, A2 and P A2 are significantly lower after six months of storage, which coincides with the control charts presented in Figure 5 (a-c).
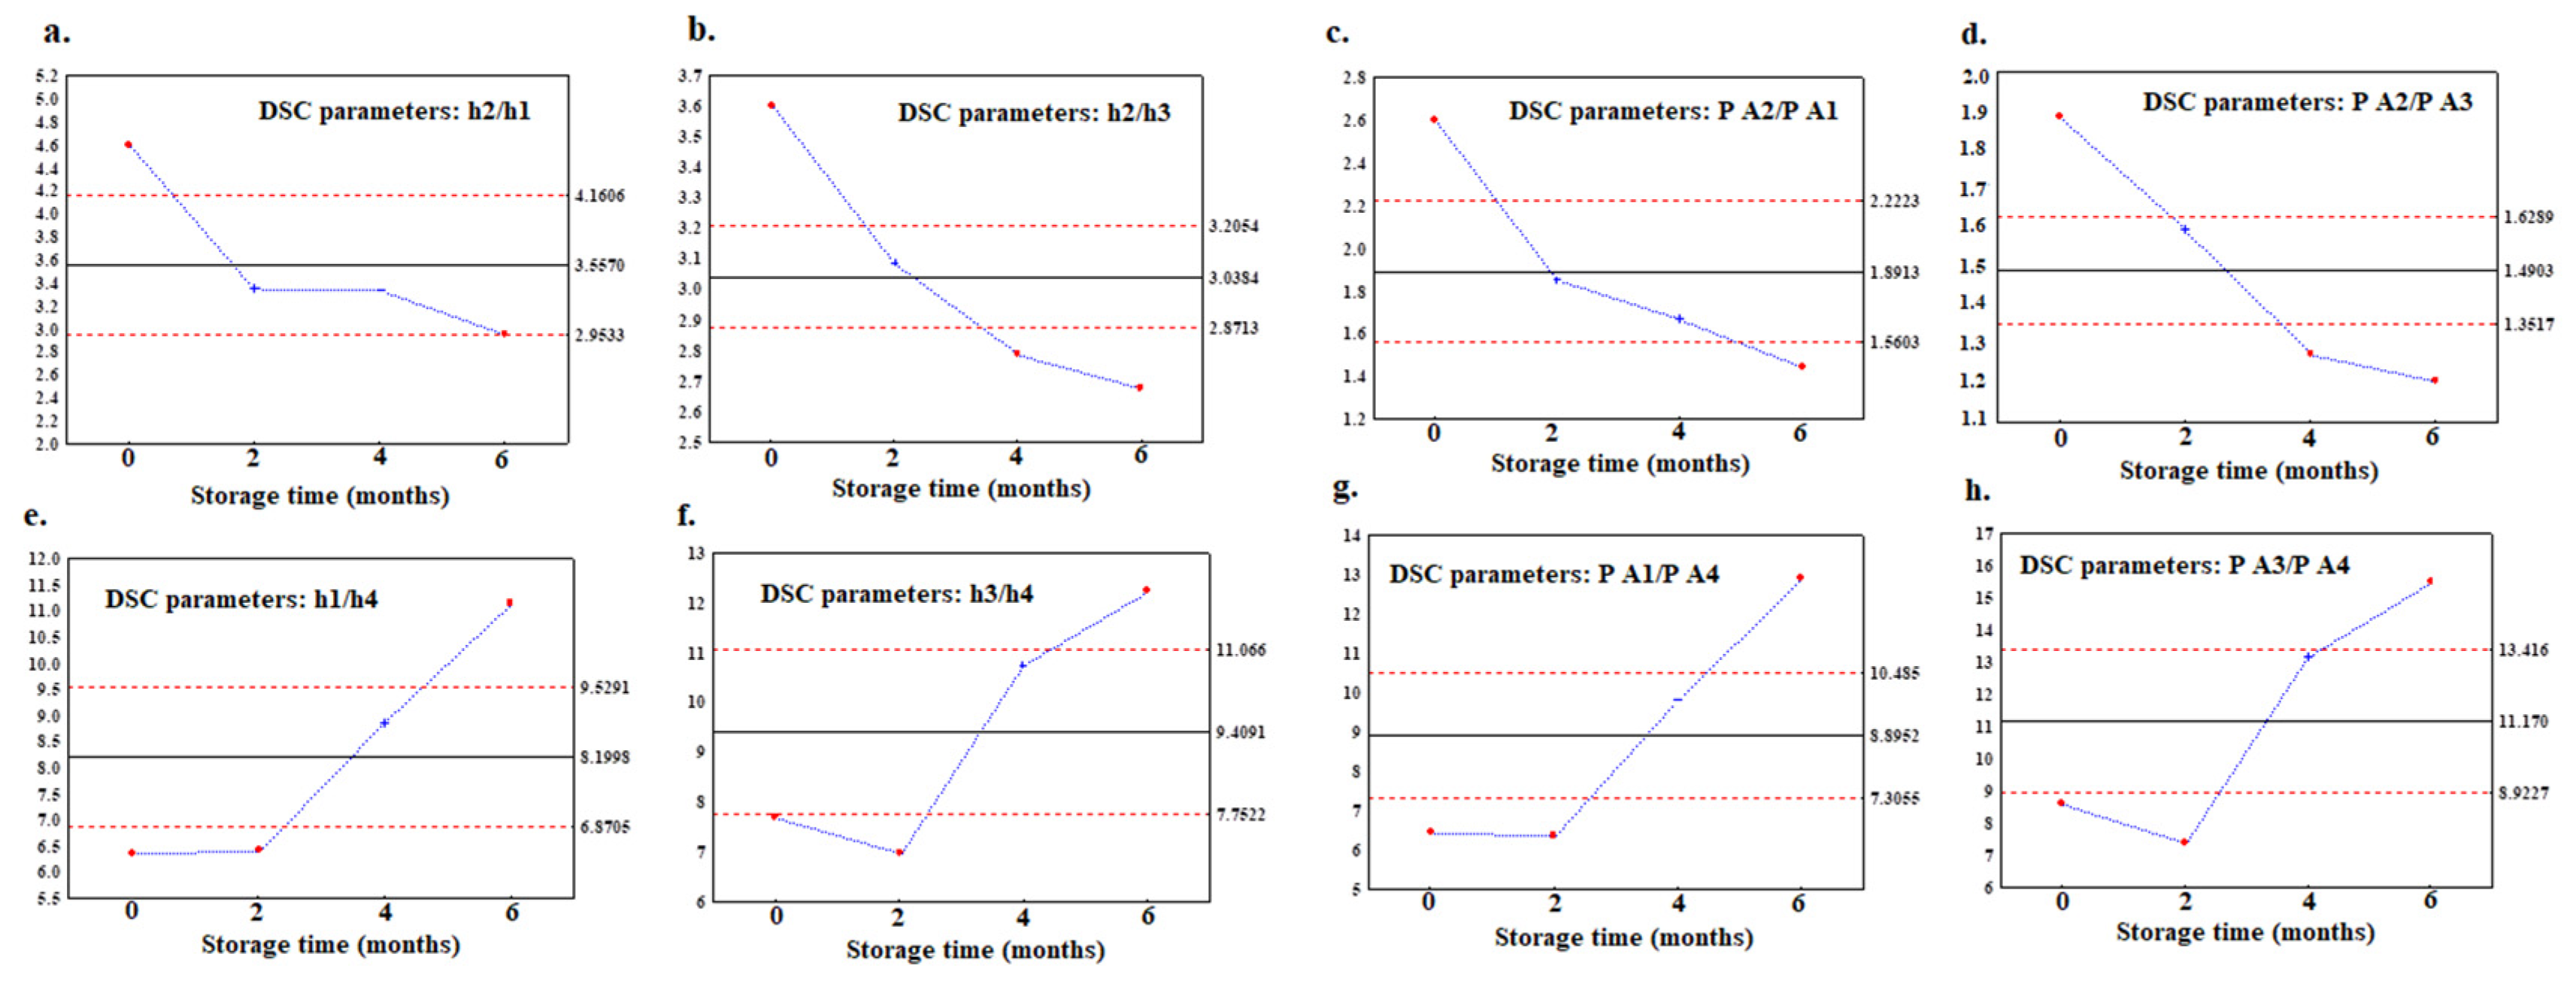
The trend within storage time of the ratio calculated for the parameters of peak height (h2/h1, h2/h3, h1/h4, h3/h4) as well as the ratio of peak area (A2/A1, A2/A3, A1/A4, A3/A4) was also analyzed by control charts (Figure 6 a-h). As it can be seen a downward trend was observed for the ratio h2/h1 and h2/h3 (Figure 6 a, b) as well as for A2/A1 and A2/A3 (Figure 6 c-d). In turn for the parameters of h1/h4, h3/h4, A1/A4 and A3/A4 increasing trend was shown (Figure 6 e-h).
Analogously, as for the ratios of peak area (A2/A1, A2/A3, A1/A4, A3/A4), the same trend was observed for ratio of percentage of area (PA2/PA1, PA2/PA3, PA1/PA4, PA3/PA4), which means that the values increased or decreased by the same pattern (Figure S1; supplementary data).
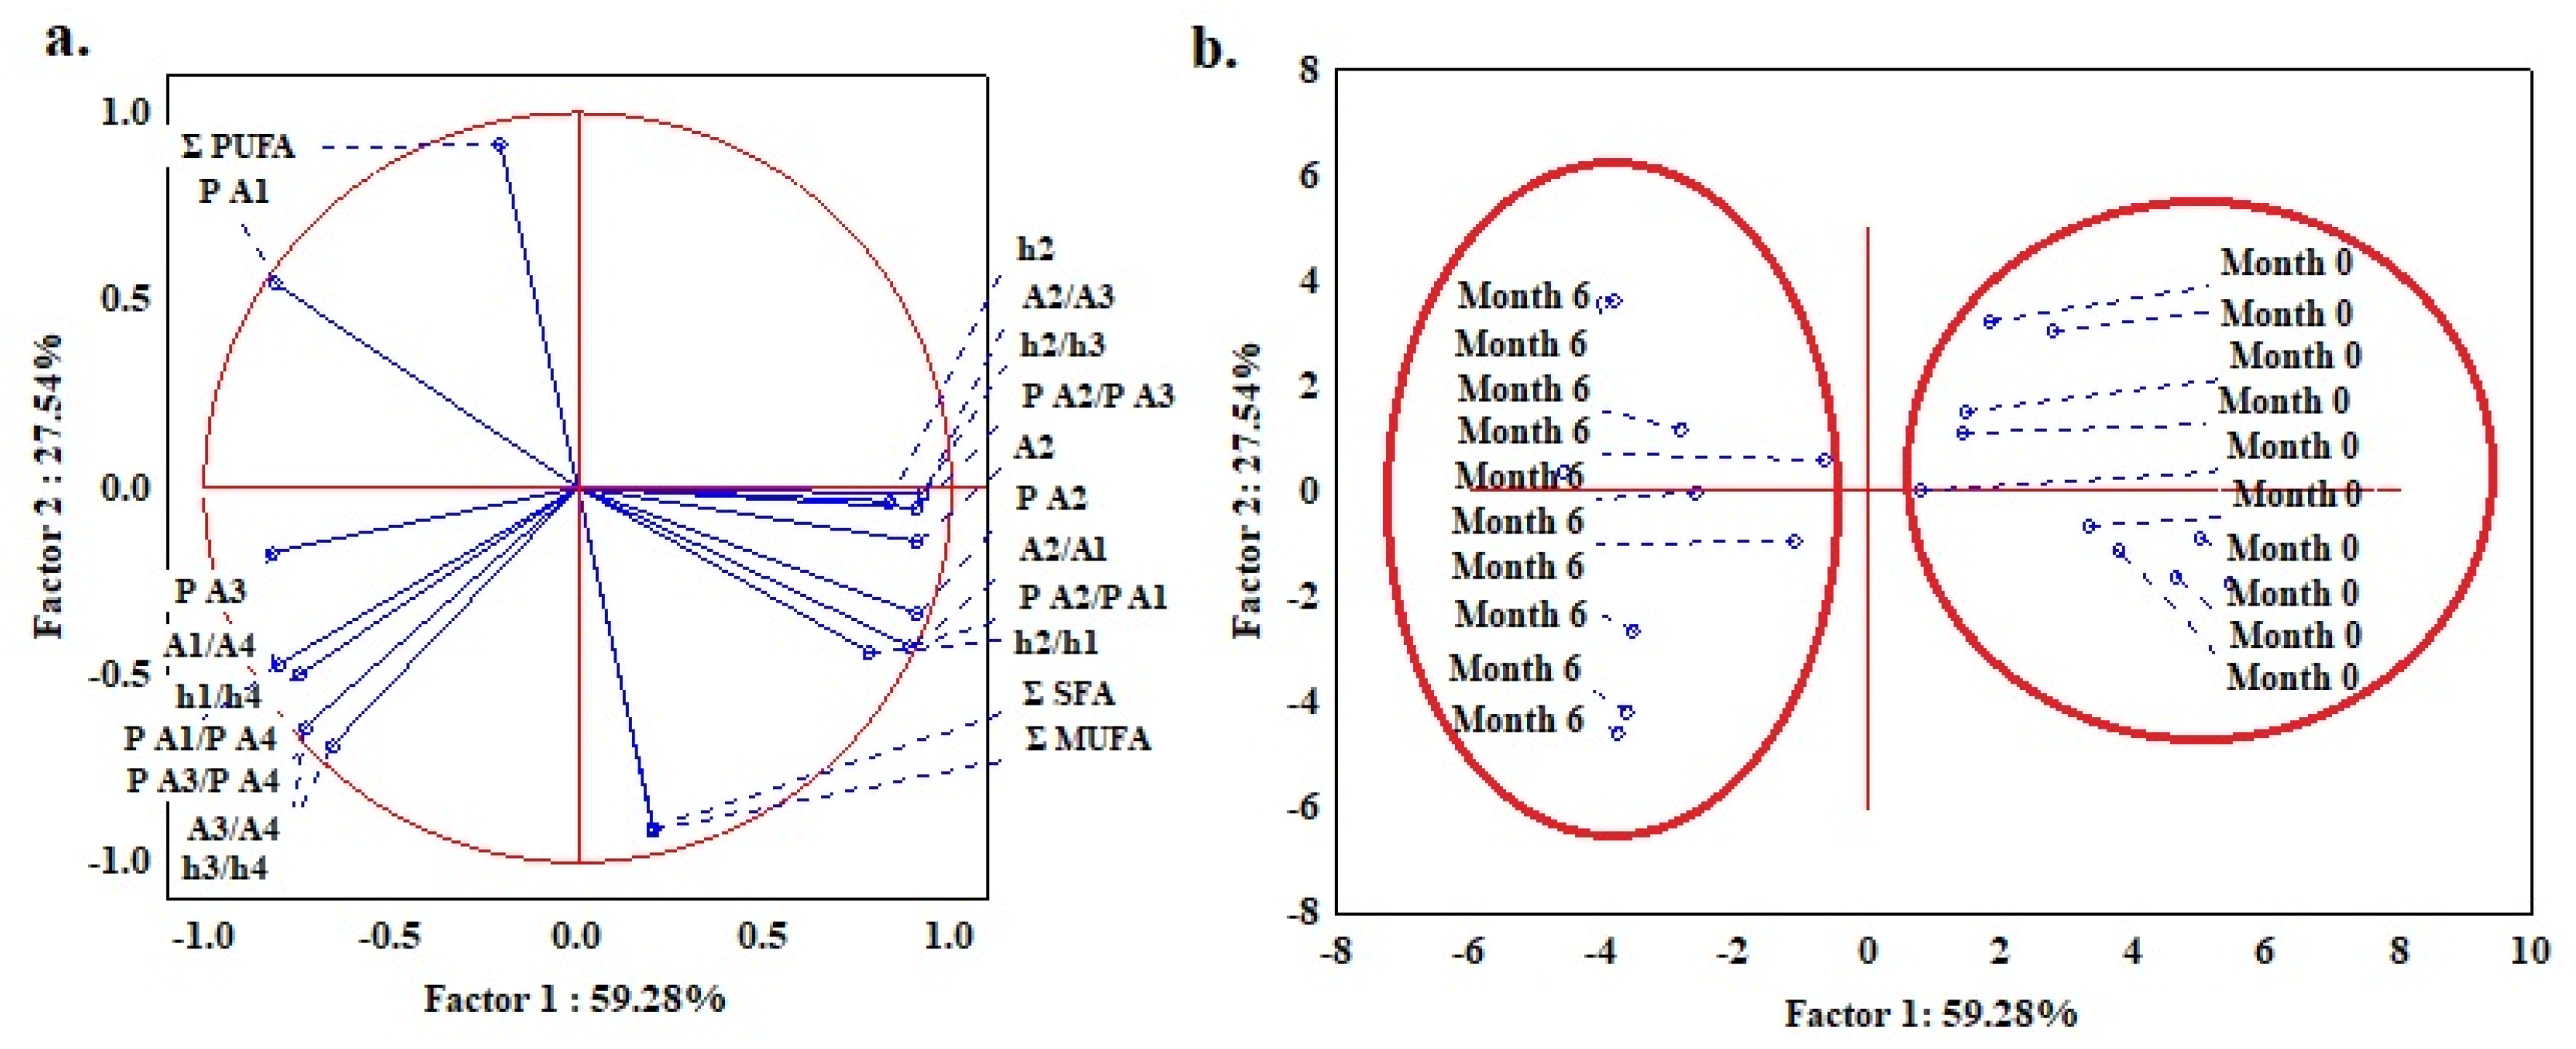
In addition, PCA analysis was applied with all the unstable parameters obtained from DSC and fatty acid content (ΣSFA, ΣMUFA, ΣPUFA) for fresh oil samples and ones that were stored for 6 months. It was shown that two distinctive clusters were separated, with the differentiation between two groups of oils i.e. fresh and stored (Figure 7b). In the graph of variable projection (Figure 7a), it can be seen that the parameters connected with the second peak (h2, A2, P A2) were the highest for fresh oil and the lowest after 6 months, in contrast to the parameters of the ratios calculated for the first and fourth peaks, as well as for the third and fourth peaks.

5. Conclusions

In the age of global food market, rapid and ecological methods which will facilitate fast authentication assessment are crucial. At the same level, control of quality of flaxseed oil is important, since it is highly susceptible to the oxidation process occurring during prolonged storage. Chemical analysis of oxidative stability (AV, PV, p-AV, TOTOX) showed the changes occurring during the storage of flaxseed oil for six months, since all parameters measured increased for all the oil samples. This study proposed an approach using a X-bar R control charts to monitor the stability and changes of DSC melting profiles of flaxseed oil stored for six months in conditions similar to the supermarket shelf. By implementing the procedure of deconvolution, four peaks were identified in the melting profile, for which the peak temperature, peak height, peak area and percentage of peak area were analyzed. Analysis by means of control charts enabled stable parameters of the melting profile of flaxseed oil to be determined, which were connected to the first and third peak. In total, twelve parameters calculated based on those peaks were selected, which can be considered as indicators for authentication. On the other hand, it was also possible to indicate from melting profile those parameters that changed throughout the shelf life with an increasing or decreasing tendency. Those parameters were mainly connected with the major second peak, as well as with the ratios calculated for the first to fourth and third to fourth peak. Sixteen parameters calculated from the melting profile were found to be unstable parameters, which can be used as indicators for the deterioration of oil. In the case of the percentage of peak area (PA), values of this parameters should be considered all together, since they depend on the other peaks.

Supplementary Materials

Figure S1: Control charts of unstable parameters (calculated from the ratio of peak’s percentage of area) from DSC melting curves. (a) ratio of parameters P A2/P A1, (b) ratio of parameters P A2/P A3, (c) ratio of parameters P A1/P A4, (d) ratio of parameters P A3/P A4.

Author Contributions

Conceptualization, M.I. and J.T.-G.; methodology, M.I., J.T.-G. A.K., A.G; formal analysis, M.I., A.K. and J.T.-G; investigation, M.I. and J.T.-G. A.G; resources, J.T.-G.; data curation, M.I., A.K. and J.T.-G.; writing—original draft preparation, M.I. and J.T.-G.; writing—review and editing, M.I., A.K. and J.T.-G.; visualization, M.I., A.K and J.T.-G.; supervision, A.K and J.T.-G., project administration, J.T.-G.; funding acquisition, J.T.-G. All authors have read and agreed to the published version of the manuscript.

Funding

This research was funded by the NATIONAL SCIENCE CENTRE, POLAND, grant number: 2018/31/B/NZ9/02762.

Data Availability Statement

The data presented in this study are available upon reasonable request.

Conflicts of Interest

The authors declare no conflict of interest.

References

  1. FAO. Production/Yield quantities of Oil of linseed in World + (Total) [Internet]. 2020. Available from: https://www.fao.org/faostat/en/#data/QCL/visualize.
  2. Tomaszewska-Gras J, Islam M, Grzeca L, Kaczmarek A, Fornal E. Comprehensive thermal characteristics of different cultivars of flaxseed oil (Linum usittatissimum L.). Molecules. 2021;26. https://doi.org/10.3390/molecules26071958.
  3. Obranović M, Škevin D, Kraljić K, Pospišil M, Neđeral S, Blekić M; et al. Influence of Climate, Variety and Production Process on Tocopherols, Plastochromanol-8 and Pigments in Flaxseed Oil. 2015;53:496–504. [CrossRef]
  4. Herchi W, Bouali I, Bahashwan S, Rochut S, Boukhchina S, Kallel H; et al. Changes in phospholipid composition, protein content and chemical properties of fl axseed oil during development. Plant Physiol Biochem [Internet]. Elsevier Masson SAS; 2012;54:1–5. [CrossRef]
  5. Khattab RY, Zeitoun MA. Quality evaluation of flaxseed oil obtained by different extraction techniques. LWT - Food Sci Technol [Internet]. Elsevier Ltd; 2013;53:338–45. [CrossRef]
  6. Teh SS, Birch J. Physicochemical and quality characteristics of cold-pressed hemp, flax and canola seed oils. J Food Compos Anal [Internet]. Elsevier Inc.; 2013;30:26–31. [CrossRef]
  7. El-Beltagi HS, Salama Z, El-Hariri DM. Evaluation of Fatty Acids Profile and the Content of Some Secondary Metabolites in Seeds of Different Flax Cultivars ( Linum Usitatissimum L.). Gen Appl Plant Physiol [Internet]. 2007;33:187–202. Available from: http://www.bio21.bas.bg/ipp/gapbfiles/v-33/07_3-4_187-202.pdf.
  8. Tavarini S, Castagna A, Conte G, Foschi L, Sanmartin C, Incrocci L; et al. Evaluation of chemical composition of two linseed varieties as sources of health-beneficial substances. Molecules. 2019;24. [CrossRef]
  9. Gallardo MA, Milisich HJ, Drago SR, González RJ. Effect of cultivars and planting date on yield, oil content, and fatty acid profile of flax varieties (Linum usitatissimum L.). Int J Agron. 2014;2014. [CrossRef]
  10. Choe E, Min DB. Mechanisms and factors for edible oil oxidation. Compr Rev Food Sci Food Saf. 2006;5:169–86. [CrossRef]
  11. Choo WS, Birch J, Dufour JP. Physicochemical and quality characteristics of cold-pressed flaxseed oils. J Food Compos Anal. 2007;20:202–11. [CrossRef]
  12. Hasiewicz-Derkacz K, Kulma A, Czuj T, Prescha A, Zuk M, Grajzer M; et al. Natural phenolics greatly increase flax (Linum usitatissimum) oil stability. BMC Biotechnol. 2015;15:1–14. [CrossRef]
  13. Islam M, Muzolf-Panek M, Fornal E, Tomaszewska-Gras J. DSC isothermal and non-isothermal assessment of thermo-oxidative stability of different cultivars of Camelina sativa L. seed oils. J Therm Anal Calorim. Springer International Publishing; 2022;147:10013–26. [CrossRef]
  14. Tańska M, Roszkowska B, Skrajda M, Grzegorz D. Commercial Cold Pressed Flaxseed Oils Quality and Oxidative Stability at the Beginning and the End of Their Shelf Life. J Oleo Sci. 2016. [CrossRef]
  15. Islam M, Bełkowska L, Konieczny P, Fornal E, Tomaszewska-Gras J. Differential scanning calorimetry for authentication of edible fats and oils - What can we learn from the past to face the current challenges? J Food Drug Anal. 2022;30. [CrossRef]
  16. Zhang ZS, Li D, Zhang LX, Liu YL, Wang X De. Heating effect on the DSC melting curve of flaxseed oil. J Therm Anal Calorim. 2014;115:2129–35. [CrossRef]
  17. AOCS. AOCS Official Method Preparations of Methyl Esters of Fatty Acids. 1997. p. 2–66.
  18. AOCS. AOCS Official Method Acid Value. Cd 3d-63. Urbana, IL, USA; 2009.
  19. ISO 3960. Animal and Vegetable Fats and Oils—Determination—Iodometric (Visual) Endpoint; International Organization for Standardization: Geneva, Switzerland, 2017. 2010.
  20. ISO 6885. Animal and Vegetable Fats and Oils: Determination of Anisidine Value. ISO: Geneva, Switzerland 2016. 2016.
  21. Tomaszewska-Gras J. Rapid quantitative determination of butter adulteration with palm oil using the DSC technique. Food Control. Elsevier Ltd; 2016;60:629–35. [CrossRef]
  22. Cantele C, Bertolino M, Bakro F, Giordano M, Jędryczka M, Cardenia V. Antioxidant effects of hemp (Cannabis sativa L.) inflorescence extract in stripped linseed oil. Antioxidants. 2020;9:1–18. [CrossRef]
  23. Malcolmson LJ, Przybylski R, Daun JK. Storage stability of milled flaxseed. JAOCS, J Am Oil Chem Soc. 2000;77:235–8. [CrossRef]
  24. Prescha A, Grajzer M, Dedyk M, Grajeta H. The antioxidant activity and oxidative stability of cold-pressed oils. JAOCS, J Am Oil Chem Soc. 2014;91:1291–301. [CrossRef]
  25. Codex Alimentarius. Standard for Named Vegetable Oils Codex Stan 210-1999. Codex Aliment. 1999;1–13.
  26. Gordon MH. The development of oxidative rancidity in foods [Internet]. Antioxidants Food. Woodhead Publishing Ltd; 2001. [CrossRef]
  27. Kozub A, Nikolaichuk H, Przykaza K, Tomaszewska-Gras J, Fornal E. Lipidomic Characteristics of Three Edible Cold-pressed Oils by LC / Q-TOF for Simple Quality and Authenticity Assurance. Food Chem. Elsevier Ltd; 2023;135761. [CrossRef]
  28. Mcelhaney RN. The use of differential scanning calorimetry and differential thermal analysis in studies of model and biological membranes. Chem Phys Lipids,. 1982;30:229–59. [CrossRef]
  29. Tan CP, Che Man YB. Comparative differential scanning calorimetric analysis of vegetable oils: I. Effects of heating rate variation. Phytochem Anal. 2002;13:129–41.
  30. Minato A, Ueno S, Yano J, Smith K, Seto H, Amemiya Y; et al. Thermal and structural properties of sn-1,3-dipalmitoyl-2-oleoylglycerol and sn-1,3-dioleoyl-2-palmitoylglycerol binary mixtures examined with synchrotron radiation X-ray diffraction. JAOCS, J Am Oil Chem Soc. 1997;74:1213–20. [CrossRef]
  31. Pratama Y, Burholt S, Baker DL, Sadeghpour A, Simone E, Rappolt M. Polymorphism of a Highly Asymmetrical Triacylglycerol in Milk Fat: 1-Butyryl 2-Stearoyl 3-Palmitoyl-glycerol. Cryst Growth Des. 2022;22:6120–30. [CrossRef]
  32. Tan CP, Che Man YB. Differential scanning calorimetric analysis of edible oils: Comparison of thermal properties and chemical composition. JAOCS, J Am Oil Chem Soc. 2000;77:143–55. [CrossRef]
  33. Konieczny P, Tomaszewska-Gras J, Andrzejewski W, Mikołajczak B, Urbańska M, Mazurkiewicz J; et al. DSC and electrophoretic studies on protein denaturation of Anodonta woodiana (Lea, 1834). J Therm Anal Calorim. 2016;126:69–75. [CrossRef]
  34. Vega S, Garcia-Gonzalez MA, Lanas A, Velazquez-Campoy A, Abian O. Deconvolution analysis for classifying gastric adenocarcinoma patients based on differential scanning calorimetry serum thermograms. Sci Rep. 2015;5:1–8. [CrossRef]
  35. Murphy CB. Thermal methods of analysis (Wendlandt, Wesley W.). J Chem Educ. American Chemical Society (ACS); 1965. p. 549–50. [CrossRef]
  36. Saito Y, Saito K, Ataké T. Theoretical analysis of peak height in classical DTA, power-compensated DSC and heat-flux DSC. Thermochim Acta. 1986;107:277–82. [CrossRef]
  37. Lim SAH, Antony J, Albliwi S. Statistical Process Control (SPC) in the food industry - A systematic review and future research agenda. Trends Food Sci Technol [Internet]. Elsevier Ltd; 2014;37:137–51. [CrossRef]
  38. Pudjihardjo I, Mulyana IJ, Asrini LJ. Autocorrelated multivariate control chart in cooking oil industry. Proc Int Conf Ind Eng Oper Manag. 2019;2019:1440–8.
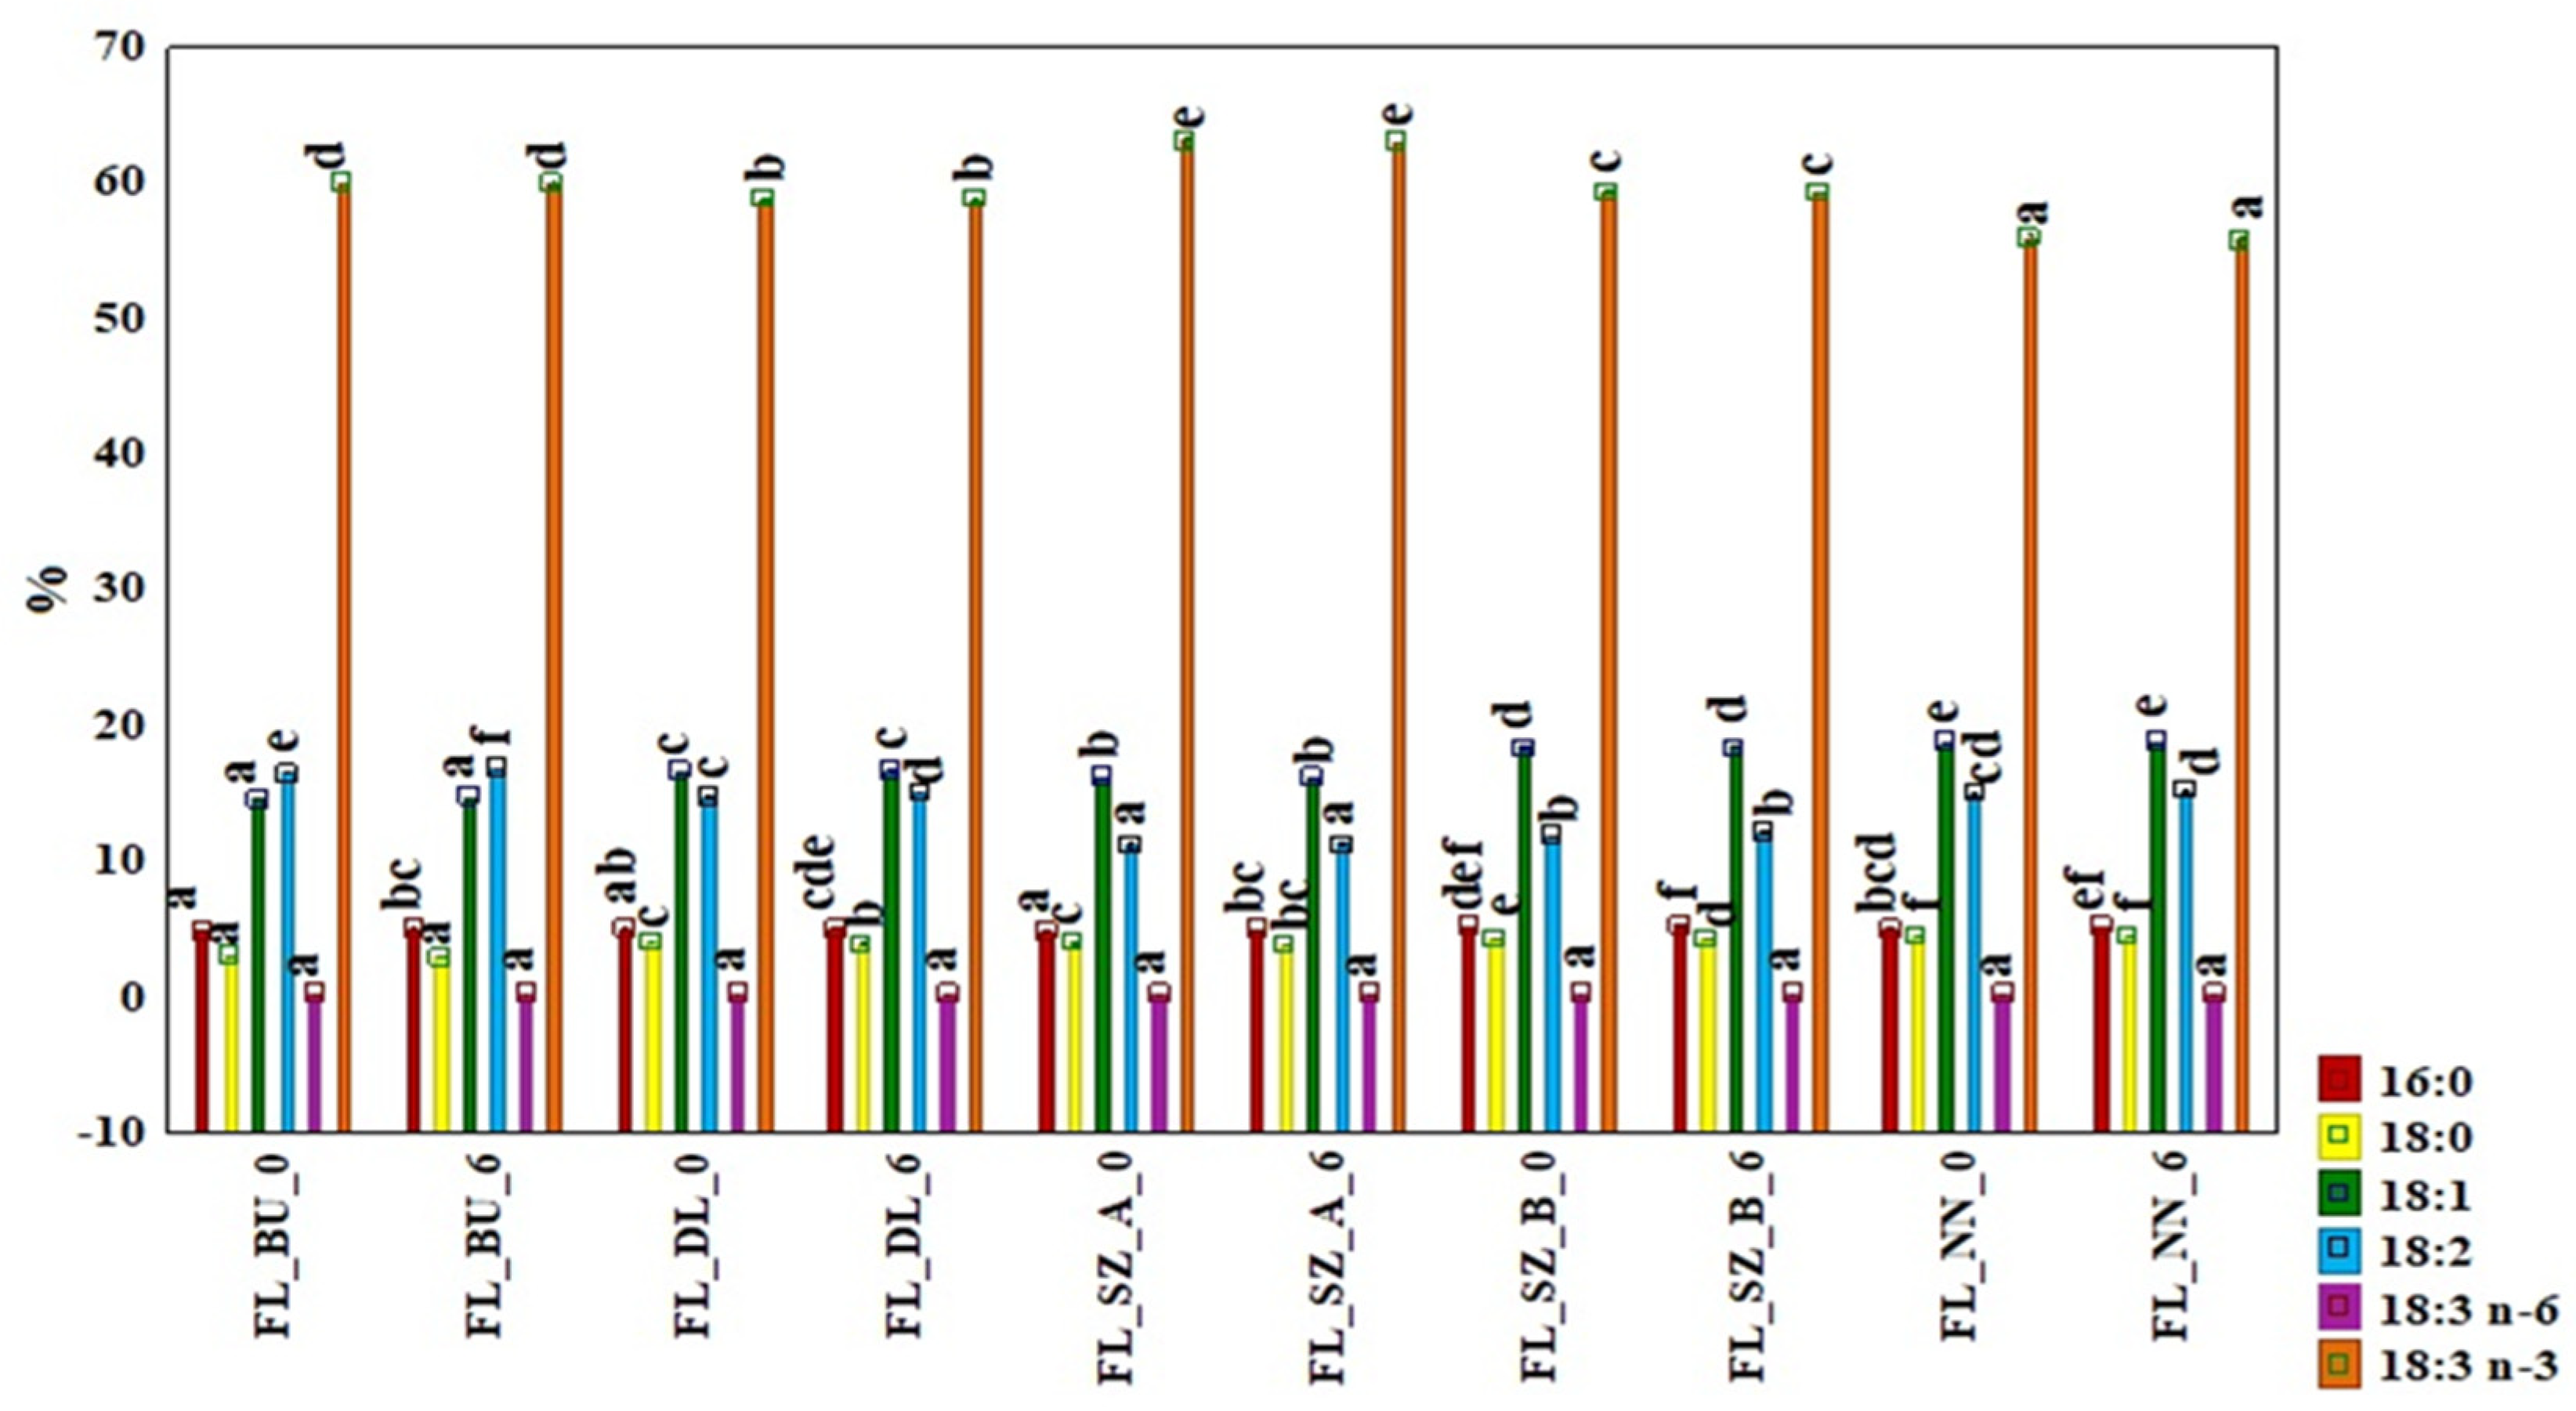
Figure 1. Fatty acids composition expressed as a percentage of total fatty acids (%) for fresh (0 month) and stored (6th month) flaxseed oils. a-f - different superscript letters above bars indicate significant differences analysed for each fatty acid (p ≤ 0.05). FL_BU_0 and FL_BU_6 (Bukoz variety at 0 month and after 6 months, analogously: FL_DL (Dolguniec variety), FL_SZA, FL_SZB (Szafir variety), FL NN (Unknown variety)
Preprints 79353 g001
Figure 2. a) Melting curves obtained from DSC analysis of cold pressed flaxseed oil (FL_SZB) with heating rate 5 °C/min during whole shelf life (0, 2, 4, 6 months); b) Deconvolution of melting curve of fresh flaxseed oil.
Preprints 79353 g002
Figure 3. X bar control charts of DSC parameters recognized as stable within six monts storage; for the first peak (a) T1, (b) h1, (c) A1 and for the third peak (d) T3, (e) h3 (f) A3.
Preprints 79353 g003
Figure 4. X bar control charts of DSC parameters recognized as stable within six monts storage; for the ratio calculated for the first and thisr peak (a) h1/h3, (b) A1/A3, (c) P A1/P A3, and for the second and fourth peak (d) h2/h4 (e) A2/A4P (f) P A2/P A4.
Preprints 79353 g004
Figure 5. X bar control charts of unstable parameters calculated from DSC melting curves for the second peak (a) h2, (b) A2 (c) P A2.
Preprints 79353 g005
Figure 6. X bar control charts of ratio calculated from DSC melting curves with downward trend (a) h2/h1, (b) h2/h3 (c) A2/A1, (d) A2/A3, and with upward trend (e) h1/h4, (f) h3/h4, (g) A1/A4, (h) A3/A4.
Preprints 79353 g006
Figure 7. a) PCA analysis with projection of the variables: DSC unstable parameters and fatty acids content; b) PCA analysis with projection of the cases showing distribution and separation of flaxseed oil samples based on their stability control.
Preprints 79353 g007
Table 1. Acid values, peroxide values, p-anisidine values, TOTOX values for cold pressed flaxseed oils at fresh condition and after storage time.
Seeds varieties Time Chemical analysis
AV
(mg KOH/g)
PV
(meq O2/kg)
p-AV TOTOX
FL_BU 0 month 0.8 ± 0.04b 3.95 ± 0.63c 0.87 ± 0.35a 8.78 ± 1.02c
After 6 months 2.54 ± 0.02g 14.44 ± 0.08h 2.02 ± 0.02c 30.90 ± 0.15h
FL_DL 0 month 0.41 ± 0.01a 2.49± 0.15b 0.65± 0.01a 5.63 ± 0.31b
After 6 months 1.59 ± 0.02d 10.64 ± 0.11f 1.70 ± 0.07bc 22.76 ± 0.21f
FL_SZA 0 month 1.27 ± 0.03c 1.41 ± 0.06a 0.73 ± 0.13a 3.54± 0.2a
After 6 months 2.40± 0.02f 9.73 ± 0.13e 1.49 ± 0.01b 21.09 ± 0.28e
FL_SZB 0 month 0.81± 0.03b 6.90 ± 0.23d 0.94 ± 0.12a 14.74 ± 0.41d
After 6 months 1.79 ± 0.02e 15.57 ± 0.16i 1.63± 0.02bc 33.61 ± 0.30i
FL_NN 0 month 1.60 ± 0.02d 1.21 ± 0.06a 0.76 ± 0.25a 3.17 ± 0.24a
After 6 months 3.25 ± 0.10h 11.69 ± 0.22g 2.47 ± 0.034d 25.08 ± 0.5g
All values are mean ± standard deviation of three measurements (n=3), (a-i) - means with the same letters within the column are not different (p>0.05).
Table 2. Peak temperature changes (T, °C) of DSC melting curves of flaxseed oils during storage (0, 2, 4 and 6 months).
Peak temperature (°C) Time FL_BU FL_DL FL_SZA FL_SZB FL_NN
T1 0 -36.85 ± 0.11aA -36.37 ± 0.12aAB -36.65 ± 0.22aAB -36.36 ± 0.07aA -36.55 ± 0.93aA
2 -37.19 ± 0.37abA -36.93 ± 0.27abcA -37.57 ± 0.36aA -36.2 ± 0.18cA -36.44 ± 0.32bcA
4 -36.72 ± 0.62aA -36.58 ± 0.06aAB -36.44 ± 0.18aB -35.69 ± 0.46abA -34.80 ± 0.17bB
6 -36.55 ± 0.18aA -36.12 ± 0.29abB -36.38 ± 0.20aB -35.59 ± 0.11bA -35.59 ± 0.06bAB
T2 0 -31.67 ± 0.09aA -30.10± 0.11abAB -30.37 ± 0.25abB -29.72 ± 0.05bA -30.01 ± 0.97abA
2 -31.54 ± 0.2aA -30.50 ± 0.29bcA -31.06 ± 0.21abA -29.64 ± 0.23dA -30.0 ± 0.25cdA
4 -30.88 ± 0.27aB -29.31 ± 0.28bcB -29.53 ± 0.12bC -28.35 ± 0.20dB -28.66 ± 0.03cdA
6 -30.22 ± 0.11aB -29.39 ± 0.24bB -29.67 ± 0.08abC -28.6 ± 0.13cB -28.55 ± 0.08cA
T3 0 -25.12 ± 0.00aA -24.94 ± 0.18abA -24.96 ± 0.2abA -24.19 ± 0.12bA -24.58 ± 0.54abA
2 -25.01 ± 0.00aA -25.05 ± 0.09aA -25.14 ± 0.00aA -24.85 ± 0.08abA -24.55 ± 0.22bA
4 -24.98 ± 0.16aA -25.10 ± 0.00aA -25.11 ± 0.00aA -24.63 ± 0.66aA -23.31 ± 0.16bB
6 -25.12 ± 0.00aA -24.55 ± 0.77aA -25.13 ± 0.00aA -24.47 ± 0.04aA -22.99 ± 0.07bB
T4 0 -13.63± 0.24aA -12.50 ± 0.49abA -12.64 ± 0.34abA -12.20 ± 0.06bA -13.87± 0.18aA
2 -13.57 ± 0.16aA -12.84 ± 0.18abA -13.27 ± 0.20aA -11.76 ± 0.42cA -12.21 ± 0.61bcB
4 -14.02 ± 0.00aA -10.62 ± 0.23bcB -11.13 ± 0.24bB -10.40 ± 0.29bcB -9.94 ± 0.15cC
6 -12.05± 0.24bB -11.24 ± 0.16aB -11.13 ± 0.04abB -10.54 ± 0.28cB -10.49 ± 0.08cC
FL_BU (Bukoz cultivar), FL_DL (Dolguniec cultivar), FL_SZA, FL SZB (Szafir cultivar), FL_NN (Unknown Flaxseed cultivar). T1 – peak temperature for first peak, counting from lower to higher temperature as T2, T3 and T4. All values are mean ± standard deviation of the two replicates. (a–d) means with the same superscript within the same row are not different (p > 0.05); (A-C) means with the same superscript within the same column are not different (p > 0.05).
Table 3. Peak height changes (h, W/g) of DSC melting curves of flaxseed oils during storage (0, 2, 4 and 6 months).
Peak
Height (W/g)
Time FL_BU FL_DL FL_SZA FL_SZB FL_NN
h1 0 0.15 ± 0.008bB 0.13 ± 0.008abA 0.14 ± 0.005abA 0.12 ± 0.008aA 0.10 ± 0.014aA
2 0.17 ± 0.007cB 0.15 ± 0.006bA 0.15 ± 0.008bcA 0.13 ± 0.004aA 0.12 ± 0.003aA
4 0.12 ± 0.004abcA 0.14 ± 0.008bcA 0.15± 0.002cA 0.11 ± 0.006abA 0.11 ± 0.013aA
6 0.15 ± 0.006aB 0.13 ± 0.024bA 0.15 ± 0.011abA 0.12 ± 0.000cA 0.12 ± 0.001cA
h2 0 0.47 ± 0.033aB 0.52 ± 0.099aA 0.46 ± 0.003aB 0.52 ± 0.002aC 0.43 ±0.062aAB
2 0.43 ± 0.016aB 0.46 ± 0.008abA 0.46 ± 0.012abB 0.48 ± 0.013bB 0.50± 0.031bB
4 0.45 ± 0.005cB 0.37 ± 0.005abA 0.37± 0.000aA 0.40 ± 0.005bA 0.46 ±0.016cAB
6 0.36 ± 0.007aA 0.42 ± 0.040aA 0.39 ± 0.013aA 0.41 ± 0.010aA 0.38 ± 0.000aA
h3 0 0.14 ± 0.006aA 0.14 ± 0.006aA 0.14 ± 0.000aA 0.15 ± 0.005aA 0.13 ± 0.000aA
2 0.14 ± 0.002aA 0.15 ± 0.006bAB 0.15 ± 0.001bB 0.16 ± 0.006bA 0.16 ± 0.002bB
4 0.14 ± 0.003aA 0.17 ± 0.003bB 0.16 ± 0.008abB 0.15 ± 0.010abA 0.14 ± 0.008aA
6 0.14 ± 0.001aA 0.14 ± 0.002aA 0.15 ± 0.001aB 0.15 ± 0.008aA 0.14 ± 0.001aA
h4 0 0.02 ± 0.001cAB 0.01 ± 0.001aA 0.02 ±0.001bAB 0.02± 0.001bcB 0.02 ±0.002bcB
2 0.03 ± 0.002cB 0.02 ± 0.001abA 0.02± 0.001bcB 0.02 ± 0.001aB 0.02 ±0.003abB
4 0.02 ± 0.002bA 0.02 ± 0.001abA 0.02 ± 0.000abA 0.01 ± 0.002bA 0.01 ± 0.002bA
6 0.02± 0.000bA 0.01 ± 0.004abA 0.01 ± 0.003abA 0.01 ± 0.003abA 0.01 ± 0.000aA
FL_BU (Bukoz cultivar), FL_DL (Dolguniec cultivar), FL_SZA, FL_SZB (Szafir cultivar), FL_NN (Unknown cultivar). h1 – peak height for first peak, counting from first to fourth peak as h2, h3 and h4. All values are mean ± standard deviation of the two replicates. (a–c) means with the same superscript within the same row are not different (p > 0.05); (A, B) means with the same superscript within the same column are not different (p > 0.05).
Table 4. Peak area (A) and percentage of peak area (P A) changes of DSC melting curves for flaxseed oils during storage (0, 2, 4 and 6 months).
Peak area Time FL_BU FL_DL FL_SZA FL_SZB FL_NN
A1 0 1.39 ± 0.07bB 1.18 ± 0.07abA 1.19 ± 0.04abA 1.03± 0.07aA 0.86 ± 0.12aA
2 1.45 ± 0.06cB 1.27 ± 0.05bA 1.33 ± 0.07bcA 1.12 ± 0.04aA 1.04 ± 0.02aA
4 1.09 ± 0.03abA 1.14 ± 0.1abA 1.30 ± 0.02bA 0.10 ± 0.07aA 0.93 ± 0.11aA
6 1.36 ± 0.05aB 1.12 ± 0.21aA 1.30 ± 0.04aA 1.07 ± 0.00aA 1.08 ± 0.01aA
A2 0 2.50 ± 0.20aB 2.68 ± 0.73aB 2.22 ± 0.01aB 2.7 ± 0.05aC 2.42± 0.04aA
2 2.20 ± 0.08aB 2.19 ± 0.04aAB 2.28 ± 0.03aB 2.21 ± 0.14aB 2.42 ± 0.26aA
4 2.29 ± 0.04bB 1.23 ± 0.11aA 1.40 ± 0.09aA 1.61± 0.05aA 2.31 ± 0.20bA
6 1.41 ± 0.06aA 1.74 ± 0.16abAB 1.62 ± 0.18abA 1.72 ± 0.05abA 1.89 ± 0.02bA
A3 0 1.20± 0.00aA 1.35 ± 0.06abA 1.32 ± 0.00abA 1.44 ± 0.05bA 1.25 ± 0.00aA
2 1.29 ± 0.03aB 1.44 ± 0.06bAB 1.41 ± 0.06abA 1.5± 0.06bA 1.48 ± 0.02bB
4 1.29 ± 0.02aB 1.58 ± 0.02bB 1.49 ± 0.08abA 1.44 ± 0.09abA 1.32 ± 0.08bA
6 1.38 ± 0.01aC 1.38 ± 0.02aA 1.47 ± 0.01aA 1.41 ± 0.08aA 1.34 ± 0.01aA
A4 0 0.21 ± 0.01bB 0.14 ± 0.02aAB 0.18 ± 0.02abB 0.18 ± 0.02abB 0.22 ± 0.02bB
2 0.22 ± 0.01bB 0.19 ± 0.01abB 0.23± 0.01bC 0.15± 0.02aB 0.20 ± 0.04abB
4 0.18 ± 0.02bAB 0.12 ± 0.01aA 0.13 ± 0.00abA 0.08 ± 0.02aA 0.08 ± 0.02aA
6 0.14 ± 0.00bA 0.11 ± 0.02abA 0.11 ± 0.02abA 0.09 ± 0.02abA 0.06 ± 0.00aA
% peak area
P A1 0 26.21 ± 0.07bB 22.18 ± 2.33abA 24.25± 0.57abA 19.23 ± 0.99aA 18.16 ± 2.17aA
2 28.16 ± 1.30cB 25.02 ± 0.20bA 25.33 ± 1.09bcA 22.54± 0.74abB 20.33 ± 1.62aA
4 22.49± 0.13aA 28.01 ± 1.06bcA 30.20 ± 0.25cB 24.11 ± 1.49abB 20.13 ± 2.37aA
6 31.65 ± 0.36bC 25.58 ± 2.89aA 28.97 ± 0.47abB 24.93 ± 0.04aB 24.67 ± 0.15aA
P A2 0 47.16 ± 1.32aC 49.72 ± 5.48aC 45.23 ± 0.42aB 50.47 ± 1.66aC 50.93 ± 1.92aA
2 42.67 ± 1.12aB 43.03 ± 0.59aBC 43.40 ± 0.70aB 44.35 ± 0.95abB 47.08 ± 2.32bA
4 47.15 ± 0.22bcC 30.07 ± 1.38aA 32.45 ± 1.88aA 38.94 ± 0.73abA 49.70 ± 4.3cA
6 32.99 ± 0.62aA 40.01 ± 0.65bcB 35.88 ± 2.1abA 40.12± 1.26bcA 43.37 ± 0.45cA
P A3 0 22.68 ± 1.15aA 25.49 ± 3.05aA 26.85 ± 0.41aA 26.85 ± 0.45aA 26.36 ± 0.49aA
2 24.87 ± 0.47aAB 28.21 ± 0.24bcA 26.87 ± 1.32abA 30.03 ± 0.41cAB 28.80 ± 1.28abAB
4 26.63 ± 0.26aB 38.92 ± 2.47cB 34.43 ± 2.14abcB 34.95 ± 2.58bcB 28.35 ± 1.59abAB
6 32.18 ± 0.98aC 31.80 ± 2.79aAB 32.77 ± 1.96aB 32.86 ± 1.88aB 30.68 ± 0.24aB
P A4 0 3.94 ± 0.10bcAB 2.61 ± 0.11aA 3.67 ± 0.26bcB 3.45 ± 0.22abB 4.55 ± 0.25cB
2 4.30 ± 0.24bB 3.74 ± 0.16abA 4.40 ± 0.14bC 3.07 ± 0.20aAB 3.78 ± 0.61abB
4 3.73 ± 0.36cAB 2.99 ± 0.03bcA 2.92 ± 0.01abcAB 1.99 ± 0.39abA 1.81 ± 0.34aA
6 3.17 ± 0.01bA 2.61 ± 0.76abA 2.37 ± 0.33abA 2.09 ± 0.58abA 1.27 ± 0.06aA
FL_BU (Bukoz cultivar), FL_DL (Dolguniec cultivar), FL_SZA, FL SZB (Szafir cultivar), FL_NN (Unknown cultivar). A1 – peak area for first peak, counting from first to fourth peak as A2, A3 and A4. P A1 – percentage of peak area for first peak, counting from first peak to fourth peak as P A2, P A3 and P A4. All values are mean ± standard deviation of the two replicates. (a–c) means with the same superscript within the same row are not different (p > 0.05); (A-C) means with the same superscript within the same column are not different (p > 0.05).
Disclaimer/Publisher’s Note: The statements, opinions and data contained in all publications are solely those of the individual author(s) and contributor(s) and not of MDPI and/or the editor(s). MDPI and/or the editor(s) disclaim responsibility for any injury to people or property resulting from any ideas, methods, instructions or products referred to in the content.
Copyright: This open access article is published under a Creative Commons CC BY 4.0 license, which permit the free download, distribution, and reuse, provided that the author and preprint are cited in any reuse.
Prerpints.org logo

Preprints.org is a free preprint server supported by MDPI in Basel, Switzerland.

Subscribe

© 2024 MDPI (Basel, Switzerland) unless otherwise stated