Submitted:
12 July 2023
Posted:
13 July 2023
You are already at the latest version
Abstract
Keywords:
1. Introduction
2. Theoretical Calculations
3. Materials and Methods
4. Results and Discussion
4.1. DFT Calculations
4.2. Fabrication and Characterization of Hybrid Film
4.3. Optical Characterization of the device
4.4. Fabrication and Electrical Characterization of the device
5. Conclusions
Author Contributions
Funding
Institutional Review Board Statement
Data Availability Statement
Acknowledgments
Conflicts of Interest
References
- Newman, C. R., Frisbie, C. D., da Silva Filho, D. A., Brédas, J.-L., Ewbank, P. C., & Mann, K. R. Introduction to organic thin film transistors and design of n-channel organic semiconductors. Chem. Mater. 2004, 16, 4436–4451. [CrossRef]
- Dou, L., Liu, Y., Hong, Z., Li, G., & Yang, Y. Low-bandgap near-IR conjugated polymers/molecules for organic electronics. Chem. Rev. 2015, 115, 12633–12665. [CrossRef]
- Murphy, A. R., & Frechet, J. M. Organic semiconducting oligomers for use in thin film transistors. Chem. Rev. 2007, 107, 1066–1096. [CrossRef]
- Piradi, V., Yan, F., Zhu, X., & Wong, W.-Y. A recent overview of porphyrin-based π-extended small molecules as donors and acceptors for high-performance organic solar cells. Mater. Chem. Front. 2021, 5, 7119–7133. [CrossRef]
- Henson, Z. B., Müllen, K., & Bazan, G. C. Design strategies for organic semiconductors beyond the molecular formula. Nat. Chem. 2012, 4, 699–704. [CrossRef]
- Sun, Y., Welch, G. C., Leong, W. L., Takacs, C. J., Bazan, G. C., & Heeger, A. J. Solution-processed small-molecule solar cells with 6.7% efficiency. Nat. Mater. 2012, 11, 44–48. [CrossRef]
- Qin, Y., Li, G., Qi, T., & Huang, H. Aromatic imide/amide-based organic small-molecule emitters for organic light-emitting diodes. Mater. Chem. Front. 2020, 4, 1554–1568. [CrossRef]
- Yu, T., Liu, L., Xie, Z., & Ma, Y. Progress in small-molecule luminescent materials for organic light-emitting diodes. Sci. China Chem. 2015, 58, 907–915. [CrossRef]
- Venkateswararao, A., & Wong, K.-T. Small molecules for vacuum-processed organic photovoltaics: past, current status, and prospect. Bull. Chem. Soc. Japan 2021, 94, 812–838. [CrossRef]
- Hains, A. W., Liang, Z., Woodhouse, M. A., & Gregg, B. A. Molecular semiconductors in organic photovoltaic cells. Chem. Rev. 2010, 110, 6689–6735. [CrossRef]
- Yamao, T., Miki, T., Akagami, H., Nishimoto, Y., Ota, S., & Hotta, S. Direct formation of thin single crystals of organic semiconductors onto a substrate. Chem. Mater. 2007, 19, 3748–3753. [CrossRef]
- Placencia, D., Wang, W., Shallcross, R. C., Nebesny, K. W., Brumbach, M., & Armstrong, N. R. Organic photovoltaic cells based on solvent-annealed, textured titanyl phthalocyanine/C60 heterojunctions. Adv. Funct. Mater. 2009, 19, 1913–1921. [CrossRef]
- Gregg, B. A., Sprague, J., & Peterson, M. W. Long-range singlet energy transfer in perylene bis (phenethylimide) films. J. Phys. Chem. B 1997, 101, 5362–5369. [CrossRef]
- Babu, B. H., Lyu, C., Yu, C., Wen, Z., Li, F., & Hao, X.-T. Role of Central Metal Ions in 8-Hydroxyquinoline-Doped ZnO Interfacial Layers for Improving the Performance of Polymer Solar Cells. Adv. Mater. Interfaces 2018, 5, 1801172. [CrossRef]
- Onlaor, K., Tunhoo, B., Thiwawong, T., & Nukeaw, J. Electrical bistability of tris-(8-hydroxyquinoline) aluminum (Alq3)/ZnSe organic-inorganic bistable device. Curr. Appl Phys. 2012, 12, 331–336. [CrossRef]
- Shahedi, Z., Jafari, M. R., & Zolanvari, A. A. Synthesis of ZnQ2, CaQ2, and CdQ2 for application in OLED: optical, thermal, and electrical characterizations. J. Mater. Sci. Mater. Electron. 2017, 28, 7313–7319. [CrossRef]
- Keshmiri, L., Elahi, S. M., Jafari, M. R., Jafari, F., & Parhizgar, S. S. The blue-shift of photoluminescence spectra of zinc complexes of 8-hydroxyquinoline by addition of ZnO nanoparticles. J. Electron. Mater. 2018, 47, 1526–1532. [CrossRef]
- Haggag, S. M., Farag, A. A., & Abdelrafea, M. Spectral, thermal and optical–electrical properties of the layer-by-layer deposited thin film of nano Zn(II)-8-hydroxy-5-nitrosoquinolate complex. Spectrochim. Acta A Mol. Biomol. Spectrosc. 2013, 110, 14–19. [CrossRef]
- Painuly, D., Masram, D. T., Rabanal, M. E., & Nagpure, I. M. The effect of ethanol on structural, morphological and optical properties of Li(I) 8–hydroxyquinoline phosphor. J. Lumin. 2017, 192, 1180–1190. [CrossRef]
- Sevgili, O., Canlı, S., Akman, F., Orak, I., Karabulut, A., & Yıldırım, N. Characterization of aluminum 8-hydroxyquinoline microbelts and microdots, and photodiode applications. J. Phys. Chem. Solids 2020, 136, 109128. [CrossRef]
- Demir, R., & Kaya, İ. Comparison of electrical characteristics of zinc oxide and cadmium sulfide films covered with 8-hydroxyquinoline for diode applications. J. Mater. Sci. Mater. Electron. 2019, 30, 7103–7109. [CrossRef]
- Babu, B. H., Lyu, C., Yu, C., Wen, Z., Li, F., & Hao, X.-T. Role of Central Metal Ions in 8-Hydroxyquinoline-Doped ZnO Interfacial Layers for Improving the Performance of Polymer Solar Cells. Adv. Mater. Interfaces 2018, 5, 1801172. [CrossRef]
- El-Nahass, M. M., Farid, A. M., & Atta, A. A. Structural and optical properties of Tris(8-hydroxyquinoline) aluminum (III)(Alq3) thermal evaporated thin films. J. Alloys Compd. 2010, 507, 112–119. [CrossRef]
- Dai, C., Shang, F., Wei, Z., Chen, Z., Yan, X., Ji, Z., Pang, Z., Han, S. Room temperature ferromagnetic and optical properties of rare earth Sm-doped tris(8-hydroxyquinoline) gallium thin films. Thin Solid Films 2018, 648, 113–119. [CrossRef]
- Bakhshipour, S., Shahedi, Z., Mirahmadi, F., Fereidonnejad, R., & Hesani, M. Effect of different in situ temperatures on the crystallinity and optical properties of green synthesized 8-hydroxyquinoline zinc by saffron extract. Opt. Continuum 2022, 1, 1401–1412. [CrossRef]
- Dumur, F. Zinc complexes in OLEDs: An overview. Synth. Met. 2014, 195, 241–251. [CrossRef]
- Shahedi, Z., Zare, H., & Sediqy, A. Manufacturing of nanoflowers crystal of ZnQ2 by a co-precipitation process and their morphology-dependent luminescence properties. J. Mater. Sci. Mater. Electron 2021, 32, 6843–6854. [CrossRef]
- Requena, F., & Crespo, M. Recent advances on phosphorescent cycloplatinated compounds containing tetradentate nitrogen ligands for OLED applications. Inorg. Chem. Res. 2022, 6, 39–47. [CrossRef]
- Jiang, F., Song, J., Dong, M., & Wang, Y. Preparation and Characterization of Paramagnetic Bis (8-Hydroxyquinoline) Manganese Crystals. Materials 2020, 13, 2379. [CrossRef]
- Ghedini, M., La Deda, M., Aiello, I., & Grisolia, A. Synthesis and photophysical characterisation of soluble photoluminescent metal complexes with substituted 8-hydroxyquinolines. Synth. Met. 2003, 138, 189–192. [CrossRef]
- Mohana, J., Ahila, G., Bharathi, M. D., & Anbalagan, G. Growth, spectral, optical, thermal, and mechanical behaviour of an organic single crystal: Quinolinium 2-carboxy 6-nitrophthalate monohydrate. J. Cryst. Growth 2016, 450, 181–189. [CrossRef]
- Saeed, A., Razvi, M. A., & Salah, N. Third-order nonlinear optical properties of the small-molecular organic semiconductor tris (8-Hydroxyquinoline) aluminum by CW Z-scan technique. Results Phys. 2021, 24, 104162. [CrossRef]
- Katakura, R., & Koide, Y. Configuration-specific synthesis of the facial and meridional isomers of tris(8-hydroxyquinolinate)aluminum (Alq3). Inorg. Chem. 2006, 45, 5730–5732. [CrossRef]
- Rajeswaran, M., Blanton, T. N., Young, R. H., & Brennessel, W. Modeling Disorder in the Crystal Structure of the α Polymorph of Alq3. J. Chem. Crystallogr.. 2010, 40, 195–200. [CrossRef]
- Kaji, H., Kusaka, Y., Onoyama, G., & Horii, F. Relationships between light-emitting properties and different isomers in polymorphs of tris(8-hydroxyquinoline) aluminum (III)(Alq3) analyzed by solid-state 27Al NMR and density functional theory (DFT) calculations. Jpn. J. App. Phys. 2005, 44, 3706. [CrossRef]
- Saeed, A., Al-Buriahi, M. S., Razvi, M. A., Salah, N., & Al-Hazmi, F. E. Electrical and dielectric properties of meridional and facial Alq3 nanorods powders. J. Mater. Sci. Mater. Electron 2021, 32, 2075–2087. [CrossRef]
- McElvain, J., Antoniadis, H., Hueschen, M. R., Miller, J. N., Roitman, D. M., Sheats, J. R., & Moon, R. L. Formation and growth of black spots in organic light-emitting diodes. J. Appl. Phys. 1996, 80, 6002–6007. [CrossRef]
- Do, L.-M., Oyamada, M., Koike, A., Han, E.-M., Yamamoto, N., & Fujihira, M. Morphological change in the degradation of Al electrode surfaces of electroluminescent devices by fluorescence microscopy and AFM. Thin Solid Films 1996, 273, 209–213. [CrossRef]
- Tang, C. W., & VanSlyke, S. A. Organic electroluminescent diodes. Appl. Phys. Lett. 1987, 51, 913–915. [CrossRef]
- Lam, T.-N., Huang, Y.-L., Weng, K.-C., Lai, Y.-L., Lin, M.-W., Chu, Y.-H., Lin, H.-J., Kaun, C.-C, Wei, D.-H., Tseng, Y.-C, Hsu, Y.-J. Spin filtering of a termination-controlled LSMO/Alq3 heterojunction for an organic spin valve. J. Mater. Chem. C 2017, 5, 9128–9137. [CrossRef]
- Kao, P.-C., Chu, S.-Y., Huang, H.-H., Tseng, Z.-L., & Chen, Y.-C. Improved efficiency of organic photovoltaic cells using tris (8-hydroxy-quinoline) aluminum as a doping material. Thin Solid Films 2009, 517, 5301–5304. [CrossRef]
- Varo, P. L., Tejada, J. J., Villanueva, J. L., Carceller, J. E., & Deen, M. J. Modeling the transition from ohmic to space charge limited current in organic semiconductors. Org. Electron. 2012, 13, 1700–1709. [CrossRef]
- Abdel-Malik, T. G., & Cox, G. A. Charge transport in nickel phthalocyanine crystals. I. Ohmic and space-charge-limited currents in vacuum ambient. J. Phys. C: Solid State Phys. 1977, 10, 63. [CrossRef]
- Moiz, S. A., Ahmed, M. M., & Karimov, K. S. Estimation of Electrical Parameters of OD Organic Semiconductor Diode from Measured I-V Characteristics. ETRI journal 2005, 27, 319–325. [CrossRef]
- Kim, K. M., Choi, B. J., Lee, M. H., Kim, G. H., Song, S. J., Seok, J. Y., . . . Hwang, C. S. A detailed understanding of the electronic bipolar resistance switching behavior in Pt/TiO2/Pt structure. Nanotechnology 2011, 22, 254010. [CrossRef]
- Kim, K. M., Choi, B. J., Shin, Y. C., Choi, S., & Hwang, C. S. Anode-interface localized filamentary mechanism in resistive switching of TiO2 thin films. App. Phys. Lett. 2007, 91, 012907. [CrossRef]
- Mott, N. F. & Gurney, R. W. Electronic processes in ionic crystals. Oxford, Second edition, 1946.
- Gucciardi, P. G., Trusso, S., Vasi, C., Patane, S., & Allegrini, M. Nano-Raman imaging of Cu–TCNQ clusters in TCNQ thin films by scanning near-field optical microscopy. Phys. Chem. Chem. Phys. 2002, 4, 2747–2753. [CrossRef]
- Bendikov, M., Wudl, F., & Perepichka, D. F. Tetrathiafulvalenes, oligoacenenes, and their buckminsterfullerene derivatives: The brick and mortar of organic electronics. Chem. Rev. 2004, 104, 4891–4946. [CrossRef]
- Roncali, J. Molecular engineering of the band gap of π-conjugated systems: Facing technological applications. Macromol. Rapid Commun. 2007, 28, 1761–1775. [CrossRef]
- Frisch, M. J., Trucks, G. W., Schlegel, H. B., Scuseria, G. E., Robb, M., Cheeseman, J. R., Scalmani, G., Barone, V. P. G. A., Petersson, G. A., Nakatsuji, H. J. R. A. Gaussian 16, Revision A. 03, Gaussian. 2016 Inc., Wallingford CT, 3.
- Becke, A. D. Density-functional exchange-energy approximation with correct asymptotic behavior. Phys. Rev. A 1988, 38, 3098. [CrossRef]
- Perdew, J. P., & Wang, Y. Accurate and simple analytic representation of the electron-gas correlation energy. Phys Rev. B 1992, 45, 13244. [CrossRef]
- Min, D., Cho, M., Khan, A. R., & Li, S. Charge transport properties of dielectrics revealed by isothermal surface potential decay. IEEE Trans. Dielectr. Electr. Insul. 2012, 19, 1465–1473. [CrossRef]
- Varo, P. L., Tejada, J. J., Villanueva, J. L., & Deen, M. J. Space-charge and injection limited current in organic diodes: A unified model. Org. Electron. 2014, 15, 2526–2535. [CrossRef]
- Bhutta, M. S., Akram, S., Meng, P., Castellon, J., Agnel, S., Li, H., Guo, Y., Rasool, G., Hussain, S., Nazir, M.T. Steady-state conduction current performance for multilayer polyimide/SiO2 films. Polymers 2021, 13, 640. [CrossRef]
- Zhu, G.-Z., & Wang, L.-S. Communication: Vibrationally resolved photoelectron spectroscopy of the tetracyanoquinodimethane (TCNQ) anion and accurate determination of the electron affinity of TCNQ. J. Chem. Phys. 2015, 143, 221102. [CrossRef]
- Scharber, M. C., & Sariciftci, N. S. Low band gap conjugated semiconducting polymers. Adv. Mater. Technol. 2021, 6, 2000857. [CrossRef]
- Havinga, E. E., Ten Hoeve, W., & Wynberg, H. J. A new class of small band gap organic polymer conductors. Polym. Bull. 1992, 29, 119–126. [CrossRef]
- Phillips, J. P., & Deye, J. F. Infrared spectra of oxine chelates. Anal. Chim. Acta 1957, 17, 231–233. [CrossRef]
- Gavrilko, T., Fedorovich, R., Dovbeshko, G., Marchenko, A., Naumovets, A., Nechytaylo, V., Puchkovska, G., Viduta, L., Baran, J., Ratajczak, H. FTIR spectroscopic and STM studies of vacuum deposited aluminium (III) 8-hydroxyquinoline thin films. J. Mol. Struct. 2004, 704, 163–168. [CrossRef]
- Tackett, J. E., & Sawyer, D. T. Properties and infrared spectra in the potassium bromide region of 8-quinolinol and its metal chelates. Inorg. Chem. 1964, 3, 692–696. [CrossRef]
- Engelter, C., Jackson, G. E., Knight, C. L., & Thornton, D. A. Spectra-structure correlations from the infrared spectra of some transition metal complexes of 8-hydroxyquinoline. J. Mol. Struct. 1989, 213, 133–144. [CrossRef]
- Bredas, J. L., Silbey, R., Boudreaux, D. S., & Chance, R. R. Chain-length dependence of electronic and electrochemical properties of conjugated systems: polyacetylene, polyphenylene, polythiophene, and polypyrrole. J. Am. Chem. Soc. 1983, 105, 6555–6559. [CrossRef]
- Tauc, J. Optical properties and electronic structure of amorphous Ge and Si. Mater. Res. Bull. 1968, 3, 37–46. [CrossRef]
- Urbach, F. The long-wavelength edge of photographic sensitivity and of the electronic absorption of solids. Phys. Rev. 1953, 92, 1324. [CrossRef]
- Alosabi, A. Q., Al-Muntaser, A. A., El-Nahass, M. M., & Oraby, A. H. Structural, optical and DFT studies of disodium phthalocyanine thin films for optoelectronic devices applications. Opt. Laser Technol. 2022, 155, 108372. [CrossRef]
- Dongol, M., El-Nahass, M. M., El-Denglawey, A., Elhady, A. F., & Abuelwafa, A. A. Optical properties of nano 5, 10, 15, 20-tetraphenyl-21H,23H-prophyrin nickel (II) thin films. Curr. Appl Phys. 2012, 12, 1178–1184. [CrossRef]
- Hill, I. G., Kahn, A., Soos, Z. G., & Pascal Jr, R. A. Charge-separation energy in films of π-conjugated organic molecules. Chem. Phys. Lett. 2000, 327, 181–188. [CrossRef]
- Hamdalla, T., Darwish, A.A.A., Al-Ghamdi, S.A., Alzahrani, A.O.M., El-Zaidia, E.F.M., Alamrani, N.A., Elblbesy, M.A., Yahia, I. S. Preparation, Raman spectroscopy, surface morphology and optical properties of TiPcCl2 nanostructured films: thickness effect. Opt. Quantum. Electron. 2021, 53, 1–16. [CrossRef]
- Ghanem, M. G., Badr, Y., Hameed, T. A., El Marssi, M., Lahmar, A., Wahab, H. A., & Battisha, I. K. Synthesis and characterization of undoped and Er-doped ZnO nano-structure thin films deposited by sol-gel spin coating technique. Mater. Res. Express 2019, 6, 085916. [CrossRef]
- De Boor, C. A practical guide to splines. Springer-verlag New York, 1978.
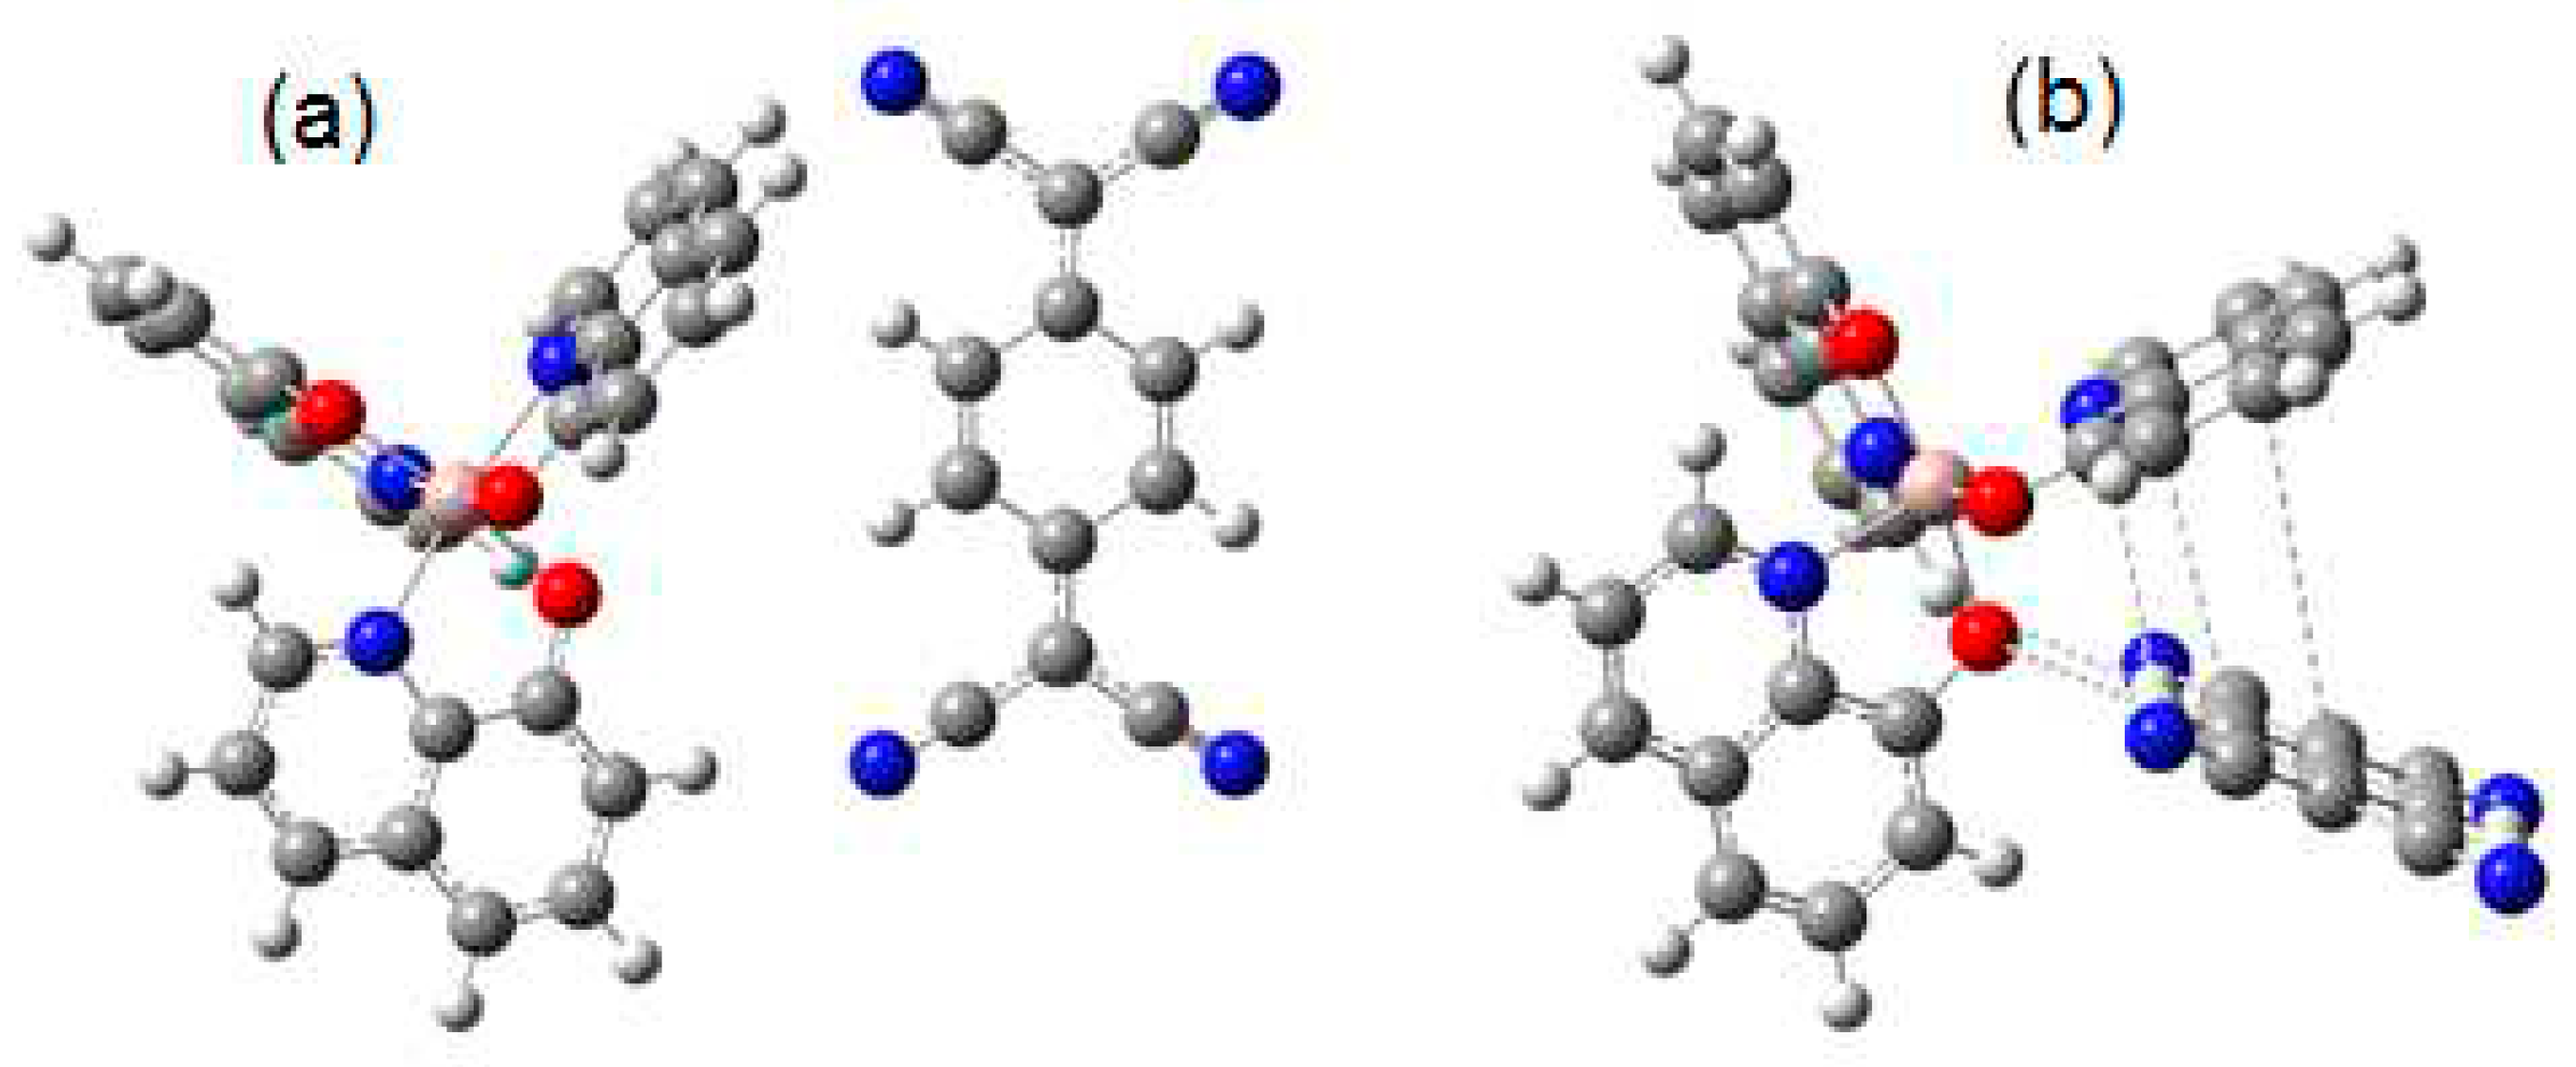

| Distance (Å) | Wiberg index | |||
|---|---|---|---|---|
| Alq3 | TCNQ | HAl-TCNQ1 | ||
| N (62) | N (53) | |||
| H (22) | 2.85 | 0.0018 | ||
| H (23) | 2.76 | 0.0024 | ||
| H (49) | 2.49 | 0.0074 | ||
| Alq3 | TCNQ | HAl-TCNQ2 | ||
| N (53) | H (69) | H (70) | ||
| H (15) | 2.69 | 0.0036 | ||
| O (32) | 3.04 | 0.0023 | ||
| O (51) | 2.079 | 0.0257 | ||
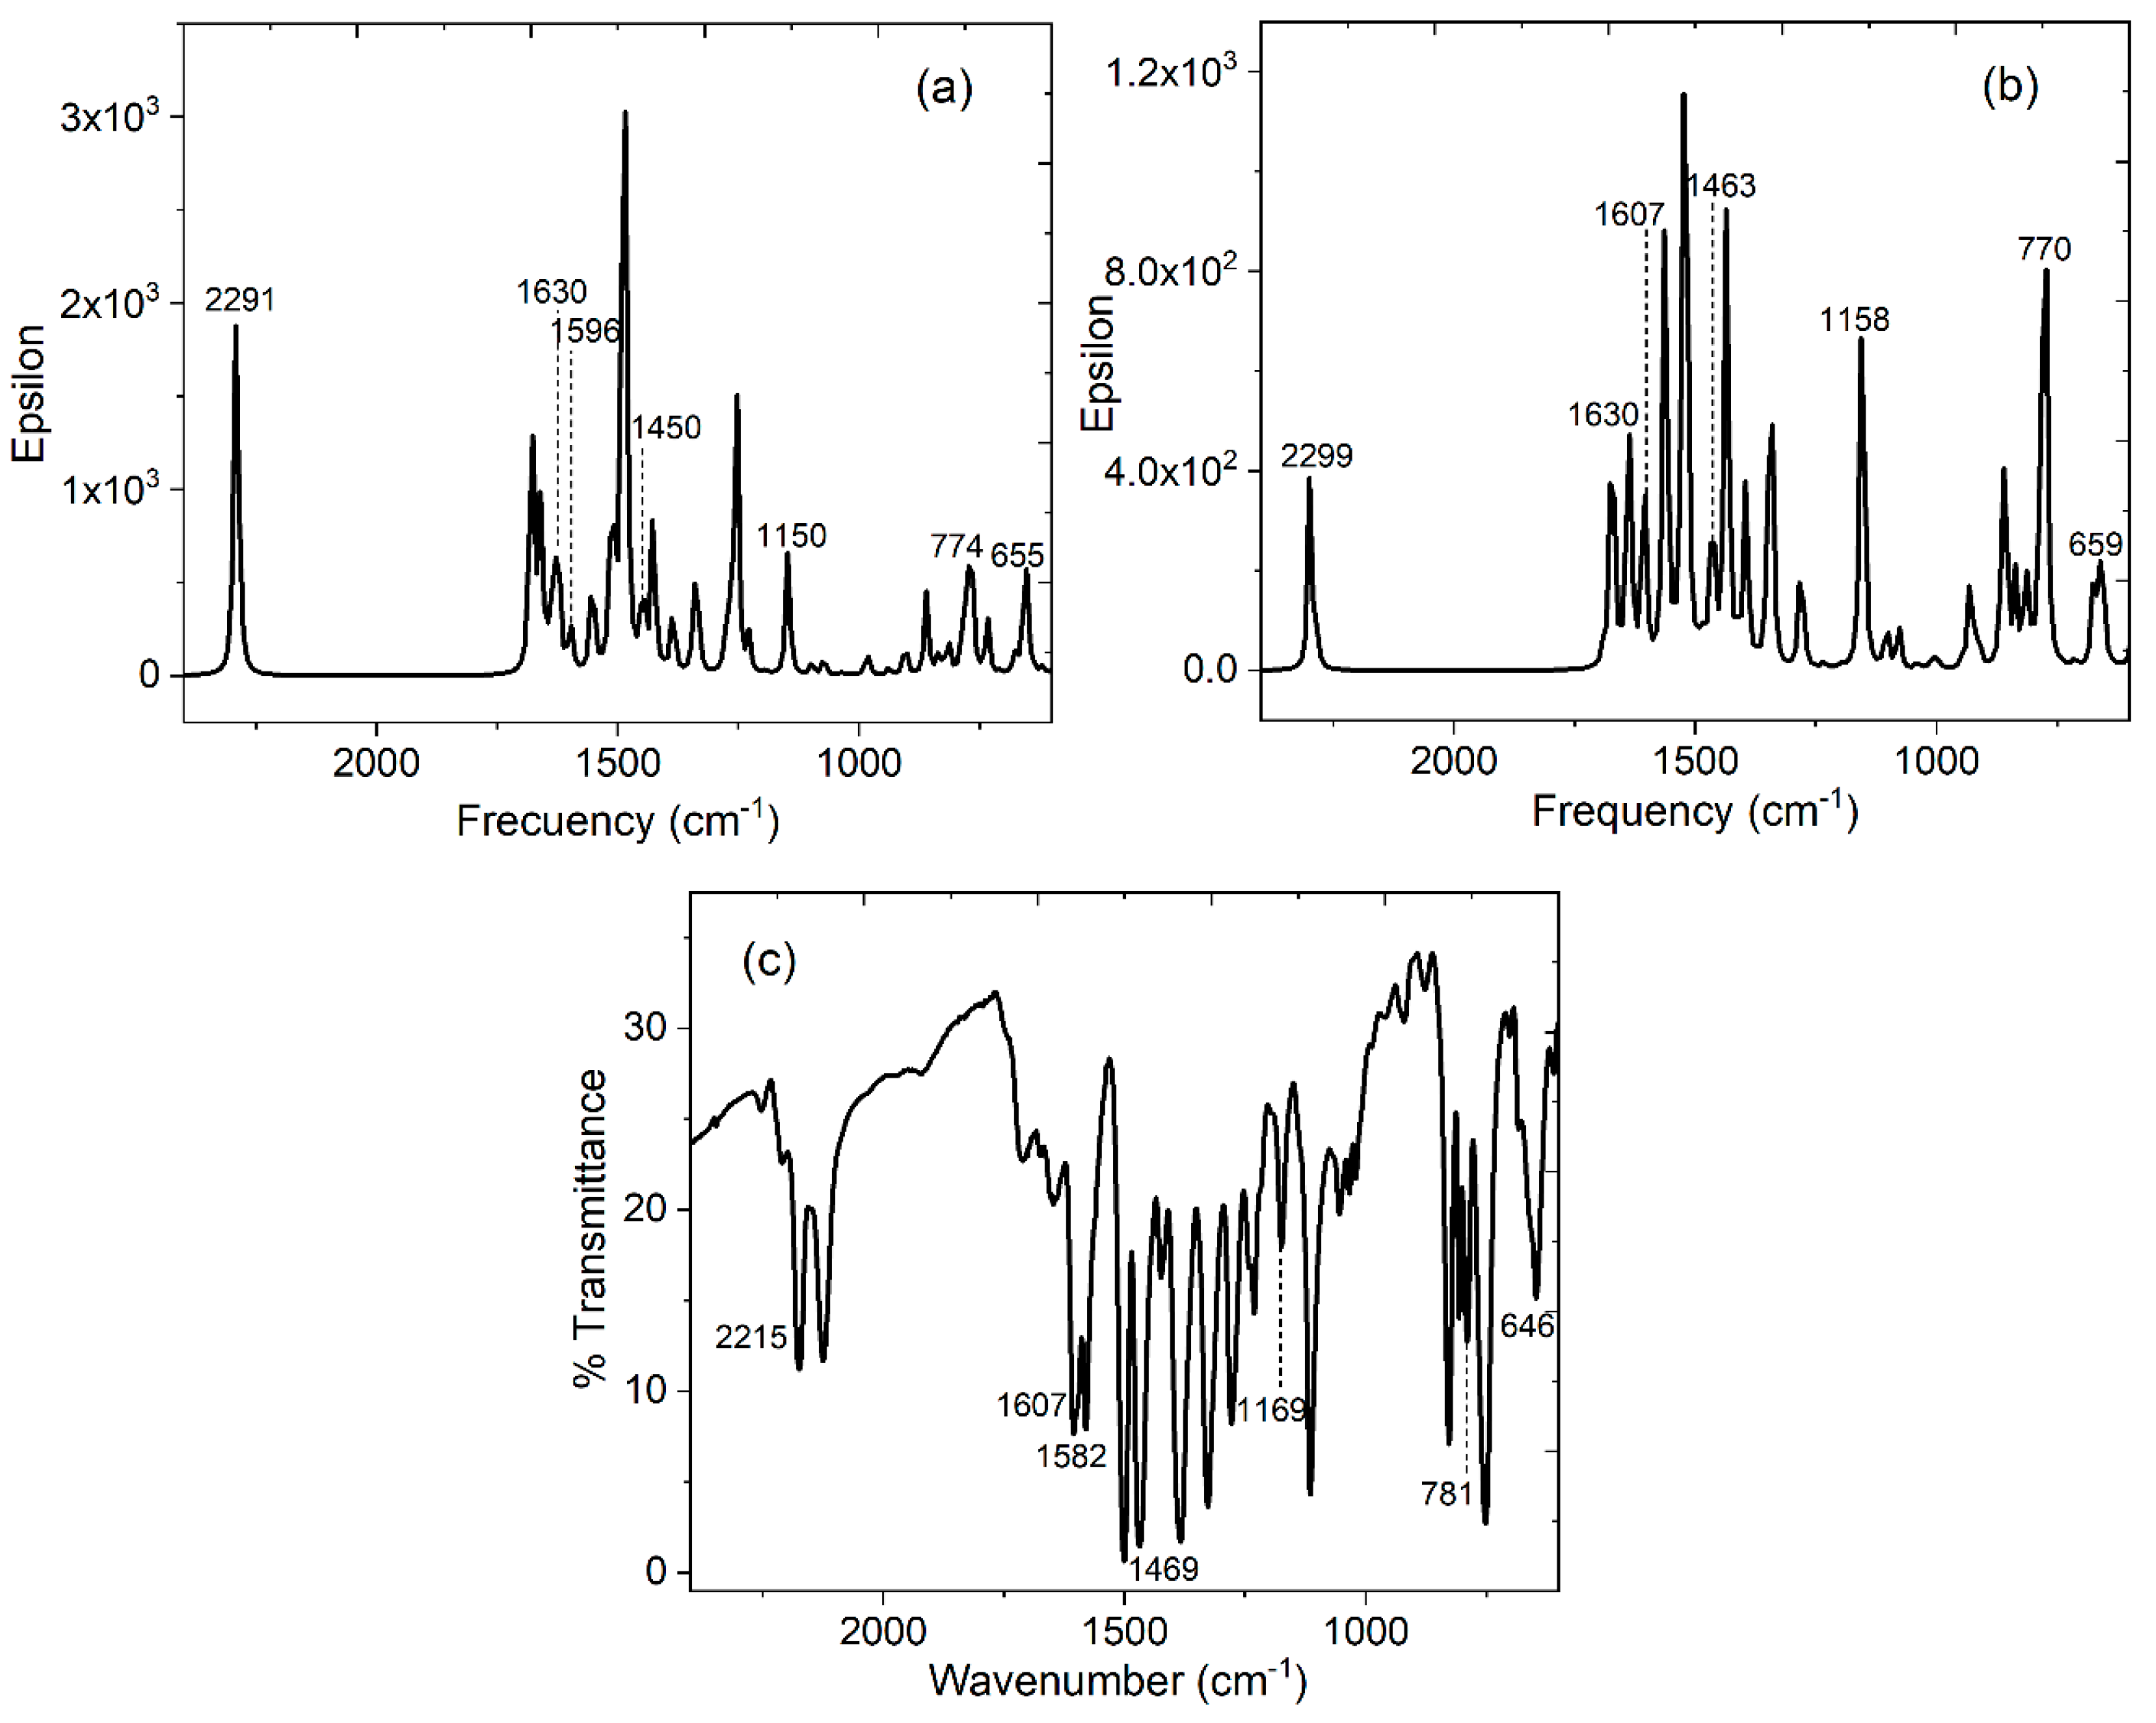
| HAl-TCNQ1 ν (cm-1) simulated |
HAl-TCNQ2 ν (cm-1) simulated |
Alq3-TCNQ ν (cm-1) KBr pellet |
(Alq3-TCNQ):PPy ν (cm-1) film |
Assignment |
|---|---|---|---|---|
| 1630 | 1630 | 1607 | 1609 | C=C |
| 1596 | 1607 | 1582 | 1591 | C=N |
| 1450 | 1463 | 1469 | 1466 | C-C |
| 1150 | 1158 | 1169 | 1156 | C-C-H |
| 774, 655 | 770, 659 | 781, 646 | 772, 648 | in-plane ring deformations |
| 2291 | 2299 | 2215 | 2217 | CN-stretchig mode |
Disclaimer/Publisher’s Note: The statements, opinions and data contained in all publications are solely those of the individual author(s) and contributor(s) and not of MDPI and/or the editor(s). MDPI and/or the editor(s) disclaim responsibility for any injury to people or property resulting from any ideas, methods, instructions or products referred to in the content. |
© 2023 by the authors. Licensee MDPI, Basel, Switzerland. This article is an open access article distributed under the terms and conditions of the Creative Commons Attribution (CC BY) license (http://creativecommons.org/licenses/by/4.0/).


