Submitted:
13 July 2023
Posted:
13 July 2023
You are already at the latest version
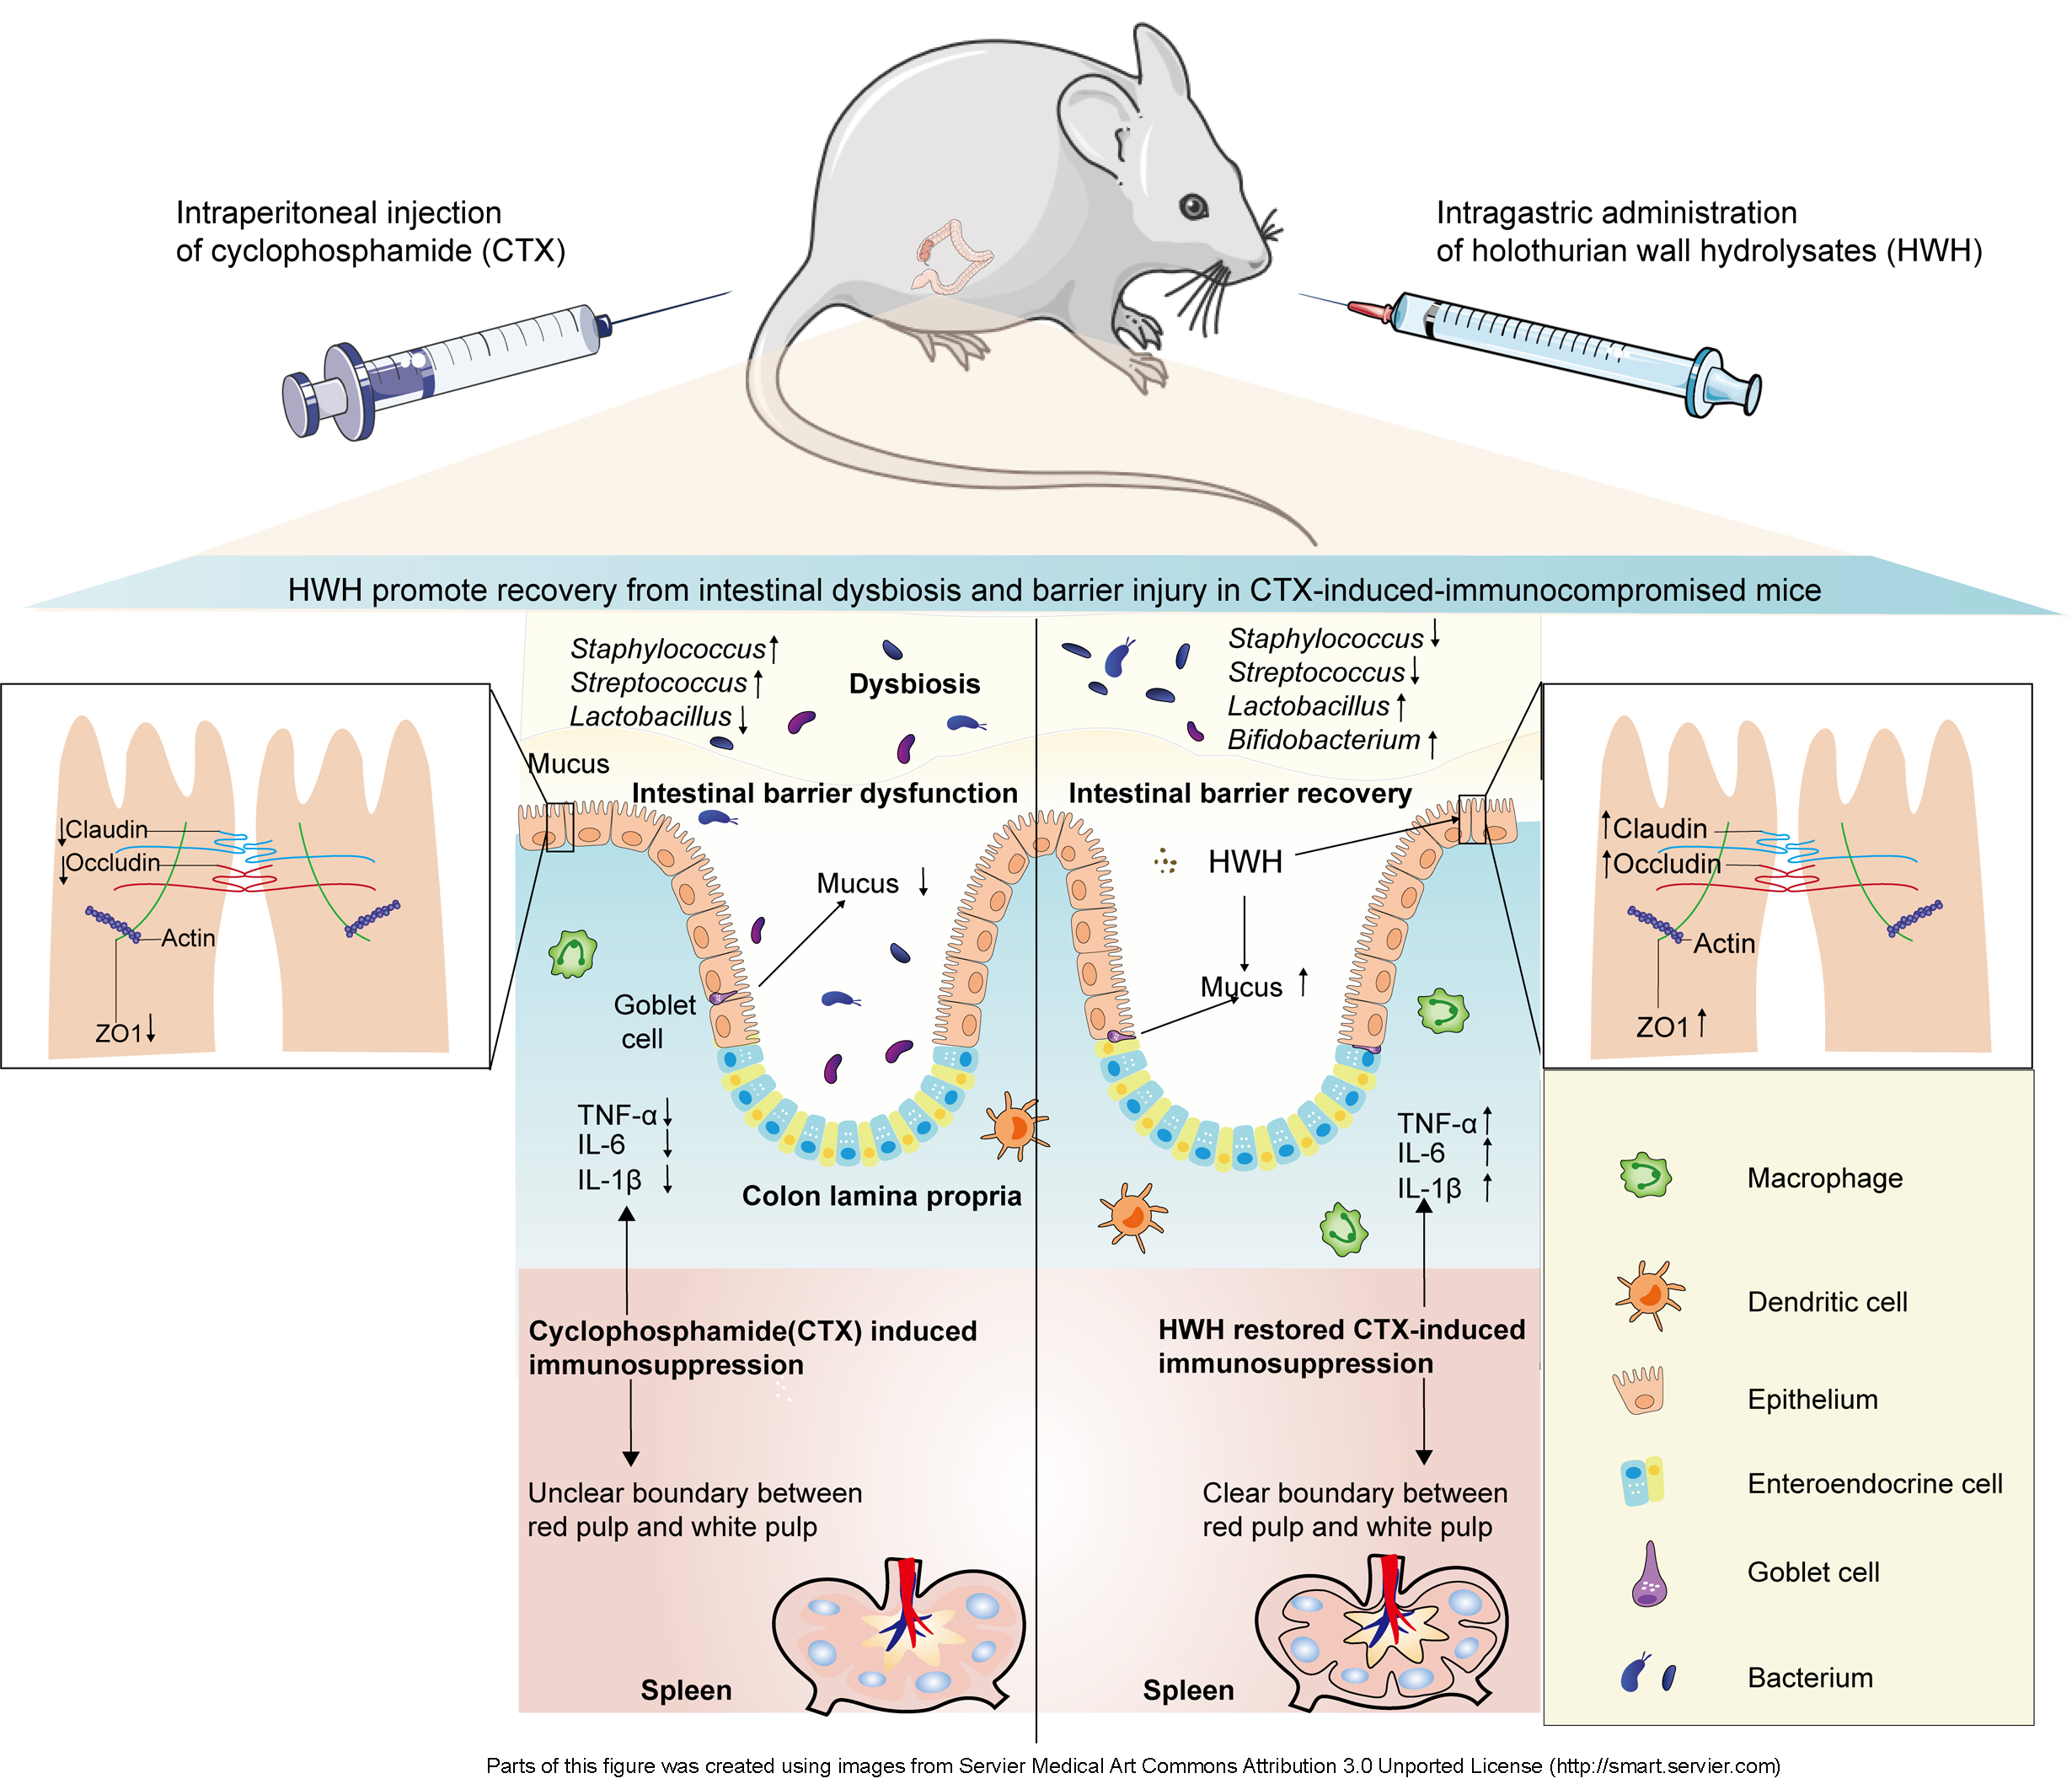
Abstract
Keywords:
1. Introduction
2. Results
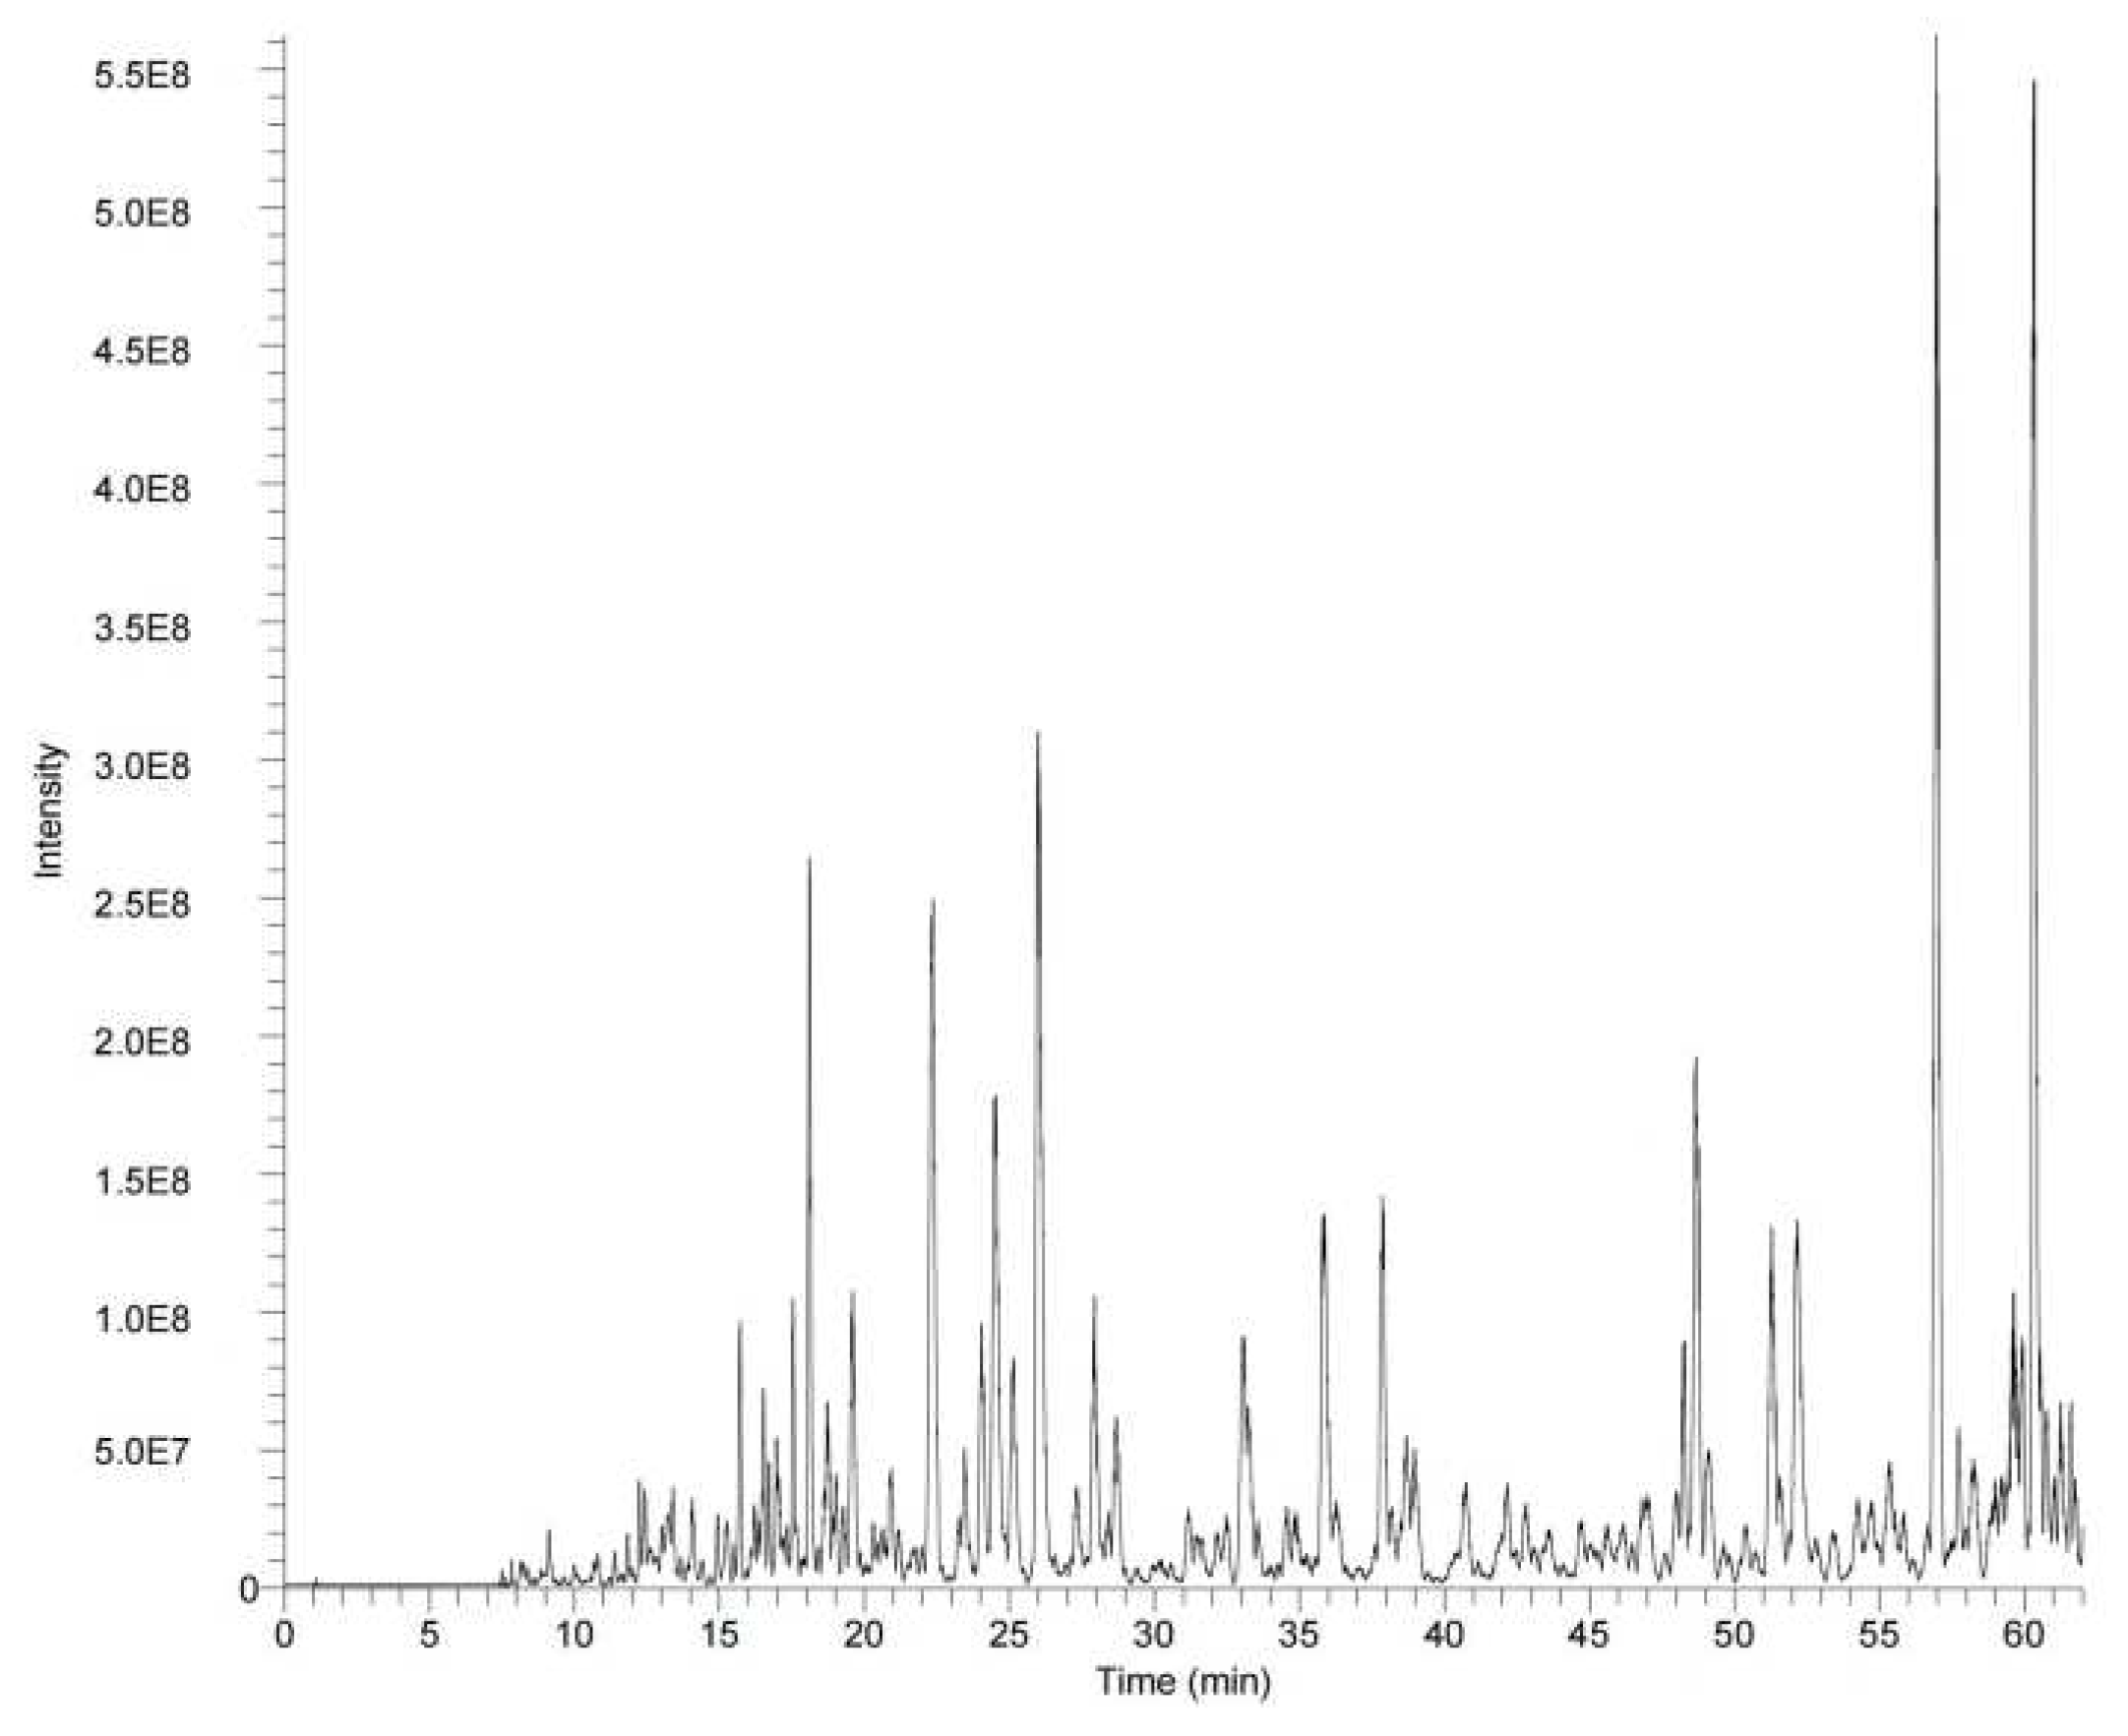
2.1. Peptide sequence analysis of HWH
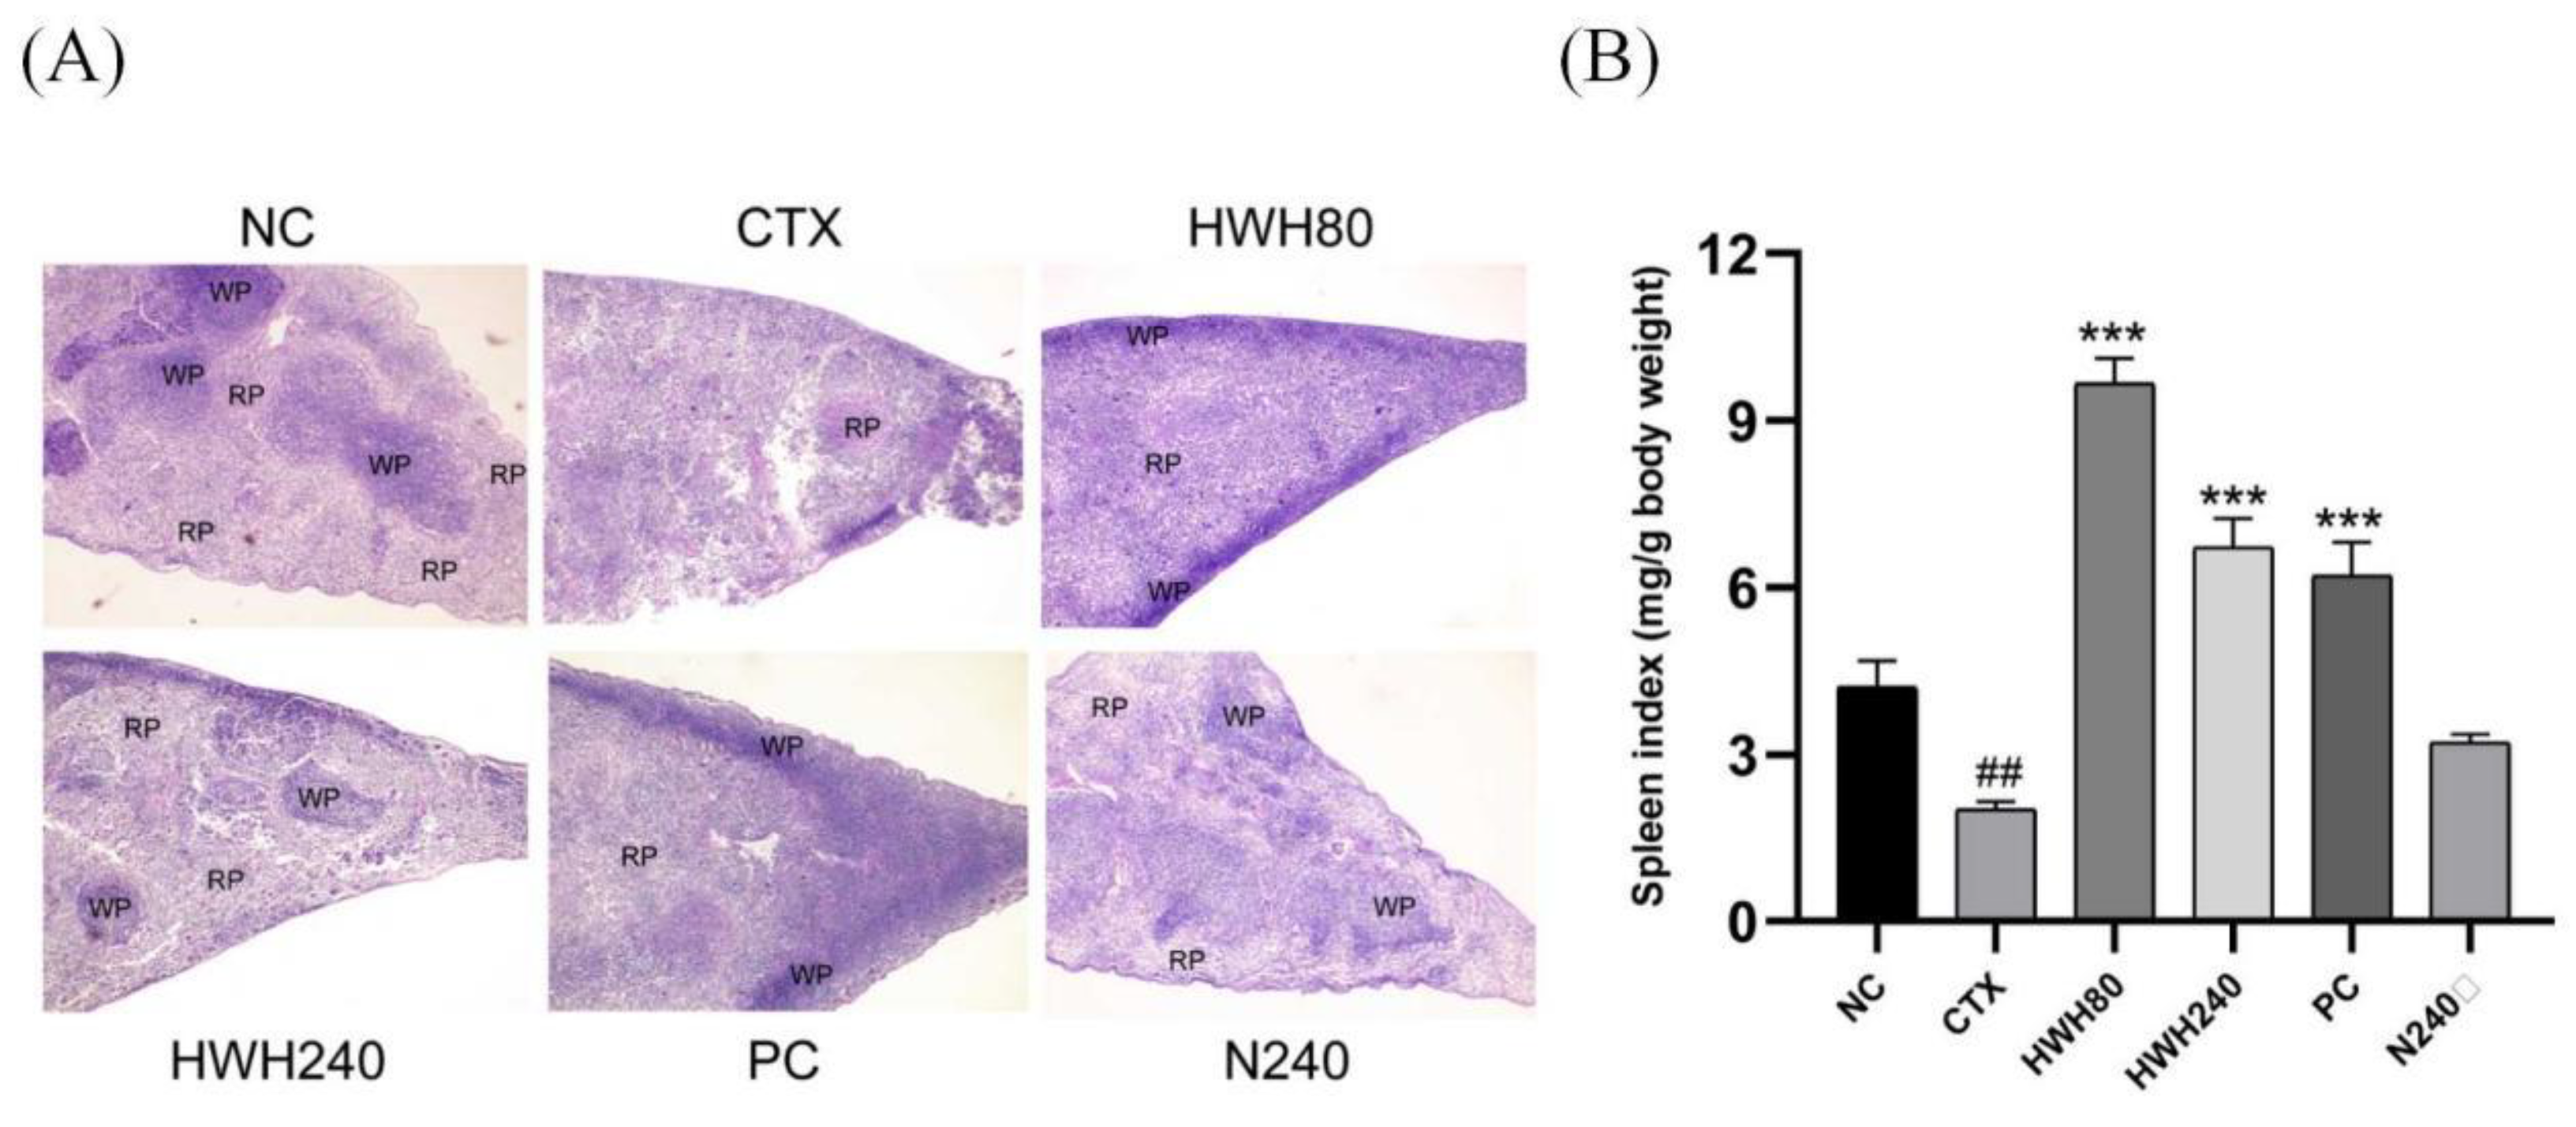
2.2. Effects of HWH on spleen index and spleen histopathology
2.3. Effects of HWH on histopathology in colon
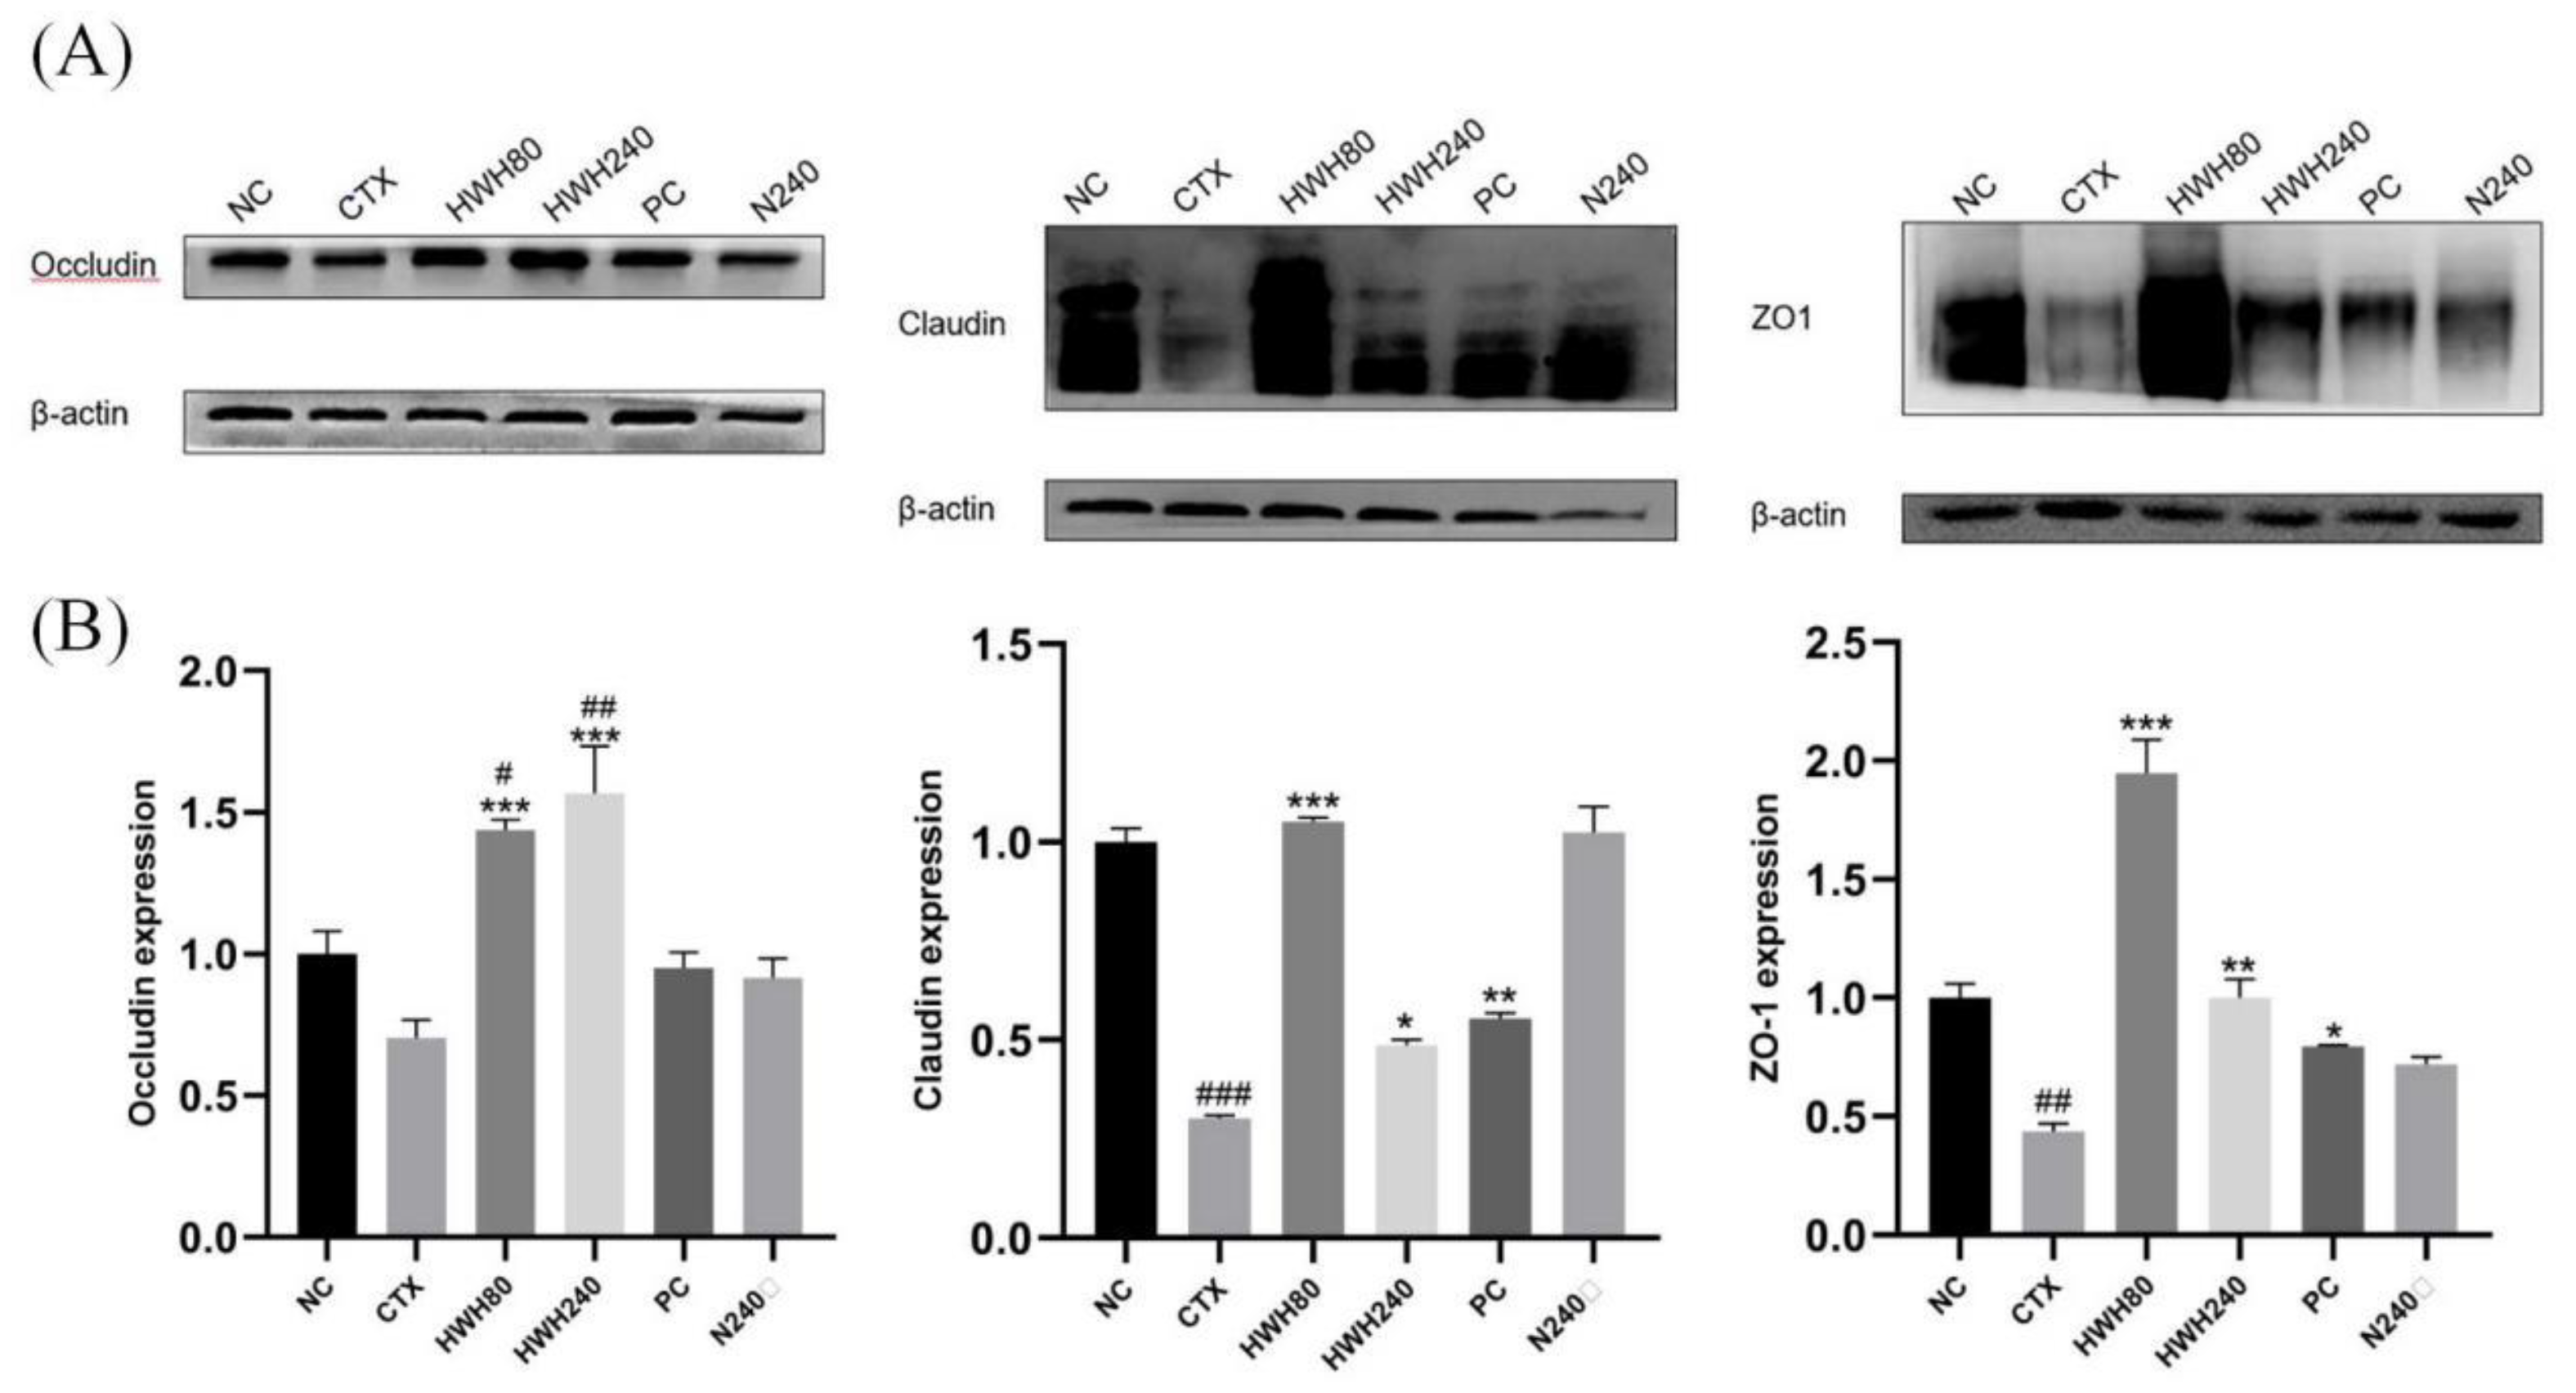
2.4. Effects of HWH on intestinal tight junction proteins
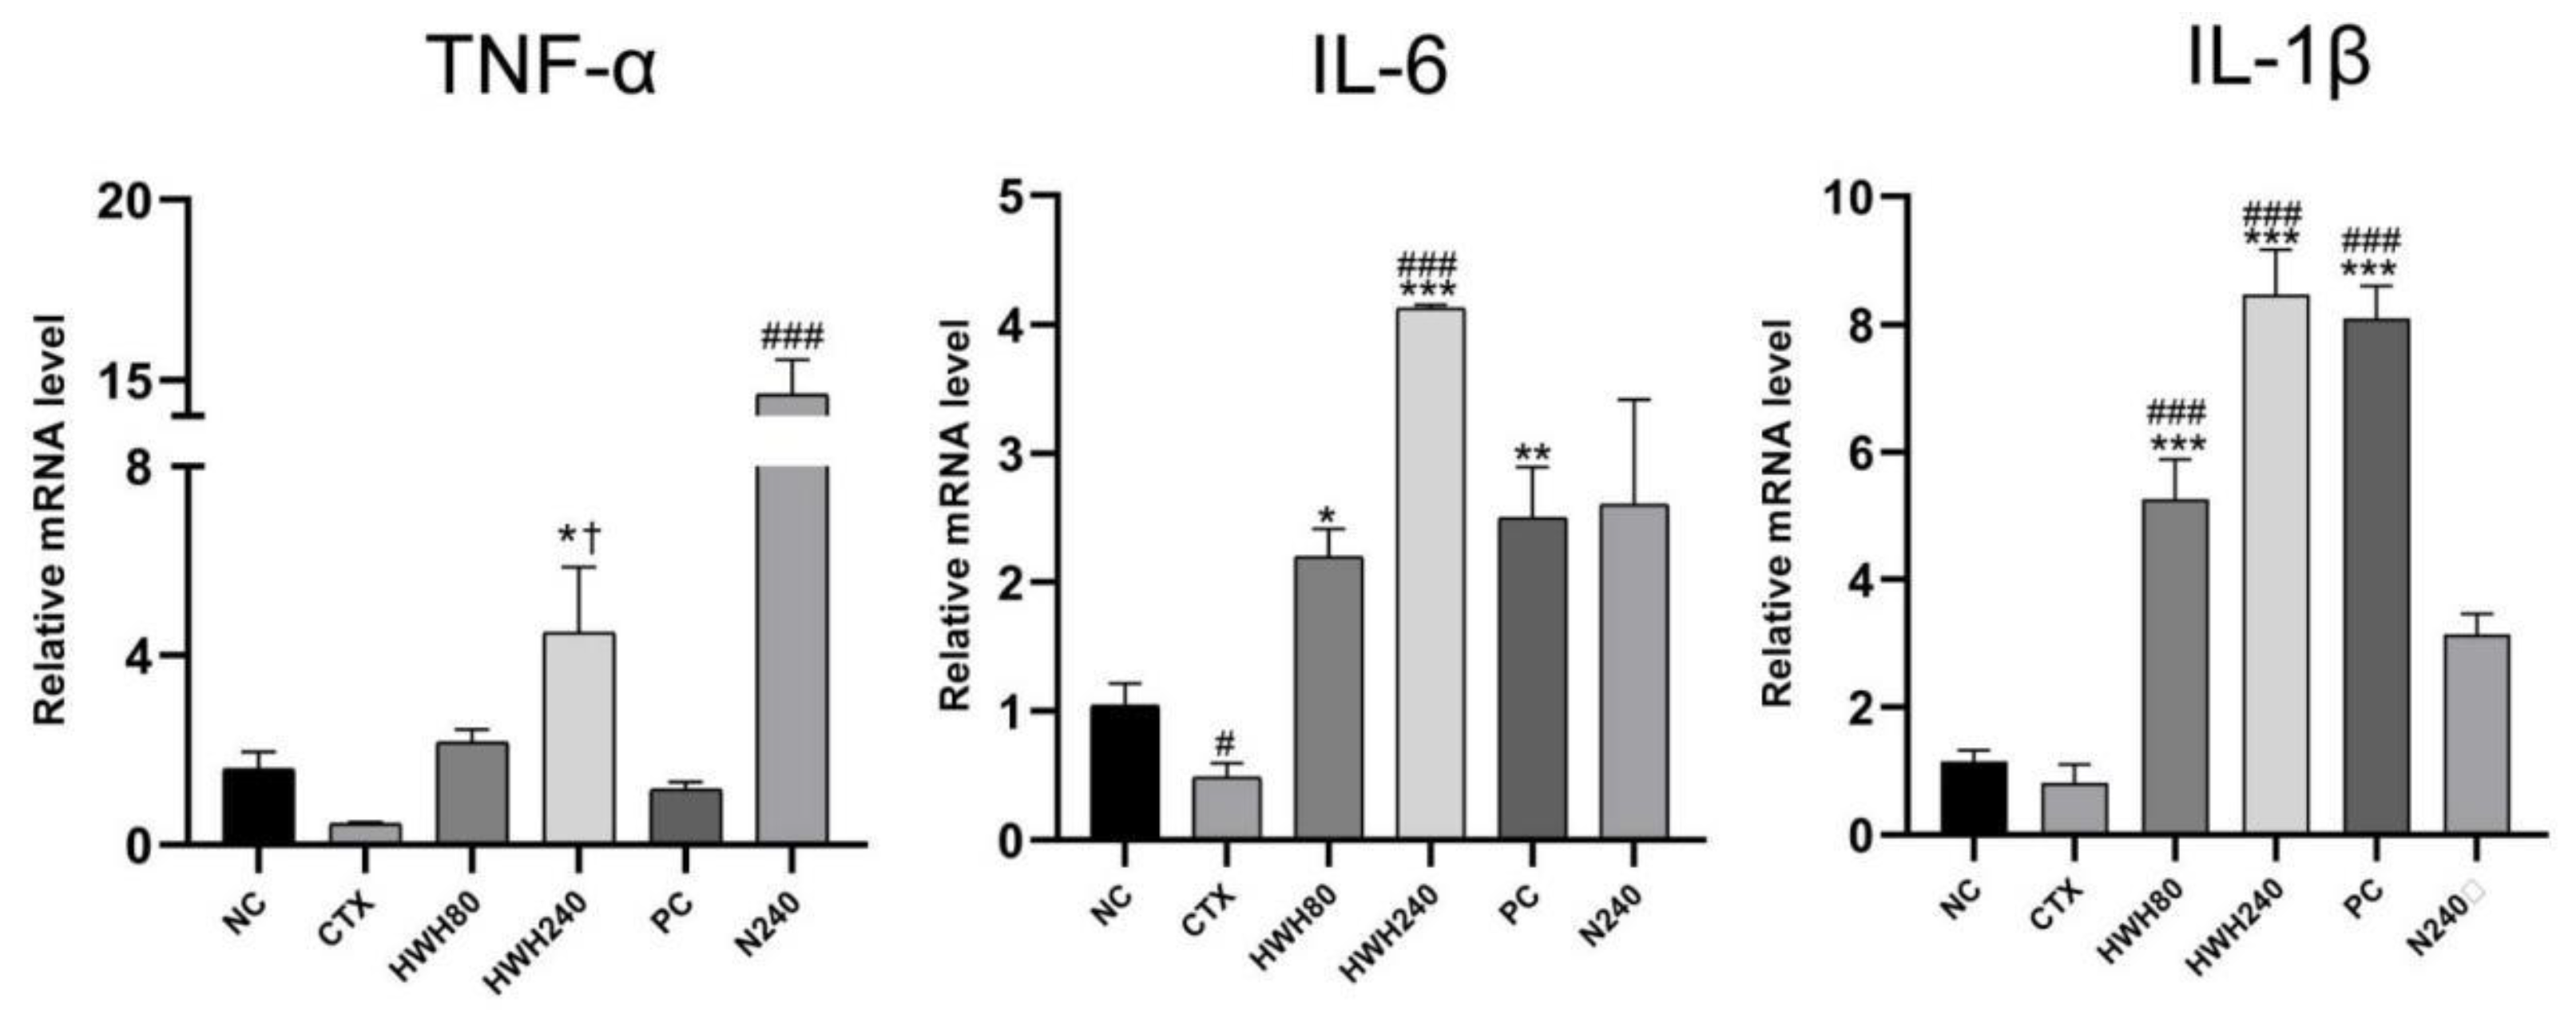
2.5. Effects of HWH on pro-inflammatory cytokines levels
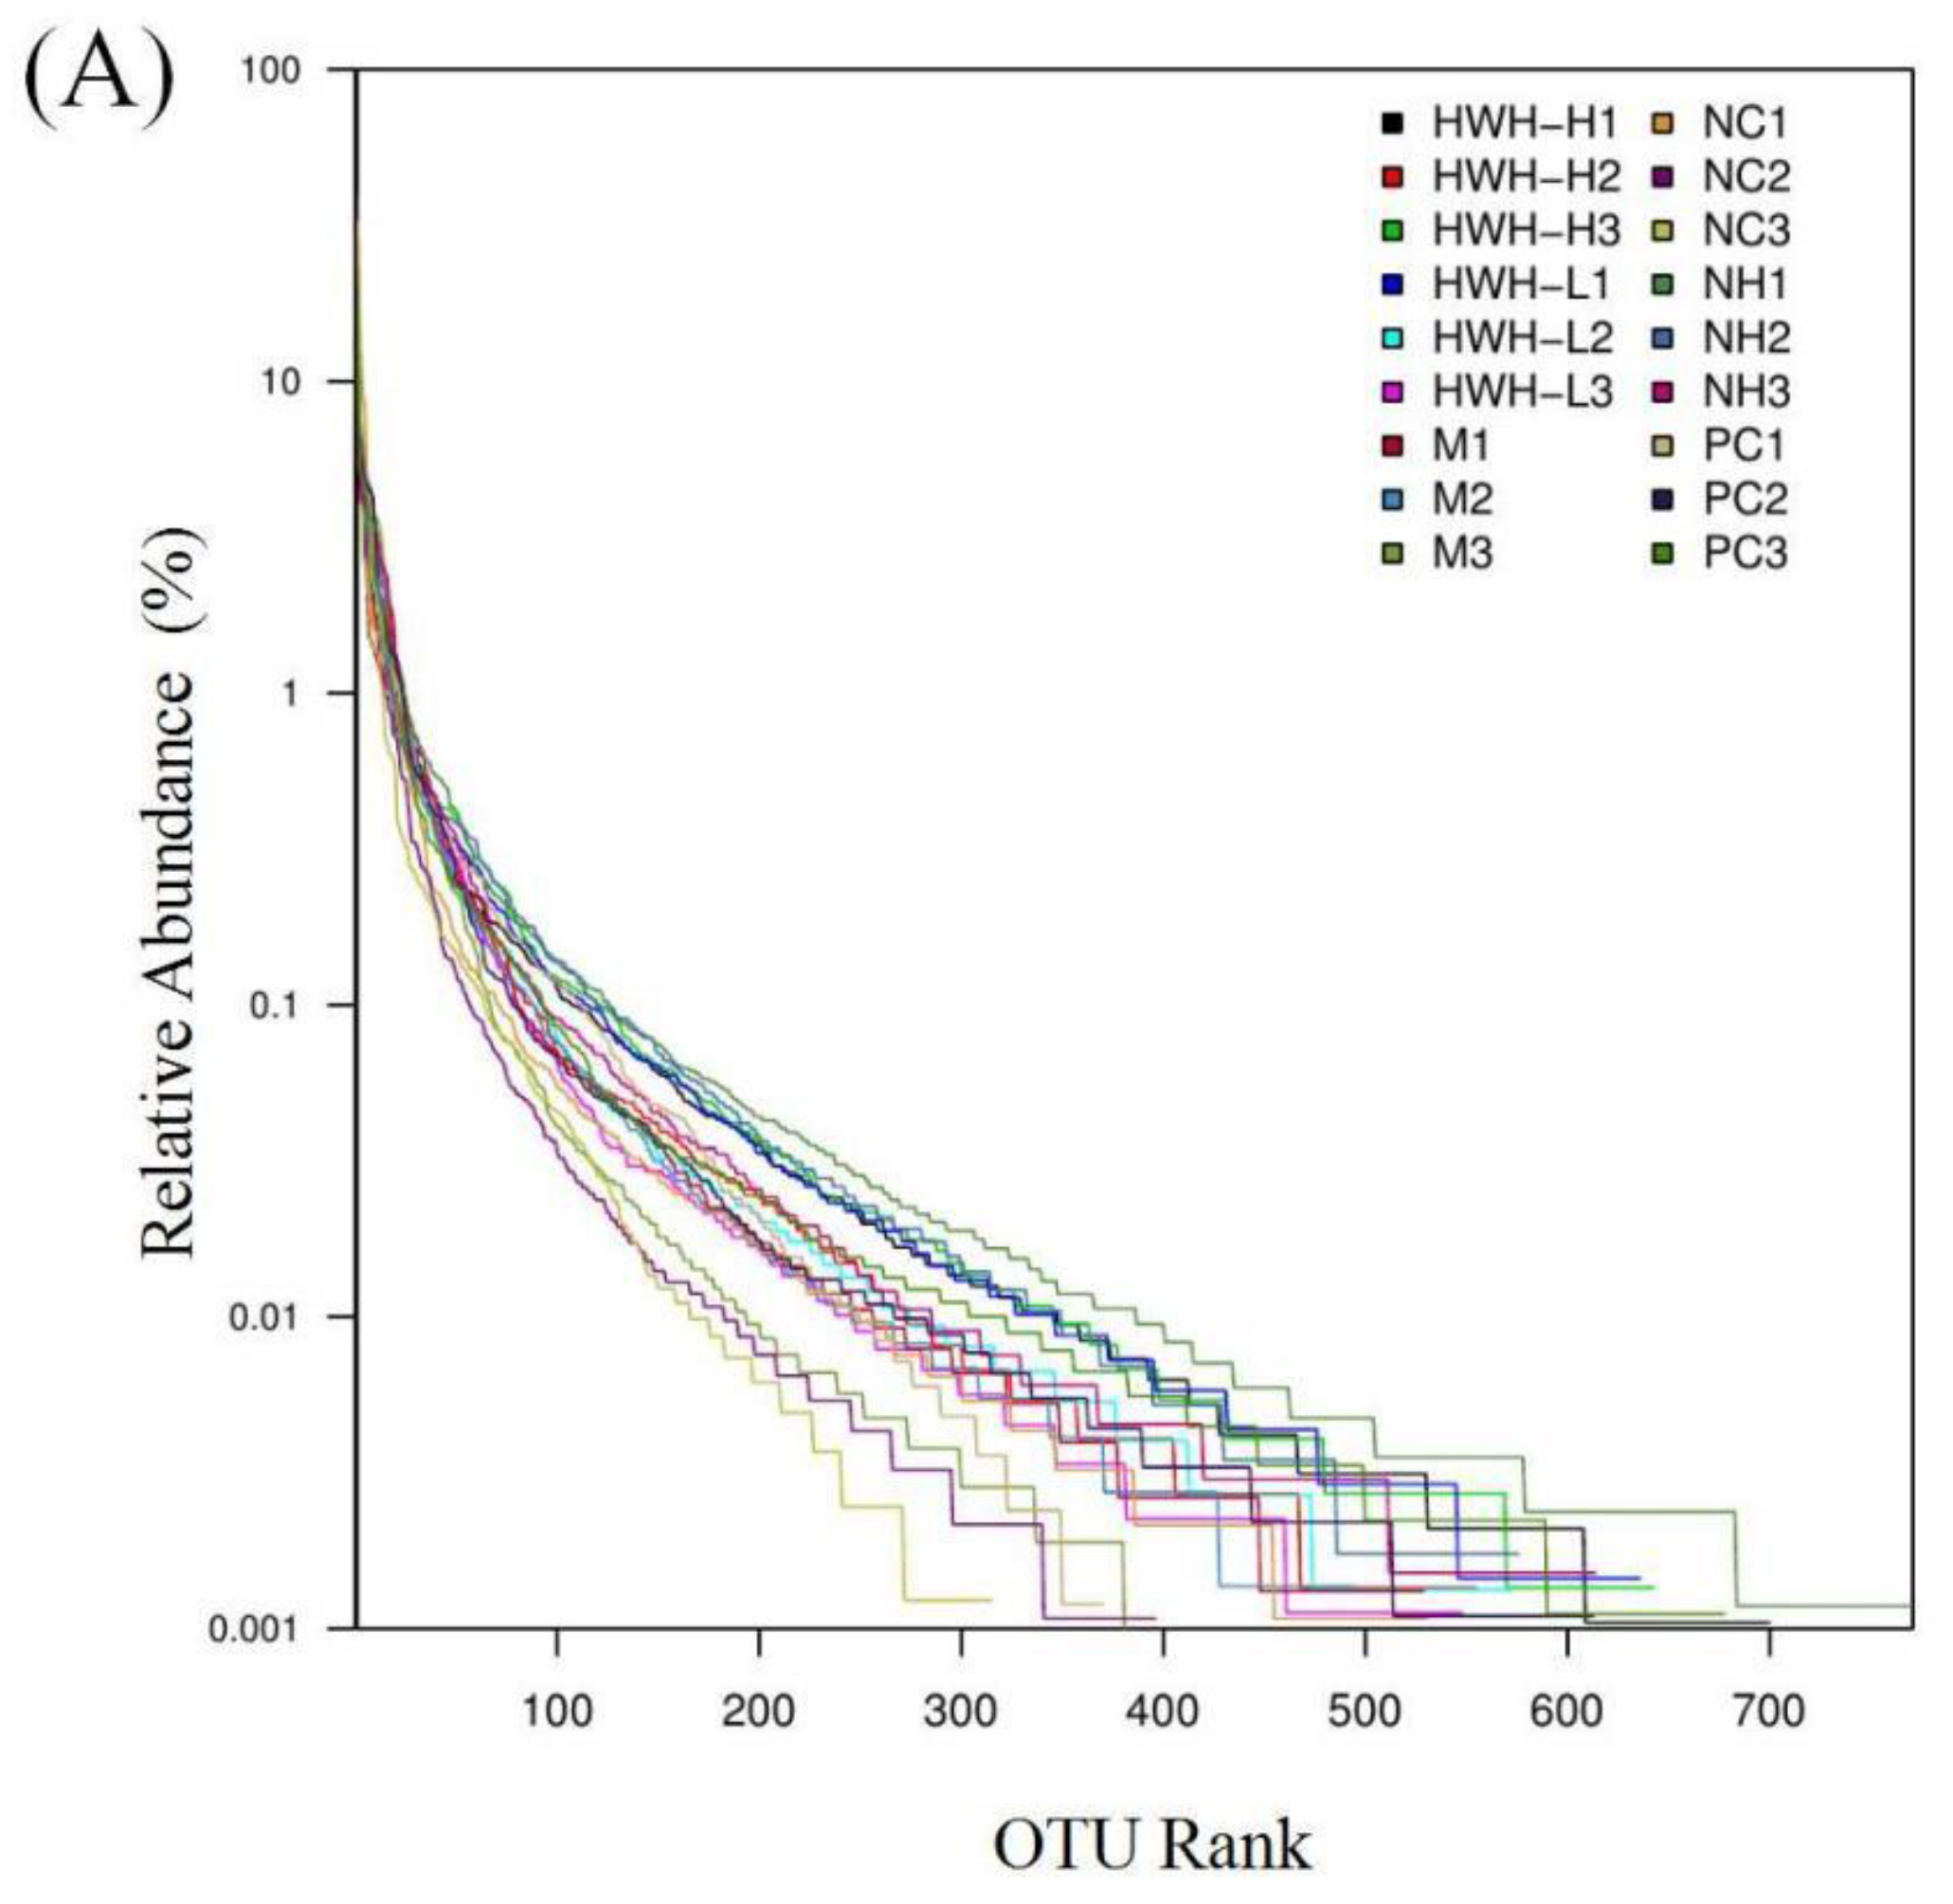
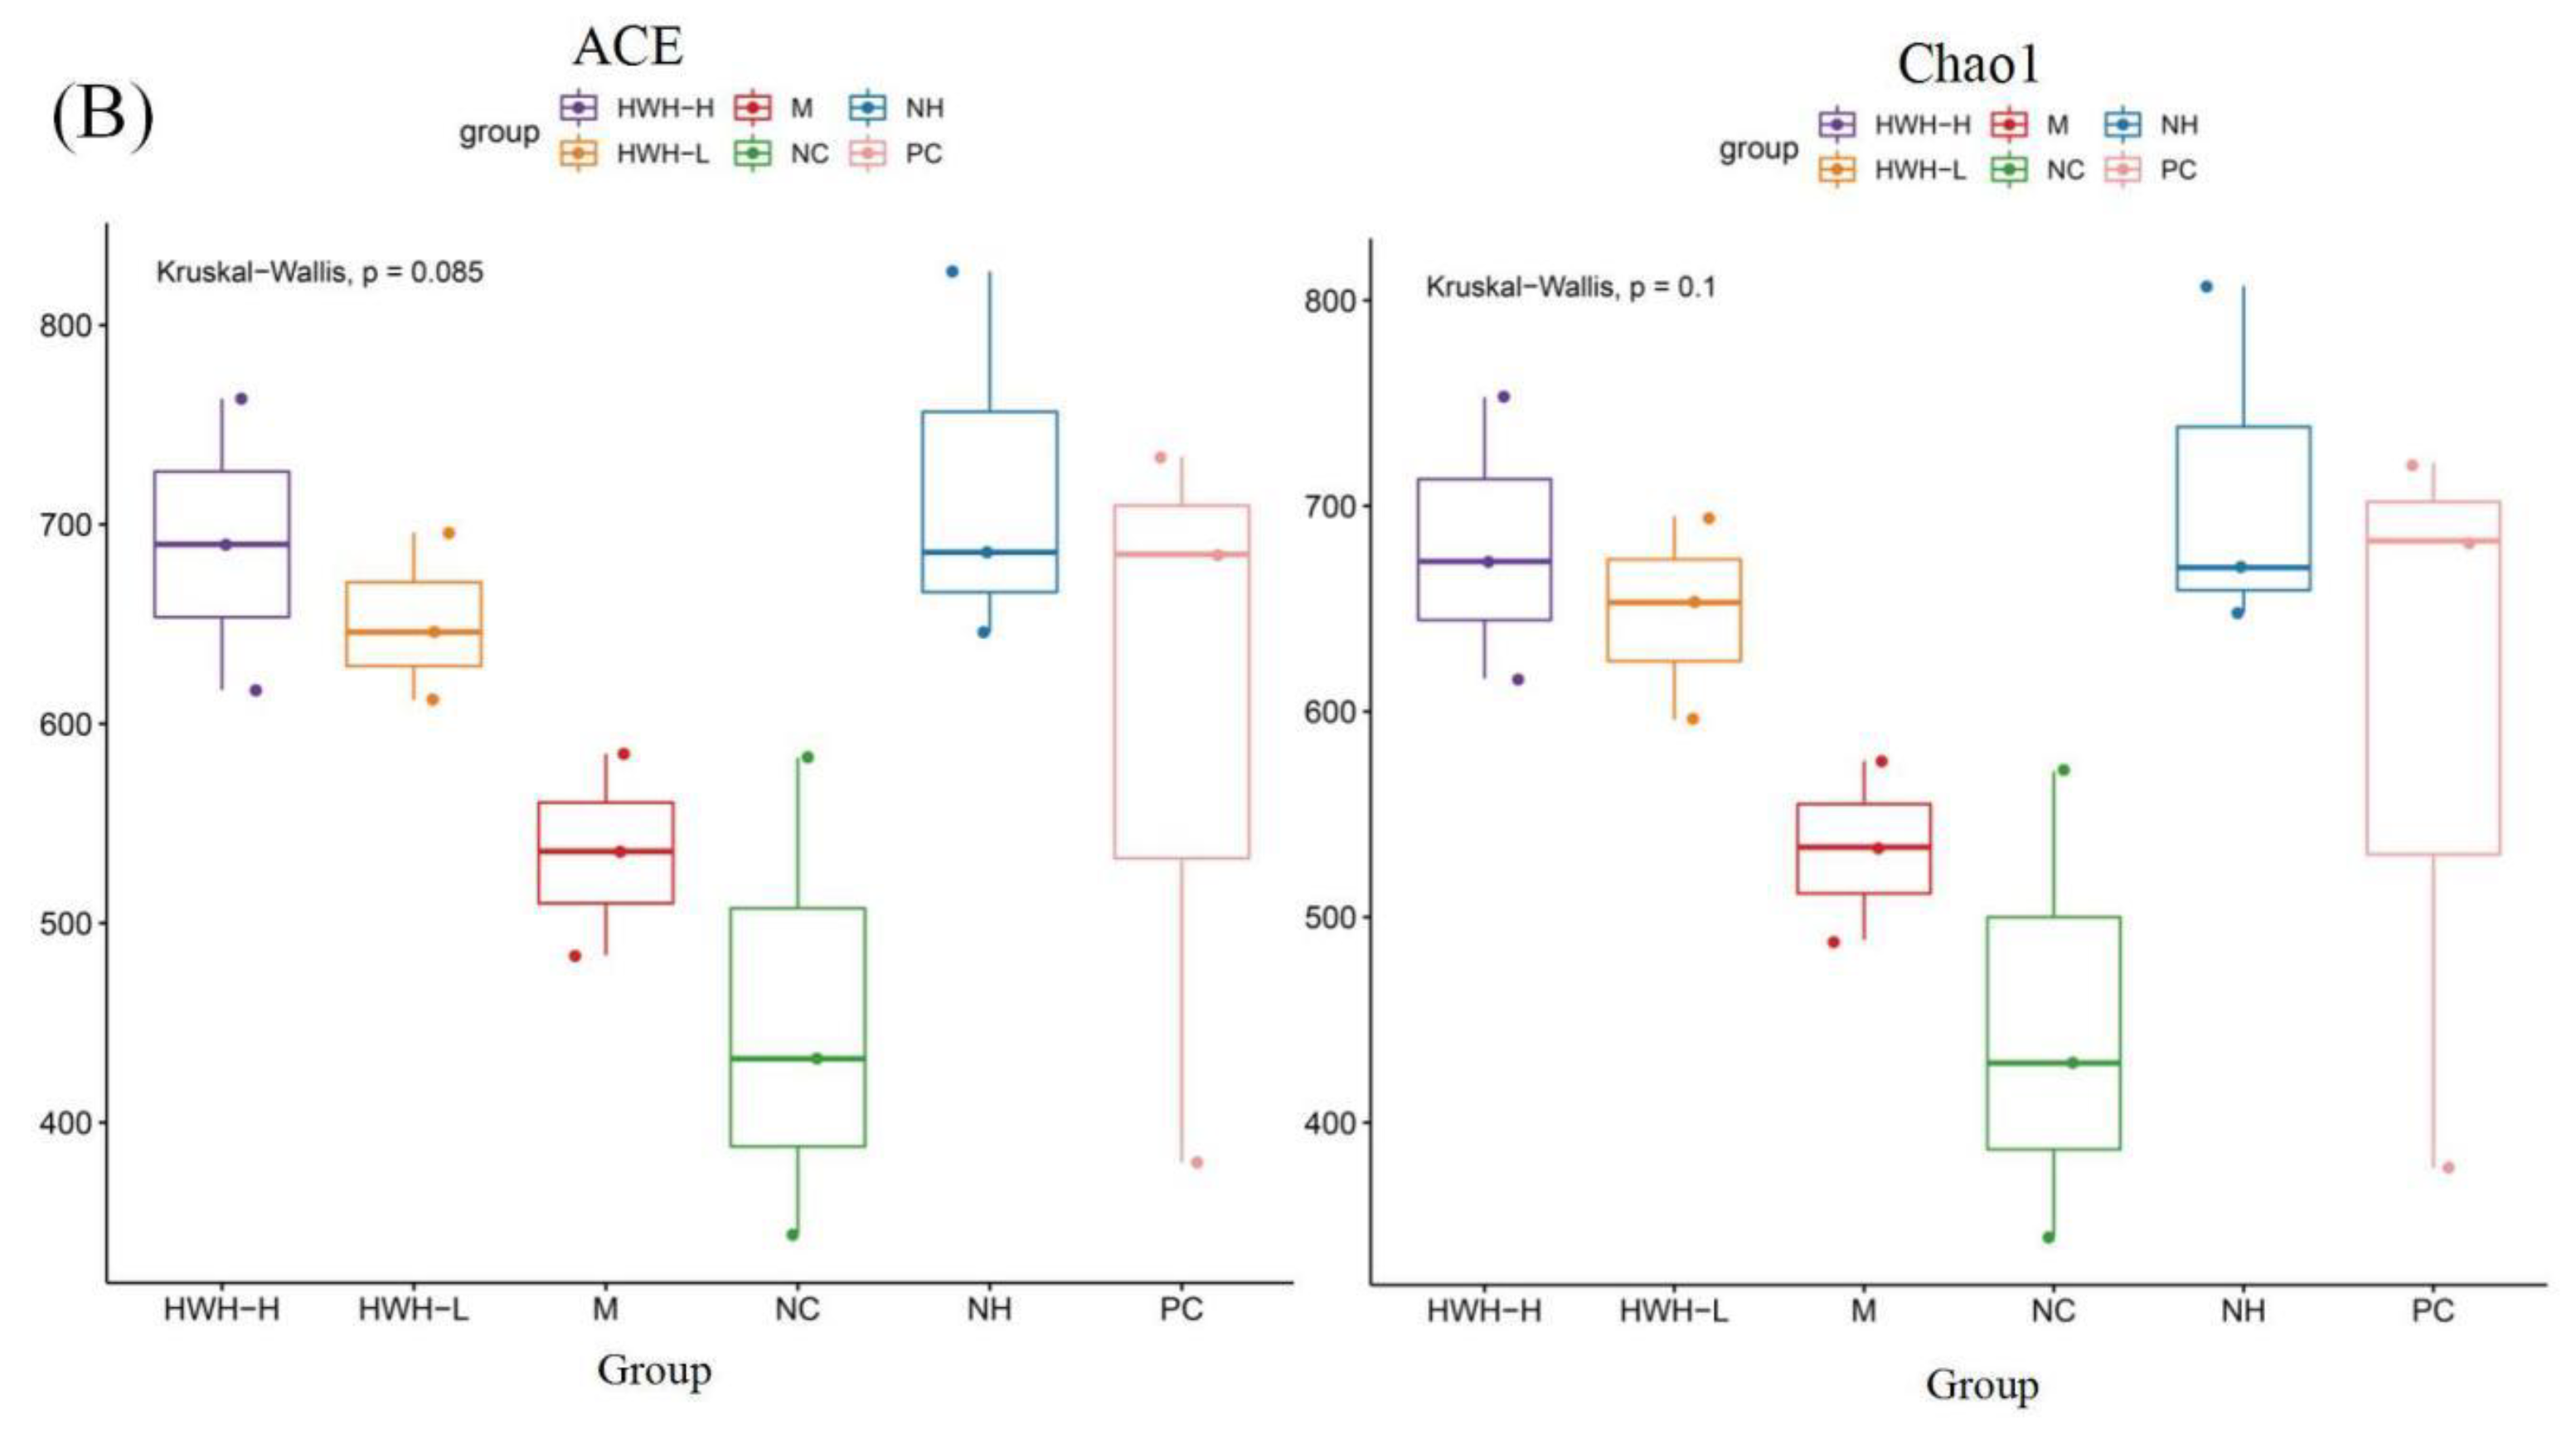
2.6. Effects of HWH on the overall composition of gut microbiota
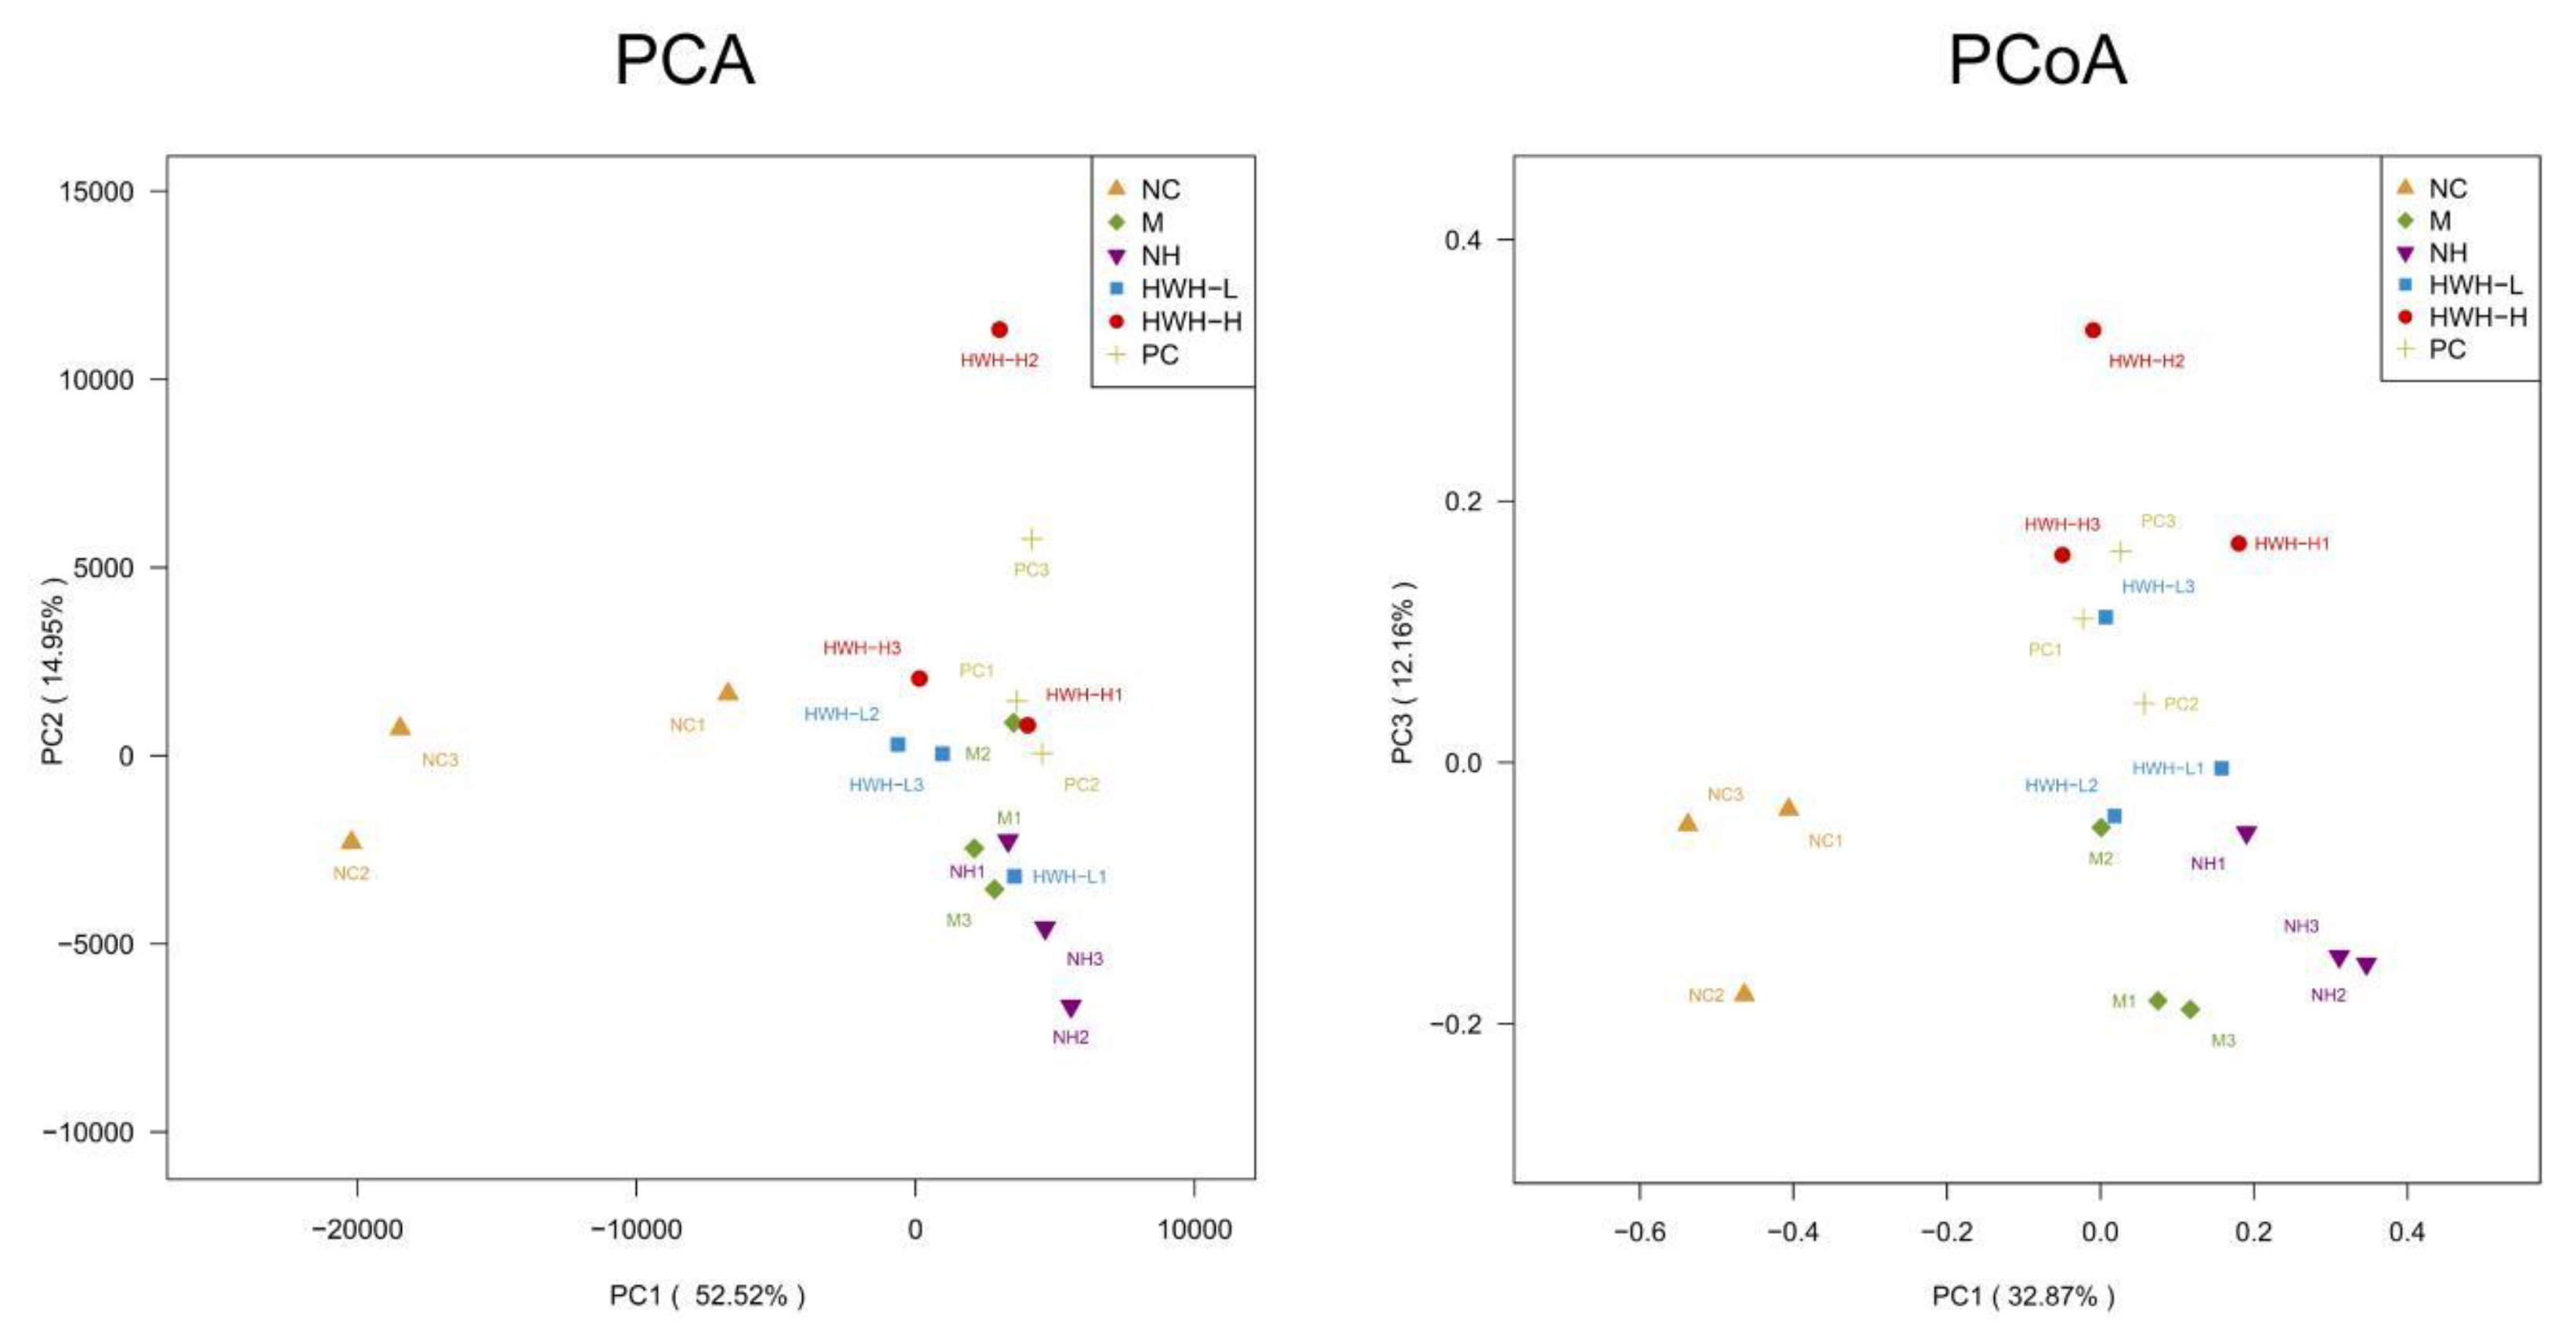
2.7. Effects of HWH on beta diversity of gut microbiota
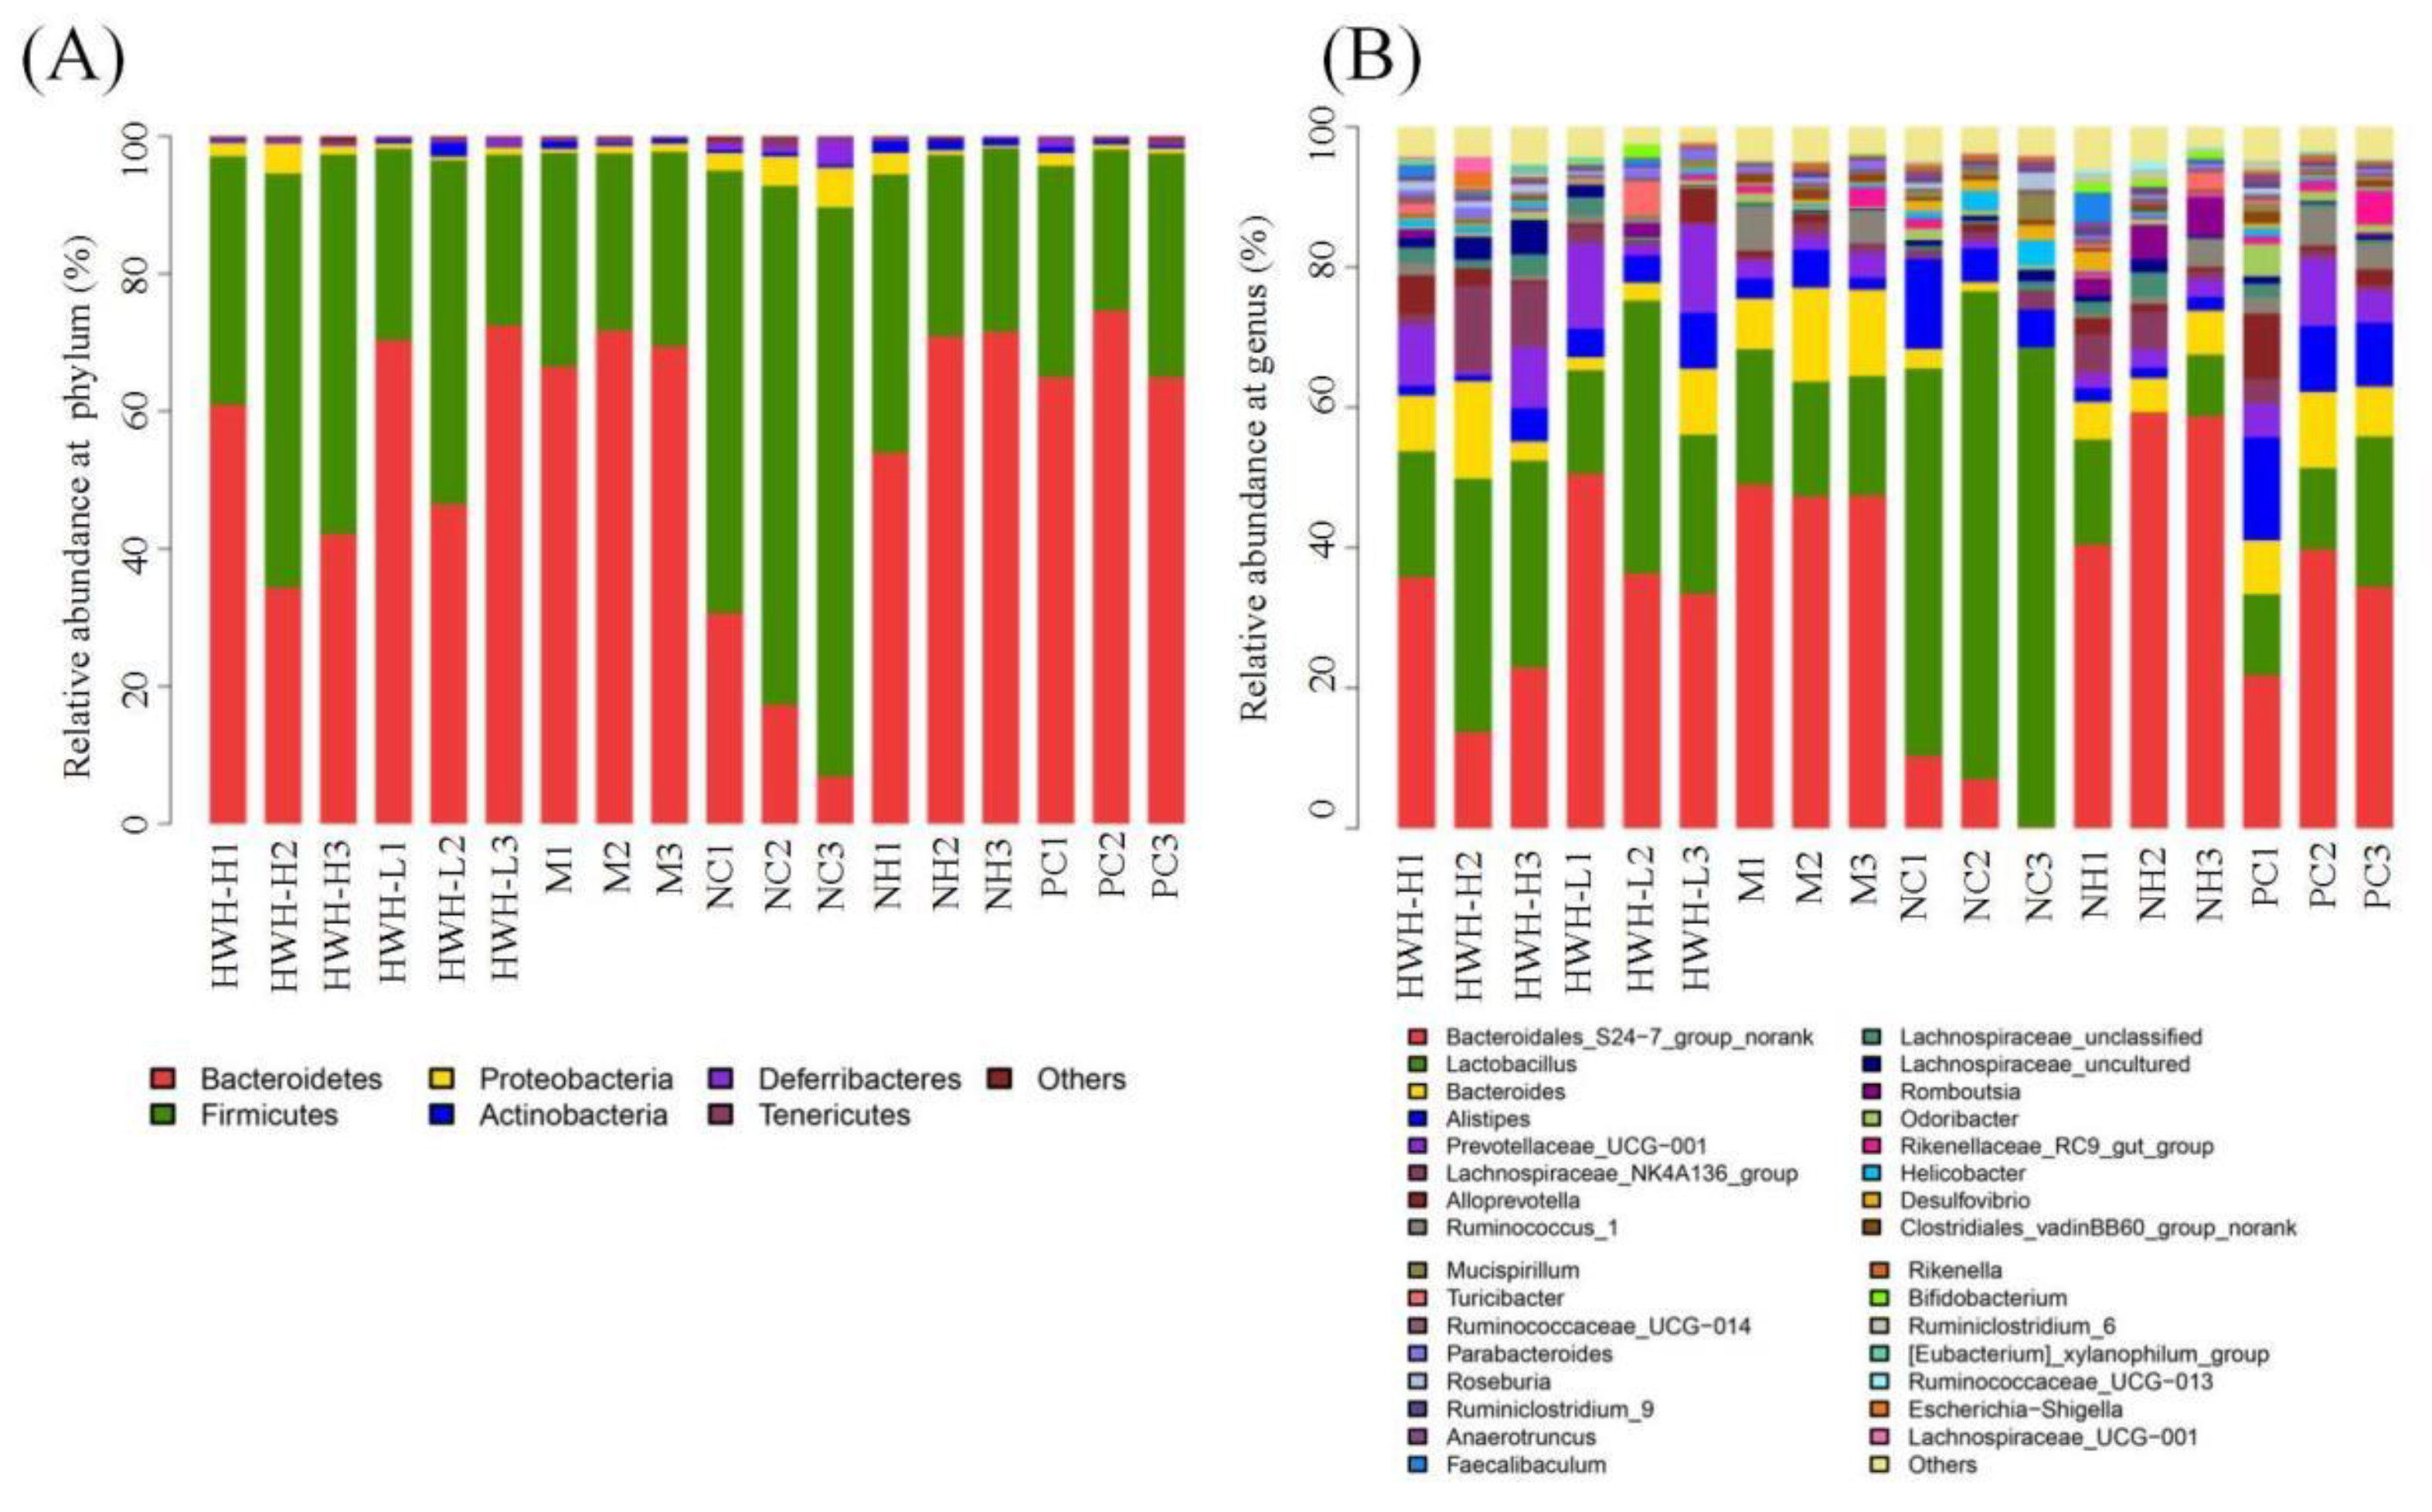
2.8. Effects of HWH on taxonomical analysis of gut microbiota
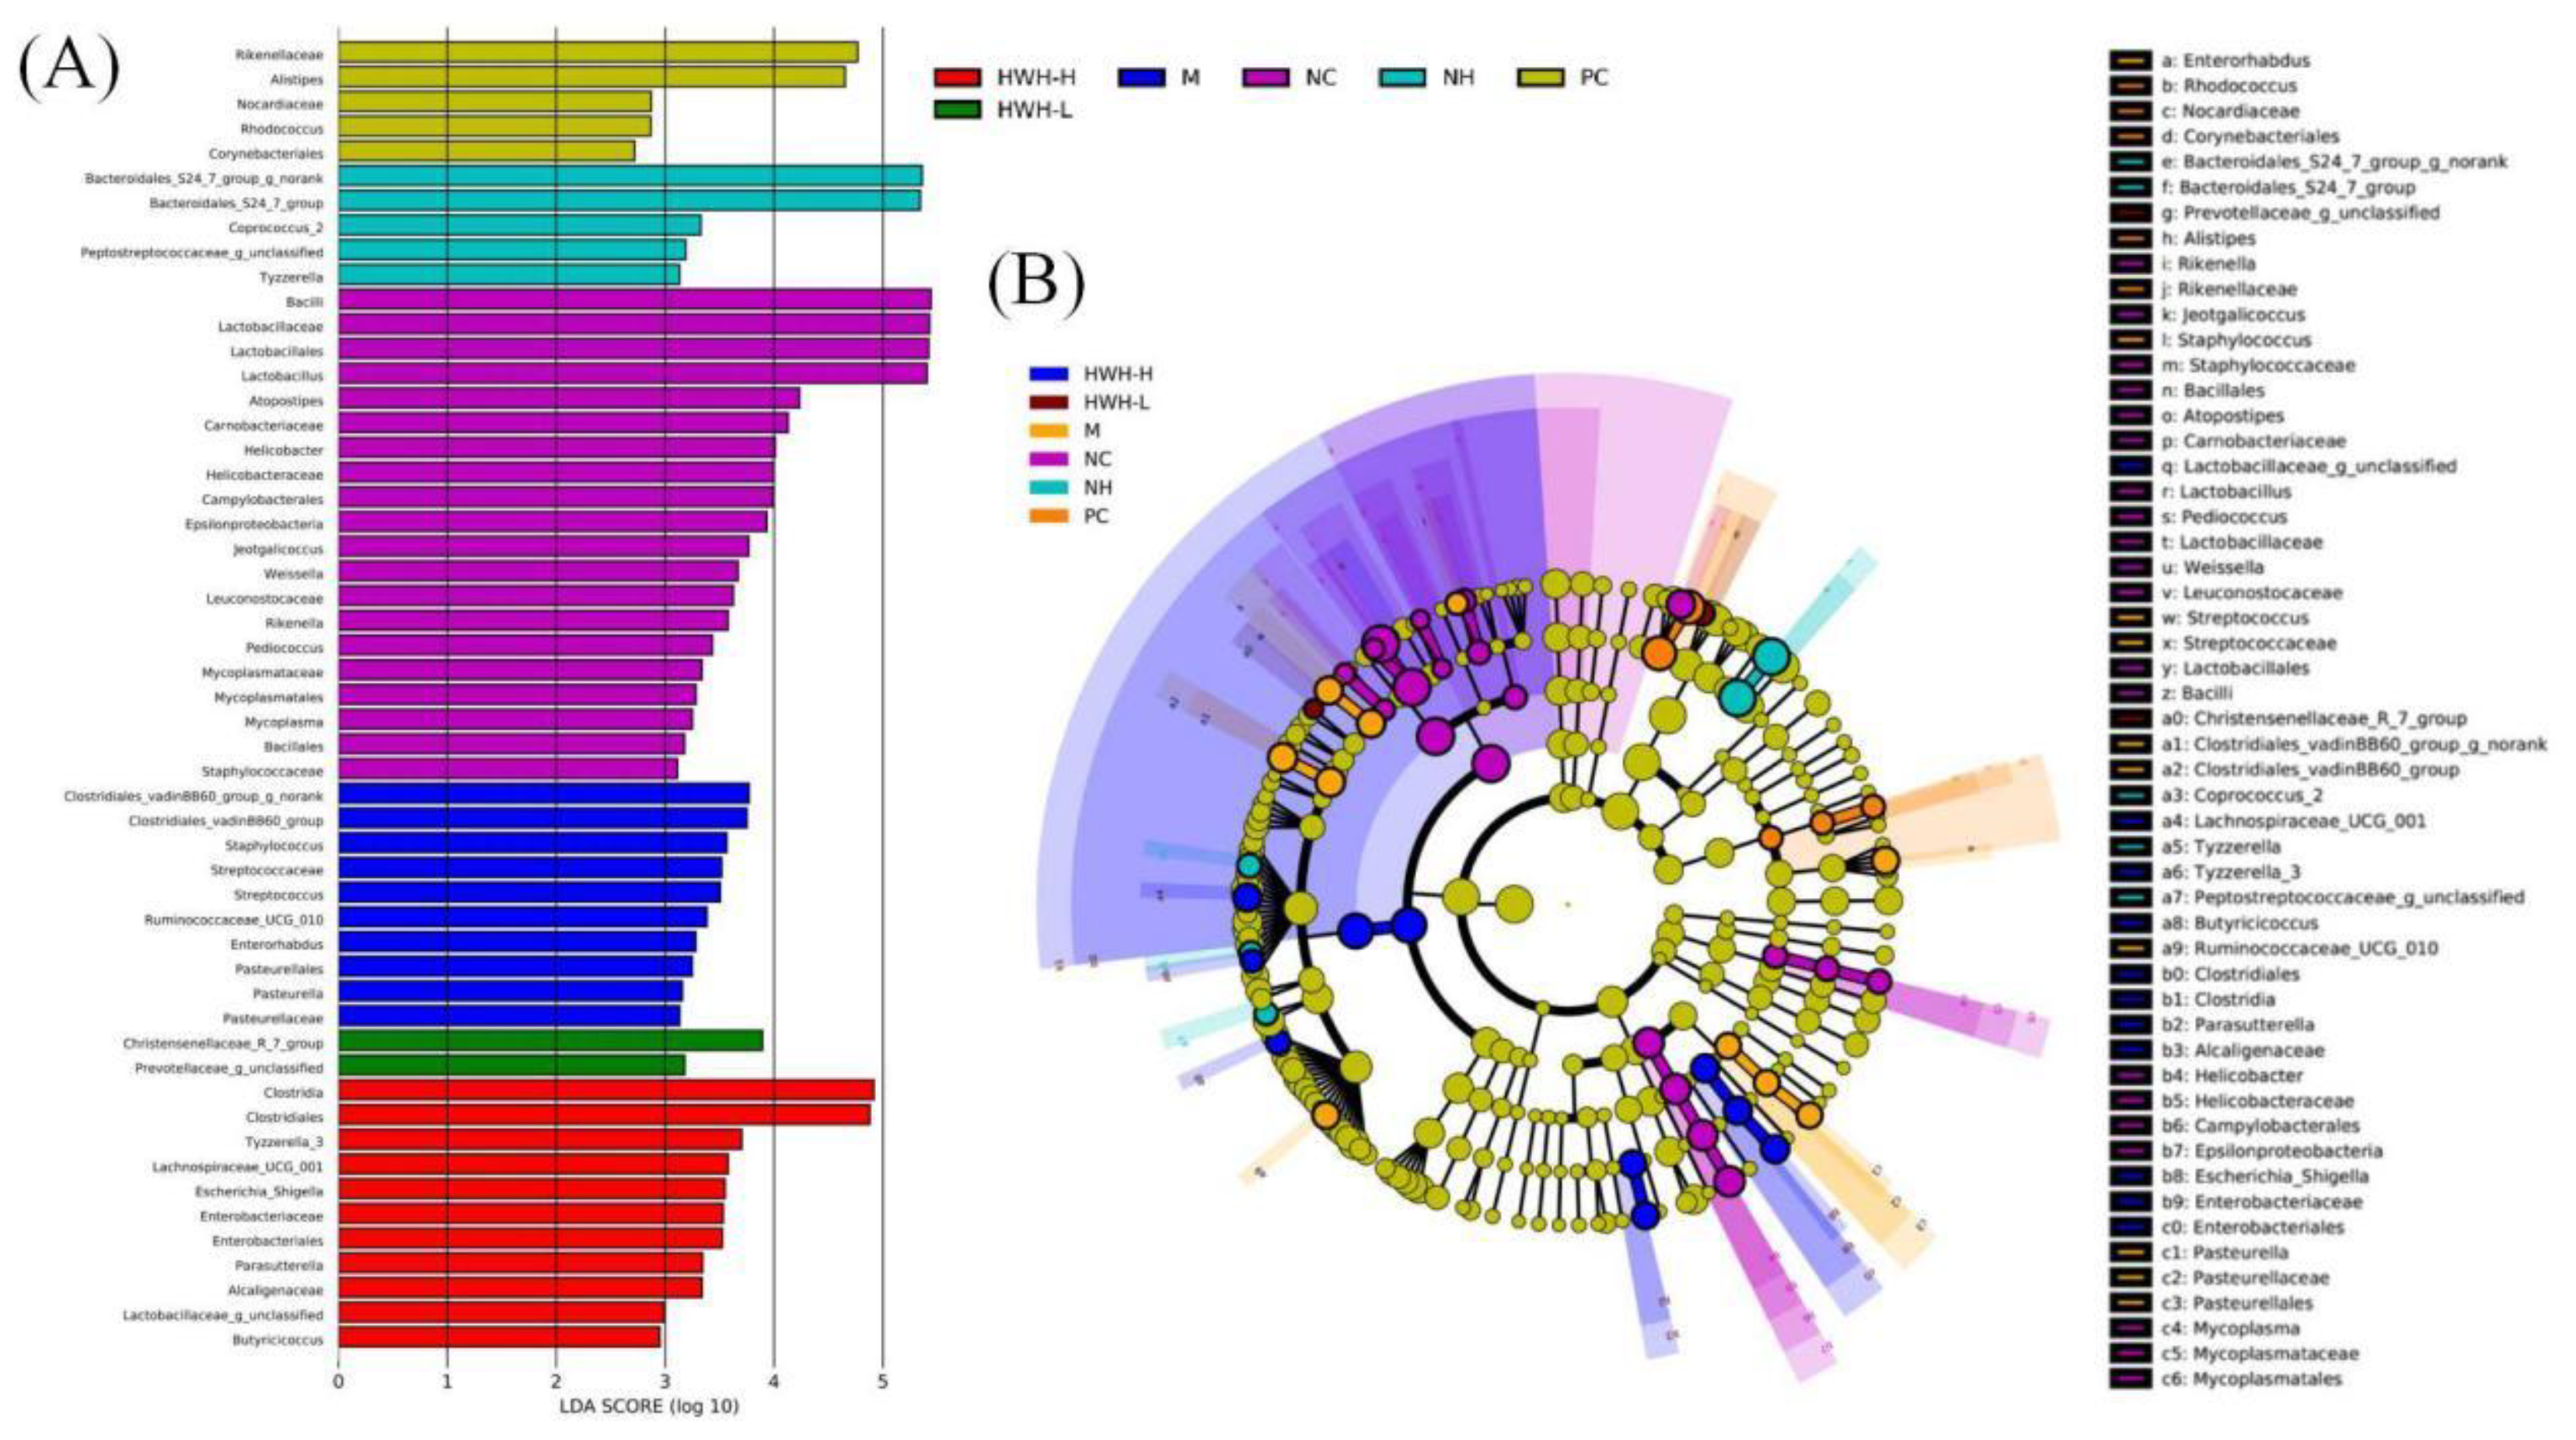
2.9. Effects of HWH on phylotypes of gut microbiota
3. Discussion
4. Materials and Methods
4.1. Materials and reagents
4.2. Preparation of HWH
4.3. Composition determination of HWH
4.5. Animals and experimental design
4.6. Determination of spleen index
4.7. Histological analysis
4.8. Western blotting analysis
4.9. Quantitative real-time PCR
4.10. 16 S rRNA sequencing of gut microbiota
4.11. Statistical analysis
5. Conclusions
Supplementary Materials
Author Contributions
Institutional Review Board Statement
Data Availability Statement
Acknowledgments
Conflicts of Interest
References
- Etienne-Mesmin, L.; Chassaing, B.; Desvaux, M.; De Paepe, K.; Gresse, R.; Sauvaitre, T.; Forano, E.; Van de Wiele, T.; Schüller, S.; Juge, N.; Blanquet-Diot, S. Experimental models to study intestinal microbes-mucus interactions in health and disease. FEMS Microbiol. Rev. 2019, 43, 457–489. [Google Scholar] [CrossRef] [PubMed]
- Lynch, S.V.; Pedersen, O. The human intestinal microbiome in health and disease. N. Engl. J. Med. 2016, 375, 2369–2379. [Google Scholar] [CrossRef]
- Eckburg, P.B.; Bik, E.M.; Bernstein, C.N.; Purdom, E.; Dethlefsen, L.; Sargent, M.; Gill, S.R.; Nelson, K.E.; Relman, D.A. Diversity of the human intestinal microbial flora. Science 2005, 308, 1635–1638. [Google Scholar] [CrossRef] [PubMed]
- Reyes, A.; Haynes, M.; Hanson, N.; Angly, F.E.; Heath, A.C.; Rohwer, F.; Gordon, J.I. Viruses in the faecal microbiota of monozygotic twins and their mothers. Nature 2010, 466, 334–338. [Google Scholar] [CrossRef]
- Zmora, N.; Suez, J.; Elinav, E. You are what you eat: diet, health and the gut microbiota. Nat. Rev. Gastroenterol. Hepatol. 2019, 16, 35–56. [Google Scholar] [CrossRef] [PubMed]
- Franzosa, E.A.; Huang, K.; Meadow, J.F.; Gevers, D.; Lemon, K.P.; Bohannan, B.J.; Huttenhower, C. Identifying personal microbiomes using metagenomic codes. Proc. Natl. Acad. Sci. USA 2015, 112, E2930–E2938. [Google Scholar] [CrossRef] [PubMed]
- Patterson, E.; Ryan, P.M.; Cryan, J.F.; Dinan, T.G.; Ross, R.P.; Fitzgerald, G.F.; Stanton, C. Gut microbiota, obesity and diabetes. Postgrad. Med. J. 2016, 92, 286–300. [Google Scholar] [CrossRef]
- Turnbaugh, P.J.; Ley, R.E.; Mahowald, M.A.; Magrini, V.; Mardis, E.R.; Gordon, J.I. An obesity-associated gut microbiome with increased capacity for energy harvest. Nature 2006, 444, 1027–1031. [Google Scholar] [CrossRef]
- Qin, J.; Li, Y.; Cai, Z.; Li, S.; Zhu, J.; Zhang, F.; Liang, S.; Zhang, W.; Guan, Y.; Shen, D.; et al. A metagenome-wide association study of gut microbiota in type 2 diabetes. Nature 2012, 490, 55–60. [Google Scholar] [CrossRef] [PubMed]
- Li, J.; Zhao, F.; Wang, Y.; Chen, J.; Tao, J.; Tian, G.; Wu, S.; Liu, W.; Cui, Q.; Geng, B.; et al. Gut microbiota dysbiosis contributes to the development of hypertension. Microbiome 2017, 5, 14. [Google Scholar] [CrossRef] [PubMed]
- Ni, J.; Wu, G.D.; Albenberg, L.; Tomov, V.T. Gut microbiota and IBD: causation or correlation? Nat. Rev. Gastroenterol. Hepatol. 2017, 14, 573–584. [Google Scholar] [CrossRef] [PubMed]
- Vollaard, E.J.; Clasener, H.A. Colonization resistance. Antimicrob. Agents Chemother. 1994, 38, 409–414. [Google Scholar] [CrossRef] [PubMed]
- Pickard, J.M.; Zeng, M.Y.; Caruso, R.; Núñez, G. Gut microbiota: Role in pathogen colonization, immune responses, and inflammatory disease. Immunol. Rev. 2017, 279, 70–89. [Google Scholar] [CrossRef] [PubMed]
- Antonini, M.; Lo Conte, M.; Sorini, C.; Falcone, M. How the Interplay Between the Commensal Microbiota, Gut Barrier Integrity, and Mucosal Immunity Regulates Brain Autoimmunity. Front. Immunol. 2019, 10, 1937. [Google Scholar] [CrossRef]
- Chelakkot, C.; Ghim, J.; Ryu, S.H. Mechanisms regulating intestinal barrier integrity and its pathological implications. Exp. Mol. Med. 2018, 50, 1–9. [Google Scholar] [CrossRef] [PubMed]
- Eri, R.; Chieppa, M. Messages from the Inside. The Dynamic Environment that Favors Intestinal Homeostasis. Front. Immunol. 2013, 4, 323. [Google Scholar] [CrossRef] [PubMed]
- Saenz, S.A.; Taylor, B.C.; Artis, D. Welcome to the neighborhood: epithelial cell-derived cytokines license innate and adaptive immune responses at mucosal sites. Immunol. Rev. 2008, 226, 172–190. [Google Scholar] [CrossRef] [PubMed]
- Paone, P.; Cani, P.D. Mucus barrier, mucins and gut microbiota: the expected slimy partners? Gut 2020, 69, 2232–2243. [Google Scholar] [CrossRef]
- Rinninella, E.; Cintoni, M.; Raoul, P.; Lopetuso, L.R.; Scaldaferri, F.; Pulcini, G.; Miggiano, G.A.D.; Gasbarrini, A.; Mele, M.C. Food Components and Dietary Habits: Keys for a Healthy Gut Microbiota Composition. Nutrients 2019, 11, 2393. [Google Scholar] [CrossRef]
- Bian, R.; Tang, J.; Hu, L.; Huang, X.; Liu, M.; Cao, W.; Zhang, H. (E)-phenethyl 3-(3,5-dihydroxy-4-isopropylphenyl) acrylate gel improves DNFB-induced allergic contact hypersensitivity via regulating the balance of Th1/Th2/Th17/Treg cell subsets. Int. Immunopharmacol. 2018, 65, 8–15. [Google Scholar] [CrossRef]
- Hu, N.; Qu, Y.; Liu, T.Y.; Zhou, Y.; Liu, C.; Wang, J.H.; Yang, B.F.; Li, C.L. Immunomodulatory effects and mechanisms of Tiepishihu Xiyangshen granules on cyclophosphamide induced immuno-suppression via TLR4/MAPKs and PI3K/AKT/FOXO3a signal pathways. J. Ethnopharmacol. 2023, 307, 116192. [Google Scholar] [CrossRef] [PubMed]
- Rehman, A.U.; Siddiqui, N.Z.; Farooqui, N.A.; Alam, G.; Gul, A.; Ahmad, B.; Asim, M.; Khan, A.I.; Xin, Y.; Zexu, W.; et al. Morchella esculenta mushroom polysaccharide attenuates diabetes and modulates intestinal permeability and gut microbiota in a type 2 diabetic mice model. Front. Nutr. 2022, 9, 984695. [Google Scholar] [CrossRef]
- Han, X.; Bai, B.; Zhou, Q.; Niu, J.; Yuan, J.; Zhang, H.; Jia, J.; Zhao, W.; Chen, H. Dietary supplementation with polysaccharides from Ziziphus Jujuba cv. Pozao intervenes in immune response via regulating peripheral immunity and intestinal barrier function in cyclophosphamide-induced mice. Food Funct. 2020, 11, 5992–6006. [Google Scholar] [CrossRef]
- Khotimchenko, Y. Pharmacological potential of sea cucumbers. Int. J. Mol. Sci. 2018, 19, 1342. [Google Scholar] [CrossRef] [PubMed]
- Lobine, D.; Rengasamy, K.R.R.; Mahomoodally, M.F. Functional foods and bioactive ingredients harnessed from the ocean: current status and future perspectives. Crit. Rev. Food. Sci. Nutr. 2022, 62, 5794–5823. [Google Scholar] [CrossRef]
- Zheng, R.; Li, X.; Cao, B.; Zuo, T.; Wu, J.; Wang, J.; Xue, C.; Tang, Q. Dietary Apostichopus japonicus enhances the respiratory and intestinal mucosal immunity in immunosuppressive mice. Biosci. Biotechnol. Biochem. 2015, 79, 253–259. [Google Scholar] [CrossRef] [PubMed]
- Aminin, D.L.; Silchenko, A.S.; Avilov, S.A.; Stepanov, V.G.; Kalinin, V.I. Immunomodulatory action of monosulfated triterpene glycosides from the sea cucumber Cucumaria okhotensis: stimulation of activity of mouse peritoneal macrophages. Nat. Prod. Commun. 2010, 5, 1877–1880. [Google Scholar] [CrossRef]
- Aminin, D.L.; Agafonova, I.G.; Kalinin, V.I.; Silchenko, A.S.; Avilov, S.A.; Stonik, V.A.; Collin, P.D.; Woodward, C. Immunomodulatory properties of frondoside A, a major triterpene glycoside from the North Atlantic commercially harvested sea cucumber Cucumaria frondosa. J. Med. Food 2008, 11, 443–453. [Google Scholar] [CrossRef] [PubMed]
- Silchenko, A.S.; Kalinovsky, A.I.; Avilov, S.A.; Andryjaschenko, P.V.; Dmitrenok, P.S.; Menchinskaya, E.S.; Aminin, D.L.; Kalinin, V.I. Structure of cucumarioside I2 from the sea cucumber Eupentacta fraudatrix (Djakonov et Baranova) and cytotoxic and immunostimulatory activities of this saponin and relative compounds. Nat. Prod. Res. 2013, 27, 1776–1783. [Google Scholar] [CrossRef] [PubMed]
- Niu, Q.; Li, G.; Li, C.; Li, Q.; Li, J.; Liu., C.; Pan, L.; Li, S.; Cai, C.; Hao, J.; et al. Two different fucosylated chondroitin sulfates: Structural elucidation, stimulating hematopoiesis and immune-enhancing effects. Carbohydr Polym. 2020, 230, 115698. [Google Scholar] [CrossRef]
- Liu, Z.; Zhang, Y.; Ai, C.; Wen, C.; Dong, X.; Sun, X.; Cao, C.; Zhang, X.; Zhu, B.; Song, S. Gut microbiota response to sulfated sea cucumber polysaccharides in a differential manner using an in vitro fermentation model. Food Res. Int. 2021, 148, 110562. [Google Scholar] [CrossRef] [PubMed]
- Wang, Z.; Shi, Y.; Zeng, S.; Zheng, Y.; Wang, H.; Liao, H.; Song, J.; Zhang, X.; Cao, J.; Li, C. Polysaccharides from Holothuria leucospilota relieve loperamide-induced constipation symptoms in mice. Int. J. Mol. Sci. 2023, 24, 2553. [Google Scholar] [CrossRef]
- Wang, X.; Sun, G.; Feng, T.; Zhang, J.; Huang, X.; Wang, T.; Xie, Z.; Chu, X.; Yang, J.; Wang, H.; et al. Sodium oligomannate therapeutically remodels gut microbiota and suppresses gut bacterial amino acids-shaped neuroinflammation to inhibit Alzheimer’s disease progression. Cell Res. 2019, 29, 787–803. [Google Scholar] [CrossRef]
- Wang, J.; Zhang, C.; Guo, C.; Li, X. Chitosan Ameliorates DSS-Induced Ulcerative Colitis Mice by Enhancing Intestinal Barrier Function and Improving Microflora. Int. J. Mol. Sci. 2019, 20, 5751. [Google Scholar] [CrossRef]
- Ying, M.; Yu, Q.; Zheng, B.; Wang, H.; Wang, J.; Chen, S.; Nie, S.; Xie, M. Cultured Cordyceps sinensis polysaccharides modulate intestinal mucosal immunity and gut microbiota in cyclophosphamide-treated mice. Carbohydr. Polym. 2020, 235, 115957. [Google Scholar] [CrossRef]
- Zhao, Y.; Yan, Y.; Zhou, W.; Chen, D.; Huang, K.; Yu, S.; Mi, J.; Lu, L.; Zeng, X.; Cao, Y. Effects of polysaccharides from bee collected pollen of Chinese wolfberry on immune response and gut microbiota composition in cyclophosphamide-treated mice. J. Funct. Foods 2020, 72, 104057. [Google Scholar] [CrossRef]
- Song, Y.; Jin, S.J.; Cui, L.H.; Ji, X.J.; Yang, F.G. Immunomodulatory effect of Stichopus japonicas acid mucopolysaccharide on experimental hepatocellular carcinoma in rats. Molecules 2013, 18, 7179–7193. [Google Scholar] [CrossRef]
- Yun, L.; Li, W.; Wu, T.; Zhang, M. Effect of sea cucumber peptides on the immune response and gut microbiota composition in ovalbumin-induced allergic mice. Food Funct. 2022, 13, 6338–6349. [Google Scholar] [CrossRef]
- Meng, M.; Wang, H.; Li, Z.; Guo, M.; Hou, L. Protective effects of polysaccharides from Cordyceps gunnii mycelia against cyclophosphamide-induced immunosuppression to TLR4/TRAF6/NF-κB signalling in BALB/c mice. Food Funct. 2019, 10, 3262–3271. [Google Scholar] [CrossRef] [PubMed]
- Wang, H.; Yang, S.; Wang, Y.; Jiang, T.; Li, S.; Lv, Z. Immunoenhancement effects of glycosaminoglycan from Apostichopus japonicus: In vitro and in cyclophosphamide-induced immunosuppressed mice studies. Mar. drugs 2017, 15, 347. [Google Scholar] [CrossRef]
- Zhu, Z.; Zhu, B.; Sun, Y.; Ai, C.; Wu, S.; Wang, L.; Song, S.; Liu, X. Sulfated polysaccharide from sea cucumber modulates the gut microbiota and its metabolites in normal mice. Int. J. Biol. Macromol. 2018, 120, 502–512. [Google Scholar] [CrossRef]
- Kim, J.K.; Kim, J.Y.; Jang, S.E.; Choi, M.S.; Jang, H.M.; Yoo, H.H.; Kim, D.H. Fermented red ginseng alleviates cyclophosphamide-induced immunosuppression and 2,4,6-trinitrobenzenesulfonic acid-induced colitis in mice by regulating macrophage activation and T cell differentiation. Am. J. Chin. Med. 2018, 46, 1879–1897. [Google Scholar] [CrossRef] [PubMed]
- Yoo, J.H.; Lee, Y.S.; Ku, S.; Lee, H.J. Phellinus baumii enhances the immune response in cyclophosphamide-induced immunosuppressed mice. Nutr. Res. 2020, 75, 15–31. [Google Scholar] [CrossRef]
- Schulte, W.; Bernhagen, J.; Bucala, R. Cytokines in sepsis: potent immunoregulators and potential therapeutic targets--an updated view. Mediators. Inflamm. 2013, 2013, 165974. [Google Scholar] [CrossRef]
- Dinarello, C.A. Interleukin-1 and the pathogenesis of the acute-phase response. N. Engl. J. Med. 1984, 311, 1413–1418. [Google Scholar]
- Feng, G.; Laijin, S.; Chen, S.; Teng, W.; Dejian, Z.; Yin, C.; Shoudong, G. In vitro and in vivo immunoregulatory activity of sulfated fucan from the sea cucumber A. leucoprocta. Int. J. Biol. Macromol. 2021, 187, 931–938. [Google Scholar] [CrossRef]
- Zhao, F.; Ma, T.; Zhang, X.; Zhao, Q.; Zhu, K.; Cao, J.; Liu, Z.; Shen, X.; Li, C. Holothuria leucospilota polysaccharides improve immunity and the gut microbiota in cyclophosphamide-treated immunosuppressed mice. Mol. Nutr. Food Res. 2023, 67, e2200317. [Google Scholar] [CrossRef]
- Wlodarska, M.; Thaiss, C.A.; Nowarski, R.; Henao-Mejia, J.; Zhang, J.P.; Brown, E.M.; Frankel, G.; Levy, M.; Katz, M.N.; Philbrick, W.M.; et al. NLRP6 inflammasome orchestrates the colonic host-microbial interface by regulating goblet cell mucus secretion. Cell 2014, 156, 1045–1059. [Google Scholar] [CrossRef]
- Siddiqui, N.Z.; Rehman, A.U.; Yousuf, W.; Khan, A.I.; Farooqui, N.A.; Zang, S.; Xin, Y.; Wang, L. Effect of crude polysaccharide from seaweed, Dictyopteris divaricata (CDDP) on gut microbiota restoration and anti-diabetic activity in streptozotocin (STZ)-induced T1DM mice. Gut Pathog. 2022, 17, 39. [Google Scholar] [CrossRef]
- Vemuri, R.; Gundamaraju, R.; Shinde, T.; Perera, A.P.; Basheer, W.; Southam, B.; Gondalia, S.V.; Karpe, A.V.; Beale, D.J.; Tristram, S.; et al. Lactobacillus acidophilus DDS-1 modulates intestinal-specific microbiota, short-chain fatty acid and immunological profiles in aging mice. Nutrients 2019, 11, 1297. [Google Scholar] [CrossRef]
- Wang, W.; Yuan, Y.; Cao, J.; Shen, X.; Li, C. Beneficial effects of Holothuria leucospilota polysaccharides on fermentability in vivo and in vitro. Foods 2021, 10, 1884. [Google Scholar] [CrossRef] [PubMed]
- Suzuki, T. Regulation of the intestinal barrier by nutrients: The role of tight junctions. Anim. Sci. J. 2020, 91, e13357. [Google Scholar] [CrossRef]
- Noth, R.; Lange-Grumfeld, J.; Stüber, E.; Kruse, M.L.; Ellrichmann, M.; Häsler, R.; Hampe, J.; Bewig, B.; Rosenstiel, P.; Schreiber, S; et al. Increased intestinal permeability and tight junction disruption by altered expression and localization of occludin in a murine graft versus host disease model. BMC Gastroenterol. 2011, 11, 109. [Google Scholar] [CrossRef] [PubMed]
- Bai, Y.; Huang, F.; Zhang, R.; Dong, L.; Jia, X.; Liu, L.; Yi, Y.; Zhang, M. Longan pulp polysaccharides relieve intestinal injury in vivo and in vitro by promoting tight junction expression. Carbohydr. Polym. 2020, 229, 115475. [Google Scholar] [CrossRef] [PubMed]
- Shi, H.; Chang, Y.; Gao, Y.; Wang, X.; Chen, X.; Wang, Y.; Xue, C.; Tang, Q. Dietary fucoidan of Acaudina molpadioides alters gut microbiota and mitigates intestinal mucosal injury induced by cyclophosphamide. Food Funct. 2017, 8, 3383–3393. [Google Scholar] [CrossRef]
- Goto, Y. Epithelial cells as a transmitter of signals from commensal bacteria and host immune cells. Front. Immunol. 2019, 10, 2057. [Google Scholar] [CrossRef]
- Ramakrishna, B.S. Role of the gut microbiota in human nutrition and metabolism. J. Gastroenterol. Hepatol. 2013, 28, 9–17. [Google Scholar] [CrossRef] [PubMed]
- Shang, Q.; Jiang, H.; Cai, C.; Hao, J.; Li, G.; Yu, G. Gut microbiota fermentation of marine polysaccharides and its effects on intestinal ecology: An overview. Carbohydr. Polym. 2018, 179, 173–185. [Google Scholar] [CrossRef] [PubMed]
- Hu, S.; Xu, Y.; Gao, X.; Li, S.; Jiang, W.; Liu, Y.; Su, L.; Yang, H. Long-chain bases from sea cucumber alleviate obesity by modulating gut microbiota. Mar. drugs 2019, 17, 455. [Google Scholar] [CrossRef]
- Zhu, G.; Luo, J.; Du, H.; Jiang, Y.; Tu, Y.; Yao, Y.; Xu, M. Ovotransferrin enhances intestinal immune response in cyclophosphamide-induced immunosuppressed mice. Int. J. Biol. Macromol. 2018, 120, 1–9. [Google Scholar] [CrossRef] [PubMed]
- Pushpanathan, P.; Mathew, G.S.; Selvarajan, S.; Seshadri, K.G.; Srikanth, P. Gut Microbiota and its mysteries. Indian J. Med. Microbiol. 2019, 37, 268–277. [Google Scholar] [CrossRef]
- Hu, J.; Luo, H.; Wang, J.; Tang, W.; Lu, J.; Wu, S.; Xiong, Z.; Yang, G.; Chen, Z.; Lan, T.; et al. Enteric dysbiosis-linked gut barrier disruption triggers early renal injury induced by chronic high salt feeding in mice. Exp. Mol. Med. 2017, 49, e370. [Google Scholar] [CrossRef] [PubMed]
- Shin, N.R.; Whon, T.W.; Bae, J.W. Proteobacteria: microbial signature of dysbiosis in gut microbiota. Trends Biotechnol. 2015, 33, 496–503. [Google Scholar] [CrossRef] [PubMed]
- Li, S.; Li, J.; Mao, G.; Wu, T.; Hu, Y.; Ye, X.; Tian, D.; Linhardt, R.J.; Chen, S. A fucoidan from sea cucumber Pearsonothuria graeffei with well-repeated structure alleviates gut microbiota dysbiosis and metabolic syndromes in HFD-fed mice. Food Funct. 2018, 9, 5371–5380. [Google Scholar] [CrossRef] [PubMed]
- Kuehbacher, T.; Rehman, A.; Lepage, P.; Hellmig, S.; Fölsch, U.R.; Schreiber, S.; Ott, S.J. Intestinal TM7 bacterial phylogenies in active inflammatory bowel disease. J. Med. Microbiol. 2008, 57, 1569–1576. [Google Scholar] [CrossRef]
- Henke, M.T.; Brown, E.M.; Cassilly, C.D.; Vlamakis, H.; Xavier, R.J.; Clardy, J. Capsular polysaccharide correlates with immune response to the human gut microbe Ruminococcus gnavus. Proc. Natl. Acad. Sci. USA 2021, 118, e2007595118. [Google Scholar] [CrossRef] [PubMed]
- Khodaei, N.; Fernandez, B.; Fliss, I.; Karboune, S. Digestibility and prebiotic properties of potato rhamnogalacturonan I polysaccharide and its galactose-rich oligosaccharides/oligomers. Carbohydr. Polym. 2016, 136, 1074–1084. [Google Scholar] [CrossRef] [PubMed]
- Willing, B.P.; Dicksved, J.; Halfvarson, J.; Andersson, A.F.; Lucio, M.; Zheng, Z.; Järnerot, G.; Tysk, C.; Jansson, J.K.; Engstrand, L. A pyrosequencing study in twins shows that gastrointestinal microbial profiles vary with inflammatory bowel disease phenotypes. Gastroenterology 2010, 139, 1844–1854. [Google Scholar] [CrossRef]
- Yuan, Y.; Zhang, B.; He, J.L.; Wei, T.; Liu, D.J.; Yang, W.J.; Guo, C.Y.; Nie, X.Q. Combinations of Tibetan tea and medicine food homology herbs: A new strategy for obesity prevention. Food Sci. Nutr. 2022, 11, 504–515. [Google Scholar] [CrossRef]
- Slattery, C.; Cotter, P.D.; O’Toole, P.W. Analysis of health benefits conferred by Lactobacillus species from Kefir. Nutrients 2019, 11, 1252. [Google Scholar] [CrossRef]
- Blackwood, B.P.; Yuan, C.Y.; Wood, D.R.; Nicolas, J.D.; Grothaus, J.S.; Hunter, C.J. Probiotic Lactobacillus species strengthen intestinal barrier function and tight junction integrity in experimental necrotizing enterocolitis. J. Probiotics Health. 2017, 5, 59–78. [Google Scholar] [CrossRef] [PubMed]
- Hu, X.; Guo, J.; Zhao, C.; Jiang, P.; Maimai, T.; Yanyi, L.; Cao, Y.; Fu, Y.; Zhang, N. The gut microbiota contributes to the development of Staphylococcus aureus-induced mastitis in mice. ISME J. 2020, 14, 1897–1910. [Google Scholar] [CrossRef] [PubMed]
- Quagliariello, A.; Del Chierico, F.; Russo, A.; Reddel, S.; Conte, G.; Lopetuso, L.R.; Ianiro, G.; Dallapiccola, B.; Cardona, F.; Gasbarrini, A.; et al. Gut microbiota profiling and gut-brain crosstalk in children affected by pediatric acute-onset neuropsychiatric syndrome and pediatric autoimmune neuropsychiatric disorders associated with streptococcal infections. Front. Microbiol. 2018, 9, 675. [Google Scholar] [CrossRef]
- Dobrindt, U.; Hacker, J.H.; Svanborg, C. Preface. Between Pathogenicity and Commensalism. Curr. Top. Microbiol. Immunol. 2013, 358, v–vii. [Google Scholar] [PubMed]
- Pilarczyk-Zurek, M.; Sitkiewicz, I.; Koziel, J. The clinical view on Streptococcus anginosus group-opportunistic pathogens coming out of hiding. Front. Microbiol. 2022, 13, 956677. [Google Scholar] [PubMed]
- Waters, J.L.; Ley, R.E. The human gut bacteria Christensenellaceae are widespread, heritable, and associated with health. BMC Biol. 2019, 17, 83. [Google Scholar]
- Mao, J.; Li; S. ; Fu, R.; Wang, Y.; Meng, J.; Jin, Y.; Wu, T.; Zhang, M. Sea Cucumber Hydrolysate alleviates immunosuppression and gut microbiota imbalance induced by cyclophosphamide in Balb/c mice through the NF-κB pathway. Foods 2023, 12, 1604. [Google Scholar] [CrossRef] [PubMed]
- Dubois, M.; Gilles, K.A.; Hamilton, J.K.; Rebers, P.t.; Smith, F. Colorimetric method for determination of sugars and related substances. Anal. Chem. 1956, 28, 350–356. [Google Scholar] [CrossRef]

| Number | Sequence | Mass | Charges | Intensity | Activity Prediction Score |
|---|---|---|---|---|---|
| 1 | AAVAAAVAPPSPPPIAGPP | 1649.91 | 2 | 179750 | 0.55 |
| 2 | ALAALQQSSSSGSSSSTAT | 1739.82 | 2 | 454080 | 0.19 |
| 3 | ATKYSDITKLSSIGKSVE | 1926.03 | 2 | 5239900 | 0.09 |
| 4 | DLSEEFMAICSTMPDT | 1845.75 | 2 | 2482400 | 0.42 |
| 5 | DVITIEVLAK | 1099.64 | 2 | 2187900 | 0.08 |
| 6 | EKLCYVALDFEQEMATAASSSSLEK | 2806.30 | 3 | 335090 | 0.04 |
| 7 | FDGPEGPRGPPGSE | 1397.62 | 2 | 4477600 | 0.55 |
| 8 | FSGSQPELPVDQ | 1302.61 | 2 | 8266800 | 0.26 |
| 9 | GEAGAETPKAATEAGEAP | 1655.76 | 2 | 4324000 | 0.14 |
| 10 | GFDGPEGPRGPPGSE | 1454.64 | 2 | 4834900 | 0.62 |
| 11 | GIVLDSGDGVTH | 1168.57 | 2 | 1385600 | 0.18 |
| 12 | KGADGETGEPGPQG | 1298.57 | 2 | 273750 | 0.22 |
| 13 | LCYVALDFEQEMATAASSSSLEK | 2549.17 | 3 | 23738000 | 0.03 |
| 14 | LDLAGRDLTDY | 1250.61 | 2 | 650410 | 0.16 |
| 15 | LLSEMRRLE | 1145.62 | 2 | 192180 | 0.22 |
| 16 | MEHDTRTHREHYR | 1766.80 | 2 | 13898000 | 0.06 |
| 17 | PVSASRHQESANQGL | 1579.77 | 2 | 6068000 | 0.20 |
| 18 | RGPAGPTGPTGPA | 1134.57 | 2 | 2150400 | 0.56 |
| 19 | SPGEKGDQGSPGPA | 1282.58 | 2 | 1278600 | 0.38 |
| 20 | SRGLLSCLF | 1051.55 | 2 | 371770 | 0.83 |
| 21 | SYELPDGQVITIGNER | 1789.88 | 2 | 765850 | 0.21 |
| 22 | VAPEEHPVLLTEAPLNPK | 1953.06 | 2 | 158170 | 0.34 |
| 23 | YAYSVKNAVQDAP | 1424.69 | 2 | 302260 | 0.09 |
Disclaimer/Publisher’s Note: The statements, opinions and data contained in all publications are solely those of the individual author(s) and contributor(s) and not of MDPI and/or the editor(s). MDPI and/or the editor(s) disclaim responsibility for any injury to people or property resulting from any ideas, methods, instructions or products referred to in the content. |
© 2023 by the authors. Licensee MDPI, Basel, Switzerland. This article is an open access article distributed under the terms and conditions of the Creative Commons Attribution (CC BY) license (http://creativecommons.org/licenses/by/4.0/).


