1. Introduction
With the rapid development of the high-speed railway (HSR) network, higher requirements have been placed on the safety and stability of high-speed trains, and the train operating environment is directly related to the safety of high-speed trains in transit. How to quickly find and solve basic faults is the focus of high-speed railway (HSR) systems around the world, and high-speed train operation environment monitoring is an important guarantee for railway safety operations[
1]. The safety of high-speed railway systems can be significantly improved through real-time monitoring and inspection. The high-speed railway operation environment monitoring system includes the railway infrastructure monitoring system, the high-speed railway natural disaster and foreign body intrusion monitoring system, the EMU on-board dynamic monitoring system, and the EMU operation and maintenance management system . At present, the wired communication network adopted by these monitoring systems has been verified to be stable and reliable. However, the high-speed railway operating environment is complex, and the high cost of wired network is not conducive to large-scale deployment of the global high-speed railway monitoring system, and the complex terrain is inconvenient for wired network maintenance[
2,
3].
With the development and maturity of wireless sensor network technology, it provides a more efficient and reliable, low-cost, easy-to-implement and maintain, high-tech means for the field of high-speed train operation environment monitoring. The use of wireless systems to monitor the operating environment of high-speed railways can realize large-scale deployment along the railway, ensure the breadth and accuracy of data collection, and can monitor the condition of slopes, tunnels, roadbeds, bridges, and other facilities, which can effectively meet the needs of high-speed trains. The need for comprehensive monitoring of the operating environment reduces the cost of train operating environment testing and is suitable for large-scale deployment and long-term online monitoring in key areas and remote areas along the high-speed railway. However, the energy resources of wireless devices are strictly limited. Wireless sensor networks’ biggest problem is saving energy, and the length of time the network lasts is a good measure of how well it works[
4,
5].
In order to ensure the reliability and real-time performance of high-speed railway operating environment monitoring information and the energy utilization efficiency of the network system, a protocol that adapts to the characteristics of the high-speed railway operating environment monitoring network is needed to efficiently utilize the limited energy resources of the network system and provide more long-term energy efficiency[
6]. Serve. The increase in communication distance will increase the energy consumption of some nodes and shorten the network life. Each protocol chooses to increase the number of forwarding hops to achieve a balance of energy consumption, and the overall energy consumption is evenly distributed to more nodes to avoid premature death of some nodes. But the increase in hop count will inevitably increase the delay of information transmission, which is bad news for the high-speed railway monitoring network[
7,
8]. In fact, it is difficult to guarantee the real-time performance of the network and its maximum lifespan at the same time. Extending the lifespan and increasing the number of hops will result in a large delay and affect the service quality of the monitoring network. To this end, in the intelligent high-speed railway monitoring system , the information in the network can be divided into several parts: receiving, transmitting, processing, state evaluation and prediction, and control decision-making . Generally speaking, the transmission of data along the shortest path can minimize the energy consumption of the network, but this approach will introduce the problem of unbalanced energy consumption. The energy consumption of the sensor device closer to the sink node is faster, which is the so-called energy hole phenomenon [
9,
11].
This phenomenon will destroy the balance of energy consumption among nodes, affect the life of the network, and also have a negative impact on the real-time performance of data transmission, hindering the normal service of the network system. Therefore, in addition to minimizing the network energy consumption, the energy consumption balance among network nodes should also be considered when designing the routing algorithm to extend the life of the network system. Therefore, when designing a routing protocol for a high-speed railway operation environment monitoring network, it is necessary to minimize and balance network energy consumption while reducing data transmission delay, so as to improve real-time performance, improve network energy utilization, and prolong network service life. So, the goal of this paper is to look into how a high-speed railway operation environment monitoring network can use an adaptive routing method to meet the needs of different services[
12,
13].
Table A1 introduces some typical existing studies and evaluates them in terms of optimization goals, adoption methods, network structures, and advantages and disadvantages. Most of the research is aimed at improving the lifetime of network systems, and the strategies to maximize network lifetime can be divided into deployment optimization, data processing, and protocol design. Among them, routing protocol design optimization is a more effective and widely used strategy, and protocol design can be divided into single-hop, multi-hop, and clustering methods. However, for a typical linear network such as a high-speed railway operating environment monitoring network, it is obviously more appropriate to use a multi-hop routing protocol. In some studies, the network lifetime is extended by minimizing the total network energy consumption (MTECR). However, its shortcomings are also obvious. As mentioned above, the problem of unbalanced network energy consumption while minimizing energy consumption leads to network energy holes, resulting in the premature death of some nodes, which affects the service life of the network. In addition, some other research focuses on balancing the energy consumption of nodes in the network, such as MVECR and AUMRP, and proves that their balancing scheme based on the residual energy of nodes is more effective for prolonging the network lifetime.
To the best of our knowledge, there are few studies on the co-optimization of lifetime and delay for high-speed railway operational environmental monitoring networks. Traditional routing algorithms cannot ensure stable transmission services in dynamic environments because they cannot cope with network dynamics and voids. If maintaining global routing information, this will incur great overhead, and the complex structure will also reduce the efficiency of the current high-speed railway linear monitoring network. These issues are addressed in this article.
2. Motiviation
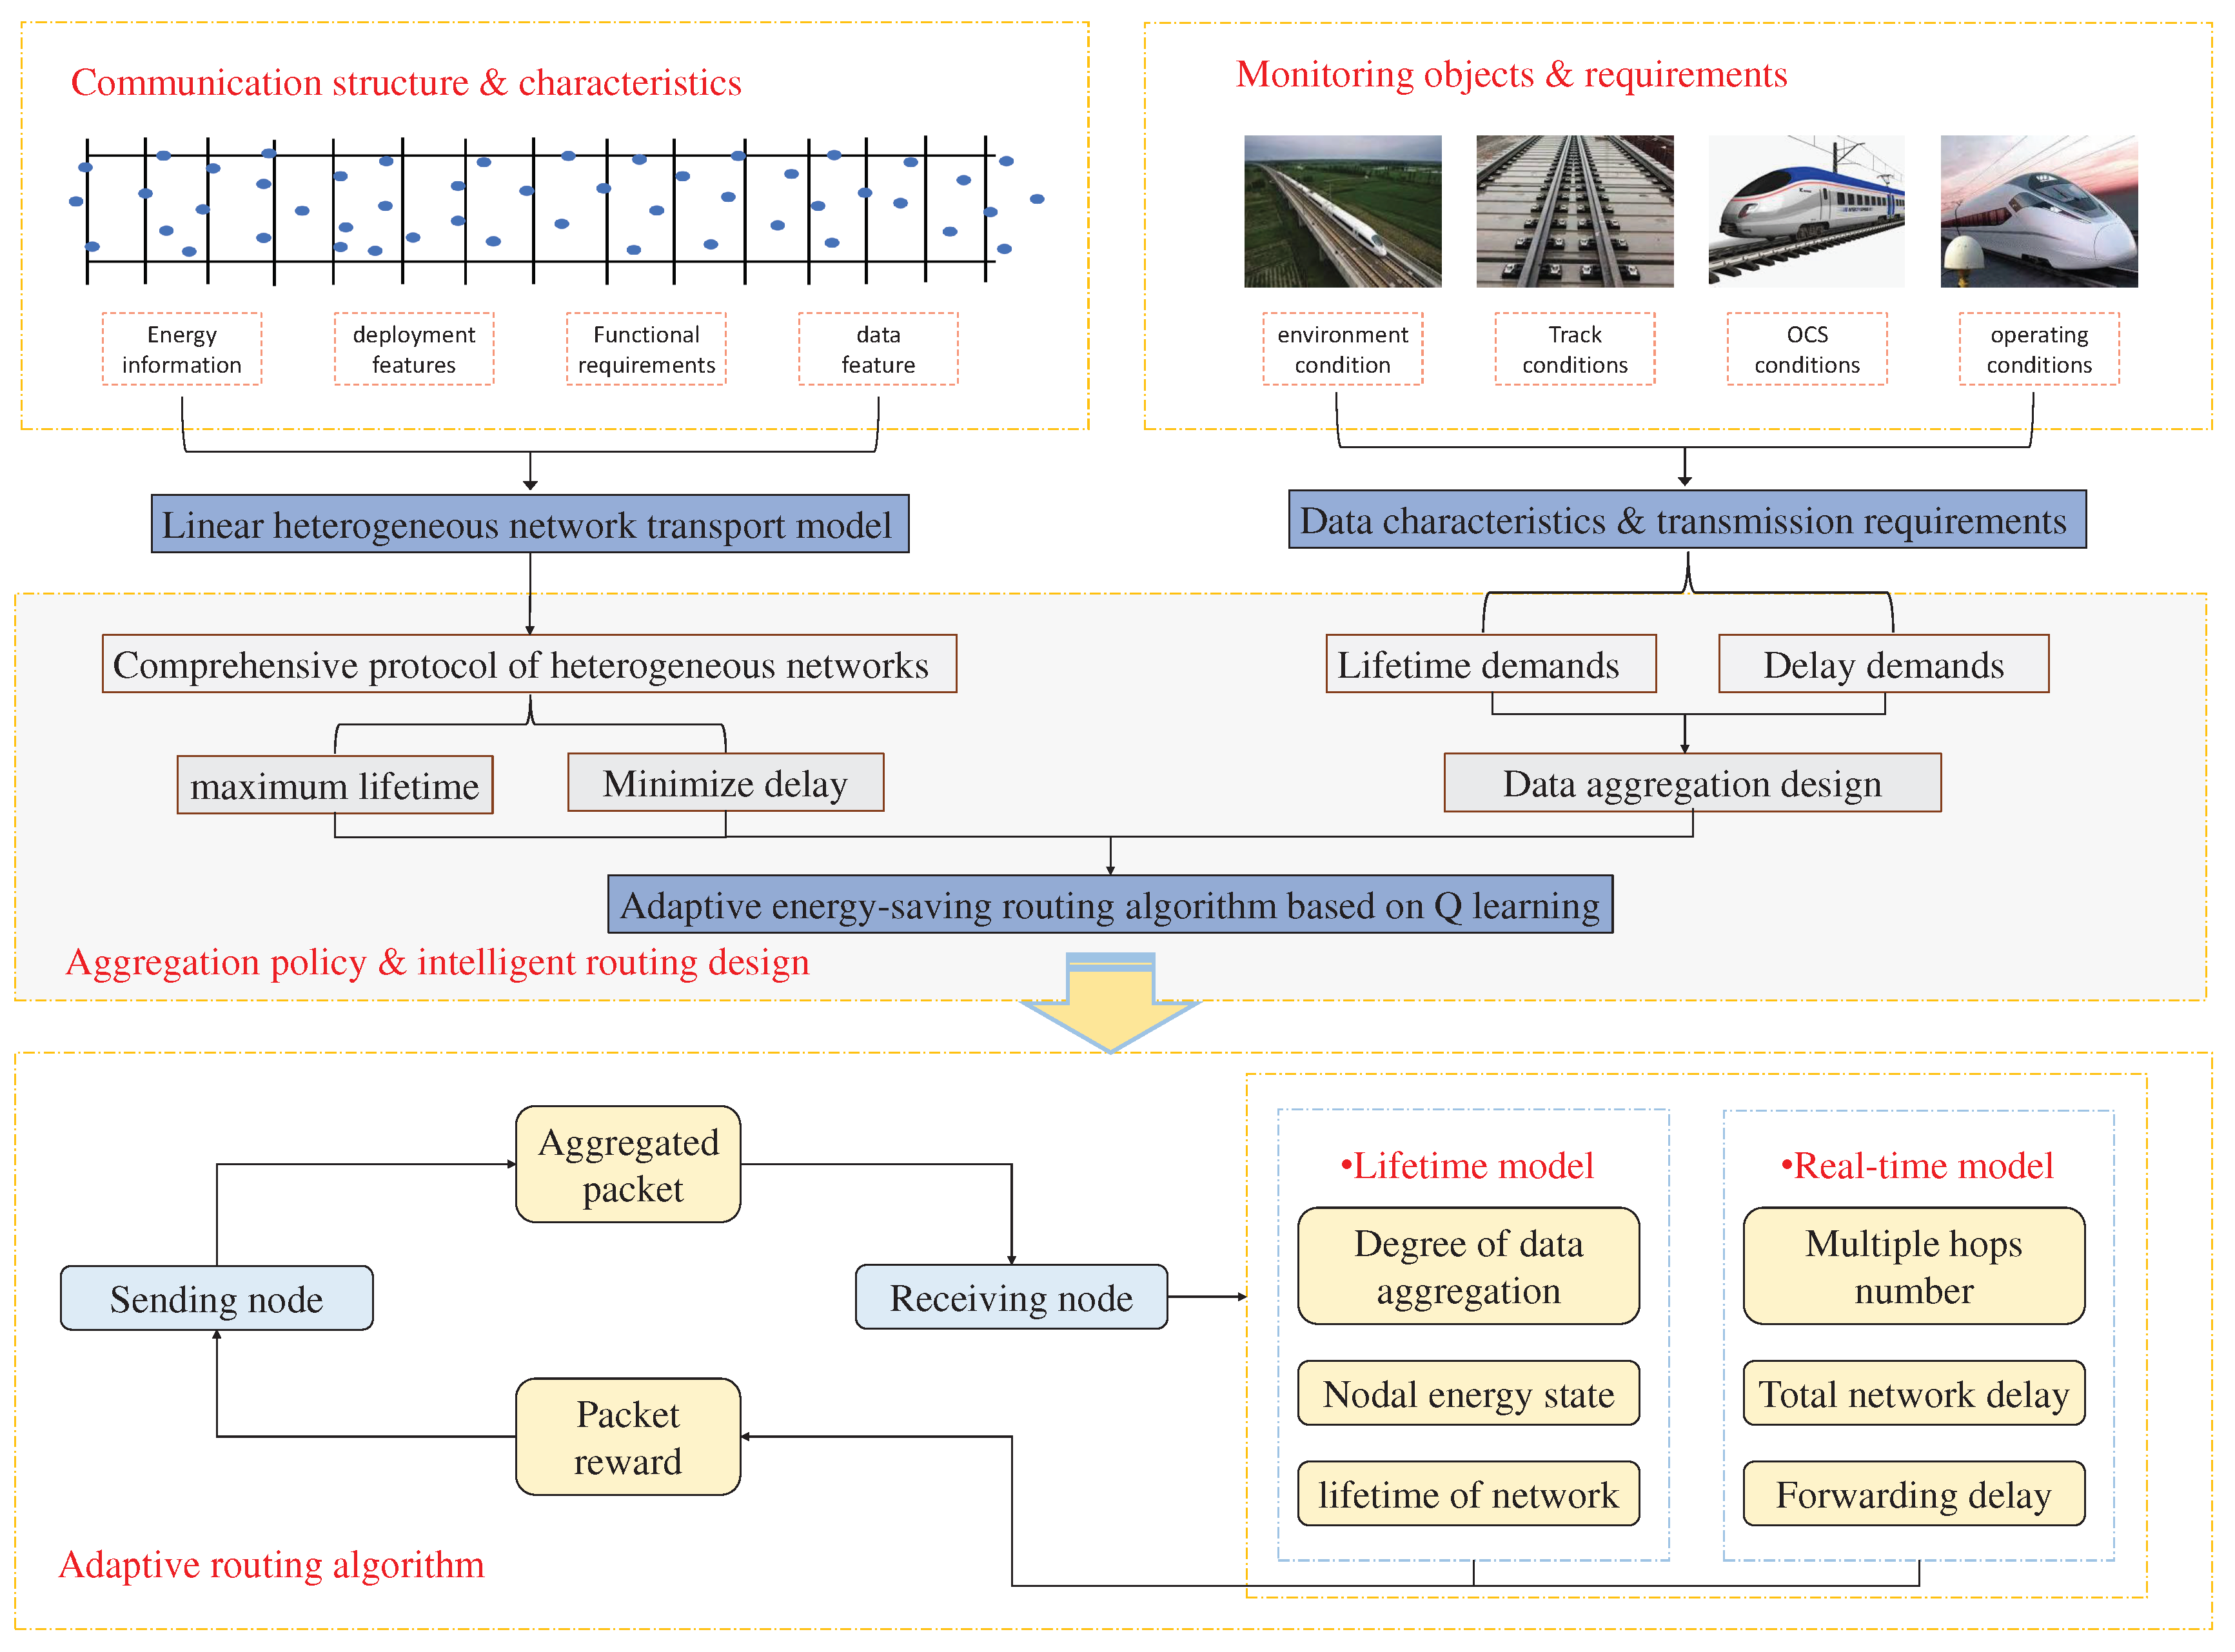
Power supply and grid maintenance for high-speed rail operating lines are very difficult. With the development and maturity of wireless sensor network technology, high-speed train operation provides more efficient, reliable, and low-cost in the field of environmental monitoring and detection, and then implements high-tech manual maintenance. Experts have done a lot of in-depth research on the coordination of the routes of the plane network, but less research on the coordination of the high-speed railway network. If there is a general problem with existing routing protocols, it is their lack of applicability to monitoring regional environments. There are many types of sensors in high-speed rail systems. Various sensors vary widely in terms of latency, transfer rate, data volume, etc. Inspired by the above requirements and existing work, this paper proposes a heterogeneous network data aggregation model and adaptive routing algorithm for high-speed railway monitoring network based on reinforcement learning. The overall design is shown in
Figure 1.
The main contributions of this paper can be summarized as follows:
A lossless data aggregation transmission model for HSR networks is proposed, which can effectively reduce the amount of data in the network and reduce the energy consumption of data transmission;
A DoubleQ-values model based on data aggregation is proposed.Forn the two Q values, we consider the data aggregation degree, the remaining energy level, the link strength, the distance from the node to the sink, and the forwarding delay to consider the network lifetime and the real-time performance of data forwarding. The defined reward function can capture the dynamic changes of the network in real time and achieve dynamic control of the entire network with less overhead;
An adaptive energy-saving routing algorithm based on DoubleQ-values is proposed to classify HSR network devices according to their real-time requirements and life cycle requirements. An adaptive control algorithm is adopted for different business priorities. It meets the real-time requirements of the HSR network and prolongs the network’s life and improves service quality.
The work arrangement of this paper is as follows. Sec.3 presents the typical structure of the high-speed railway monitoring network as well as the analysis of node requirements and introduces the data aggregation scheme. Sec.4 describes in detail the proposed demand-aware energy-saving routing algorithm based on Q-learning. Sec.5 discussed and analyzed the performance metrics of the proposed routing protocol through simulation experiments. The conclusions are summarized in Sec.6.
3. System Profile and Overall Scheme
This section may be divided by subheadings. It should provide a concise and precise description of the experimental results, their interpretation as well as the experimental conclusions that can be drawn.
The system involved in this paper consists of the following four parts:
Structure and characteristics of communication;
Keeping track of objects and requirements;
Policy of aggregation and intelligent routing design;
Algorithm for adaptive routing.
3.1. Communication structure and characteristics
The high-speed train operating environmental monitoring system based on the wireless sensor network is simply called HSR-N, which is used for the completion, replenishment, or replacement of the transmission high-speed train operating environmental monitoring system. The proposed wireless sensor network can be roughly considered as a linear network.
In HSR-N, its monitoring areas are wide and varied, and different monitoring targets have great differences. Therefore, relevant parameters and network technologies need to be designed for specific monitoring targets. With limited network energy, HSR-N needs an energy-efficient transmission protocol that meets its requirements.
3.2. Monitoring objects and requirements
Line inspection mainly includes bridge inspection, tunnel monitoring, road base monitoring, contact network monitoring, and rail monitoring. Estimate the volume of five parts.
Some monitoring objects and their corresponding characteristics are shown in
Table A2. The real-time requirements and life cycle requirements of monitoring objects are different. We make a brief evaluation of their different functional requirements to provide support for the following work. The evaluation is mainly allocated based on the urgency of the data and the amount of data. For data types with high real-time requirements, we give higher real-time evaluation to reduce delay; for periodic data with low real-time requirements, we Based on how the data is set up, the aggregation processing is made to give the network a longer life cycle [
22,
23].
According to the different functions and requirements of various types of sensors, this paper divides all sensors into high, medium, and low grades according to their life cycle and real-time requirements[
24]. In the operation of high-speed railways, their security has higher requirements for information delay. However, the energy constraints of the wireless network determine the conflict between the network lifetime and the delay. The change of most infrastructure states is a very slow process, so the information collected by the band basically changes slowly or unchanged. The collection and transmission of information should consider the life cycle of the network as much as possible. However, changes in the power supply network of high-speed railways and changes in some natural environments, especially changes in conditions such as meteorological disasters, require strong real-time performance. Under such conditions, real-time performance has a higher priority.
3.3. Aggregation policy and intelligent routing design
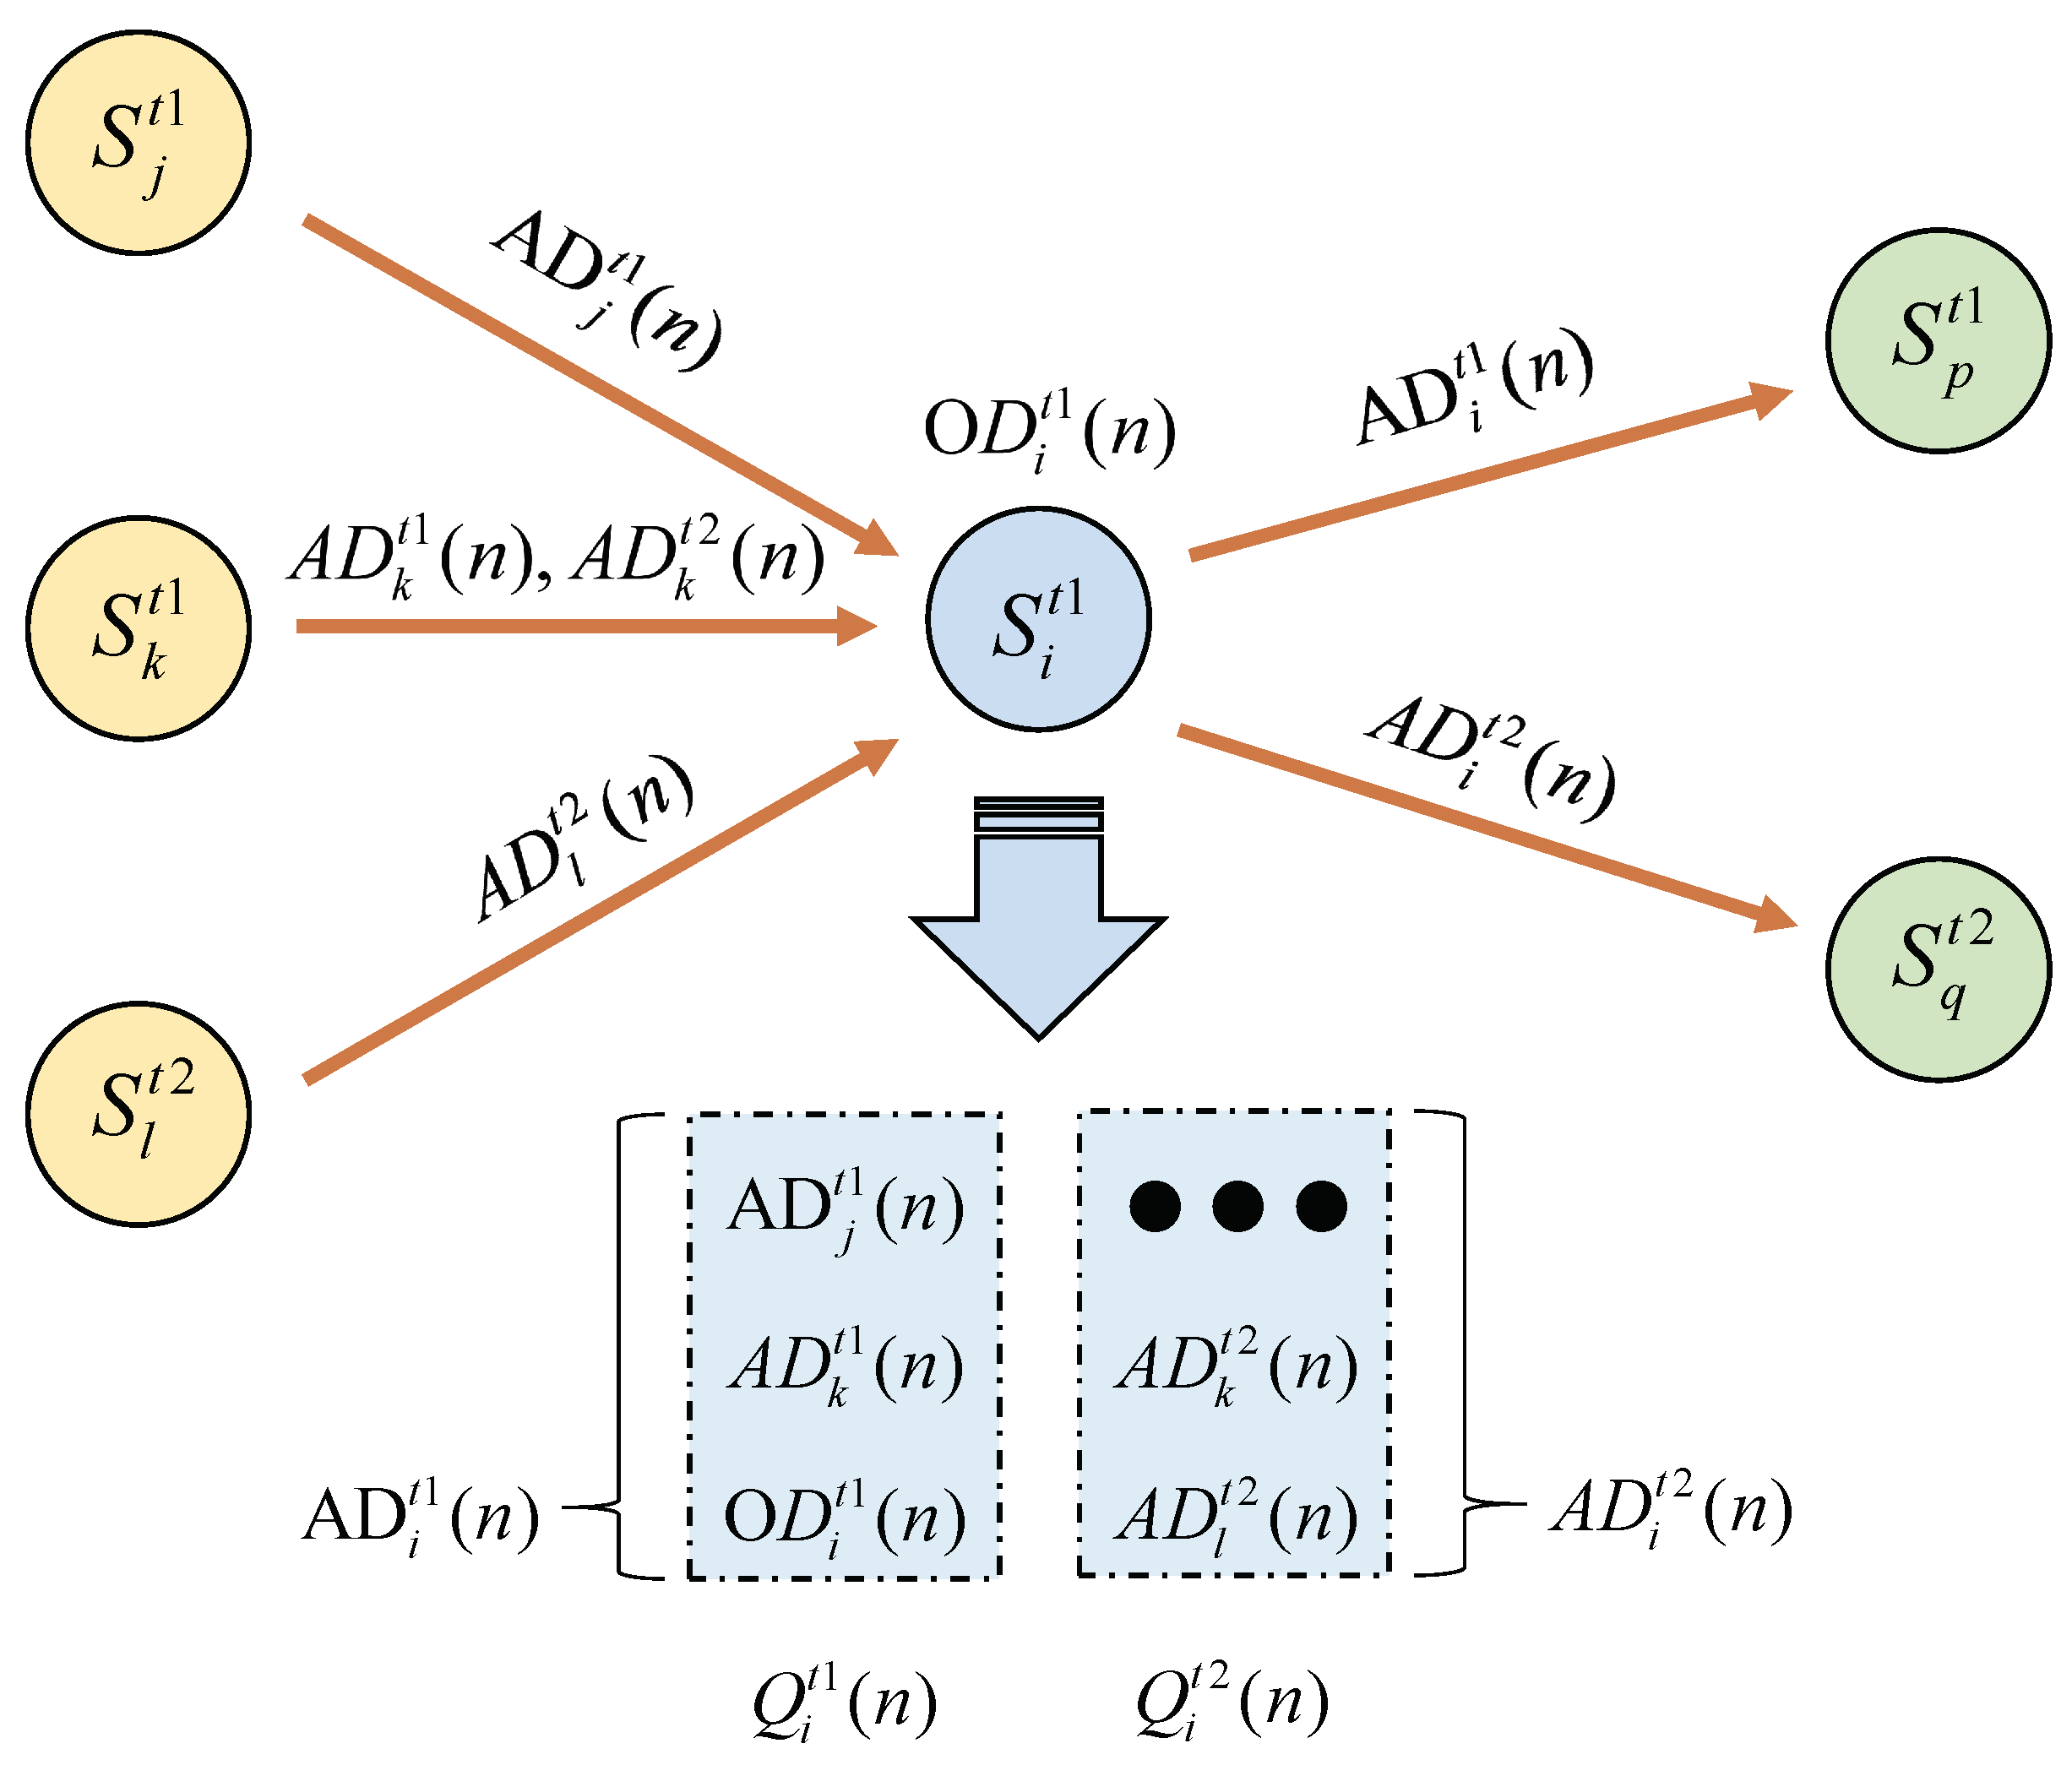
For most of the monitoring requirements of chronic changes, we only need to collect their data periodically and analyze it, while some monitoring requires only a large number of repeated measurements as the train passes by. For this data with low real-time requirements, we consider data aggregation on the transmission path to reduce the transmission burden of nodes to achieve the purpose of saving energy and prolonging the network life cycle. Data aggregation A lossless aggregation model is adopted in this study. This means that the original data can be reconstructed by the sink node from the received aggregated data packets without any damage or loss of data. The data aggregation model is expressed as follows:
The data aggregation model is defined in this paper. The data buffer area of each sensor is partitioned, and each sensor maintains storage areas of multiple data types. For the same type of data, when the real-time requirement is low, the sensor performs data aggregation before forwarding to optimize the data volume. When a packet of data type T is transmitted in the network, each node transmits to the next hop after the interval
. Obviously, the longer the waiting time for data aggregation, the greater the delay for the data packet to reach the sink node. It can be seen from Table 2 that different types of sensors have different real-time requirements for data. Therefore, in the design of routing protocols, the real-time requirements of different nodes need to be considered when energy-saving design is carried out[
25,
26]. This will be explained in Sec. IV. The aggregation process design is shown in
Figure 2 and model parameters are listed in
Table 1.
If the sensor node is the next hop selected by ,, and , the -type aggregated data packets from the node and the -aggregated data packets of the node are stored together with the data packets observed by the node from the surrounding environment After aggregated into data packets in the data type queue of node , they are sent to the next hop node of type. Similarly, the type data packets from nodes and , is in the data of node The data packets are aggregated in the type queue and sent to the next-hop node of type . After this aggregation process, the data of the same type will be aggregated first and sent to the next-hop node with the same data type until The data packet is sent to the sink node to complete the aggregation and transmission of the data.
3.4. Adaptive routing algorithm
In the aggregation model described in
Section 3.3, the aggregated data of each sensor node is sent to the optimal next-hop node, and the next-hop node selection is determined by the Q-learning adaptive algorithm proposed in this paper (See
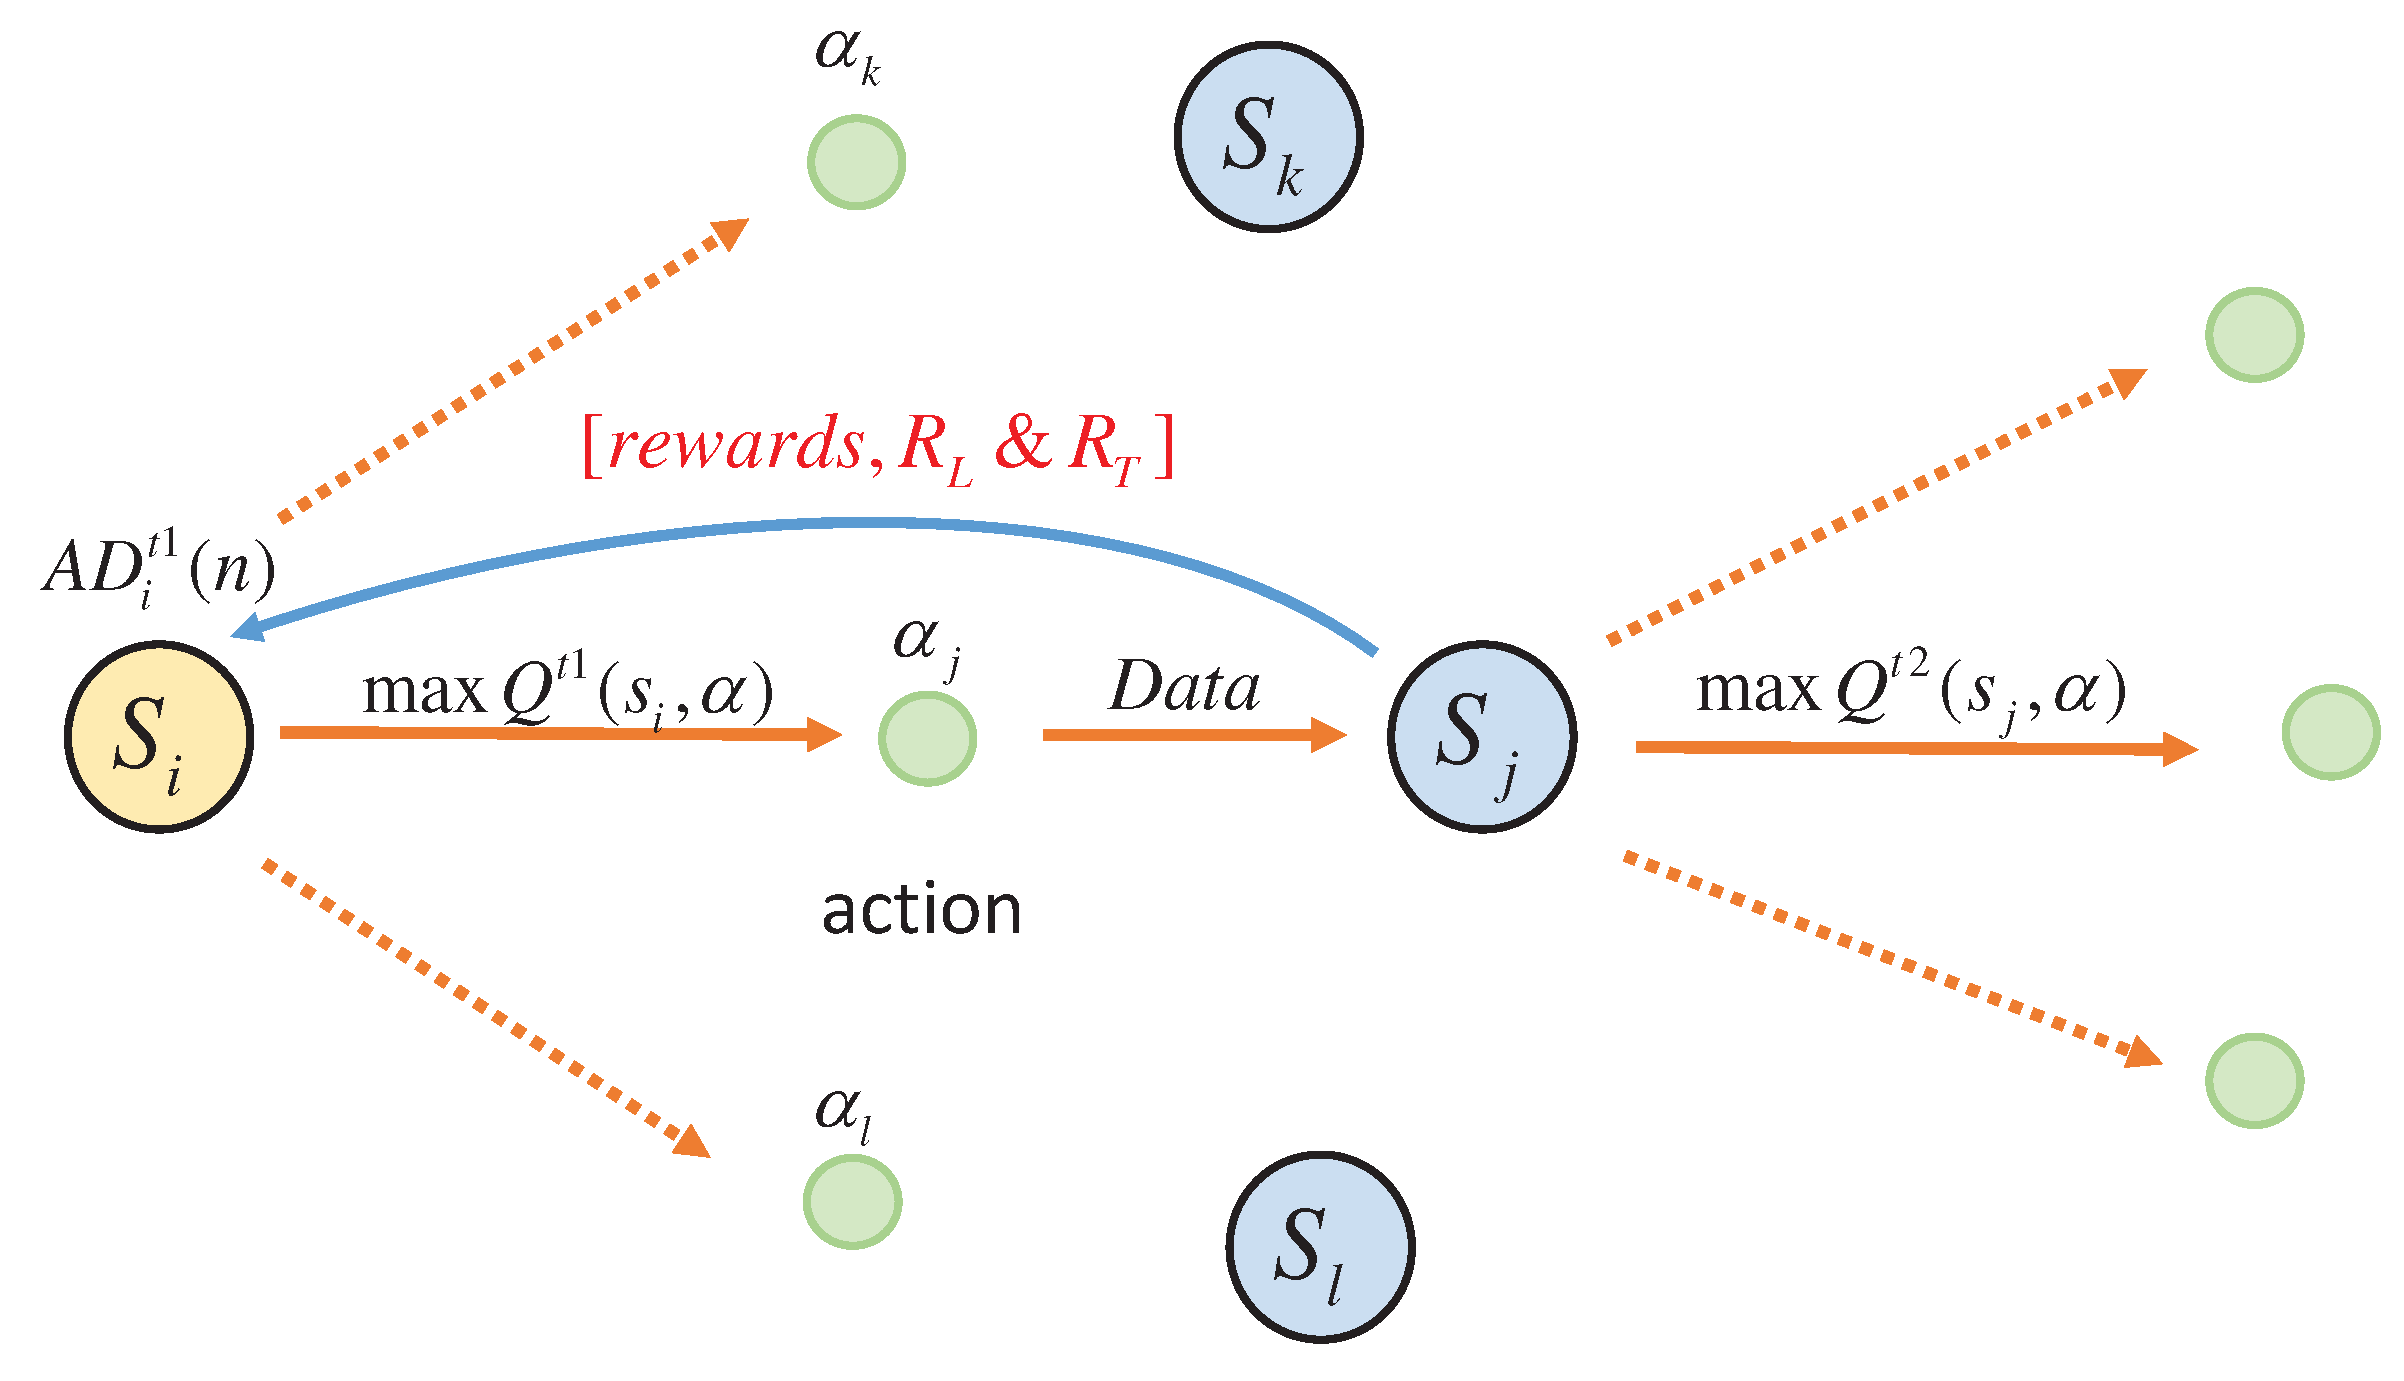
Section 4). The adaptive routing algorithm consists of three parts: 1)The sending node selects the node with the highest priority in the Q routing table to send the data packet; 2)The receiving node feeds back the reward value information to the sending node according to the received data packet; 3)The sending node accepts the reward value information and updates its Q routing table.
4. Model and Methodology of the Adaptive Protocol
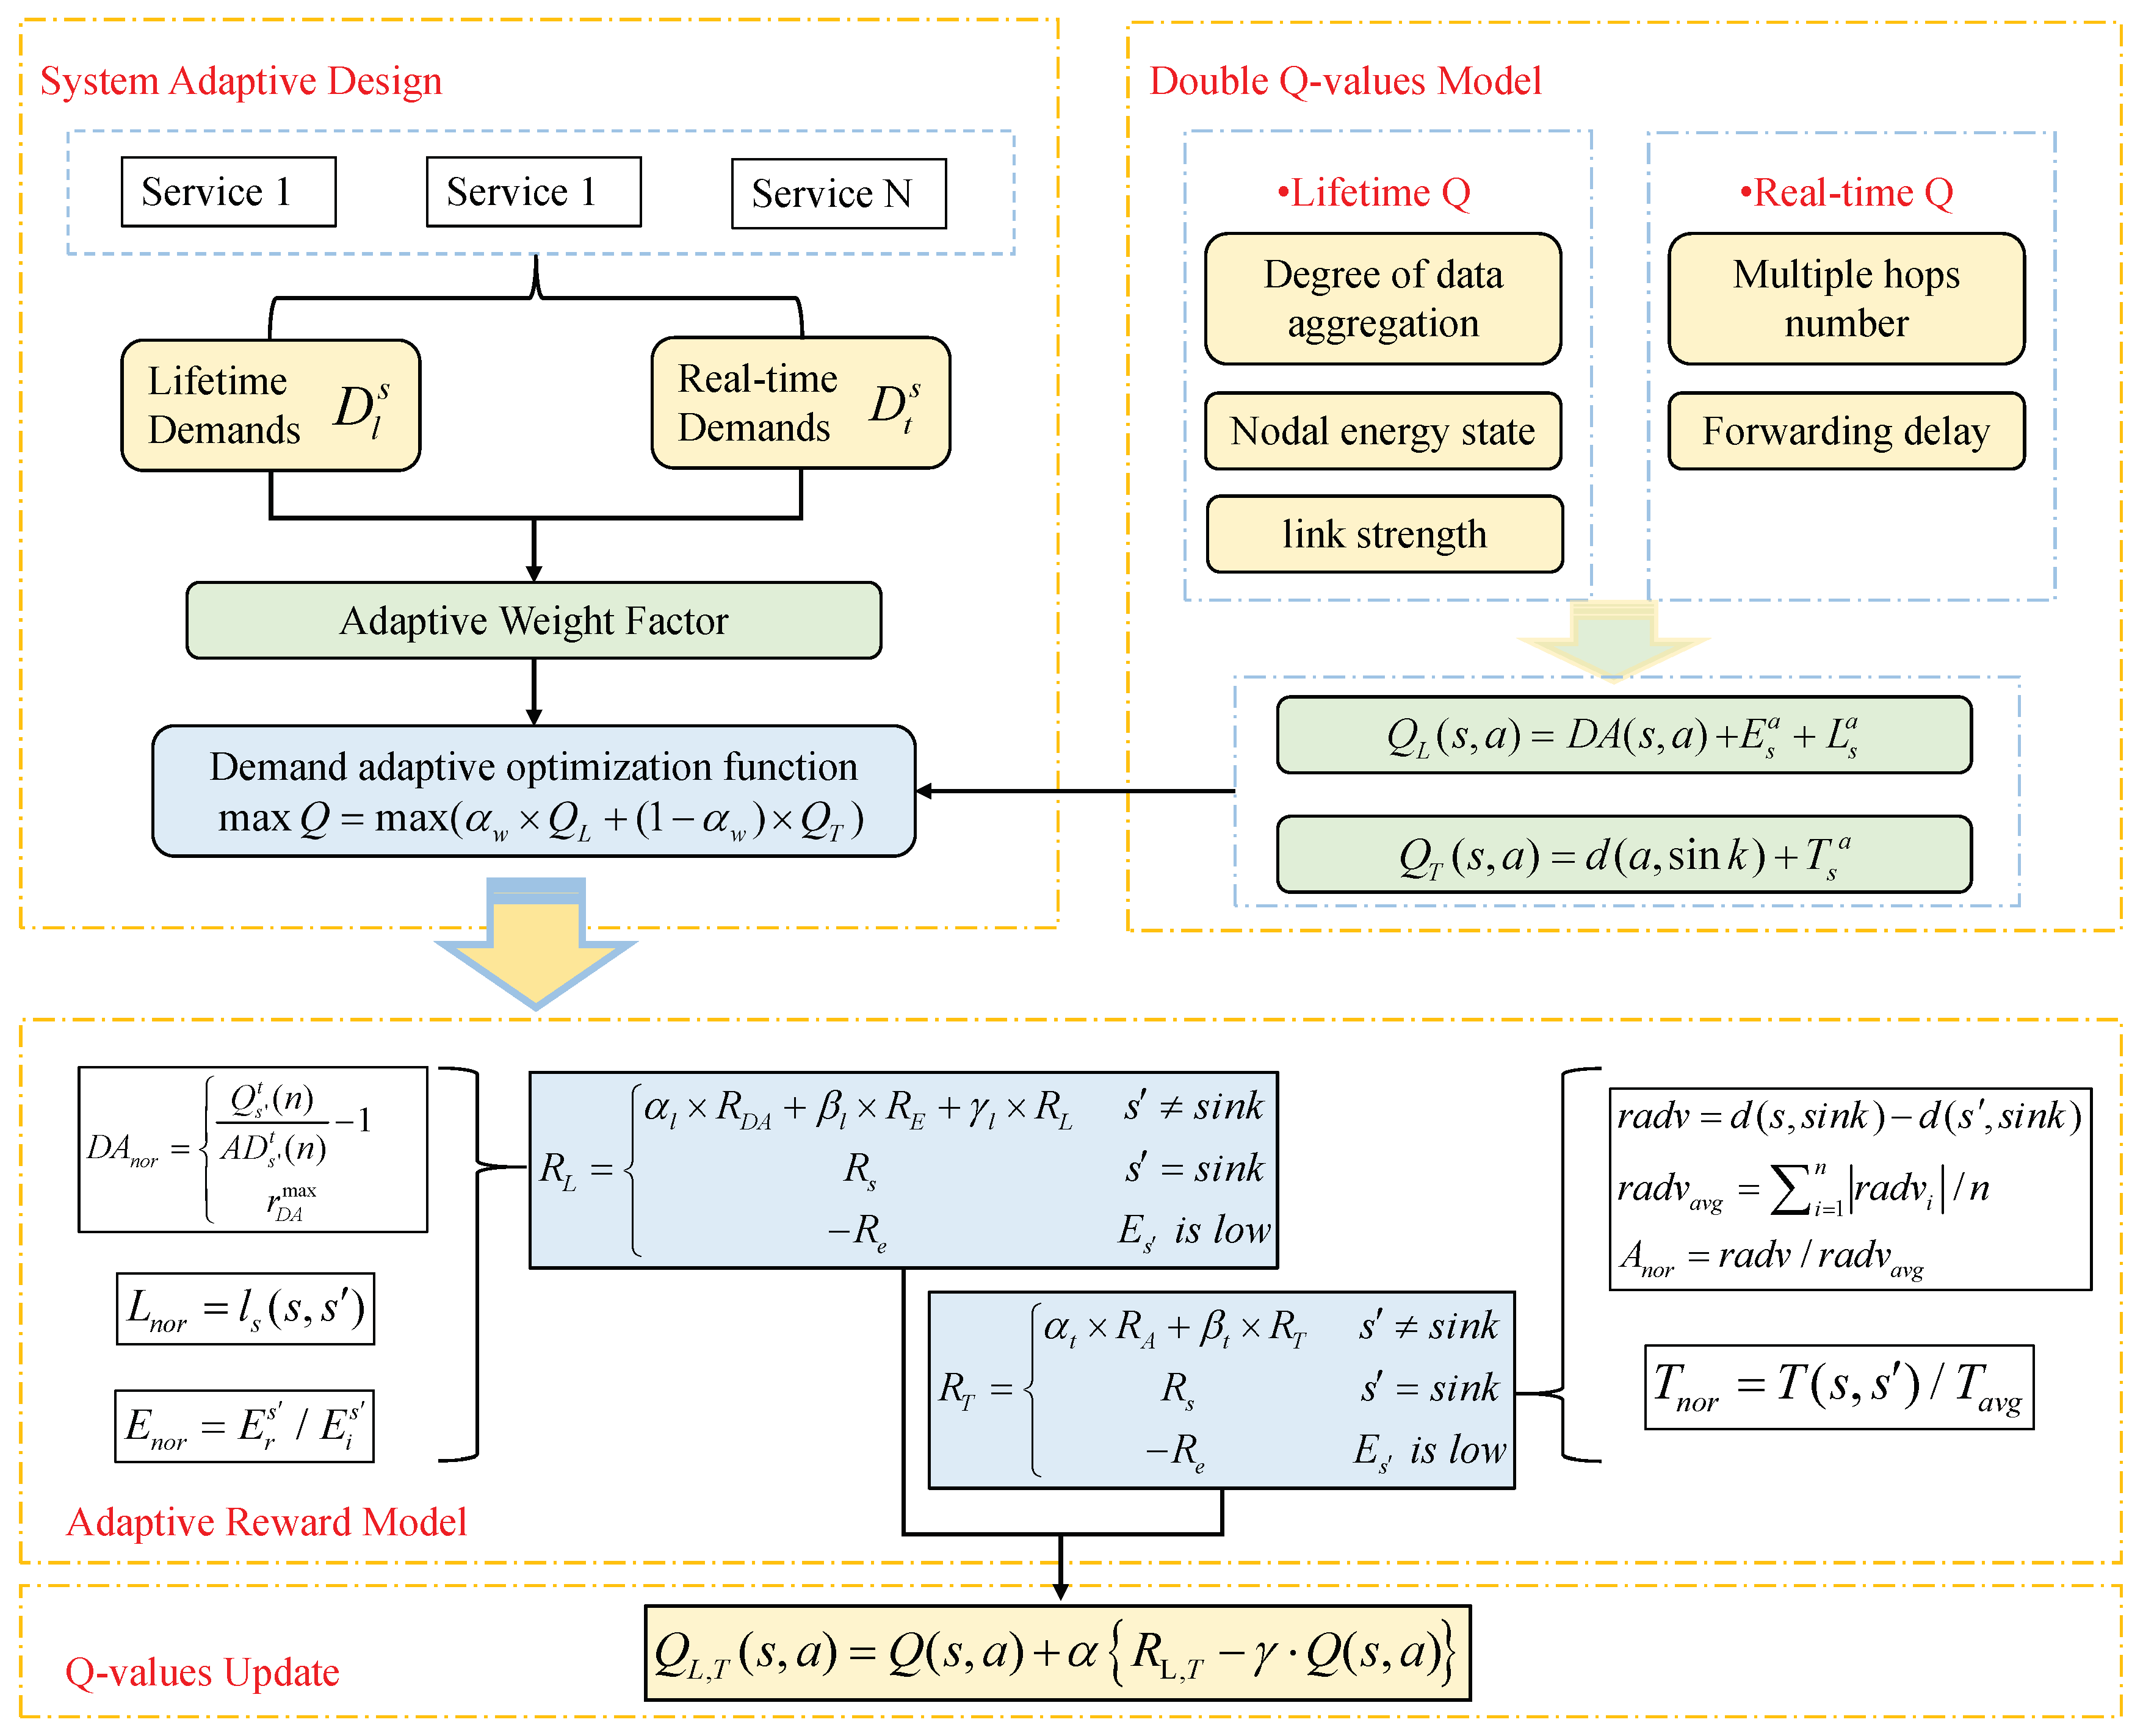
In order to maximize the network life cycle and meet the functional requirements of various types of sensors, an adaptive protocol model based on Q-learning is proposed in this section, as shown in
Figure 3. For a linear heterogeneous network such as a high-speed railway monitoring network, according to different functional requirements, ensuring the real-time of emergency or security service information while taking into account the life cycle of the entire network is crucial for monitoring the service quality of the system[
27].
Q-learning is a model-free reinforcement learning algorithm whose core is Q-value and reward[
28]. This technology enables nodes in the network to use the local Q-table to select the best next hop without the overhead of maintaining global routing information, which makes it applicable to routing problems in sensor networks. Based on the traditional single-objective Q-learning route, this paper proposes a double-Q-value adaptive algorithm to meet the needs of the high-speed railway monitoring system to ensure the real-time performance and life cycle of the monitoring network. The parameters and definitions used in this section are shown in
Table 2.
4.1. Energy model
Nodes adopt a periodic sleep/active work mode. The main energy consumption of nodes can be divided into two parts:
We adopt the typical WSN energy consumption model to calculate the energy consumption of sending, receiving, and aggregated data, which is given by (3),(4)and(5) respectively.
Among them, represents the node’s energy consumption when sending, and represents the distance between nodes. When , the node energy consumption is in the normal loss mode; when , the node energy consumption is gradually reduced; and represent the energy at different distances is the energy expended for computation; l is the length of the data frame.
4.2. Double Q value learning model
The Q-learning algorithm is a value function-based algorithm in RL, and for any finite Markov decision process, Q-learning can find an optimal policy. Q-learning involves an agent, a set of states
S, and a set of actions
A. By performing actions in the environment that cause the agent to move from one state to another, the action in a particular state is rewarded. That is,
is the expected reward for performing action
a(
) in state
s(
) at a given time[
29]. The algorithm used in this study is shown in
Figure 4.
4.3. Figures, Tables and Schemes
4.3.1. State and Aaction
In the proposed double-Q value learning model for high-speed railway wireless monitoring network routing, adjacent nodes exchange routing information in a cooperative way to ensure that nodes in the network can dynamically follow network changes and reduce the burden of maintaining the global routing table[
30]. Define a sensor node’s node set
S, action
, and action state set
A as follows when it sends a specific type of data to the next hop node:
where
n is node number and
is the Set of forwarding nodes of node
.
4.3.2. Initialize the Double Q-values
In Q-learning, the forwarding of data between nodes uses a Q-table to find the best action, where Q-value is the expectation of nodes when forwarding[
31]. In the double Q-value model designed in this paper, the action value functions are divided into life cycle functions and real-time functions
and
.
consists of three parts: data aggregation degree, node energy status, and link strength. The first part aims to increase the aggregability of forwarded data packets and reduce the data size to reduce the energy loss caused by data transmission. The second part avoids selecting energy. Nodes with low values are forwarded, and the third part aims to reduce communication overhead and save energy.
consists of two parts: the number of hops reaching the sink node and the forwarding delay estimation, both of which aim to ensure the real-time performance of the data packet reaching the sink node. As shown in (7), double Q-values are initialized as a weighted sum of the probabilities of their respective parts.
Where
denotes the degree to which node s aggregates data to the node indicated by its action a;
is the remaining energy of the node pointed to by action a; The link strength between node s and the node pointed to by action a is represented by
.
is the distance between the node indicated by action a and the sink.
is forwarding time from node s to the node pointed to by its action a; Before starting, the Q-values are initialized only by the initial energy and the distance to the sink, and other parameters will be updated after running.
4.3.3. Double Q-values update
In this paper,
defines the possibility of state
s acting
a and provides various types of businesses with a Q table based on their business requirements, which is defined as follows:
Among them,
is the business type,
is the life cycle measurement of an action, and
is the real-time measurement of an action.
When a node selects the optimal next hop in its Q table to send a packet, it gets a reward from the receiving node and updates its Q value accordingly. The new Q value is (8).
where
is the learning rate and
is the discount factor for the future reward.
4.3.4. Explore strategies
Usually, action selection relies only on the highest Q value, but this fixed selection can get stuck in a local optimum. To do this, we use an epsilon-greedy algorithm that makes it possible to escape local optima with partial probability.
4.3.5. Future rewards
In this stage, rewards are given for the action performed in the previous step, which can be divided into three situations.
1) The node receiving data packets is not the sink node, and the energy level is normal. We give each component of double Q-Values its own reward scheme, calculated as follows.
2)The receiving node is the
. The reward is a constant
when the chosen action sends the data packet to the sink node.
3) The receiving node is not a sink, and the energy level is too low. In order to maintain the performance and life of the network, we suggest not giving the node the function of forwarding data when the energy level is too low to ensure that the basic monitoring service of the network is normal [33]. Therefore, we give a negative reward to avoid packets from neighbor nodes.
Based on the above definition, corresponding to the double Q-values, the future reward should also be divided into two parts to give different rewards for its life cycle and real-time performance. At the same time, in order to avoid increasing the probability of forwarding to nodes far away from the sink, it is necessary to provide a discount value to the reward. The reward
and
for the state s are calculated as follows:
4.4. Adaptive routing protocol based on double Q-values
In order to meet different business needs, this section proposes an adaptive weighting scheme based on the proposed double Q-values model and the principles of maximizing network lifetime and adaptively meeting the functional requirements of various types of sensors, trying to consider both energy saving and delay reduction. Two objectives are used to adapt to different business objectives. The multi-objective function formula is as follows:
where
is a business adaptive weighting factor used to adjust the weight of life cycle and real-time goals. As shown in
Table 1, different services in the system have different requirements for life cycle and real-time performance. When the real-time performance requirement of the monitoring object is low, it means that the object has higher requirements for the continuity of data transmission. The adaptive weight factor will increase with the improvement of life requirements; and when the real-time requirement of the monitored object is high, the algorithm will give priority to meeting its real-time requirement. Therefore, the design of the adaptive weight factor is as follows: in this formula, low, medium, and high values are 0.2, 0.5, and 0.8.
Among them, the life cycle demand amplification factor
and the real-time demand amplification factor
are defined as follows:
5. PERFORMANCE COMPARISON AND VALIDATION
In this section, we compare and analyze the performance of the proposed Double Q-values Adaptive Aggregation Routing Protocol (DQAAR) in terms of energy consumption, network lifetime, transmission delay, and data retransmission energy loss. At present, there is little research on multi-objective optimization of high-speed railway wireless sensor network delay and life cycle. This paper uses MATLAB R2018b to realize the simulation environment and compares it with the other three excellent routing protocols. They are METCR, AUMRP, and MVECR.
5.1. Parameters Configuration
In this study, the node communication energy consumption adopts the space energy loss model, and the simulation parameter configuration is shown in
Table 3.
The initial energy of the sensor nodes involved in this paper is
, and the energy of
nodes is unlimited. According to the node types and business requirements in
Table 1, the network model is constructed proportionally to verify the performance of the adaptive routing model in this paper. In the comparative analysis before, we introduced a few concepts about performance indicators. 1) FND (the time at which the first node dies). 2) HND (time when half of the nodes die). 3) CP Index (Comprehensive Performance Index): The utility of a high-speed railway monitoring network is determined by its life cycle and real-time performance. In this paper, we built a complete evaluation model for life cycle and real-time performance. It looks like this:
Among them,U is the comprehensive performance index,L is the life cycle, and T is the delay.
5.2. Results and Discussion
In order to verify the effectiveness of the adaptive routing protocol proposed in this paper, this paper first verifies the effect of extending the network life cycle of each protocol, and then simulates environmental changes and different application scenarios by changing some system parameters. Several aspects, such as extending the comprehensive efficiency index, are compared with the three routing protocols mentioned above, which verifies the superiority of DQAAR.
5.2.1. Lifetime evaluation
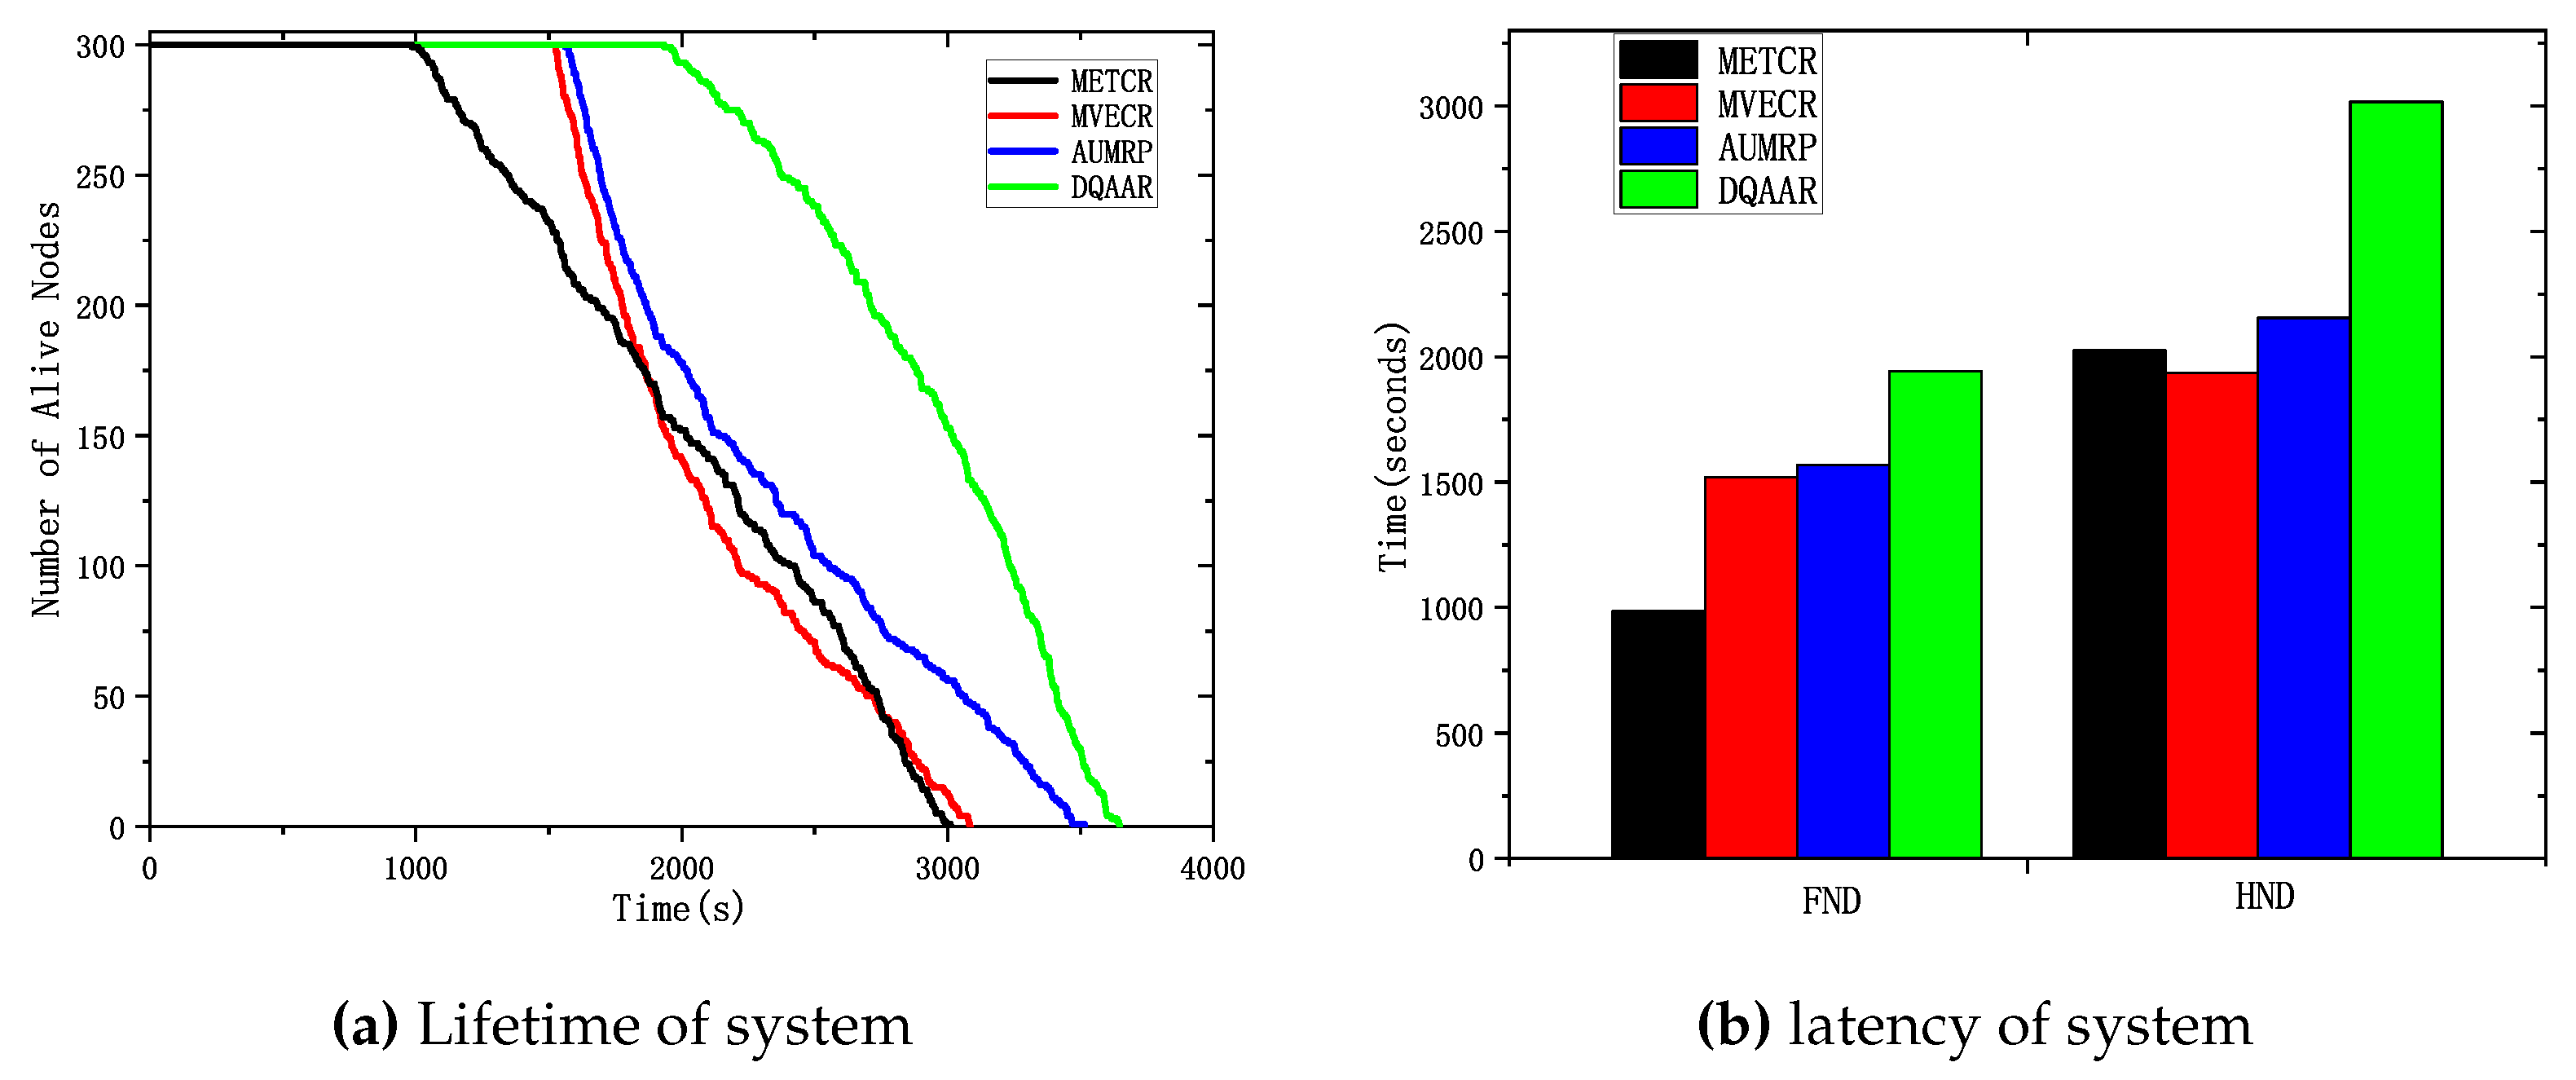
Figure 5 shows the change in the number of surviving nodes for each routing protocol with the network running time. For the high-speed railway monitoring network, the main task is to collect as much on-site information as possible to ensure the safety of railway operation, so we first focus on the life cycle of the network.
Figure 5 (a) shows that DQAAR has a longer running time than METCR, MVECR, and AUMRP under the same conditions. Because METCR only pays attention to the overall energy loss of the network and does not care about the energy balance of the network, its first The death time of each node occurs in about 1000s of Compared with METCR, MVECR, and AUMRP, they impose some constraints on the overall energy consumption balance of the network, but while prolonging the death time of the first node, they also cause a large area of low-energy nodes to die in the network around 1500 s. The DQAAR proposed in this paper delays the death time of the first node in the network to about 2000s, and then there is no continuous death of large-scale nodes but maintains a relatively slow trend. This is because DQAAR gives dynamic rewards based on data aggregation while paying attention to the balanced use of network energy, and each node learns the best next-hop node. Efficient data aggregation paths greatly reduce the amount of data transmitted over the network, which greatly delays node death times.
Figure 5 (b) shows the FND and HND data of the four routing protocols, respectively. The FND and HND of the worst performing METCR are 985 and 2024, respectively, and the AUMRP data of FND is only 1565 and 2155, although it is effective. The node death time is delayed, but the process from the death of the first node to the death of half of the nodes is not very slow. The FND and HND of the DQAAR proposed in this paper are 1982 and 3016, respectively. It can be seen that DQAAR gives better answers in terms of balancing network energy consumption and improving network life.
5.2.2. Latency Time
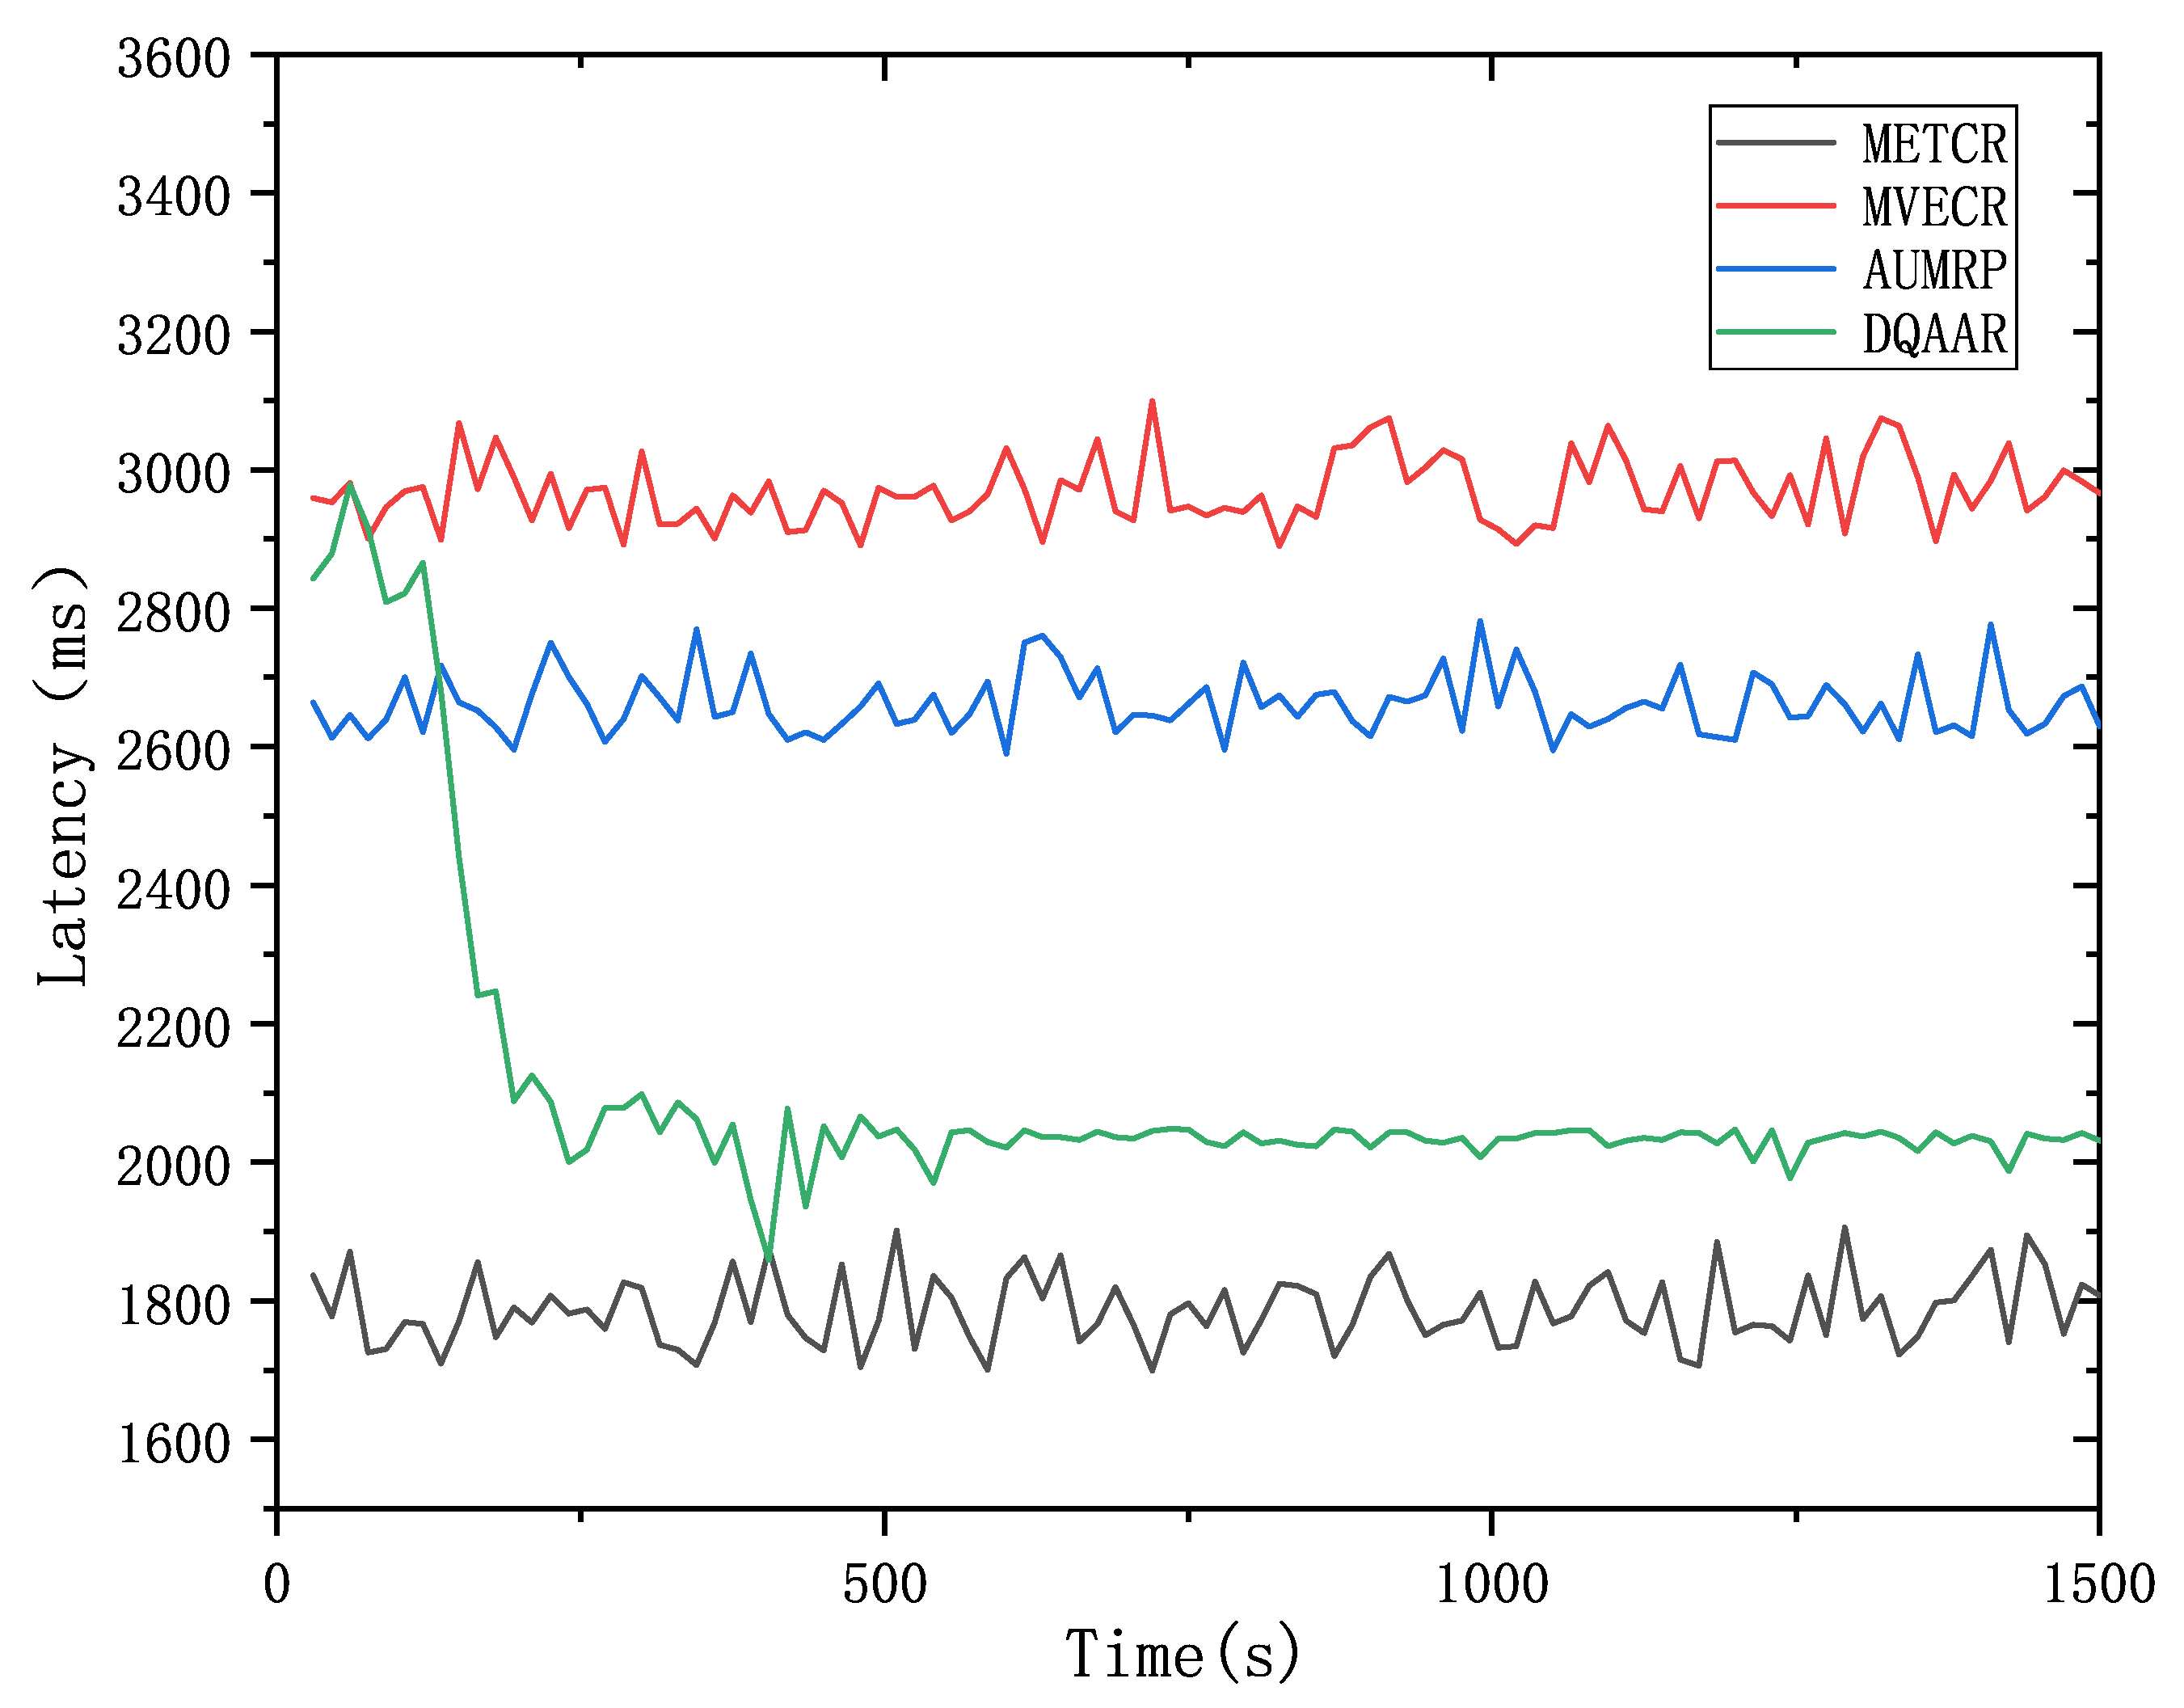
Figure 6 shows the real-time performance of DQAAR and the three protocols mentioned above. METCR achieves the best real-time performance with an average latency of 1780 ms, but this is due to its advantage of reducing hop count at the expense of lifetime. In the initial stage of the network, the efficiency of DQAAR is low, and its real-time performance is greatly improved after a period of learning, which is not much different from METCR.
Compared with the other three routing protocols, the DQAAR delay in the stable operation stage has better stability performance. That is to say, the initial high delay is caused by the exploration behavior of DQAAR. In the stable operation stage, the real-time performance of DQAAR far exceeds that of MVECR and AUMRP, achieving good real-time performance.
5.2.3. scenario analysis
Case 1 verifies the impact of network size changes on its performance and the performance of each routing protocol. Among them, a single data packet on the network data = 200 bits.
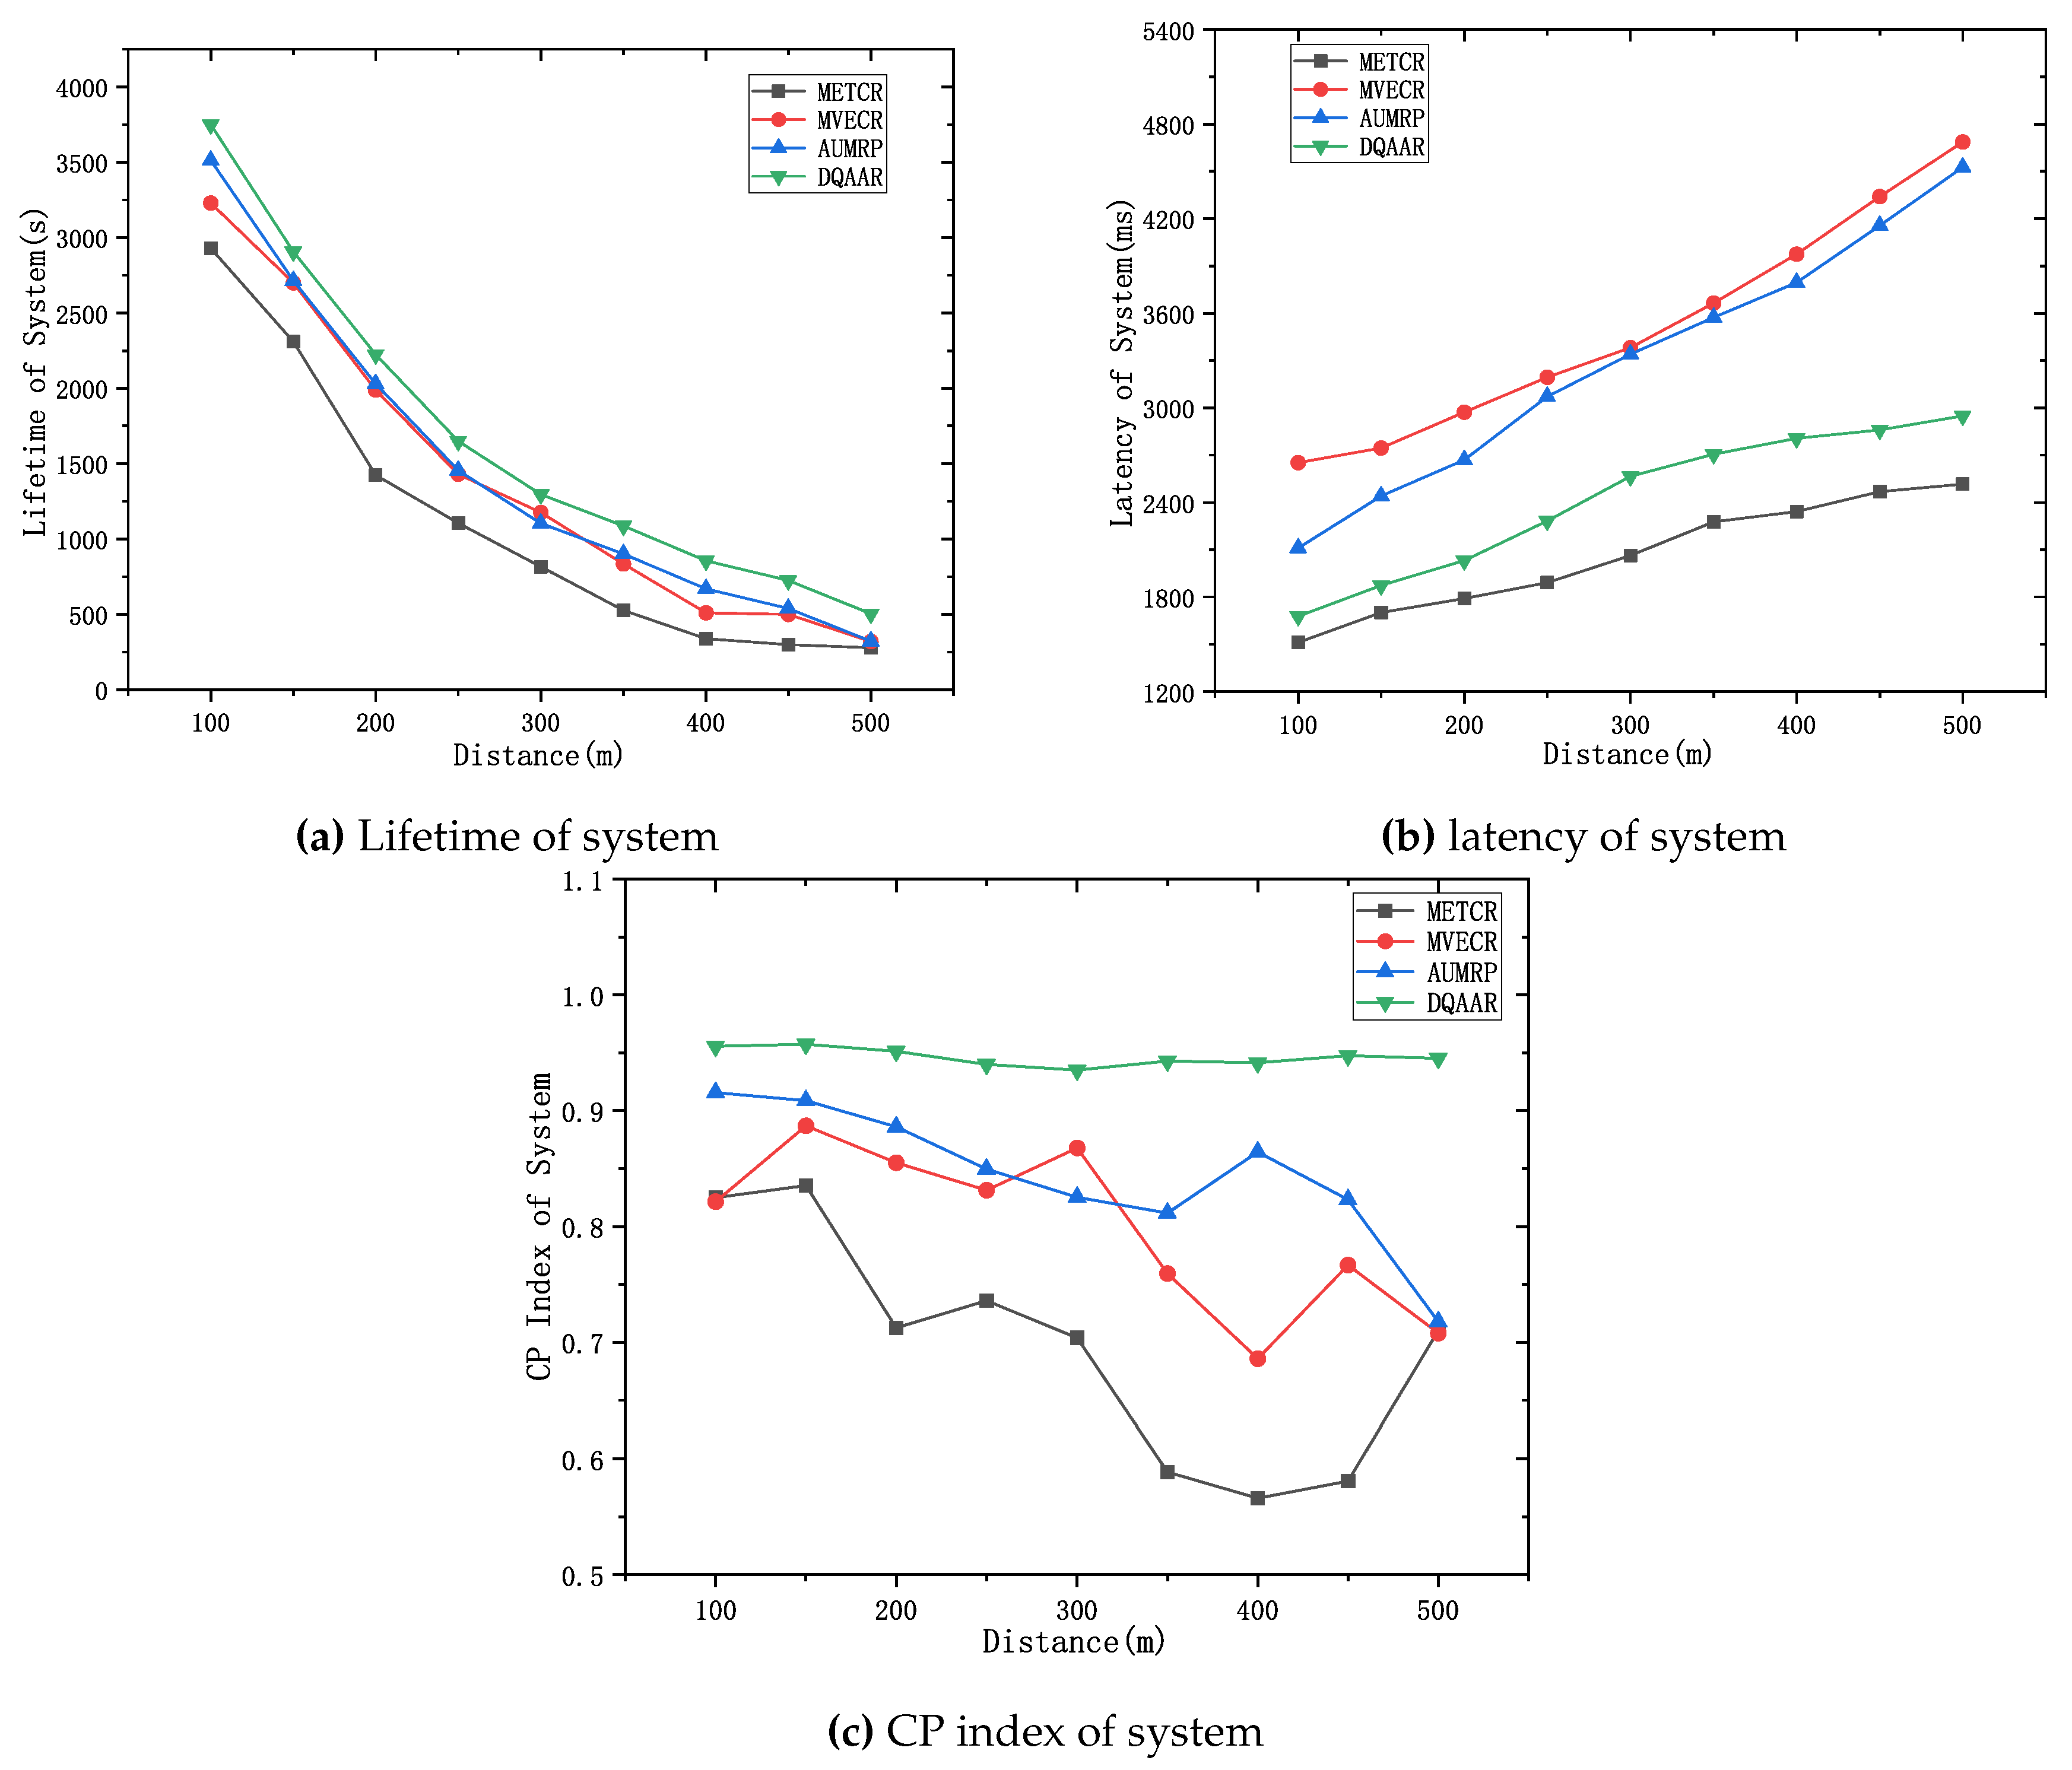
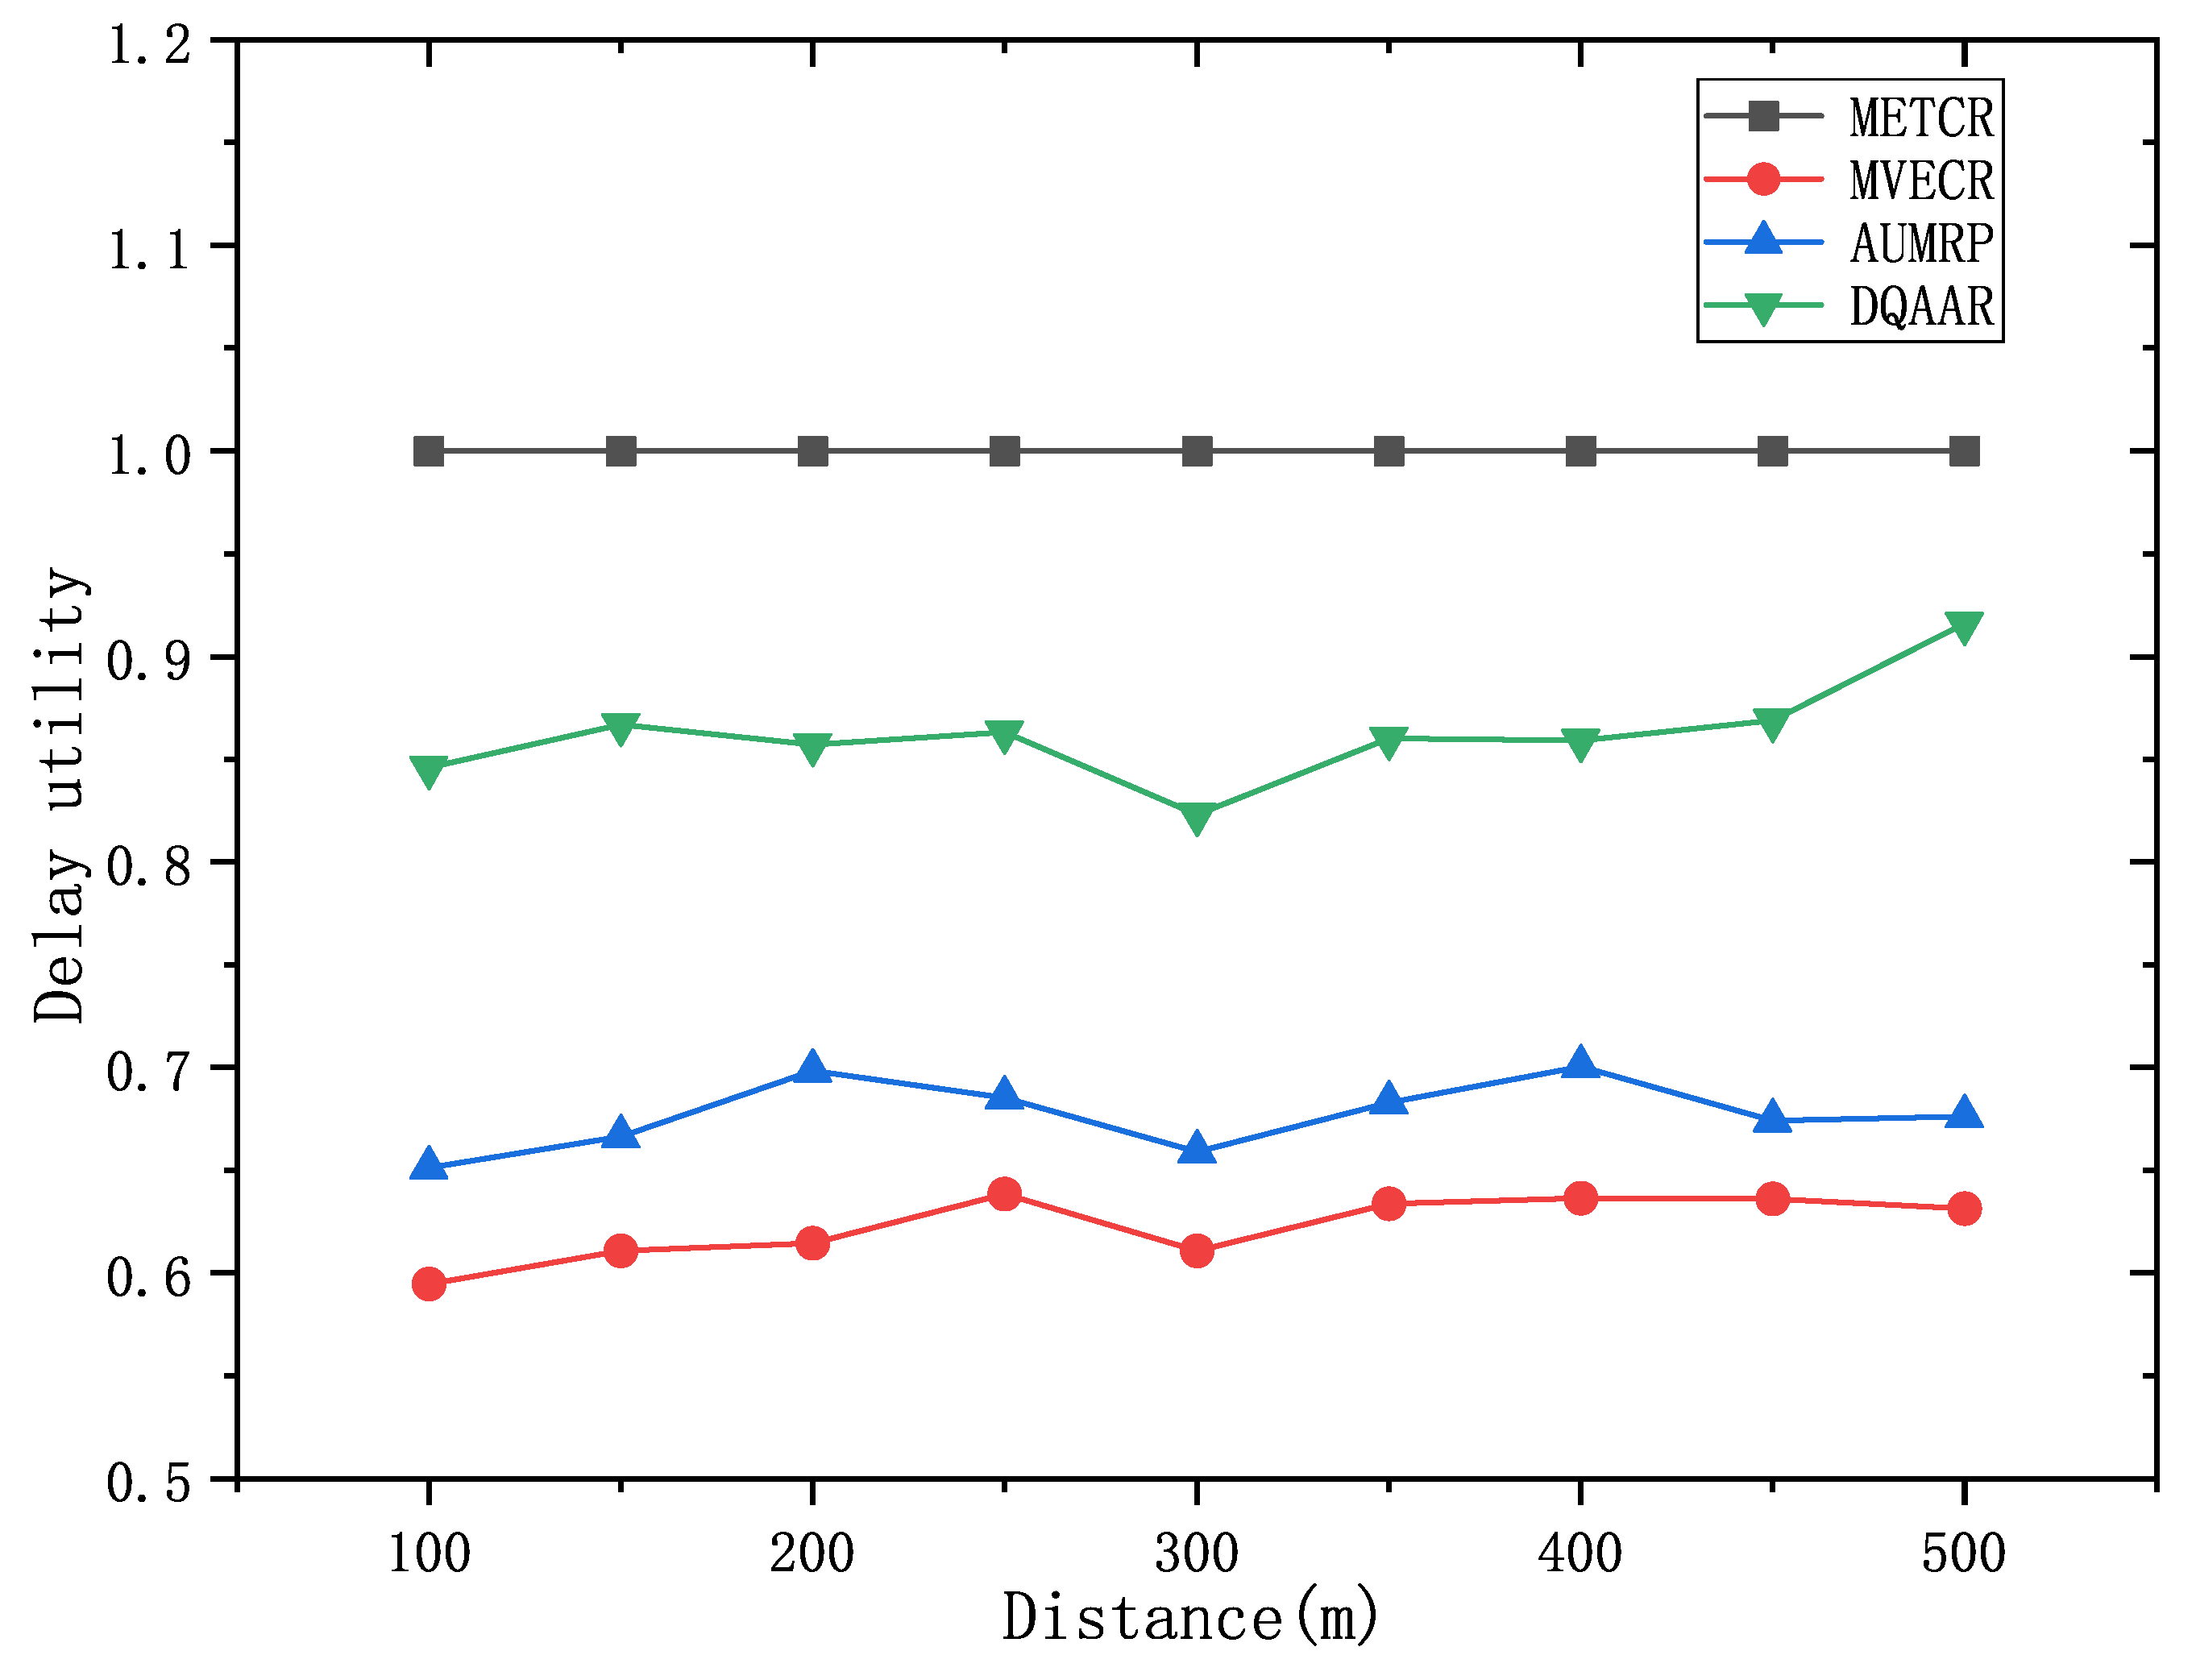
Figure 7 shows the performance of the life cycle, delay, and overall energy efficiency of each routing protocol when the distance from the head end to the end of the network changes from d = 100 m to d = 500 m.
Figure 7 (a) shows that with the increase of the network range, the energy balance of the network system will be destroyed, which also causes the life cycle of each routing protocol to decrease significantly with the increase of d, but compared with AUMRP, MTECR, MVECR, and DQAAR have better performance in extending the network life cycle. When the network range is expanded to 500m, its lifetime is still about 30% higher than the worst performing MTECR.
Figure 7 (b) shows the delay performance of each routing protocol as the network range increases, and the time for each routing protocol data packet to reach the sink node gradually increases as the communication distance increases. Among them, MVECR and AUMRP lack the constraints on the delay, which leads to the rapid increase of the delay when the distance increases, and DQAAR reduces the delay through dynamic learning so that the network can obtain good real-time performance. In order to obtain better real-time performance, MTECR reduces the number of hops of data packet forwarding in the network, which greatly increases the energy consumption and shortens the network life.
Figure 7 (c) shows the comprehensive energy efficiency coefficients of each protocol.
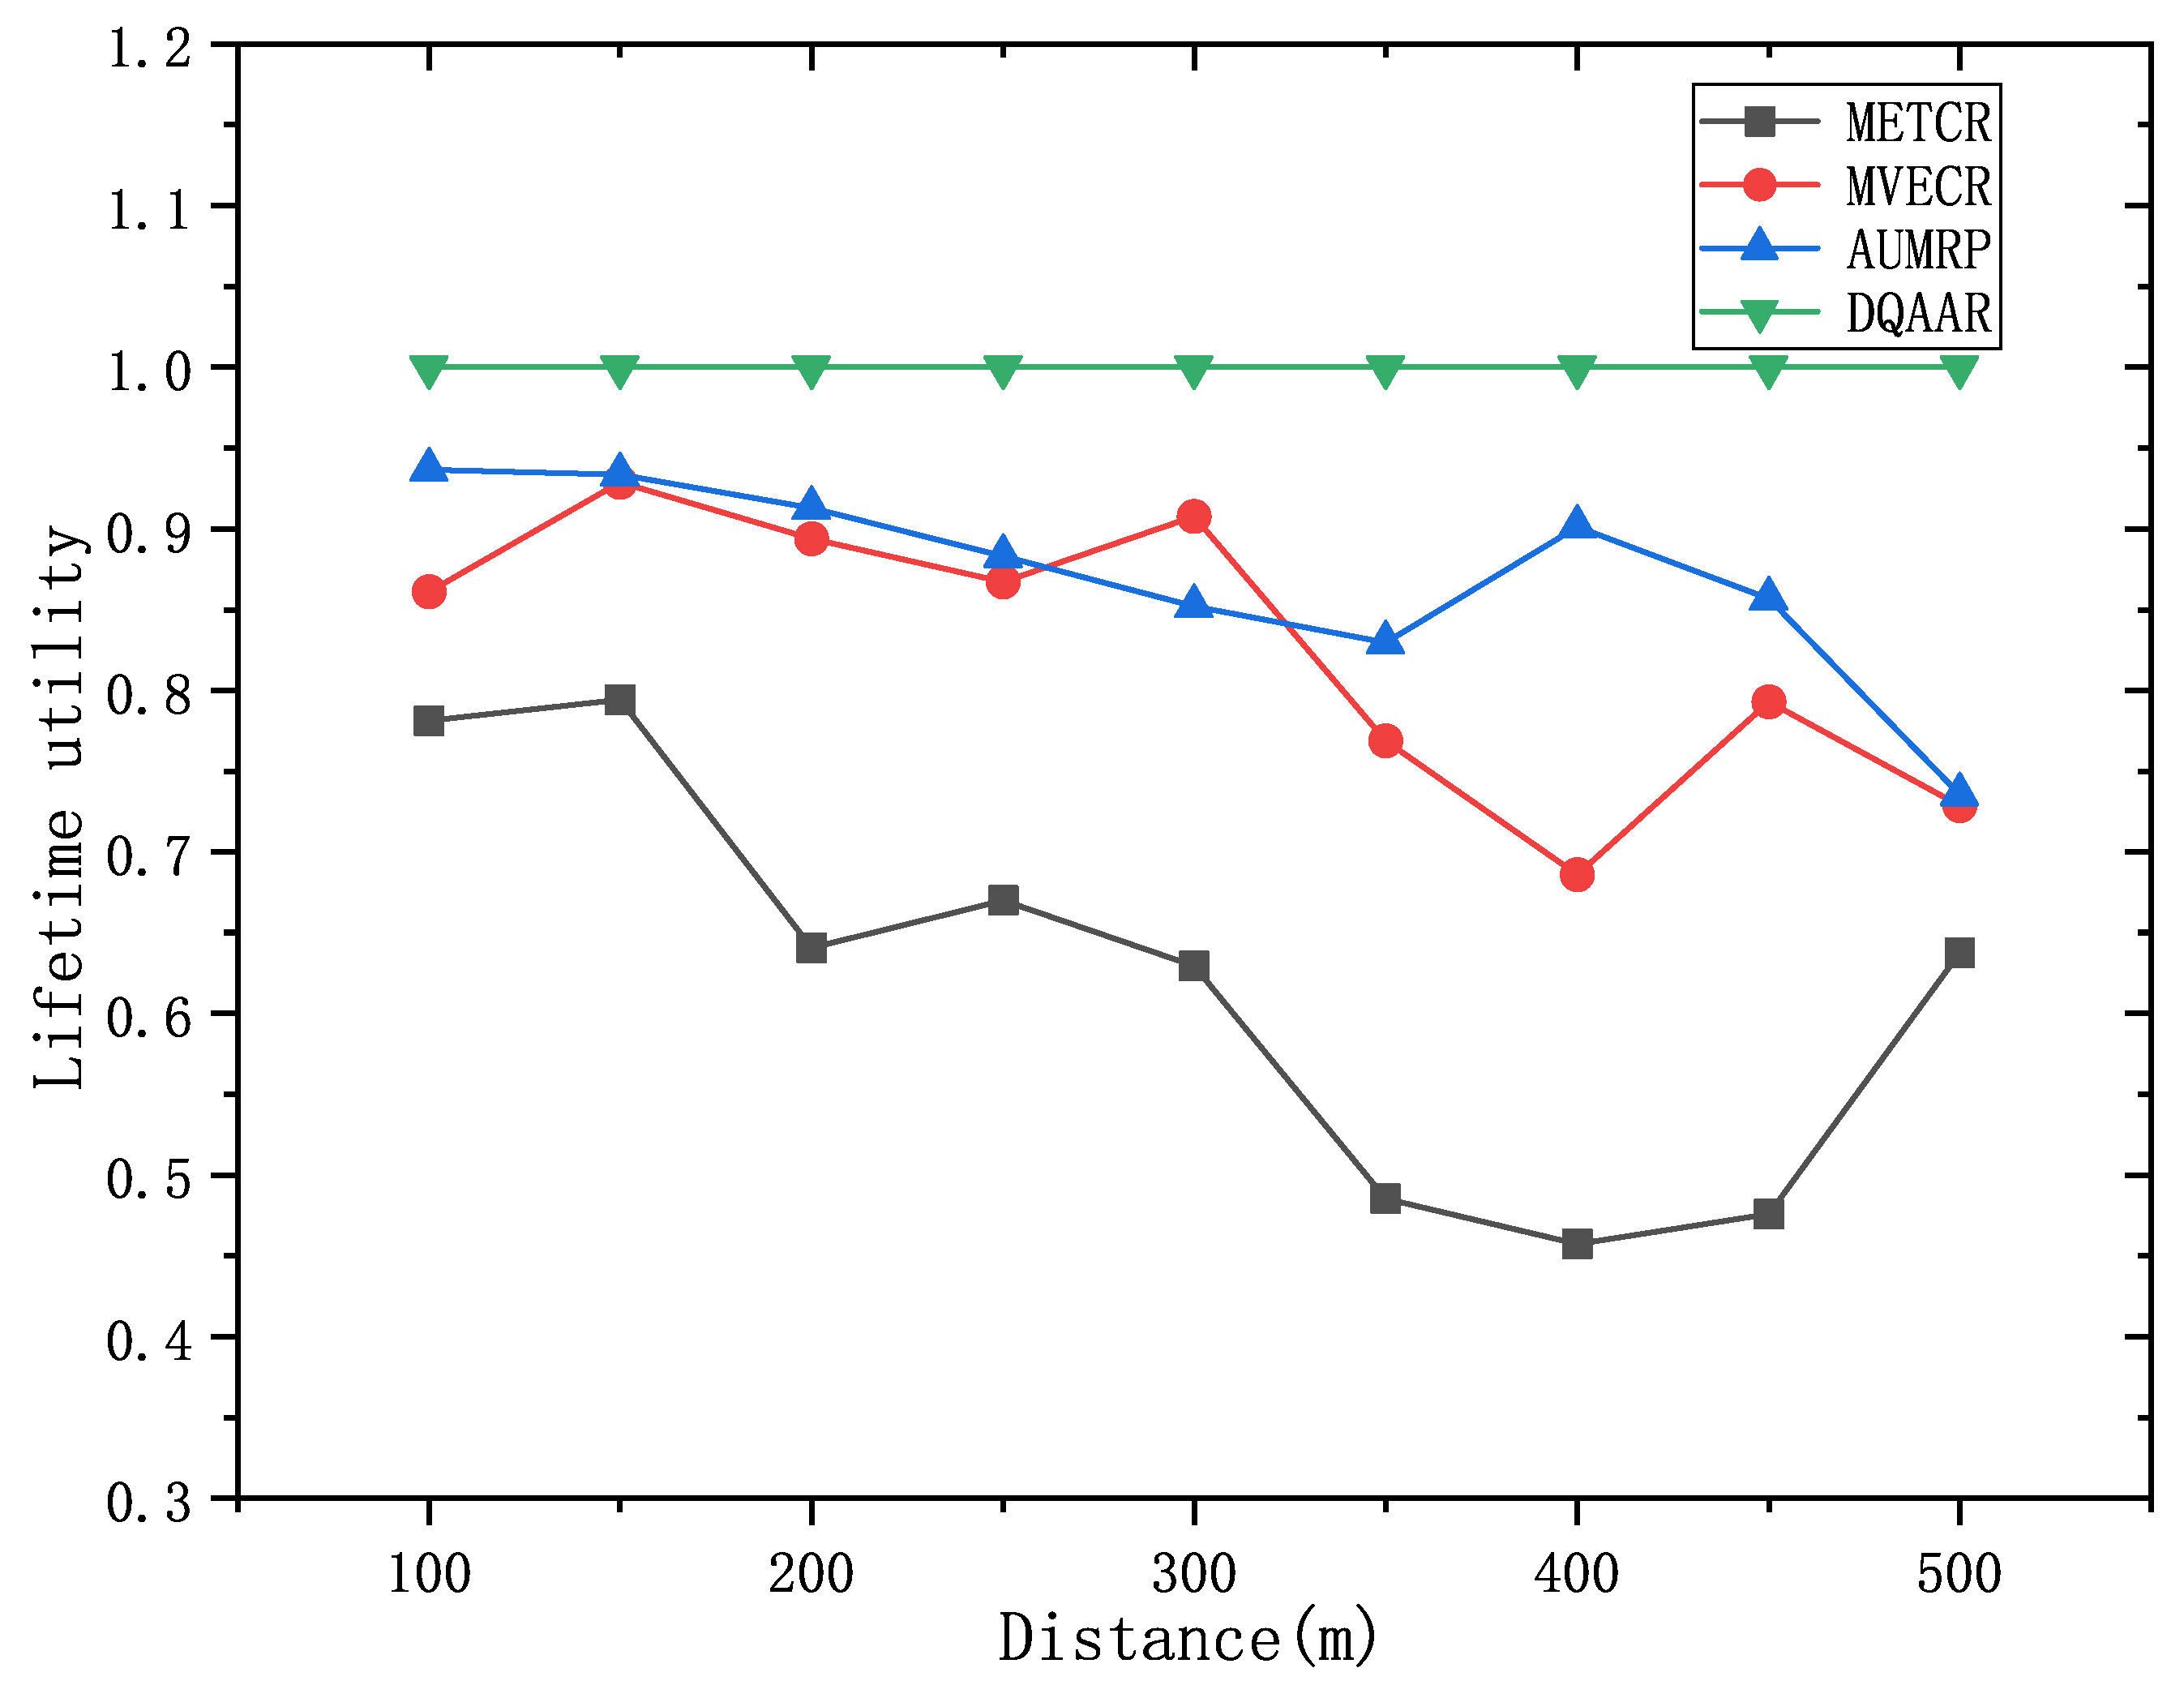
Obviously, the DQAAR proposed in this paper is ahead of AUMRP, MTECR, and MVECR in terms of comprehensive energy efficiency. When the network range is small, the life cycle of AUMRP and MVECR is close to that of DQAAR, and their comprehensive energy efficiency is also close to that of DQAAR. The life cycle index and delay index of the network system using each protocol are shown in
Figure 8 and
Figure 9.
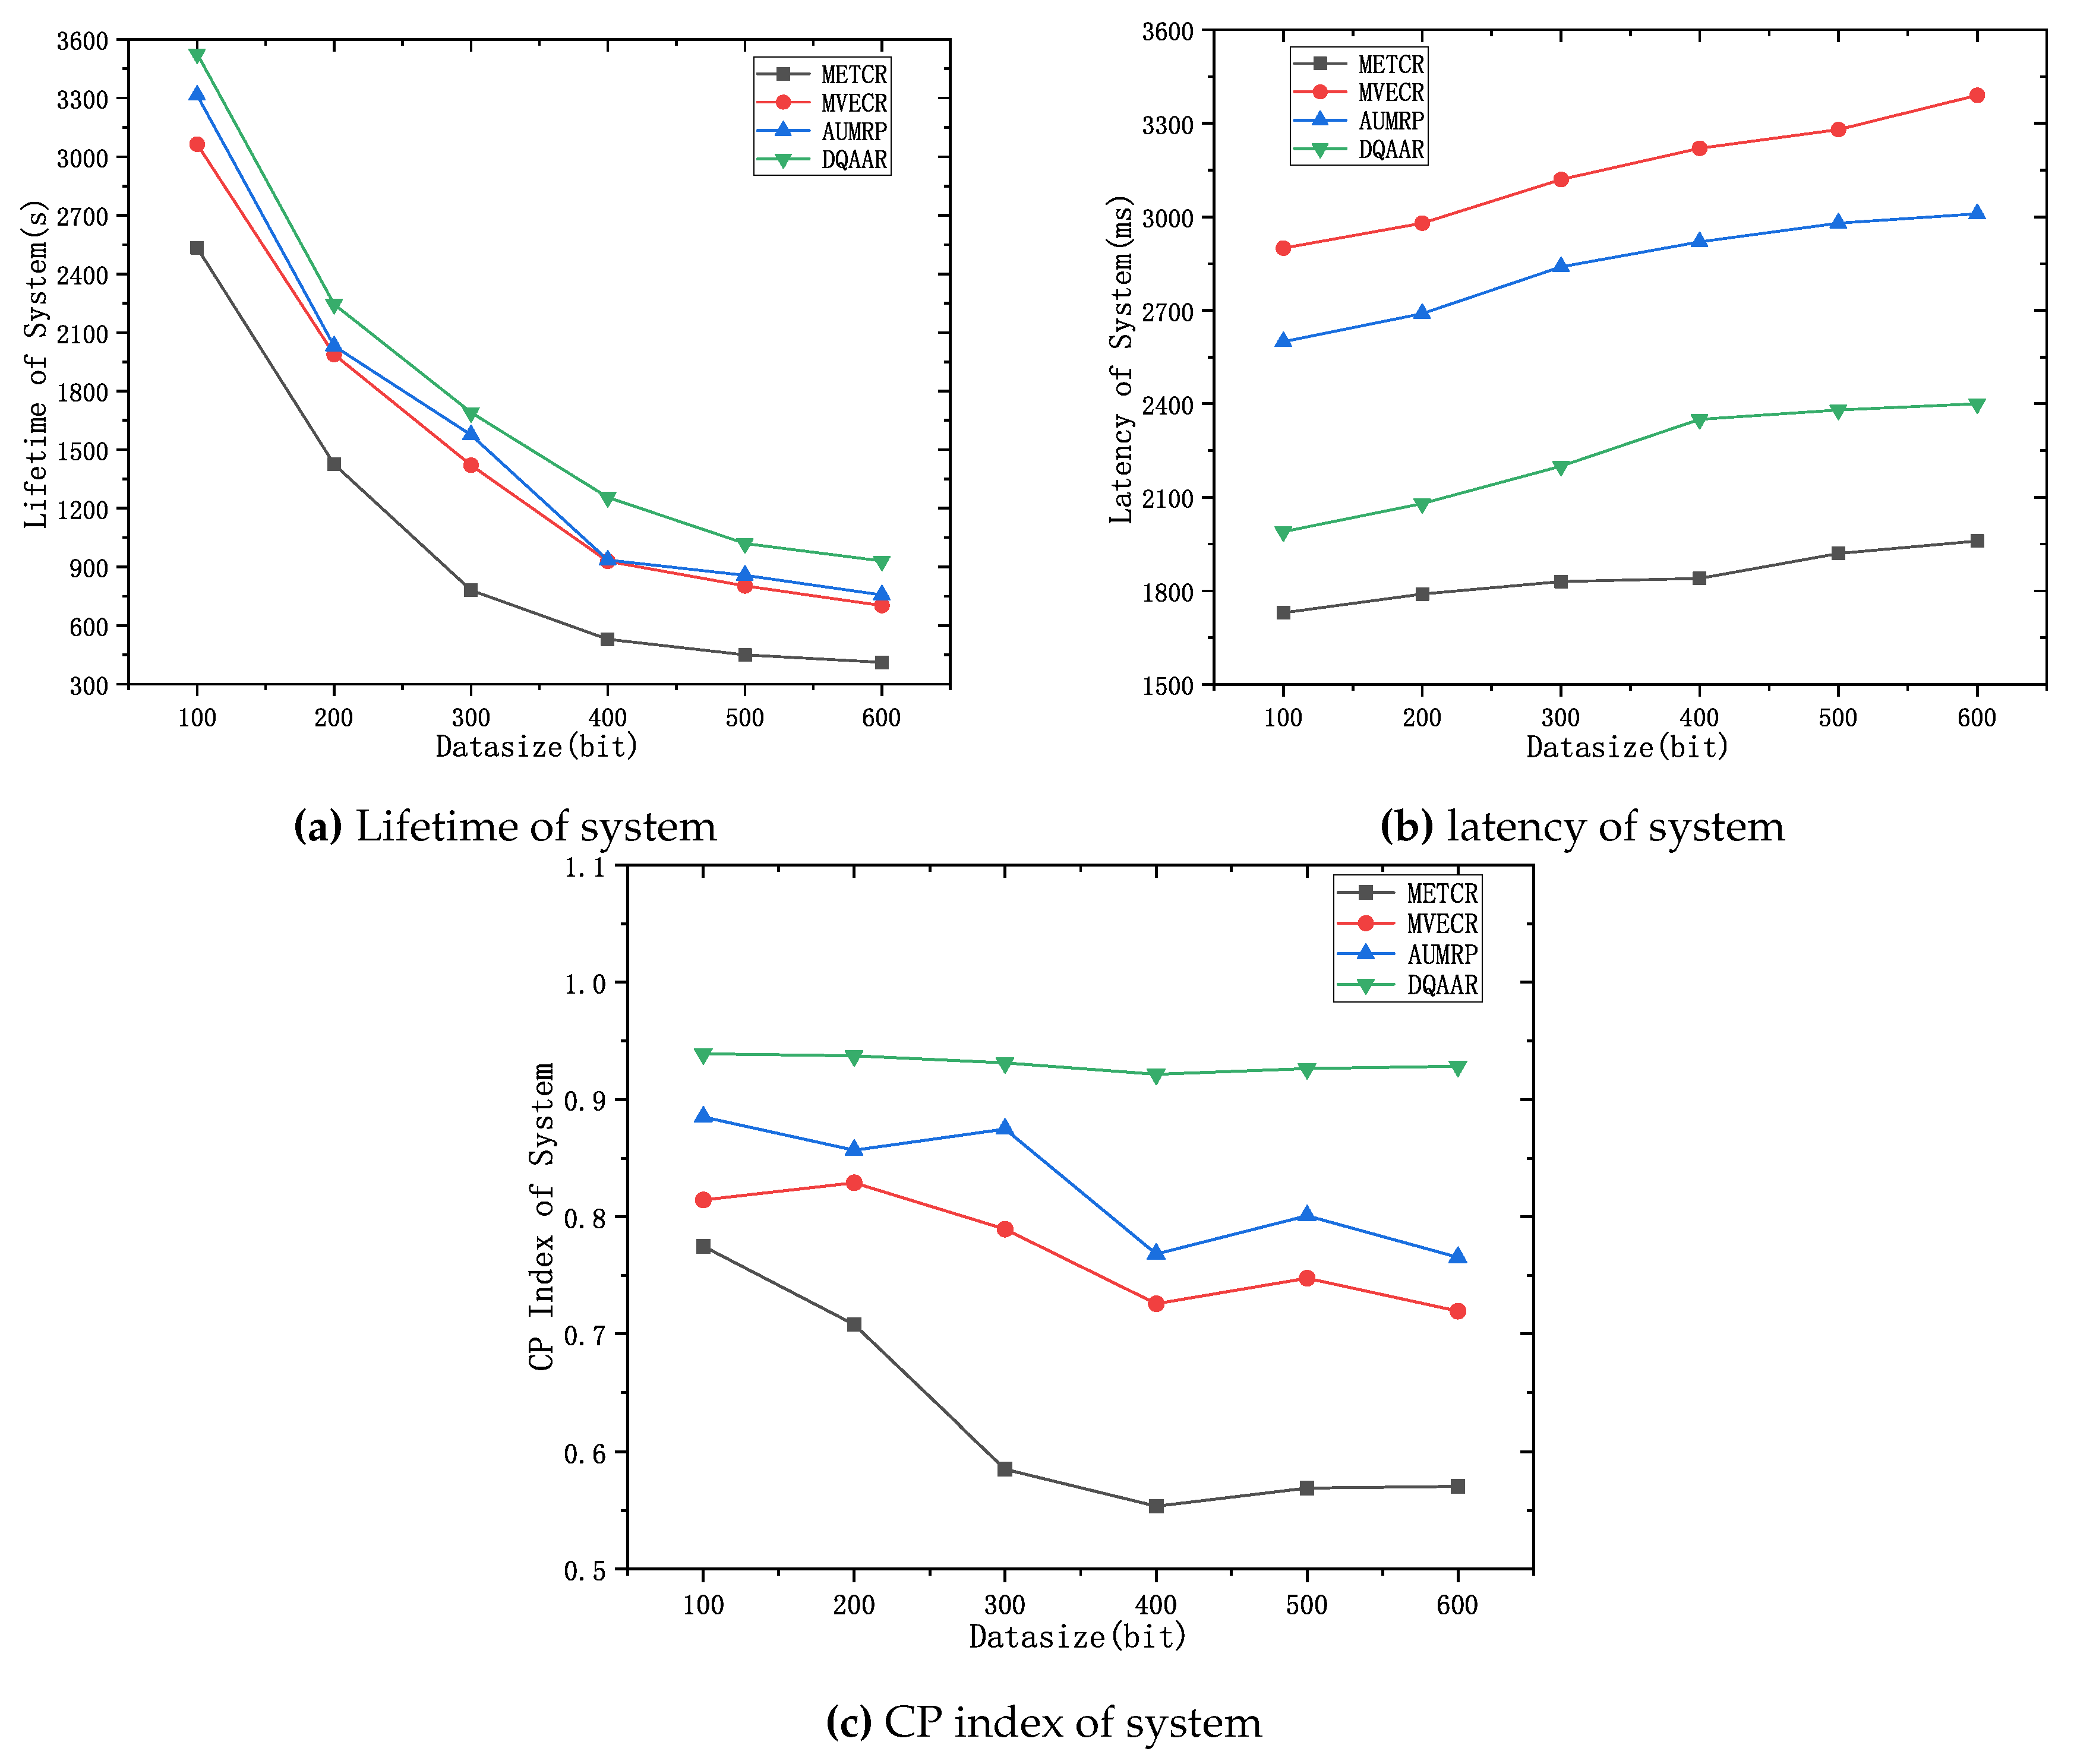
Case 2 verifies the impact of changes in the amount of data in the network on its performance and the performance of the four routing protocols. Among them, the network range is d=200 m.
Figure 10 shows the network life cycle, delay and comprehensive energy efficiency level of the DQAAR proposed in this paper and the other three routing protocols (AUMRP, MVECR, and METCR) when the single data packet size of the network node changes from Data=100bit to Data=600bit. As shown in
Figure 10(a), an increase in the amount of data in the network is accompanied by a rapid decrease in its life cycle, because the sending and receiving of data consumes the most energy in sensor nodes. MVECTR pays too much attention to the energy consumption balance of each node in the network, but it increases its total energy consumption, and the life cycle has a disadvantage compared with AUMRP. DQAAR’s transmission path planning based on data aggregation effectively reduces the amount of data in the network and thus prolongs the life cycle of the network, and its performance is higher than the other three routing protocols. The delay of the network system using DQAAR is smaller than AUMRP and MVECR but slightly larger than MTECR, and the delay increases with the increase of data volume, which is caused by the increase in transmission time caused by the increase in data volume. Data latency increases. Also, as the amount of data increases, the trend of delay growth for DQAAR is not as fast as it is for AUMRP and MVECR. This shows that the data transmission delay is reduced enough by the data aggregation strategy used in this paper to make up for the time it takes to aggregate the data. It can be seen from
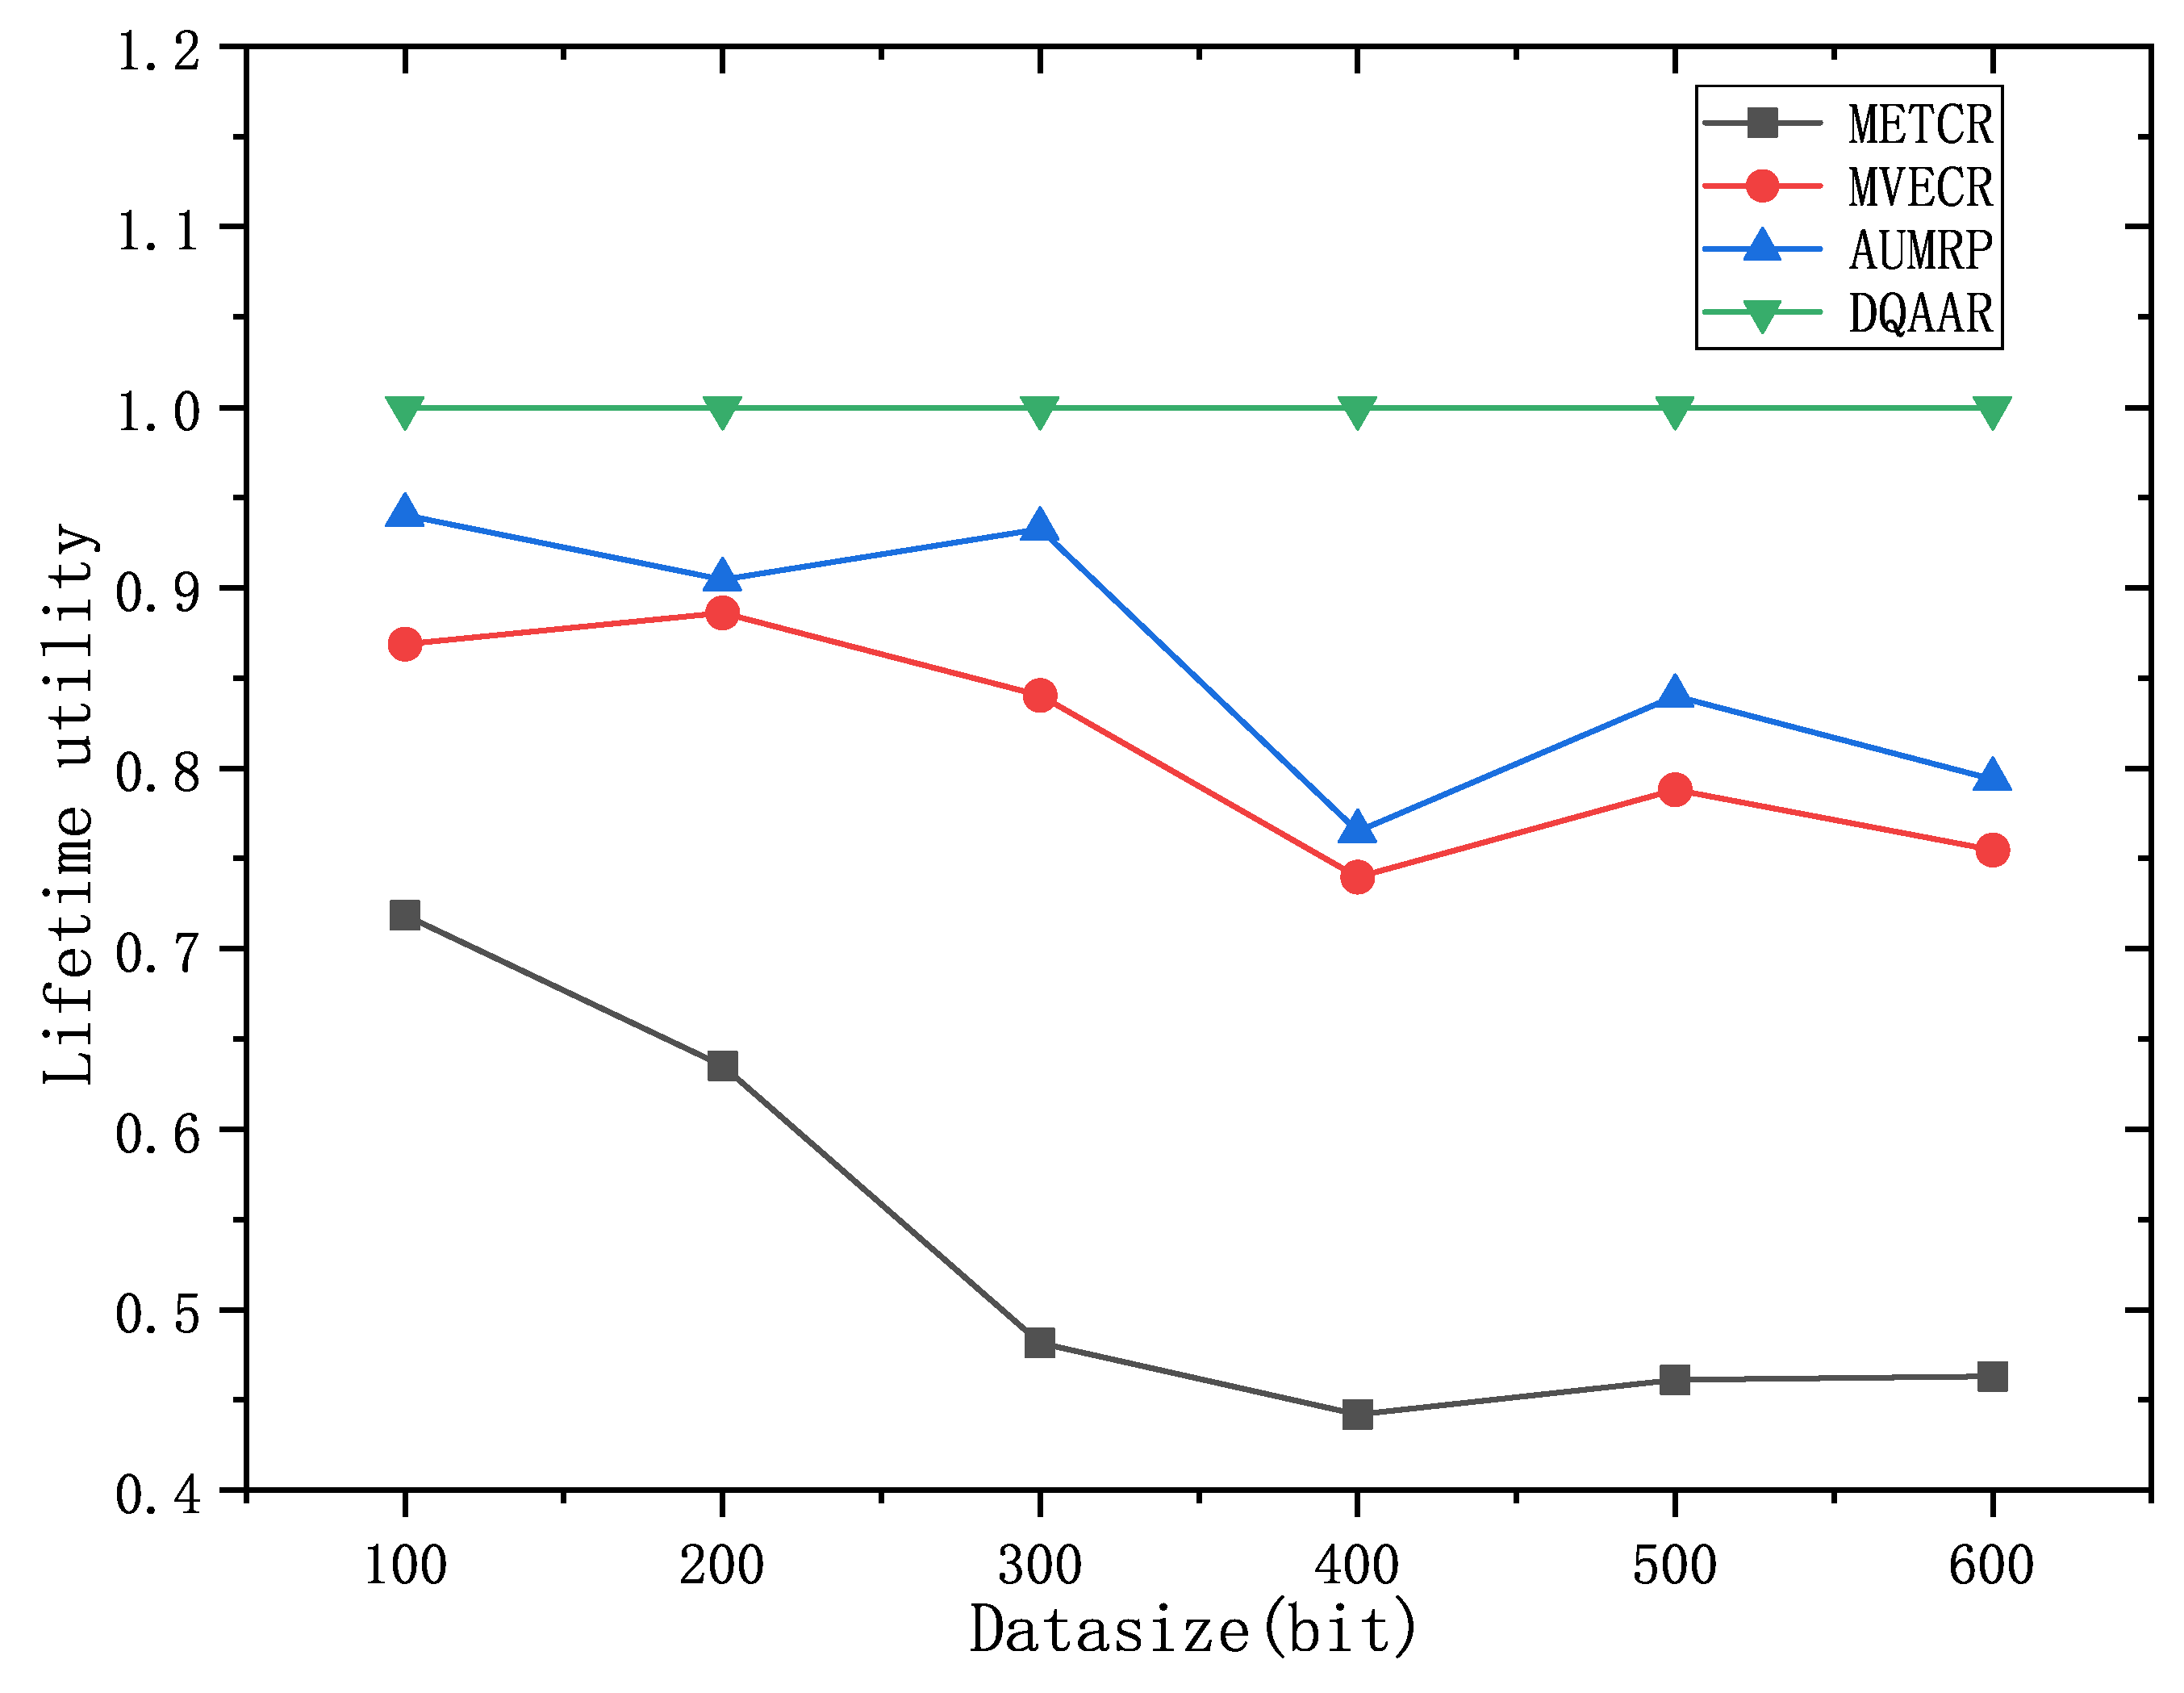
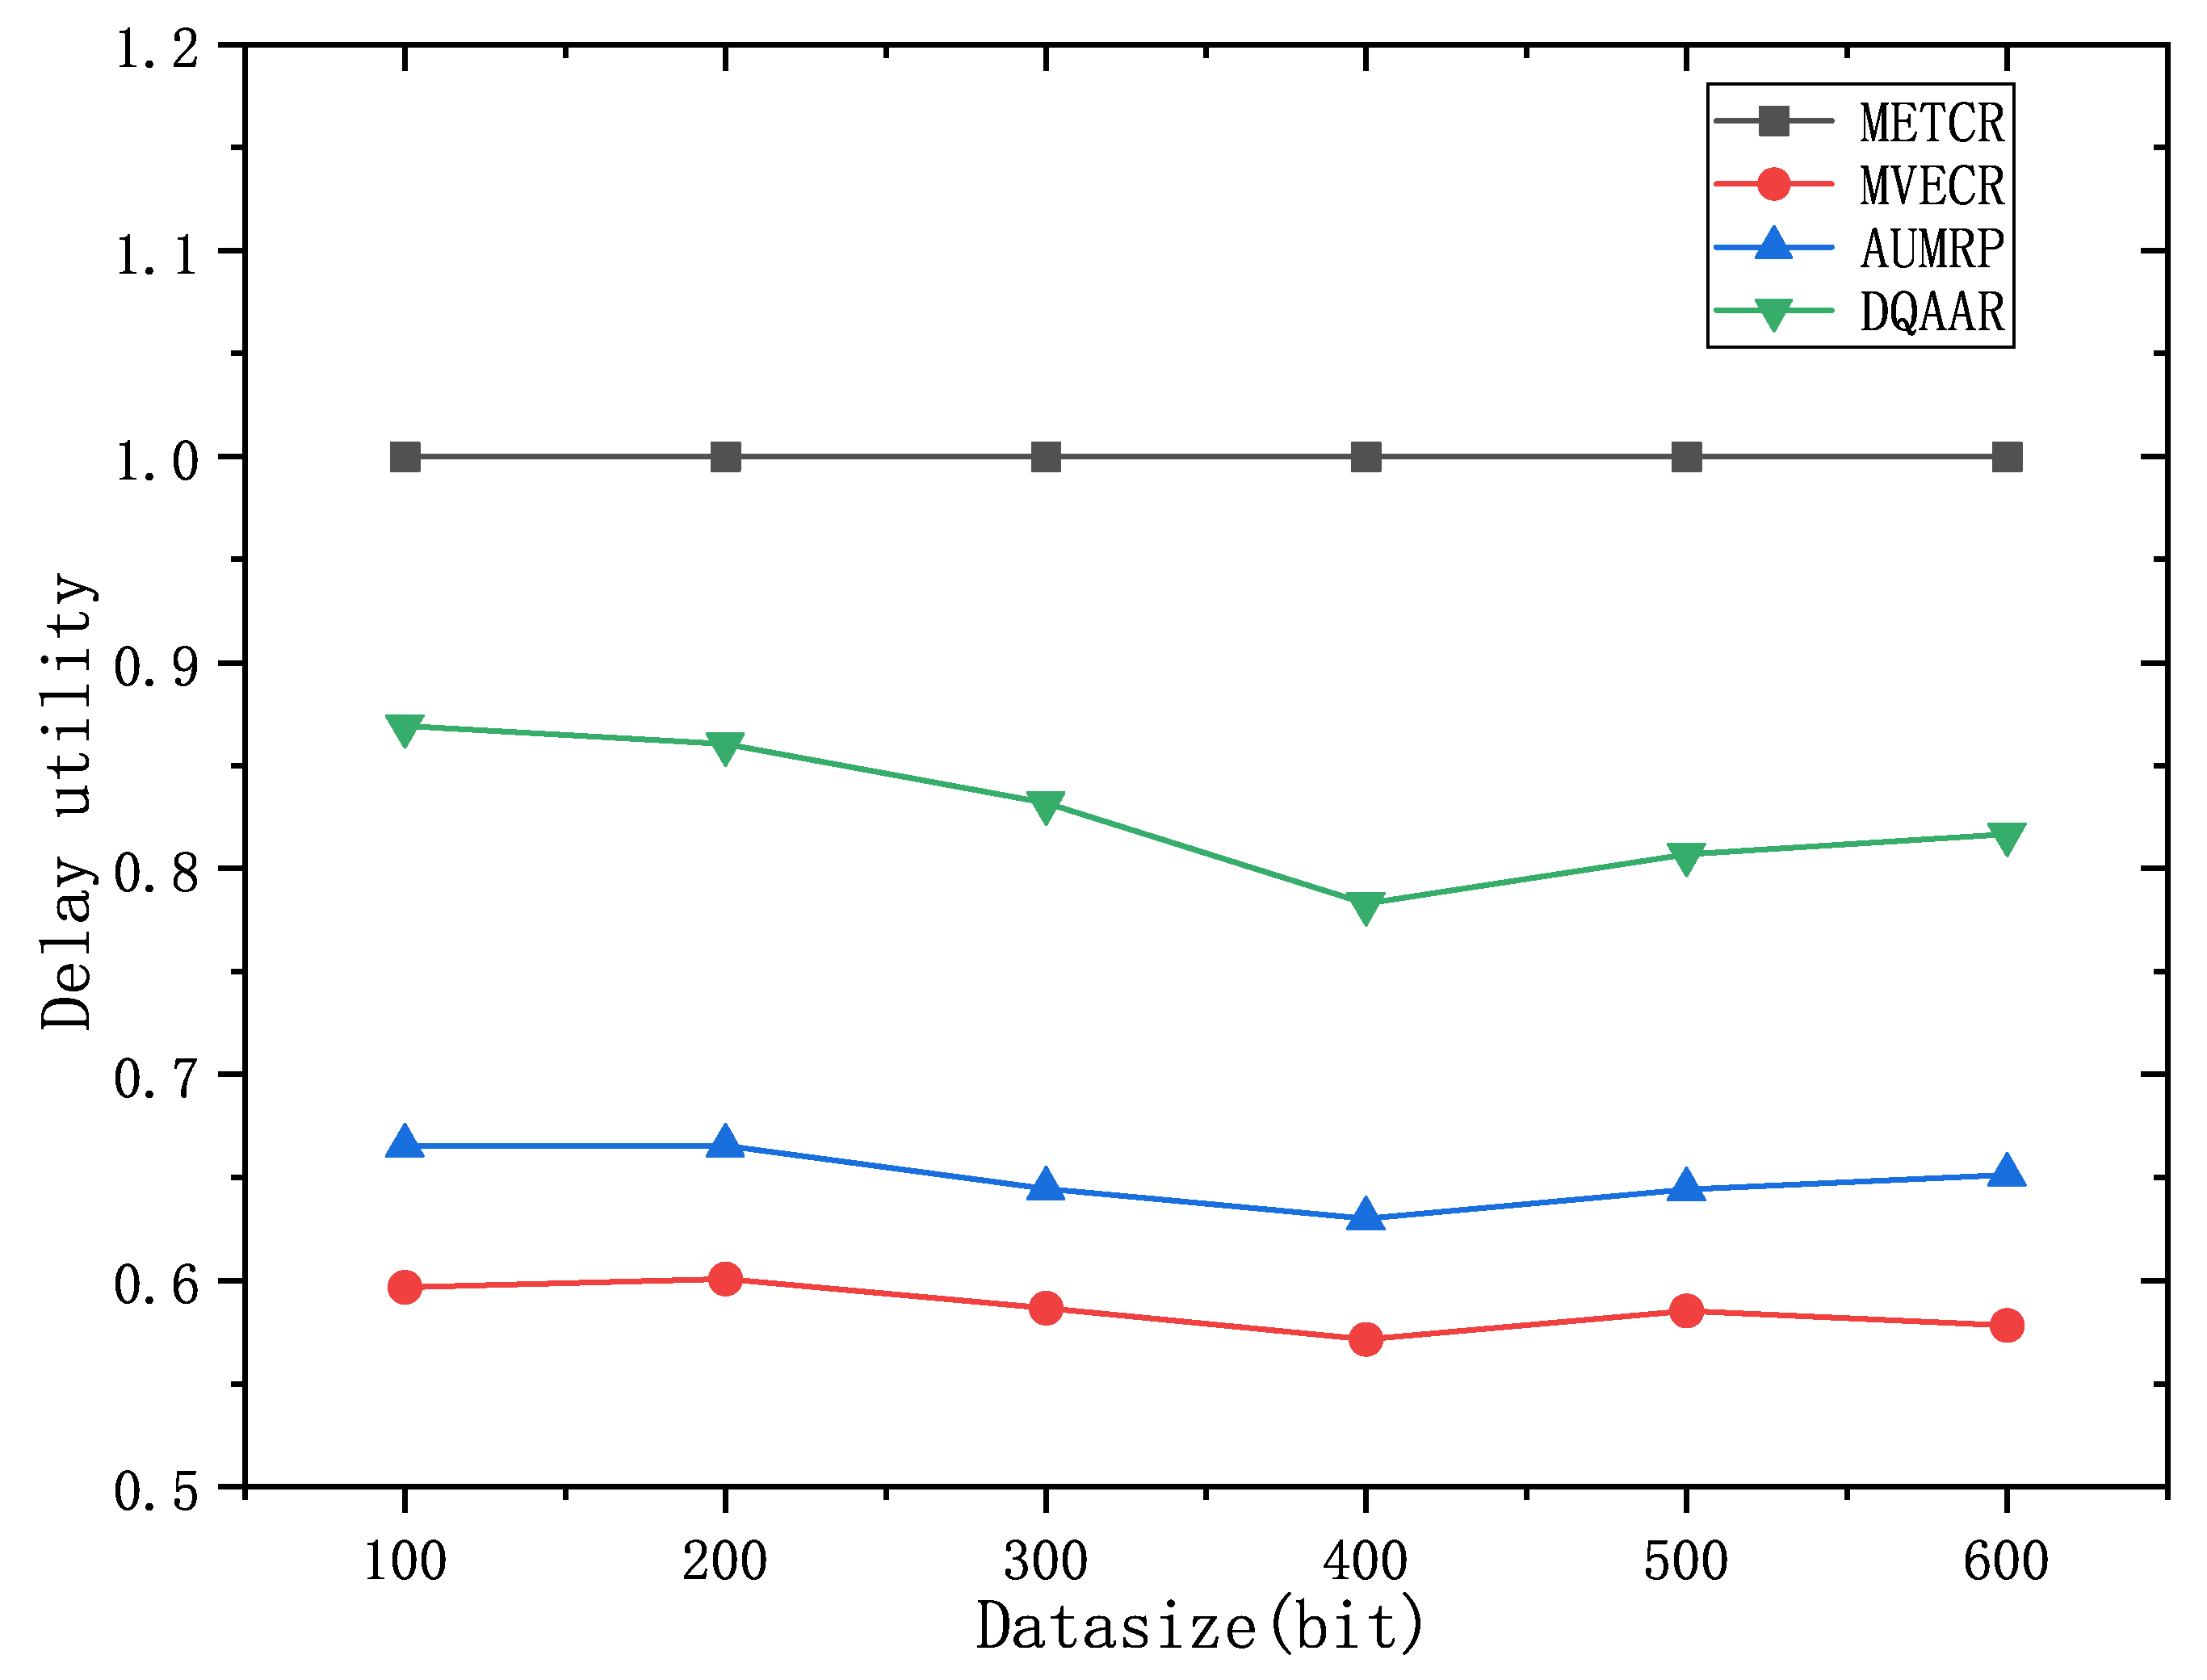
Figure 10 (c) that DQAAR can effectively reduce the amount of data when the amount of data in the network increases, while the delay does not cause a significant change. Its comprehensive energy efficiency is much greater than the other three routing protocols, and the network system life The cycle and delay maintain stable performance with the increase of data volume.The lifetime index and delay index of the network system using each protocol are shown in
Figure 11 and
Figure 12.
Finally, the simulation verification results can be summarized into the following three points:
1) Compared with AUMRP, the life of the network system using DQAAR has been improved to a certain extent, and both MVECR and MTECR have been improved to a certain extent, which effectively prolongs the dead time of the first node in the network system. It ensures the balance of network energy consumption and allows nodes with heavy loads in the network to survive longer when the energy level is low to ensure the monitoring quality of the network.
2) In the high-speed railway monitoring system, the life cycle of the network and the delay of data transmission are both important performance indicators, and the single-objective network optimization algorithm is difficult to meet the actual needs. The adaptive routing algorithm based on double Q-values proposed in this paper can effectively improve the network life and obtain good real-time performance. The comprehensive energy efficiency index is used to evaluate the routing protocol and verify the superiority of DQAAR in these two aspects.
3) The design of the adaptive operator and Q-value in this paper comes from the business requirements of each sensor in the high-speed railway monitoring network system. In different application scenarios, the adaptive operator and Q-value can be designed differently. This ensures the multi-scene adaptability of the adaptive model based on double Q-values established in this paper.
6. Conclusion
In this paper, we propose a DoubleQ-values-based adaptive routing algorithm (DQAAR) for the business requirements of high-speed railway monitoring network systems. The proposed method is different from most of the existing methods and has the following contributions:
First, we propose a DoubleQ-values model based on data aggregation. For the two Q values, we consider the data aggregation degree, the remaining energy level, the link strength, the distance from the node to the sink, and the forwarding delay to consider the network lifetime and the real-time performance of data forwarding. The defined reward function can track the network’s changes in real time and keep the whole thing under control with less work.
Second, an adaptive weight is proposed based on the different requirements of each service for network lifetime and real-time performance. This makes the algorithm proposed in this paper better able to adapt to different situations.
Finally, the algorithm proposed in this paper is verified in different scenarios. The results show that DQAAR is better than AUMRP and MVECR in achieving network energy balance and prolonging network life, and its real-time performance is also better than these two routing protocols. Compared with MTECR, although the routing protocol proposed in this paper is slightly insufficient in real-time performance, it is far better than it in extending network life. From the point of view of overall energy efficiency, the DQAAR that is proposed in this paper is a lot better than other routing protocols.
Author Contributions
Conceptualization, W.F.; methodology, Q.P. and C.H.; software, Q.P.;formal analysis, W.F.; investigation, Q.P. and C.H.; data curation, Q.P.; writing—original draft preparation, Q.P. and C.H.; writing—review and editing, W.F.; visualization, S.T.;project administration, W.F. ; funding acquisition, W.F. All authors have read and agreed to the published version of the manuscript.
Funding
This research was funded by the National Key R&D Program of China(2021YFB3203200).
Data Availability Statement
The data presented in this study are available in the article.
Acknowledgments
Here, I would like to express my special gratitude to Prof. Shihua Tong for his valuable feedback on paper editing.
Conflicts of Interest
The authors declare no conflict of interest.
Appendix A
Table A1.
Existing methods and their characteristics.
Table A1.
Existing methods and their characteristics.
| Projects |
Description |
Contribution |
Structure |
| Routing Protocol to Minimize Total Network Energy Consumption(MTECR) |
Reducing the energy consumption in the network by reducing the number of data forwarding hops |
Transmission of data with the minimum number of hops reduces forwarding energy consumption and transmission delay |
Linear network structure |
| Minimize variance of network energy consumption(MVECR) |
Minimize the energy consumption variance of each node in the network to achieve the purpose of improving the network lifetime |
Minimizing the variance of energy consumption balances the energy consumption of each node in the network and increases the network lifetime |
Linear network structure |
| Adaptive Optimization of Multi-Hop Communication Protocol(AUMRP) |
Control the transmission power of each node and minimize the energy consumption of the node to achieve the purpose of improving the life of the network |
Constrains the maximum energy consumption of nodes in the network, so that the energy of nodes is preserved and the life of the network is improved |
Linear network structure |
| Hybrid Energy Efficient Distributed Cluster (HEEDR) |
The cluster head is selected based on the remaining energy of the node and the cost of its communication |
The residual energy-based strategy is used in both intra-cluster communication and inter-cluster head communication, improving network lifetime |
Mesh network structure |
| Distributed Energy Efficient Cluster Routing Protocol (DEECR) |
A routing protocol for heterogeneous networks is proposed, which selects cluster heads based on the ratio of remaining energy to the average energy level of the network |
The strategy of selecting cluster heads by residual energy and average energy level successfully improves the energy efficiency of the network |
Mesh network structure |
| Energy Efficient Unequal Clustering Routing Protocol (UDCHR) |
Inhomogeneous clustering and dual-cluster head techniques are used to solve hotspot problems, and a hybrid rotation strategy based on node time and energy is also proposed to reduce energy consumption |
Mitigates hotspot issues in the network with Rotational Forwarding |
Mesh network structure |
| Energy Efficient Cluster Head Selection Routing Protocol (EECHS) |
Select a node in each cluster to monitor the total energy level of the network, and dynamically transmit data to the cluster head according to the remaining energy of the node |
Use one node to maintain global network information, reducing the delay of data transmission in the network |
Mesh network structure |
| Energy saving distributed scheduling algorithm (CLU-DDAS) |
An energy-efficient distributed scheduling algorithm based on a novel cluster aggregation tree is proposed to minimize delay |
Reduced data transfer delays in the network while singing network longevity |
Tree network structure |
Table A2.
Monitoring objects and characteristics.
Table A2.
Monitoring objects and characteristics.
| Monitoring objects |
Sensor type |
Life cycle demands |
Real-time demands |
| Longitudinal stress of steel rail |
Ultrasonic sensor |
high |
low |
| Rail deformation |
Deformation sensor |
high |
low |
| Rail integrity |
Ultrasonic sensor |
medium |
medium |
| Rail wear |
Video monitoring |
low |
low |
| Track switch extension pitch adjuster |
Fiber grating strain sensor |
high |
high |
| Rail stiffness |
Rail inspection car |
low |
low |
| Foreign body contamination limit |
Video monitoring |
high |
high |
| Track foundation submerges |
Leica total station monitoring system |
medium |
low |
| Track slope condition |
Laser laser scanner and fiber grating strain sensor |
medium |
medium |
| Lead power supply system |
Infrared temperature sensor, fire detector, temperature and humidity sensor |
high |
high |
| Bow net service state |
Acceleration sensor, ratchet deviation Angle sensor,Cable clip temperature sensor |
high |
high |
| Suspension tension, elasticity and vibration |
Tension measurement sensor, wire vibration sensor, elastic measurement sensor |
medium |
medium |
| Pantograph image recognition |
Image and Video Signal Processing |
high |
high |
| Geological disasters |
Seismic detector, landslide detection |
low |
low |
| Meteorological disaster |
Laser monitoring equipment, video and image processing |
low |
high |
| Meteorological watch |
Temperature sensor and humidity sensor |
high |
high |
References
- Zhang, D.; Li, G.; Zheng, K.; Ming, X.; Pan, Z.-H. An Energy-Balanced Routing Method Based on Forward-Aware Factor for Wireless Sensor Networks. IEEE Transactions on Industrial Informatics 2014, 10, 766–773. [Google Scholar] [CrossRef]
- Paine, B.M.; Polmanter, S.R.; Ng, V.T.; Kubota, N.T.; Ignacio, C.R. Lifetesting GaN HEMTs With Multiple Degradation Mechanisms. IEEE Transactions on Device and Materials Reliability 2015, 15, 486–494. [Google Scholar] [CrossRef]
- Kuawattanaphan, R.; Champrasert, P.; Aramkul, S. A Novel Heterogeneous Wireless Sensor Node Deployment Algorithm With Parameter-Free Configuration. IEEE Access 2018, 6, 44951–44969. [Google Scholar] [CrossRef]
- Li, X.; Liu, W.; Xie, M.; Liu, A.; Zhao, M.; Xiong, N.N.; Zhao, M.; Dai, W. Differentiated Data Aggregation Routing Scheme for Energy Conserving and Delay Sensitive Wireless Sensor Networks. Sensors 2018, 18, 2349. [Google Scholar] [CrossRef]
- Ma, X.; Dong, H.; Liu, X.; Jia, L.; Xie, G.; Bian, Z. An Optimal Communications Protocol for Maximizing Lifetime of Railway Infrastructure Wireless Monitoring Network. IEEE Transactions on Industrial Informatics 2018, 14, 3347–3357. [Google Scholar] [CrossRef]
- Lin, J.; Ma, L.; Cui, J. A frequency-domain convolutional neural network architecture based on the frequency-domain randomized offset rectified linear unit and frequency-domain chunk max pooling method. IEEE Access 2020, 8, 98126–98155. [Google Scholar] [CrossRef]
- Zhang, J.; Hu, P.; Xie, F.; Long, J.; He, A. An Energy Efficient and Reliable In-Network Data Aggregation Scheme for WSN. IEEE Access 2018, 6, 71857–71870. [Google Scholar] [CrossRef]
- Aslam, N.; Xia, K.; Hadi, M.U. Optimal Wireless Charging Inclusive of Intellectual Routing Based on SARSA Learning in Renewable Wireless Sensor Networks. IEEE Sensors Journal 2019, 19, 8340–8351. [Google Scholar] [CrossRef]
- Kaur, M.; Munjal, A. Data aggregation algorithms for wireless sensor network: A review. Ad Hoc Networks 2020, 100, 102083. [Google Scholar] [CrossRef]
- Li, Z.; Liu, Y.; Liu, A.; Wang, S.; Liu, H. Minimizing Convergecast Time and Energy Consumption in Green Internet of Things. IEEE Transactions on Emerging Topics in Computing 2020, 8, 797–813. [Google Scholar] [CrossRef]
- Shobana, M.; Sabitha, R.; Karthik, S. Cluster-Based Systematic Data Aggregation Model (CSDAM) for Real-Time Data Processing in Large-Scale WSN. Wireless Personal Communications 2020 117, 2865–2883. [CrossRef]
- Ullah, I.; Youn, H.Y. Efficient data aggregation with node clustering and extreme learning machine for WSN. The Journal of Supercomputing 2020, 76, 10009–10035. [Google Scholar] [CrossRef]
- Zhang, J.; Lin, Z.; Tsai, P.W.; Xu, L. Entropy-driven data aggregation method for energy-efficient wireless sensor networks. Information Fusion 2020, 56, 103–113. [Google Scholar] [CrossRef]
- Guo, Z.; Peng, J.; Xu, W.; Liang, W.; Wu, W.; Xu, Z.; Guo, B.; Wu, Y.-L. Minimizing Redundant Sensing Data Transmissions in Energy-Harvesting Sensor Networks via Exploring Spatial Data Correlations. IEEE Internet of Things Journal 2021, 8, 512–527. [Google Scholar] [CrossRef]
- Jaradat, Y.; Masoud, M.; Al-Jazzar, S.; Alia, M. Optimal network dimensions for energy conservation in clustered 3D WSN. Wireless Networks 2021, 27, 1821–1833. [Google Scholar] [CrossRef]
- Jasim, A.A.; Idris, M.Y.I.; Razalli Bin Azzuhri, S.; Issa, N.R.; Rahman, M.T.; Khyasudeen, M.F.B. Energy-Efficient Wireless Sensor Network with an Unequal Clustering Protocol Based on a Balanced Energy Method (EEUCB). Sensors 2021, 21, 784. [Google Scholar] [CrossRef]
- Kathiroli, P.; Kanmani, S. An efficient cluster-based routing using Sparrow Search Algorithm for heterogeneous nodes in Wireless Sensor Networks. 2021 International Conference on Communication information and Computing Technology (ICCICT), Mumbai, India, 25-27 June 2021; pp. 1–6. [Google Scholar]
- Ketshabetswe, K.L.; Zungeru, A.M.; Mtengi, B.; Lebekwe, C.K.; Prabaharan, S.R.S. Data Compression Algorithms for Wireless Sensor Networks: A Review and Comparison. IEEE Access 2021, 9, 136872–136891. [Google Scholar] [CrossRef]
- Khisa, S.; Moh, S. Survey on Recent Advancements in Energy-Efficient Routing Protocols for Underwater Wireless Sensor Networks. IEEE Access 2021, 9, 55045–55062. [Google Scholar] [CrossRef]
- Li, A.; Liu, W.; Zeng, L.; Fa, C.; Tan, Y. An Efficient Data Aggregation Scheme Based on Differentiated Threshold Configuring Joint Optimal Relay Selection in WSNs. IEEE Access 2021, 9, 19254–19269. [Google Scholar] [CrossRef]
- Liu, B.; Yang, R.; Xu, M.; Zhou, J. A Chaotic Elite Niche Evolutionary Algorithm for Low-Power Clustering in Environment Monitoring Wireless Sensor Networks. Journal of Sensors 2021, 2021, 1–12. [Google Scholar] [CrossRef]
- Liu, X.; Yu, J.; Zhang, W.; Tian, H. Low-energy dynamic clustering scheme for multi-layer wireless sensor networks. Computers & Electrical Engineering 2021, 91, 107093. [Google Scholar]
- Maivizhi, R.; Yogesh, P. Q-learning based routing for in-network aggregation in wireless sensor networks. Wireless Networks 2021, 27, 2231–2250. [Google Scholar] [CrossRef]
- Nguyen, P.D.; Kim, L.W. Sensor System: A Survey of Sensor Type, Ad Hoc Network Topology and Energy Harvesting Techniques. Electronics 2021, 10, 219. [Google Scholar] [CrossRef]
- Nikseresht, M.R.; Mollamotalebi, M. Providing a CoAP-based technique to get wireless sensor data via IoT gateway. Computer Communications 2021, 172, 155–168. [Google Scholar] [CrossRef]
- Osamy, W.; Salim, A.; Khedr, A.M.; El-Sawy, A.A. IDCT: Intelligent Data Collection Technique for IoT-Enabled Heterogeneous Wireless Sensor Networks in Smart Environments. IEEE Sensors Journal 2021, 21, 21099–21112. [Google Scholar] [CrossRef]
- Panchal, A.; Singh, R.K. EEHCHR: Energy Efficient Hybrid Clustering and Hierarchical Routing for Wireless Sensor Networks. Ad Hoc Networks 2021, 12, 102692. [Google Scholar] [CrossRef]
- Wang, Y.; Sun, G.; Yang, G.; Ding, X. XgBoosted Neighbor Referring in Low-Duty-Cycle Wireless Sensor Networks. IEEE Internet of Things Journal 2020, 8, 3446–3461. [Google Scholar] [CrossRef]
- Xiao, X.; Zhao, M. Routing optimization strategy of IoT awareness layer based on improved cat swarm algorithm. Neural Computing and Applications 2021, 34, 3311–3322. [Google Scholar] [CrossRef]
- Yao, B.; Gao, H.; Chen, Q.; Li, J. Energy-Adaptive and Bottleneck-Aware Many-to-Many Communication Scheduling for Battery-Free WSNs. IEEE Internet of Things Journal 2020, 8, 8514–8529. [Google Scholar] [CrossRef]
- Yun, W.K.; Yoo, S.J. Q-Learning-Based Data-Aggregation-Aware Energy-Efficient Routing Protocol for Wireless Sensor Networks. IEEE Access 2021, 9, 10737–10750. [Google Scholar] [CrossRef]
- Zaraket, E.; Murad, N.M.; Yazdani, S.S.; Rajaoarisoa, L.; Ravelo, B. An overview on low energy wake-up radio technology: Active and passive circuits associated with MAC and routing protocols. Journal of Network and Computer Applications 2021, 190, 103140. [Google Scholar] [CrossRef]
- Maivizhi, R.; Yogesh, P. Fuzzy routing for in-network aggregation in wireless sensor networks. Peer-to-Peer Networking and Applications 2022, 15, 592–611. [Google Scholar] [CrossRef]
- Zhu, T.; Li, J.; Gao, H.; Li, Y. Data Aggregation Scheduling in Battery-Free Wireless Sensor Networks. IEEE Transactions on Mobile Computing 2022, 21, 1972–1984. [Google Scholar] [CrossRef]
|
Disclaimer/Publisher’s Note: The statements, opinions and data contained in all publications are solely those of the individual author(s) and contributor(s) and not of MDPI and/or the editor(s). MDPI and/or the editor(s) disclaim responsibility for any injury to people or property resulting from any ideas, methods, instructions or products referred to in the content. |
© 2023 by the authors. Licensee MDPI, Basel, Switzerland. This article is an open access article distributed under the terms and conditions of the Creative Commons Attribution (CC BY) license (http://creativecommons.org/licenses/by/4.0/).
