1. Introduction
Taekwondo is a Korean martial art and combat sport, that has been an Olympic discipline since the Sidney (2000) Olympic Games, where kicking skills are crucial for a high motor performance. This combat sport originated in medieval or similar cultures, and today it is primarily a combat activity conditioned by safety rules [
1].
Miluh-chagi is a Taekwondo kicking technique, and can be directed at the opponent’s middle and higher zone. It is a typical Taekwondo push kick but can also score like any other kick. The trajectory follows a linear movement. The foot contact zone, with the target, can be made by the tip of the foot with flexion of the toe, the outside of the foot, and the sole of the foot. Elite athletes successfully use this kick with the front leg and change the target zone, correct the trajectory, needing less time relative to speed for foot motor control, and adjust the foot trajectory earlier than other athletes; and no bilateral difference was found in any of the variables on the knee flexion and extension assessment [
2,
3,
4]. The authors Kim et al., [
5] identified four phases for kicks: Start (A), Toe off (B), Maximum Knee Flexion (C), and Impact (D); and three moments: Push, Lift, and Strike. The authors [
6] identified three phases and six moments: Foot take-off, knee up, contact moment, start leg extension, start leg flexion and thigh extension. The authors Gavacan & Sayers [
7] also describe four phases in the analysis of the kick technical process. The preparation phase was defined as occurring from toe down of the support leg until toe off of the kicking leg. The chamber phase started at the end of the preparation phase and continued until the beginning of knee extension in the kicking leg. The extension phase followed and continued until contact with the target pad. The studies presented by Gavacan et al. (2007) and Barnamehei, et al. (2007) [
7,
8] assert that all this movement must be executed at a high velocity by rapid pelvic axial rotation, hip abduction, hip flexion and knee extension, combined with rapid movements of the center of mass towards the target. In the Taekwondo combat sport, the sporting outcome depends for the most part on the technical perfection of the kick. The athletes’ kicking skills execution is essential for a good performance, seeking a masterly presentation of the martial art [
6].
Taekwondo coaches believe that they have a kind of “eagle eye” and that is why they feel comfortable to analyze athletes’ skills without using essential observational tools. In contrast, O’Donoghue argued that the role of the performance analyst working with coaches and athletes is to help enhance performance through a cycle of observation, analysis, reflection, planning and action. The coach observes the athlete performing the skill and this observation is evaluated by comparing it with the theoretical ideal performance [
9]. The use of fundamental indicators to model performance and establish performance profiling has provided the basis with high applicability for coaching staff to manage performance during training and competition [
10]. Gomez-Ruano et al., (mention Hughes and Franks, 2007) say that the development and implementation of new measurement technologies (e.g., observational video analysis systems) with multiple practical applications have intensified the focus of performance analysis in sport [
10]. Researchers have shown that human observation and memory are not reliable enough to provide accurate and objective information for high-performance athletes. So objective measuring tools using technology are necessary to enable the feedback process [
11].
The aim of this study was to analyze the athletes’ technical indicators during the technical skill implementation of “a cycle of ten kicks” performing one Taekwondo technique namely -
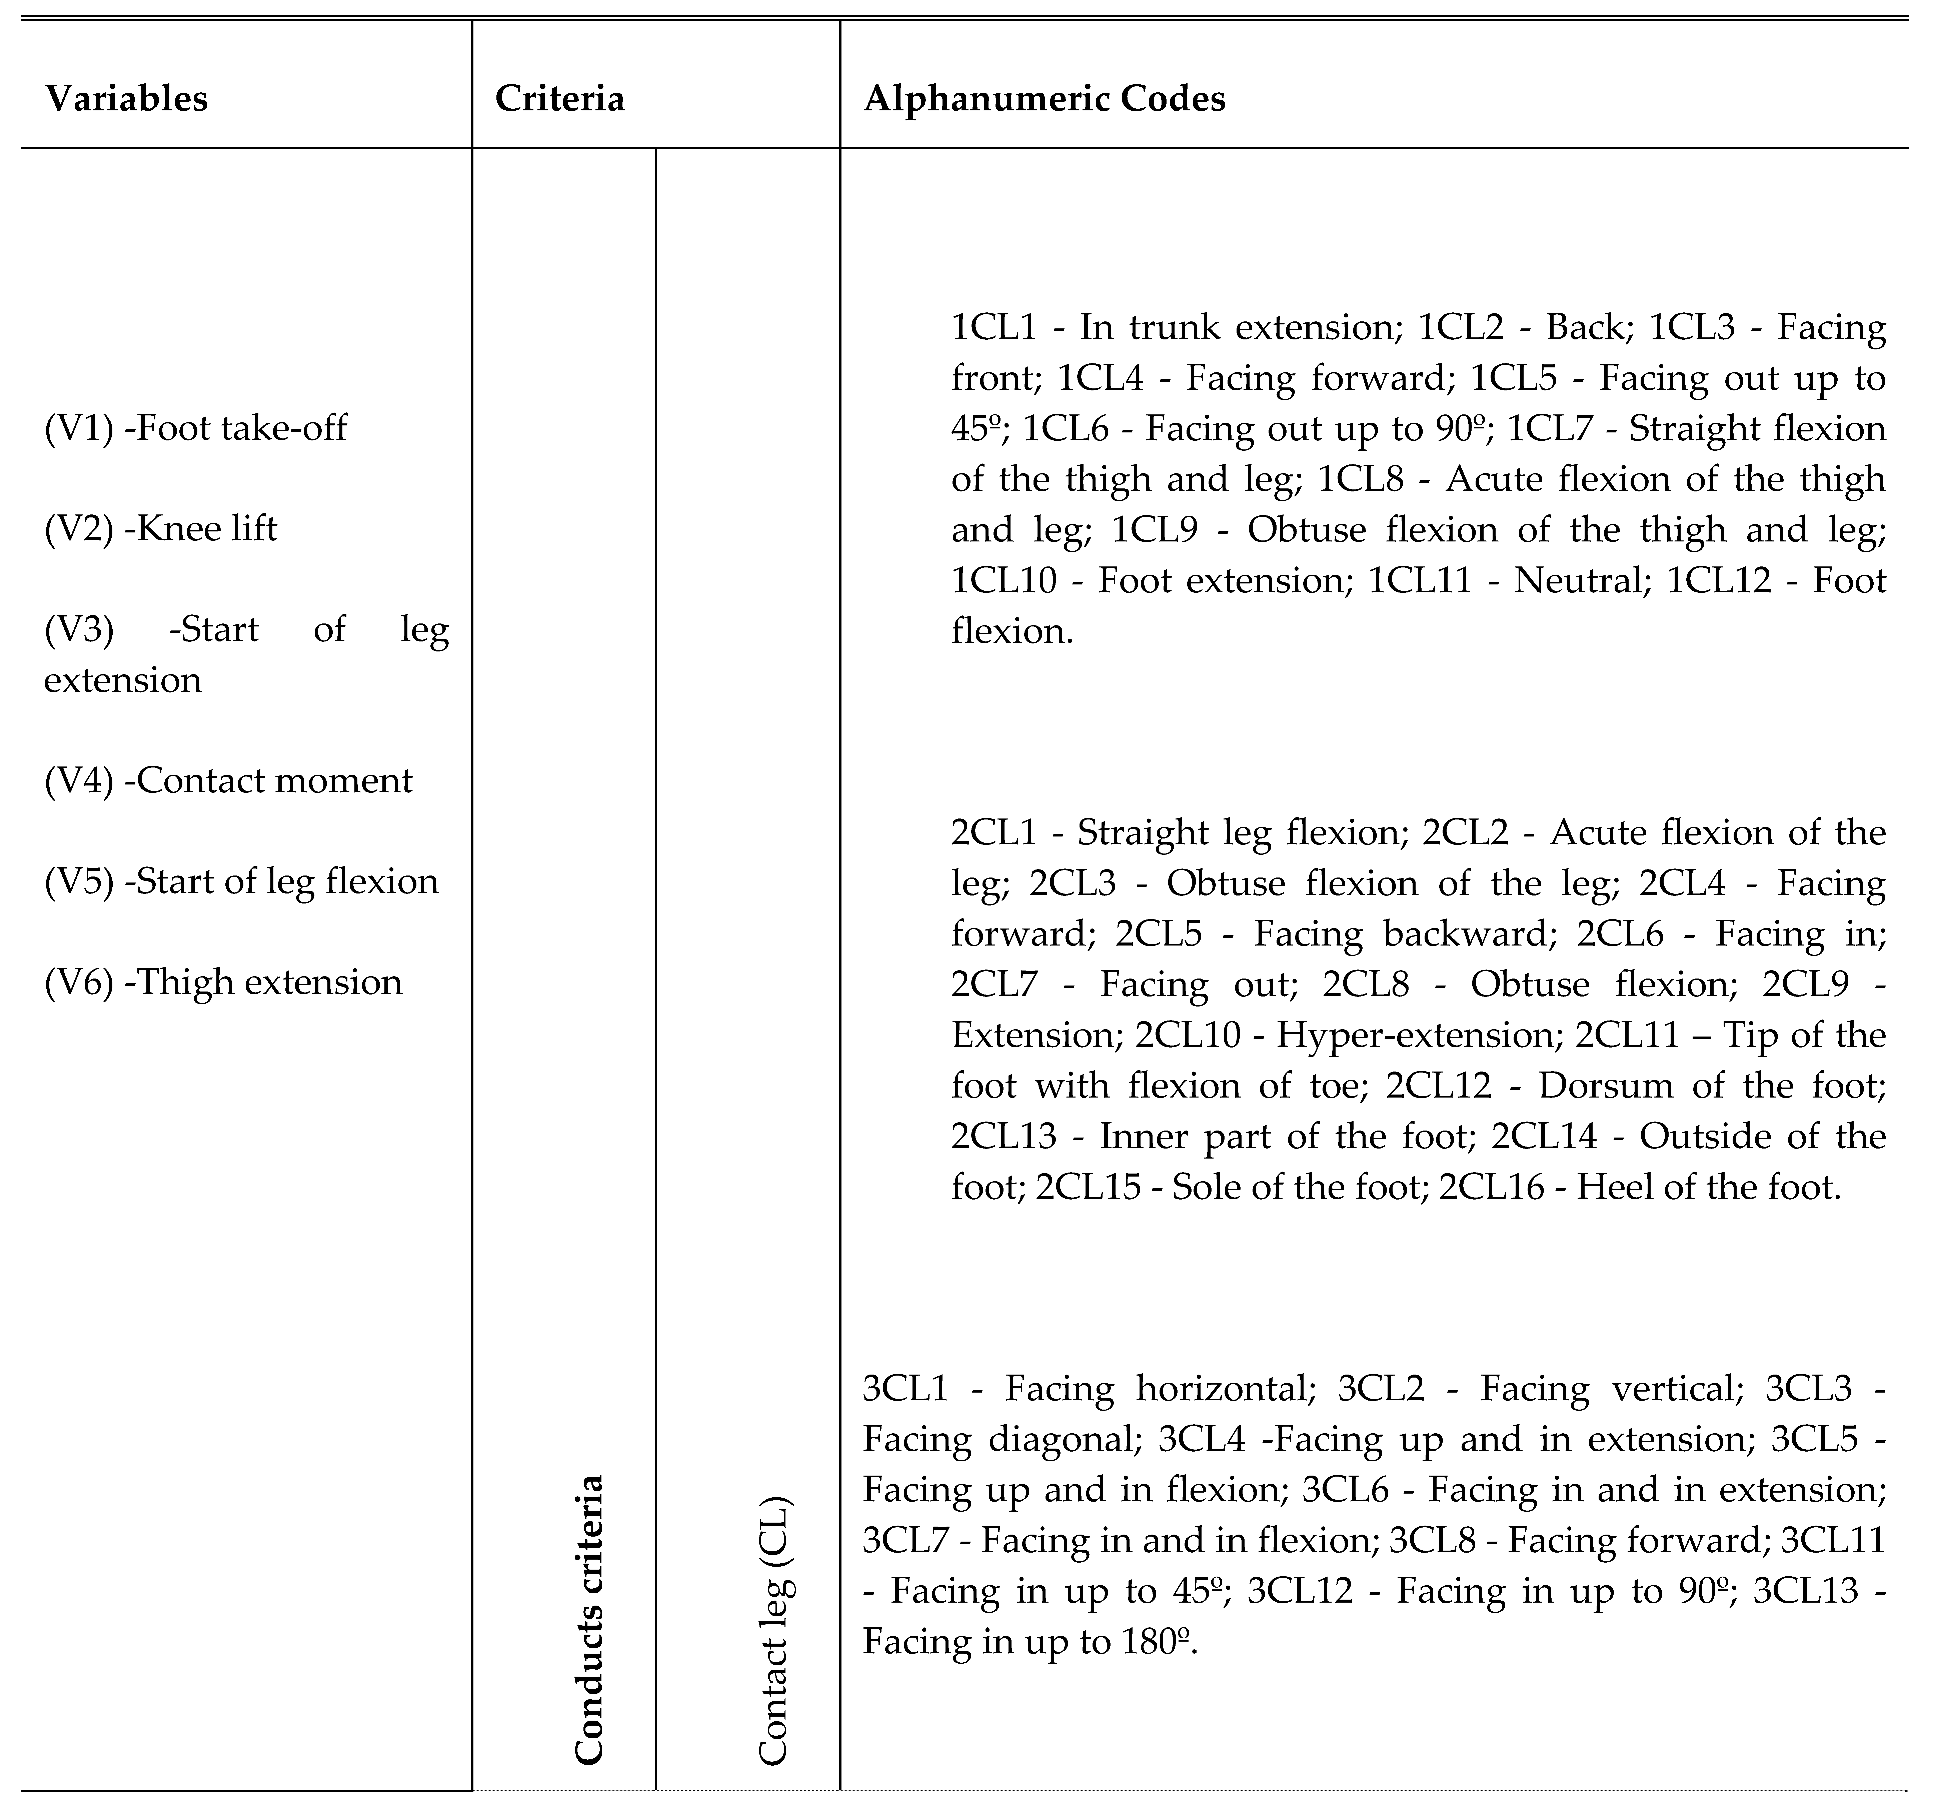
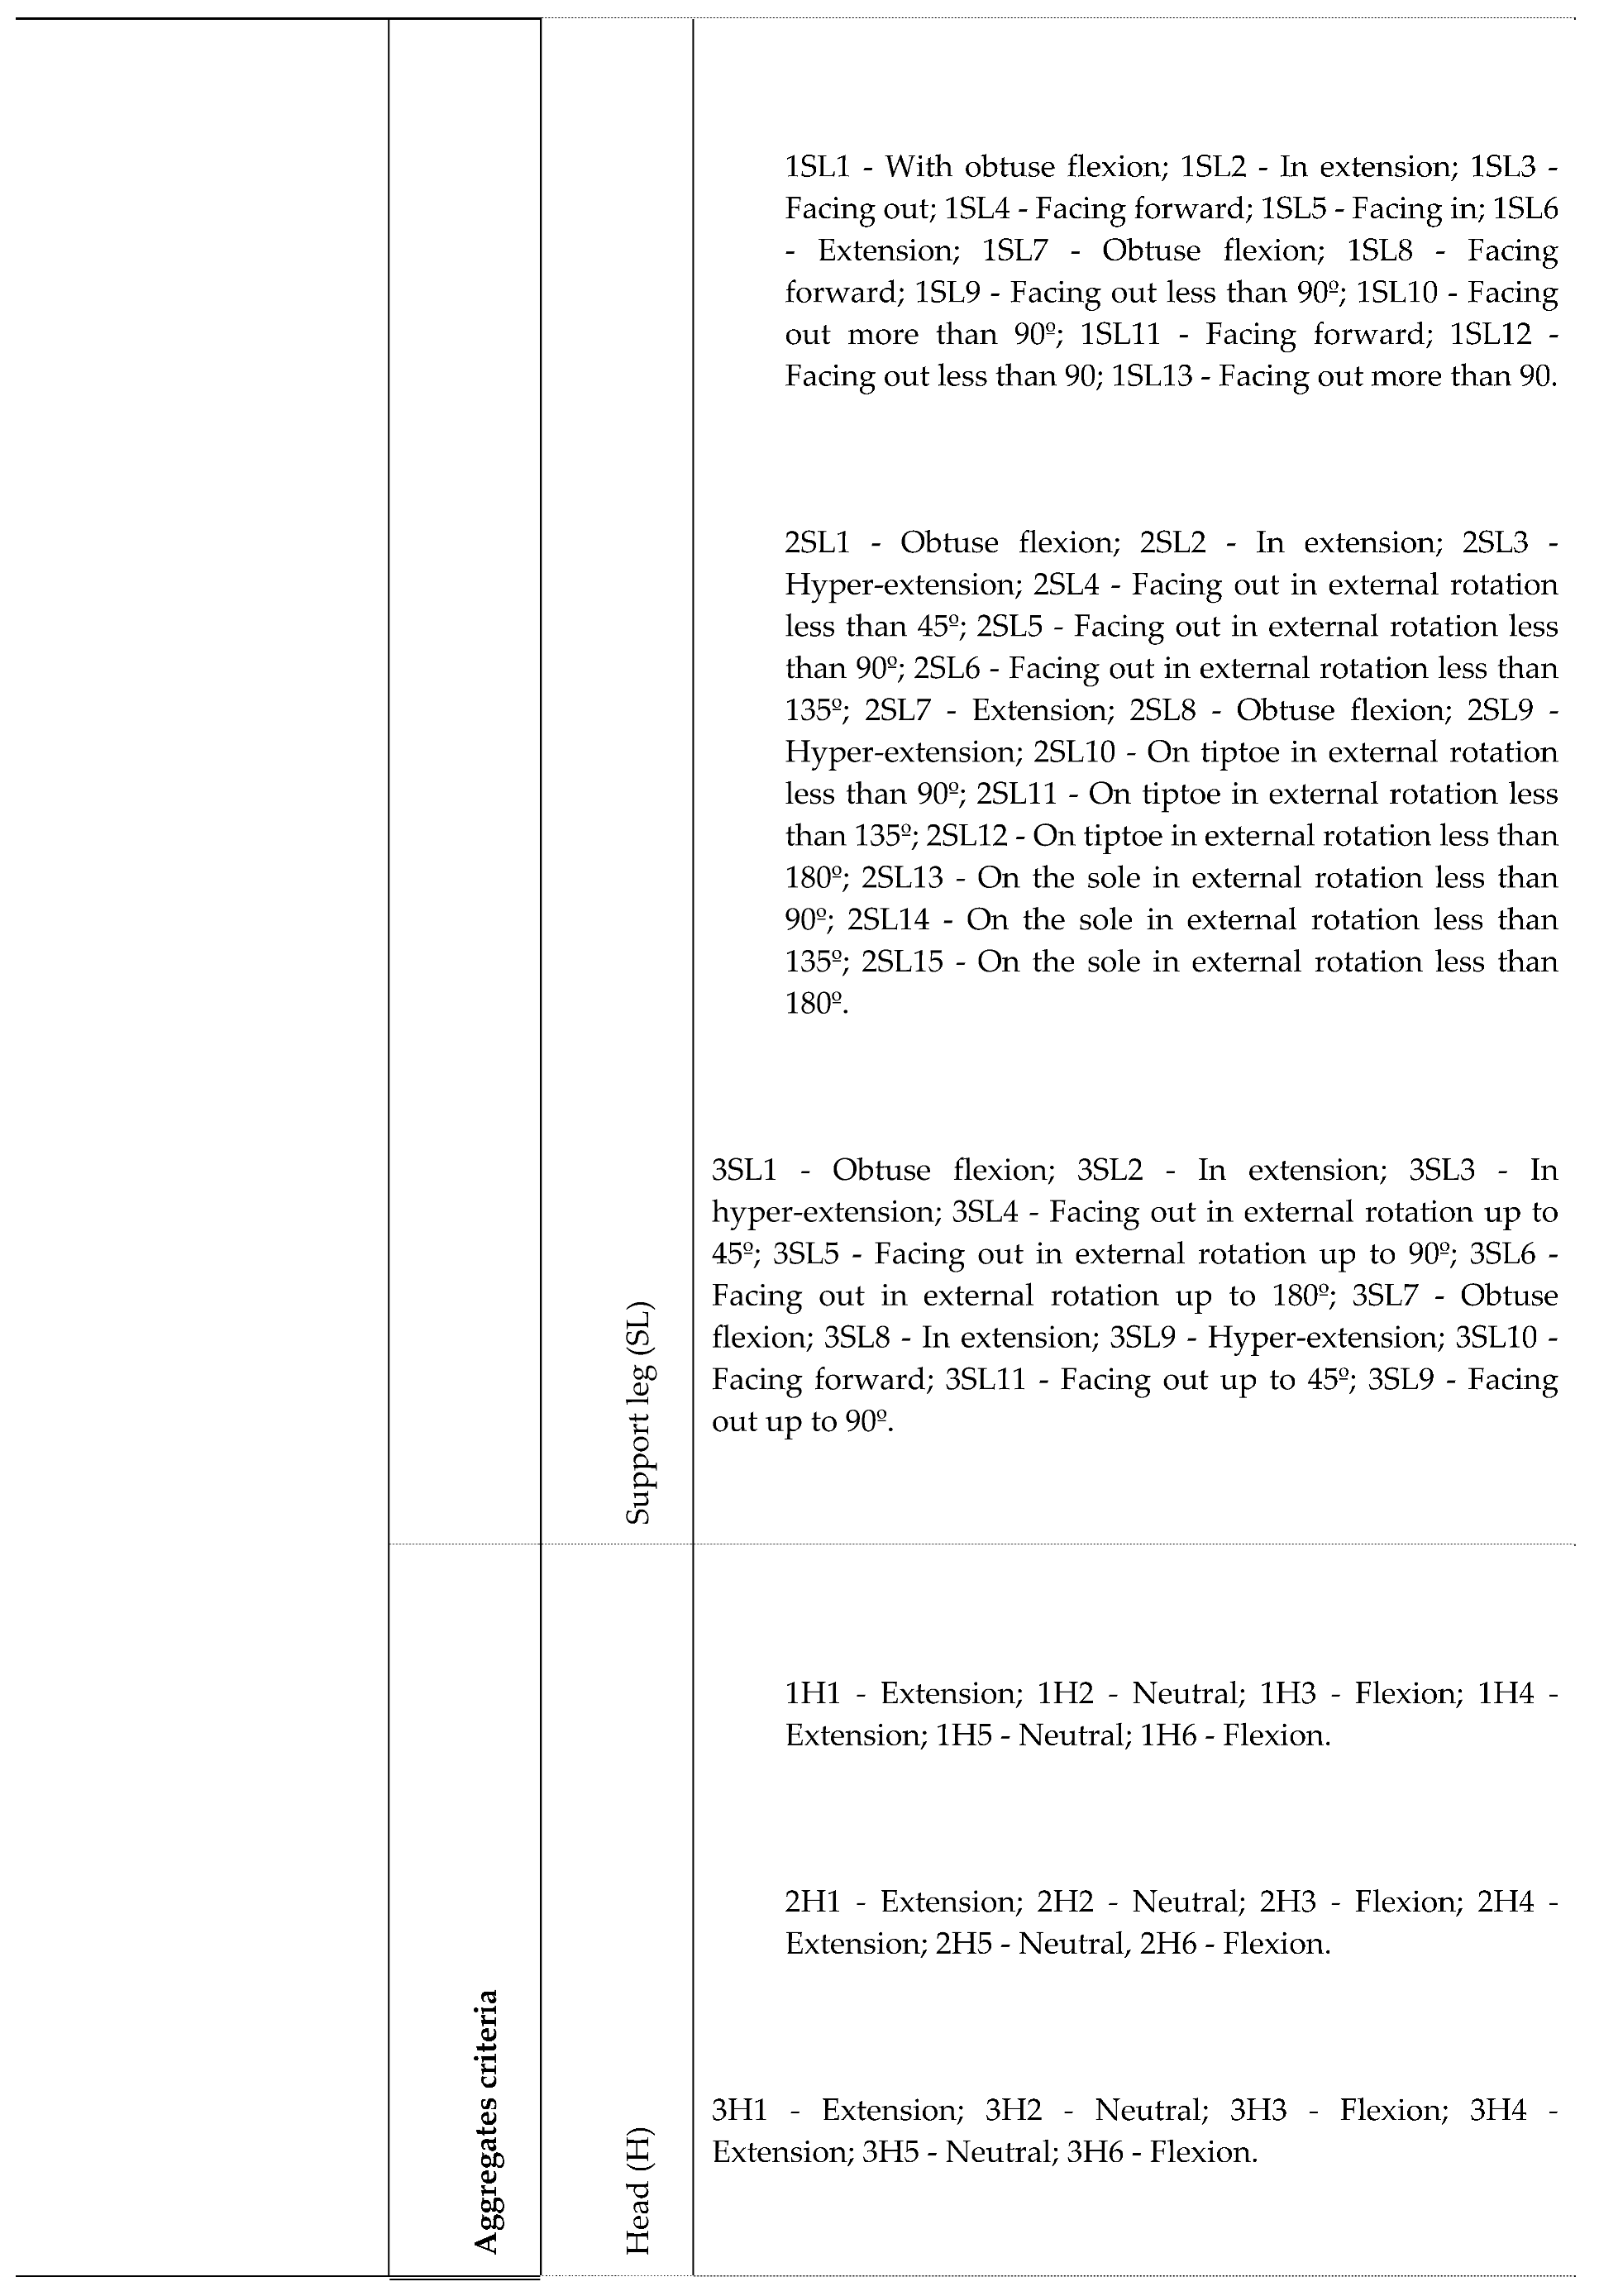
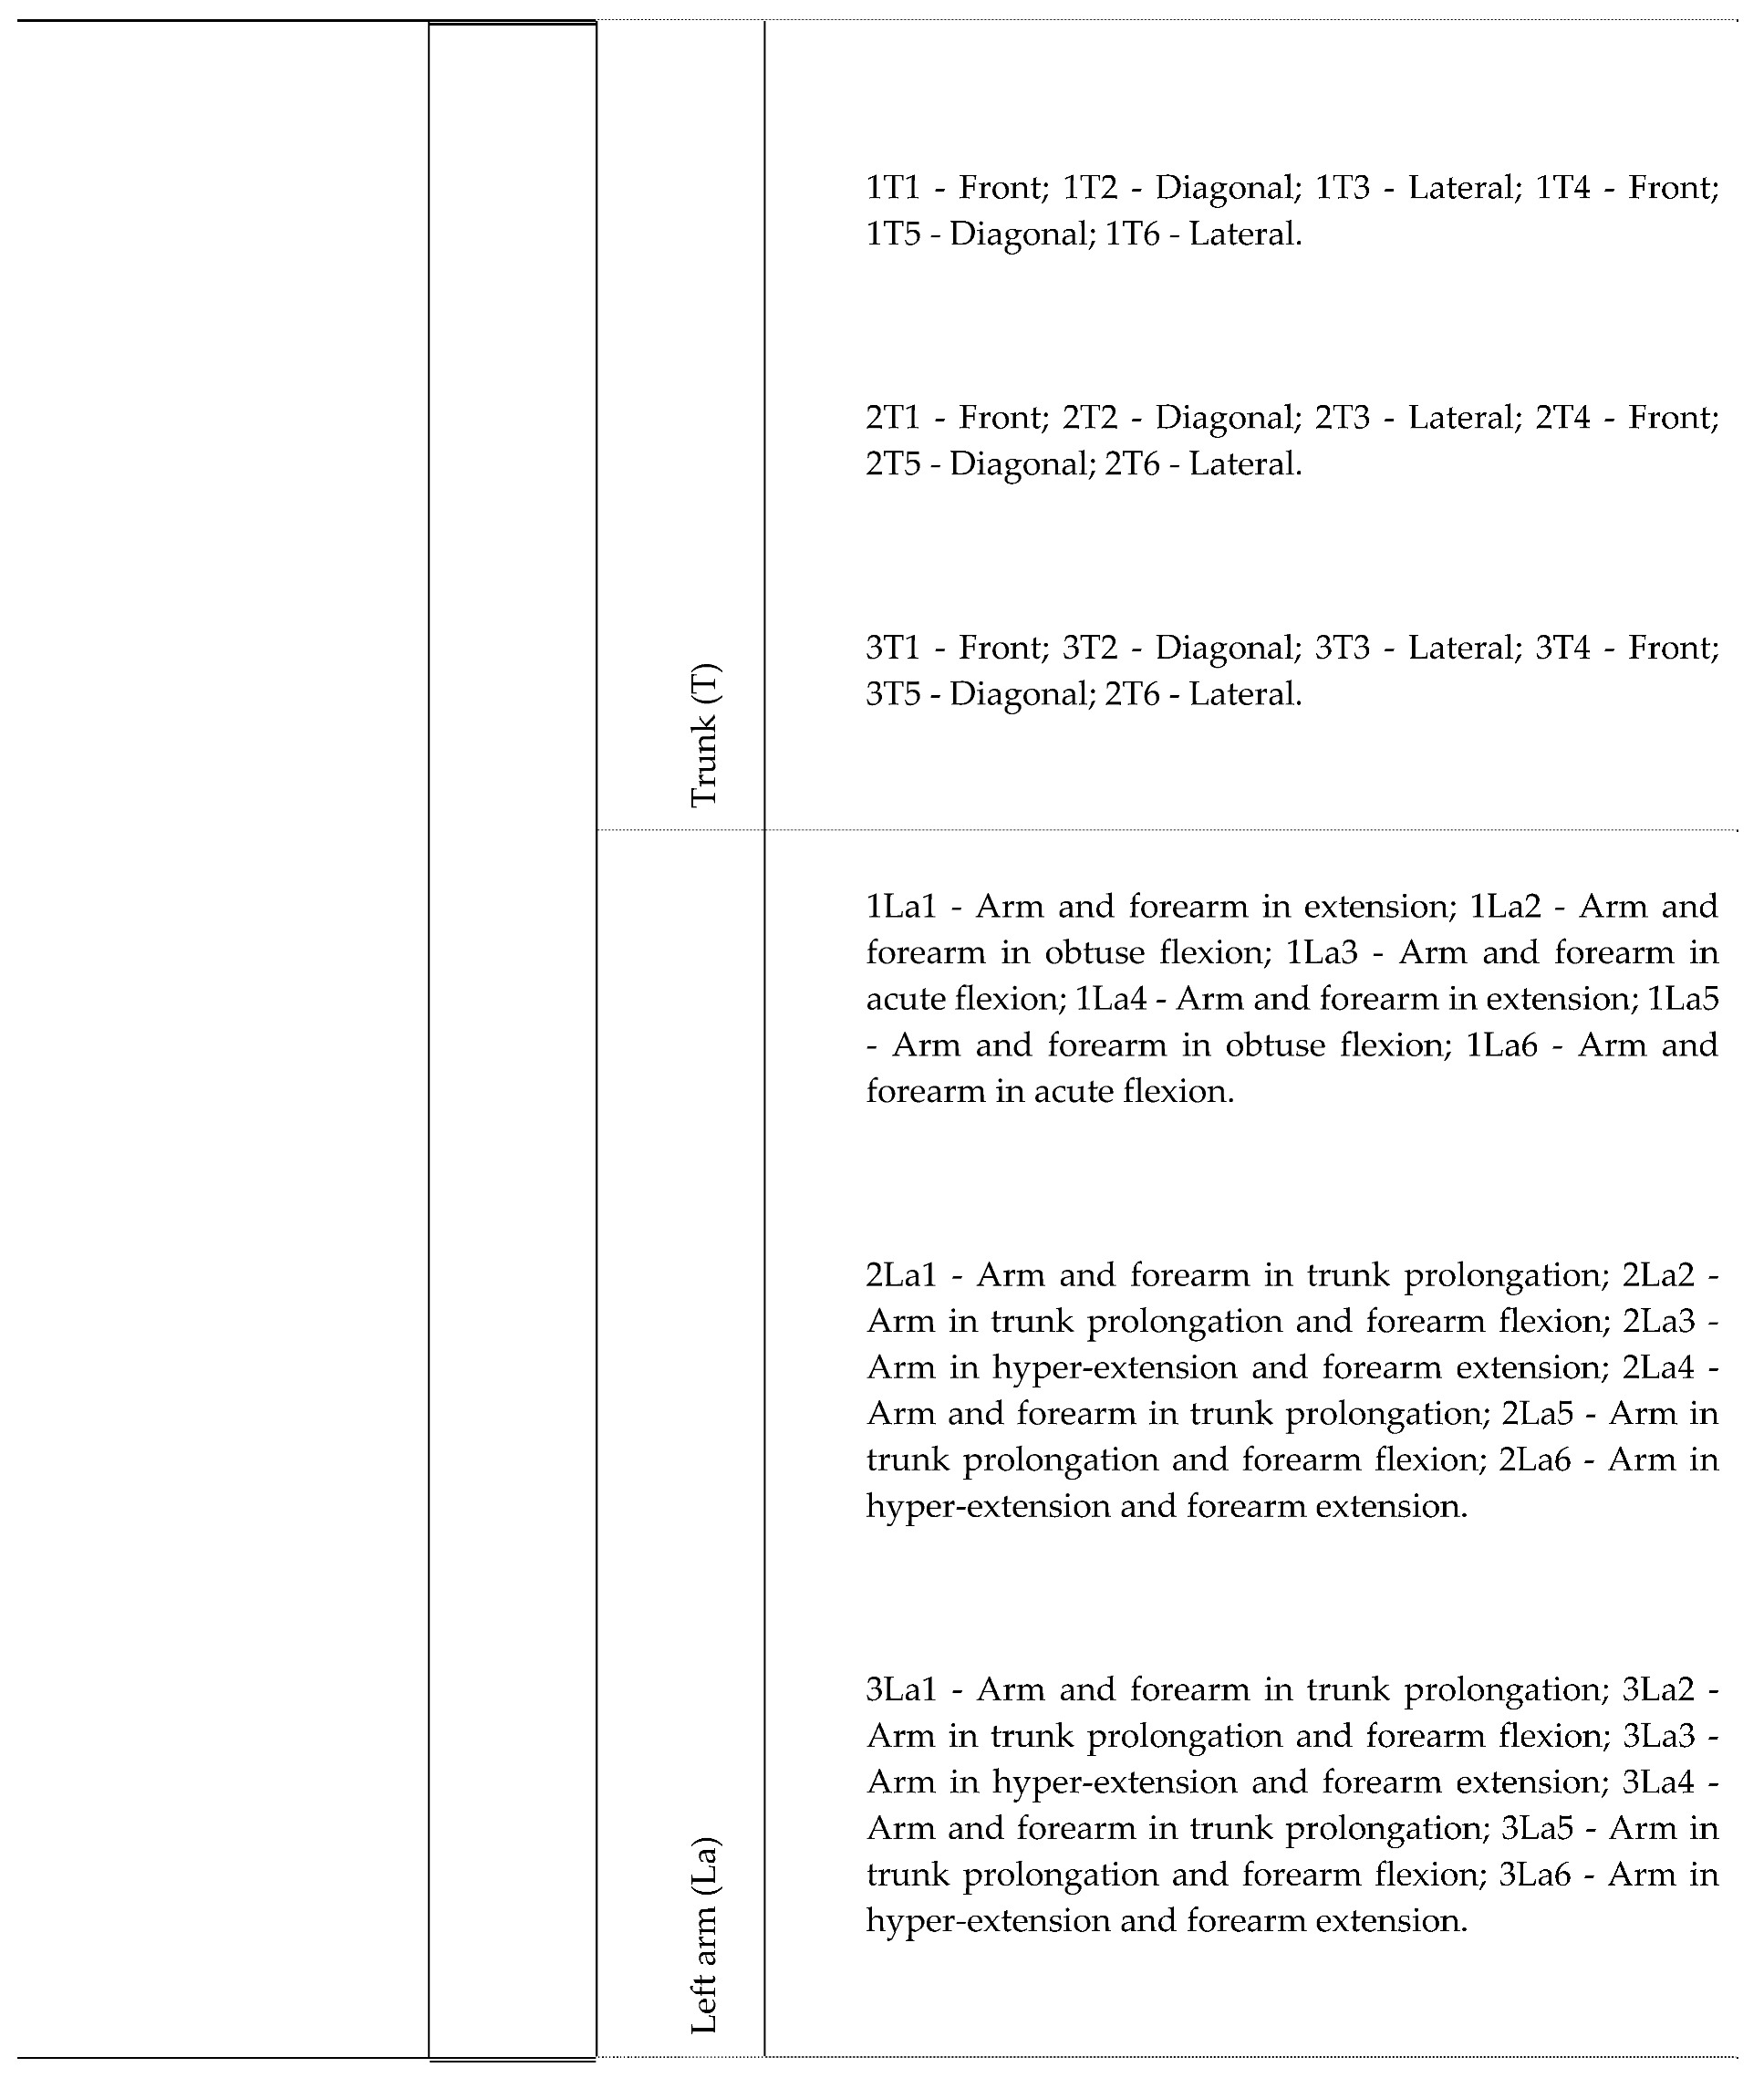
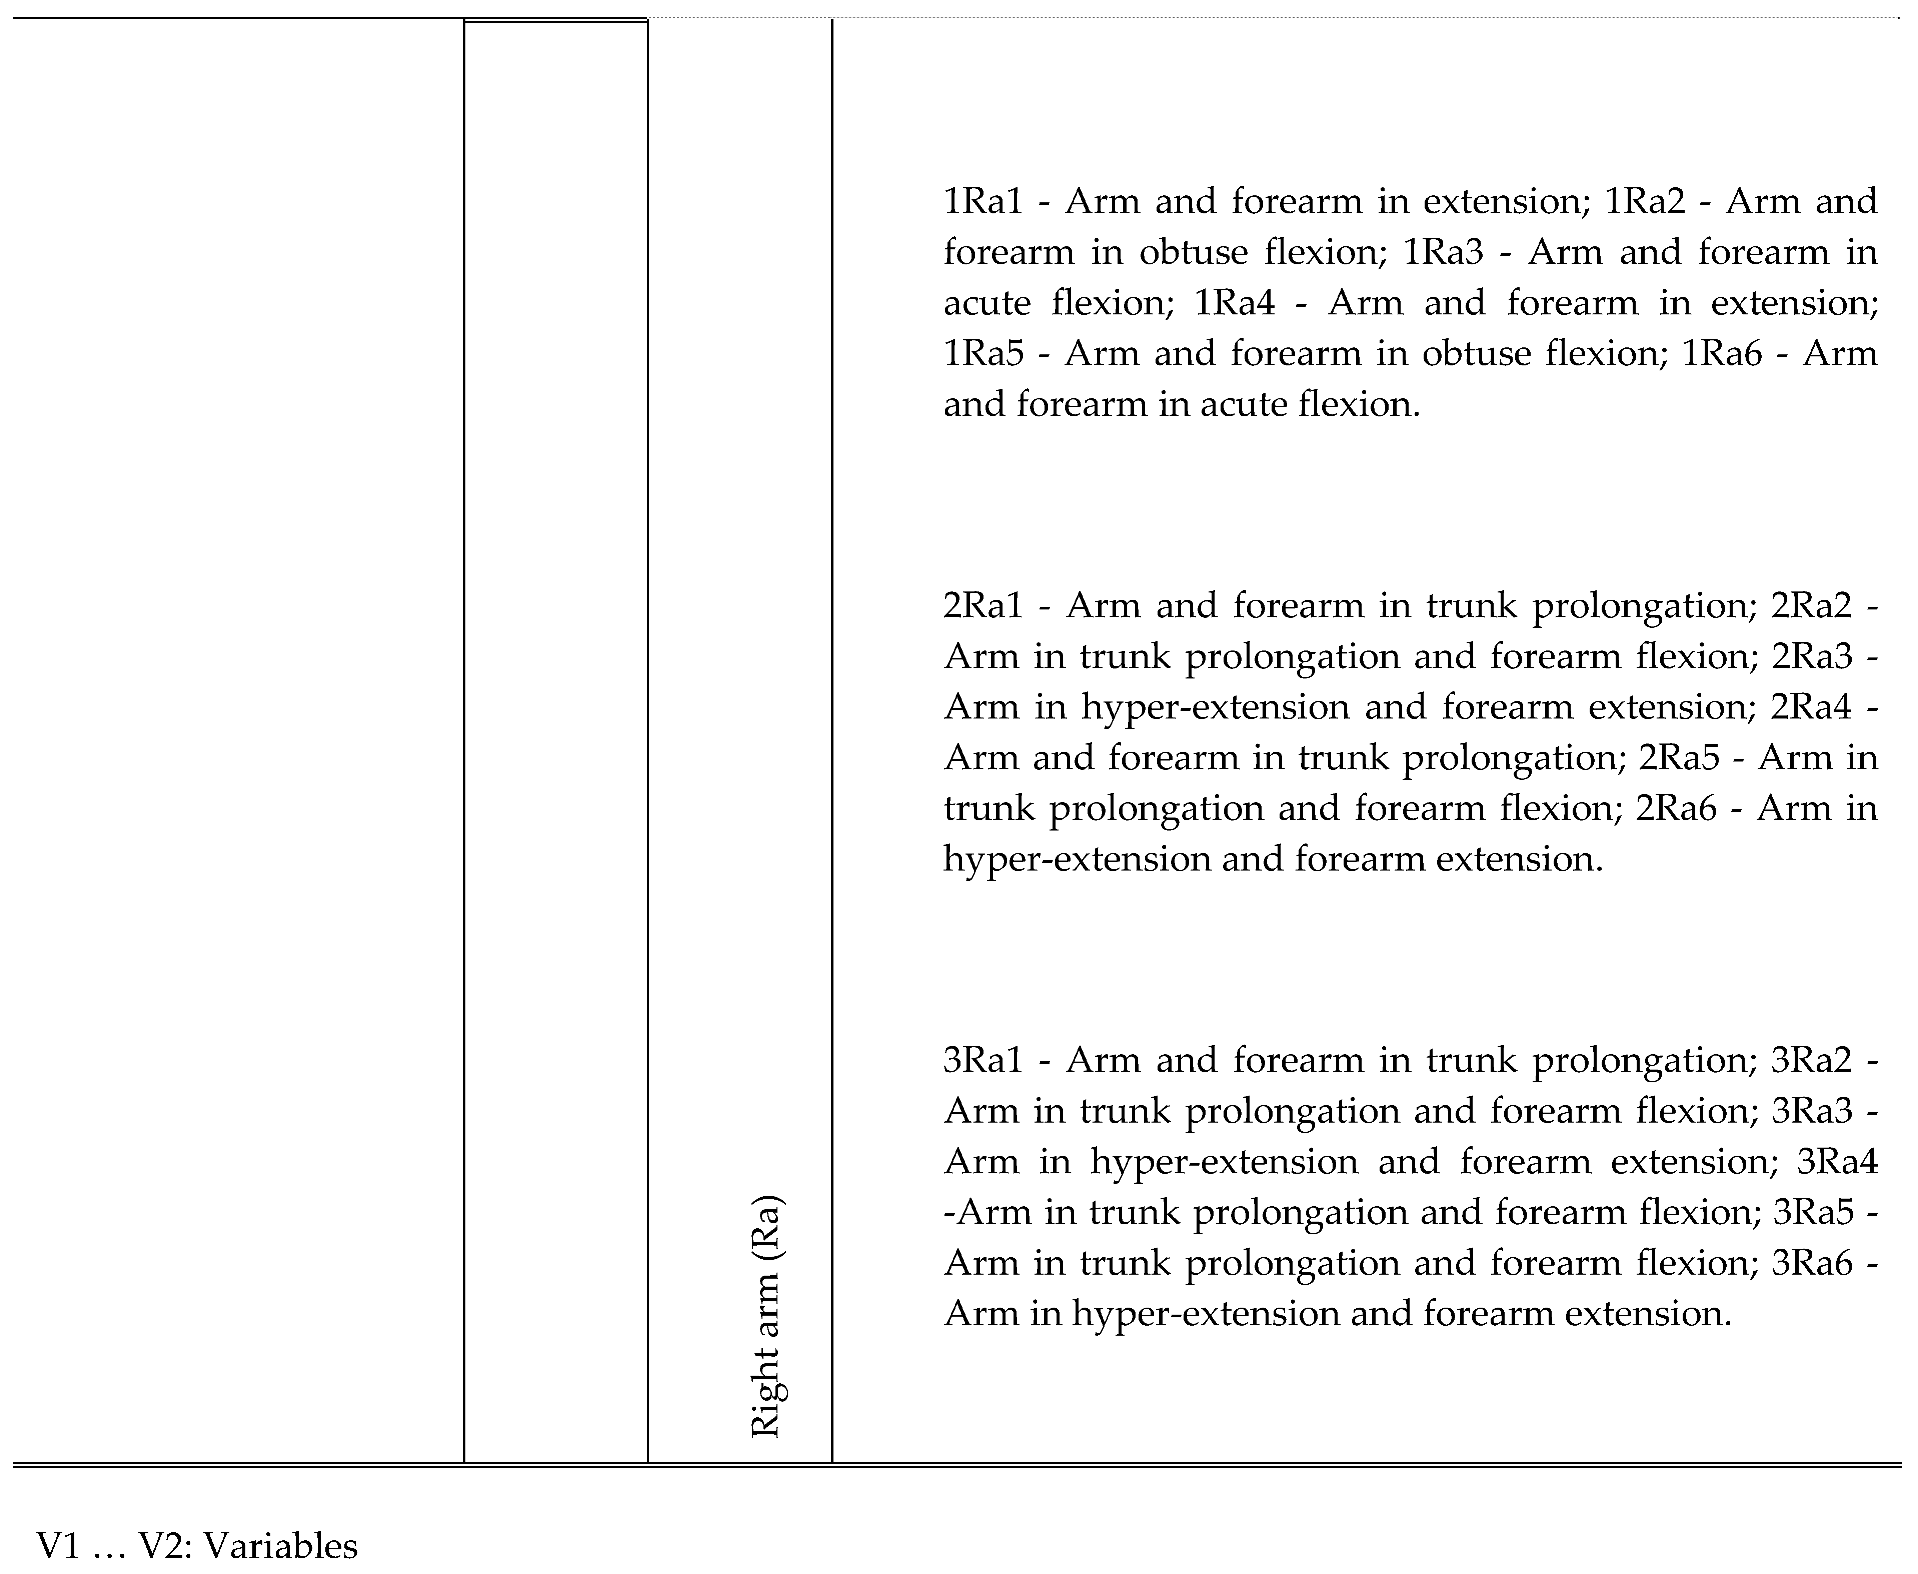
Miluh-chagi. This study used a previously designed, validated and published observation tool, the Observation System for Technical Performance Indicators - Chagi (OSTIP-C) Sousa et al. [
1].
3. Results
Valid and complete results were obtained throughout a technical cycle of ten kicks (
n = 120) performed by 12 athletes (41.7% women and 58.3% men).
Table 2 displays the main characteristics of the Taekwondo athletes which were not significantly different in terms of age and Taekwondo practice years. The men showed statistically significant differences in terms of height (taller +3.4cm) and weight (heavier +2.1kg) compared to the women. The effect sizes shown as moderate in height and small in weight variables.
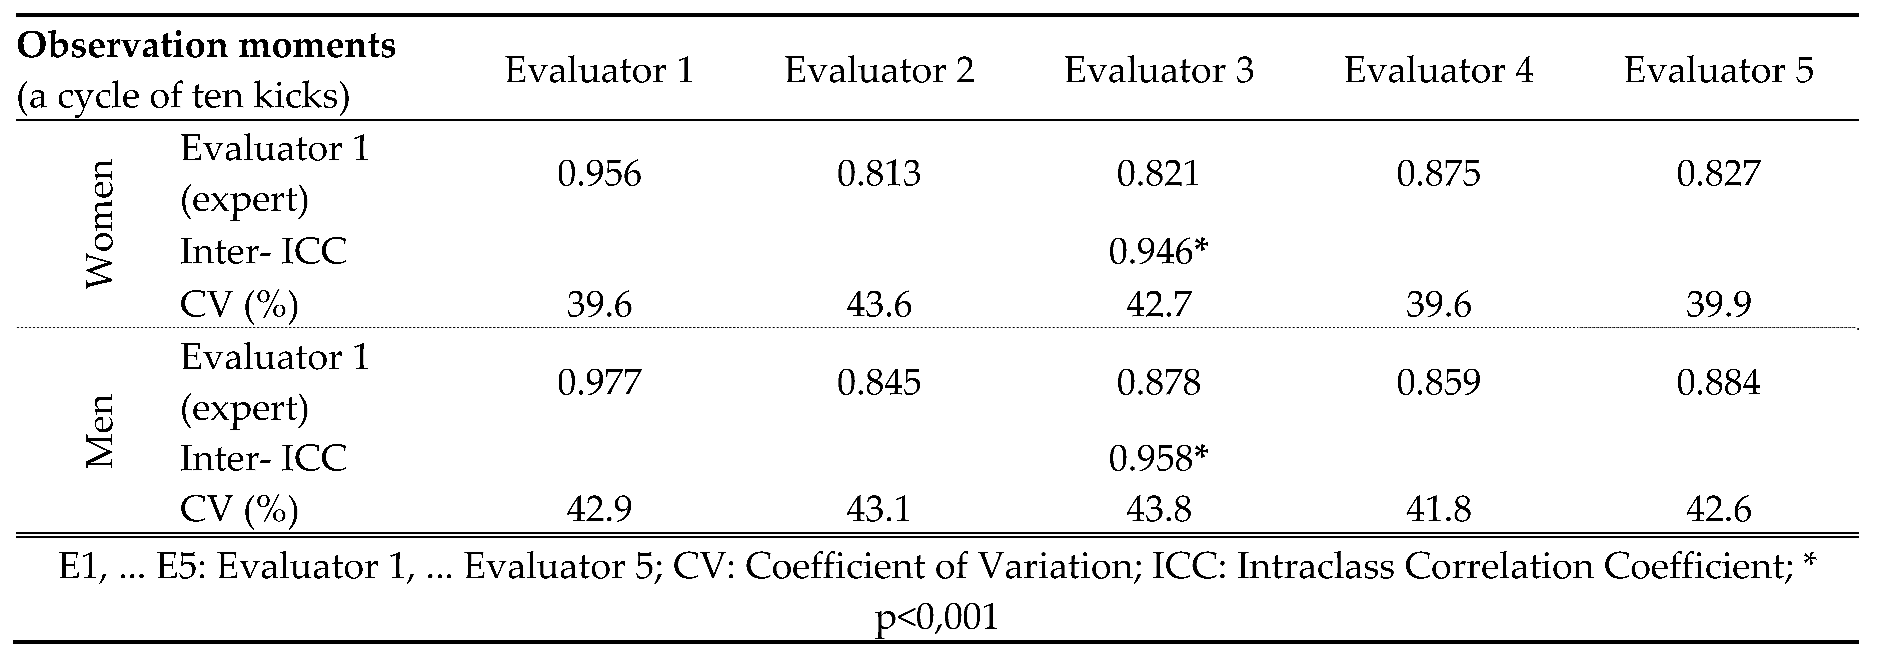
To determine the quality of the data studied, the coefficient of variation, and intraclass correlation coefficient were calculated to confirm the reliability of the evaluators’ panel. To evaluate the panel’s reliability, they analyzed the 6
th and 7
th cycle of ten kicks, executed by athlete #9 (woman), and athlete #5 (man) respectively.
Table 3 displays the CV results showing that the men’s group revealed less variation than the women’s group. Through the ICC the evaluators’ reliability results for both groups (women and men) were shown to be good (p < 0.05).
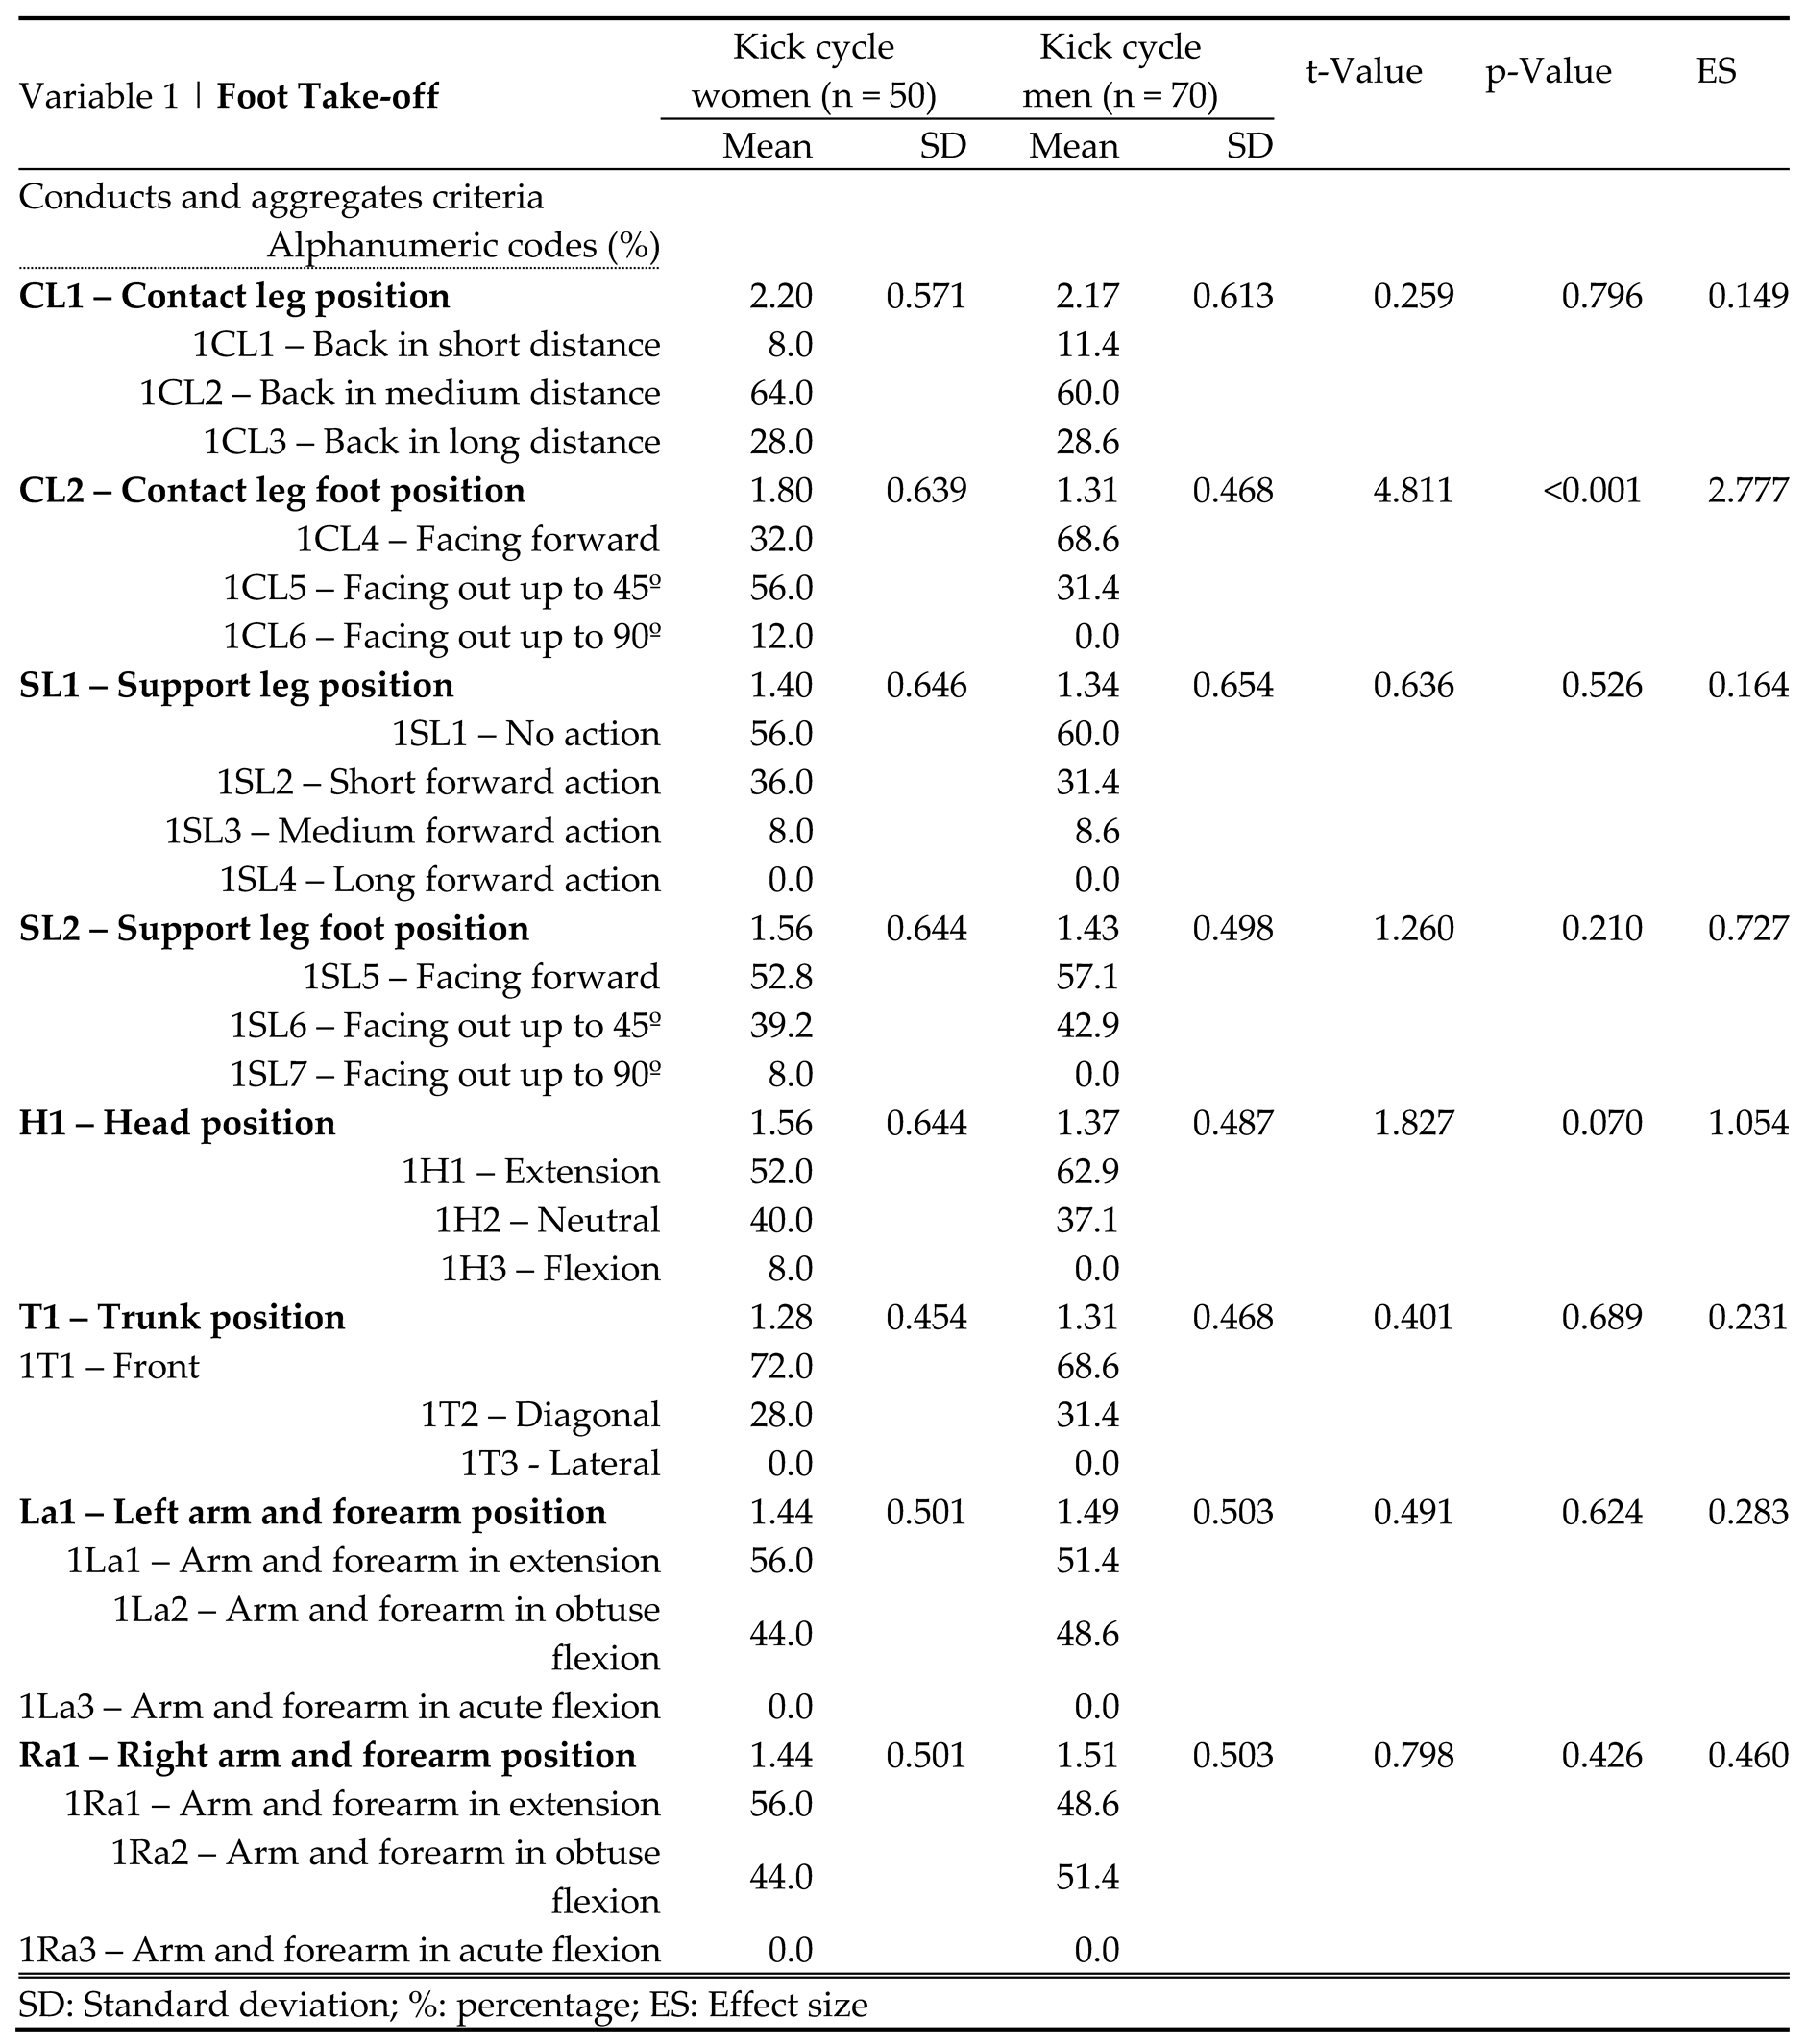
The foot take-off indices are reported in
Table 4. The alphanumeric codes associated with the conducts criteria which presented the highest mean percent value were 1CL2 (64.0) in the women and 1CL4 (68.6) in the men; and the alphanumeric code linked to the aggregates criteria was for both group 1T1 (72.0) and (68.6) women and men respectively. The CL1, CL2, SL1, SL2 conducts criteria, and H1 aggregates criteria was higher in women and the T1, La1, and Ra2 aggregates criteria in the men’s group. Only the CL2 conducts criteria showed a statistically significantly difference in the women and men. The CL2 and H1 criteria indicated a large effect size.
The knee up indices are reported in
Table 5. The alphanumeric codes associated with the conducts criteria which presented the highest percent mean value were 1SL8 (52.0) in the women and 1CL8 (60.0) in the men; and the alphanumeric codes linked to the aggregates criteria were for both groups 1La5 (72.0) and (68.6) women and men respectively. The CL3, CL4, SL4, H2, T2, and La2 aggregates criteria were higher in the women, and the SL3, SL4 and Ra2 aggregates criteria in the men’s group. The CL4 aggregates criteria showed a statistically significant difference in the women and men. The CL4, H2 and Ra2 conducts criteria indicated a very large effect size.
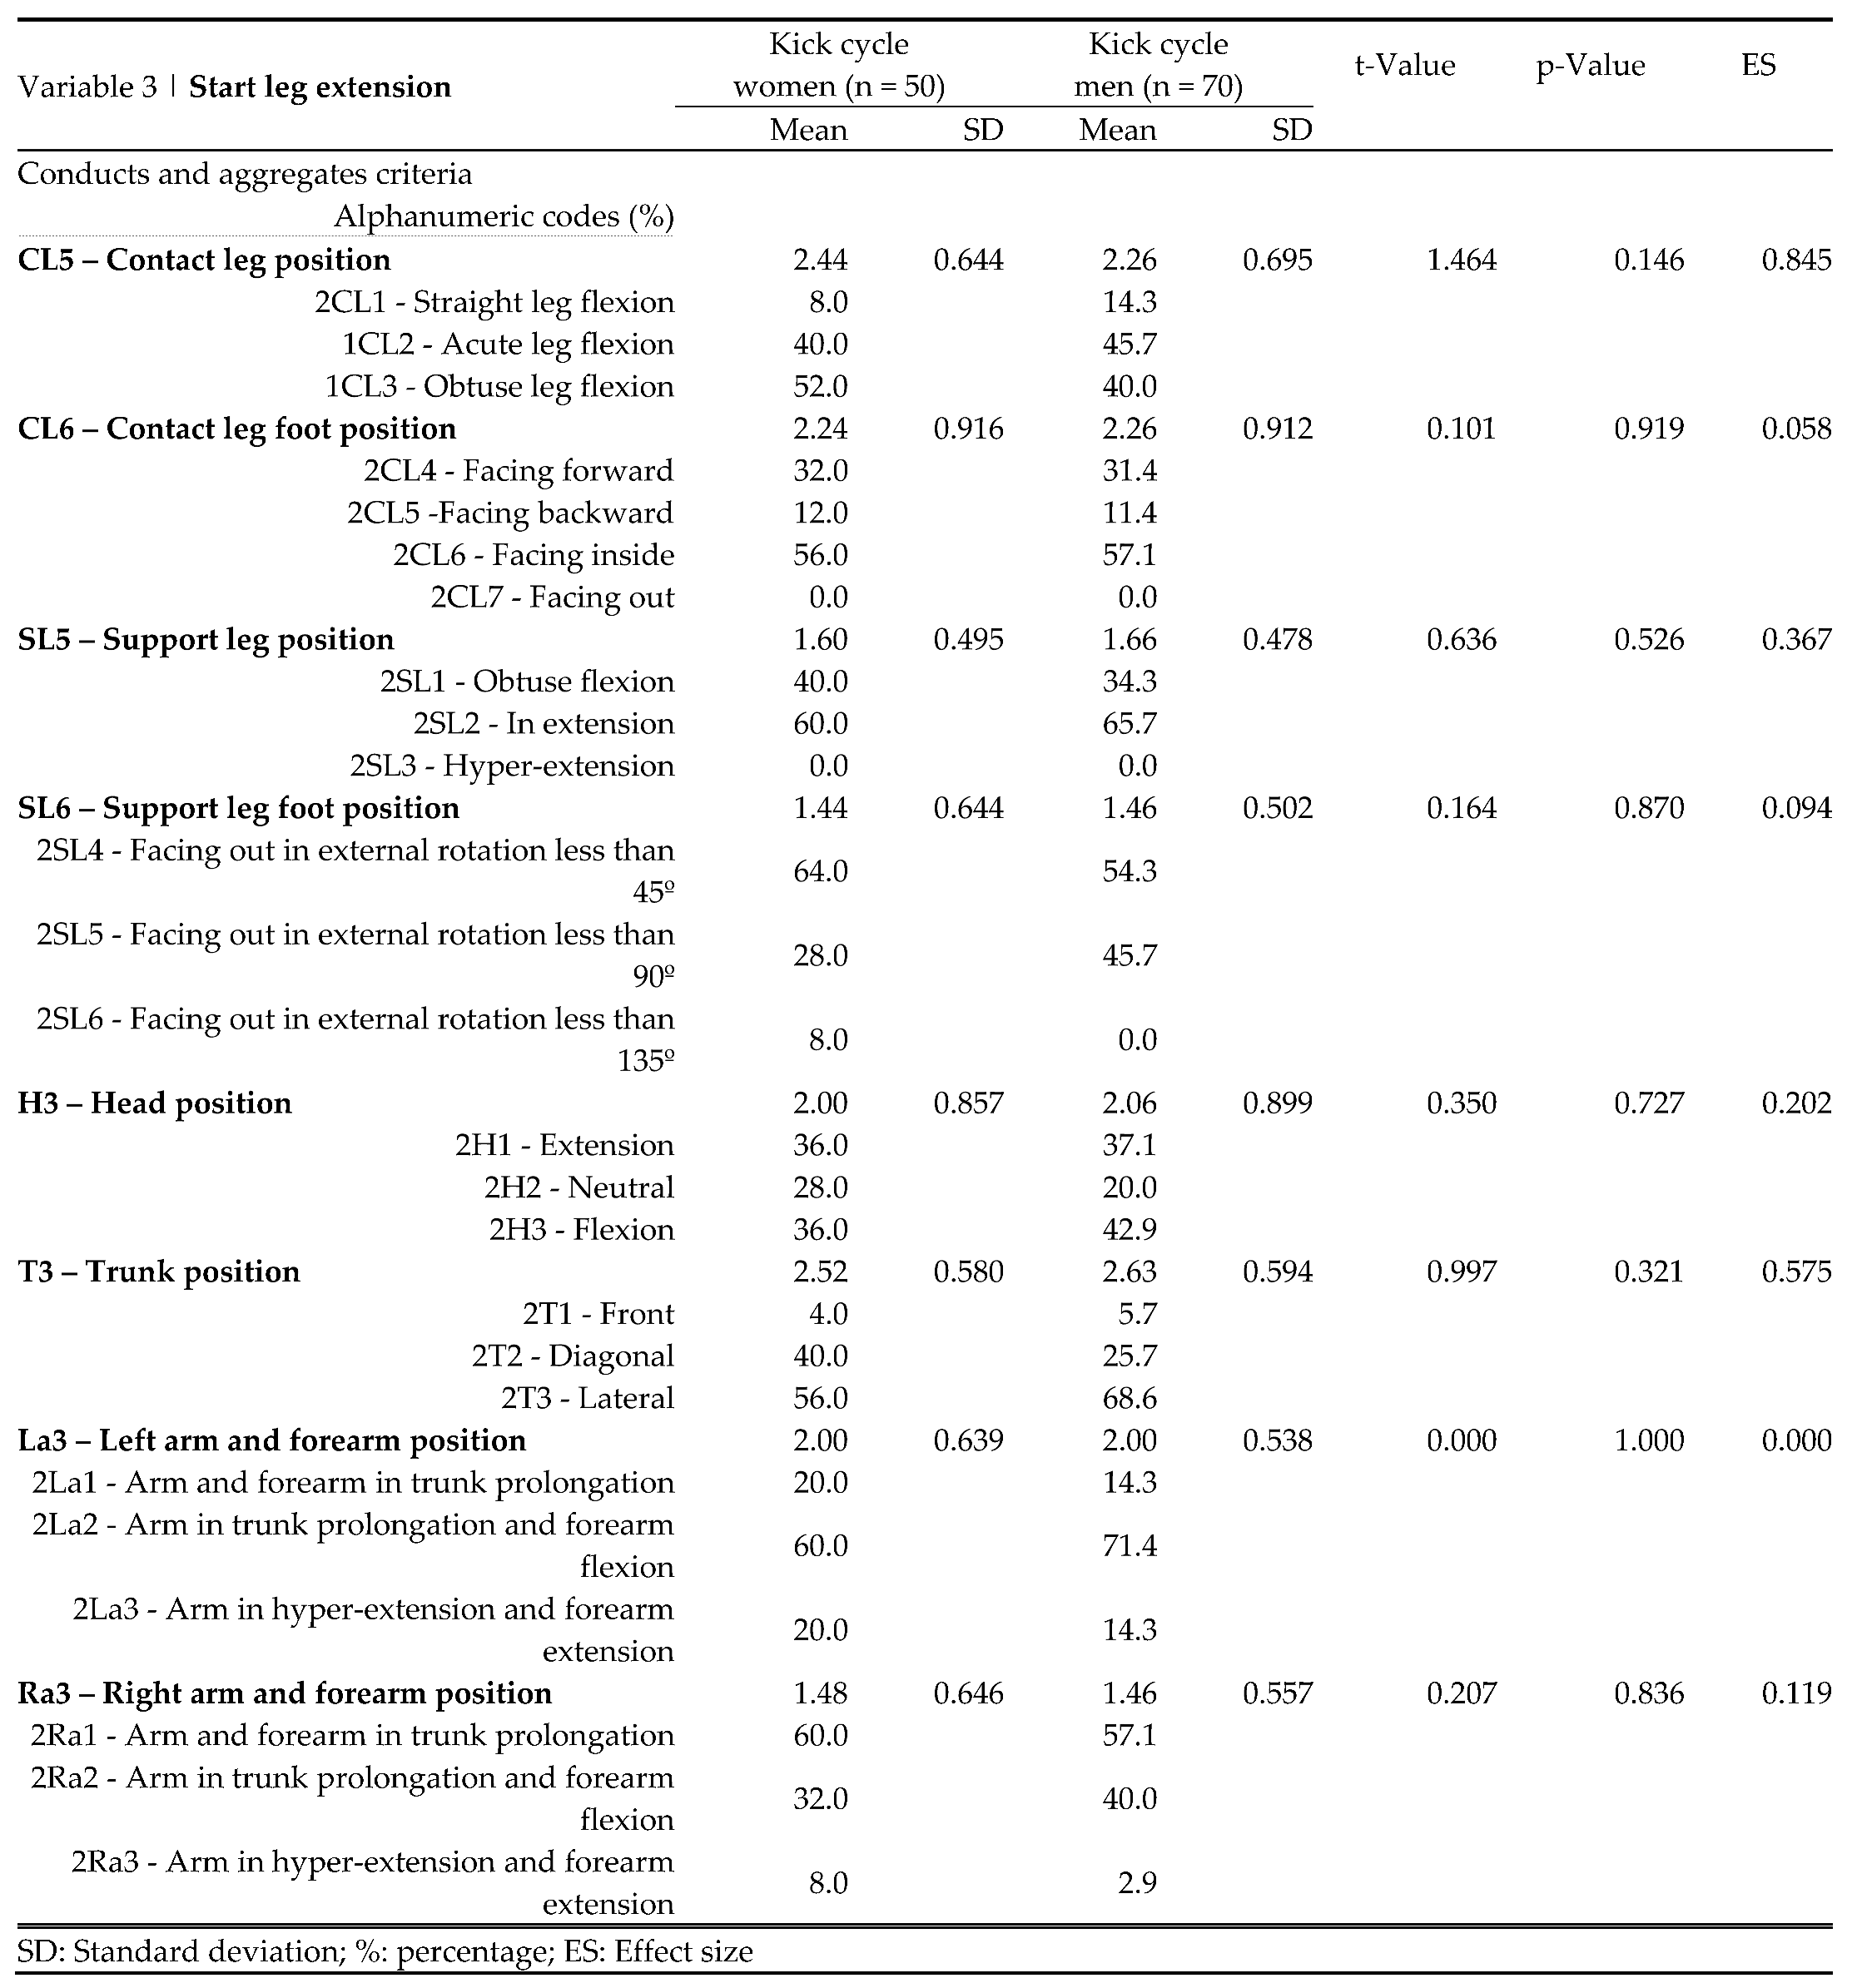
The start leg extension indices are reported in
Table 6. The alphanumeric codes associated with the conducts criteria which presented the highest mean percent value were 2SL4 (64.0) in the women and 2SL2 (65.7) in the men. The alphanumeric codes linked to the aggregates criteria which showed highest percent mean values was 2La2 and 2Ra2 (60.0) in the women, and 2La2 (71.4) in the men. The CL5 conducts criteria, and Ra3 aggregates criteria were higher in the women and CL5, SL5, SL6 conducts criteria, H3, T3, and La3 aggregates criteria in the men’s group. No one aggregates criterion revealed a statistically significant different in the women and men. Only the CL5 conducts criteria indicated a large effect size.
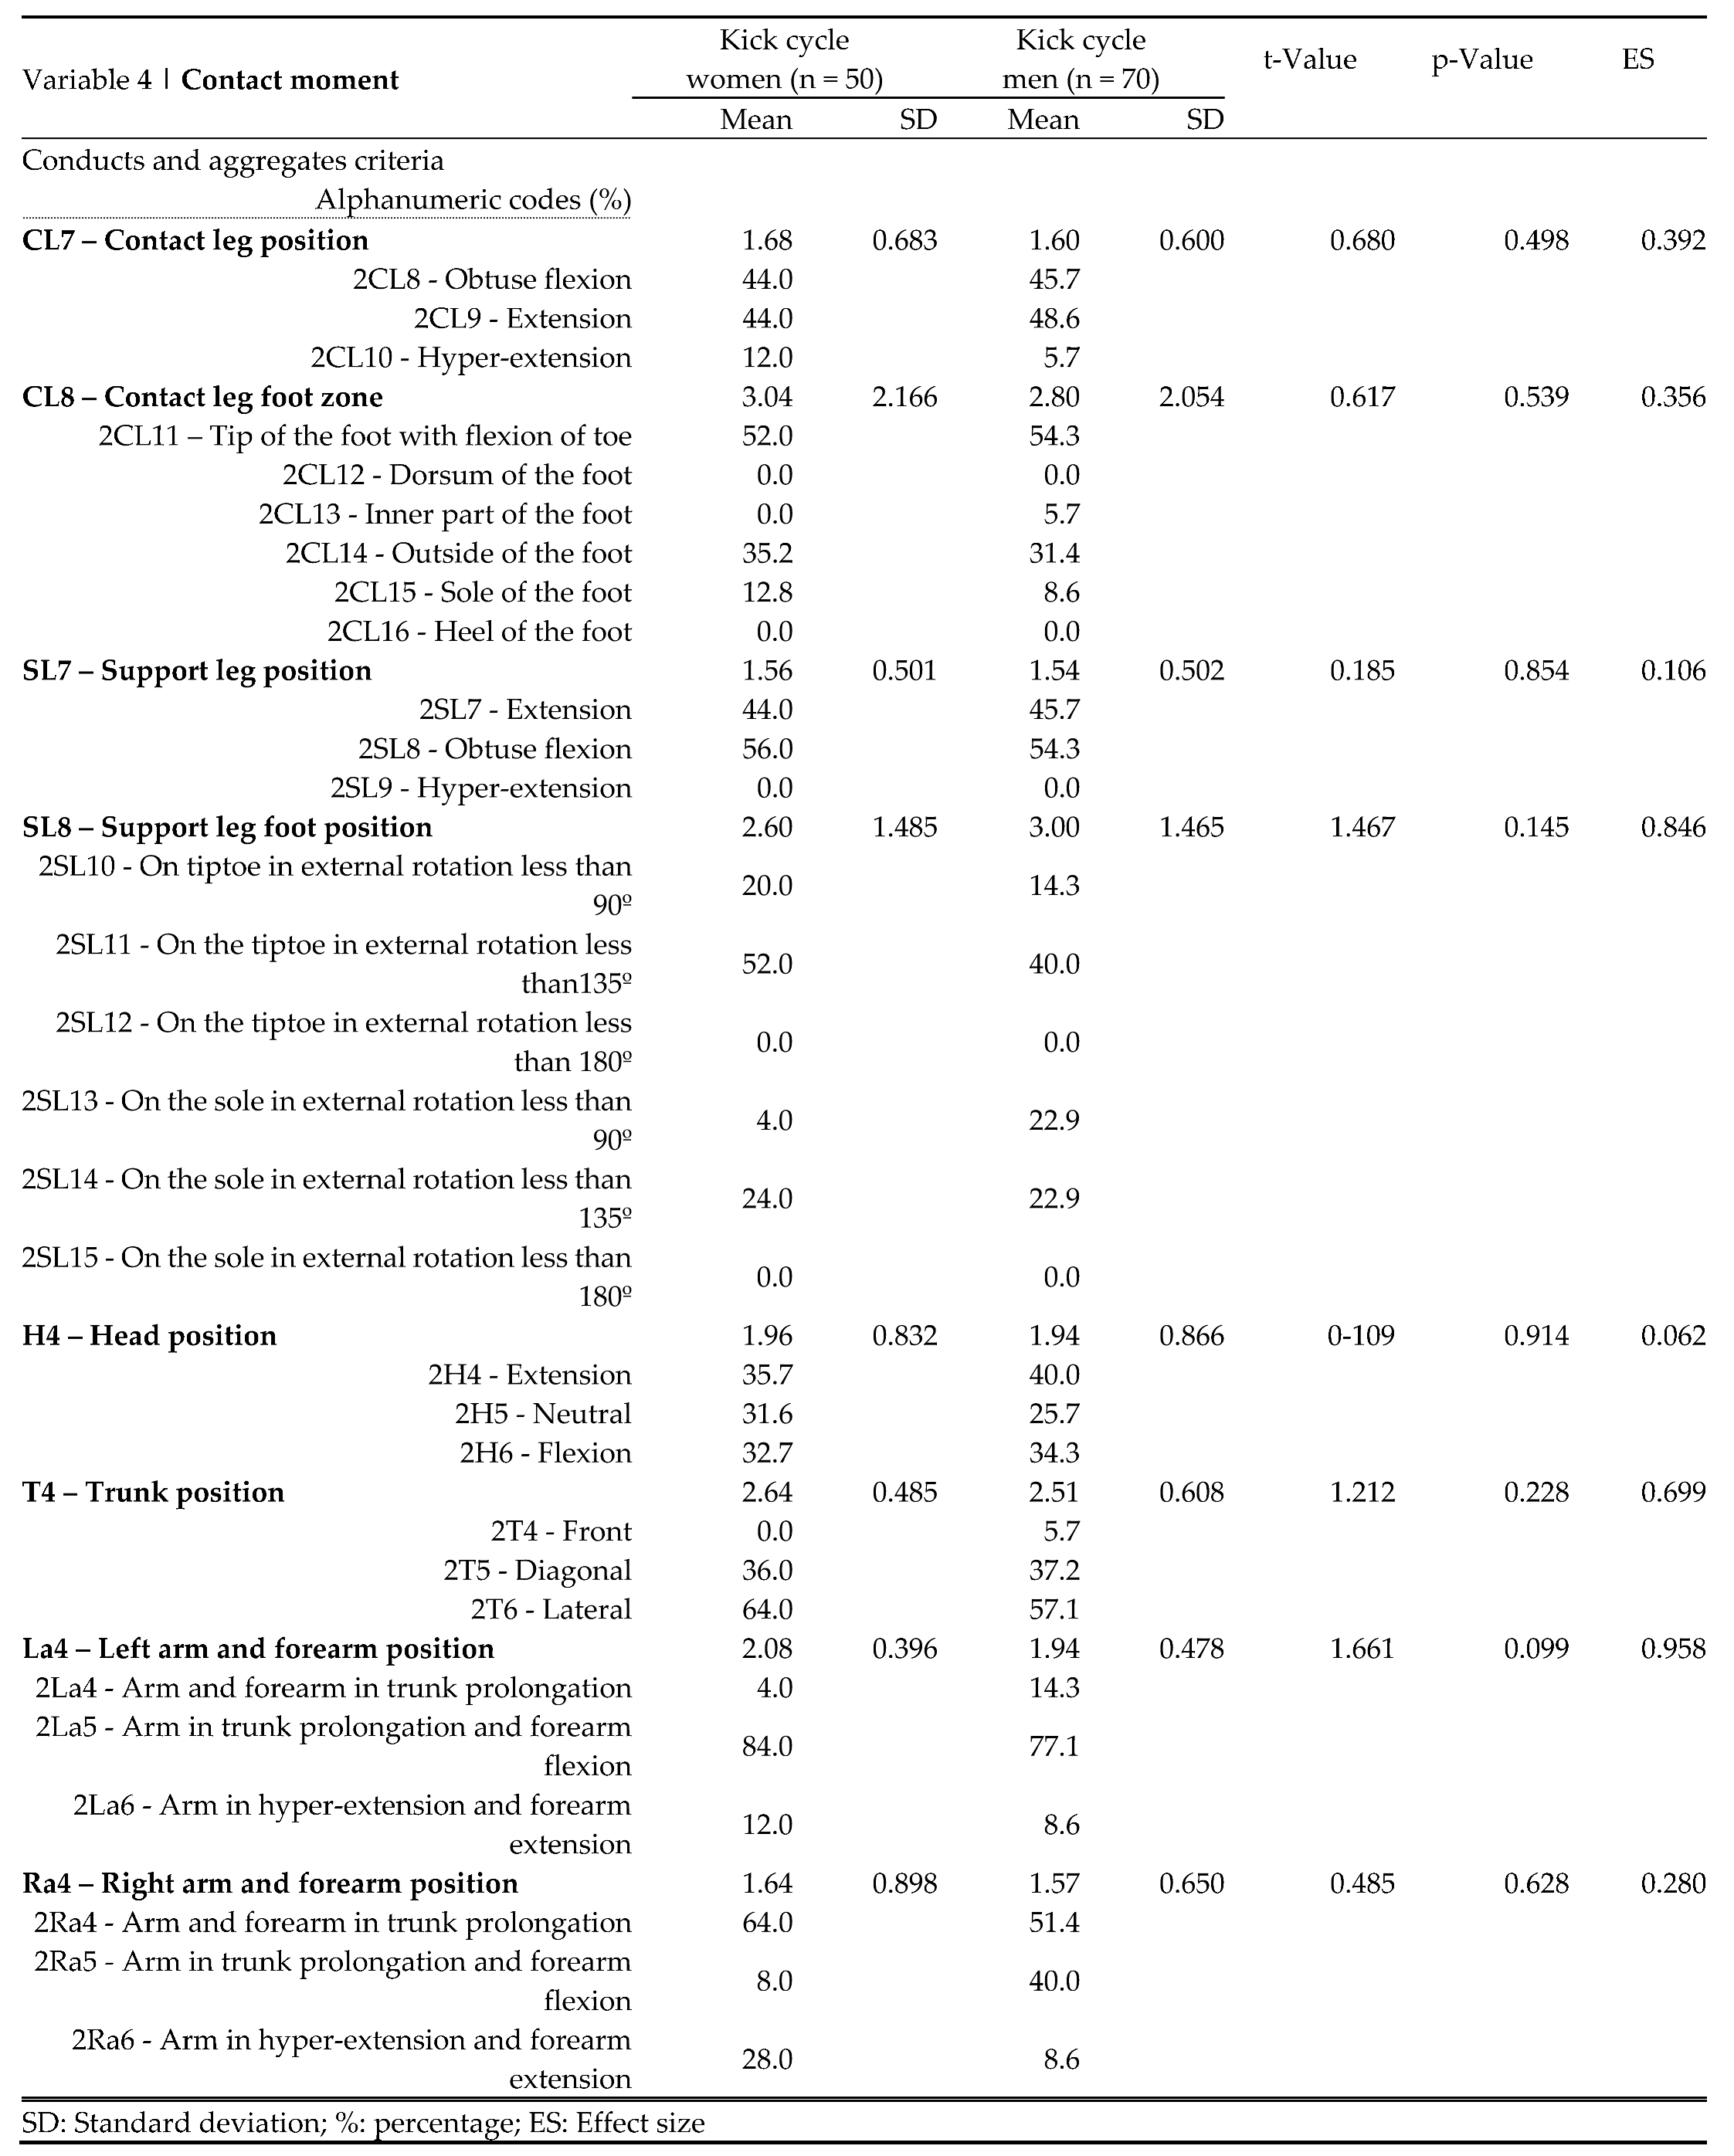
The contact moment indices are reported in
Table 7. The alphanumeric codes associated with conducts criteria which present the highest mean percent value were 2SL8 (56.0) in the women and 2CL11, and 2SL8 (54.3) in the men. The alphanumeric codes linked to aggregates criteria showing the highest percent values was 2La5 (84.0) in the women, and (77.1) in the men. In this variable all conducts and aggregates criteria were higher in the women than in the men except for SL8 - support leg foot position. No one conducts criteria revealed a statistically significant difference in the women and the men. The SL8 and La4 conducts criteria indicated a large effect size.
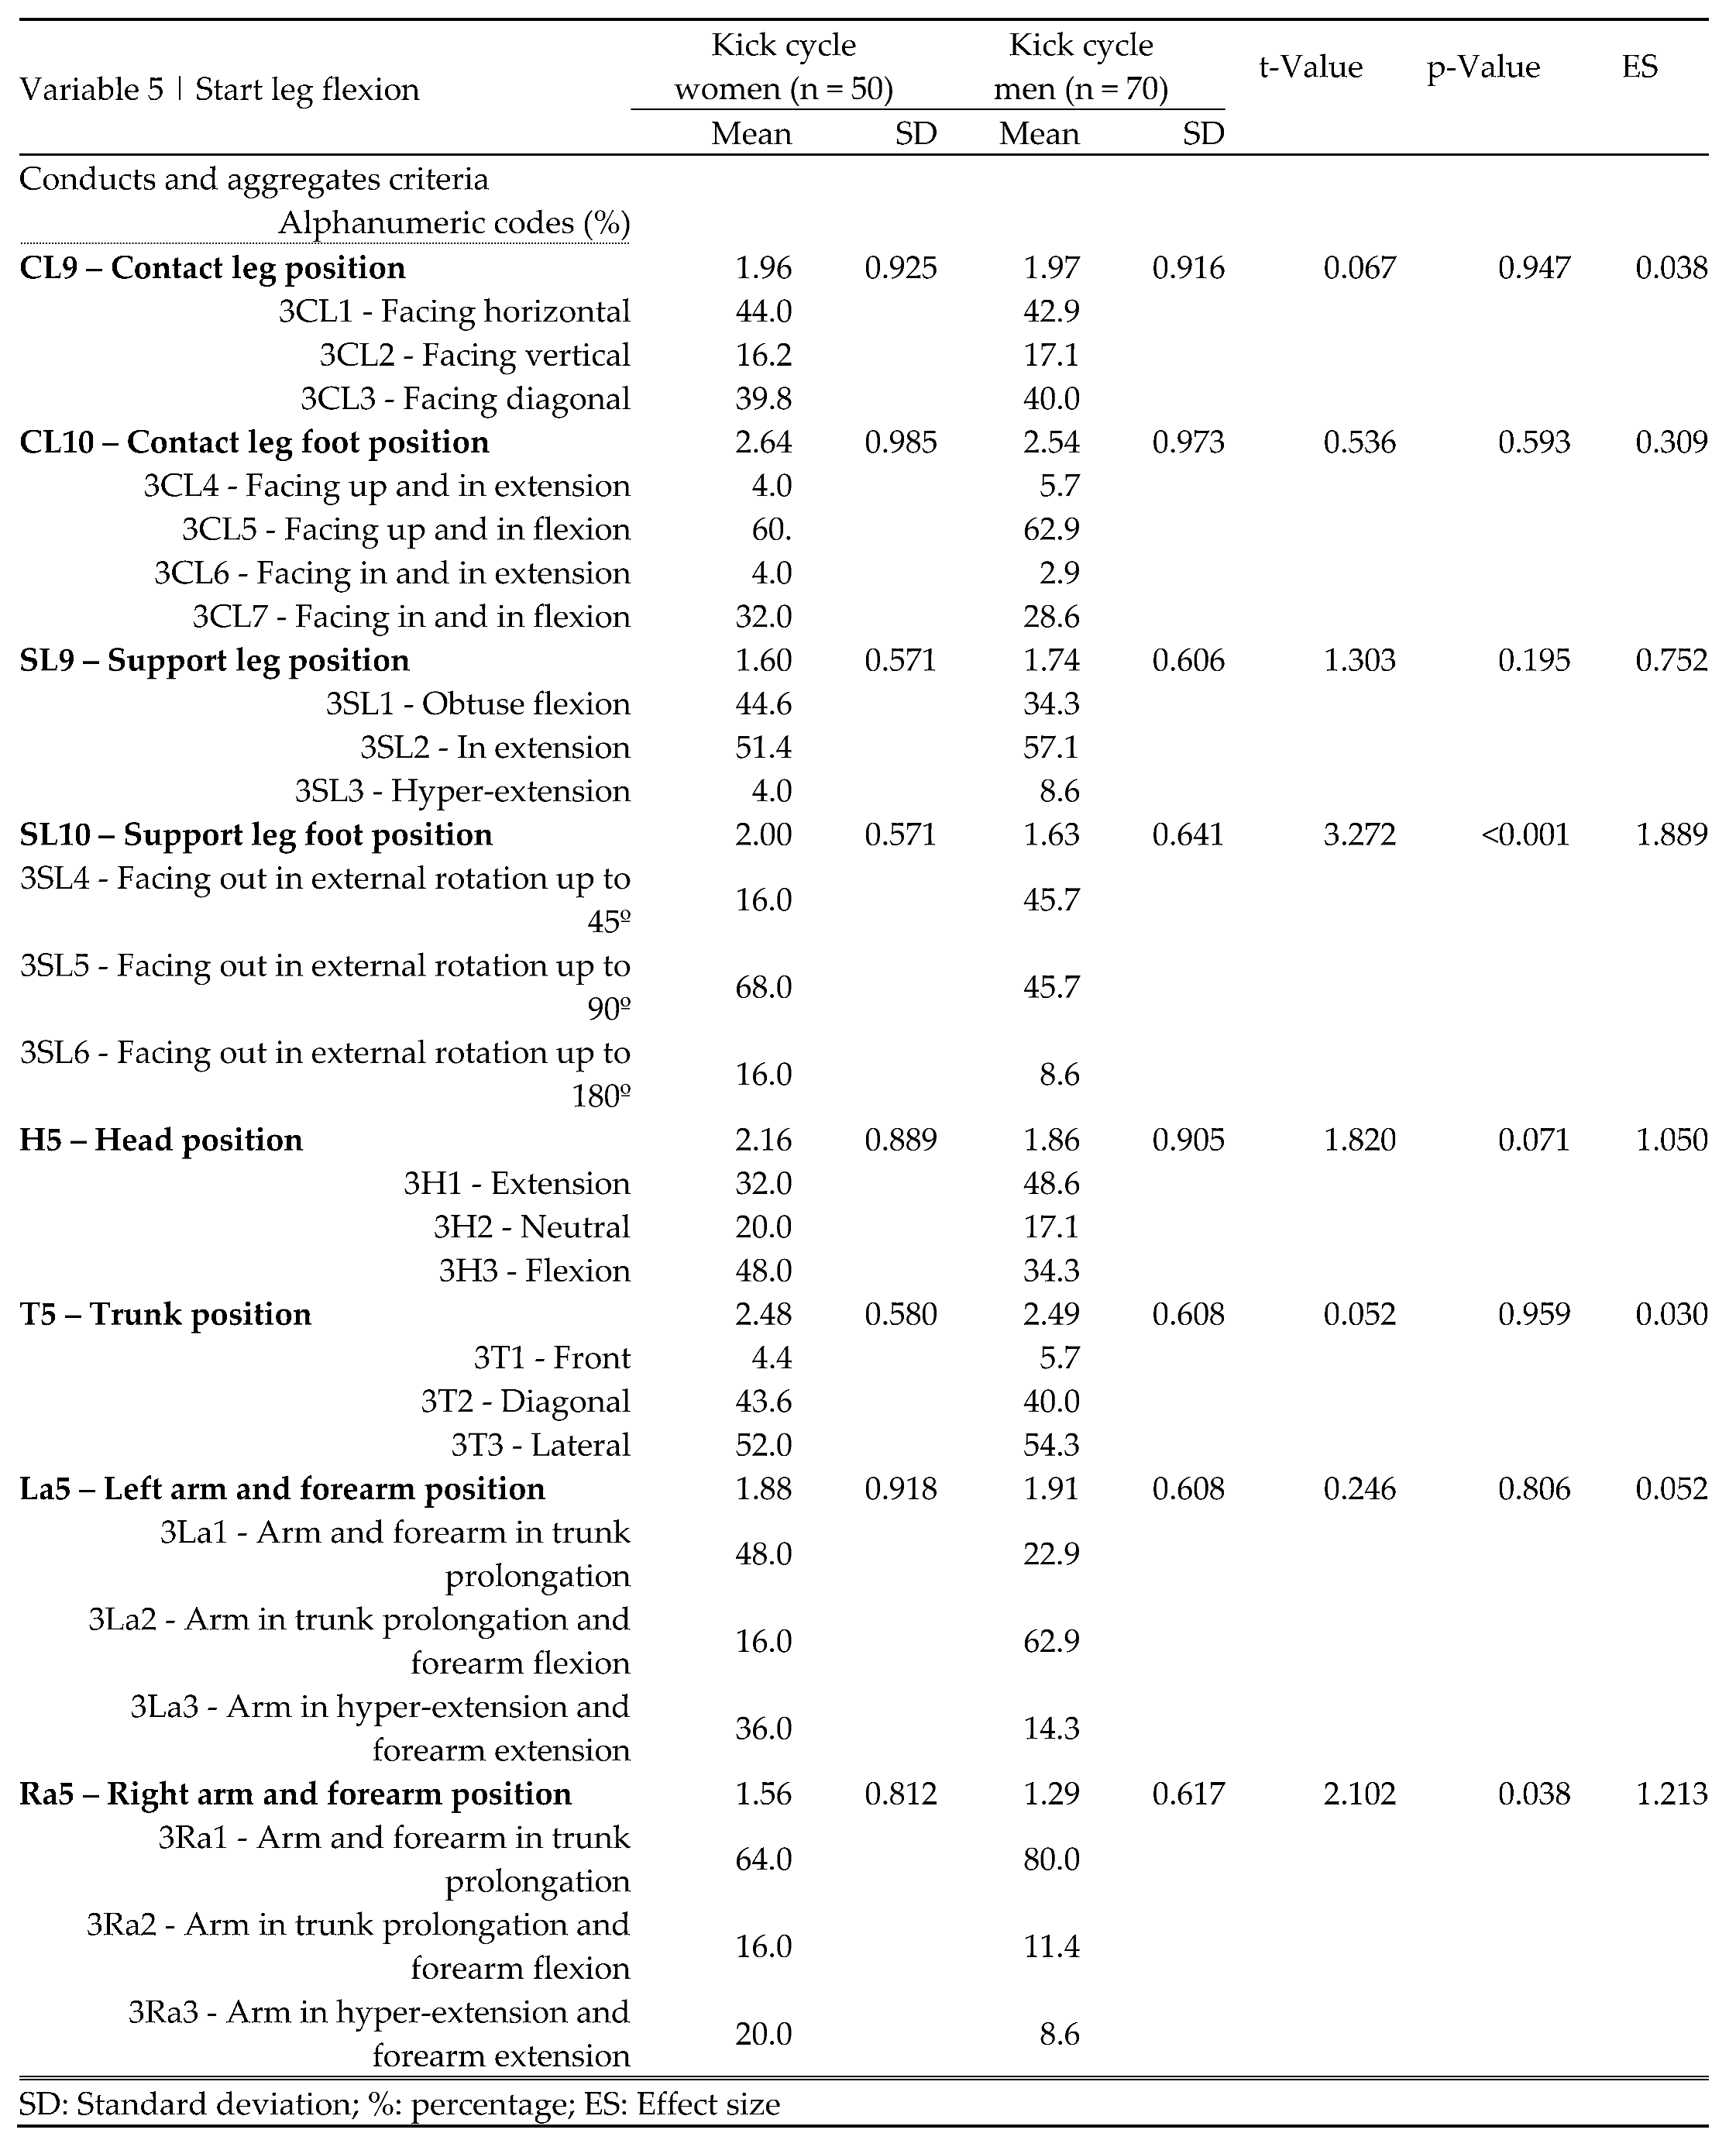
The start leg flexion indices are reported in
Table 8. The alphanumeric codes associated with the conducts criteria which present the highest percent values were 3SL5 (68.0) in women and 3CL5 (62.9) in the men. The alphanumeric codes linked to the aggregates criteria showing the highest percent values were 3Ra1 (60.0) in the women, and (80.0) in the men. The mean value of the conducts criteria was higher in the men than in the women except for SL10. The H5 and Ra5 aggregates criteria were higher in the women, and the T5 and La5 aggregates criteria in the men’s group. Only the SL10 conducts criteria revealed a statistically significant difference in the women and the men. The SL10 conducts criteria, and H5 and Ra5 aggregates criteria indicated a large effect size.
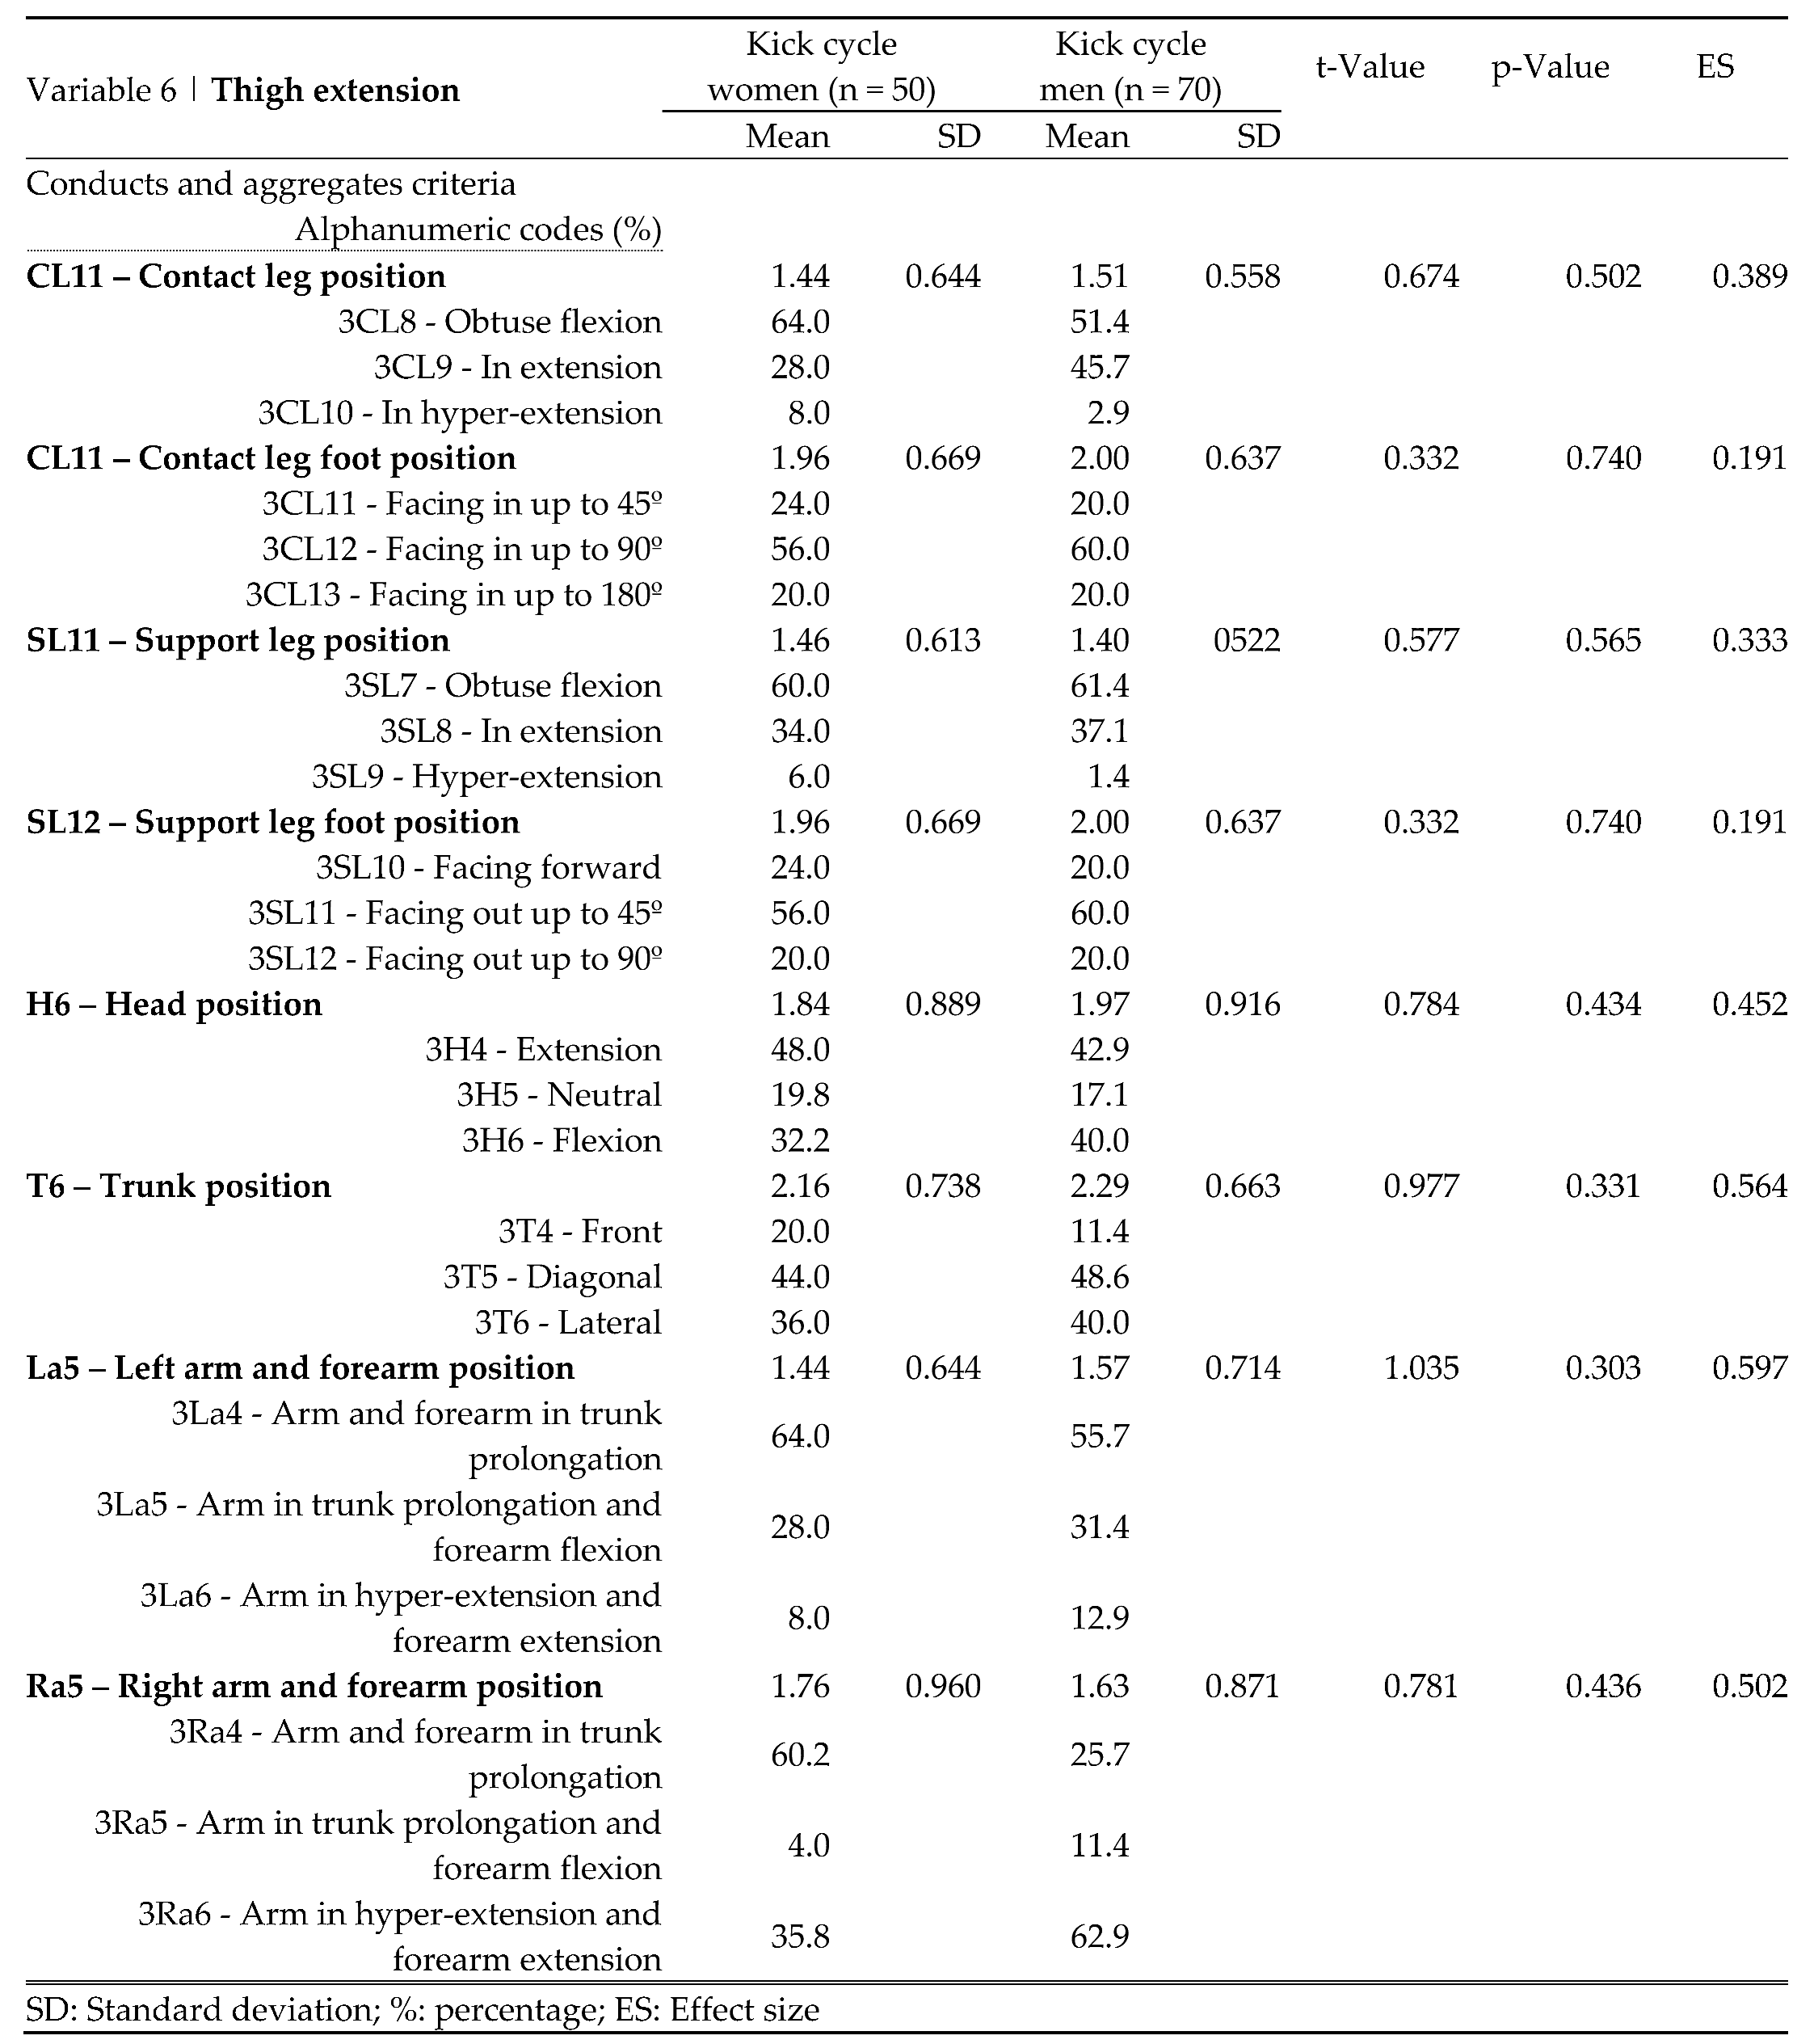
The thigh extension indices are reported in
Table 9. The alphanumeric codes associated with the conducts criteria which presented the highest percent values were 3CL8 (64.0) in women and 3SL7 (61.4) in the men. The alphanumeric codes linked to the aggregates criteria showing the highest percent values were 3La4 (64.0) in the women, and 3Ra6 (62.9) in the men. The mean value of the conducts criteria was higher in the men than the women except for SL11, and all the aggregates criteria were higher in the men’s group than the women’s group except for Ra6. No one conducts criteria showed a statistically significant difference in the women and the men. The T6, La6 and Ra6 aggregates criteria indicated a moderate effect size.
The
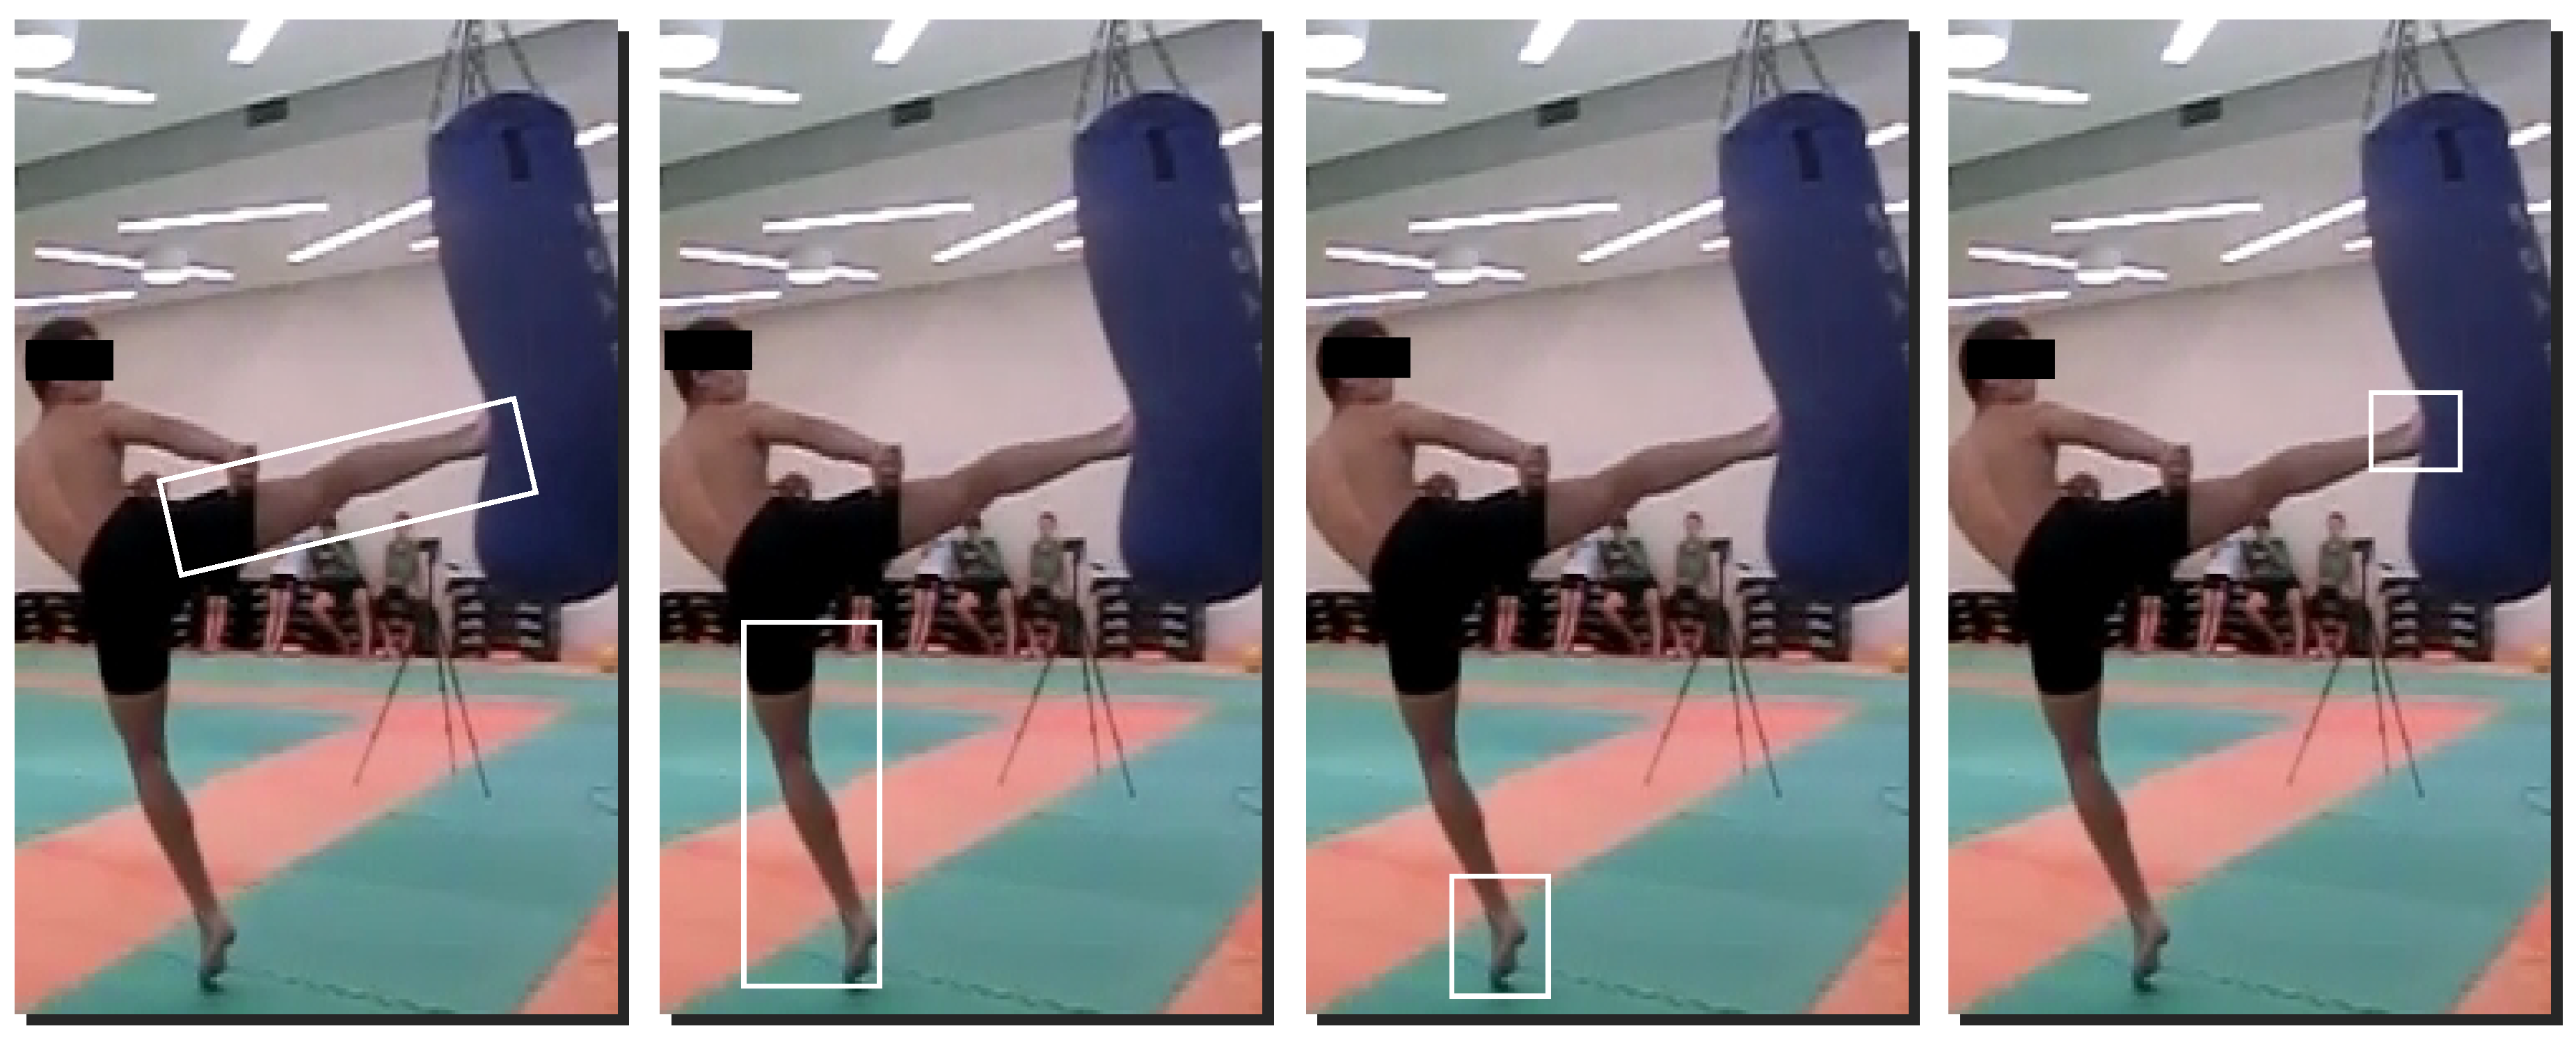
Figure 3 shows the observation moment of contact of the foot with the boxing bag. The contact leg and support leg are in obtuse flexion, the support leg foot is on tiptoe in external rotation less than 135º and the contact leg foot is on sole of the foot.
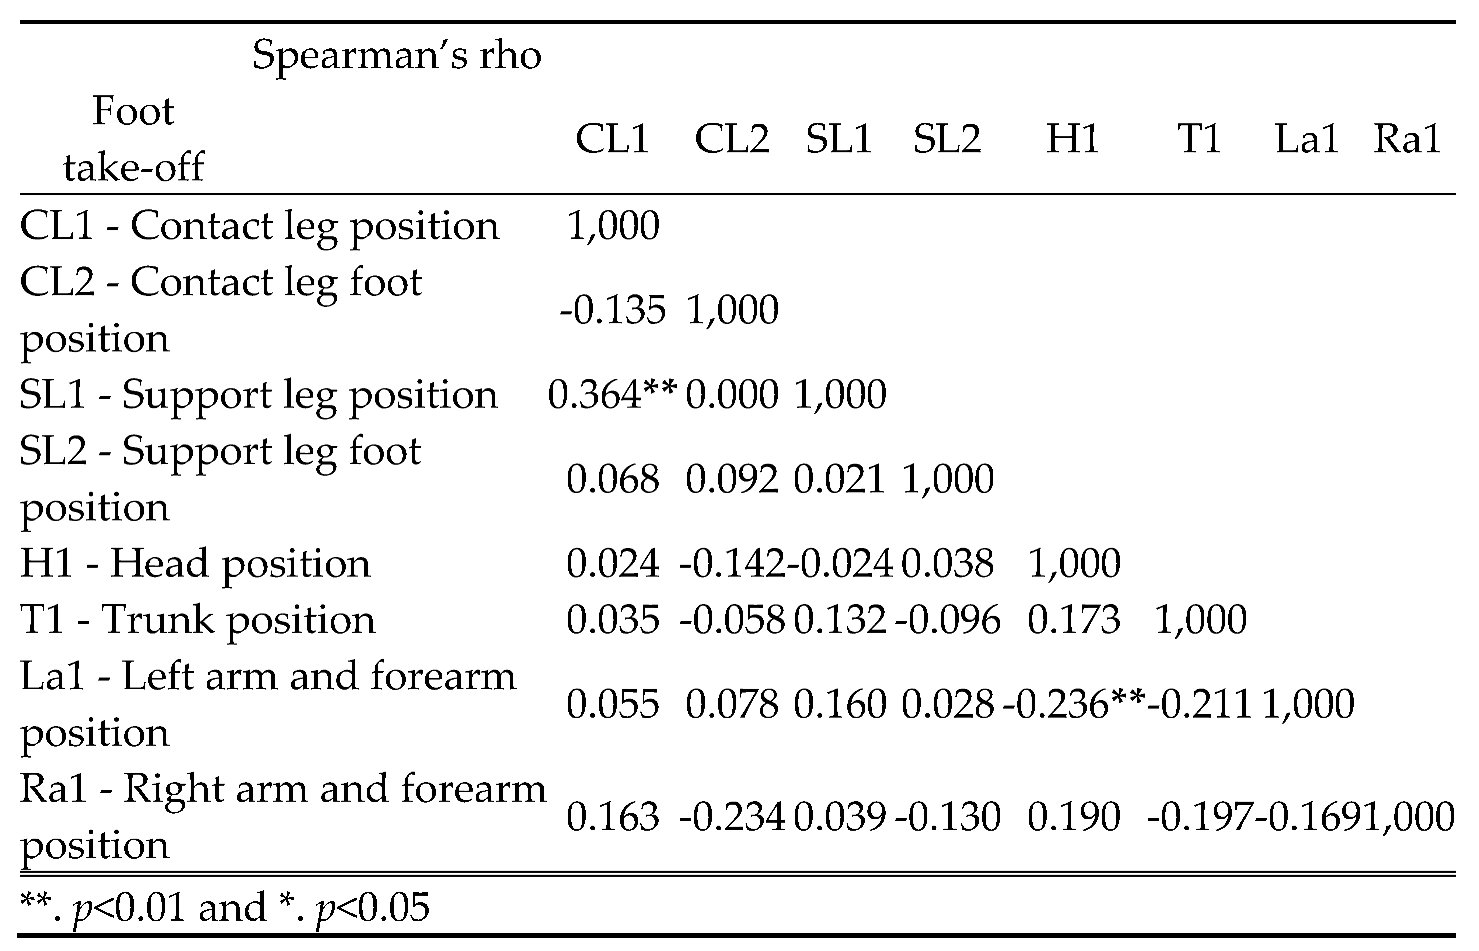
In the foot take-off moment Spearman’s correlation coefficient was statistically significant (
Table 10) showing a moderate correlation between the conducts criteria |”support leg and contact leg position”| (
p = 364;
p < 0.01), and a small and negative correlation between the aggregates criteria |”left arm and forearm” and “head position”| (
p = 236;
p < 0.01).
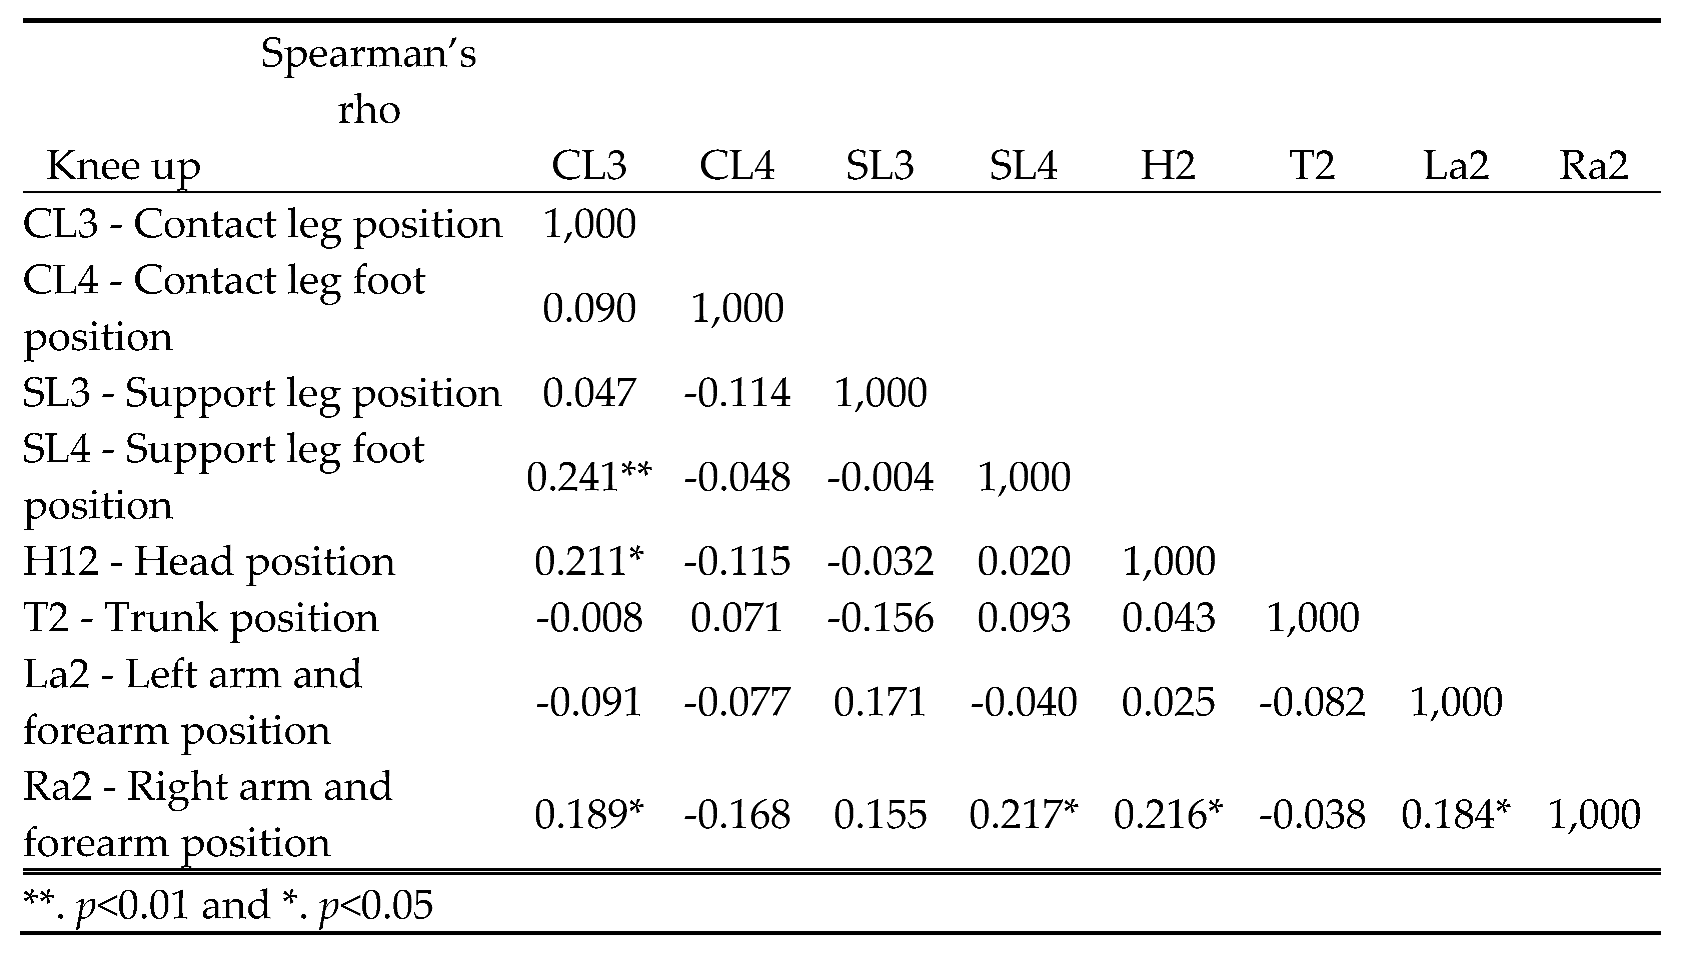
In the knee up moment the correlation coefficient was statistically significant (
Table 11) showing a small correlation between |”support leg foot” and “contact leg position”| (
p = 241;
p < 0.05), between |”head” and “contact leg position”| (
p = 211;
p < 0.05), and |”right arm and forearm” and “contact leg position”| (
p = 189;
p < 0.05), |”support leg foot position”| (
p = 217;
p < 0.05), |”head position”| (
p = 216;
p < 0.05) and |”left arm and forearm”| (
p = 184;
p < 0.05) respectively.
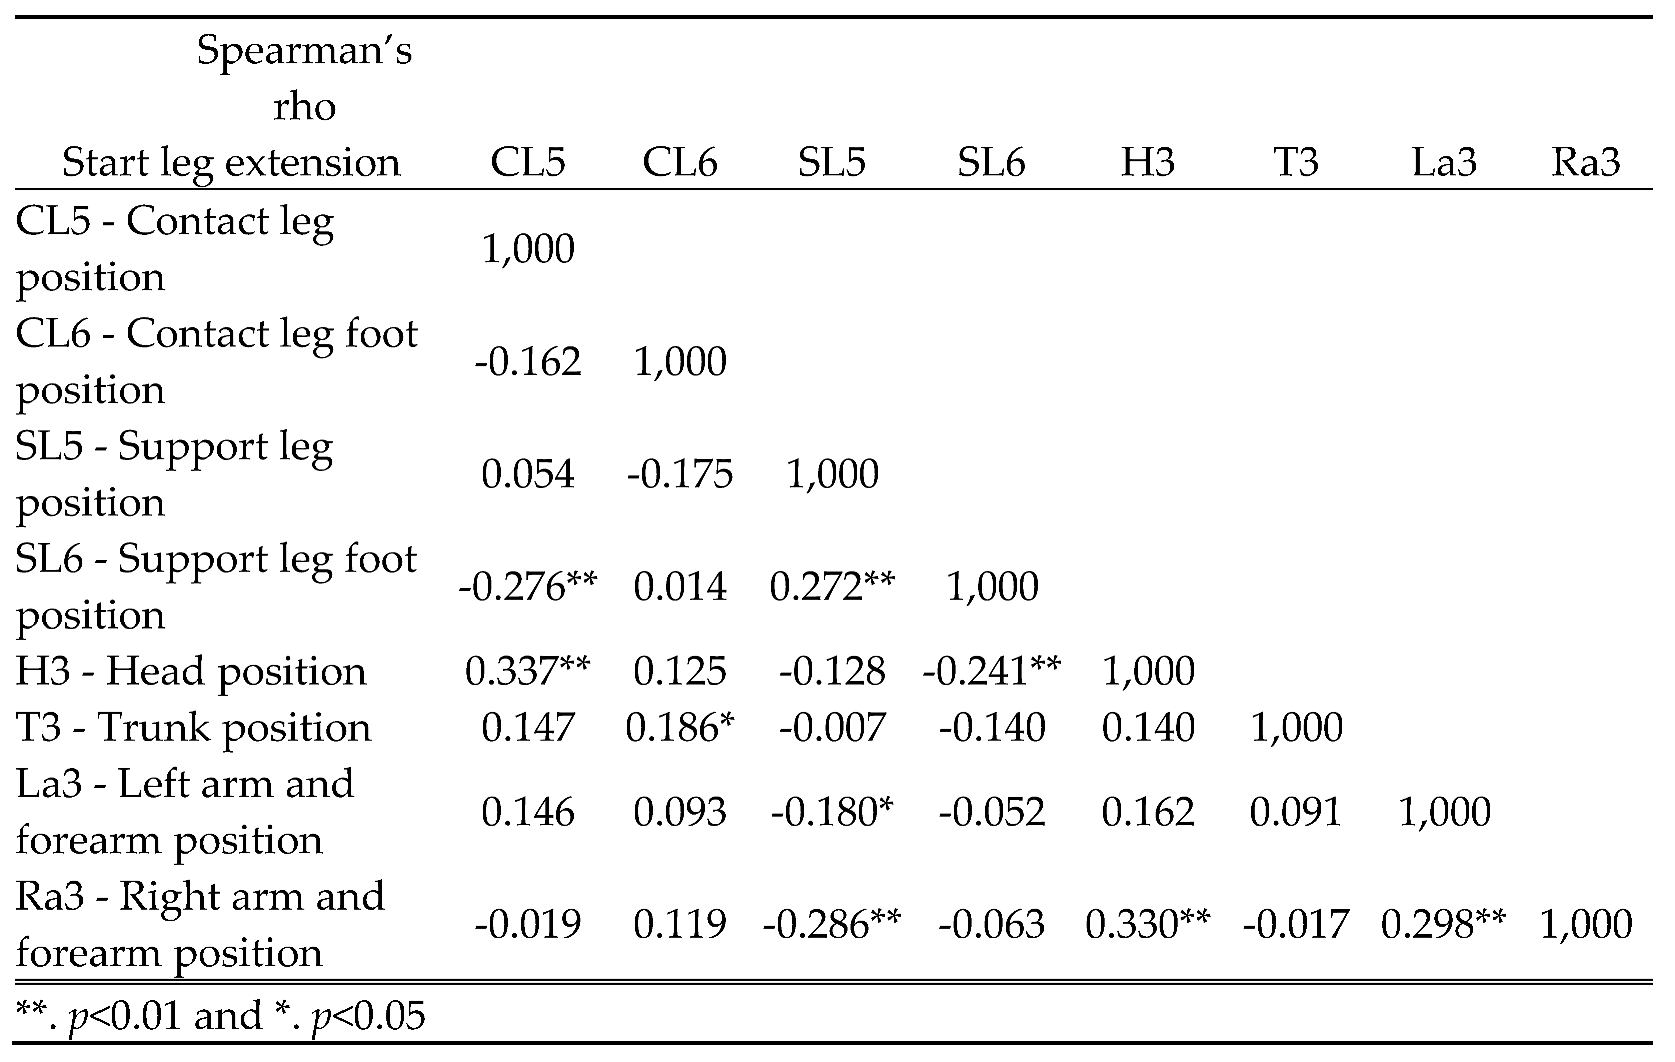
In the start leg extension moment the correlation coefficients were statistically significant (
Table 12) showing a small and negative correlation between |”support leg foot and contact leg position”| (
p = 276;
p < 0.01), between |”head and support leg foot position”| (
p = 241;
p < 0.01), between |”left arm and forearm” and “support leg position”| (
p = 180;
p < 0.05), and between |”right arm and forearm” and “support leg position”| (
p = 286;
p < 0.01); a small correlation between |”support leg foot and support leg position”| (
p = 272;
p < 0.01) and |”trunk” and “contact leg foot position”| (
p = 186;
p < 0.01); a moderate correlation between |”head and contact leg position”| (
p = 337;
p < 0.01), between |”right arm and forearm”, and “head position”| (
p = 330;
p < 0.01), and |”right arm and forearm”|, and |”left arm and forearm”| (
p = 298;
p < 0.01) respectively.
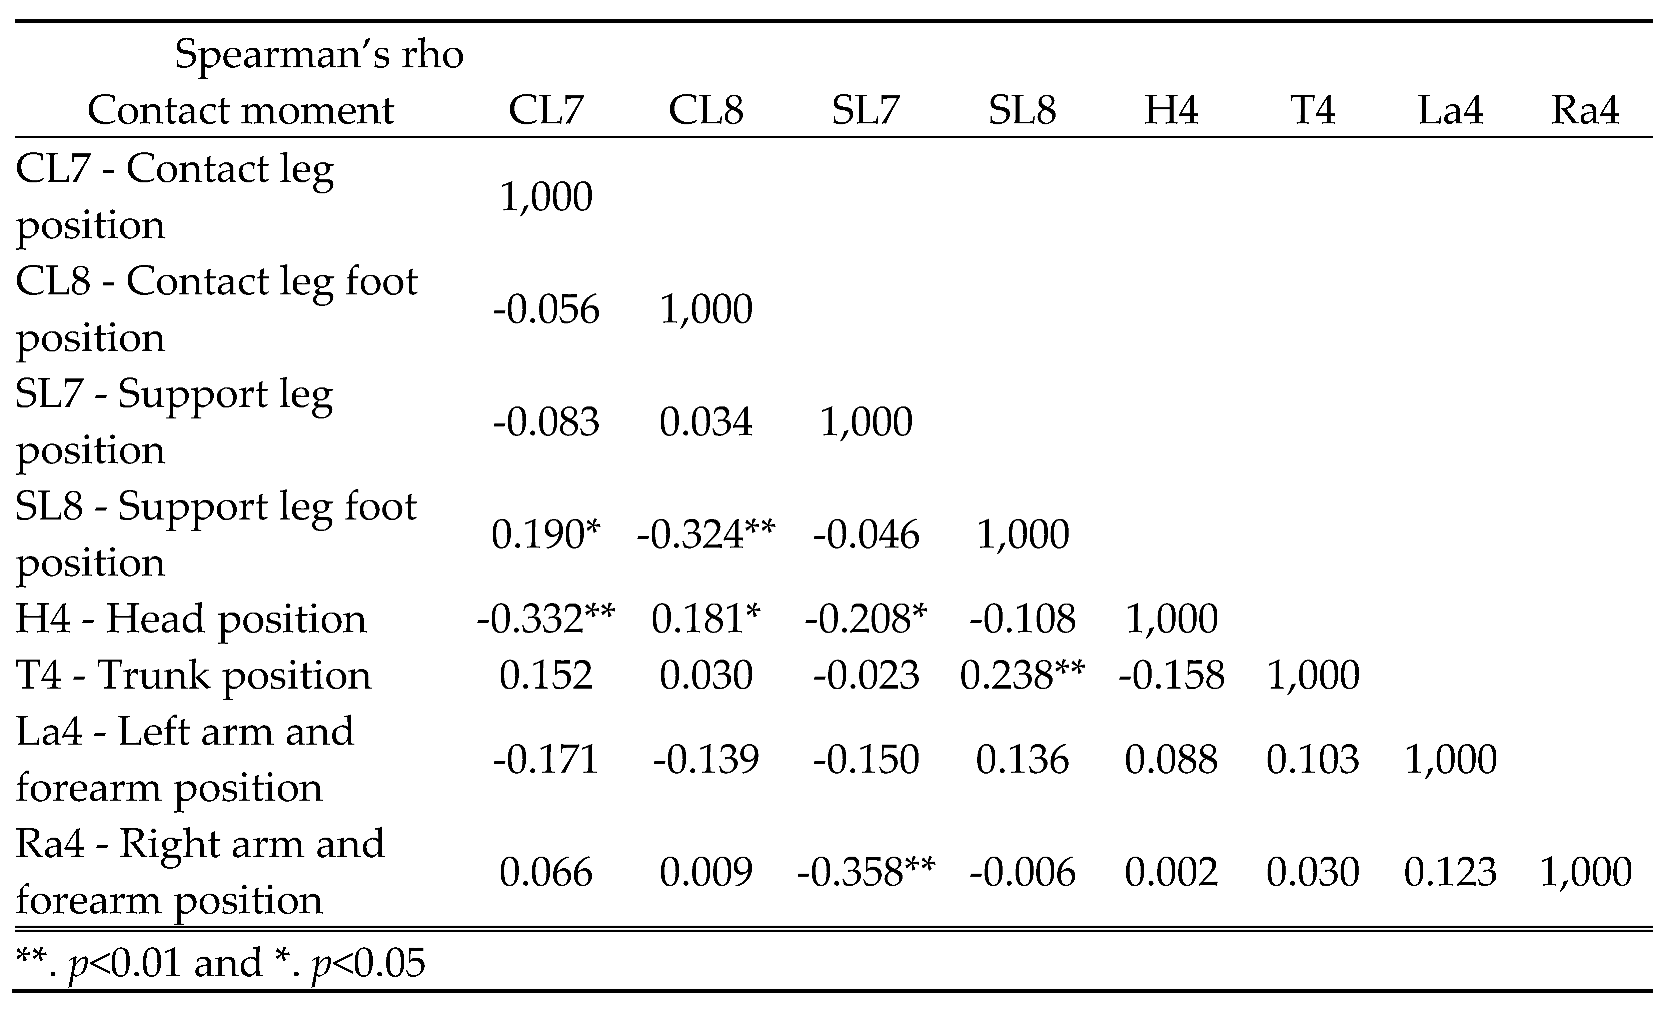
In the contact moment correlation coefficients were statistically significant (
Table 13) showing a small and negative correlation between |”head and support leg position”| (
p = 208;
p < 0.05); a moderate and negative correlation between |”support leg foot and contact leg foot position”| (
p = 324;
p < 0.01), and between |”head and contact leg position”| (
p = 332;
p < 0.01), and |“right arm and forearm and support leg position”| (
p = 358;
p < 0.01); and a small correlation between |”support leg and contact leg position”| (
p = 190;
p < 0.05), |”head and contact leg position”| (
p = 181;
p < 0.05), and |”trunk and support leg foot position”| (
p = 238;
p < 0.01).
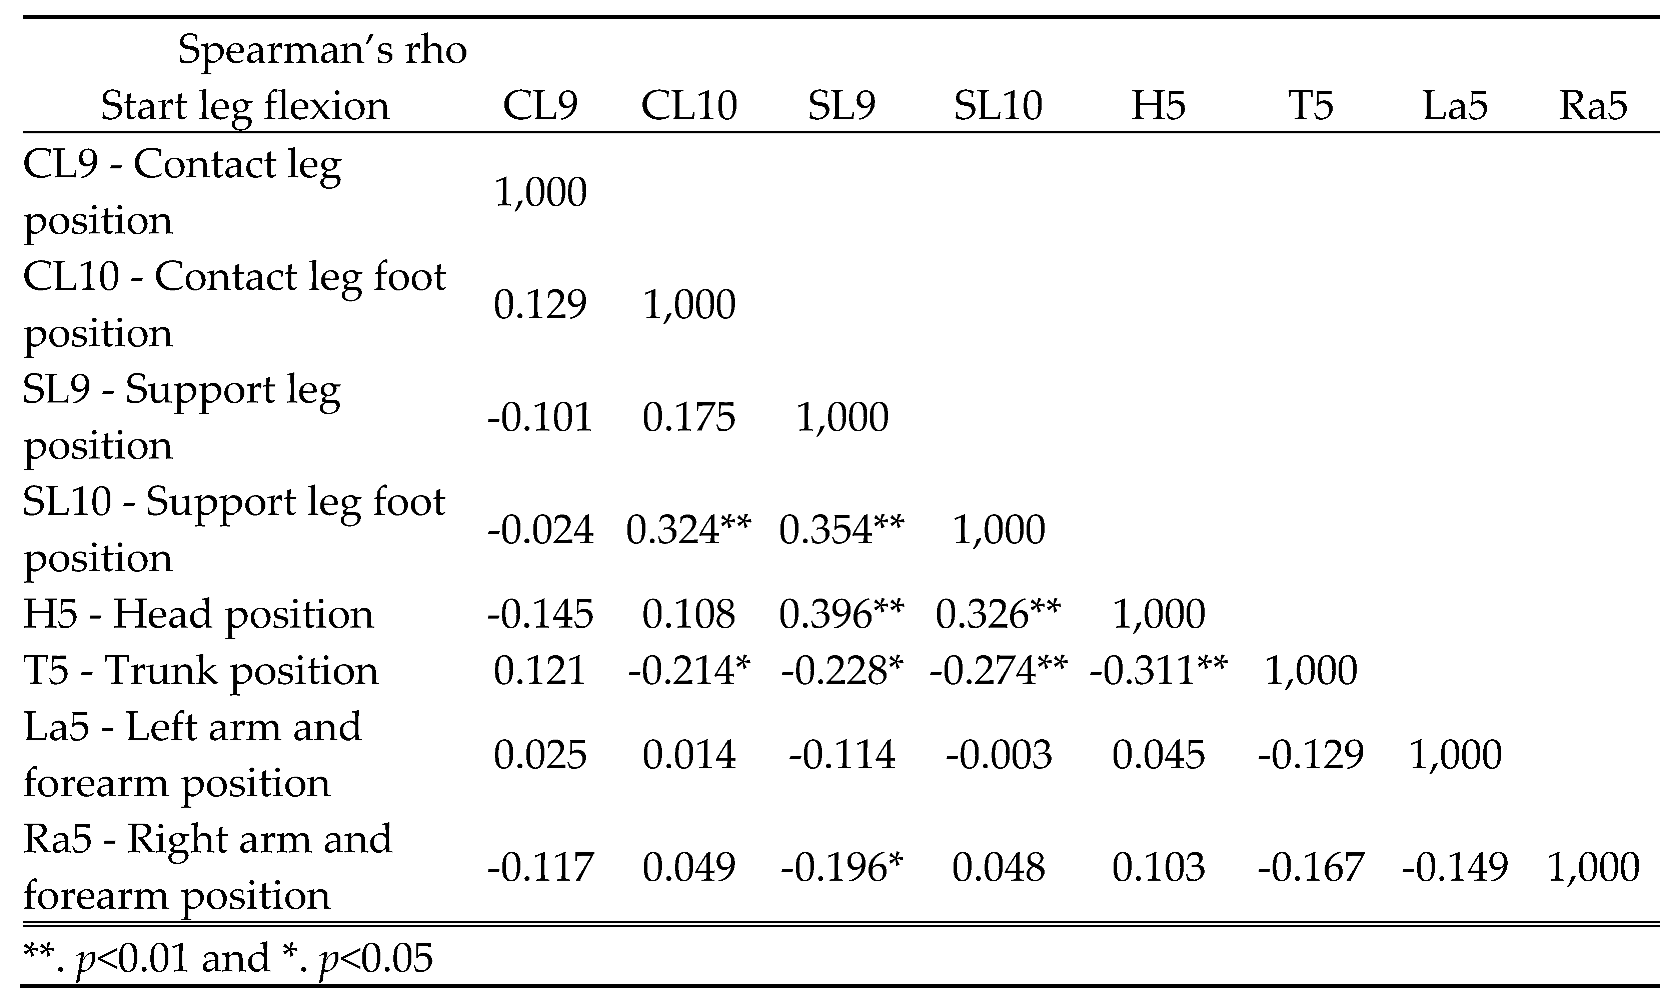
In the start leg flexion moment the correlation coefficients were statistically significant (
Table 14) showing a small and negative correlation between |”trunk” and “contact leg”| (
p = 214;
p < 0.05), |”support leg”| (
p = 228;
p < 0.05), and |”support leg foot position”| (
p = 274;
p < 0.01) respectively; also a small and negative correlation between |”right arm and forearm” and “support leg position”| (
p = 196;
p < 0.05); a moderate and negative correlation between |”trunk and head position”| (
p = 311;
p < 0.01); a moderate correlation between |”support leg foot” and “contact leg foot position”| (
p = 324; p < 0.01), between |”support leg foot” and “support leg position”| (
p = 354;
p < 0.01), between |”head and support leg position”| (
p = 396;
p < 0.01), and between |”head” and “support leg foot position”| (
p = 326;
p < 0.01).
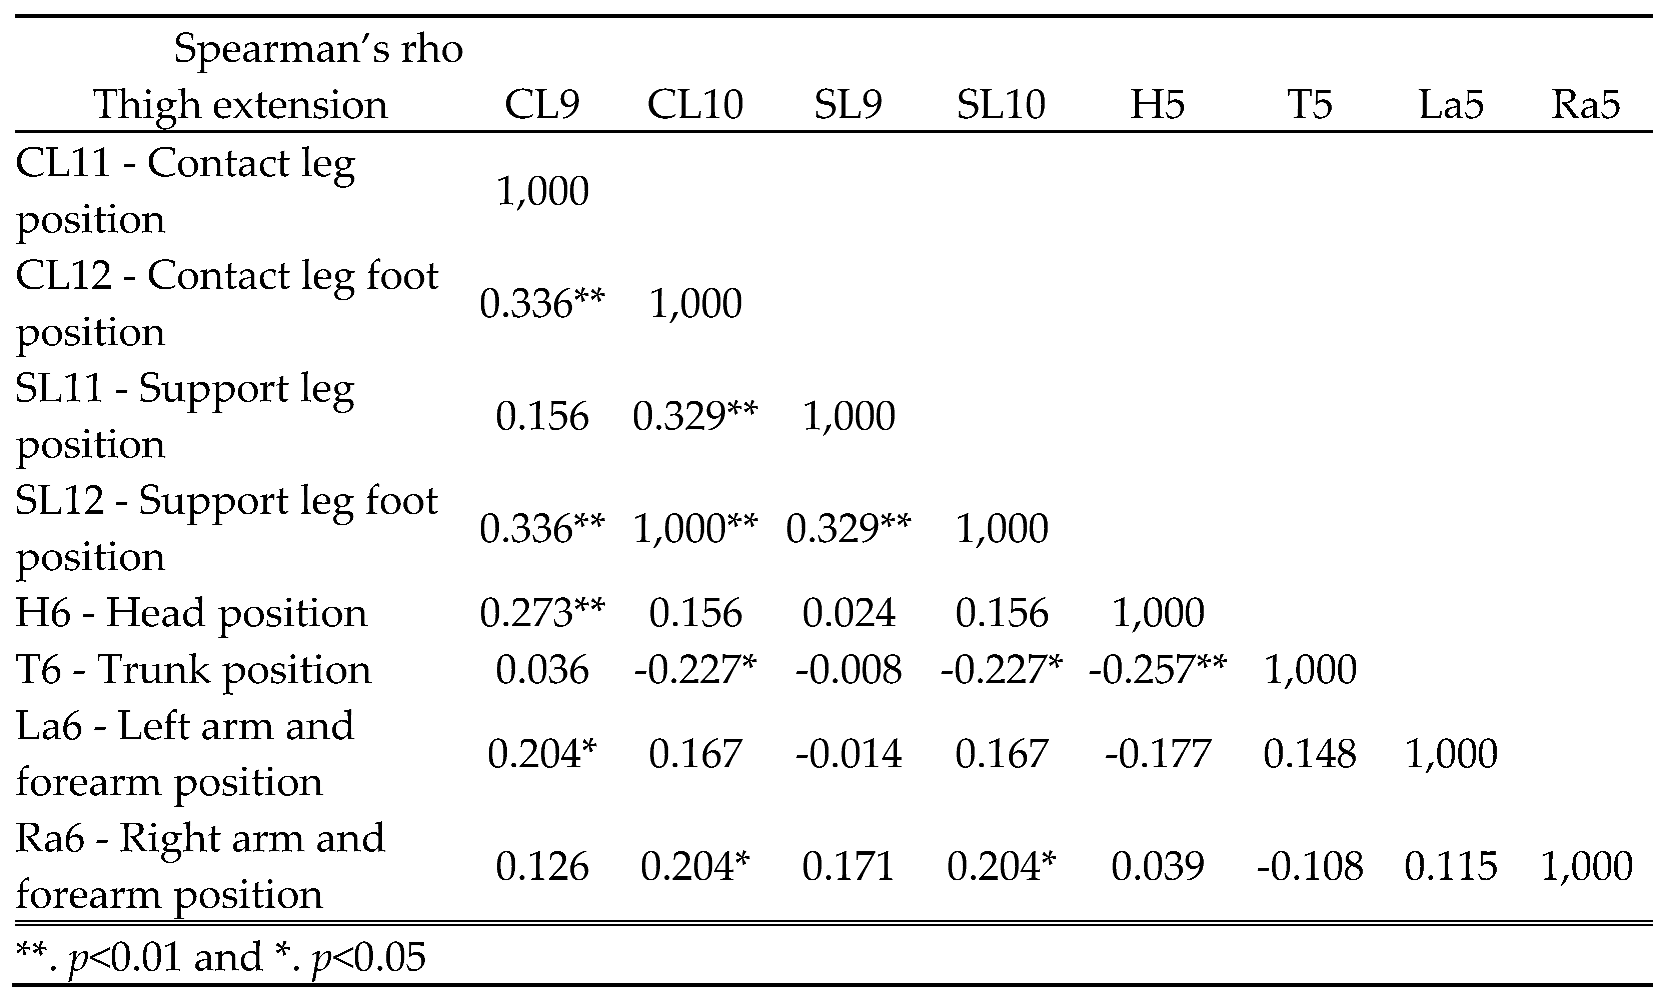
In the thigh extension moment the correlation coefficients were statistically significant (
Table 15) showing a small and negative correlation between |”trunk and contact leg foot position”| (
p = 227;
p < 0.05), |”support leg foot position”| (
p = 227;
p < 0.05), and |”head position”| (
p = 257;
p < 0.01) respectively. There was also a small correlation between |”head and contact leg position”| (
p = 273;
p < 0.01), between |”left arm and forearm” and “contact leg position”| (
p = 204;
p < 0.05), between |”right arm and forearm” and “contact leg”| (
p = 204;
p < 0.05), and between |“right arm and forearm” and “support leg foot position”| (
p = 204;
p < 0.05). A moderate correlation was found between |”contact leg foot and contact leg position”| (
p = 336;
p < 0.01), between |”support leg and contact leg foot position”| (
p = 329;
p < 0.01), between |”support leg foot and contact leg position”| (
p = 336;
p < 0.01), and between |”support leg foot” and “support leg position”| (
p = 329;
p < 0.01) respectively. A perfect correlation was revealed between |”support leg foot and contact leg position”| (
p = 1;
p < 0.01).
4. Discussion
The main aim of the present study was to verify and analyze the athletes’ technical indicators, during “a cycle of ten kicks” performed, in one usual combat Taekwondo technique, namely
Miluh-chagi. All the participants were black belt Taekwondo practitioners. We used the published Observation System for Technical Performance Indicators - Chagi (OSTIP-C) [
1] tool and a Taekwondo expert panel as evaluators. The results of our study suggest that OSTIP-C presents good reliability and precision to analyze motor behavior, motor development and motor performance [
1]. The athletes’ sample was composed of 5 women (41.7%) and 7 men (58.3%) Taekwondo practitioners who each performed “a cycle of ten kicks” (
n = 120) of the Miluh-chagi technique. The Taekwondo athletes’ characteristics were not statistically significant different in age and Taekwondo practice years (p>0.05). The men revealed a statistically significant different in height (t (10) = 3.958; p < 0.05) with a moderate effect size and weight (t (10) = 2.950; p < 0.05) with a small effect size. The effect size values findings in our study are in line those of Cohen and Lakens [
26,
27,
28]. The men’s group was, according to the mean, taller +3.4 cm and heavier +2.1 kg than women’s group, coinciding with [
2,
3,
4,
30,
31,
32] where researchers conclude that the men’s sample are taller and heavier than women’s group.
The coefficient of variation was calculated to verify the precision among the evaluators. The results show very good values for the evaluators. The variation results show that the men presented less variation than the women’s group. Our results are supported by various studies and in accordance with those of Hopkins (2000), Hopkins et al. (2009), and Reed et al. (2002) [
23,
24,
25]. The intraclass correlation coefficient (ICC) statistical method was used to confirm the evaluators’ reliability between variables at six observation moments. The reference values for the ICC were <0.5 (Poor), 0.5-0.75 (Moderate), 0.75-0.90 (Good), and ≥0.90 (Excellent) [
22,
23,
24]. The evaluator group analyzed the 6
th and 7
th kick of a cycle of ten kicks, executed by athlete #9 (woman), and athlete #5 (man) respectively. The results (
Table 3) confirm the reliability of the evaluators for both group (women and men). The women’s group results presented for intra-rater reliability (evaluator 1 vs. evaluator 1) were excellent with 0.956 (
p < 0.01) lower than Sousa et al., [
6] who presented 0.994 (
p < 0.05) with almost perfect conformity and Barrientos et al. with ICC = 0.99 that revealed excellent to perfect results [
33]. The inter-rater results, among the expert evaluators, presented good values of more than 0.800 (
p < 0.01) once again, lower than Sousa et al., who reported 0.968 (
p < 0.05) [
6]. Evaluator #2 was the one who presented the lowest inter-rater values (0.813) and evaluator #4 the highest 0.875 (
p < 0.01). In the men’s group the expert presented excellent intra-rater values of 0.977 (
p < 0.01). The inter-rater results, between expert and evaluators, show good values more than 0.840 (
p < 0.01). Again, the evaluator #2 showed lower values (0.845) between evaluators and expert, and evaluator #5 present good results 0.884 (
p < 0.01). The findings in our study concerning the evaluators’ reliability are supported by respective authors [
18,
19,
20,
21] who argue that good results are values above 0.800. On this issue, the strength of this study was that it used five evaluators, two more than the Ibáñez et al. and Barrientos et al. [
30,
33], and the same number as Sousa et al. [
6]. All ICC results in this study using the OSTPI-C tool showed nearly perfect or excellent to perfect observers’ agreement reliability [
6,
33]. Student´s
t-test was used to compare the maximum values of the variables: foot take-off, knee up, start leg extension, contact moment, start leg flexion, and thigh extension in the women and men Taekwondo athletes.
Phase 1 has two observation moments: (1) The
Foot take-off is composed of eight conducts and aggregates criteria (
Table 4). The mean and standard deviation of the conducts criteria (CL1, CL2, SL1, SL2), aggregates criteria (H1) were higher in the women and aggregates criteria (T1, La1, Ra2) in the men’s group. The alphanumeric codes associated with the conducts criteria which presented the highest mean percent value was 1CL2 (64.0) in the women and 1CL4 (68.6) in the men. The values found are in line with those Sousa et al. [
6]. The alphanumeric codes linked to aggregates criteria which presented highest mean percent value were for both groups 1T1 (72.0) and (68.6) in the women and men respectively. Sousa et al. and Louro et al. [
6,
34] presented lower values than the findings in our study. Only the conducts criteria CL2, contact leg foot position, showed a statistically significant difference in means in the women’s and men’s groups (p < 0.01). Student’s
t-test show that in THE mean, the women athletes present statistically significant difference in the conducts criteria contact leg foot position (t (118) = 4.811; p < 0.01)) with a large effect size. In the men’s group the contact leg foot position was 68.6% facing forward, and in the women’s group the alphanumeric codes 1CL5, facing out up to 45º, presented a value of 56.0% and 1CL4, facing forward, presented 32.0%. These findings are related to those of Sousa et al. [
6]. The aggregate criteria H1 and conduct criteria CL2 revealed a large effect size and no statistically significant difference (p > 0.05). (2) The
Knee up indices are composed of eight conducts and aggregates criteria (
Table 5). The mean and standard deviation of the conducts criteria (CL3, CL4) and the aggregates criteria (H2, T2, La2) were higher in the women. The conducts criteria (SL3, SL4) and aggregates criteria (Ra2) were higher in the men’s group. The alphanumeric codes associated with the conducts criteria which presented the highest mean percent value was 1SL8 (52.0) in the women and 1CL8 (60.0) in the men. The alphanumeric codes linked to the aggregates criteria were for both group 1La5 (72.0) and (68.6) the women and the men respectively. The values are lower than those of Sousa et al. [
6]. Only the conducts criteria CL4, contact leg foot position, presented a statistically significant difference in the means of the women’s and men’s groups (p < 0.01). Student’s
t-test shows that, in the means, the women athletes presented statistically significant differences in the conducts criteria contact leg foot position (t (118) = 4.264; p < 0.01)) with a large effect size. The alphanumeric codes of the contact leg foot position are 62.9% in the extension foot position for the men’s group and 40.0% in the flexion foot position for the women’s group. Sousa et al. [
6] presented similar results to the values found in our study. The aggregates criteria H2, and Ra2 indicated a very large effect size but do not present a statistically significant difference (p > 0.05).
Phase 2 has two moments of observation: (3) The
Start leg extension is composed of eight conducts and aggregates criteria (
Table 6). The mean and standard deviation of the conducts criteria (CL5, CL6) and aggregates criteria (Ra3) was higher in the women. The conducts criteria (SL5, SL6) and aggregates criteria (H3, T3, La3) were higher in the men’s group. The alphanumeric codes associated with the conducts criteria which presented highest mean percent value were 2SL4 (64.0) in the women and 2SL2 (65.7) in the men. The alphanumeric codes linked to the aggregates criteria which showed the highest mean percent values were 2La2 and 2Ra2 (60.0) in the women, and 2La2 (71.4) in the men’s group. The authors Sousa et al. [
6] also found a higher mean percent in this aggregate. Student’s
t-test shows that in mean, the women’s and men’s groups did not present statistically significant differences in any conducts or aggregate criteria, but a trivial to moderate effect size, and the CL5 conducts indicated a large effect size of 0.845, | d | > 0.79 (large). (4) The
Contact moment is composed of eight conducts and aggregates criteria (
Table 7). The mean and standard deviation of the conducts and aggregates criteria were higher in the women’s group except in the conducts criteria SL8. The alphanumeric codes associated with the conducts criteria which presented the highest mean percent value were 2SL8 (56.0) in women and 2CL11, and 2SL8 (54.3) in the men. These results are not in agreement with Sousa et al. [
6], regarding the contact area of the foot with the target, that has shown a greater stability index of 97%. The alphanumeric codes linked to the aggregates criteria which showed the highest mean percent values were 2La5 (84.0) in the women, and (77.1) in the men’s group. Student’s
t-test shows that in mean, the women and men’s groups did not present statistically significant differences in any conducts or aggregate criteria. The SL8 and La4 conducts criteria indicated a large effect size with 0.846 and 0.958 (| d | > 0.79) respectively. These findings are similar to those shown by Sousa et al. [
6].
Phase 3 has two moments of observation: (5) The
start leg flexion is composed of eight conducts and aggregates criteria (
Table 8). The alphanumeric codes associated with the conducts criteria which presented the highest mean percent value were 3SL5 (68.0) in the women and 3CL5 (62.9) in the men’s group. The alphanumeric code linked to the aggregates criteria showing the highest mean percent values was 3Ra1 (60.0) in the women, and (80.0) in the men’s group. The mean and standard deviation of the conducts criteria were higher in the men than the women’s group except for SL10. The H5 and Ra5 aggregates criteria were higher in the women, and T5 and La5 aggregates criteria in the men’s group. These findings agree with those of Sousa et al. [
6]. Student’s
t-test shows that in mean, the women’s and men’s groups presented statistically significant differences in the conducts criteria (SL10), contact leg foot position (t (118) = 3.272; p < 0.01)) with scale 1.889 corresponding to a large effect size (| d | > 0.79), which means the support leg foot position is 68% facing out in external rotation up to 90º for the women, and only 45.7% in the men’s group. The aggregates criteria (H5 and Ra5) indicated a large effect size with 1.050 and 1.213 (| d | > 0.79) respectively. (6) The
thigh extension is composed of eight conducts and aggregates criteria (
Table 9). The mean and standard deviation of the conducts and aggregate criteria were higher in the men’s than the women’s group except for SL11 and Ra6. The alphanumeric codes associated with the conducts criteria which presented the highest mean percent value were 3CL8 (64.0) in the women and 3SL7 (61.4) in the men. These values are lower than those of Sousa et al. [
6] who presented a stability index of more than 80.0%. The alphanumeric codes linked to the aggregates criteria which showed the highest mean percent values were 3La4 (64.0) in the women, and 3Ra6 (62.9) in the men’s group. Student’s
t-test showed that in the mean, the women’s and men’s groups did not present statistically significant differences in any conducts or aggregate criteria. The T6, La6 and Ra6 conducts criteria indicated a moderate effect size with 0.564, 0.597 and 0.502 (| d | = 0.50 - 0.79) respectively.
The Correlation Coefficient analysis was carried out calculating Spearman’s rho. The criteria indicated by Hopkins et al. [
23,
24] were used to assess the strength of correlation. Kwon, Kline, and Kline and Klammer [
29,
35,
36] argued that it is difficult to measure the variables X and Y as separate latent constructs with a correlation of 0.90. The correlation coefficient values for all the variables did not exceed 0.85, which shows that there was no problem of multicollinearity [
35]. Statistical significance was set at p < 0.05 for all the analyses in this study. A statistically significant correlation coefficient showing a small and negative correlation between two latent constructs was found as follows: In the foot take-off instant of observation between left arm and forearm and head position; in the start leg extension between support leg foot and contact leg position; between left arm and forearm, and support leg position; between support leg foot and contact leg position; in the contact moment between right arm and forearm, and support leg position; in the start leg flexion between trunk and contact leg, support leg and support leg foot position, and right arm and forearm and support leg position; and in the thigh extension between trunk and contact leg foot and support leg foot, and head position. A small correlation was found as follows: In the knee up, between support leg foot and contact leg position; between head and contact leg position; between right arm and forearm and contact leg position, support leg foot position, head position and left arm and forearm; in the start leg extension, between support leg foot and support leg position; between trunk and contact leg foot position; between right arm and forearm, and support leg position; in the contact moment, between trunk and support leg foot position; in the thigh extension, between head and contact leg position; between left arm and forearm and contact leg position; and between right arm and forearm and contact leg, and support leg foot position. These results are comparable to those reported by Sousa et al. [
6].
A moderate and negative correlation was found as follows: In the contact moment, between support leg foot and contact leg foot position; between head, and contact leg position and support leg position respectively; and in the start leg flexion, between trunk and head position. A moderate correlation was found as follows: In the foot take-off, between contact leg foot and contact leg position; in the start leg extension, between head and contact leg position, between right arm and forearm and head, and left arm and forearm; in the start leg flexion, between support leg foot and contact leg foot position and support leg position, and between head and support leg position and support leg foot position; in the thigh extension, between contact leg foot and contact leg position, and between support leg and contact leg foot position. And, finally between support leg foot and contact leg position, and support leg position. Our study showed a perfect correlation (
p = 1;
p < 0.01), in the thigh extension instant of observation, between support leg foot and contact leg position. The Sousa et al. [
6] study showed different results, they found a perfect stability index of 97% regarding the contact area of the foot.
Figure 3.
- Event configuration framework of V4: “contact moment”.
Figure 3.
- Event configuration framework of V4: “contact moment”.
Table 2.
- Taekwondo women and men athletes’ characteristics. Mean ± Standard Deviation (SD) and Student´s t-test.
Table 2.
- Taekwondo women and men athletes’ characteristics. Mean ± Standard Deviation (SD) and Student´s t-test.
Table 3.
- Intraclass correlation coefficient (ICC) reliability of evaluators, and coefficient of variation (CV) after analyzing the 6th and 7th cycle of the whole cycle of ten kicks (n = 120).
Table 3.
- Intraclass correlation coefficient (ICC) reliability of evaluators, and coefficient of variation (CV) after analyzing the 6th and 7th cycle of the whole cycle of ten kicks (n = 120).
Table 4.
- Foot take-off, in the women and men (%). Mean ± standard deviation (SD), Student’s t-test and Effect size for the whole a cycle of ten kicks (n = 120).
Table 4.
- Foot take-off, in the women and men (%). Mean ± standard deviation (SD), Student’s t-test and Effect size for the whole a cycle of ten kicks (n = 120).
Table 5.
- Knee up (%), in the women and men. Mean ± Standard Deviation (SD), Student’s t-test and Effect Size for the whole cycle of ten kicks (n = 120).
Table 5.
- Knee up (%), in the women and men. Mean ± Standard Deviation (SD), Student’s t-test and Effect Size for the whole cycle of ten kicks (n = 120).
Table 6.
- Start leg extension (%), in the women and men. Mean ± Standard Deviation (SD), Student’s t-test and Effect Size for the whole cycle of ten kicks (n = 120).
Table 6.
- Start leg extension (%), in the women and men. Mean ± Standard Deviation (SD), Student’s t-test and Effect Size for the whole cycle of ten kicks (n = 120).
Table 7.
- Contact moment (%), in women and men. Mean ± Standard Deviation (SD), Student’s t-test and Effect Size for the whole cycle of ten kicks (n = 120).
Table 7.
- Contact moment (%), in women and men. Mean ± Standard Deviation (SD), Student’s t-test and Effect Size for the whole cycle of ten kicks (n = 120).
Table 8.
- Start leg flexion (%), in women and men. Mean ± Standard Deviation (SD), Student’s t-test and Effect Size for the whole cycle of ten kicks (n = 120).
Table 8.
- Start leg flexion (%), in women and men. Mean ± Standard Deviation (SD), Student’s t-test and Effect Size for the whole cycle of ten kicks (n = 120).
Table 9.
- Thigh extension (%), in the women and the men. Mean ± Standard Deviation (SD), Student’s t-test and Effect Size for the whole cycle of ten kicks (n = 120).
Table 9.
- Thigh extension (%), in the women and the men. Mean ± Standard Deviation (SD), Student’s t-test and Effect Size for the whole cycle of ten kicks (n = 120).
Table 10.
- The whole cycle of ten kicks (n = 120) correlation coefficient analysis results.
Table 10.
- The whole cycle of ten kicks (n = 120) correlation coefficient analysis results.
Table 11.
- The whole cycle of ten kicks (n = 120) correlation coefficient analysis results.
Table 11.
- The whole cycle of ten kicks (n = 120) correlation coefficient analysis results.
Table 12.
- The whole cycle of ten kicks (n = 120) correlation coefficient analysis results.
Table 12.
- The whole cycle of ten kicks (n = 120) correlation coefficient analysis results.
Table 13.
- The whole cycle of ten kicks (n = 120) correlation coefficient analysis results.
Table 13.
- The whole cycle of ten kicks (n = 120) correlation coefficient analysis results.
Table 14.
- The whole cycle of ten kicks (n = 120) correlation coefficient analysis results.
Table 14.
- The whole cycle of ten kicks (n = 120) correlation coefficient analysis results.
Table 15.
- The whole cycle of ten kicks (n = 120) correlation coefficient analysis results.
Table 15.
- The whole cycle of ten kicks (n = 120) correlation coefficient analysis results.
