1. Introduction
With the accelerated development of industrialisation and the intelligent development of electronic devices, the range of applications of printed circuit boards [
1] is being further expanded. In the use of electronic devices containing printed circuit boards, board missing_hole, mouse_bite, open_circuit, short, spur, spurious_copper defects can lead to damage to electronic devices and, more seriously, can cause major safety accidents. The safety and stability of printed circuit boards becomes very important and requires that defects are checked in time to eliminate safety hazards.
Printed circuit board surface defects are small and varied, making the manual visual inspection method, detection efficiency is low and the rate of missed detection is high. Automatic optical inspection [
2] method accuracy is low, vulnerable to interference, detection speed is slow. With the rapid development of computer technology advances and improved deep learning in the direction of image processing [
3,
4,
5,
6,
7], researchers have proposed a variety of printed circuit board defect detection methods based on deep learning [
8].
One class is the defect detection methods based on traditional convolutional neural networks [
9]. A multi-scale feature fusion detection method is implemented based on upsampling and layer-hopping connections [
10]. Detection methods based on basic convolutional neural networks with multiple segmentation of defect regions. Defect detection method based on FasterRcnn multi-attention fusion mechanism. Anti-disturbance encoder [
11,
12,
13,
14], decoder structure of convolutional neural network defect detection methods. Such defect detection methods have complex network structures, large number of parameters and slow detection speed.
The other category is the YOLO [
15] family of defect detection methods. Target detection methods using ResNet as the backbone feature extraction network of YOLOv3 [
16]. Target detection methods based on the backbone feature extraction network of YOLOv4 [
17,
18], incorporating long-range attention mechanisms. Defect detection method based on YOLOv5 [
19,
20,
21] network with enhanced perceptual field by introducing coordinate attention mechanism and enhanced multi-scale feature fusion. Based on the improved MobileNetv3 as the backbone feature extraction network, ECAnet [
22] is introduced to adjust the feature weights adaptively to enhance the feature extraction of the network. Such defect detection methods have a small number of parameters and relatively fast detection speed, but for small target [
23,
24] defect detection, the feature extraction strength is insufficient and the detection accuracy is low.
Currently, printed circuit board defect detection has two difficulties: (1) defect detection network model layers, complex network model, large number of parameters, low lightweight [
25,
26] degree, slow detection speed. (2) printed circuit board defect targets are small, and important defect features are difficult to extract, resulting in low accuracy of small target defect detection
In response to the above problems, this paper sets up a Double-Cross-Residual [
27] YOLO(DCR-YOLO) defect detection model. It meets the requirements of industrial real-time detection of small target defects. It solves the problem of low detection accuracy due to multiple defect detection network layers, complex model structure and low network lightweight.
2. Approach to the overall design of the DCR-YOLO network model
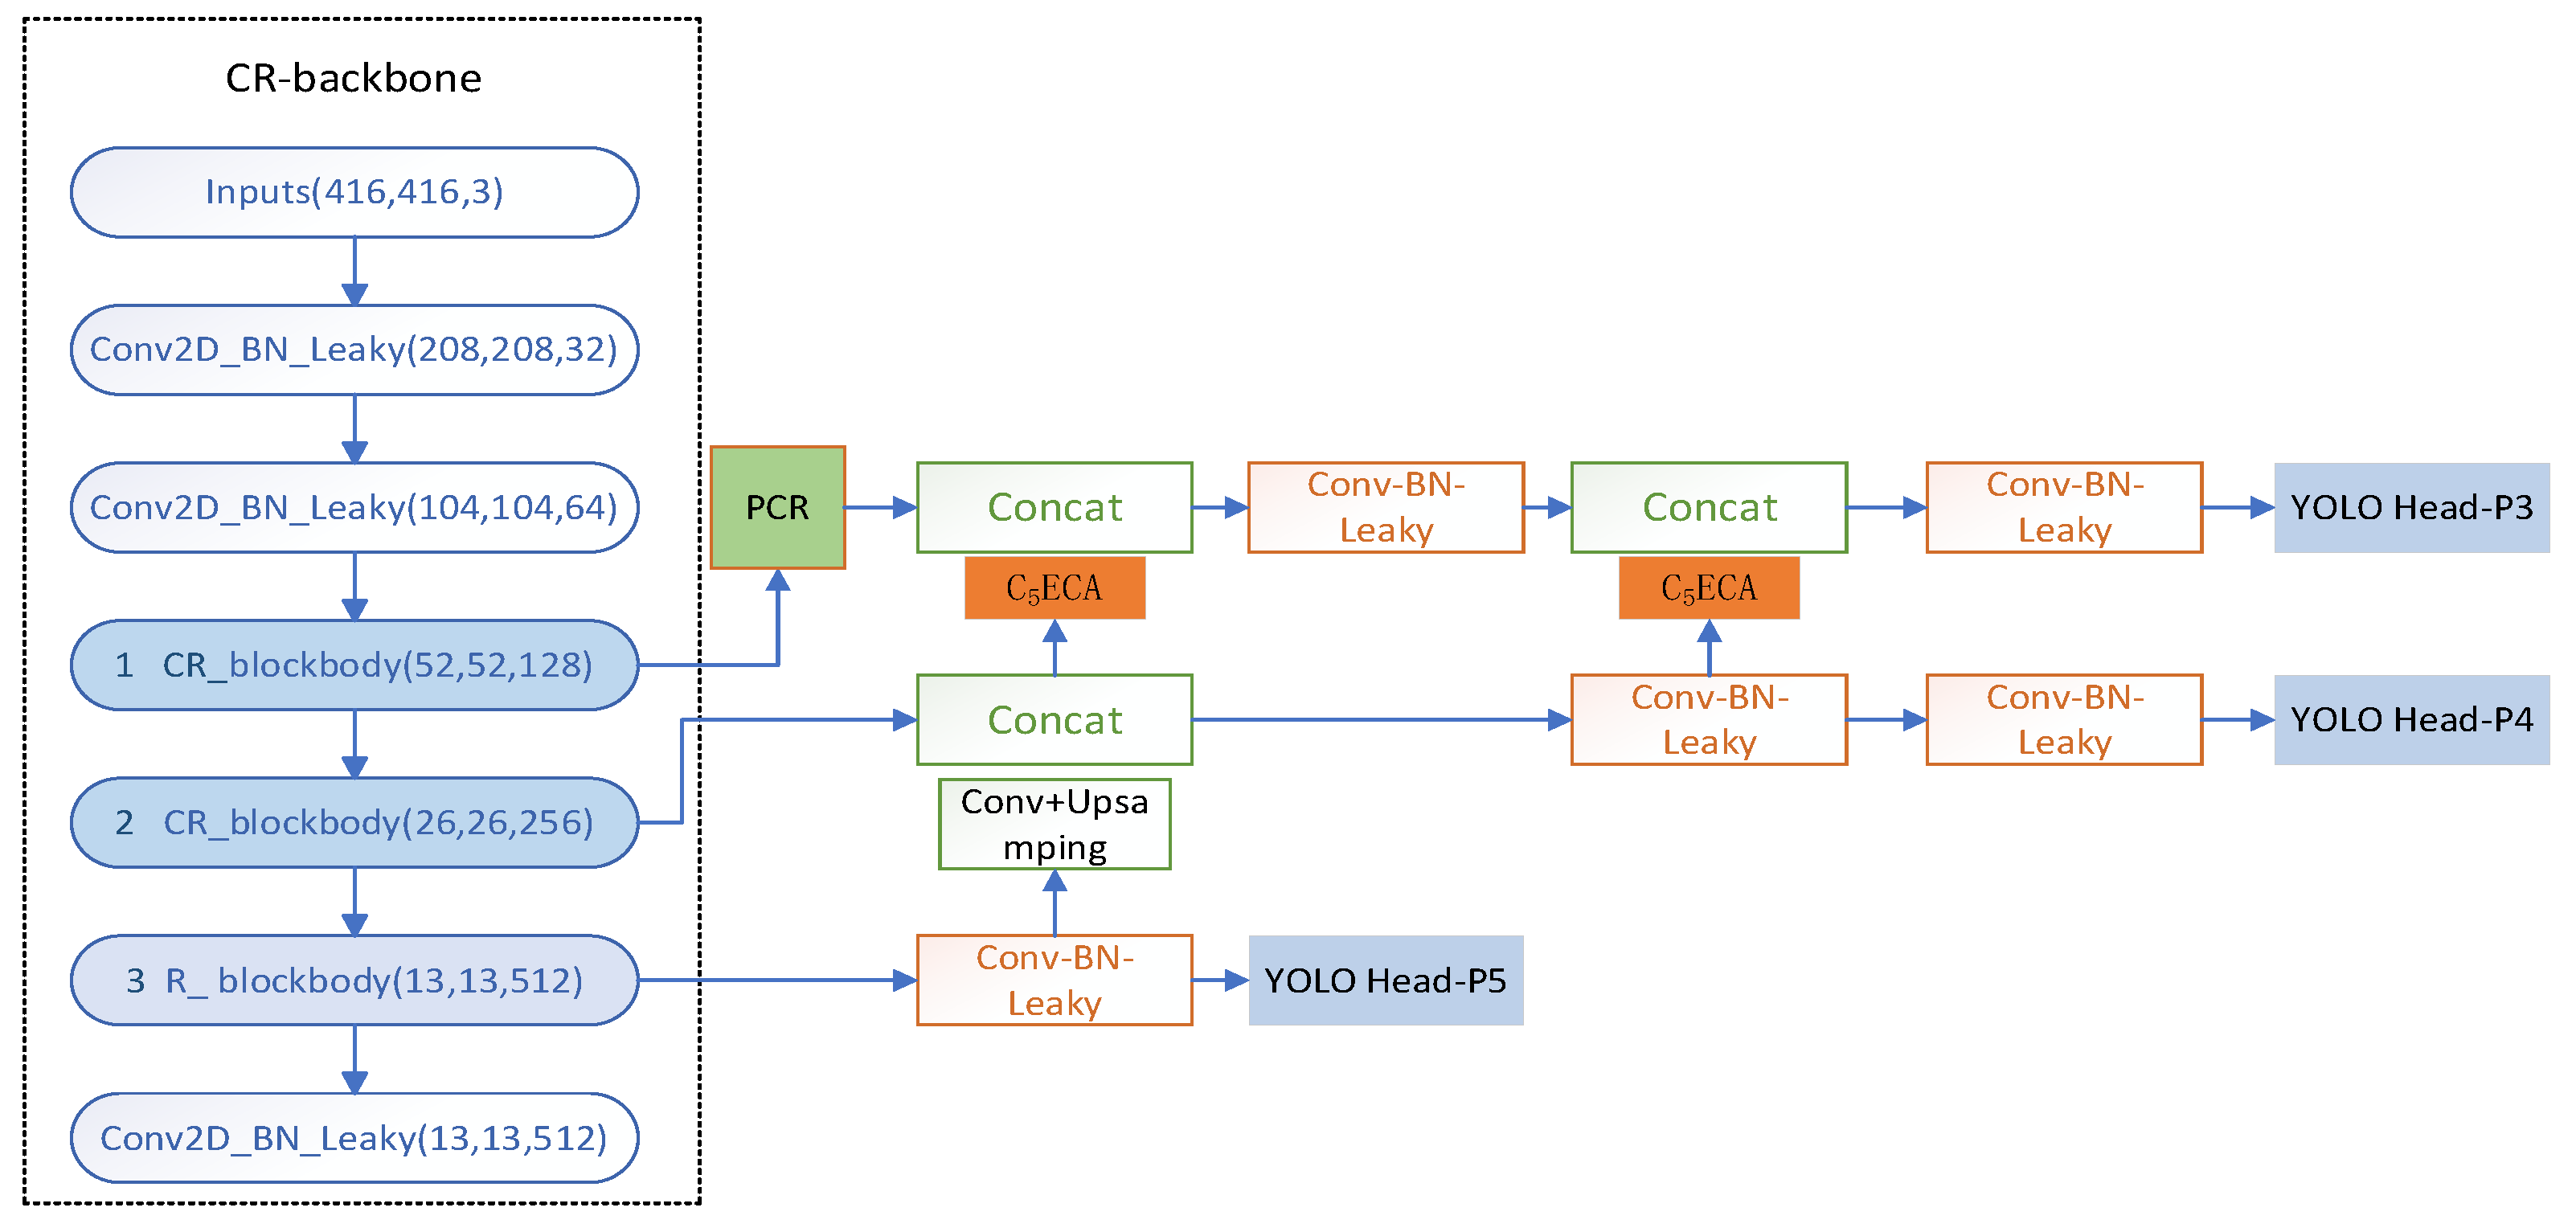
Due to the small surface defects of printed circuit boards, important defect features are difficult to extract. In order to meet the industrial requirements for accuracy and speed of detection of small target defects, the detection network needs to be improved for small target defect detection accuracy and to ensure a high degree of lightness of the detection network. In the single-stage YOLO target detection series of algorithms, both in terms of detection accuracy and detection speed have a good performance. The overall structure of the DCR-YOLO network is shown in
Figure 1.
The DCR-YOLO network mainly consists of the Double-Cross-Residual backbone (DCR-backbone) module, the Pooling-Convolution-Residual (PCR) module, the Same-Direction-Double-Top Feature Pyramid [
28] Network (SDDT-FPN) module, C
5ECA module, and three prediction heads, YOLO-Head.
2.1. Design of the DCR-backbone structure
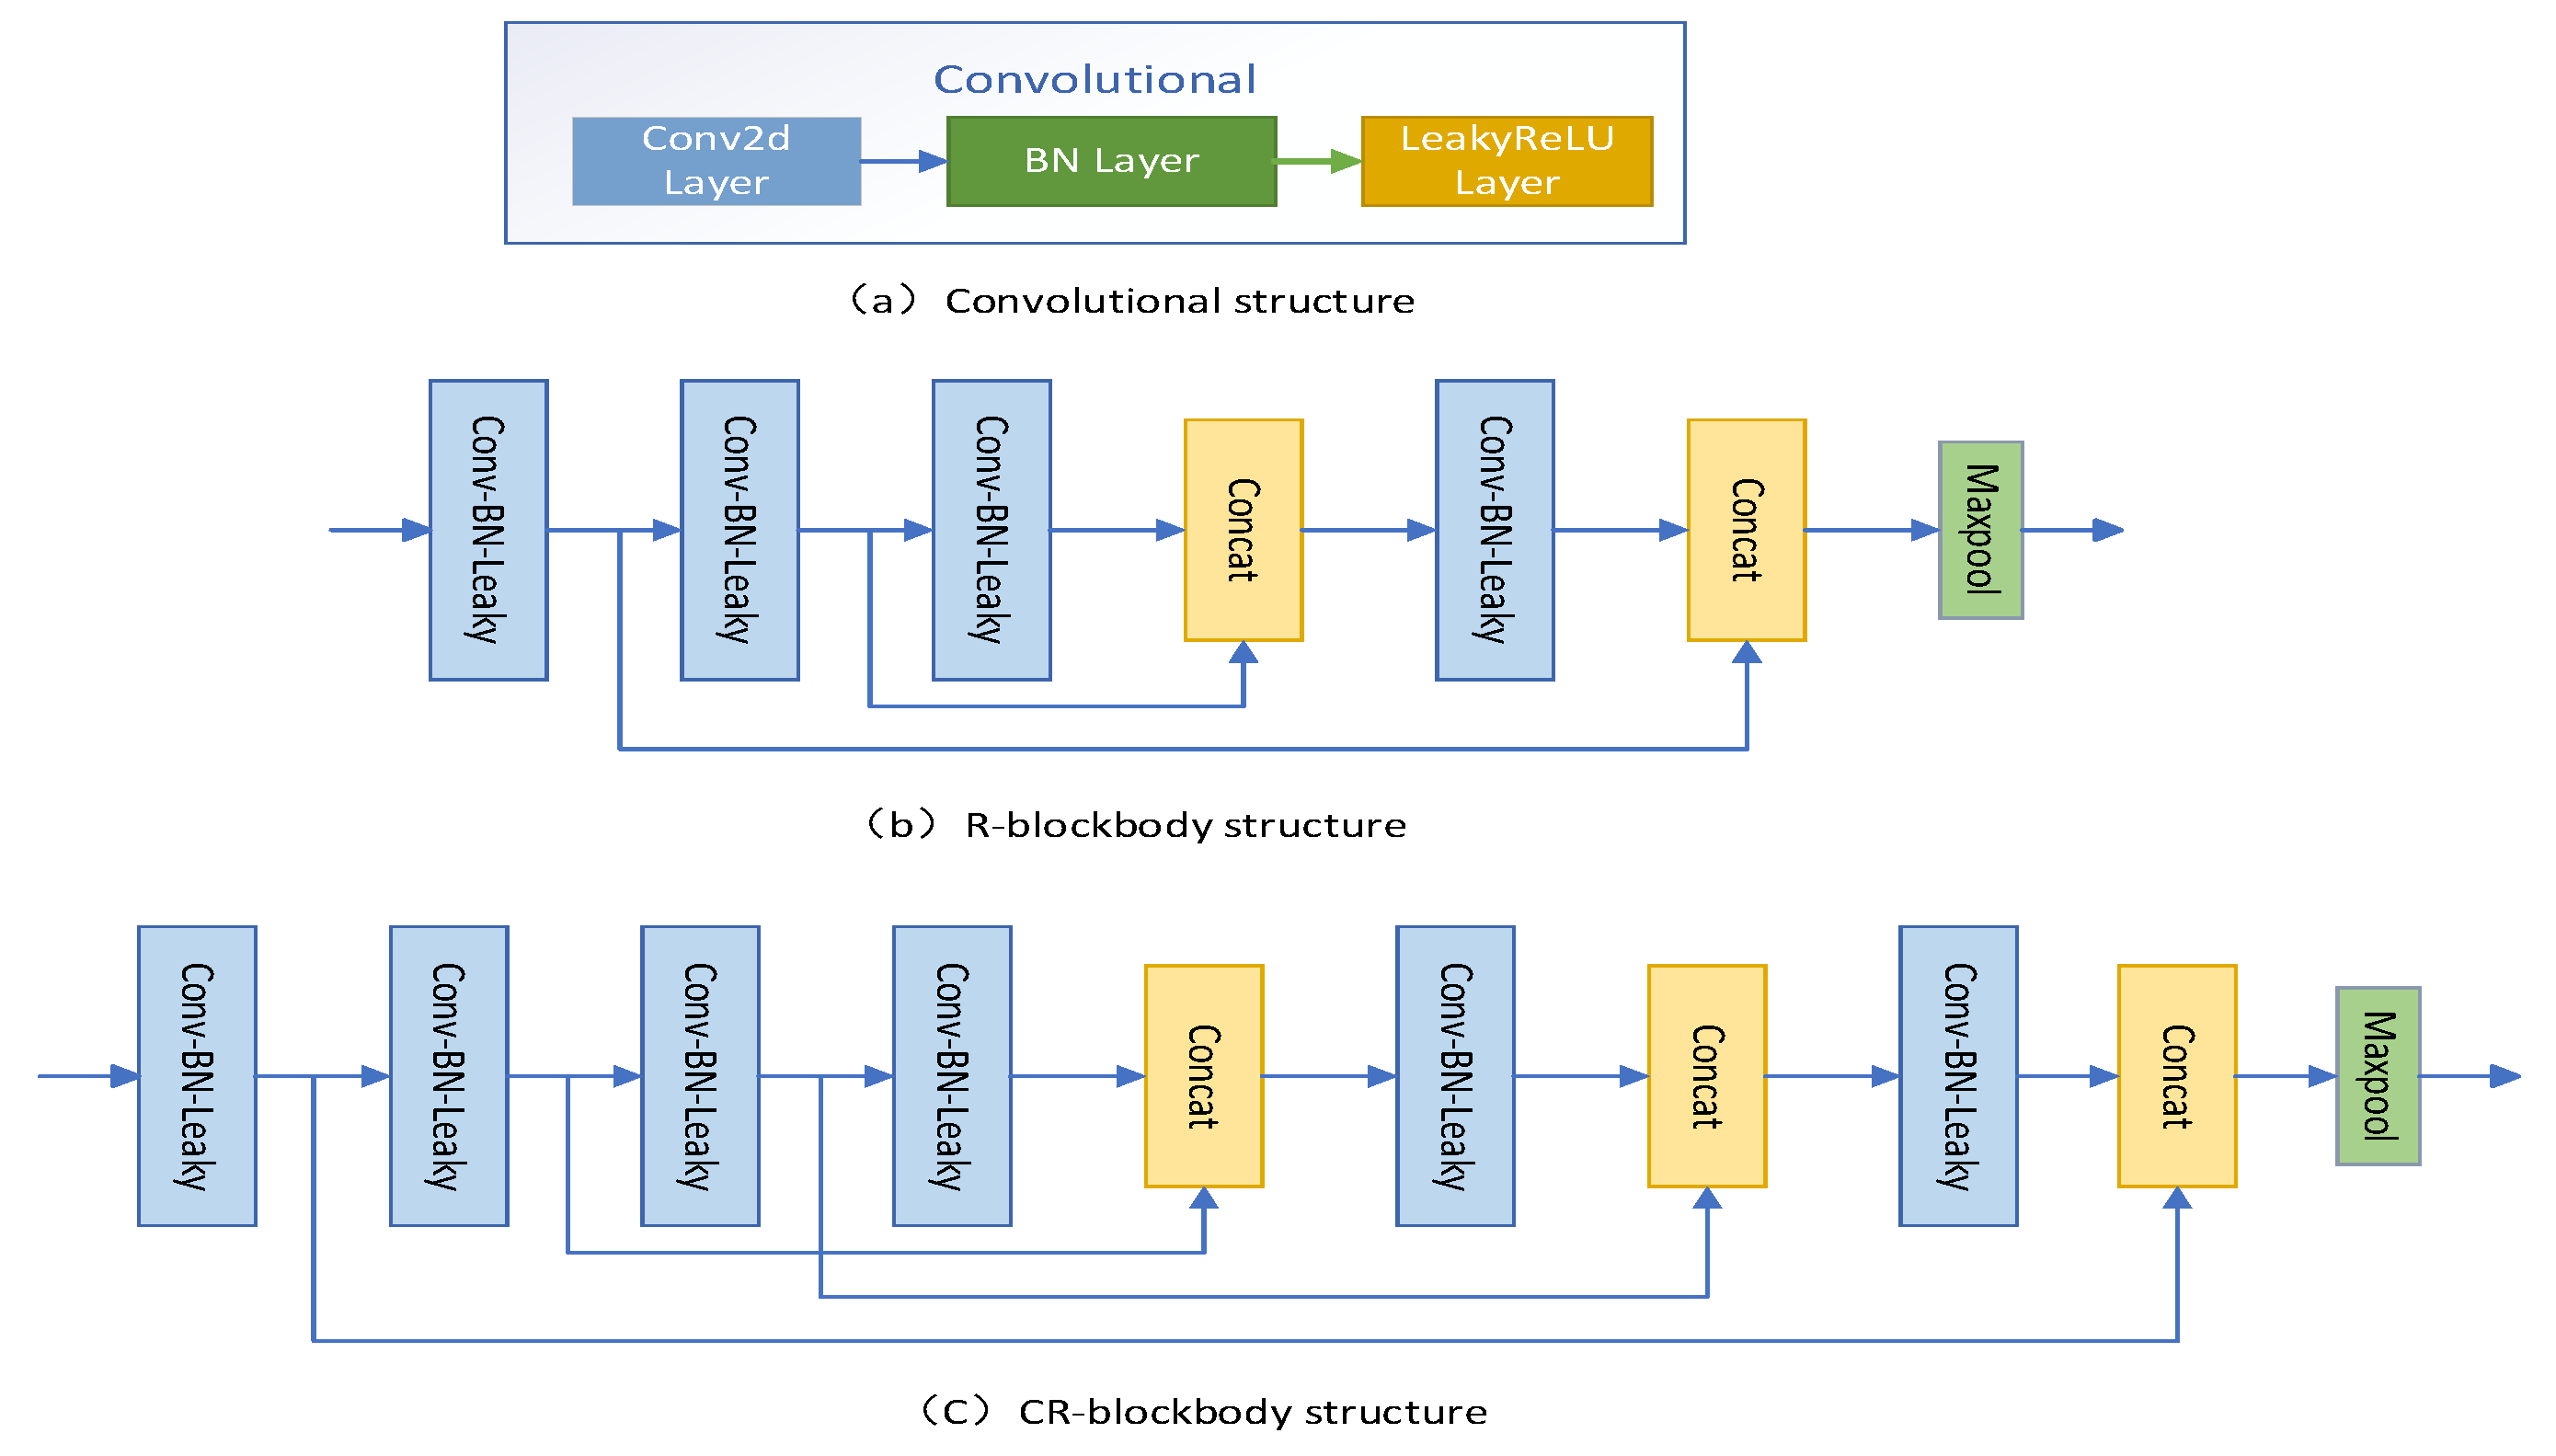
Printed circuit board surface defects are small, in order to be able to fully extract the features of small target defects, enhance the feature extraction ability of small target defects, effectively alleviate the gradient disappearance and explosion problems, and improve the learning ability of the network, a backbone feature extraction network based on Cross-Residual blockbody (CR-blockbody) is designed. The backbone feature extraction network mainly consists of three convolutional structures, two CR-blockbodies and one ordinary Residual-blockbody (R-blockbody) structure. The deeper the backbone feature extraction network is, the more feature information of small targets will be lost. The first two backbone feature extraction blocks use CR-blockbody, and the latter one uses R-blockbody, so that the small target feature information is fully extracted and retained, and the model improves the lightness.
The convolution structure is shown in
Figure 2a and consists of Conv2D, BN [
29] (Batch Normalization), and LeakyRelu activation function. the R-blockbody structure is shown in
Figure 2b and consists of four convolution structures, two jump connections, two splicing operations, and one pooling structure. the CR-blockbody structure is shown in
Figure 2b and consists of four convolution structures, two jump connections, two splicing operations, and one pooling structure. the CR-blockbody structure is shown in
Figure 2c. blockbody structure shown in
Figure 2c consists of 6 convolutional structures, 3 jump connections, 3 splicing operations, and 1 pooling structure. There are common cross-convolutional layers in the residual block of jump connections, which effectively reduces the problem of feature information loss and depletion when feature extraction is performed on the input feature layer, especially for small target defects.
2.2. Design of the CPR structure
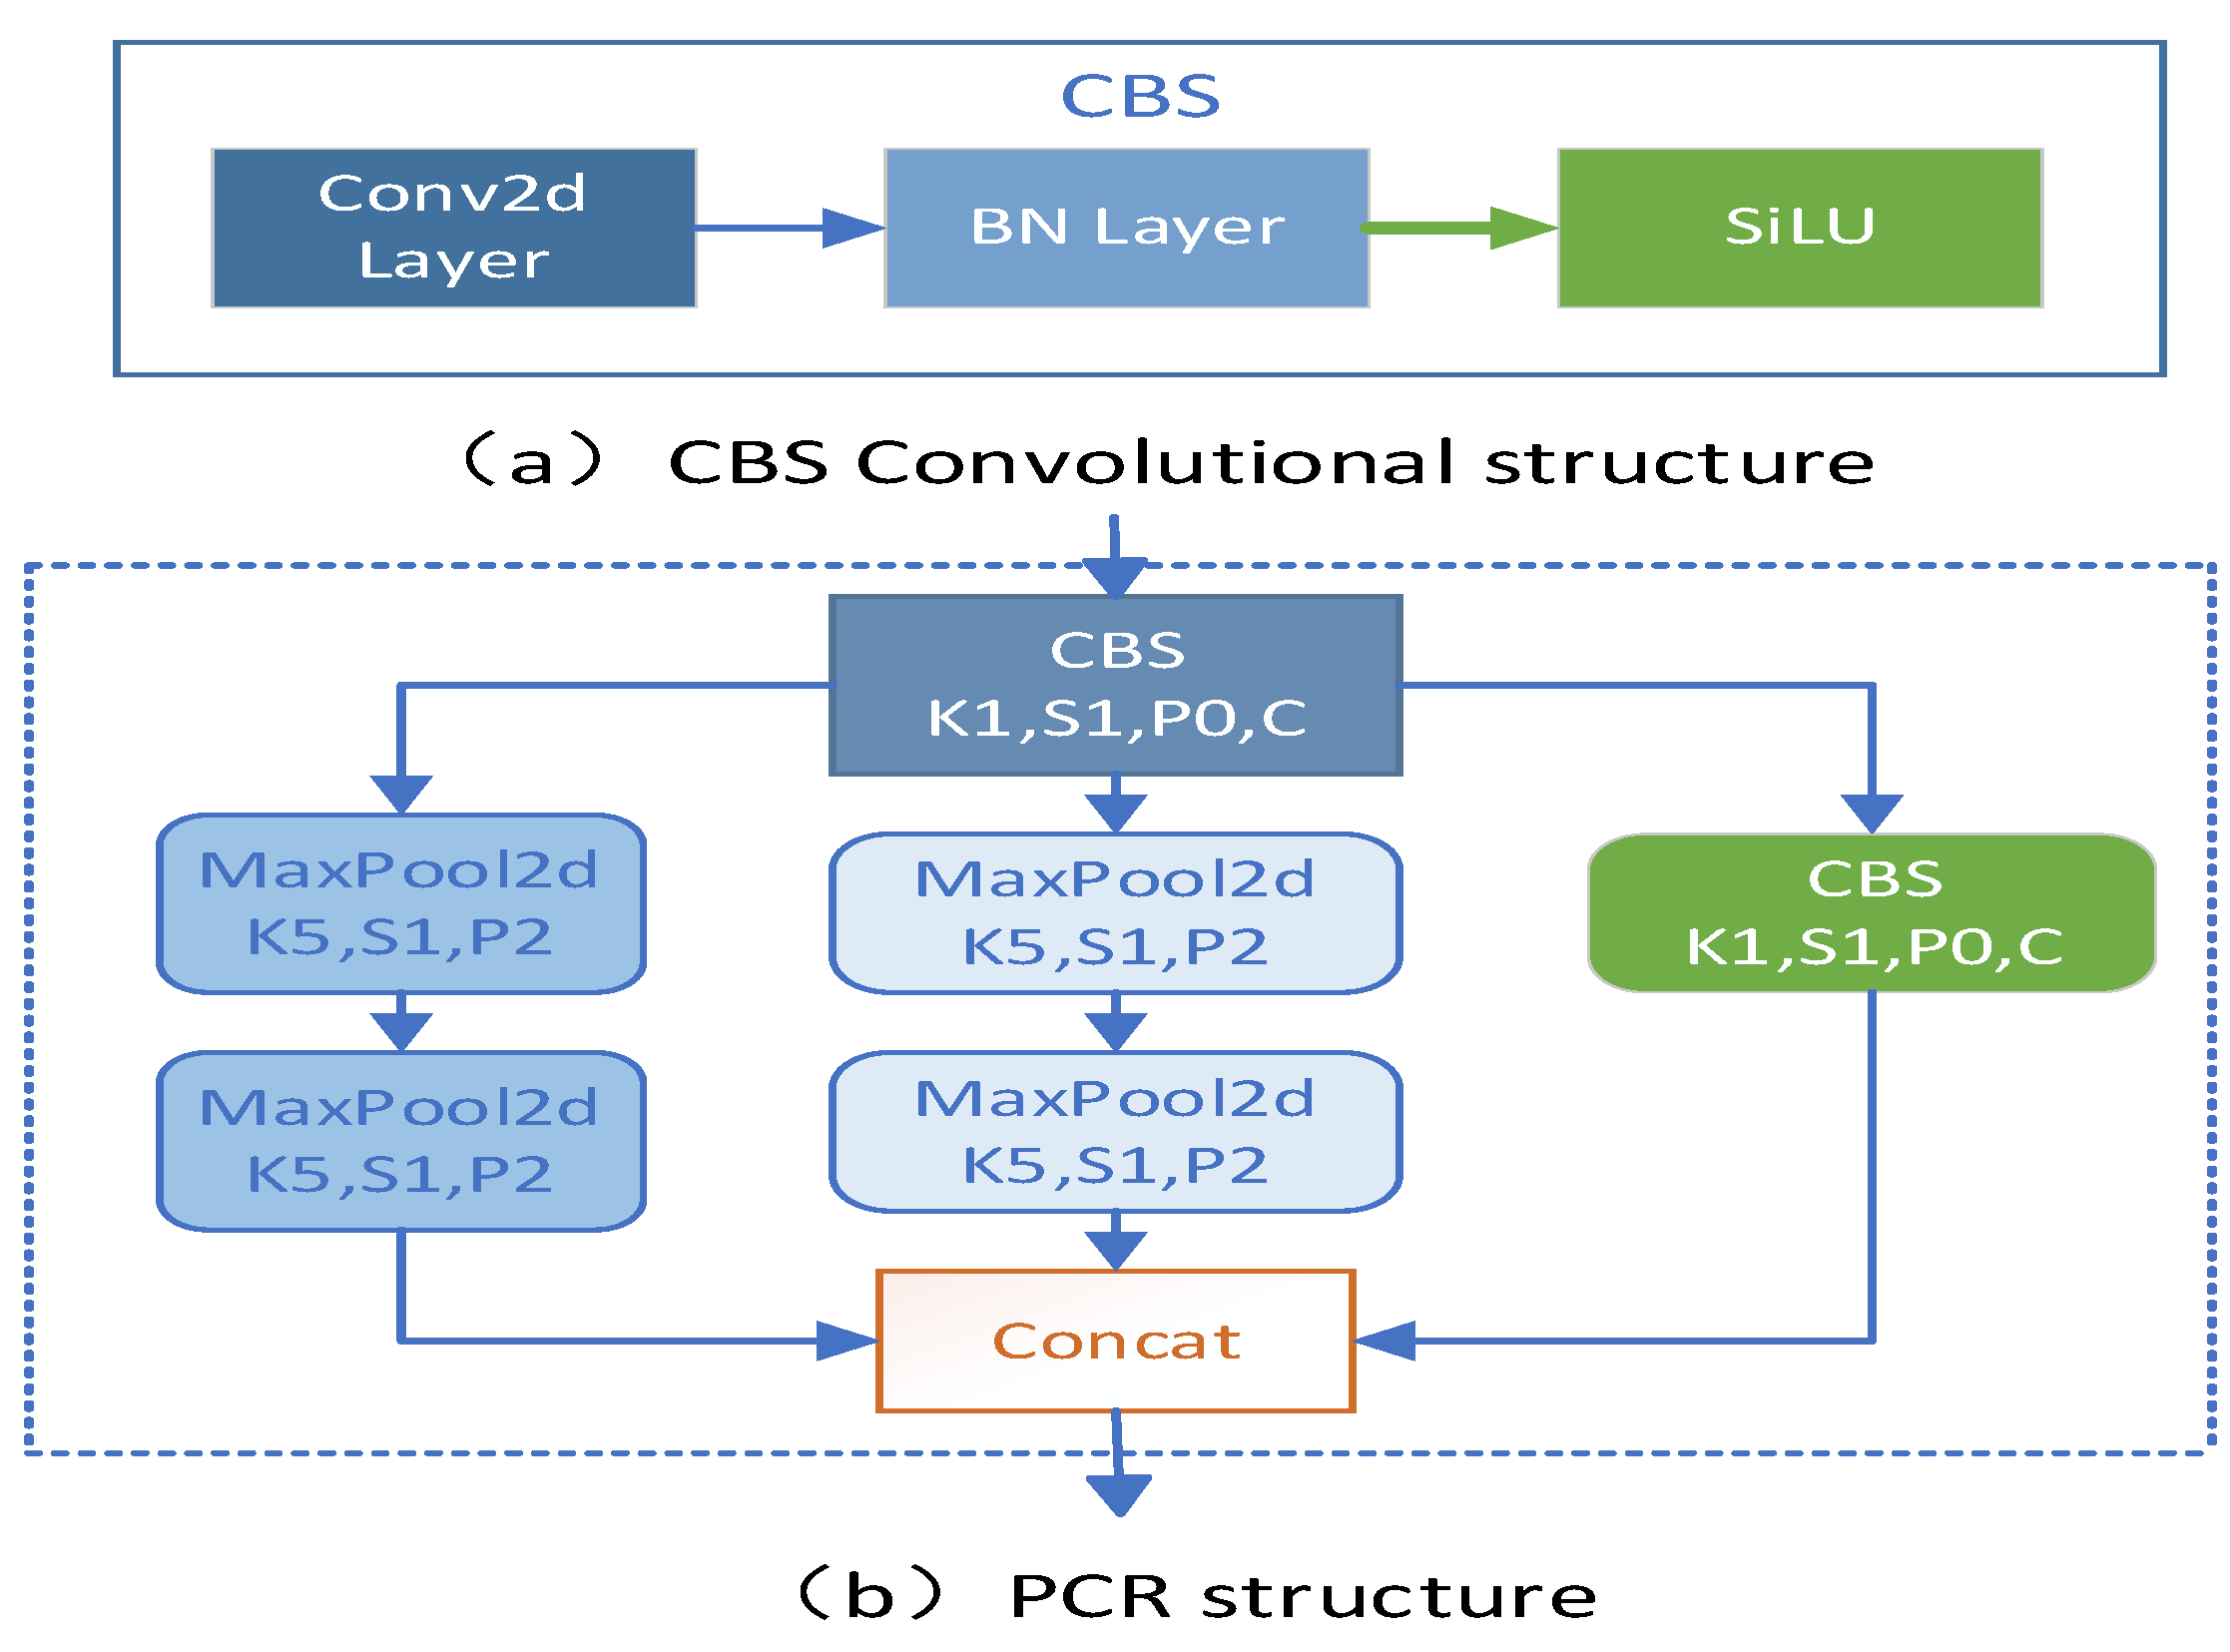
To enhance the feature fusion mechanism at different scales between the CR-backbone backbone feature extraction network and the SDDT-FPN feature fusion module, and to effectively prevent feature information loss when fusing features at different scales between different modules, the pooled convolutional residual structure CPR was designed. the CPR module mainly consists of a residual convolutional structure and two pooling channel structures. the CBS convolutional structure As shown in
Figure 3a mainly consists of Conv2D, BN, and Silu activation functions. Both pooling channel structures are composed of two pooling layers of the same size. The pooling layer has a pooling kernel size of 5x5, a step size of 1, and a padding number P of 2. The input feature layer is processed by the convolutional structure, the two pooling channels, and then the fused feature layer is passed backwards through a splicing operation. the CPR structure is shown in
Figure 3b.
2.3. Design of the SDDT-FPN structure
YOLO-Head P5 and YOLO-Head P4 have a deeper backbone feature extraction network, which is suitable for predicting relatively large defects, but the deeper backbone feature extraction network will lead to the loss of some features in the extraction of small target defects, resulting in relatively low accuracy of small target defect prediction. It is more suitable for small target defect prediction as less features are lost in the process. Therefore, it is necessary to enhance the feature fusion for YOLO-Head P3 to improve the accuracy of small target defect prediction.
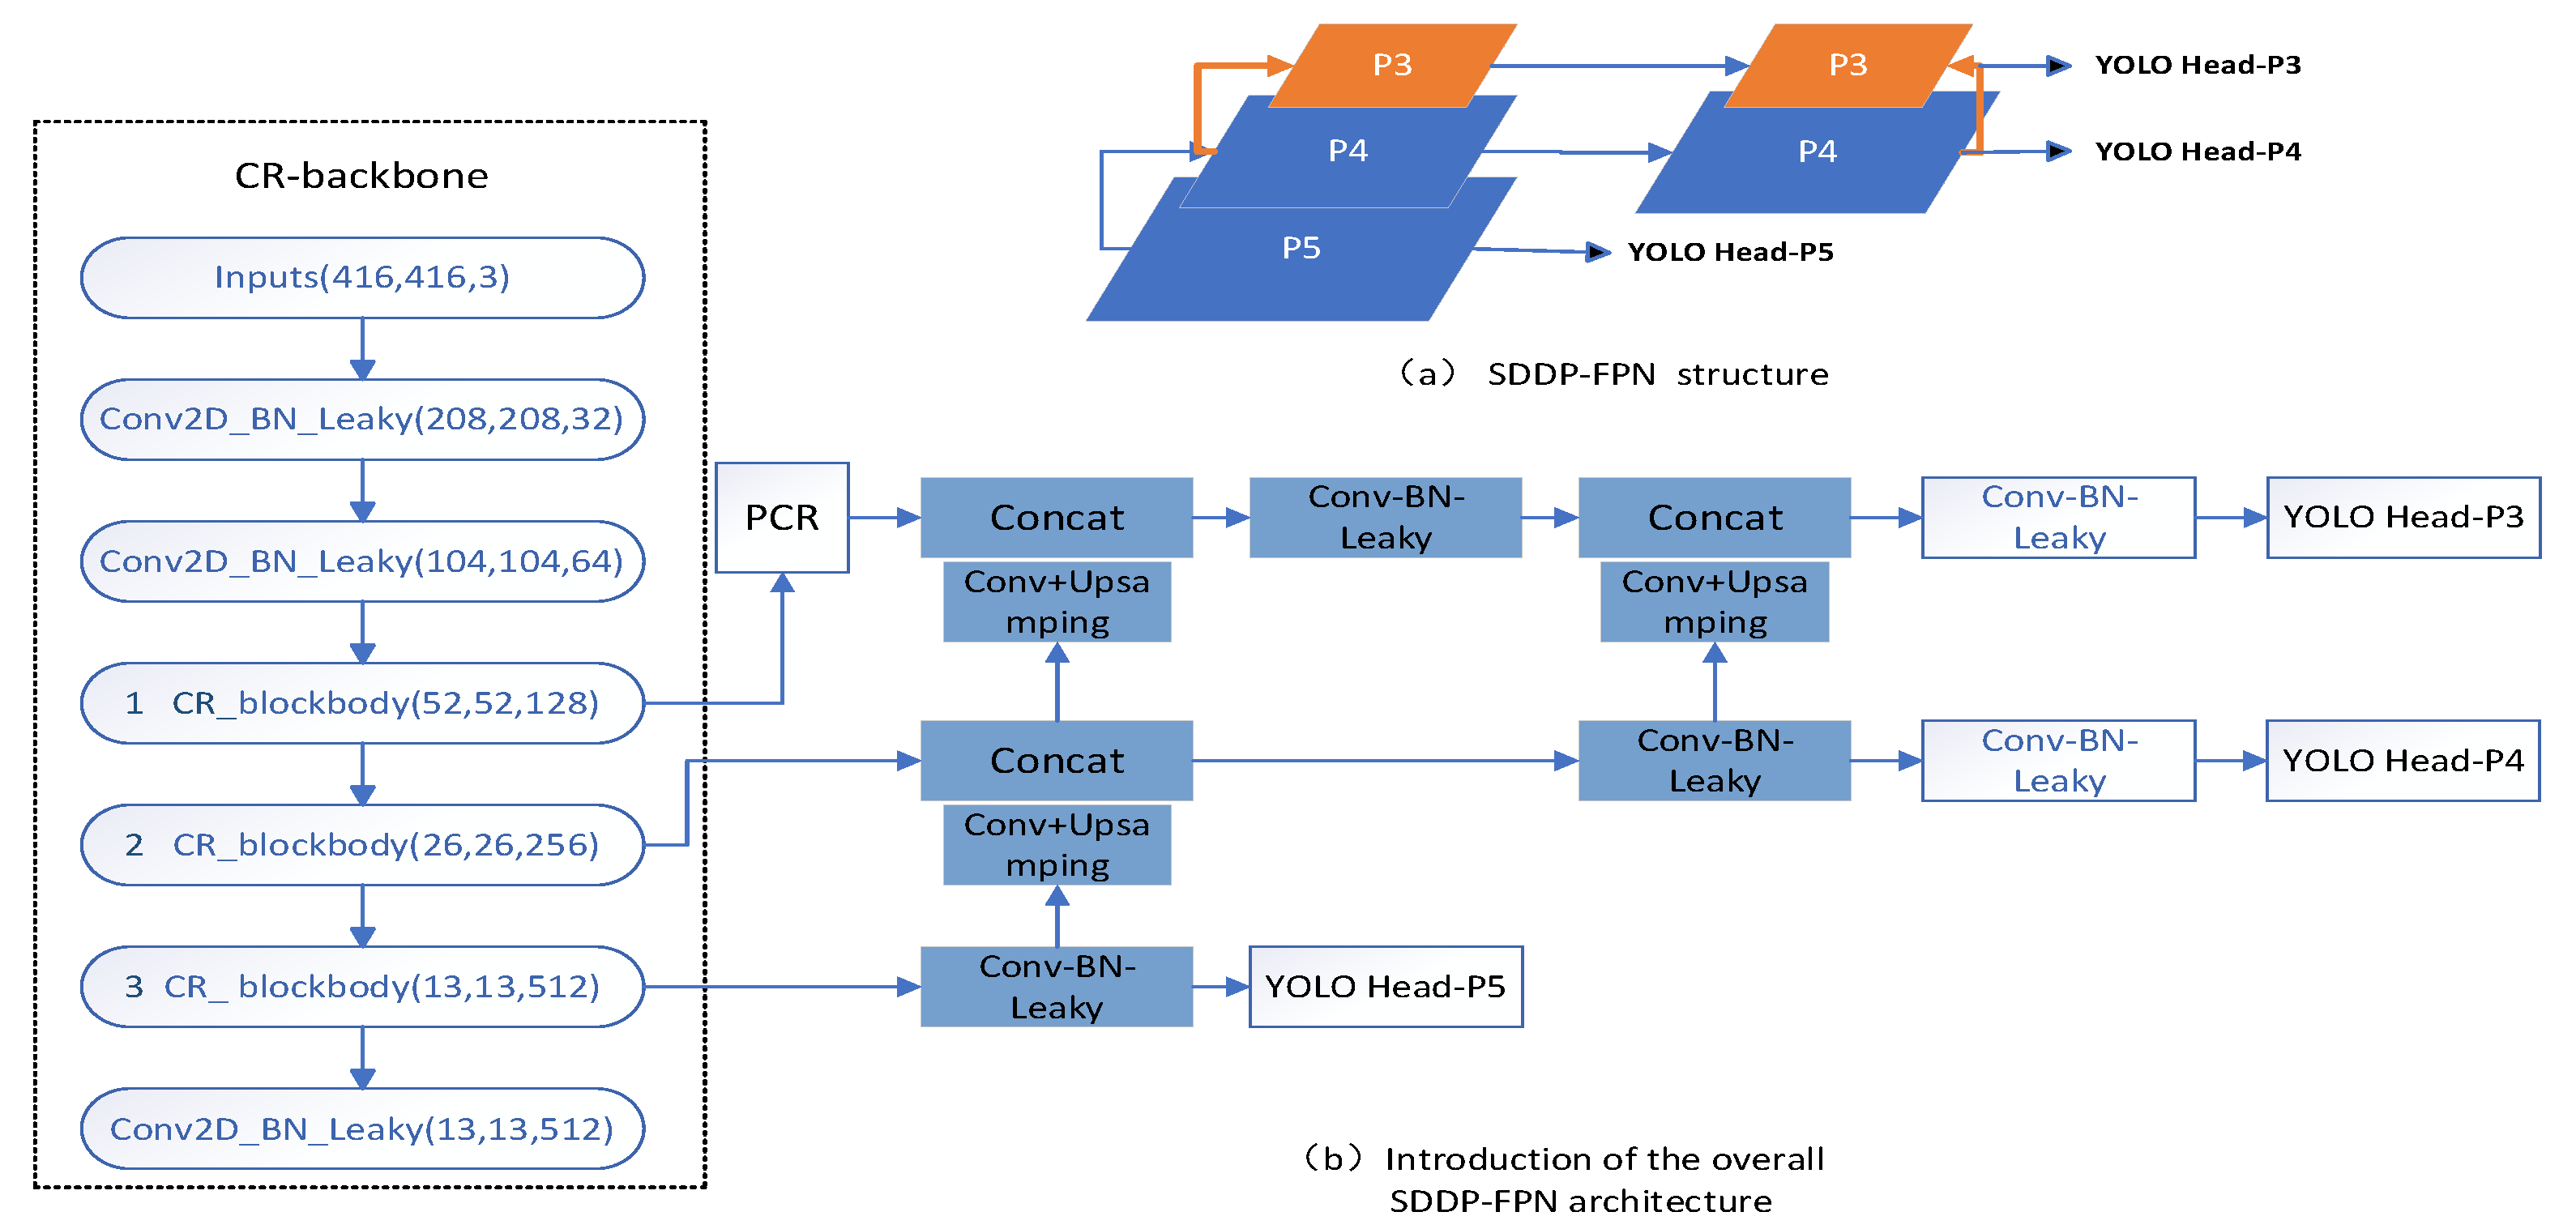
To address the above issues, an isotropic double-top feature pyramid SDDT- FPN structure is designed as shown in
Figure 4a. This structure not only facilitates the feature fusion mechanism between the bottom-up special layers, but also re-introduces the isotropic pyramid top for the feature fusion layer where the small target defect prediction head YOLO Head-P3 is located, further enhancing the feature information transfer in the feature layer for small target defect prediction. The overall model after the introduction of the SDDT-FPN structure is shown in
Figure 4b.
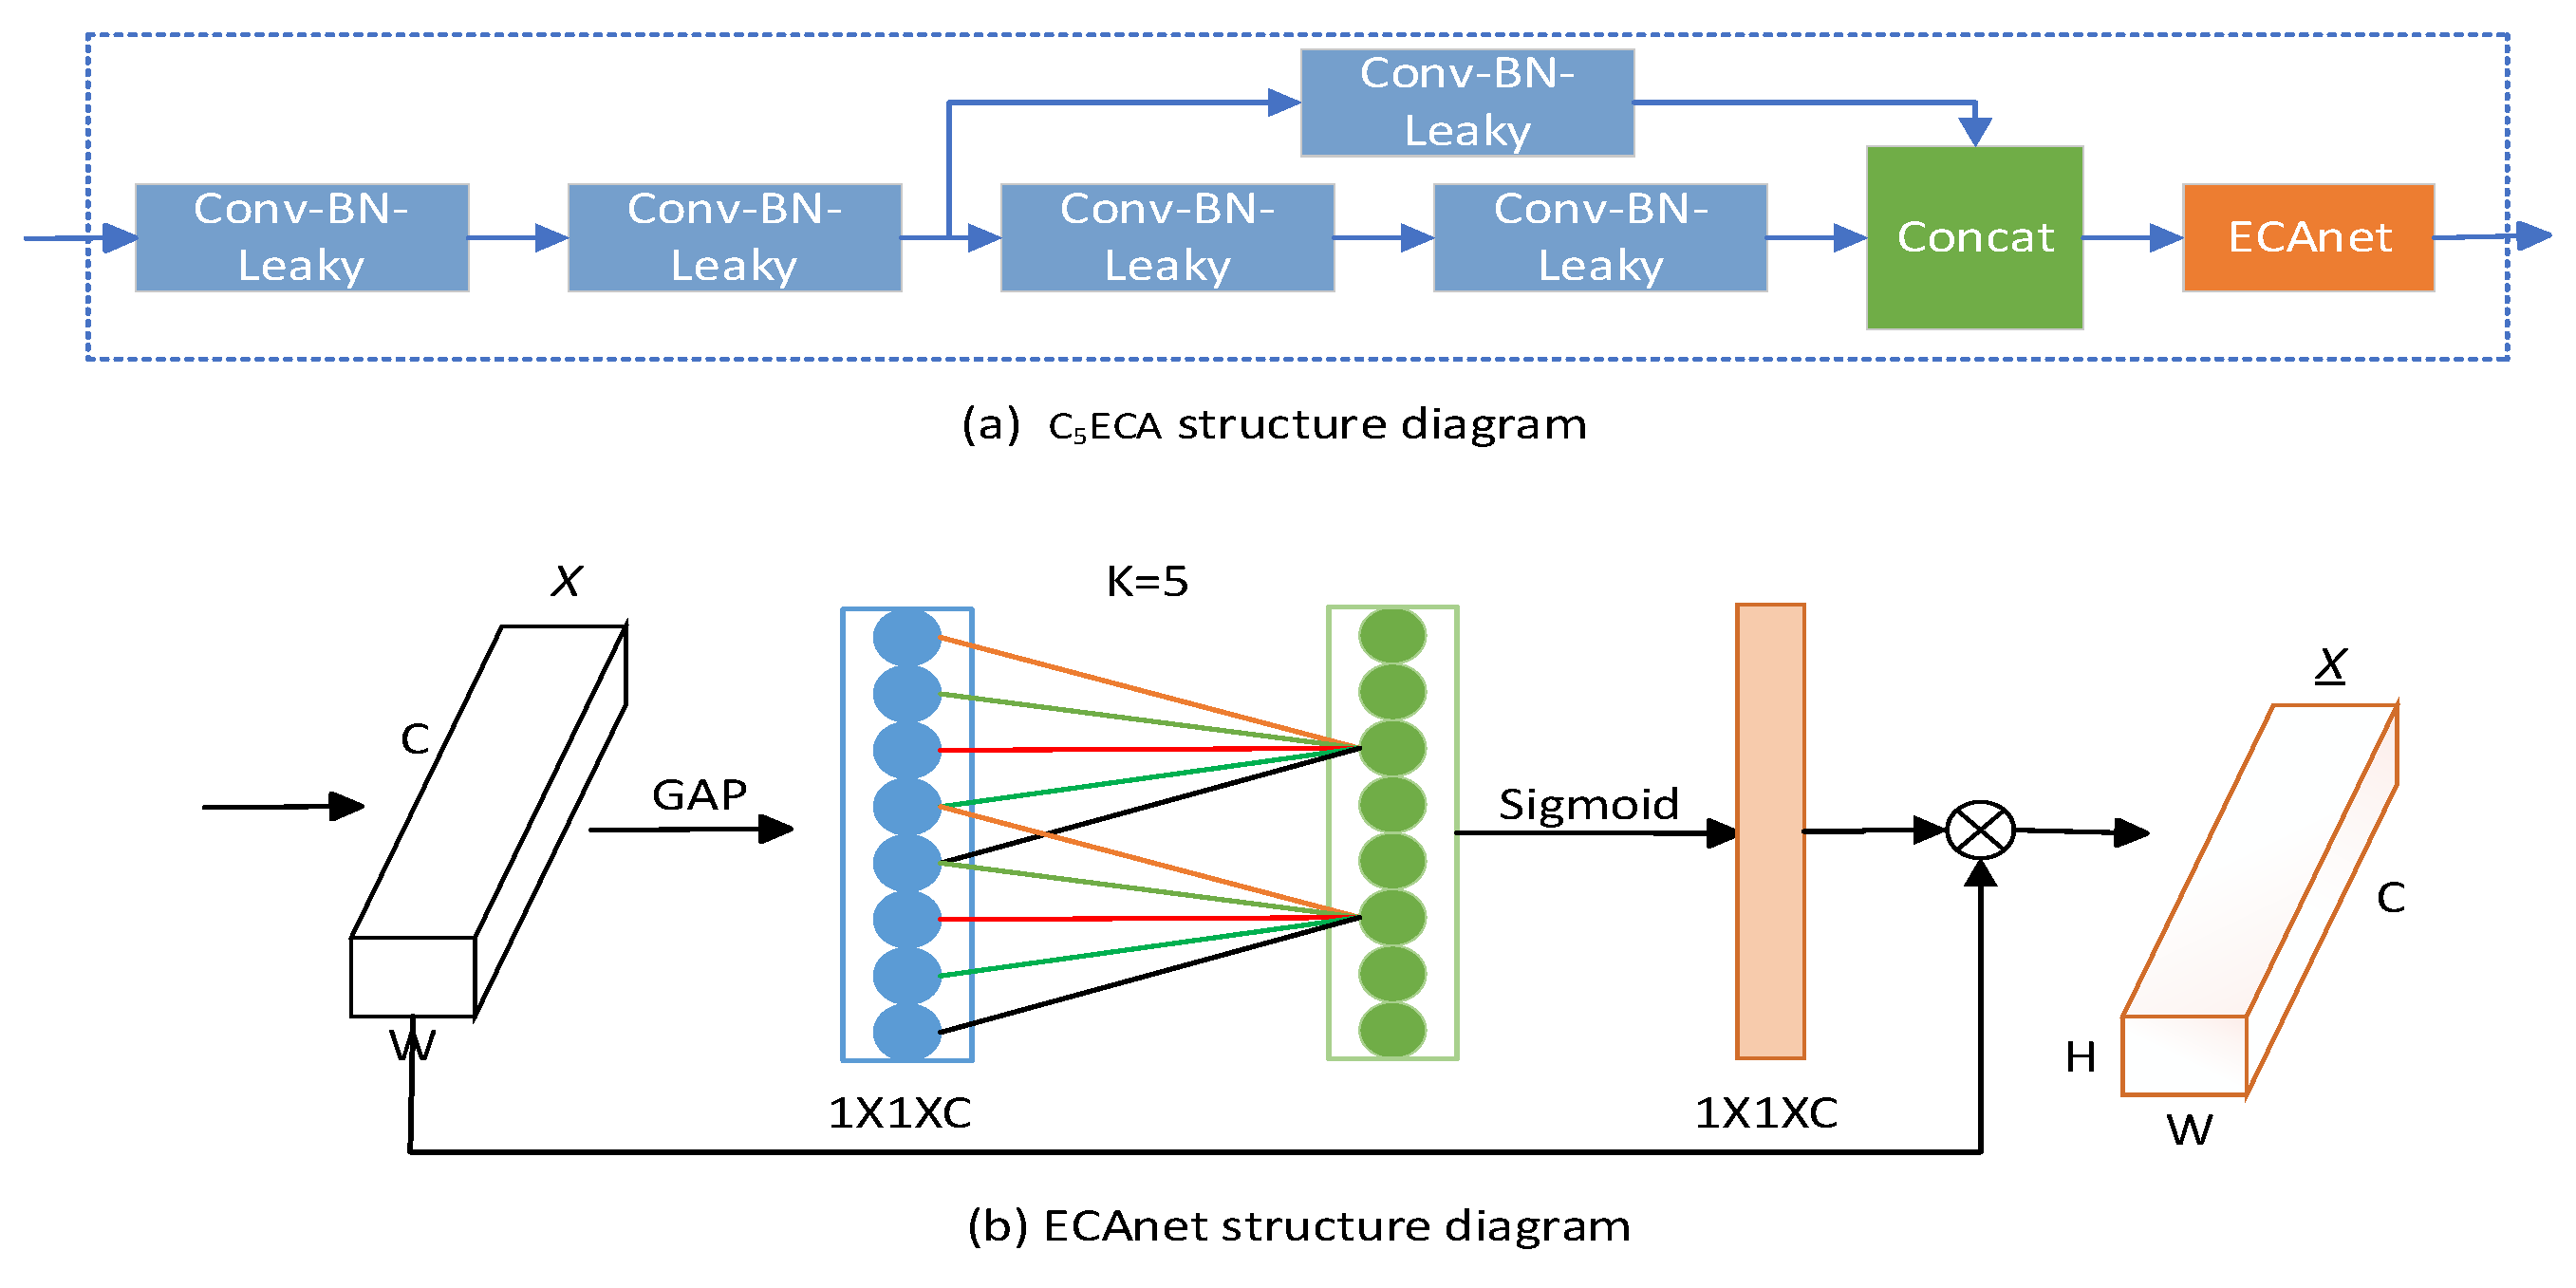
2.4. Design of the C5ECA structure
The overall model has a large amount of feature information to extract and focus on, then to some extent the focus on minor feature information needs to be reduced and the focus on major information needs to be enhanced. The C
5ECA structure is designed so that the feature extraction and fusion mechanisms are enhanced between the layer structures of the SDDT-FPN network to enhance the attention to small target defective feature information. the C
5ECA module structure is shown in
Figure 5a, which mainly consists of 2 convolutional structures, a residual convolution (consisting of 3 convolutional structures), ECAnet [
30] structure, and splicing operations.
The first two convolutional structures are mainly used for upsampling operations, and the residual convolutional structure is used for feature extraction and transfer between prediction layer structures to enhance the sensitivity of small target information extraction. the specific structure of the Effificient Channel Attention network (ECAnet) module is shown in
Figure 5b. As can be seen from the ECAnet structure, firstly, the input feature map is globally averaged to pool the h and w dimensions to 1, and only the channel dimension is retained. Secondly, a 1D convolution is performed so that the channels in each layer interact with the channels in neighbouring layers and share the weights. Finally, using the Sigmoid function for processing, the input feature map is multiplied with the processed feature map weights and the combined weights are assigned to the feature map. After processing by the ECAnet module, the model is made to adaptively focus on the more important small target defect feature information, which further improves the adaptive [
31] feature extraction capability of the network model and thus improves the prediction accuracy of small target defects.
3. Experimental basis and procedure
To validate the detection performance and prediction performance of the DCR-YOLO model, comparative and ablation experiments were conducted using the publicly available printed circuit board defect dataset from the Open Laboratory for Intelligent Robotics [
32,
33], the Windows 11 operating system, and the Python programming language.
3.1. Data set for the experiment
This experimental dataset comes from the open dataset of printed circuit board defects from the Intelligent Robotics Open Lab, with a total of 10,668 images. 2,667 images were randomly selected from this experimental data, which contains an equal number of images of six types of printed circuit board surface defects as shown in
Figure 6, missing_hole, mouse_bite, open_circuit, short, spur, spurious_copper. The training set consisted of 2160 images, the validation set consisted of 240 images and the test set consisted of 267 images.
3.2. Evaluation criteria
The commonly used and representative evaluation metrics used in this paper are Average Precision (AP), Mean Average Precision (mAP), Check All Rate (Recall, R), the curve of R change for each defect category, and Frame Rate (Frames Per Second, FPS).
P refers to the proportion of all objects that the model predicts correctly, also known as the accuracy rate, as shown in equation (1). The check-all rate, R, refers to the proportion of all real objects that are correctly predicted by the model, also known as the recall rate, and is shown in equation (2). The average precision (AP) formula is shown in equation (3) and refers to the size of the area enclosed by the two curves, the precision P curve and the accuracy R curve, on the interval (0,1). The mean accuracy (mAP), which is the average of the AP values for all categories, reflects the overall effectiveness and overall accuracy of the model, and is an important overall measure of model performance.
The formula TP means that the sample is a positive sample, the number of samples predicted to be positive, the FP value is the sample is a negative sample, the number of samples predicted to be positive, FN means that the sample is a positive sample, the number of samples predicted to be negative is wrong.
3.3. Experimental platform and parameters
The configuration and parameters required for the experiments are as follows: the framework for deep learning is Pytorch 1.12.1 + CUDA116, python version 3.8, the operating system is Windows 11, the graphics processor is an NVIDIA GeForce RTX 3050Ti GPU with 4G video memory, and the relevant parameters for training are shown in
Table 1.
3.4. Model training process and results
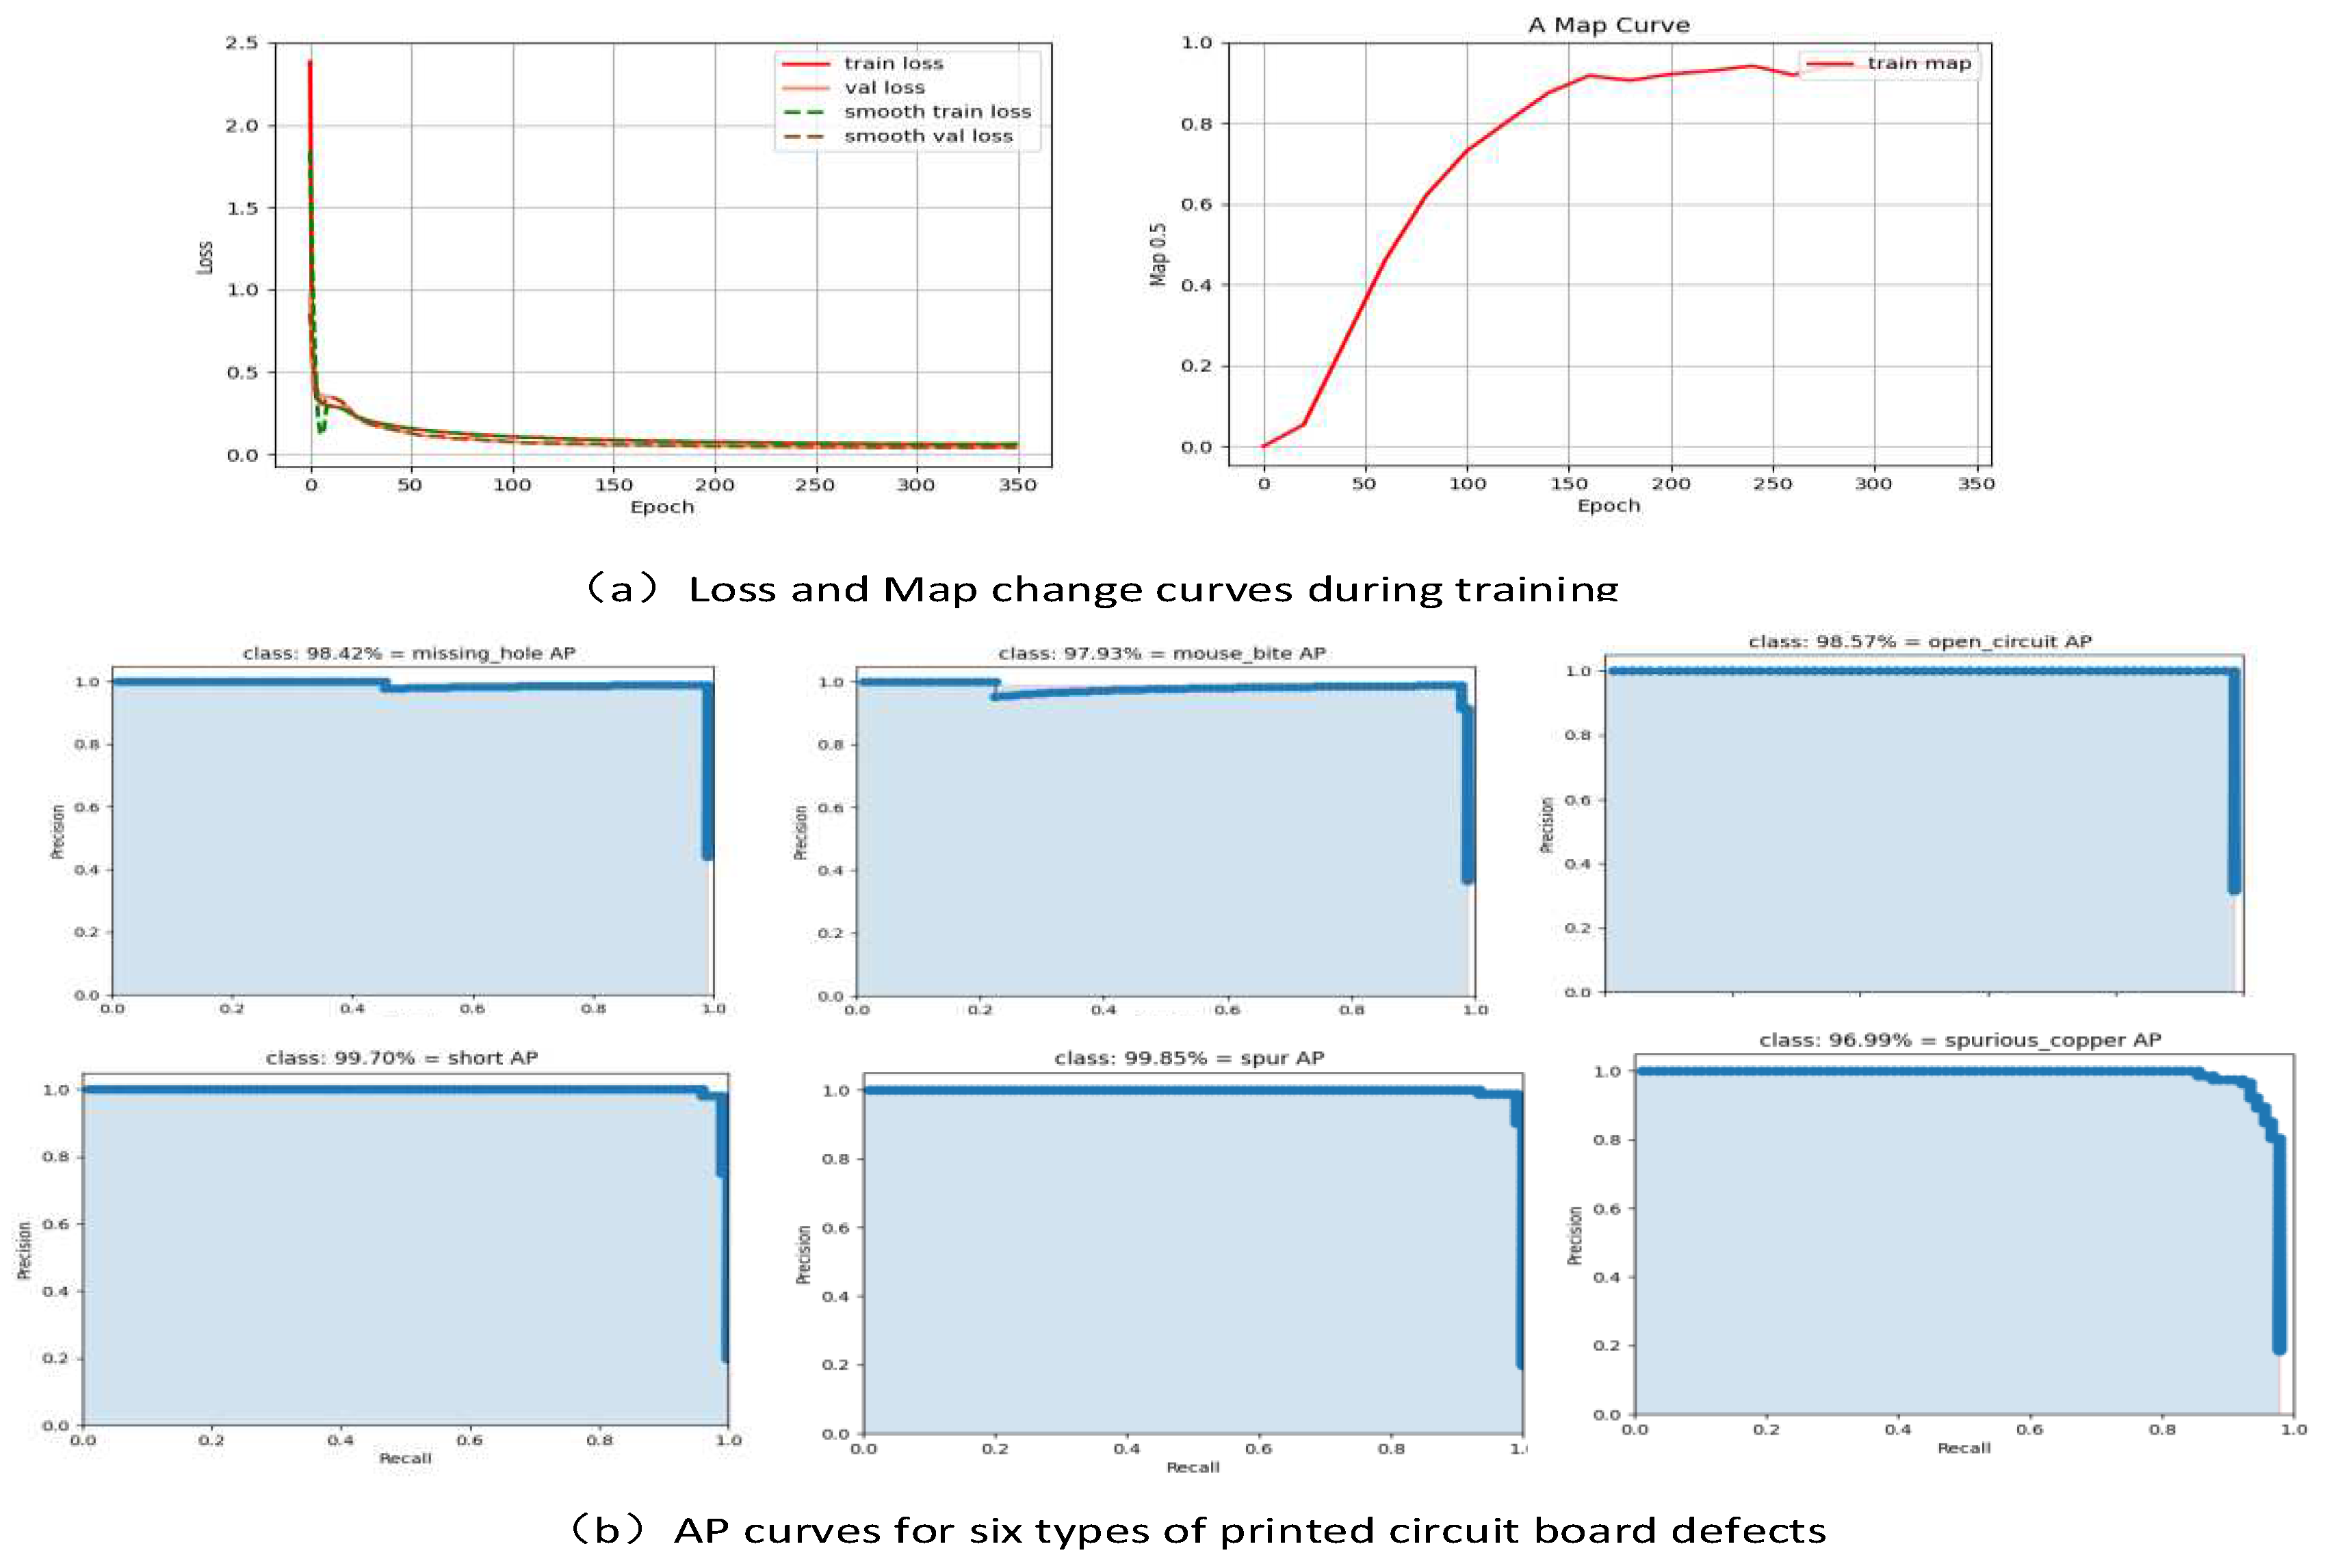
The DCR-YOLO model training process Loss change curve and training process Map change curve are shown in
Figure 7a. After 350 epochs of training, the loss curve shows that the loss function is basically in a converged state after 200 epochs, and the map change curve shows that the average accuracy value of the model reaches about 90% at 175 epochs, and the map value is basically smooth after 260 epochs. The average accuracy curves of each category after training are shown in
Figure 7b, and the average accuracy of each category is basically above 95%.
3.5. Ablation experiments with different modules
Ablation experiments were designed to evaluate the degree of optimisation of the performance of the algorithm with different combinations of designed modules. The results of the ablation experiments are shown in
Table 2. DCR-3Head indicates a base model consisting of a CR-backbone backbone network and three predictor heads. Px-PCR indicates the introduction of a PCR module after the backbone feature layer where a predictor head is located. sddt-fpn indicates the introduction of an sddt-fpn module between the backbone feature extraction network and the predictor head. 1-C
5ECA indicates the introduction of a C
5ECA module between P5 and P4. the introduction of the C
5ECA module between P5 and P4. 2-C
5ECA indicates the first (left) introduction of the C
5ECA module between P4 and P3. 3-C
5ECA indicates the second (right) introduction of the C
5ECA module between P4 and P3.
From experiment 1, it can be seen that the network structure of the CR-backbone backbone network-based model map=96.76, proving that the designed cross-residual CR-blockbody has a strong capability of small target defect feature extraction.
As can be seen from Experiments 1 and 2, the introduction of the SDDT-FPN module improved map and R by 0.5% and 1.37% respectively compared to Experiment 1, proving that the SDDT-FPN enhanced the feature fusion mechanism between layers and also improved the feature fusion capability for the feature fusion layer where the small target prediction head YOLO Head-P3 is located, further improving the small target defect detection accuracy .
From Experiments 3, 4 and 5, it can be seen that the introduction of the PCR module after the backbone feature extraction layer where the P3 predictor head is located gives the best results in fusing the different scale feature layers, with a 0.74% improvement in MAP, compared to Experiment 2.
From Experiments 6, 7, 8 and 9, it can be seen that the introduction of two (left and right sides) C5ECA models between the predictor heads P4 and P3 in the SDDT-FPN structure strengthens the feature fusion mechanism between the layer structures of the SDDT-FPN network and improves the attention to small target defect feature information, with map and R improving by 0.58% and 0.48%, respectively, compared to Experiment 3.
3.6. Comparative experiments with different models
To verify the model DCR-YOLO feasibility and effectiveness, six current mainstream target detection models were trained and tested on the printed circuit board defect dataset using YOLOv3, YOLOv4, YOLOv4-tiny, YOLOv5-s, YOLOv5-m, and YOLOv7-tiny [
34] under the same experimental environment, and the experimental results are shown in Table The experimental results are shown in
Table 3.
As can be seen from
Table 3, model detection in terms of MAP, the DCR-YOLO model reached 98.58%, which was 10.14%, 1.44%, 8.95%, 4.24%, 2.69%, and 3.26% higher than YOLOv3, YOLOv4, YOLOv4-tiny, YOLOv5-s, YOLOv5-m, and YOLOv7-tiny, respectively, 3.26%. The DCR-YOLO model R=97.24%, 25.05% higher than YOLOv5-s and 5.37% higher than YOLOv4, which is a significant improvement compared to the other models. The volume of the model is 7.73MB, which is 56.23MB and 13.34MB lower than the YOLOv4 and YOLOv5-m models respectively, meeting the lightweight requirement. The inspection speed of fps=103.15 meets the demand for real-time inspection of printed circuit board defects.
4. Visualisation of results analysis
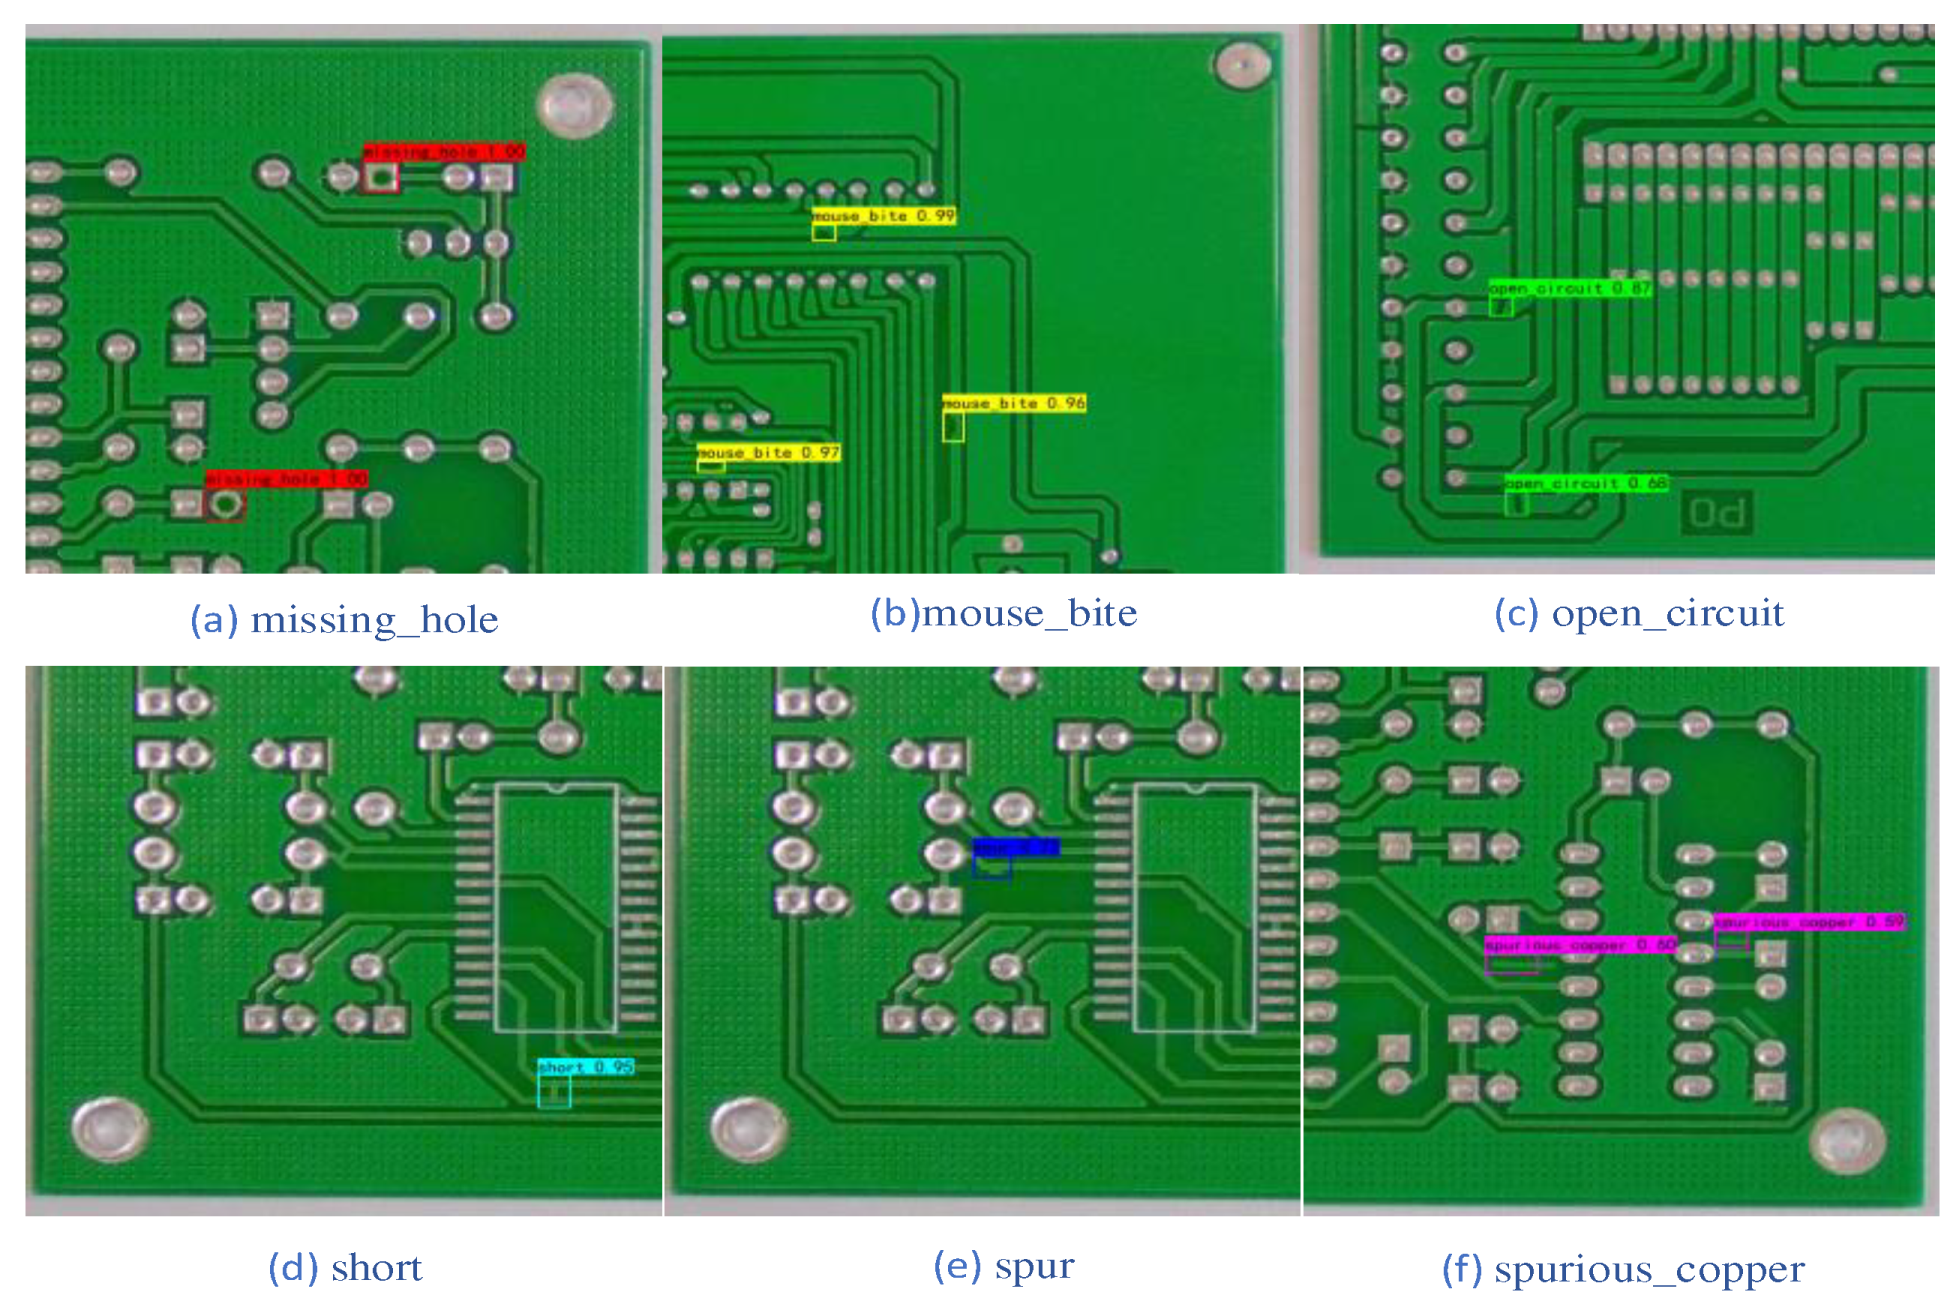
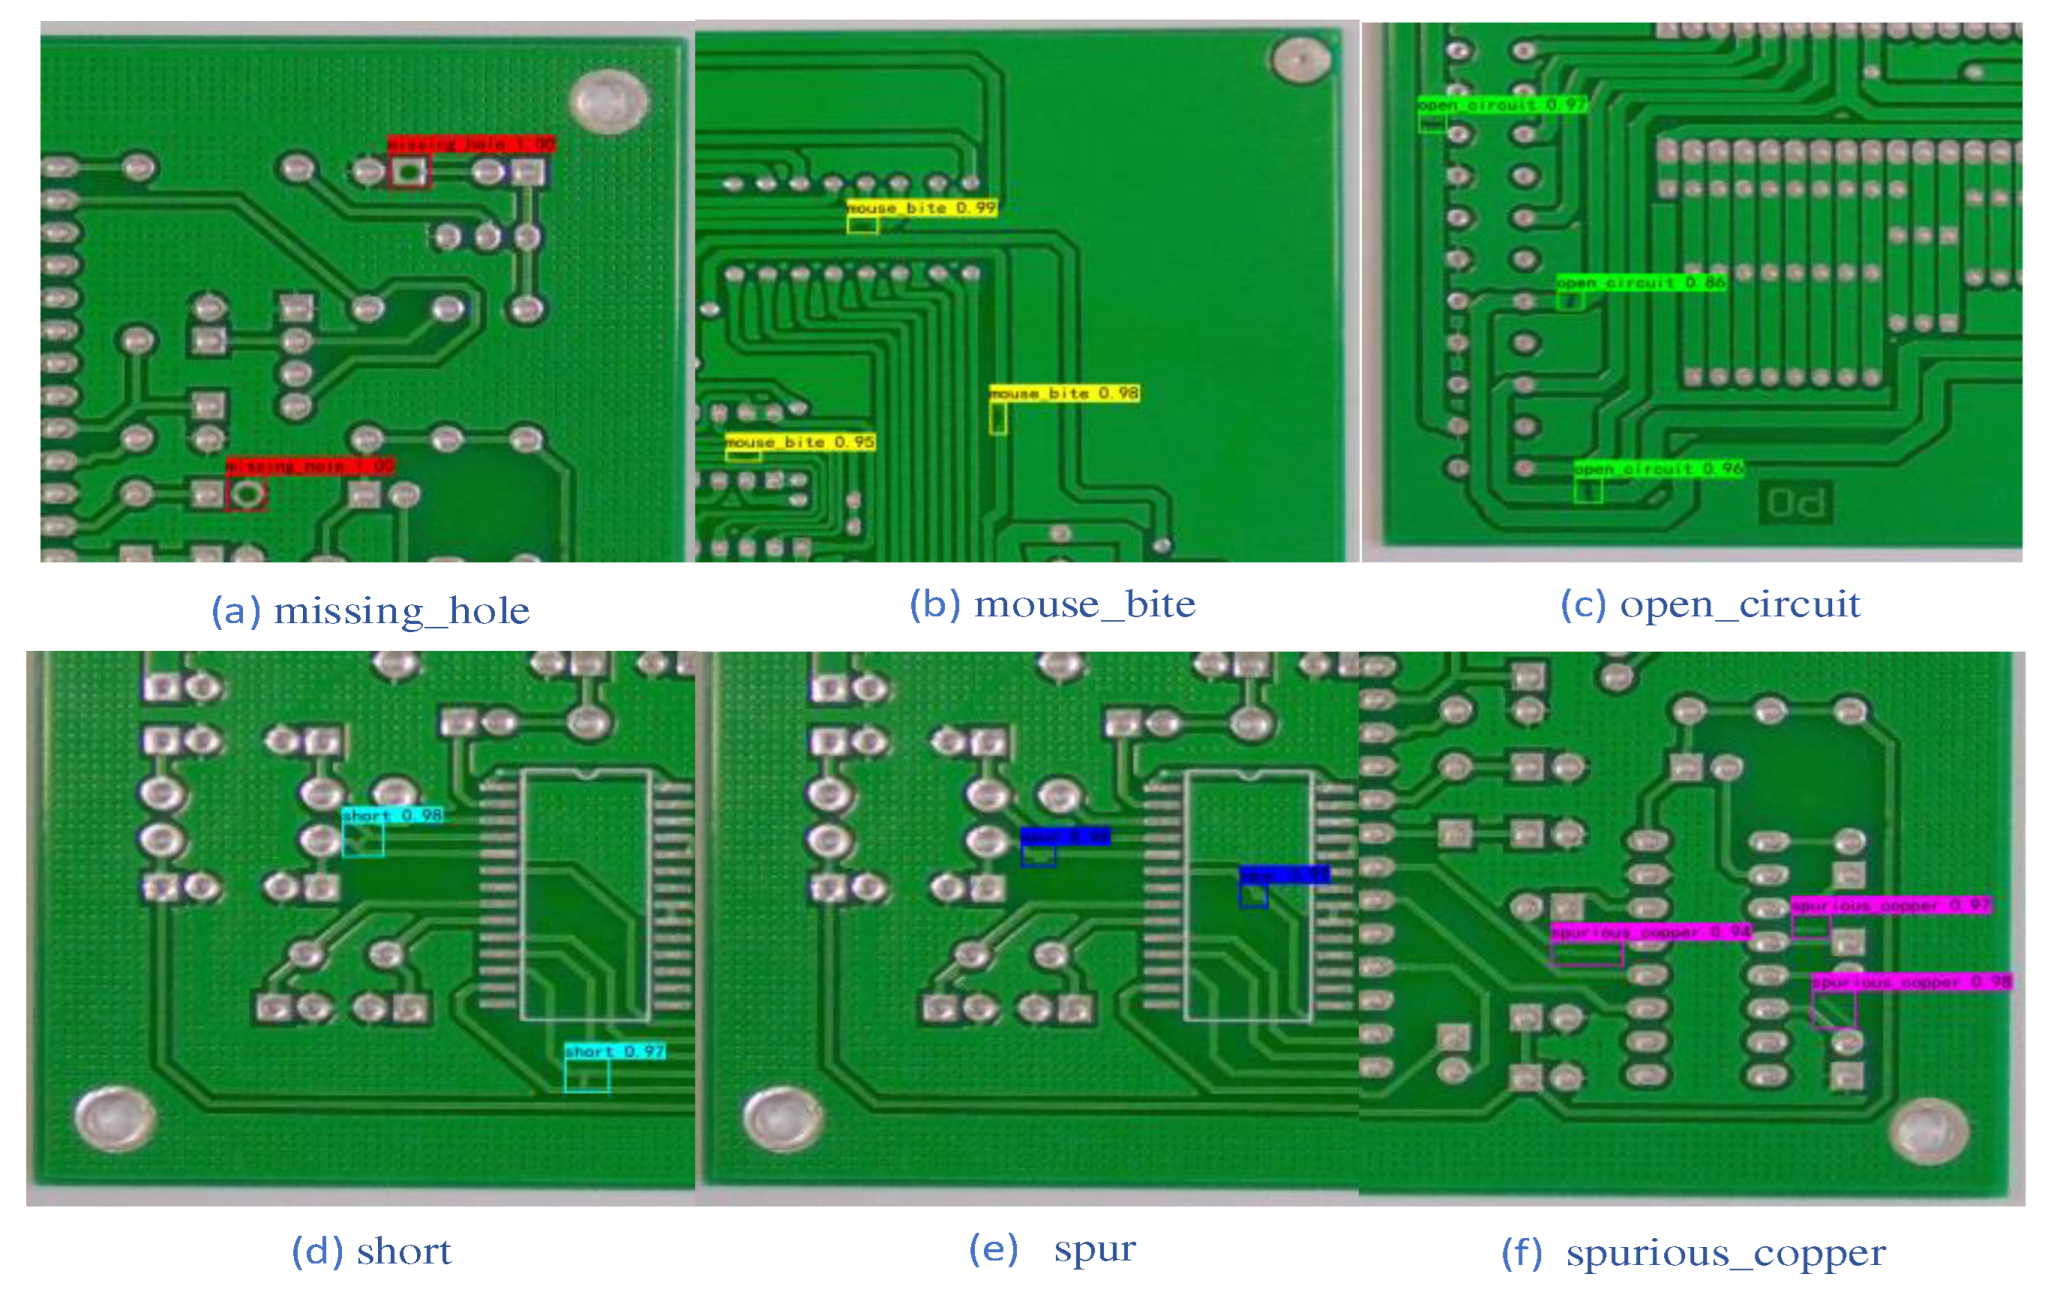
The DCR-YOLO model was conceived based on the structure of the YOLO series of models. In order to verify the actual detection effect of the DCR-YOLO model, six types of printed circuit defect images were randomly selected for detection and also compared with the detection results of the more lightweight YOLOv4-tiny model. the detection results of the YOLOv4-tiny model are shown in
Figure 8 and the detection results of the DCR-YOLO algorithm model are shown in
Figure 9.
The comparison of the two models shows that for (a) missing_hole and (b) mouse_bite, both the original model and DCR-YOLO detected the defects that were present, and there were no missed detections, and the DCR-YOLO model and the YOLOv4-tiny model were equal in terms of detection accuracy. For (c) open_circuit, (d) short, (e) spur, and (f) spurious_copper, the YOLOv4-tiny model showed no leakage, while the DCR-YOLO model showed no leakage, and the average accuracy of the detected defects was higher than that of the YOLOv4-tiny model. The DCR-YOLO model is higher than the YOLOv4-tiny model.
5. Discussion
In this paper, the DCR-YOLO model is designed. It solves the problem of difficult feature extraction due to small defect targets on printed circuit boards, and improves the accuracy of surface defect detection on printed circuit boards. The overall structure of the inspection model is simple and lightweight, while also meeting the real-time inspection speed requirements.
The experimental results show that the most basic network structure consisting of a CR-backbone backbone feature extraction network and three YOLO-Heads achieves a Map of 96.76% and a recall of R of 95.38%, indicating that the designed cross-residual CR-blockbody has a strong feature extraction capability for small target defects. The PCR module effectively bridges and fuses the feature maps of different sizes between the DCR-backbone feature extraction network and the SDDT-FPN structure. The C5ECA module focuses on the small target defect information of the printed circuit board, further enhancing the feature fusion and transfer capability between the SDDT-FPN structure layers, and improving the adaptive feature extraction capability of the network model, enhancing the convergence capability of the network to a certain extent and improving the prediction accuracy. The prediction accuracy is improved.
The DCR-YOLO model has significant advantages over several current mainstream target detection models in terms of detection accuracy, recall, model size, and detection speed. It is also feasible and feasible to detect small defects in real time. The current model needs to be further improved in terms of lightness, so that it can be more easily embedded in more mobile terminals.
Author Contributions
Conceptualization, MengNan Cai and Dong Zhang; Data curation, MengNan Cai; Formal analysis, Yuanyuan Jiang, MengNan Cai and Dong Zhang; Funding acquisition, Yuanyuan Jiang; Investigation, MengNan Cai and Dong Zhang; Methodology, MengNan Cai; Project administration, Yuanyuan Jiang; Resources, MengNan Cai; Software, MengNan Cai; Supervision, Yuanyuan Jiang, MengNan Cai and Dong Zhang; Validation, MengNan Cai; Visualization, MengNan Cai; Writing – original draft, MengNan Cai; Writing – review & editing, Yuanyuan Jiang and MengNan Cai.
Funding
This work was supported by the Key Research and Development Program of Anhui Province under grant 202104g01020012 and the Research and Development Special Fund for Environmentally Friendly Materials and Occupational Health Research Institute of Anhui University of Science and Technology under grant ALW2020YF18.
Institutional Review Board Statement
Not applicable.
Informed Consent Statement
Not applicable.
Data Availability Statement
The data presented in this study are available on request from the corresponding author.
Conflicts of Interest
The authors declare no conflict of interest.
References
- Chang, P.C.; Chen, L.Y.; Fan, C.Y. A case-based evolutionary model for defect classifification of printed circuit board images. J. Intell. Manuf. 2008, 19, 203–214. [Google Scholar] [CrossRef]
- Abd Al Rahman, M.; Mousavi, A. A review and analysis of automatic optical inspection and quality monitoring methods in electronics industry. IEEE Access 2020, 8, 183192–183271. [Google Scholar]
- Chen, J.; Ran, X. Deep learning with edge computing: A review. Proc. IEEE 2019, 107, 1655–1674. [Google Scholar] [CrossRef]
- Ren, R.; Hung, T.; Tan, K.C. A generic deep-learning-based approach for automated surface inspection. IEEE Trans. Cybern. 2017, 48, 929–940. [Google Scholar] [CrossRef]
- Dave, N.; Tambade, V.; Pandhare, B.; Saurav, S. PCB defect detection using image processing and embedded system. Int. Res. J. Eng. Technol. (IRJET) 2016, 3, 1897–1901. [Google Scholar]
- Guo, F.; Guan, S.-A. Research of the Machine Vision Based PCB Defect Inspection System. In Proceedings of the International Conference on Intelligence Science and Information Engineering, Washington, DC, USA, 20–21 August 2011; pp. 472–475. [Google Scholar]
- Baldi, P. Autoencoders; Guyon, I. Autoencoders, Unsupervised Learning, and Deep Architectures; Guyon, I., Dror, G., Lemaire, V., Taylor, G., Silver, D., Eds.; PMLR: Bellevue, WA, USA, 2012; pp. 37–49. [Google Scholar]
- Chattopadhyay, A.; Sarkar, A.; Howlader, P.; Balasubramanian, V.N. Grad-CAM++: Improved Visual Explanations for Deep Convolutional Networks. arXiv 2018, arXiv:1710.11063. [Google Scholar]
- Scherer, D.; Müller, A.; Behnke, S. Evaluation of Pooling Operations in Convolutional Architectures for Object Recognition. In Proceedings of the International Conference on Artifificial Neural Networks, Thessaloniki, Greece, 15–18 September 2010; pp. 92–101. [Google Scholar]
- Kim, J.; Ko, J.; Choi, H.; Kim, H. Printed Circuit Board Defect Detection Using Deep Learning via A Skip-Connected Convolutional Autoencoder. Sensors 2021, 21, 4968. [Google Scholar] [CrossRef]
- Gong, D.; Liu, L.; Le, V.; Saha, B.; Mansour, M.R.; Venkatesh, S.; Hengel, A.V.D. Memorizing Normality to Detect Anomaly: Memory-Augmented Deep Autoencoder for Unsupervised Anomaly Detection. In Proceedings of the IEEE/CVF International Conference on Computer Vision (ICCV), Seoul, Korea, 27 October–2 November 2019. [Google Scholar]
- Turchenko, V.; Chalmers, E.; Luczak, A. A Deep convolutional auto-encoder with pooling—Unpooling layers in caffe. Int. J. Comput. 2019, 8–31. [Google Scholar] [CrossRef]
- Choi, Y.; El-Khamy, M.; Lee, J. Variable Rate Deep Image Compression with a Conditional Autoencoder. In Proceedings of the IEEE/CVF International Conference on Computer Vision (ICCV), Seoul, Korea, 27 October–2 November 2019. [Google Scholar]
- Zong, B.; Song, Q.; Min, M.R.; Cheng, W.; Lumezanu, C.; Cho, D.; Chen, H. Deep Autoencoding Gaussian Mixture Model for Unsupervised Anomaly Detection. In Proceedings of the International Conference on Learning Representations, Vancouver, BC, Canada, 30 April–3 May 2018. [Google Scholar]
- Lalak, M.; Wierzbicki, D. Automated Detection of Atypical Aviation Obstacles from UAV Images Using a YOLO Algorithm. Sensors 2022, 22, 6611. [Google Scholar] [CrossRef]
- Huang, R.; Gu, J.; Sun, X.; Hou, Y.; Uddin, S. A rapid recognition method for electronic components based on the improved YOLO-V3 network. Electronics 2019, 8, 825. [Google Scholar] [CrossRef]
- Wu, Y.; Li, J. YOLOv4 with Deformable-Embedding-Transformer Feature Extractor for Exact Object Detection in Aerial Imagery. Sensors 2023, 23, 2522. [Google Scholar] [CrossRef]
- Liao, X.; Lv, S.; Li, D.; Luo, Y.; Zhu, Z.; Jiang, C. YOLOv4-MN3 for PCB Surface Defect Detection. Appl. Sci. 2021, 11, 11701. [Google Scholar] [CrossRef]
- Han, J.; Liu, Y.; Li, Z.; Liu, Y.; Zhan, B. Safety Helmet Detection Based on YOLOv5 Driven by Super-Resolution Reconstruction. Sensors 2023, 23, 1822. [Google Scholar] [CrossRef]
- Ahmad, T.; Cavazza, M.; Matsuo, Y.; Prendinger, H. Detecting Human Actions in Drone Images Using YoloV5 and Stochastic Gradient Boosting. Sensors 2022, 22, 7020. [Google Scholar] [CrossRef]
- Liu, H.; Sun, F.; Gu, J.; Deng, L. SF-YOLOv5: A Lightweight Small Object Detection Algorithm Based on Improved Feature Fusion Mode. Sensors 2022, 22, 5817. [Google Scholar] [CrossRef]
- Jin, J.; Feng, W.; Lei, Q.; Gui, G.; Li, X.; Deng, Z.; Wang, W. Defect Detection of Printed Circuit Boards Using EffificientDet. In Proceedings of the 2021 IEEE 6th International Conference on Signal and Image Processing (ICSIP), Nanjing, China, 9–11 July 2021; pp. 287–293. [Google Scholar]
- Lai, H.; Chen, L.; Liu, W.; Yan, Z.; Ye, S. STC-YOLO: Small Object Detection Network for Traffic Signs in Complex Environments. Sensors 2023, 23, 5307. [Google Scholar] [CrossRef]
- Mohamed, E.; Sirlantzis, K.; Howells, G.; Hoque, S. Optimisation of Deep Learning Small-Object Detectors with Novel Explainable Verification. Sensors 2022, 22, 5596. [Google Scholar] [CrossRef]
- Wang, J.; Zhang, F.; Zhang, Y.; Liu, Y.; Cheng, T. Lightweight Object Detection Algorithm for UAV Aerial Imagery. Sensors 2023, 23, 5786. [Google Scholar] [CrossRef]
- Betti, A.; Tucci, M. YOLO-S: A Lightweight and Accurate YOLO-like Network for Small Target Detection in Aerial Imagery. Sensors 2023, 23, 1865. [Google Scholar] [CrossRef]
- Zagoruyko, S.; Komodakis, N. Wide Residual Networks. arXiv 2016, arXiv:abs/1605.07146. [Google Scholar]
- Luo, Q.; Jiang, W.; Su, J.; Ai, J.; Yang, C. Smoothing Complete Feature Pyramid Networks for Roll Mark Detection of Steel Strips. Sensors 2021, 21, 7264. [Google Scholar] [CrossRef] [PubMed]
- Lee, D.; Kim, S.; Kim, I.; Cheon, Y.; Cho, M.; Han, W.-S. Contrastive Regularization for Semi-Supervised Learning. arXiv 2022, arXiv:abs/2201.06247. [Google Scholar]
- Tan, M.; Le, Q.V. EffificientNet: Rethinking Model Scaling for Convolutional Neural Networks. arXiv 2019, arXiv:abs/1905.11946. [Google Scholar]
- Neogi, N.; Mohanta, D.K.; Dutta, P.K. Defect detection of steel surfaces with global adaptive percentile thresholding of gradient image. J. Inst. Eng. 2017, 98, 557–565. [Google Scholar] [CrossRef]
- Pramerdorfer, C.; Kampel, M. A dataset for computer-vision-based PCB analysis. In Proceedings of the 2015 14th IAPR International Conference on Machine Vision Applications (MVA), Tokyo, Japan, 18–22 May 2015; pp. 378–381. [Google Scholar]
- Huang, W.; Wei, P. A PCB Dataset for Defects Detection and Classifification. arXiv 2019, arXiv:1901.08204. [Google Scholar]
- Wang, C.Y.; Bochkovskiy, A.; Liao, H.Y.M. YOLOv7: Trainable bag-of-freebies sets new state-of-the-art for real-time object detectors. arXiv 2022, arXiv:2207.02696. [Google Scholar]
|
Disclaimer/Publisher’s Note: The statements, opinions and data contained in all publications are solely those of the individual author(s) and contributor(s) and not of MDPI and/or the editor(s). MDPI and/or the editor(s) disclaim responsibility for any injury to people or property resulting from any ideas, methods, instructions or products referred to in the content. |
© 2023 by the authors. Licensee MDPI, Basel, Switzerland. This article is an open access article distributed under the terms and conditions of the Creative Commons Attribution (CC BY) license (http://creativecommons.org/licenses/by/4.0/).
