
Submitted:
14 July 2023
Posted:
17 July 2023
You are already at the latest version
Abstract
Plants respond to drought by major reprogramming of gene expression enabling the plant to survive this threatening environmental condition. One major upstream signal inducing this multifaceted process is the phytohormone abscisic acid (ABA). In this report, we investigate the drought response in barley plants (Hordeum vulgare, cv. Morex) at both epigenome and transcriptome levels. Leaves of barley plants after 10 days of drought treatment, when soil water content was decreased by about 40%, were compared to well-watered controls. Due to the drought treatment, chlorophyll content and photosystem II-efficiency were decreased by about 10% and some known drought-related genes were already induced. Global ChIPseq analyses were used to identify genes where histones 3 associated with promoter or gene body were modified with euchromatic K4 trimethylation or K9 acetylation during drought. Using stringent exclusion criteria, 129 genes loaded with H3K4me3 and 2008 genes loaded with H3K9ac in response to drought were identified, indicating that H3K9 acetylation reacts to drought more sensitive than H3K4 trimethylation. Comparison with differentially expressed genes enabled to identify those genes, which are loaded with the euchromatic marks and are induced in response to the drought treatment. The results show that a major part of these genes is involved in ABA-signaling and related pathways. Intriguingly, two members of the protein phosphatase 2C family (PP2Cs), which are involved in the central regulatory machinery of ABA signaling, were also identified by this approach.
Keywords:
ABA-related genes
; drought stress
; epigenetics
; euchromatic histone modifications
; Hordeum vulgare
1. Introduction
The sessile lifestyle of plants burdens numerous challenges including accessibility of water. Water shortage leads to drought stress, affecting the plant on a morphological, physiological and molecular level during every stage of development.
Plants exhibit a multitude of responses to upcoming drought conditions including maintaining stomatal conductance by osmotic adjustment due to accumulation of osmolytes like proline, sugars and phenols 1,2 or altering of the root system 3–5.
One of the first responses to the perception of water shortage is stomatal closing, thereby minimizing the loss of water through stomata but also reducing photosynthetic action through diminished CO2 uptake. The hormone abscisic acid (ABA) plays a major role in regulating the drought stress response in plants. Decreasing water availability leads to an induction of expression of ABA biosynthesis-related genes 6,7, e.g., the enzymes NINE-CIS-EPOXYCAROTENOID DIOXYGENASE 3 (NCED3), ZEAXANTHIN EPOXIDASE(ZEP)ALDEHYDE OXIDASE (AAO3) and MOLYBDENUM COFACTOR SULFURASE (MCSU). The newly synthesized ABA then interacts with proteins of the PYRABACTIN RESISTANCE/PYRABACTIN RESISTANCE-LIKE/REGULATORY COMPONENTS OF THE ABSCISIC ACID RECEPTOR (PYR/PYL/RCAR) family, which function as ABA receptors and thereby inhibit clade A protein phosphatases 2Cs (PP2Cs), like ABI1 (Abscisic acid insensitive 1), ABI2, HAB1 (Hypersensitive to ABA1) and HAB2 8–11. The inhibition of the repressor PP2Cs leads to an activation of sucrose non-fermenting 1-related kinase 2-type protein kinases (SnRK2), including the open stomata 1 (OST1)/SnRK2-6 and the S-type anion channel (SLAC1) which function in the induction of stomatal closure and other stress responses 12–16.
Recent studies revealed that responses of plants to environmental stress involve higher order epigenetic regulatory mechanisms as differential histone modifications and DNA methylation, affecting chromatin structure (reviewed in 17). Especially in response to drought, fast and dynamic changes in histone modifications as well as more stable and progressive changes in the histone context were reported 18–21, however, the exact mechanistic link between epigenetic modifications and transcriptional regulation is not yet fully understood 18,22.
Most work concerning stress-related histone modifications was done with the model plant Arabidopsis thaliana. Using chromatin immunoprecipitation followed by deep sequencing (ChIP-seq), genome wide distribution patterns of mono-, di- and trimethylation of H3K4 in Arabidopsis thaliana under drought stress were conducted and it could be shown that in contrast to the moderately changed H3K4me1 and H3K9me2 marks, H3K4me3 changed prominently corresponding with up- and downregulated genes 23. Furthermore, dehydration- and ABA- inducible genes showed a broader distribution of H3K4me3 over the gene body. In another genome-wide study in rice under drought stress, the transcript level of a subset of stress-responsive genes could be positively correlated with the modification level of H3K4me3 24. Forestan et al.25 applied mild prolonged stress on Zea mays followed by a recovery phase while examining changes in the H3K4me3, H3K9ac and H3K27me3 levels with an additional focus on transcript level changes. It could be shown that between 25- 30% of genes marked with H3K4me3 or H3K9ac are also upregulated during drought whereas the H3K27me3 mark showed no correlation25. In the grass Brachypodium distachyon, combined ChIPseq and transcriptome data could identify genes upregulated during PEG-6000-simulated drought stress and associated with increased H3K9ac level 26.
Real time qPCR analyses with drought stressed rice seedlings showed an elevated expression of four histone acetyltransferases (HATs; OsHAC703, OsHAG703, OsHAF701, OsHAM701) and supporting Western-blot analysis revealed an enrichment of acetylation on H3K9, K18 and K27 as well as H4K5 in parallel to the increased OsHATs expression 27. Loss of function studies of the Arabidopsis TRITHORAX-like factor ATX1 which trimethylates H3K4 leads to decreased levels of H3K4me3 at NCED3, a key enzyme in ABA biosynthesis, in drought stressed Arabidopsis plants, resulting in reduced ABA concentration 28. Furthermore, it could be shown, that during dehydration, NCED3 showed increased enrichment of nucleosomal H3K4me3 29. In two studies, Kim et al. (2008, 2012) showed enriched H3K4me3 and H3K9ac levels at the drought-inducible genes RD20 and RD29A where the enrichment levels correlated with the intensity of the stress (moderate vs severe) 18. Interestingly, during rehydration, the H3K9ac mark diminished fast and robustly while H3K4me3 decreased progressively 19.
In this study, we investigated the genome-wide responses of the crop plant Hordeum vulgare to drought stress at the level of H3K4 trimethylation and H3K9 acetylation. Interestingly, the H3K9ac mark showed a more flexible and dynamic response to the stress than H3K4me3. Strikingly, especially histones in promoter and ATG-region of genes involved in ABA-related stress responses were acetylated at K9 in response to the stress, including 26 protein phosphatases 2C (PP2Cs), indicating epigenetic regulation of ABA-related drought stress responses in the crop plant barley. Parallel stringent RNAseq and qPCR analyses revealed that some of these genes were also induced during drought treatment, but on the other hand, many genes up-regulated during drought did not show loading with these euchromatic marks. This indicates that epigenetic control at least during the early phase of drought stress response investigated in this work, specifically targets genes involved in ABA-biosynthesis and -response.
2. Results
2.1. Set-up of drought stress experiment
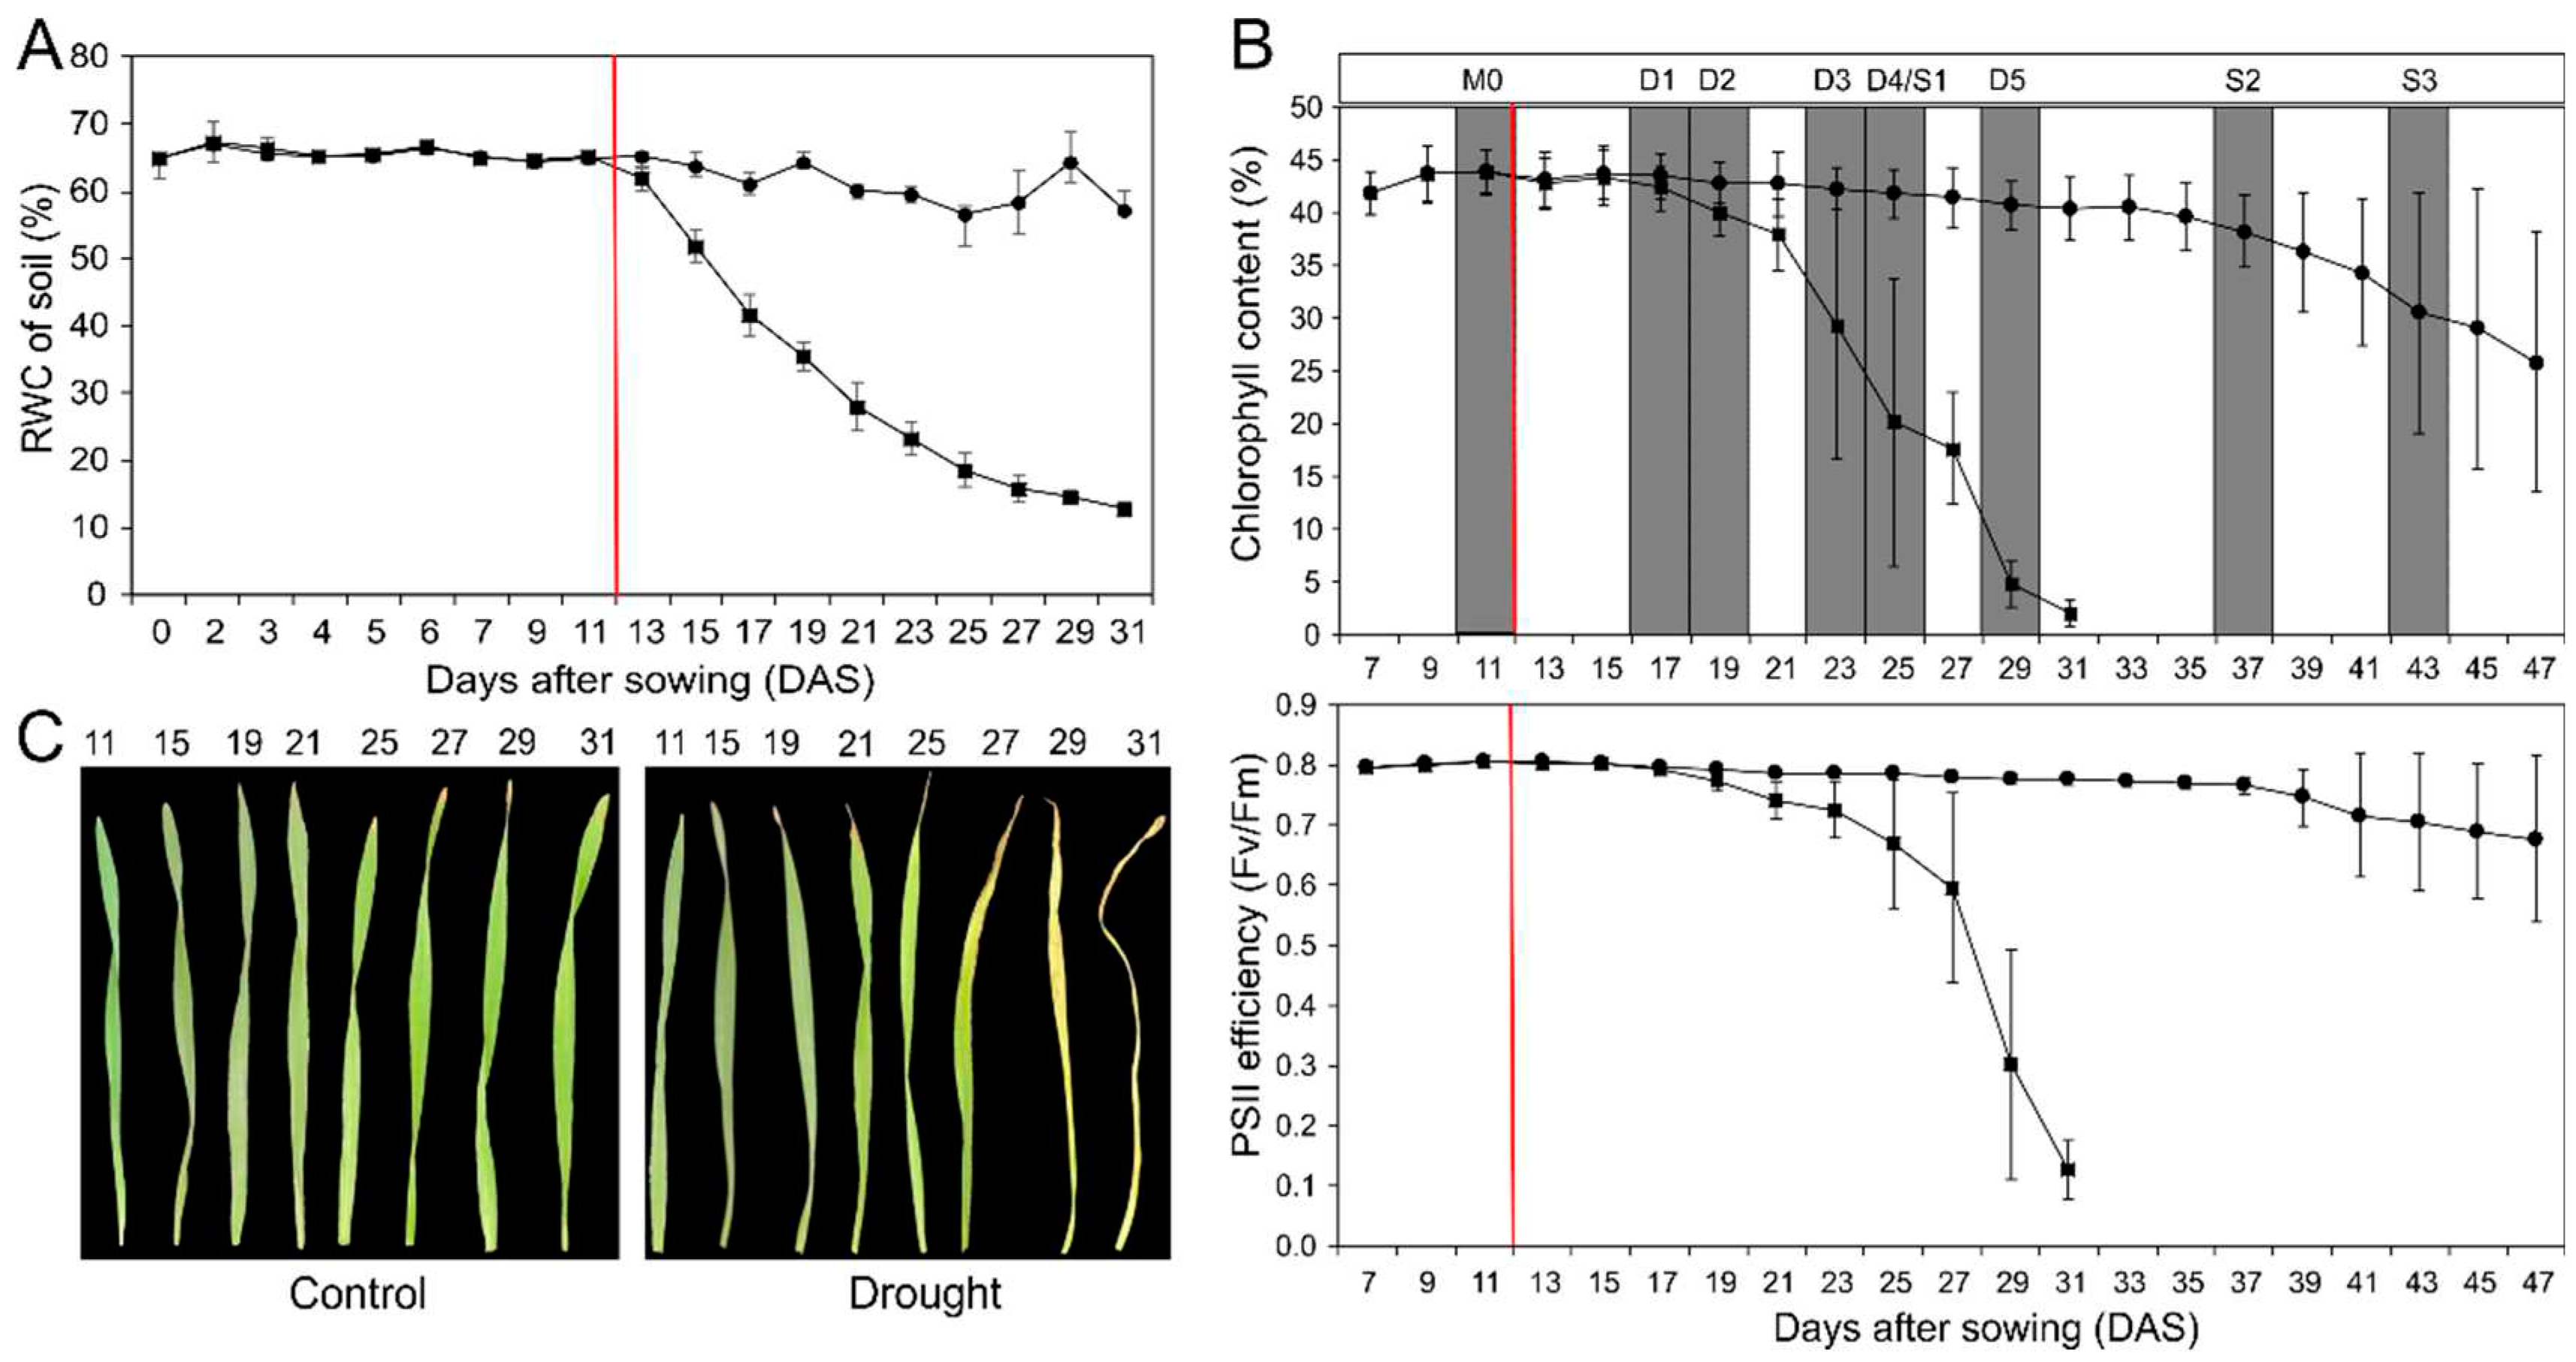
Barley (Hordeum vulgare cv. Morex) plants were grown in Mitscherlich pots in soil under standardized conditions. Eleven days after sowing, irrigation was stopped for half of the pots, resulting in a continuous decrease in soil water content (Figure 1A). The other plants were kept under control conditions at about 65% soil water content. This mild drought stress caused an early decrease in chlorophyll content and photosystem II (PSII)-efficiency in the primary leaf (Figure 1B), indicating premature stress-induced senescence processes with decreasing photosynthesis and degradation of chloroplasts. Exemplarily, in Figure 1C primary leaves of drought-stressed and control plants at different time points are shown. The drought-stressed leaves clearly show a much earlier loss of chlorophyll content when compared to the control. Developmental senescence of primary leaves in control starts only much later. As indicated in Figure 1B, primary leaves for gene expression analyses were harvested from both, drought-stressed and control plants, before drought-treatment (M0), and at five stages of drought-stress treatment (D1-D5) and in control plants additionally at two further stages (S2 and S3). Developmental and drought stress stages were defined based on the relative chlorophyll content. The maximum measured value of the chlorophyll content was set as 100 % and determined as the mature stage in which the primary leaf is fully developed (M0). Leaves of stage D1/S1 have a relative chlorophyll content of 95 %, D2/S2 90 %, D3/S3 75 %, D4/S4 50 % and D5/S5 25 %. In control plants stage S1 is at the same day as D4 in drought-stressed samples.
Figure 1.
Physiological characterization of barley plants under developmental (●) and drought stress (■) conditions. (A) Relative soil water content of control and drought stress plants during a time period of 31 days. (B) Relative chlorophyll content and PSII efficiency (Fv/Fm = maximum quantum yield) of control and drought stressed plants over a time period of 47 days. The red line marks the starting point of water retention. Developmental stages were defined based on the relative Chlorophyll content. The maximum measured value of the chlorophyll content was set as 100 % and determined as the mature stage in which the primary leaf is fully developed (M0). Every data point corresponds to the mean values of four to eight independent measurements. (C) Photographic documentation of primary leaves under drought stress (right) and control (left) conditions during a time period of 31 days. Each data point represents the average value from at least 5 biological replications, and the error bar shows the mean (±) standard deviation.
2.2. Expression of stress- and senescence-related marker genes
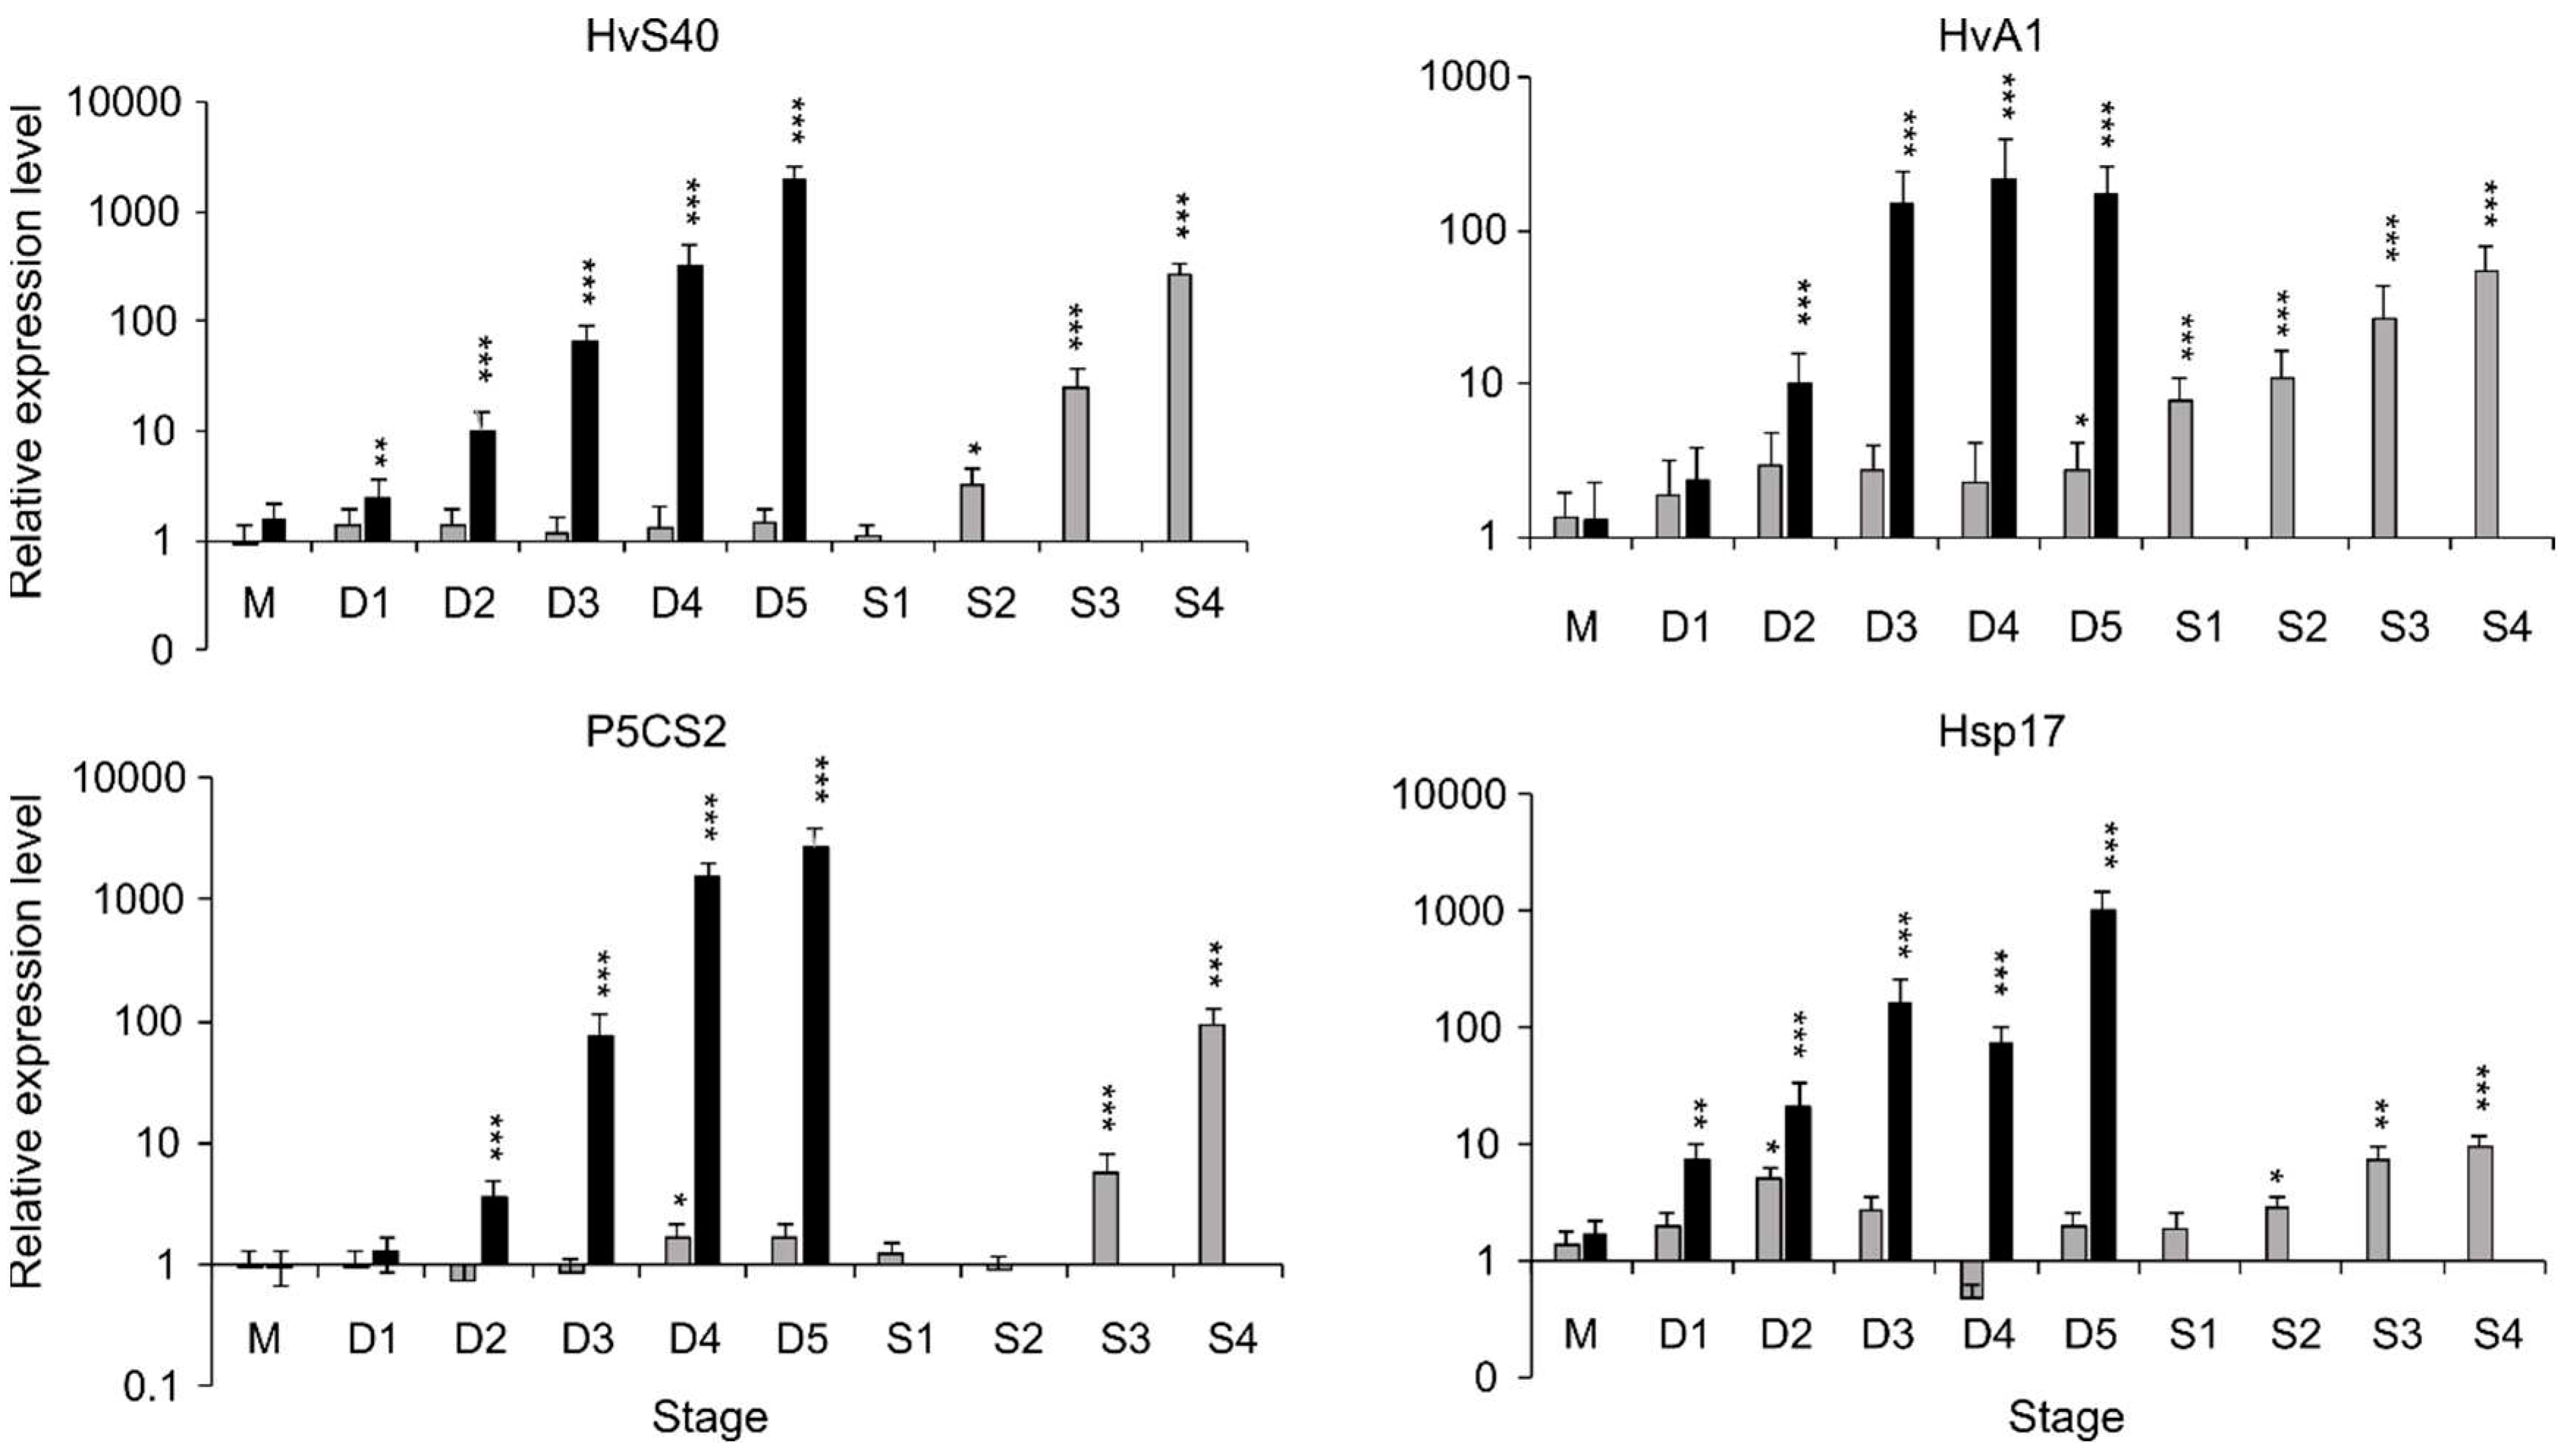
Drought stress results in a major reprogramming of gene expression 30. To map this process, expression of known marker genes of drought-stress and leaf senescence was analyzed in drought stress- and control-samples at the stages defined by the physiological parameters outlined above (Figure 2). These marker genes are the senescence-associated gene HvS40 31–33, HvA1 encoding a dehydrin of the LEA protein-family 34,35, P5CS2 encoding a Delta-1-pyrroline-5-carboxylate synthetase enzyme, involved in proline biosynthesis 36–38 and Hsp17 encoding a stress-related heat shock protein 39. HvS40, HvA1, P5CS2 and Hsp17 are clearly upregulated in response to drought-treatment, and to some extent also during developmental senescence.
Figure 2.
Relative transcript level of drought stress-related and senescence-associated genes in mature, non-stressed stage (M) and at different stages during drought stress (D1-D5, drought stress (■)) and during development under control conditions (■) of mature leaves at same days when drought-treated plants are at stages D1-D5, and later at different stages of developmental senescence S1-S4). Each graph bar represents the average value from 3 separate replications, and the error bar shows the ±SE. The asterisks above the graph bar show statistically significant differences according to Student’s t-test with * p < 0.05, ** p < 0.01 and ***p<0.001. Mean relative expression level, standard error and p-values were calculated by the software REST-384 ©2006 (v2.0, Qiagen GmBH, Hilden, Germany).
2.3. Drought stress specifically alters genome-wide loading with euchromatic marks H3K4me3 and H3K9ac
Primary leaves were harvested at three different stages (M0 and M2 as control, and D2 as drought stressed sample). To detect early responses to drought the D2 stage was chosen, which represents a rather early phase of drought stress, with only 10% loss of chlorophyll and less than 5% decrease in photosynthetic performance (Figure 1B). Chromatin immunoprecipitation (ChIP) followed by Illumina deep sequencing for each stage was performed with samples from three independent experiments to detect genome-wide loading of histone 3 with euchromatic marks K4me3 and K9ac in M0, M2 and D2. At an average count of 18.9 million reads per sample, 93 % of the reads could be mapped to the barley genome MorexV2 40,41. The mapping statistics for the Input (untreated chromatin) and the IP samples (antibody-treated samples) are listed in supplemental Table S1. To detect enriched regions of H3K4me3 and H3K9ac, pooled peak calling with all three IP samples and their corresponding input samples were performed with MACS2 (see Material and Methods for details), yielding lists of peaks for each time point and histone modification. The detected peaks were intersected with the annotated gene list of the barley genome MorexV2, resulting in ~ 7,000 – 28,000 genes associated with a mark for each sample (Figure 3A, genes are listed in Supplemental Table S2-S7). The pure number of detected genes with H3K4me3-loading is much higher than with H3K9ac-loading and most of the detected genes (15,302) share both marks. Peak distribution covering all 7 chromosomes (1H – 7H) is shown in Figure 3B. The euchromatic marks H3K4me3 and H3K9ac detected in this analysis agglomerate at chromosome end regions and not at centromere showing the same distribution as transcriptionally active genes 40. In addition, we analyzed the heterochromatic mark H3K9me2, which shows the opposite distribution and is spread over centromeric, inactive regions, and is missing at active chromosome ends.
Figure 3.
Genome-wide identification of euchromatic marks. (A) Number of detected peaks and genes for both modifications and the three time points (B) Visualization of the detected peaks in the Integrative Genome Viewer (IGV). (C) Venn diagrams of the comparison of the gene lists loaded with H3K4me3 and H3K9ac between all three time points. (D) Read density around the TSS of their corresponding genes for H3K4me3 and H3K9ac where the y-axis depicts the mean normalized log2 ratio between the signal track of the histone enrichment and the genic regions and the x-axis presents the genomic ranges.
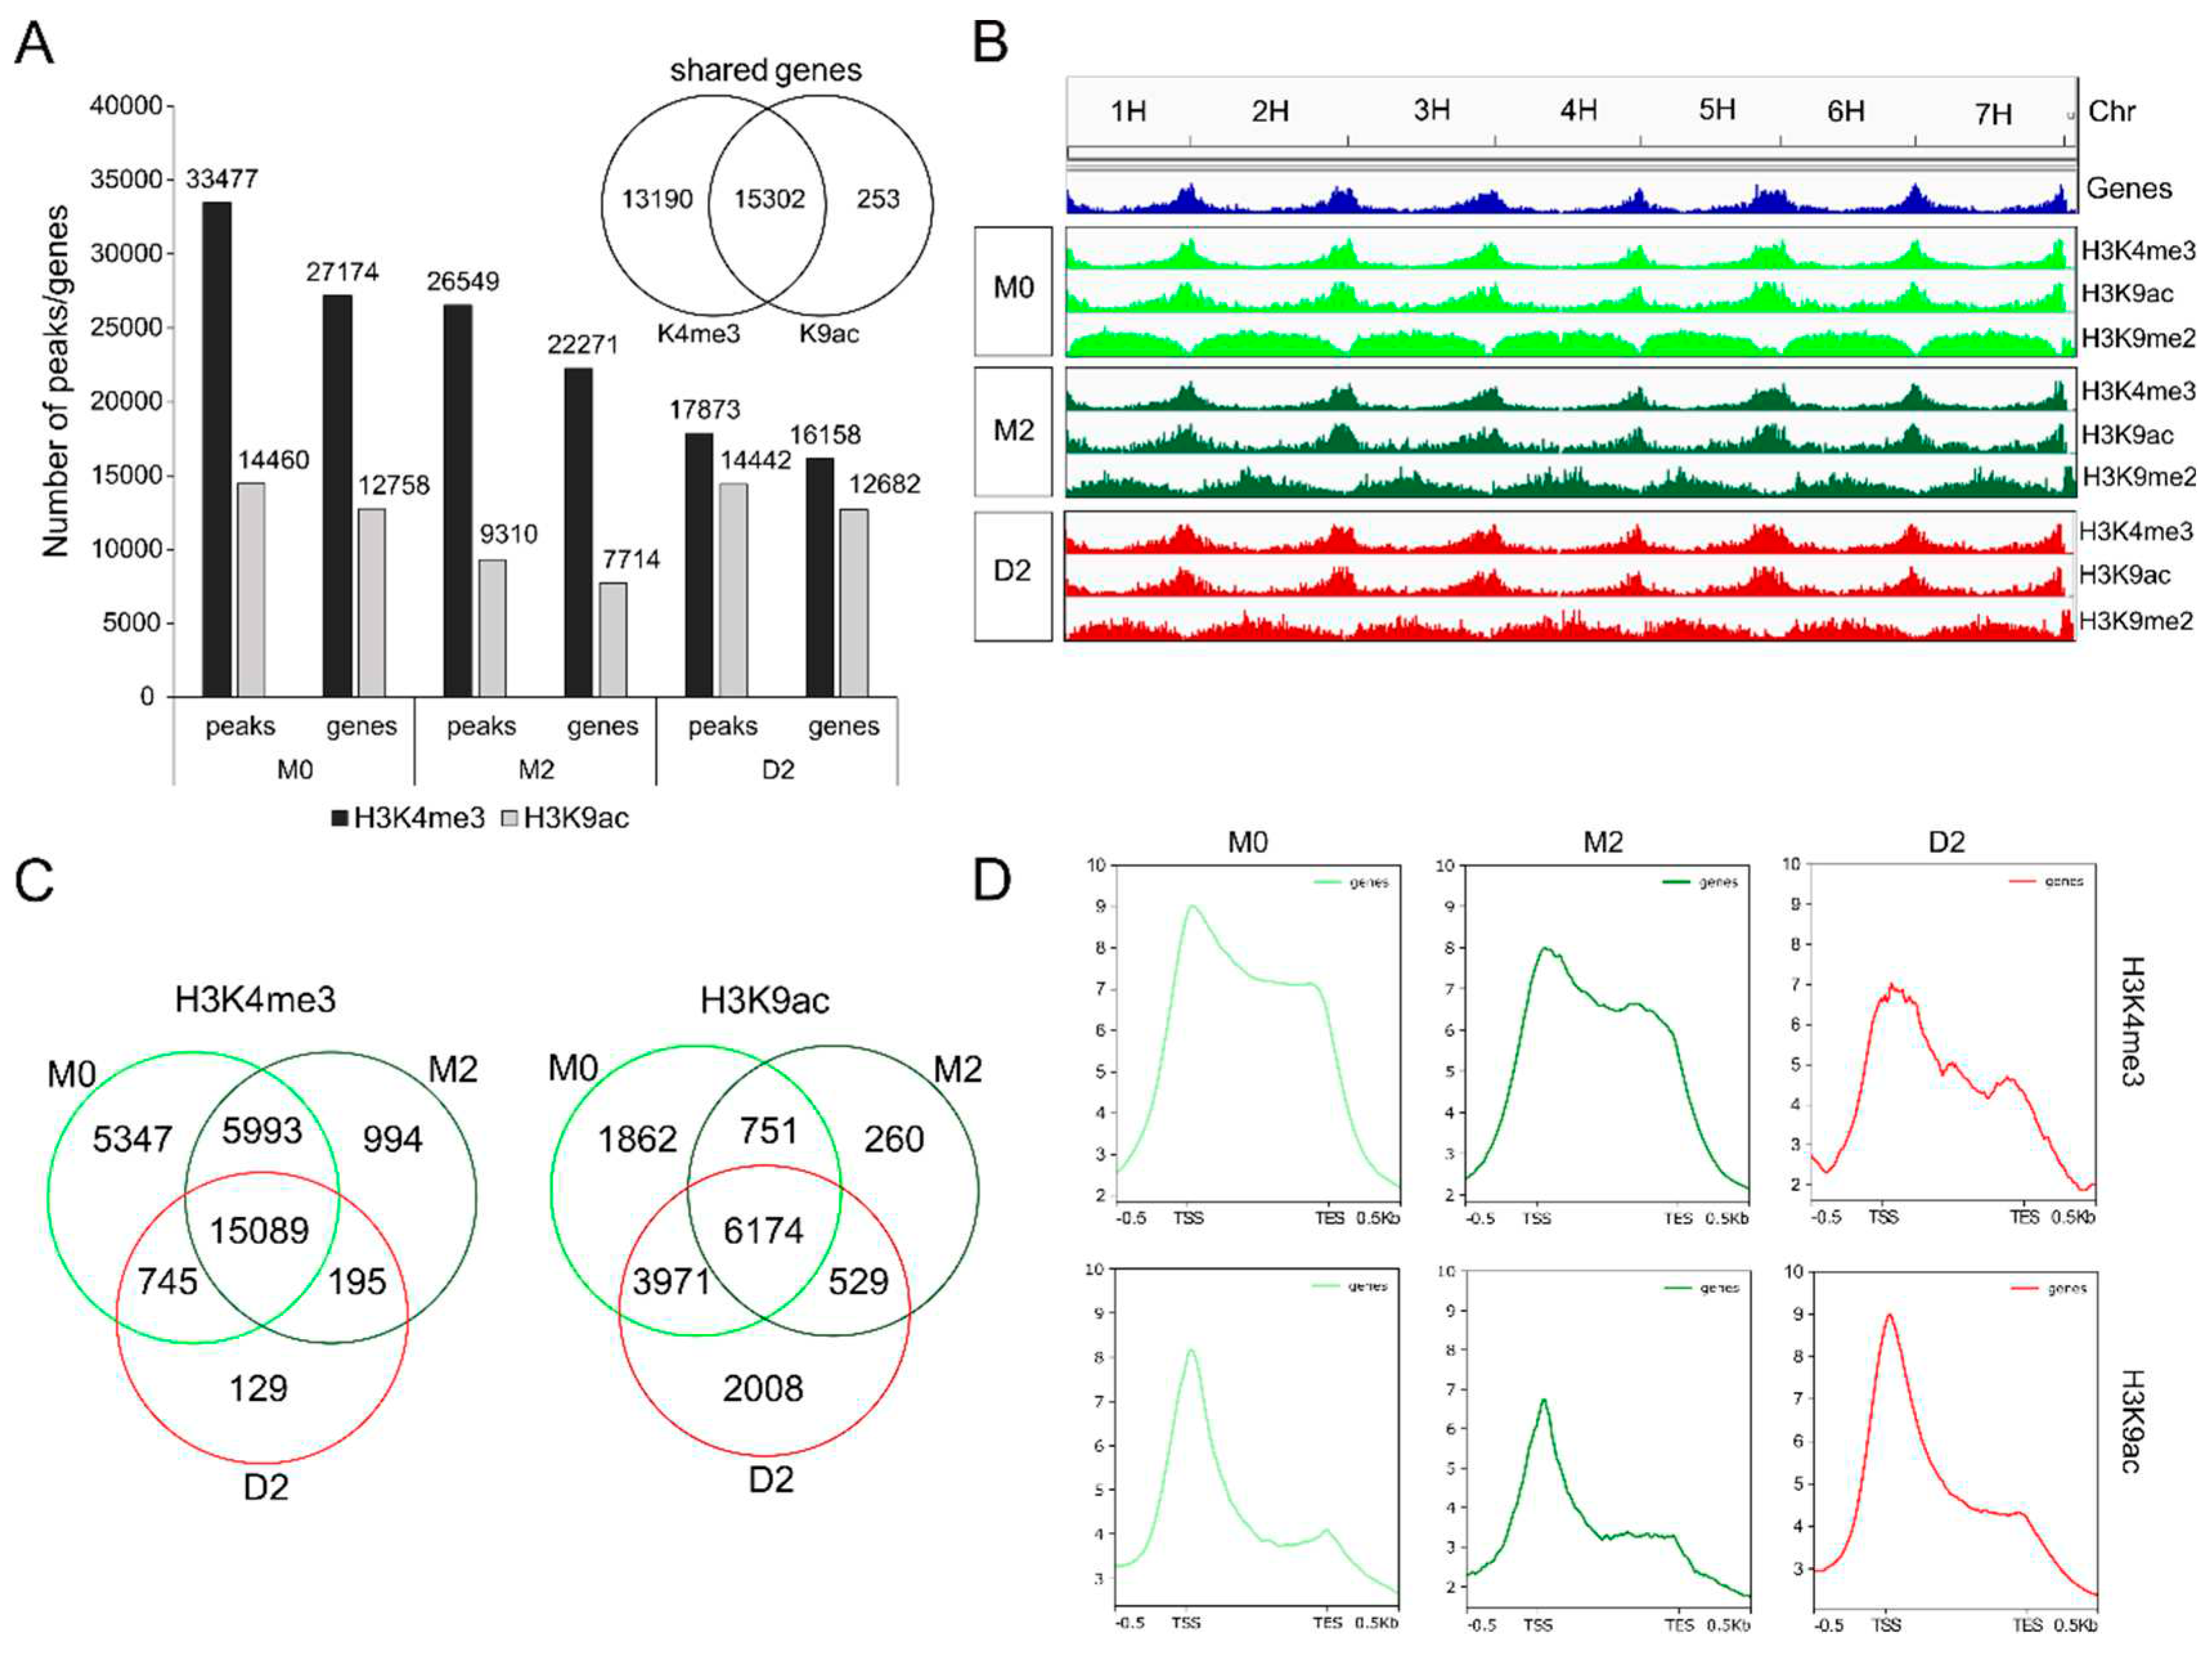
To identify only those genes with prominent H3K4me3- and H3K9ac- loading at promoter and gene body, a stringent threshold for peak detection was exerted. MACS2-identified peaks with a fold enrichment ≥ 10fold and q-value < 0.05 were selected. Figure 3C shows Venn diagrams comparing these gene lists (Supplemental Tables S2-6) identified from leaves under control conditions (M0 and M2) and under drought stress condition (D2). For both marks, around 50% of the genes loaded with the euchromatic marks (H3K4me3 and H3K9ac) are common in all of the three conditions M0, M2 and D2 (15,089 genes with H3K4me3 and 6174 genes with H3K9ac). However, there are genes specifically loaded only in one or two conditions. Interestingly, the majority of genes loaded with H3K4me3 and H3K9ac specifically in only one condition, is found in M0, meaning that these marks are erased during further 8 days of development (from 11 to 19/21 days after sowing), irrespective of control or drought condition. Comparing the two different euchromatic marks, there are differences in changes during development and drought stress. While 5,993 genes are labelled with H3K4me3 in both developmental stages, M0 and M2, only 751 genes retain H3K9ac marks during development from M0 to M2. This could indicate that H3K9ac-labeling is more flexible than H3K4me3-labeling during development, respectively. Interestingly, under drought stress, 2,008 genes were specifically labeled with H3K9ac, compared to only 129 genes labeled specifically with H3K4me3, indicating again a higher flexibility of H3K9 acetylation than H3K4 tri-methylation.
Euchromatic marks like K4 tri-methylation and K9 acetylation are known to be preferentially positioned at histones 3, associated with DNA around transcriptional start sites (TSS) and to reach into gene body 42. This distinct spatial distribution of transcriptionally active marks is also seen for the identified genes associated with H3K4me3 or H3K9ac (Figure 3D). Using deeptools, mean scores calculated from the signal tracks of the histone enrichment were plotted against the genes associated with a peak. In all three conditions (M0, M2 and D2), highest enrichment of H3K4me3 and H3K9ac is around TSS and adjoining gene body. While H3K4me3 shows a broader labeling with high loading over the whole gene body with sharp drop at the transcription end site (TES), H3K9ac is preferentially positioned around TSS. This was also described in Baker et al., showing strong enrichment in ChIP-seq peaks around the TSS for H3K4me3 and H3K56ac43.
2.4. Functional analysis of genes loaded with H3K9ac or H3K4me3 in response to drought
Comparing genes associated with the euchromatic marks at the different time points revealed that in response to early drought 129 genes were loaded with H3K4me3 and 2008 genes with H3K9ac (Figure 3C). Using the GO enrichment analysis platform TRAPID 44, these genes (listed in Supplemental Tables S8,9) were functionally clustered and enrichment analyses were performed. The program uses the Benjamini & Hochberg method for correcting and the maximum q-value was set to 0.05. While with these settings, no significantly enriched GO terms could be detected for the low number of H3K4me3-marked genes, this analysis allowed to identify specific functional classes of genes which are marked with H3K9ac in response to drought stress.
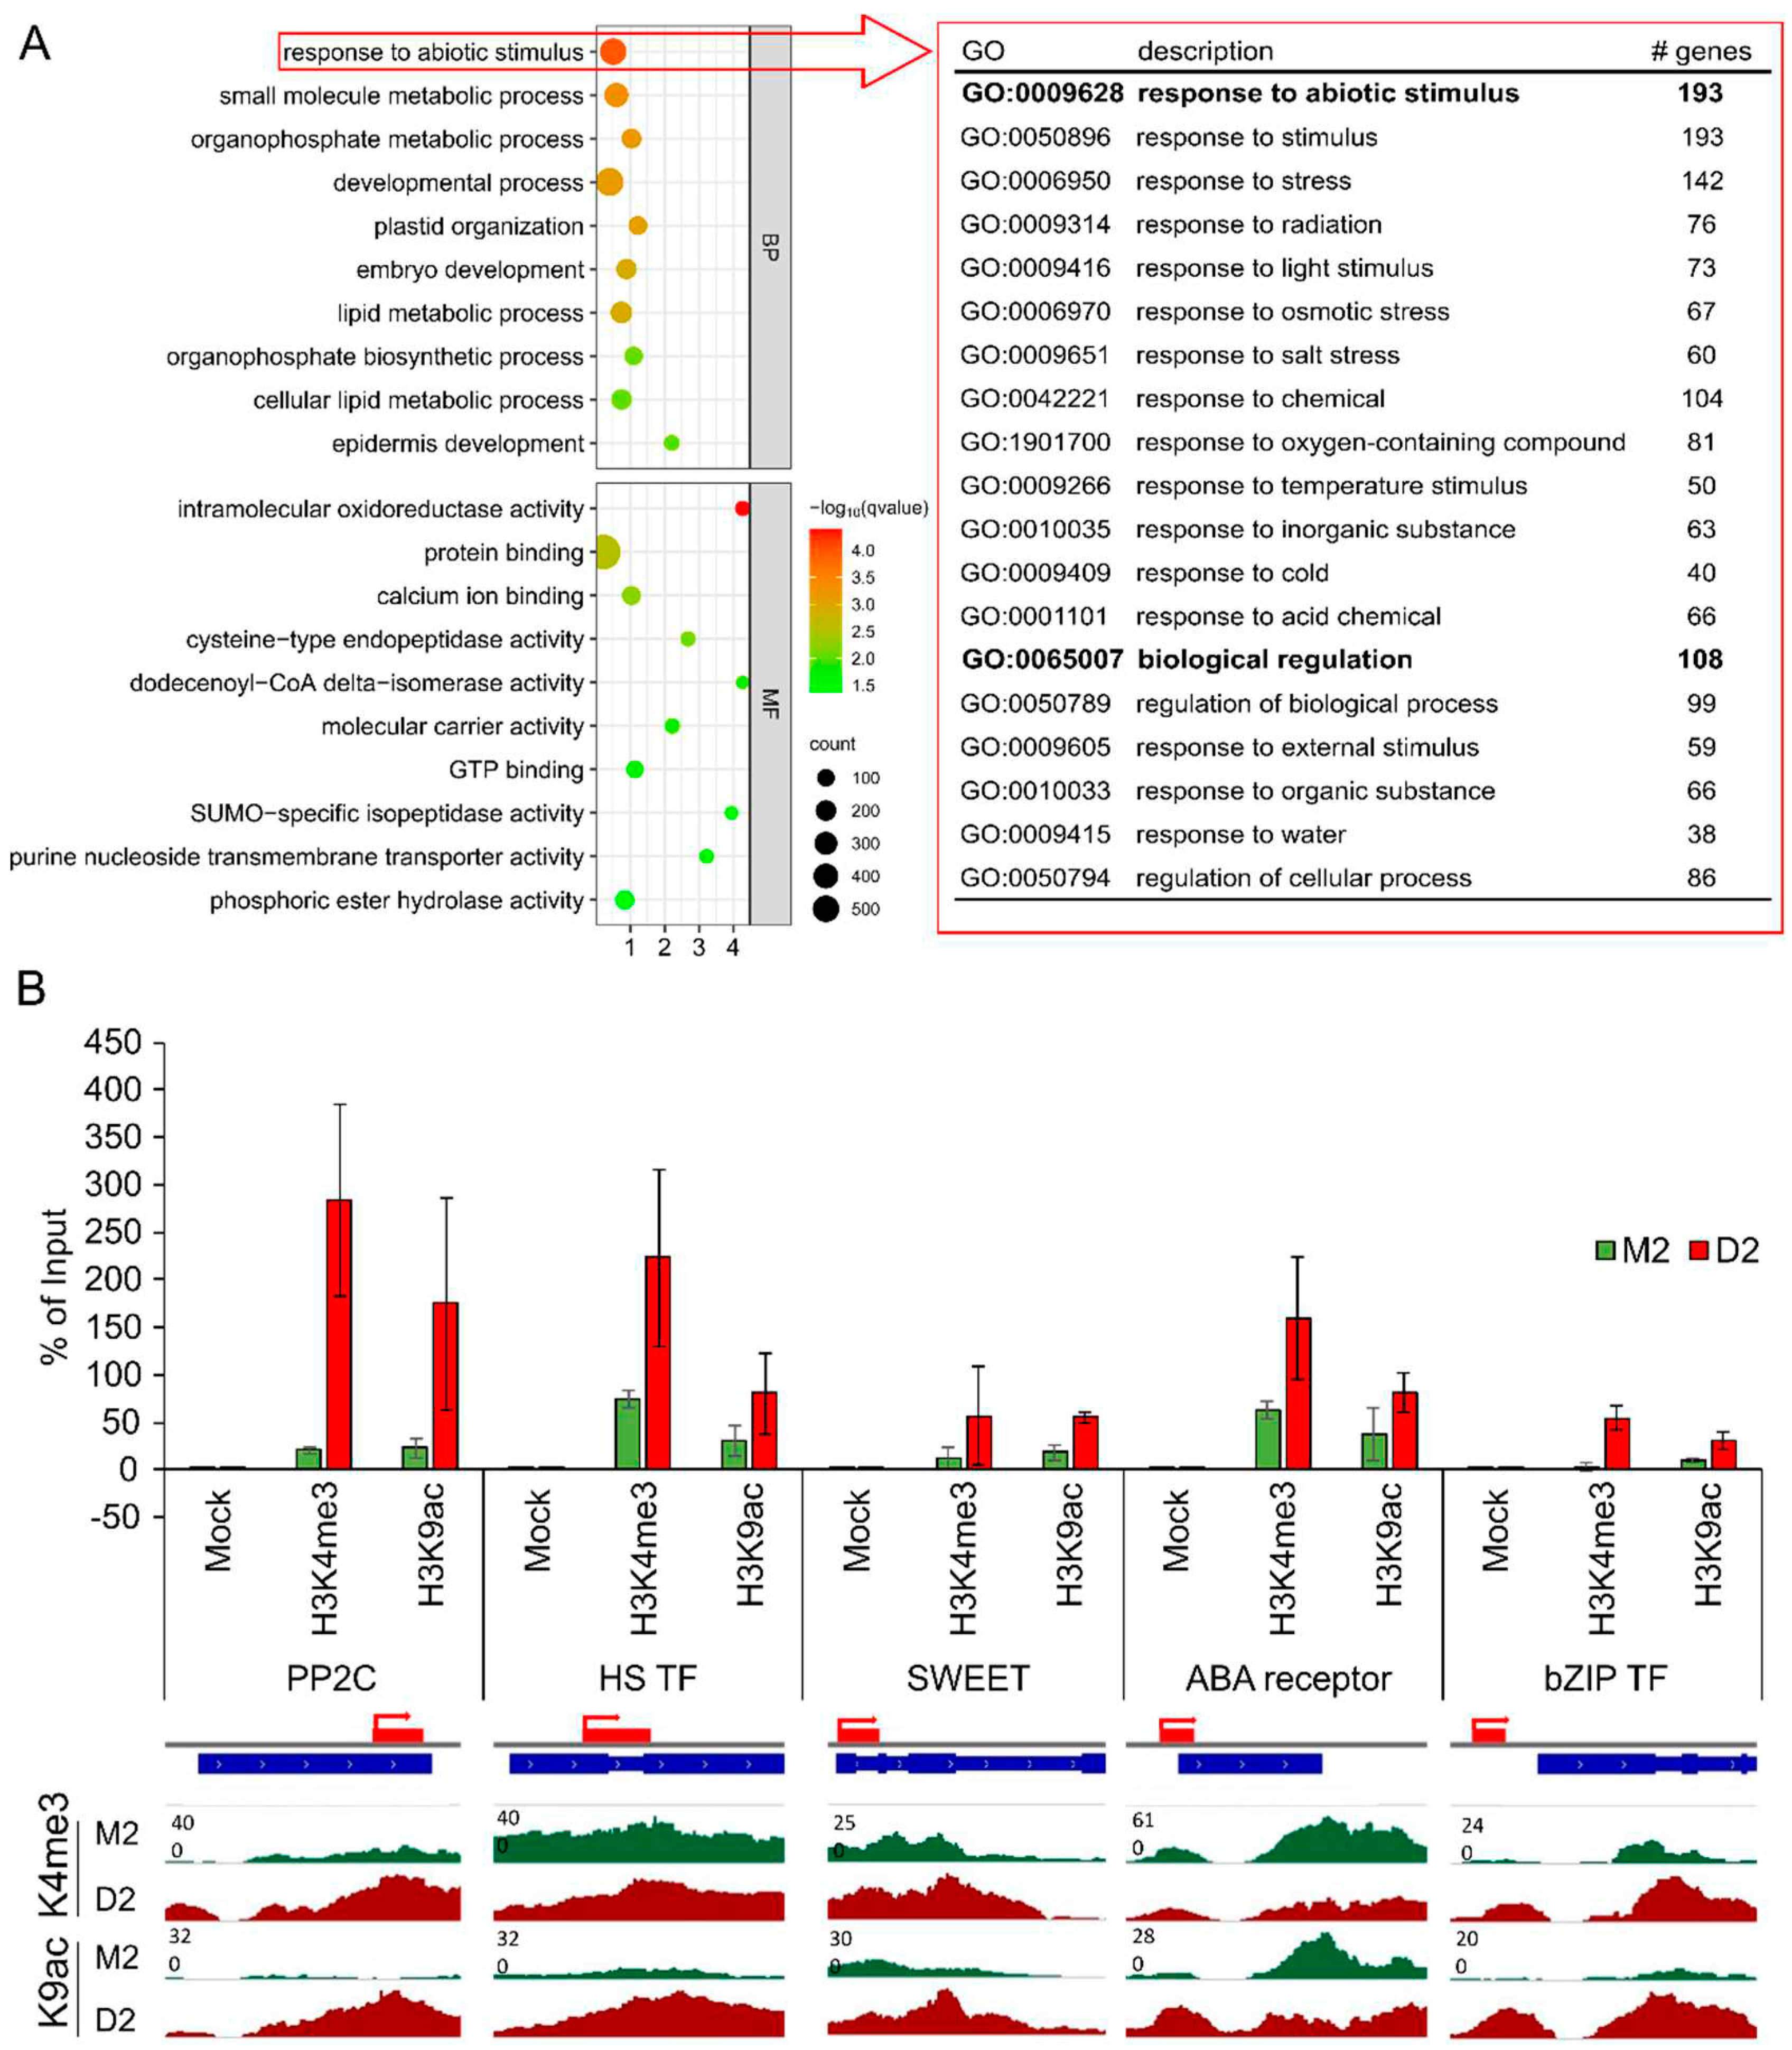
Figure 4A shows the top ten enriched GO terms for the Biological Process and the Molecular Function for the 2008 genes associated exclusively with H3K9ac in D2 (see full list in Table S10). These genes have functions in several metabolic processes, involving small molecule metabolism, organophosphate metabolism, lipid metabolism and endopeptidase function. In addition, genes were found which are involved in plastid organization, embryo and epidermis development and protein binding. The most striking set of genes with the highest q-value is involved in response to abiotic stimulus. This set of 193 genes, specifically loaded in response to drought with the euchromatic mark H3K9ac, is functionally connected to different abiotic stress responses, including drought/osmotic stress, light stimulus, salt stress, temperature stress, cold stress and external stimulus (Figure 4A). Supplemental Figure S1 shows increase in H3K9ac-loading for 10 well-known stress-related genes from the list: a 9-cis-epoxycarotenoid dioxygenase (central enzyme of ABA-biosynthesis), two Cytochrome P450 genes (known to act in biotic and abiotic stress pathways), two ethylene-responsive transcription factors (stress-response), a flowering locus T gene (regulates flowering time, also in response to environmental changes), two genes coding for HVA22-like proteins (involved in abiotic stress responses), a Zinc-finger protein and a LEA-family protein (both involved in abiotic stress responses), show a clear increase in acetylation at K9 during drought. Furthermore, 22 genes are associated with both marks exclusively in D2 (data not shown). To validate the deep sequencing results, loading with H3K4me3 and H3K9ac at five genes from that list was additionally validated via qRT-PCR (Figure 4B). These genes are a Protein phosphatase 2C (PP2C), a bidirectional sugar transporter SWEET (SWEET), a bZIP Transcription factor (bZIP TF), an ABA receptor and a Heat shock transcription factor (HS TF). This analysis revealed a significant enhancement in both marks in drought stressed samples, with PP2C showing the strongest enrichment with both euchromatic marks.
Figure 4.
Analysis of genes associated with H3K4me3 or H3K9ac. (A) GO enrichment analysis of genes associated with H3K9ac in D2 in comparison to M0 and M2. The top ten GO terms for Biological Process (BP) and Molecular Function (MF) were chosen based on the q-value. Subset enrichment analysis were conducted for the overrepresented term ‘response to abiotic stimulus’ and the first two terms with corresponding subterms (in red) are shown. (B) ChIPseq validation with five selected genes. The percentage of Input was calculated for a Protein Phosphatase 2C (PP2C) gene, a Heat shock transcription factor (HS TF), a bidirectional SWEET transporter (SWEET), a gene encoding for an ABA receptor and a bZIP Transcription factor (bZIP TF) (n=3). The red bands mark the PCR amplicon. In addition, signal tracks of histone 3 loading with K4me3 or K9ac of promoter and TSS regions of these genes are shown for M2 (green) and D2 (red). .
2.5. Identification of genes specifically labeled with H3K4me3 and H3K9ac, and being up-regulated during drought stress
Via genome-wide ChIPseq we could identify genes which were loaded with euchromatic marks H3K4me3 and H3K9ac during development (M2vsM0) and at early phase of drought stress (D2vsM2). Using genome-wide RNAseq approach, we additionally identified parallel changes in transcriptional activity of barley genes during development and drought stress. Lists with differentially expressed genes (DEGs) under these conditions are provided in supplemental material (Supplemental Tables S11, S12). Using stringent conditions (adjusted q-value < 0.05; log fold change≥|1|), 220 genes differentially expressed in response to early drought stress (D2vsM2) could be identified, 103 being down-regulated and 117 being up-regulated (Figure 5A). RNAseq data were validated for selected genes via qRT-PCR (Figure 5B). To gain insight in the biological functions of the upregulated genes, Gene Ontology enrichment analysis was performed. The main enriched GO terms are cell wall related (plant-type secondary cell wall biogenesis, lignin catabolic process), stress related (response to osmotic stress, response to water deprivation), the phenylpropanoid metabolic process, response to abiotic stimulus and oxidation-reduction processes.
Figure 5.
Comparison of transcriptomic changes and histone modifications. (A) Number of up- and downregulated genes in drought stress (D2vsM2) and GO enrichment analysis of genes upregulated during drought. (BP)= Biological Process, (MF)= Molecular Function, (CC)= Cellular Component. (B) Relative transcript level calculated via qRT-PCR of four selected up- and one down- regulated genes, confirming the results of the RNA sequencing. (C) Genes associated with a histone mark and being upregulated in D2. (D) Signal tracks of selected genes for H3K4me3 and H3K9ac.
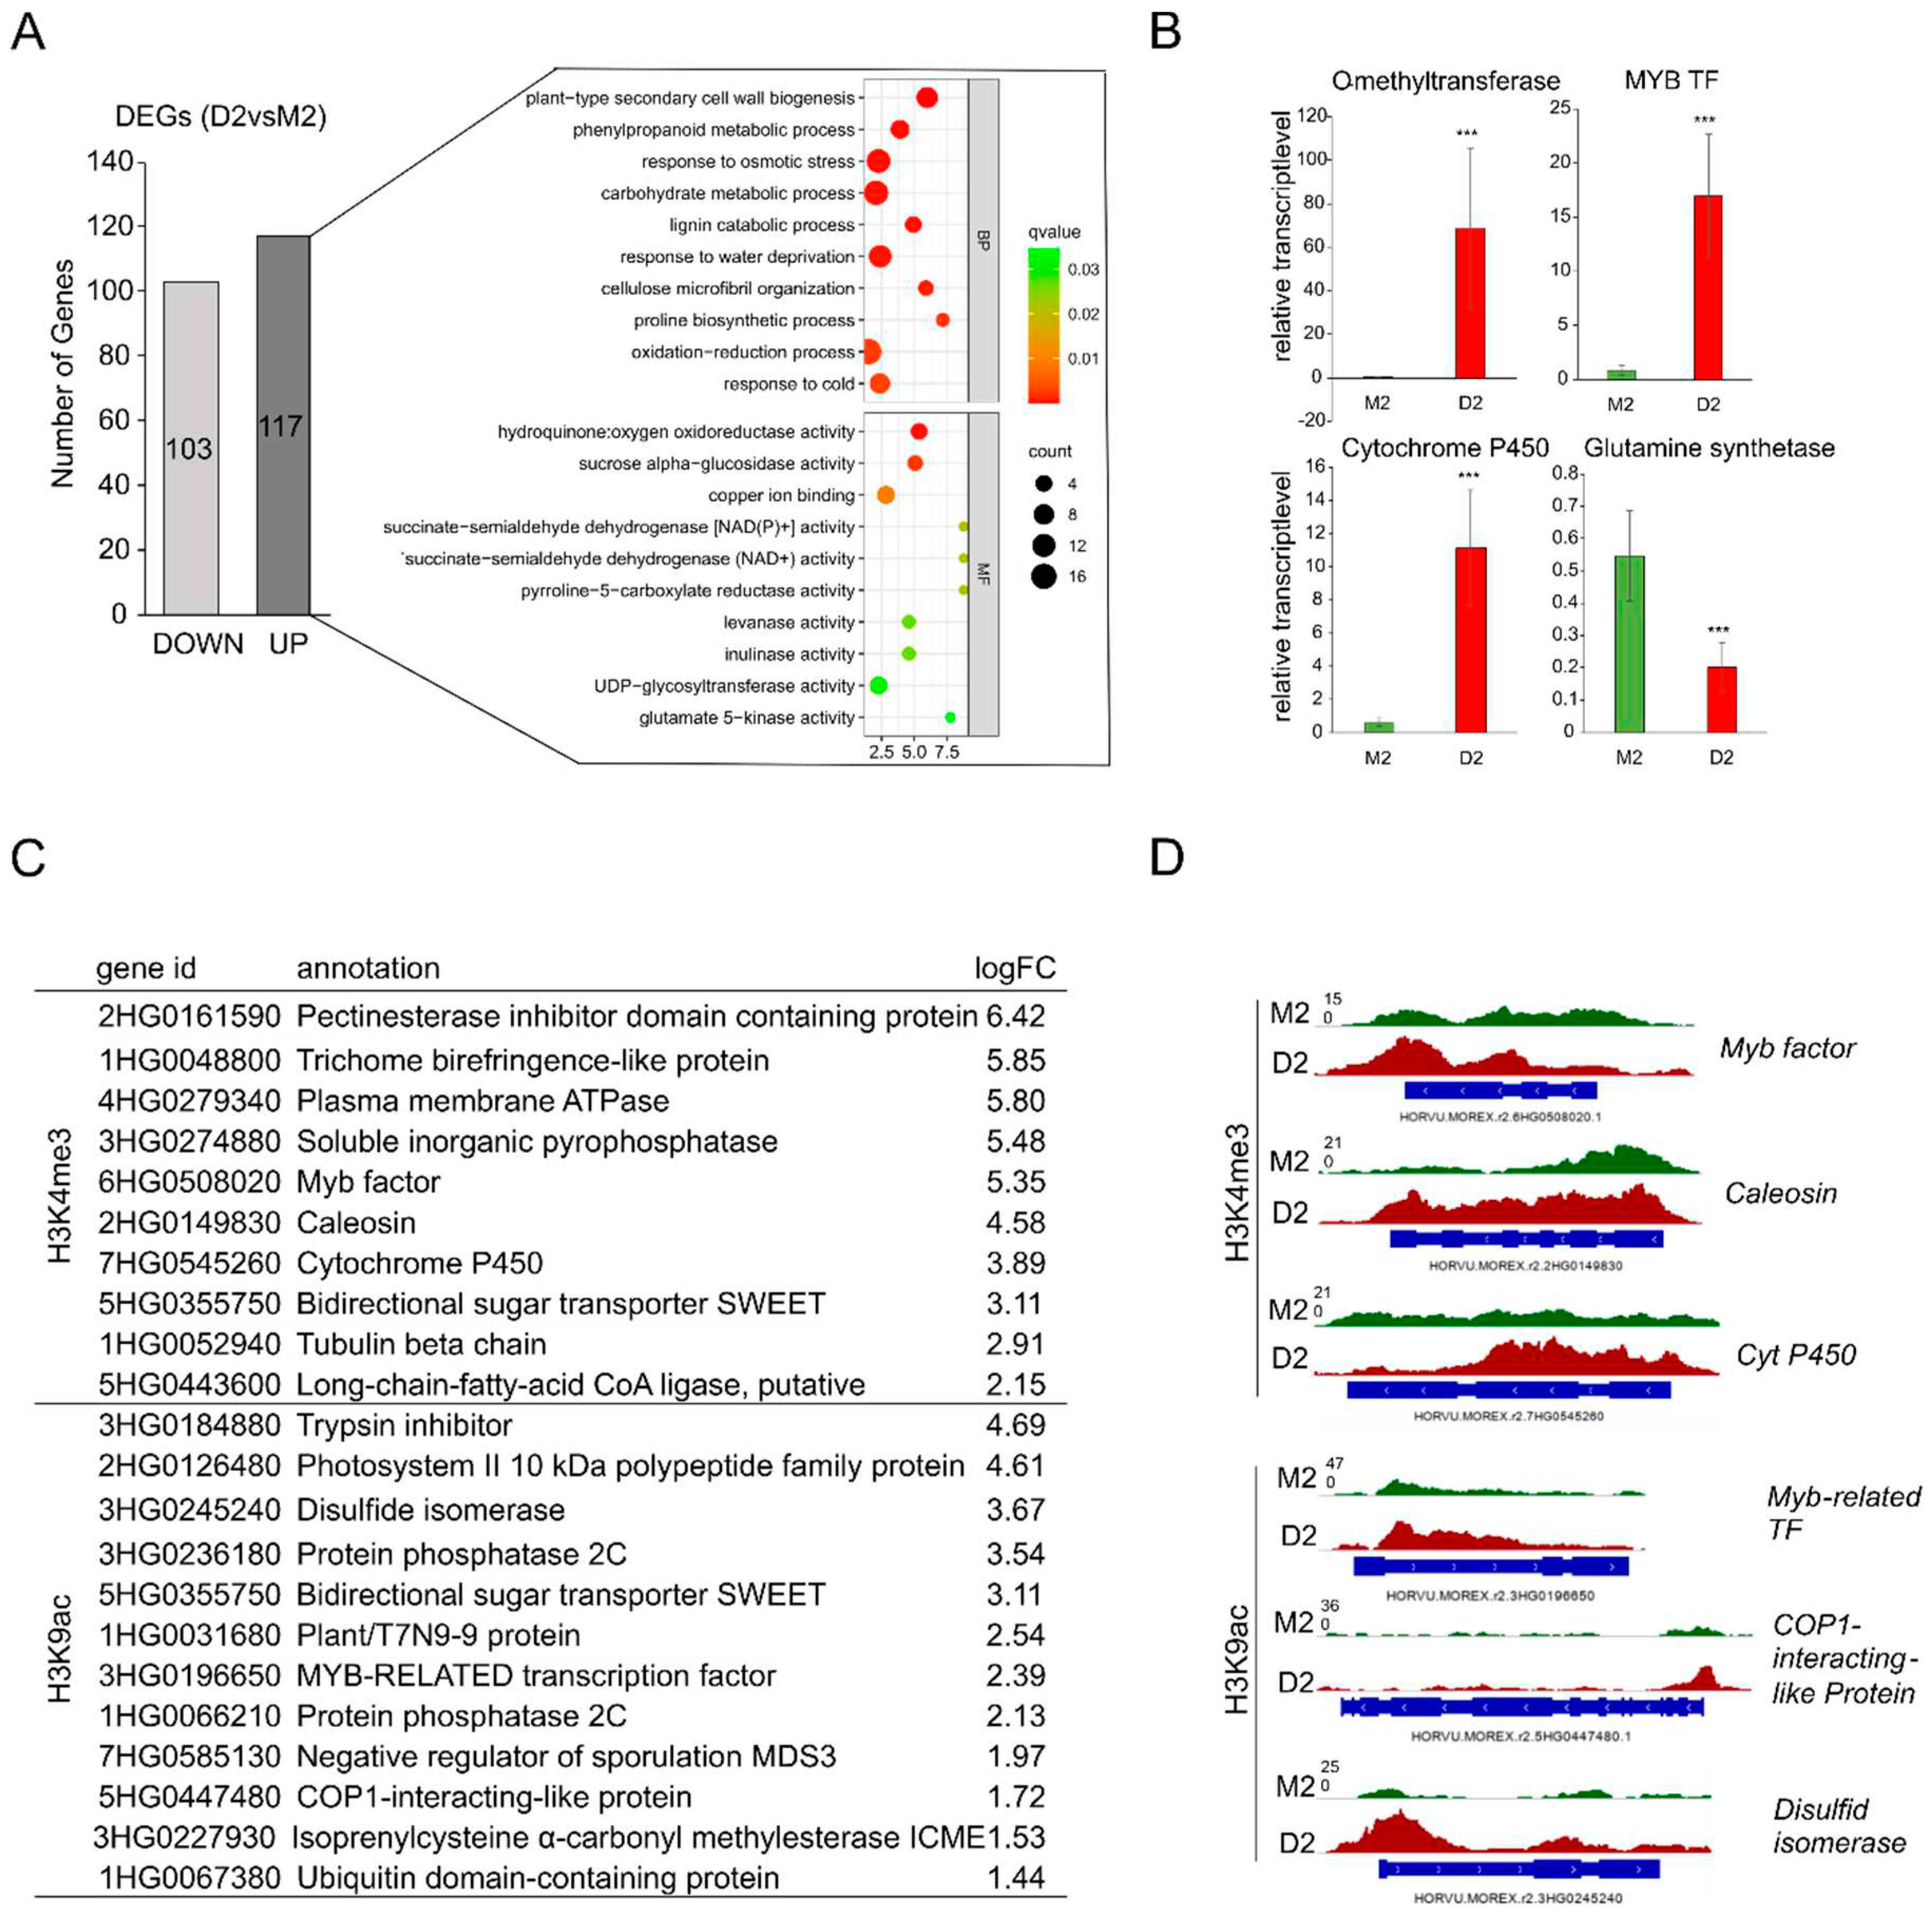
Using stringent conditions, comparison of ChIP-seq data with transcriptome data revealed that from the 117 genes, up-regulated at the early phase of mild drought stress (D2), 10 genes in parallel could be identified via ChIPseq to be loaded with H3K4me3 and 12 genes with H3K9ac (listed in Figure 5C). Many of these genes are involved in abiotic stress responses, e.g., Myb transcription factors, cytochrome P450 and the bidirectional sugar transporter SWEET. In Figure 5D exemplarily the loading of three genes with H3K4me3 and of three genes with H3K9ac is illustrated. Interestingly, two members of the PP2C family were shown to be loaded with H3K9ac and being up-regulated early during drought stress.
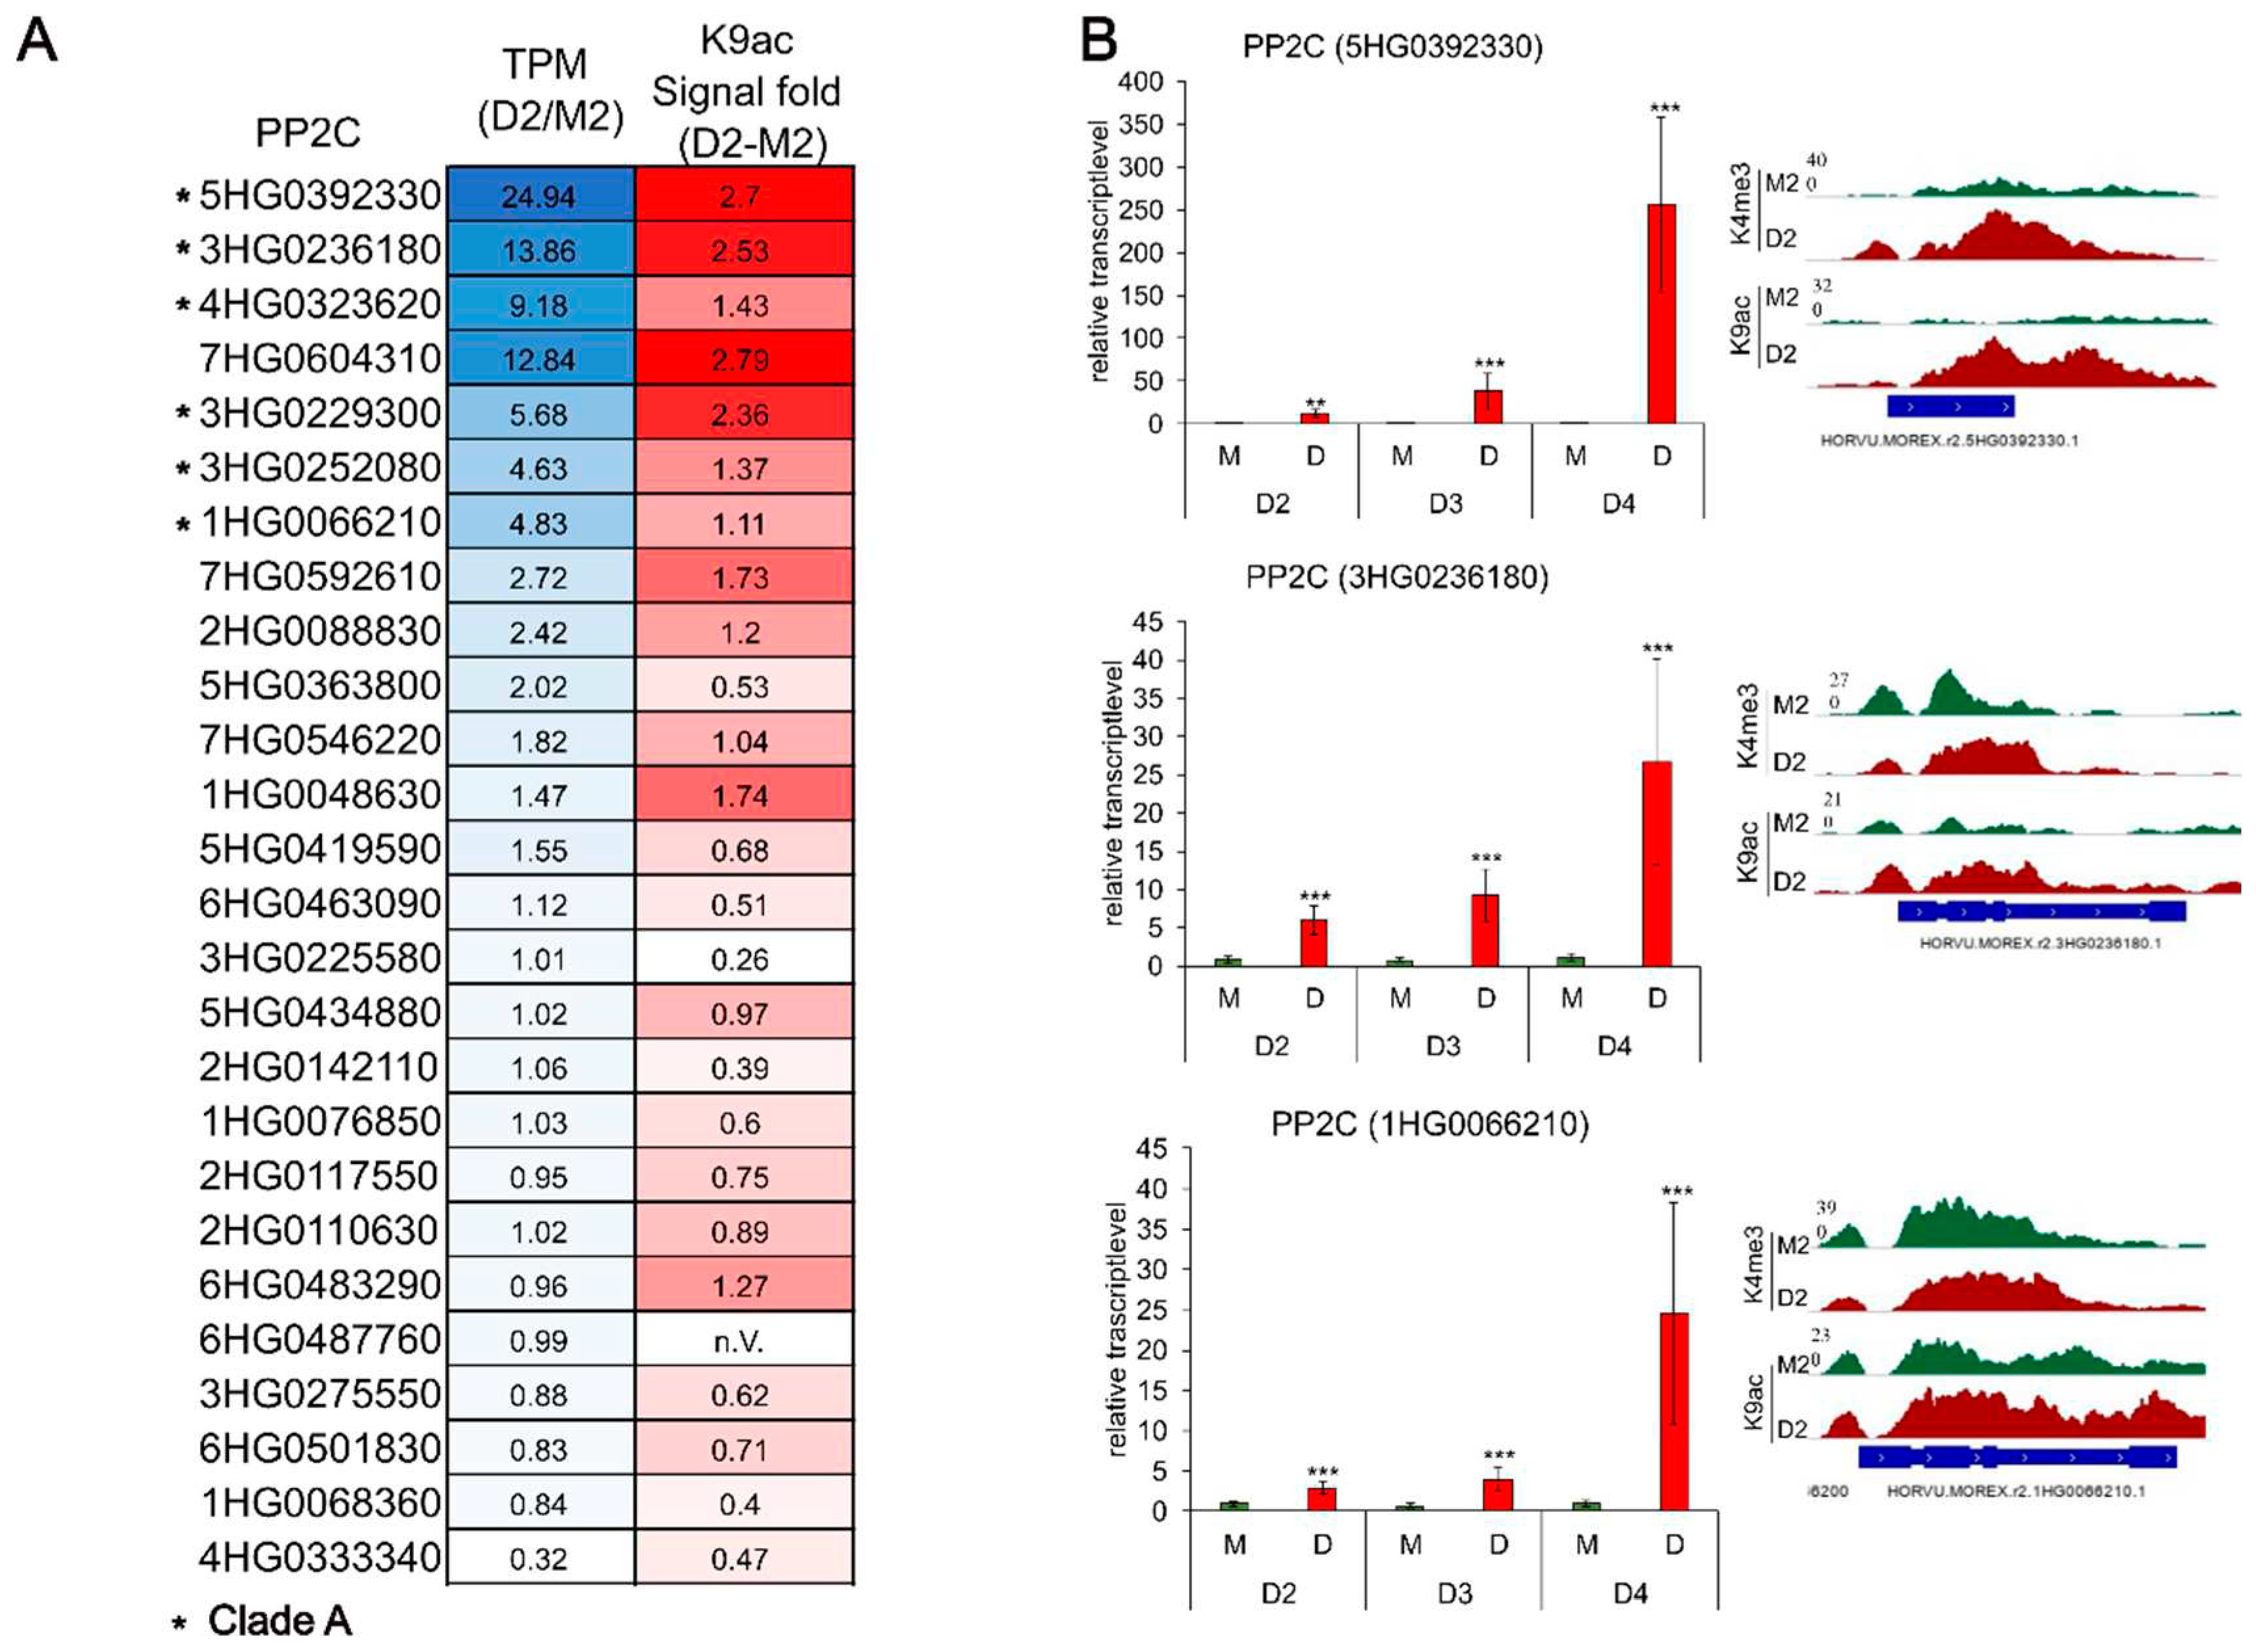
These protein phosphatases 2C (PP2Cs) which play a central role in the ABA signaling module were analyzed in more detail. They function as a negative regulatory switch at the center of the ABA signaling network tuning the ABA response and integrating it with other developmental and stress-related pathways 45. In Arabidopsis, 76 PP2Cs are identified and grouped into ten clades (A-J) and it was shown, that six of nine PP2Cs belonging to the clade A are involved in ABA signaling 46. The expression of these genes in Arabidopsis was shown to be regulated by epigenetic mechanisms altering the chromatin state 47,48. In Hordeum vulgare cv. Morex, 85 PP2Cs were recently identified 49. In this study, we could show that in total 26 Hordeum vulgare PP2Cs, including six putative and six family protein PP2Cs, are loaded with the euchromatic acetylation-mark at K9 already during early drought stress (see supplemental Tables S13 and S14). Comparing the expression levels of the PP2Cs with their corresponding K9ac signal as a heatmap showing a higher enriched signal correlates with an enhanced expression (Figure 6A). Blast analysis in combination with the recent PP2C phylogenetic studies in hulless barley 50 revealed, that six of the top seven K9ac enriched PP2Cs are belonging to the clade A. Validation via qRT-PCR of three selected PP2Cs confirmed the results and continued expression analyses for later, more severe drought stress stages D3 and D4 showed an increasing relative transcript level for all three PP2Cs.
Figure 6.
PP2Cs associated with H3K9ac in D2. (A) Heatmap of the 26 PP2Cs labelled with H3K9ac in D2. Shown are the color-coded values for the TPM (Transcript per Kilobase Million) ratio (D2/M2) in blue and the signal of H3K9ac enrichment (signal fold D2-M2) in red. Darker colors indicate higher values; asterisks mark the PP2Cs that are belonging to clade A. (B) Validation of three selected PP2Cs via qRT-PCR. Shown are the relative transcript level calculated with the ct-values from the qRT-PCR for the stages D2, D3 and D4 with the corresponding histone mark signal tracks for D2.
3. Discussion
The experimental set-up of this study allowed a slow decrease of the relative soil water content, after withholding the water at day 11, simulating a more natural drought stress. While a majority of studies focused on proceeded drought stress in barley 51–54, the focus of this research was on the epigenetic and transcriptomic responses in the early phase after onset of drought. Therefore, time points for sampling were chosen at a very early stage, when only 10- 15% of the chlorophyll and only 5- 10% of the photosynthetic performance was lost. Transcriptomic analysis via qRT-PCR showed that at this time point some marker genes of drought stress were already induced.
3.1. Early response to drought stress includes global re-orientation of histone modifications H3K9ac and H3K4me3
With the aid of the ChIP method followed by deep sequencing, drought-responsive changes in global distribution of the histone modifications H3K4me3 and H3K9ac could be detected. Both euchromatic marks, in contrast to heterochromatic mark H3K9me2, were associated with areas of active gene transcription, which in barley are located towards the telomeres of all seven chromosomes. A spatial distribution of these marks at open and transcriptionally active chromatin was reported before for different plant species 55. In general, H3K4me3 was found at twice as much genes as H3K9ac, which was also reported before for Arabidopsis thaliana during developmental leaf senescence or in Paulownia fortunei 56,57. In addition, the majority of genes marked with H3K9ac (98, 4 %) were simultaneously marked with H3Kme3. However, the loading with H3K9ac was much more flexible and in contrast to the loading with H3K4me3 sensitively responded to development and onset of stress. While comparison of the three samples (M0, M2 and D2) revealed that there is no major difference in the distribution of H3K4me3 in response to onset of drought, distribution of H3K9ac was clearly altered. This indicates that trimethylation of H3K4 is on one hand a widespread epigenetic mark in barley, but that on the other hand acetylation of H3K9, at least under the conditions we investigated, is a much more flexible histone modification, sensitively reacting to environmental cues. Kim et al.20 showed that the acetylation of K9 at the drought-inducible gene related to AP2.4 (RAP2.4) occurred strongly already after 1 hour of drought treatment whereas the trimethylation of H3 accumulated gradually. In their review, Ueda and Seki discussed that a fast response to environmental stress via acetylation and a longer term response of methylation regarding flowering or stress memory could be beneficial 58.
The genes, which specifically gained euchromatic H3K9ac-marks in early drought stress comprise, among genes involved in several metabolic processes, many stress-related genes, including genes involved in response to different stimuli as cold, light, salt and drought, with several of them being involved in ABA-related stress-responses (see Supplemental Table S8 and Figure S1). This indicates that the early response to drought in the model crop plant Hordeum vulgare involves higher-order regulation of expression of genes involved in abiotic stress responses via differential histone modifications. These findings are supported by the results of a genome-wide ChIP-sequencing in drought-stressed Brachypodium distachyon, where they could show that the level of H3K9ac is increased at drought-responsive genes 59. For barley, it could be shown, that the levels of H3K4me3 are increased at the heat shock protein 17 (HSP17) whereas H3K9me2 is reduced 60. Recently, overexpression analyses of the WHIRLY1 protein in drought-stressed barley leading to a decrease in H3K9ac and H3K4me3 levels at the ABA-related genes HvNCED1 and HvS40 revealed its possible regulatory role towards drought stress responses by interacting with epigenetic regulators 61.
3.2. Genes loaded with euchromatic H3K9ac and induced at early drought stress
ChIPseq analyses revealed that specific sets of barley genes were loaded with euchromatic mark H3K9ac at the early stages of drought stress. It was already reported before, that severe drought stress causes stronger enrichment/changes in the histone marks than mild drought stress 20,62. In order to exclude secondary effects of prolonged drought treatment, this work aimed at identifying early responses to drought and we could identify an interesting set of genes on one hand loaded with euchromatic histone modifications already at this early stage and on the other hand being already up-regulated. In order to identify those genes, we performed RNAseq with the same samples used for ChIPseq, comparing transcriptome of plants with that of control plants. As expected under these early and mild conditions, RNAseq revealed a relatively small number of DEGs. Actually, the intention of this work was to identify in barley especially those genes which quickly react to upcoming drought stress and which might have basic functions in the following establishment of resilience to drought in barley. The intersection of ChIPseq- and RNAseq data revealed that about 11% of the early up-regulated genes are loaded with H3K9ac in response to the onset of drought. Similar results have been reported for drought-stressed maize, where 25-30 % of the genes labeled with increased H3K4me3 or H3K9ac were also expressed at higher levels 25. ChIPseq and qRT-PCR analysis of PEG-6000 treated Brachypodium distachyon revealed 40 genes with increased H3K9ac level of which 23 depicts elevated transcription levels 26. Similar results could also be seen in rice 24. In senescing Arabidopsis leaves, 22 % of the genes, that are upregulated during senescence are also gaining a trimethylation of K4 and only 2% of these genes show elevated H3K9ac marks 56.
3.3. PP2Cs and other ABA-related genes are loaded with H3K9ac in response to drought
Interestingly, about half of the genes already during early stress response loaded with euchromatic marks and being up-regulated during the drought stress encode proteins involved in stress responses and ABA signaling. These are for example two Myb or Myb-related transcription factors, cytochrome P450 and the sugar transporter SWEET and they include the PPCs involved in drought stress signaling 63–65. Interestingly, two members of the PP2C family, involved in the central ABA signaling module 66, were also already significantly up-regulated and loaded with H3K9Ac. This indicates an epigenetic control level of a part of drought stress-induced reprogramming of gene expression via establishment of euchromatic marks.
The regulation of PP2C genes was investigated in more detail, analyzing also later stages of drought stress. Of the 26 annotated PP2C genes, that were found to be associated with H3K9ac in drought, seven were upregulated, two of them significantly already at early phases, indicating that several PP2Cs being central regulators in ABA signaling after onset of drought are loaded with euchromatic marks and by this up-regulated. Moreover, comparison of the TPM expression values and the signal enrichment of H3K9ac revealed a slight correlation between the expression and the acetylation of several PP2C genes. PP2Cs with higher TPM values in D2 depict also a stronger acetylation in D2, emphasizing the activating role of K9ac in gene expression 67–69. Interestingly, six of the seven top K9ac-enriched PP2Cs are belonging to the clade A. Recent phylogenetic and transcriptomic studies in Tibetan hulless barley revealed, that most of the upregulated PP2Cs during dehydration stress belong to the clade A or F 50. Similar results were seen in Maize, where a majority of the tested clade A ZmPP2Cs are induced either under drought or ABA treatment 70,71. Upregulation of the PP2C-As ABI1 and ABI2 during stress conditions (salt-, drought-, osmotic stress) and downregulation of the ABA receptors RCAR3 and RCAR10 in Arabidopsis leads to the suggestion, that higher PP2C levels desensitize the plant to high ABA levels in a negative feedback loop mechanism 72–74. Chan (2012) concluded in confirmative experiments that an increased PP2C:PYR/PYL ratio is important for the activation of the downstream ABA signaling cascade 75. Similar results could be also shown in barley 76.
RNAseq analyzes of the Protein Phosphatase 2C (5HG0392330) shows a not significant upregulation (logFC= 4.9, padj=0.07) in drought whereas qRT-PCR analysis could confirm an upregulation in D2 and an increasing relative gene expression in the ongoing drought stress (stage D3 and D4). Similar to the other PP2Cs being upregulated during stress and showing enhanced acetylation in D2, the PP2C gene shows a strong enrichment of H3K9ac but also H3K4me3 at the promotor region and the gene body in D2. BLAST analysis revealed a homology to the rice PP2C OsPP108/OsPP2C68, which is highly up-regulated under ABA, salt and drought stress and overexpression of this PP2C in rice leads to ABA insensitivity 77.
Conclusion
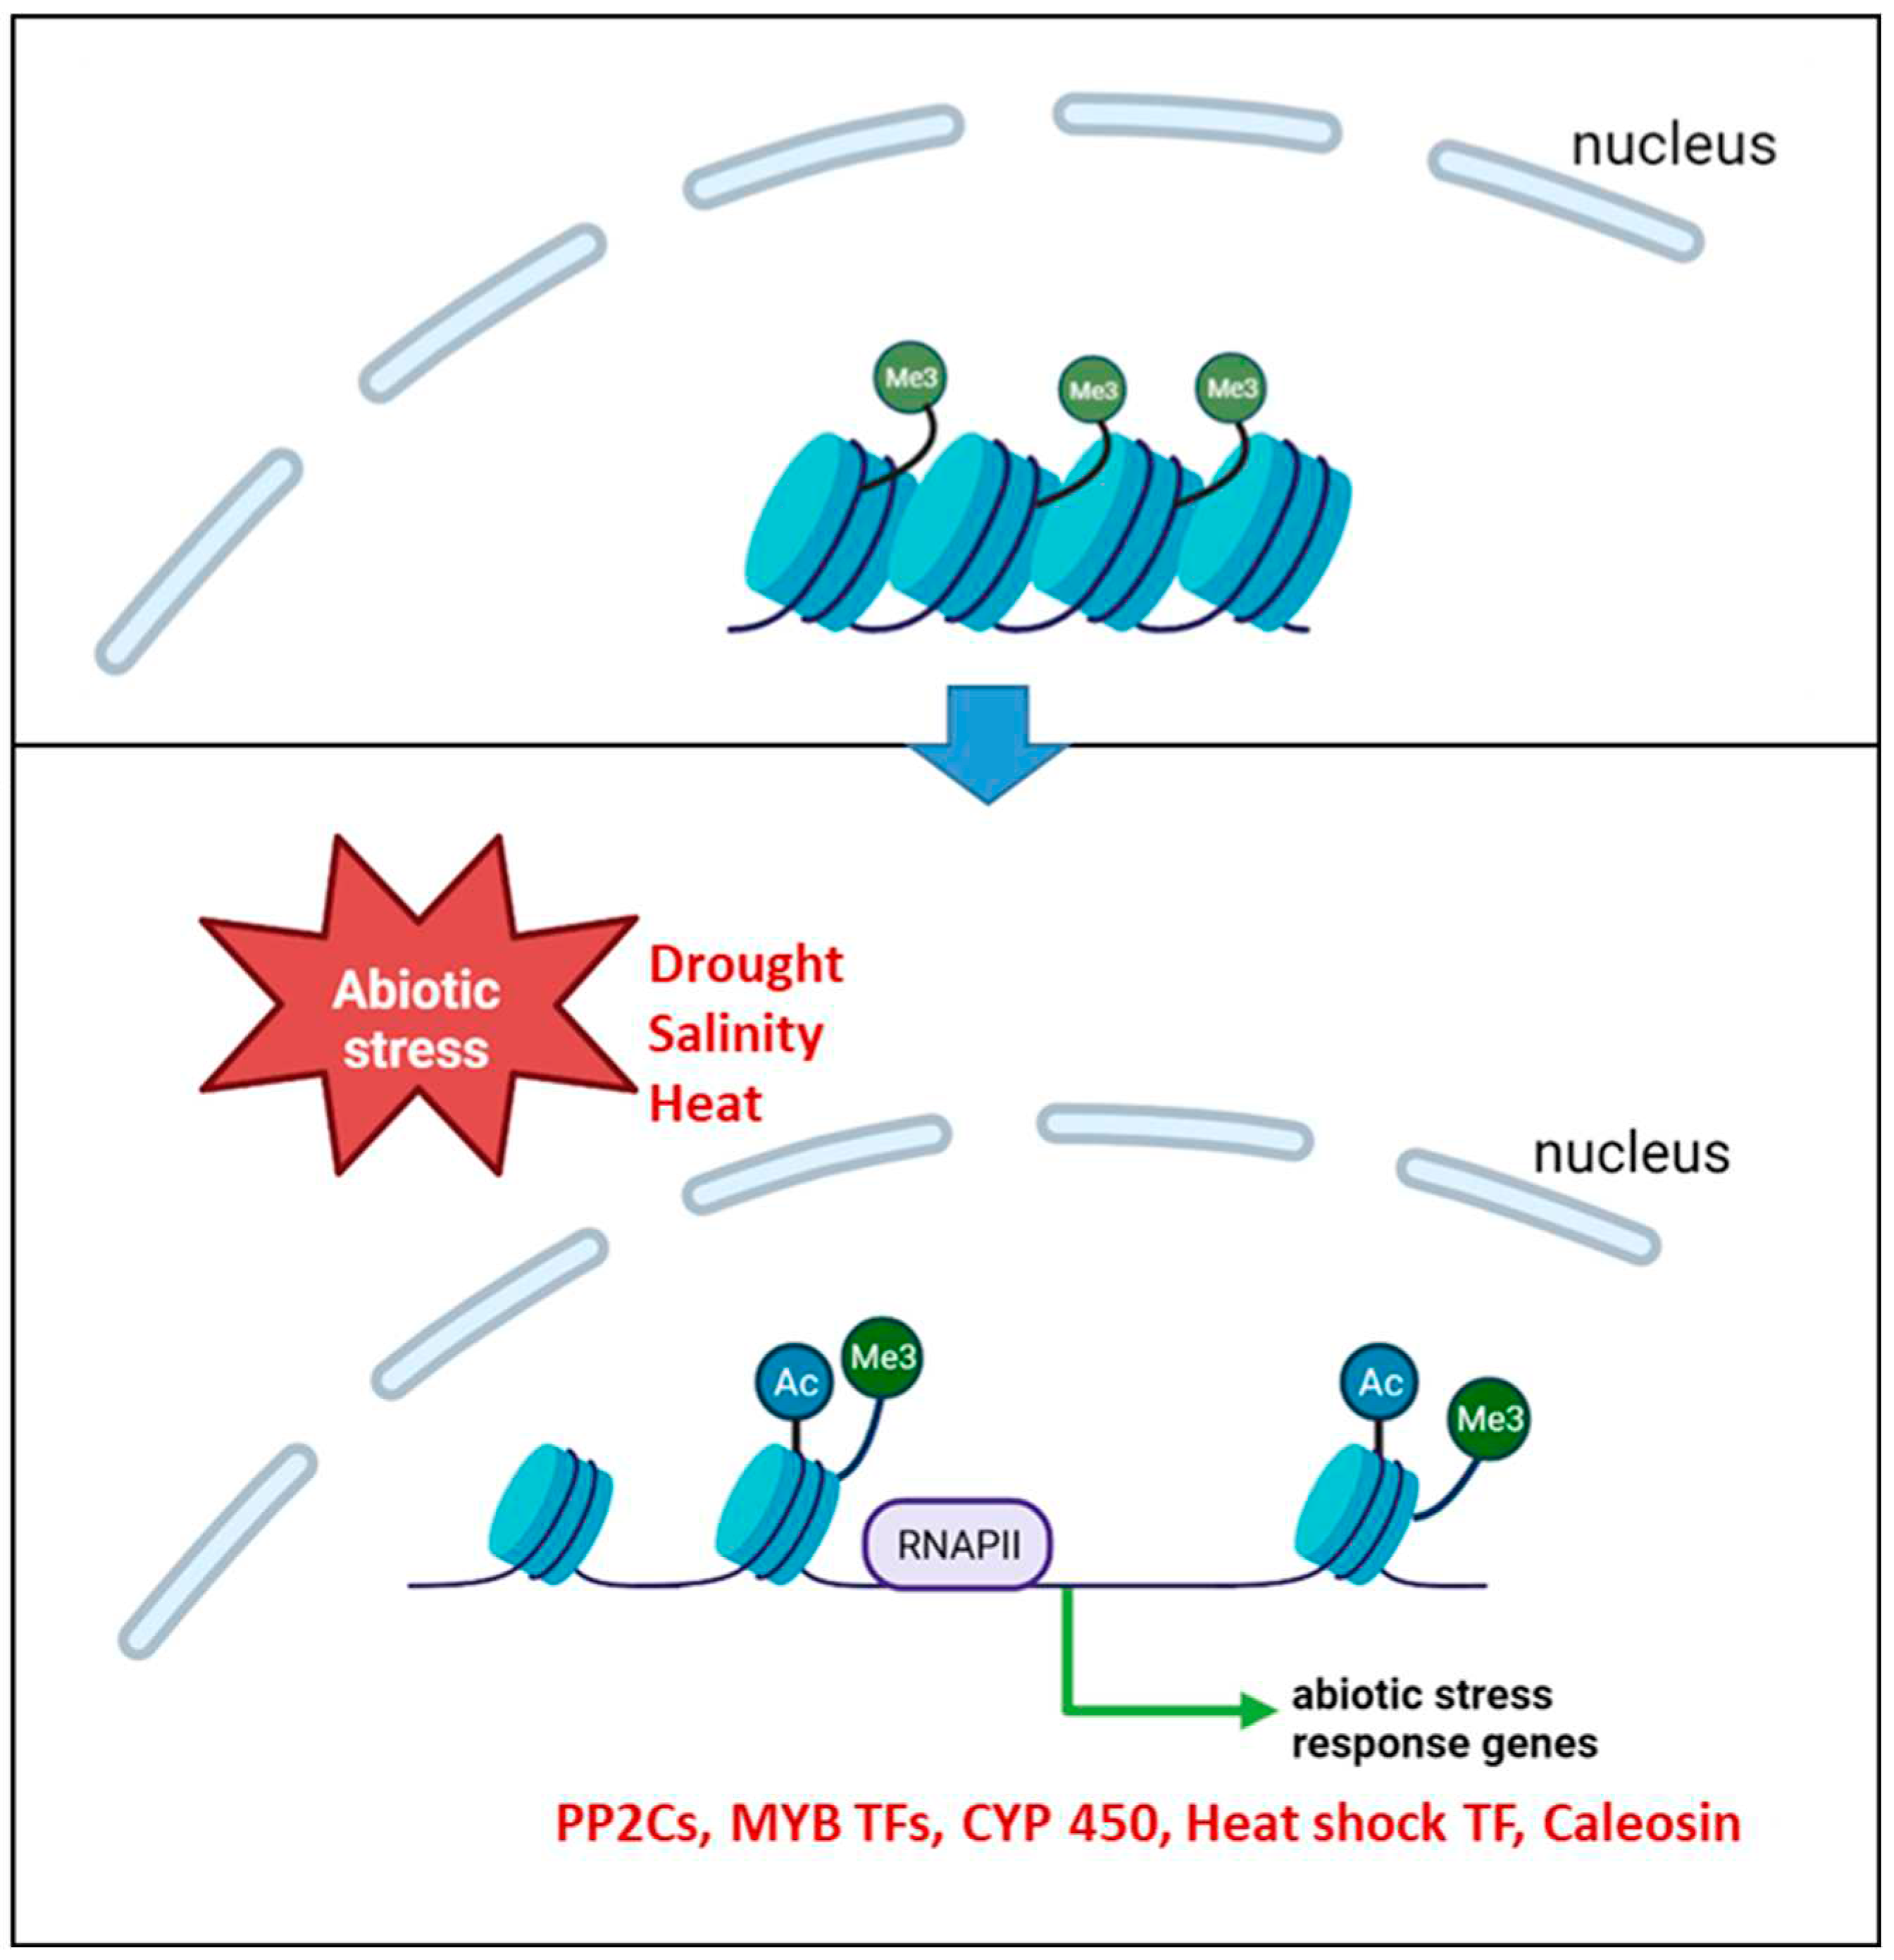
Barley has developed complex mechanisms to adapt to drought stress. One of these mechanisms involves histone modifications, particularly H3K9 acetylation, that lead to the up-regulation of specific genes. We show that in the early phase of drought stress, when chloroplasts remain active, a specific set of genes is loaded with H3K9ac and up-regulated. Among these genes are ABA-related genes, e.g., genes encoding PP2Cs involved in the central regulatory unit of ABA-action. Our results indicate that in response to drought the H3K9ac mark works in a more flexible manner in comparison to the trimethylation of K4, suggesting a potential role of H3K9 acetylation in the short stress memory of plants, as discussed by 19,22,78,79. Furthermore, our results support the findings of Brusslan et al.56, which propose that H3K9ac can act as a template for the trimethylation of K4.
Figure 7.
Working model of the changes in histone modifications and chromatin structure during abiotic stress (created with BioRender.com).
Figure 7.
Working model of the changes in histone modifications and chromatin structure during abiotic stress (created with BioRender.com).
4. Material and Methods
4.1. Plant material and growth under drought stress conditions
Barley (Hordeum vulgare cv. Morex) seeds were incubated for 72 hours at 4°C in darkness followed by 24 hours at room temperature on wet tissue paper. Germinated seedlings were sown as described in Temel et al. 60 with minor changes. On the twelfth day after sowing (das), the water for half of the pots was withhold to induce drought stress whereas the other half (control group) was watered. Every two days the pots were weighed to calculate the soil water content and physiological parameters were measured. For RNA expression analysis and RNA- sequencing, primary leaves were harvested, frozen in liquid nitrogen and stored at -80°C. For the chromatin immunoprecipitation (ChIP), 1 g of primary leaves were harvested and fixed with formaldehyde before frozen in liquid nitrogen and stored at -80°C.
4.2. Physiological measurements
The relative chlorophyll content and the PSII efficiency were measured every second day between 7 and 47 das. The relative chlorophyll content was measured with the aid of the SPAD (Soil Plant Analysis Development) tool from Minolta (Konica Minolta Sensing Europe B.V., Munich, Germany). The relative chlorophyll content of 20 primary leaves was measured at the top, middle and bottom of the leave and the mean value was calculated. Each data point represents the mean of at least five biological replicates. The chlorophyll fluorescence is the difference between the maximum (Fm) and minimum (F0) fluorescence and is called variable fluorescence (Fv). The PSII-efficiency is calculated from following formula: (Fm-Fo)/Fm= Fv/Fm. Leaves were dark adapted for 10 minutes and PSII efficiency was measured with the MINI-PAM fluorometer (Walz GmbH, Effeltrich, Germany).
4.3. Gene expression analysis by quantitative real-time PCR (qRT-PCR)
Total RNA from at least four independent biological replicates was isolated with Trizol as described in Chomczynski and Mackey80. In general, all DNA and RNA concentrations were measured with the Nanospectrophotometer (Implen, Munich, Germany). Samples for sequencing were additionally measured on a Bioanalyzer2100 system (Agilent Technologies, Santa Clara, CA, USA) using the RNA 6000 pico- and the HS DNA kit (Agilent Technologies, Santa Clara, CA, USA) and with a Qubit 4 Fluorometer (Thermo Fischer Scientific, Waltham, MA, USA). With the RevertAidTM H Minus First Strand cDNA Synthesis Kit (Thermo Fisher Scientific, Waltham, MA, USA), 1 µg of total RNA were transcribed into cDNA following the manufacturer’s instructions. For qRT-PCR, 2 µl of cDNA-template were mixed with the KAPA SYBR fast qPCR Mastermix (KAPABIOSYSTEMS, Roche) and the gene-specific primers (supplemental Table S15). To exclude the amplification of unspecific products a no RT (reverse transcriptase) control was additionally run. Quantitative RT-PCR was performed with the CFX Connect Real-Time PCR Detection System from Bio Rad (Bio-Rad Laboratories Inc., Göttingen, Germany). For the determination of the relative gene expression, the REST-384 © 2006 software v2 81 was used with genes HvActin, HvPP2A and HvGCN2 as reference genes for normalization.
4.4. Chromatin immunoprecipitation (ChIP) followed by sequencing
The ChIP was performed as described in Ay et al. 82 with some minor modifications. Samples from three different stages were taken: M0, M2 as control samples, and the corresponding drought stress sample D2. The isolated chromatin was sheared (average fragment size: 300 bp) using the Covaris M220 Focused Ultrasonicator (Covaris LLC, USA). Two antibodies against euchromatic H3K4me3 (ab8580) and H3K9ac (ab10812) and one antibody against heterochromatic H3K9me2 (ab1220), all obtained from Abcam (Cambridge, UK), were used for the overnight immunoprecipitation step at 4 °C. In total, ChIP-DNA from three independent replicates was isolated and used for library preparation and sequencing. The libraries were prepared with the Illumina TruSeq ChIP Library Preparation Kit and sequenced (paired-end, 2 x 101 cycles) on the Illumina HiSeq2500 device (Illumina Inc., San Diego, CA, USA) .The analysis of the sequenced data was accomplished with a specific workflow. In brief, after quality control with FASTQC83, the trimmed reads were aligned to the second version of the reference genome sequence assembly of barley cv. Morex 40,41 with BWA-MEM 84,85 with default parameters. The software MACS2 86 was used to quantify regions that are enriched in reads (peaks). The peak detection was carried out with all three IP samples from every biological replicate and their corresponding input samples in a pooled peak calling. Resulting peaks with a fold enrichment ≥ 10 were intersected with the annotated gene list of Morex V2. Signal tracks of the histone modifications enrichment levels over the whole genome were built with the bdgcmp command from MACS2, converted into bigWig files on the Galaxy platform 87 with the UCSC BedGraph-to-bigWig converter 88, and could then be visualized in the Integrative Genome Browser (IGV) 89 together with the called peaks. To plot the peak distribution over the signal track profiles of the genes in combination with their expression level, the software deeptools 90 was used. To compare the list of genes within each other, a webtool creating venn diagrams were used (https://bioinformatics.psb.ugent.be/webtools/Venn/). For calculating the differences in the signal tracks between M2 and D2, deeptools Bigwigsummary and the Diffbind package 91 were used.
To validate the detected peaks, quantitative real-time PCR of the ChIPed-DNA was performed with five different gene-specific primer sets (supplemental Table S15). To normalize the ChIP-qPCR data, the Percent Input method was used, in which the enrichment of the IP samples is determined as the % of the Input 92.
4.5. RNA-Seq Analysis
Total RNA from four independent replicates were isolated with homemade Trizol reagent (0.8 M guanidine thiocyanate, 0.4 M ammonium thiocyanate, 0.1 M sodium acetate, 5 % glycerol, 38 % phenol (pH=5)) followed by a purification step with the RNeasy® Plant Mini Kit (Qiagen, Hilden, Germany). Library preparation was done with the Illumina TruSeq RNA Library Preparation Kit according to manufacturer’s instructions. The samples were sequenced (paired-end, 2x 101 cycles) with the Illumina HiSeq2500 instrument (Illumina Inc., San Diego, CA, USA). Like the ChIPseq-data, the analysis of the RNAseq data was accomplished with a workflow. In brief, as a first step after read quality control, the transcript abundance was quantified by pseudo alignment of the processed reads with the software kallisto (v0.45.0) 93. The kallisto commands were executed with the default parameters, except for bootstrap-samples, which was set to 40. The resulting abundance data from the kallisto pseudo alignment were imported into R (R core team, 2018, version 3.5.1) for statistical analysis. The following steps were executed with the R packages edgeR 94 and limma 95. The genes that are differentially expressed between control and drought stress samples were identified. Genes were defined to be up regulated or down regulated if the log2 fold change (logFC) was greater than 1 or less than -1, respectively. The adjusted p-value cut-off were set to ˂0.05. The RNAseq results were validated with qRT-PCR with four selected primer (supplemental Table S15) as described in chapter 4.3.
4.6. GO-term Enrichment analysis
The GO term enrichment analysis were executed with the TRAPID software 44 and the maximum q-value were set to 0.05. The enrichment bubble plots were plotted by http://www.bioinformatics.com.cn/srplot, an online platform for data analysis and visualization.
Author Contributions
Conceptualization, K.H., N.S., M.M. and C.O..; methodology, C.O., K.H., M.M., A.H, T.L.N., validation, C.O. and K.H.; formal analysis, C.O., H.C.; investigation, C.O., H.C.; resources, K.H., N.S., M.M.; writing—original draft preparation, C.O and K.H.; writing—review and editing, K.H., N.S., M.M., A.H., H.C., C.O. T.L.N.; visualization, C.O.; supervision, K.H., N.S. and M.M.; project administration, K.H.; funding acquisition, K.H. All authors have read and agreed to the published version of the manuscript.
Funding
This research was funded by the ScienceCampus Halle – Plant-based Bioeconomy, by the Research Focus Program ‘Molecular biosciences as a motor for a knowledge-based economy’ from the European Regional Development Fund and the Deutsche Forschungsgemeinschaft (DFG, German Research Foundation)—400681449/GRK2498.
Data Availability Statement
The data presented in this study are available in the supplemental material.
Acknowledgments
We would like to thank Ines Walde, Siska Herklotz and Nancy Zimmermann for their excellent technical support. We would also like to thank the support by “WissenschaftsCampus Halle WCH”.
Conflicts of Interest
The authors declare no conflict of interest.
References
- Ferchichi, S.; Hessini, K.; Dell’Aversana, E.; D’Amelia, L.; Woodrow, P.; Ciarmiello, L. F.; Fuggi, A.; Carillo, P. Hordeum Vulgare and Hordeum Maritimum Respond to Extended Salinity Stress Displaying Different Temporal Accumulation Pattern of Metabolites. Funct. Plant Biol. 2018, 45, 1096–1109. [Google Scholar] [CrossRef] [PubMed]
- Turner, N. C. Turgor Maintenance by Osmotic Adjustment : 40 Years of Progress. J. Exp. Bot. 2018, 69, 3223–3233. [Google Scholar] [CrossRef] [PubMed]
- Uga, Y.; Sugimoto, K.; Ogawa, S.; Rane, J.; Ishitani, M.; Hara, N.; Kitomi, Y.; Inukai, Y.; Ono, K.; Kanno, N.; Inoue, H.; Takehisa, H.; Motoyama, R.; Nagamura, Y.; Wu, J.; Matsumoto, T.; Takai, T.; Okuno, K.; Yano, M. Control of Root System Architecture by DEEPER ROOTING 1 Increases Rice Yield under Drought Conditions. Nat. Genet. 2013, 45, 1097–1102. [Google Scholar] [CrossRef]
- Wasson, A. P.; Richards, R. A.; Chatrath, R.; Misra, S. C.; Prasad, S. V. S.; Rebetzke, G. J.; Kirkegaard, J. A. Traits and Selection Strategies to Improve Root Systems and Water Uptake in Water-Limited Wheat Crops. J. Exp. Bot. 2012, 63, 3485–3498. [Google Scholar] [CrossRef]
- Lynch, J. P.; Chimungu, J. G.; Brown, K. M. Root Anatomical Phenes Associated with Water Acquisition from Drying Soil : Targets for Crop Improvement. J. Exp. Bot. 2014, 65, 6155–6166. [Google Scholar] [CrossRef] [PubMed]
- Kim, T. H.; Böhmer, M.; Hu, H.; Nishimura, N.; Schroeder, J. I. Guard Cell Signal Transduction Network: Advances in Understanding Abscisic Acid, CO2, and Ca2+ Signaling. Annu. Rev. Plant Biol. 2010, 61, 561–591. [Google Scholar] [CrossRef]
- Dar, N. A.; Amin, I.; Wani, W.; Wani, S. A.; Shikari, A. B.; Wani, S. H.; Masoodi, K. Z. Abscisic Acid: A Key Regulator of Abiotic Stress Tolerance in Plants. Plant Gene 2017, 11, 106–111. [Google Scholar] [CrossRef]
- Ma, Y.; Szostkiewicz, I.; Korte, A.; Moes, D.; Yang, Y.; Christmann, A.; Grill, E. Regulators of PP2C Phosphatase Activity Function as Abscisic Acid Sensors. Science 2009, 324, 1064–1068. [Google Scholar] [CrossRef]
- Park, S. Y.; Fung, P.; Nishimura, N.; Jensen, D. R.; Fujii, H.; Zhao, Y.; Lumba, S.; Santiago, J.; Rodrigues, A.; Chow, T. F. F.; Alfred, S. E.; Bonetta, D.; Finkelstein, R.; Provart, N. J.; Desveaux, D.; Rodriguez, P. L.; McCourt, P.; Zhu, J.-K. K.; Schroeder, J. I.; Volkman, B. F.; Cutler, S. R.; Volkmann, B. F.; Cutler, S. R. Abscisic Acid Inhibits Type 2C Protein Phosphatases via the PYR/PYL Family of START Proteins. Science 2009, 324, 1068–1069. [Google Scholar] [CrossRef]
- Cutler, S. R.; Rodriguez, P. L.; Finkelstein, R. R.; Abrams, S. R. Abscisic Acid: Emergence of a Core Signaling Network. Annu. Rev. Plant Biol. 2010, 61, 651–679. [Google Scholar] [CrossRef]
- Raghavendra, A. S.; Gonugunta, V. K.; Christmann, A.; Grill, E. ABA Perception and Signalling. Trends Plant Sci. 2010, 15, 395–401. [Google Scholar] [CrossRef] [PubMed]
- Lim, C.; Baek, W.; Jung, J.; Kim, J.; Lee, S. Function of ABA in Stomatal Defense against Biotic and Drought Stresses. Int. J. Mol. Sci. 2015, 16, 15251–15270. [Google Scholar] [CrossRef] [PubMed]
- Lee, S. C.; Lan, W.; Buchanan, B. B.; Luan, S. A Protein Kinase-Phosphatase Pair Interacts with an Ion Channel to Regulate ABA Signaling in Plant Guard Cells. Proc. Natl. Acad. Sci. U. S. A. 2009, 106, 21419–21424. [Google Scholar] [CrossRef] [PubMed]
- Geiger, D.; Scherzer, S.; Mumm, P.; Stange, A.; Marten, I.; Bauer, H.; Ache, P.; Matschi, S.; Liese, A.; Al-Rasheid, K. A. S.; Romeis, T.; Hedrich, R. Activity of Guard Cell Anion Channel SLAC1 Is Controlled by Drought-Stress Signaling Kinase-Phosphatase Pair. Proc. Natl. Acad. Sci. U. S. A. 2009, 106, 21425–21430. [Google Scholar] [CrossRef] [PubMed]
- Mustilli, A. C.; Merlot, S.; Vavasseur, A.; Fenzi, F.; Giraudat, J. Arabidopsis OST1 Protein Kinase Mediates the Regulation of Stomatal Aperture by Abscisic Acid and Acts Upstream of Reactive Oxygen Species Production. Plant Cell 2002, 14, 3089–3099. [Google Scholar] [CrossRef]
- Hsu, P. K.; Dubeaux, G.; Takahashi, Y.; Schroeder, J. I. Signaling Mechanisms in Abscisic Acid-Mediated Stomatal Closure. Plant J. 2021, 105, 307–321. [Google Scholar] [CrossRef]
- Kim, J. H. Multifaceted Chromatin Structure and Transcription Changes in Plant Stress Response. Int. J. Mol. Sci. 2021, 22, 1–25. [Google Scholar] [CrossRef]
- Kim, J.-M.; Sasaki, T.; Ueda, M.; Sako, K.; Seki, M. Chromatin Changes in Response to Drought, Salinity, Heat, and Cold Stresses in Plants. Front. Plant Sci. 2015, 6. [Google Scholar] [CrossRef]
- Kim, J. M.; To, T. K.; Ishida, J.; Matsui, A.; Kimura, H.; Seki, M. Transition of Chromatin Status during the Process of Recovery from Drought Stress in Arabidopsis Thaliana. Plant Cell Physiol. 2012, 53, 847–856. [Google Scholar] [CrossRef]
- Kim, J. M.; To, T. K.; Ishida, J.; Morosawa, T.; Kawashima, M.; Matsui, A.; Toyoda, T.; Kimura, H.; Shinozaki, K.; Seki, M. Alterations of Lysine Modifications on the Histone H3 N-Tail under Drought Stress Conditions in Arabidopsis Thaliana. Plant Cell Physiol. 2008, 49, 1580–1588. [Google Scholar] [CrossRef]
- Luo, M.; Liu, X.; Singh, P.; Cui, Y.; Zimmerli, L.; Wu, K. Chromatin Modifications and Remodeling in Plant Abiotic Stress Responses. Biochim. Biophys. Acta - Gene Regul. Mech. 2012, 1819, 129–136. [Google Scholar] [CrossRef] [PubMed]
- Asensi-Fabado, M.-A.; Amtmann, A.; Perrella, G. Plant Responses to Abiotic Stress: The Chromatin Context of Transcriptional Regulation. Biochim. Biophys. Acta - Gene Regul. Mech. 2017, 1860, 106–122. [Google Scholar] [CrossRef] [PubMed]
- van Dijk, K.; Ding, Y.; Malkaram, S.; Riethoven, J.-J. M.; Liu, R.; Yang, J.; Laczko, P.; Chen, H.; Xia, Y.; Ladunga, I.; Avramova, Z.; Fromm, M. Dynamic Changes in Genome-Wide Histone H3 Lysine 4 Methylation Patterns in Response to Dehydration Stress in Arabidopsis Thaliana. BMC Plant Biol. 2010, 10, 238. [Google Scholar] [CrossRef] [PubMed]
- Zong, W.; Zhong, X.; You, J.; Xiong, L. Genome-Wide Profiling of Histone H3K4-Tri-Methylation and Gene Expression in Rice under Drought Stress. Plant Mol. Biol. 2013, 81, 175–188. [Google Scholar] [CrossRef] [PubMed]
- Forestan, C.; Farinati, S.; Zambelli, F.; Pavesi, G.; Rossi, V.; Varotto, S. Epigenetic Signatures of Stress Adaptation and Flowering Regulation in Response to Extended Drought and Recovery in Zea Mays. Plant Cell Environ. 2020, 43, 55–75. [Google Scholar] [CrossRef] [PubMed]
- Song, J.; Henry, H.; Tian, L. Drought-inducible Changes in the Histone Modification H3K9ac Are Associated with Drought-responsive Gene Expression in Brachypodium Distachyon. Plant Biol. 2020, 22, 433–440. [Google Scholar] [CrossRef] [PubMed]
- Fang, H.; Liu, X.; Thorn, G.; Duan, J.; Tian, L. Expression Analysis of Histone Acetyltransferases in Rice under Drought Stress. Biochem. Biophys. Res. Commun. 2014, 443, 400–405. [Google Scholar] [CrossRef]
- Ding, Y.; Avramova, Z.; Fromm, M. The Arabidopsis Trithorax-like Factor ATX1 Functions in Dehydration Stress Responses via ABA-Dependent and ABA-Independent Pathways. Plant J. 2011, 66, 735–744. [Google Scholar] [CrossRef]
- Ding, Y.; Avramova, Z.; Fromma, M. Two Distinct Roles of Arabidopsis Homolog of Trithorax1 (ATX1) at Promoters and within Transcribed Regions of ATX1-Regulated Genes. Plant Cell 2011, 23, 350–363. [Google Scholar] [CrossRef]
- Shinozaki, K.; Yamaguchi-Shinozaki, K. Gene Networks Involved in Drought Stress Response and Tolerance. J. Exp. Bot. 2007, 58, 221–227. [Google Scholar] [CrossRef]
- Kleber-Janke, T.; Krupinska, K. Isolation of CDNA Clones for Genes Showing Enhanced Expression in Harley Leaves during Dark-Induced Senescence as Well as during Senescence under Field Conditions. Planta 1997, 203, 332–340. [Google Scholar] [CrossRef] [PubMed]
- Krupinska, K.; Haussühl, K.; Schäfer, A.; Van der Kooij, T. A. W.; Leckband, G.; Lörz, H.; Falk, J. A Novel Nucleus-Targeted Protein Is Expressed in Barley Leaves during Senescence and Pathogen Infection. Plant Physiol. 2002, 130, 1172–1180. [Google Scholar] [CrossRef]
- Krupinska, K.; Dähnhardt, D.; Fischer-Kilbienski, I.; Kucharewicz, W.; Scharrenberg, C.; Trösch, M.; Buck, F. Identification of WHIRLY1 as a Factor Binding to the Promoter of the Stress- and Senescence-Associated Gene HvS40. J. Plant Growth Regul. 2014, 33, 91–105. [Google Scholar] [CrossRef]
- Hong, B.; Uknes, S. J.; Ho, T. hua D. Cloning and Characterization of a CDNA Encoding a MRNA Rapidly-Induced by ABA in Barley Aleurone Layers. Plant Mol. Biol. 1988, 11, 495–506. [Google Scholar] [CrossRef] [PubMed]
- Straub, P. F.; Shen, Q.; Ho, T. hua D. Structure and Promoter Analysis of an ABA- and Stress-Regulated Barley Gene, HVA1. Plant Mol. Biol. 1994, 26, 617–630. [Google Scholar] [CrossRef]
- Hu, C. A.; Delauney, A. J.; Verma, D. P. A Bifunctional Enzyme (Delta 1-Pyrroline-5-Carboxylate Synthetase) Catalyzes the First Two Steps in Proline Biosynthesis in Plants. Proc. Natl. Acad. Sci. 1992, 89, 9354–9358. [Google Scholar] [CrossRef]
- Strizhov, N.; Ábrahám, E.; Ökrész, L.; Blickling, S.; Zilberstein, A.; Schell, J.; Koncz, C.; Szabados, L. Differential Expression of Two P5CS Genes Controlling Proline Accumulation during Salt-Stress Requires ABA and Is Regulated by ABA1, ABI1 and AXR2 in Arabidopsis. Plant J. 1997, 12, 557–569. [Google Scholar] [CrossRef]
- Verbruggen, N.; Hermans, C. Proline Accumulation in Plants: A Review. Amino Acids 2008, 35, 753–759. [Google Scholar] [CrossRef]
- Guo, P.; Baum, M.; Grando, S.; Ceccarelli, S.; Bai, G.; Li, R.; Von Korff, M.; Varshney, R. K.; Graner, A.; Valkoun, J. Differentially Expressed Genes between Drought-Tolerant and Drought-Sensitive Barley Genotypes in Response to Drought Stress during the Reproductive Stage. J. Exp. Bot. 2009, 60, 3531–3544. [Google Scholar] [CrossRef]
- Mascher, M.; Gundlach, H.; Himmelbach, A.; Beier, S.; Twardziok, S. O.; Wicker, T.; Radchuk, V.; Dockter, C.; Hedley, P. E.; Russell, J.; Bayer, M.; Ramsay, L.; Liu, H.; Haberer, G.; Zhang, X. Q.; Zhang, Q.; Barrero, R. A.; Li, L.; Taudien, S.; Groth, M.; Felder, M.; Hastie, A.; Šimková, H.; Stanková, H.; Vrána, J.; Chan, S.; Munõz-Amatriaín, M.; Ounit, R.; Wanamaker, S.; Bolser, D.; Colmsee, C.; Schmutzer, T.; Aliyeva-Schnorr, L.; Grasso, S.; Tanskanen, J.; Chailyan, A.; Sampath, D.; Heavens, D.; Clissold, L.; Cao, S.; Chapman, B.; Dai, F.; Han, Y.; Li, H.; Li, X.; Lin, C.; McCooke, J. K.; Tan, C.; Wang, P.; Wang, S.; Yin, S.; Zhou, G.; Poland, J. A.; Bellgard, M. I.; Borisjuk, L.; Houben, A.; Doleael, J.; Ayling, S.; Lonardi, S.; Kersey, P.; Langridge, P.; Muehlbauer, G. J.; Clark, M. D.; Caccamo, M.; Schulman, A. H.; Mayer, K. F. X.; Platzer, M.; Close, T. J.; Scholz, U.; Hansson, M.; Zhang, G.; Braumann, I.; Spannagl, M.; Li, C.; Waugh, R.; Stein, N. A Chromosome Conformation Capture Ordered Sequence of the Barley Genome. Nature 2017, 544, 427–433. [Google Scholar] [CrossRef]
- Mascher, M. Pseudomolecules and Annotation of the Second Version of the Reference Genome Sequence Assembly of Barley Cv. Morex [Morex V2]. e!DAL - Plant Genomics and Phenomics Research Data Repository (PGP), IPK Gatersleben, Seeland OT Gatersleben, Corrensstraße 3, 06466, Germany 2019. [CrossRef]
- He, G.; Elling, A. A.; Deng, X. W. The Epigenome and Plant Development. Annu. Rev. Plant Biol 2011, 62, 411–435. [Google Scholar] [CrossRef] [PubMed]
- Baker, K.; Dhillon, T.; Colas, I.; Cook, N.; Milne, I.; Milne, L.; Bayer, M.; Flavell, A. J. Chromatin State Analysis of the Barley Epigenome Reveals a Higher-Order Structure Defined by H3K27me1 and H3K27me3 Abundance. Plant J. 2015, 84, 111–124. [Google Scholar] [CrossRef] [PubMed]
- Bucchini, F.; Del Cortona, A.; Kreft, Ł.; Botzki, A.; Van Bel, M.; Vandepoele, K. TRAPID 2.0: A Web Application for Taxonomic and Functional Analysis of de Novo Transcriptomes. Nucleic Acids Res. 2021, 49, 1–17. [Google Scholar] [CrossRef] [PubMed]
- Jung, C.; Nguyen, N. H.; Cheong, J.-J. Transcriptional Regulation of Protein Phosphatase 2C Genes to Modulate Abscisic Acid Signaling. Int. J. Mol. Sci. 2020, 21, 9517. [Google Scholar] [CrossRef] [PubMed]
- Schweighofer, A.; Hirt, H.; Meskiene, I. Plant PP2C Phosphatases: Emerging Functions in Stress Signaling. Trends Plant Sci. 2004, 9, 236–243. [Google Scholar] [CrossRef] [PubMed]
- Bruce, T. J. A.; Matthes, M. C.; Napier, J. A.; Pickett, J. A. Stressful “Memories” of Plants: Evidence and Possible Mechanisms. Plant Sci. 2007, 173, 603–608. [Google Scholar] [CrossRef]
- Kinoshita, T.; Seki, M. Epigenetic Memory for Stress Response and Adaptation in Plants. Plant Cell Physiol. 2014, 55, 1859–1863. [Google Scholar] [CrossRef]
- Wu, X.-T.; Xiong, Z.-P.; Chen, K.-X.; Zhao, G.-R.; Feng, K.-R.; Li, X.-H.; Li, X.-R.; Tian, Z.; Huo, F.-L.; Wang, M.-X.; Song, W. Genome-Wide Identification and Transcriptional Expression Profiles of PP2C in the Barley (Hordeum Vulgare L.) Pan-Genome. Genes (Basel). 2022, 13, 834. [Google Scholar] [CrossRef]
- Liang, J.; Yi, L.; Li, L.; Zhang, H.; Zhang, Y.; Deng, G.; Long, H.; Yu, M. Identification of PP2C Genes in Tibetan Hulless Barley (Hordeum Vulgare Var. Nudum) Under Dehydration Stress and Initiatory Expression and Functional Analysis of HvPP2C59. Plant Mol. Biol. Report. 2022, 40, 611–627. [Google Scholar] [CrossRef]
- Samarah, N. H.; Alqudah, A. M.; Amayreh, J. A.; McAndrews, G. M. The Effect of Late-Terminal Drought Stress on Yield Components of Four Barley Cultivars. J. Agron. Crop Sci. 2009, 195, 427–441. [Google Scholar] [CrossRef]
- Zhao, J.; Sun, H.; Dai, H.; Zhang, G.; Wu, F. Difference in Response to Drought Stress among Tibet Wild Barley Genotypes. Euphytica 2010, 172, 395–403. [Google Scholar] [CrossRef]
- Wehner, G.; Balko, C.; Humbeck, K.; Zyprian, E.; Ordon, F. Expression Profiling of Genes Involved in Drought Stress and Leaf Senescence in Juvenile Barley. BMC Plant Biol. 2016, 16, 1–12. [Google Scholar] [CrossRef] [PubMed]
- Talamè, V.; Ozturk, N. Z.; Bohnert, H. J.; Tuberosa, R. Barley Transcript Profiles under Dehydration Shock and Drought Stress Treatments: A Comparative Analysis. J. Exp. Bot. 2007, 58, 229–240. [Google Scholar] [CrossRef] [PubMed]
- Probst, A. V.; Mittelsten Scheid, O. Stress-Induced Structural Changes in Plant Chromatin. Curr. Opin. Plant Biol. 2015, 27, 8–16. [Google Scholar] [CrossRef] [PubMed]
- Brusslan, J. A.; Bonora, G.; Rus-Canterbury, A. M.; Tariq, F.; Jaroszewicz, A.; Pellegrini, M. A Genome-Wide Chronological Study of Gene Expression and Two Histone Modifications, H3K4me3 and H3K9ac, during Developmental Leaf Senescence. Plant Physiol. 2015, 168, 1246–1261. [Google Scholar] [CrossRef]
- Yan, L.; Zhai, X.; Zhao, Z.; Fan, G. Whole-Genome Landscape of H3K4me3, H3K36me3 and H3K9ac and Their Association with Gene Expression during Paulownia Witches’ Broom Disease Infection and Recovery Processes. 3 Biotech 2020, 10, 336. [Google Scholar] [CrossRef]
- Ueda, M.; Seki, M. Histone Modifications Form Epigenetic Regulatory Networks to Regulate Abiotic Stress Response. Plant Physiol. 2020, 182, 15–26. [Google Scholar] [CrossRef]
- Song, J.; Henry, H.; Tian, L. Drought-inducible Changes in the Histone Modification H3K9ac Are Associated with Drought-responsive Gene Expression in Brachypodium Distachyon. Plant Biol. 2020, 22, 433–440. [Google Scholar] [CrossRef]
- Temel, A.; Janack, B.; Humbeck, K. Drought Stress-Related Physiological Changes and Histone Modifications in Barley Primary Leaves at HSP17 Gene. Agronomy 2017, 7, 43. [Google Scholar] [CrossRef]
- Manh, M. B.; Ost, C.; Peiter, E.; Hause, B.; Krupinska, K.; Humbeck, K. WHIRLY1 Acts Upstream of ABA-Related Reprogramming of Drought-Induced Gene Expression in Barley and Affects Stress-Related Histone Modifications. Int. J. Mol. Sci. 2023, 24. [Google Scholar] [CrossRef]
- Chang, Y.; Zhu, C.; Jiang, J.; Zhang, H.; Zhu, J.; Duan, C. Epigenetic Regulation in Plant Abiotic Stress Responses. J. Integr. Plant Biol. 2020, 62, 563–580. [Google Scholar] [CrossRef] [PubMed]
- Baldoni, E.; Genga, A.; Cominelli, E. Plant MYB Transcription Factors: Their Role in Drought Response Mechanisms. Int. J. Mol. Sci. 2015, 16, 15811–15851. [Google Scholar] [CrossRef] [PubMed]
- Millar, A. A.; Jacobsen, J. V.; Ross, J. J.; Helliwell, C. A.; Poole, A. T.; Scofield, G.; Reid, J. B.; Gubler, F. Seed Dormancy and ABA Metabolism in Arabidopsis and Barley: The Role of ABA 8′-Hydroxylase. Plant J. 2006, 45, 942–954. [Google Scholar] [CrossRef] [PubMed]
- Gong, Z.; Yang, S. Drought Meets SWEET. Nat. Plants 2022, 8, 25–26. [Google Scholar] [CrossRef]
- Soon, F. F.; Ng, L. M.; Zhou, X. E.; West, G. M.; Kovach, A.; Tan, M. H. E.; Suino-Powell, K. M.; He, Y.; Xu, Y.; Chalmers, M. J.; Brunzelle, J. S.; Zhang, H.; Yang, H.; Jiang, H.; Li, J.; Yong, E. L.; Cutler, S.; Zhu, J. K.; Griffin, P. R.; Melcher, K.; Xu, H. E. Molecular Mimicry Regulates ABA Signaling by SnRK2 Kinases and PP2C Phosphatases. Science 2012, 335, 85–88. [Google Scholar] [CrossRef] [PubMed]
- Brownell, J. E.; Allis, C. D. Special HATs for Special Occasions: Linking Histone Acetylation to Chromatin Assembly and Gene Activation. Curr. Opin. Genet. Dev. 1996, 6, 176–184. [Google Scholar] [CrossRef]
- Tian, L.; Fong, M. P.; Wang, J. J.; Wei, N. E.; Jiang, H.; Doerge, R. W.; Chen, Z. J. Reversible Histone Acetylation and Deacetylation Mediate Genome-Wide, Promoter-Dependent and Locus-Specific Changes in Gene Expression during Plant Development. Genetics 2005, 169, 337–345. [Google Scholar] [CrossRef]
- Zhou, J.; Wang, X.; He, K.; Charron, J. B. F.; Elling, A. A.; Deng, X. W. Genome-Wide Profiling of Histone H3 Lysine 9 Acetylation and Dimethylation in Arabidopsis Reveals Correlation between Multiple Histone Marks and Gene Expression. Plant Mol. Biol. 2010, 72, 585–595. [Google Scholar] [CrossRef]
- He, Z.; Wu, J.; Sun, X.; Dai, M. The Maize Clade A PP2C Phosphatases Play Critical Roles in Multiple Abiotic Stress Responses. Int. J. Mol. Sci. 2019, 20, 3573. [Google Scholar] [CrossRef]
- Xiang, Y.; Sun, X.; Gao, S.; Qin, F.; Dai, M. Deletion of an Endoplasmic Reticulum Stress Response Element in a ZmPP2C-A Gene Facilitates Drought Tolerance of Maize Seedlings. Mol. Plant 2017, 10, 456–469. [Google Scholar] [CrossRef]
- Singh, A.; Pandey, A.; Srivastava, A. K.; Tran, L.-S. S. P.; Pandey, G. K. Plant Protein Phosphatases 2C: From Genomic Diversity to Functional Multiplicity and Importance in Stress Management. Crit. Rev. Biotechnol. 2016, 36, 1023–1035. [Google Scholar] [CrossRef] [PubMed]
- Fuchs, S.; Grill, E.; Meskiene, I.; Schweighofer, A. Type 2C Protein Phosphatases in Plants. FEBS J. 2013, 280, 681–693. [Google Scholar] [CrossRef] [PubMed]
- Szostkiewicz, I.; Richter, K.; Kepka, M.; Demmel, S.; Ma, Y.; Korte, A.; Assaad, F. F.; Christmann, A.; Grill, E. Closely Related Receptor Complexes Differ in Their ABA Selectivity and Sensitivity. Plant J. 2010, 61, 25–35. [Google Scholar] [CrossRef]
- Chan, Z. Expression Profiling of ABA Pathway Transcripts Indicates Crosstalk between Abiotic and Biotic Stress Responses in Arabidopsis. Genomics 2012, 100, 110–115. [Google Scholar] [CrossRef]
- Seiler, C.; Harshavardhan, V. T.; Reddy, P. S.; Hensel, G.; Kumlehn, J.; Eschen-lippold, L.; Rajesh, K.; Korzun, V.; Wobus, U.; Lee, J.; Selvaraj, G.; Sreenivasulu, N. Abscisic Acid Flux Alterations Result in Differential Abscisic Acid Signaling Responses and Impact Assimilation Efficiency in Barley under Terminal Drought Stress. Plant Physiol. 2014, 164, 1677–1696. [Google Scholar] [CrossRef] [PubMed]
- Singh, A.; Jha, S. K.; Bagri, J.; Pandey, G. K. ABA Inducible Rice Protein Phosphatase 2C Confers ABA Insensitivity and Abiotic Stress Tolerance in Arabidopsis. PLoS One 2015, 10, 1–24. [Google Scholar] [CrossRef]
- Lämke, J.; Brzezinka, K.; Altmann, S.; Bäurle, I. A Hit-and-run Heat Shock Factor Governs Sustained Histone Methylation and Transcriptional Stress Memory. EMBO J. 2016, 35, 162–175. [Google Scholar] [CrossRef]
- Ding, Y.; Fromm, M.; Avramova, Z. Multiple Exposures to Drought “train” Transcriptional Responses in Arabidopsis. Nat. Commun. 2012, 3, 740. [Google Scholar] [CrossRef]
- Chomczynski, P.; Mackey, K. Short Technical Reports. Modification of the TRI Reagent Procedure for Isolation of RNA from Polysaccharide- and Proteoglycan-Rich Sources. Biotechniques 1995, 19, 942–945. [Google Scholar]
- Pfaffl, M. W. Relative Expression Software Tool (REST(C)) for Group-Wise Comparison and Statistical Analysis of Relative Expression Results in Real-Time PCR. Nucleic Acids Res. 2002, 30, 36e–36. [Google Scholar] [CrossRef]
- Ay, N.; Janack, B.; Fischer, A.; Reuter, G.; Humbeck, K. Alterations of Histone Modifications at the Senescence-Associated Gene HvS40 in Barley during Senescence. Plant Mol. Biol. 2015, 89, 127–141. [Google Scholar] [CrossRef] [PubMed]
- Andrews, S. FastQC: A Quality Control Tool for High Throughput Sequence Data. 2010. 2017.
- Li, H.; Durbin, R. Fast and Accurate Long-Read Alignment with Burrows-Wheeler Transform. Bioinformatics 2010, 26, 589–595. [Google Scholar] [CrossRef] [PubMed]
- Li, H. Aligning Sequence Reads, Clone Sequences and Assembly Contigs with BWA-MEM ArXiv:1303.3997v1 [q-Bio.GN]. 2013.
- Zhang, Y.; Liu, T.; Meyer, C. A.; Eeckhoute, J.; Johnson, D. S.; Bernstein, B. E.; Nusbaum, C.; Myers, R. M.; Brown, M.; Li, W.; Liu, X. S. Model-Based Analysis of ChIP-Seq (MACS). Genome Biol. 2008, 9, 1–9. [Google Scholar] [CrossRef]
- Afgan, E.; Baker, D.; Batut, B.; Van Den Beek, M.; Bouvier, D.; Ech, M.; Chilton, J.; Clements, D.; Coraor, N.; Grüning, B. A.; Guerler, A.; Hillman-Jackson, J.; Hiltemann, S.; Jalili, V.; Rasche, H.; Soranzo, N.; Goecks, J.; Taylor, J.; Nekrutenko, A.; Blankenberg, D. The Galaxy Platform for Accessible, Reproducible and Collaborative Biomedical Analyses: 2018 Update. Nucleic Acids Res. 2018, 46, W537–W544. [Google Scholar] [CrossRef]
- Kent, W. J.; Sugnet, C. W.; Furey, T. S.; Roskin, K. M.; Pringle, T. H.; Zahler, A. M.; Haussler, a. D. The Human Genome Browser at UCSC. Genome Res. 2002, 12, 996–1006. [Google Scholar] [CrossRef]
- Robinson, J. T.; Thorvaldsdóttir, H.; Winckler, W.; Guttman, M.; Lander, E. S.; Getz, G.; Mesirov, J. P. Integrative Genomics Viewer. Nat. Biotechnol. 2011, 29, 24–26. [Google Scholar] [CrossRef]
- Ramírez, F.; Dündar, F.; Diehl, S.; Grüning, B. A.; Manke, T. DeepTools: A Flexible Platform for Exploring Deep-Sequencing Data. Nucleic Acids Res. 2014, 42, W187–W191. [Google Scholar] [CrossRef]
- Stark, R.; Brown, G. DiffBind : Differential Binding Analysis of ChIP-Seq Peak Data. R Packag. version 100.4.3 2011, 1–29. [Google Scholar]
- Solomon, E. R.; Caldwell, K. K.; Allan, A. M. A Novel Method for the Normalization of ChIP-QPCR Data. MethodsX 2021, 8, 101504. [Google Scholar] [CrossRef]
- Bray, N. L.; Pimentel, H.; Melsted, P.; Pachter, L. Near-Optimal Probabilistic RNA-Seq Quantification. Nat. Biotechnol. 2016, 34, 525–527. [Google Scholar] [CrossRef] [PubMed]
- Robinson, M. D.; McCarthy, D. J.; Smyth, G. K. EdgeR: A Bioconductor Package for Differential Expression Analysis of Digital Gene Expression Data. Bioinformatics 2010, 26, 139–140. [Google Scholar] [CrossRef] [PubMed]
- Ritchie, M. E.; Phipson, B.; Wu, D.; Hu, Y.; Law, C. W.; Shi, W.; Smyth, G. K. Limma Powers Differential Expression Analyses for RNA-Sequencing and Microarray Studies. Nucleic Acids Res. 2015, 43, e47. [Google Scholar] [CrossRef] [PubMed]
Disclaimer/Publisher’s Note: The statements, opinions and data contained in all publications are solely those of the individual author(s) and contributor(s) and not of MDPI and/or the editor(s). MDPI and/or the editor(s) disclaim responsibility for any injury to people or property resulting from any ideas, methods, instructions or products referred to in the content. |
© 2023 by the authors. Licensee MDPI, Basel, Switzerland. This article is an open access article distributed under the terms and conditions of the Creative Commons Attribution (CC BY) license (http://creativecommons.org/licenses/by/4.0/).
Copyright: This open access article is published under a Creative Commons CC BY 4.0 license, which permit the free download, distribution, and reuse, provided that the author and preprint are cited in any reuse.


