1. Introduction
Thermochemical decomposition of solid materials, e.g., wood, is a complex process as it includes several chemical reactions, heat and mass transfer processes that take place concurrently. The solid decomposition may be described mathematically with a system of partial differential equations (PDEs) that would account for the conservation of energy, species mass, and momentum (Park et al., 2010; Haseli et al., 2011a; Haseli et al., 2011b; Wan et al., 2015; Atreya et al., 2017; Gómez et al. 2018; Pecha et al. 2018; Fatehi et al., 2019; Lu et al., 2020; Fatehi et al., 2021; Lu et al., 2021). It is a challenging to nearly impossible task to analytically solve the system of PDEs that consist of conduction, reaction, and convection terms. The model equations are often solved using numerical techniques allowing to predict the species concentrations and the temperature of a decomposing solid.
Numerical solution of a system of nonlinear PDEs is inherently expensive computationally; this has promoted simplified (or reduced) models that account for the key aspects of the phenomena. Solving a PDE problem analytically becomes even more challenging when the solution is constrained to satisfy a specified set of initial and boundary conditions, which is the case in most physical and chemical processes such as heating a finite-size object, combustion of a solid fuel (Haseli et al., 2011c; He and Behrendt, 2011; Haseli et al., 2013a; Torero et al., 2020; Zhao et al., 2022), and pyrolysis of wood.
A class of simplified solid decomposition models postulates that the reaction occurs at a thin front dividing the solid into a charred region and a virgin region. The reaction-front characterized by temperature Tr is first formed at the surface of the solid and then propagates toward the center. A subgroup of thin reaction-front based models accounts for solid decomposition rate by a single-step kinetic model (Galgano and Di Blasi, 2003; Wichman and Atreya, 1987) whereas models assuming infinite reaction rate have also been developed (Chen et al., 1993; Moghtaderi et al., 1997a; Spearpoint and Quintiere, 2000; Haseli et al., 2012a, Haseli et al. 2013b). The reaction-front temperature is predictable in the former through a combined solution of heat transfer and kinetic models, and it is shown to vary during the process (Galgano and Di Blasi, 2003). However, the latter subgroup of simplified models requires a knowledge of the reaction-front temperature often treated as a constant parameter throughout the solid decomposition.
A past study on wood pyrolysis (Galgano and Di Blasi, 2005) has revealed that the reaction-front temperature obtained from the two methods (finite-rate and infinite-rate kinetics) may not be necessarily identical. Indeed, the reaction-front temperature in the infinite-rate kinetics model may be viewed as an average volumetric decomposition temperature. The question is then what value should be assigned to this temperature in infinite-rate models? Park et al. (2009) have investigated this problem for a pyrolyzing thermally thick wood. They examined the (average volumetric) pyrolysis-front temperature by means of numerical modeling and comparing the predictions of a single-step finite rate model and a constant reaction-front temperature model where both models were developed based on the thin reaction-front approximation. The pyrolysis-front temperature was determined by equating the energy consumed by the volatiles obtained using the two models. They studied the effects of various parameters such as sample size, external heat flux, and thermal properties on the pyrolysis-front temperature.
The approach employed in the previous studies (Galgano and Di Blasi, 2005; Park et al., 2009) is numerical in that one can observe graphically the effects of process parameters on the pyrolysis-front temperature. On the contrary, the present study aims to develop a closed-form solution for the pyrolysis-front temperature of a thermally reactive solid by solving the unsteady heat transfer equation for a finite size solid slab. The method will assume an infinite rate reaction taking place at a thin layer – the reaction front. The solution will lead to a relation between the total reaction time, the average reaction-front temperature, and the external heat flux. The pyrolysis-front temperature will then be expressed as a function of the applied heat flux by eliminating the reaction time using an empirical relation.
The second objective of this study is to establish a theoretical framework for better understanding of the ignition (not necessarily the same as onset of pyrolysis) of decomposing solids. Experimental studies have shown that the ignition temperature of solid fuels depends on numerous factors such as external heat flux, size, and solid material (Moghtaderi et al., 1997b; Spearpoint and Quintiere, 2001; Yang et al., 2003). A review by Babrauskas (2001) reveals that the temperature at which wood begins to react is in the range 210-497 °C, although a lower value of 190 °C has also been reported (Yang et al., 2003). A recent study by Bartlett et al. (2019) suggests that the critical heat flux at which wood ignites lies between 10 and 28 kW/m2 with ignition temperature within 190-408 °C. Kashiwagi’s (1979, 1981, 1982) extensive study on the ignition of wood (red oak) and polymethyl methacrylate (PMMA) has shown that under identical radiant heat fluxes autoignition takes longer than pilot ignition, and horizontally oriented samples ignite faster than when they are vertical.
Past modeling studies on ignition of solid fuels often treat ignition temperature as an input parameter that corresponds to a critical heat flux; see for instance Spearpoint and Quintiere (2001), Hernández et al. (2019), and Parot et al. (2022). In the present study, we will derive an explicit expression for the ignition temperature as a function of the external heat flux. The method will include establishing a relation between the surface temperature at ignition, ignition delay time, and the external heat flux. Experimental studies have shown that the ignition time is inversely proportional to the applied heat flux (Moghtaderi et al., 1997b; Bartlett et al., 2019, Rhodes and Quintiere, 1996; Boonmee and Quintiere, 2002; Mikkola and Wichman, 1989). This will allow to eliminate the ignition time and to derive an expression for the ignition temperature as a function of the external heat flux. The predictability of the expressions obtained for the pyrolysis-front temperature and ignition temperature will qualitatively be assessed against the findings of previous studies.
2. Solid Decomposition Model
Consider a solid slab whose surface receives heat from its surrounding whereas its back face is insulated.
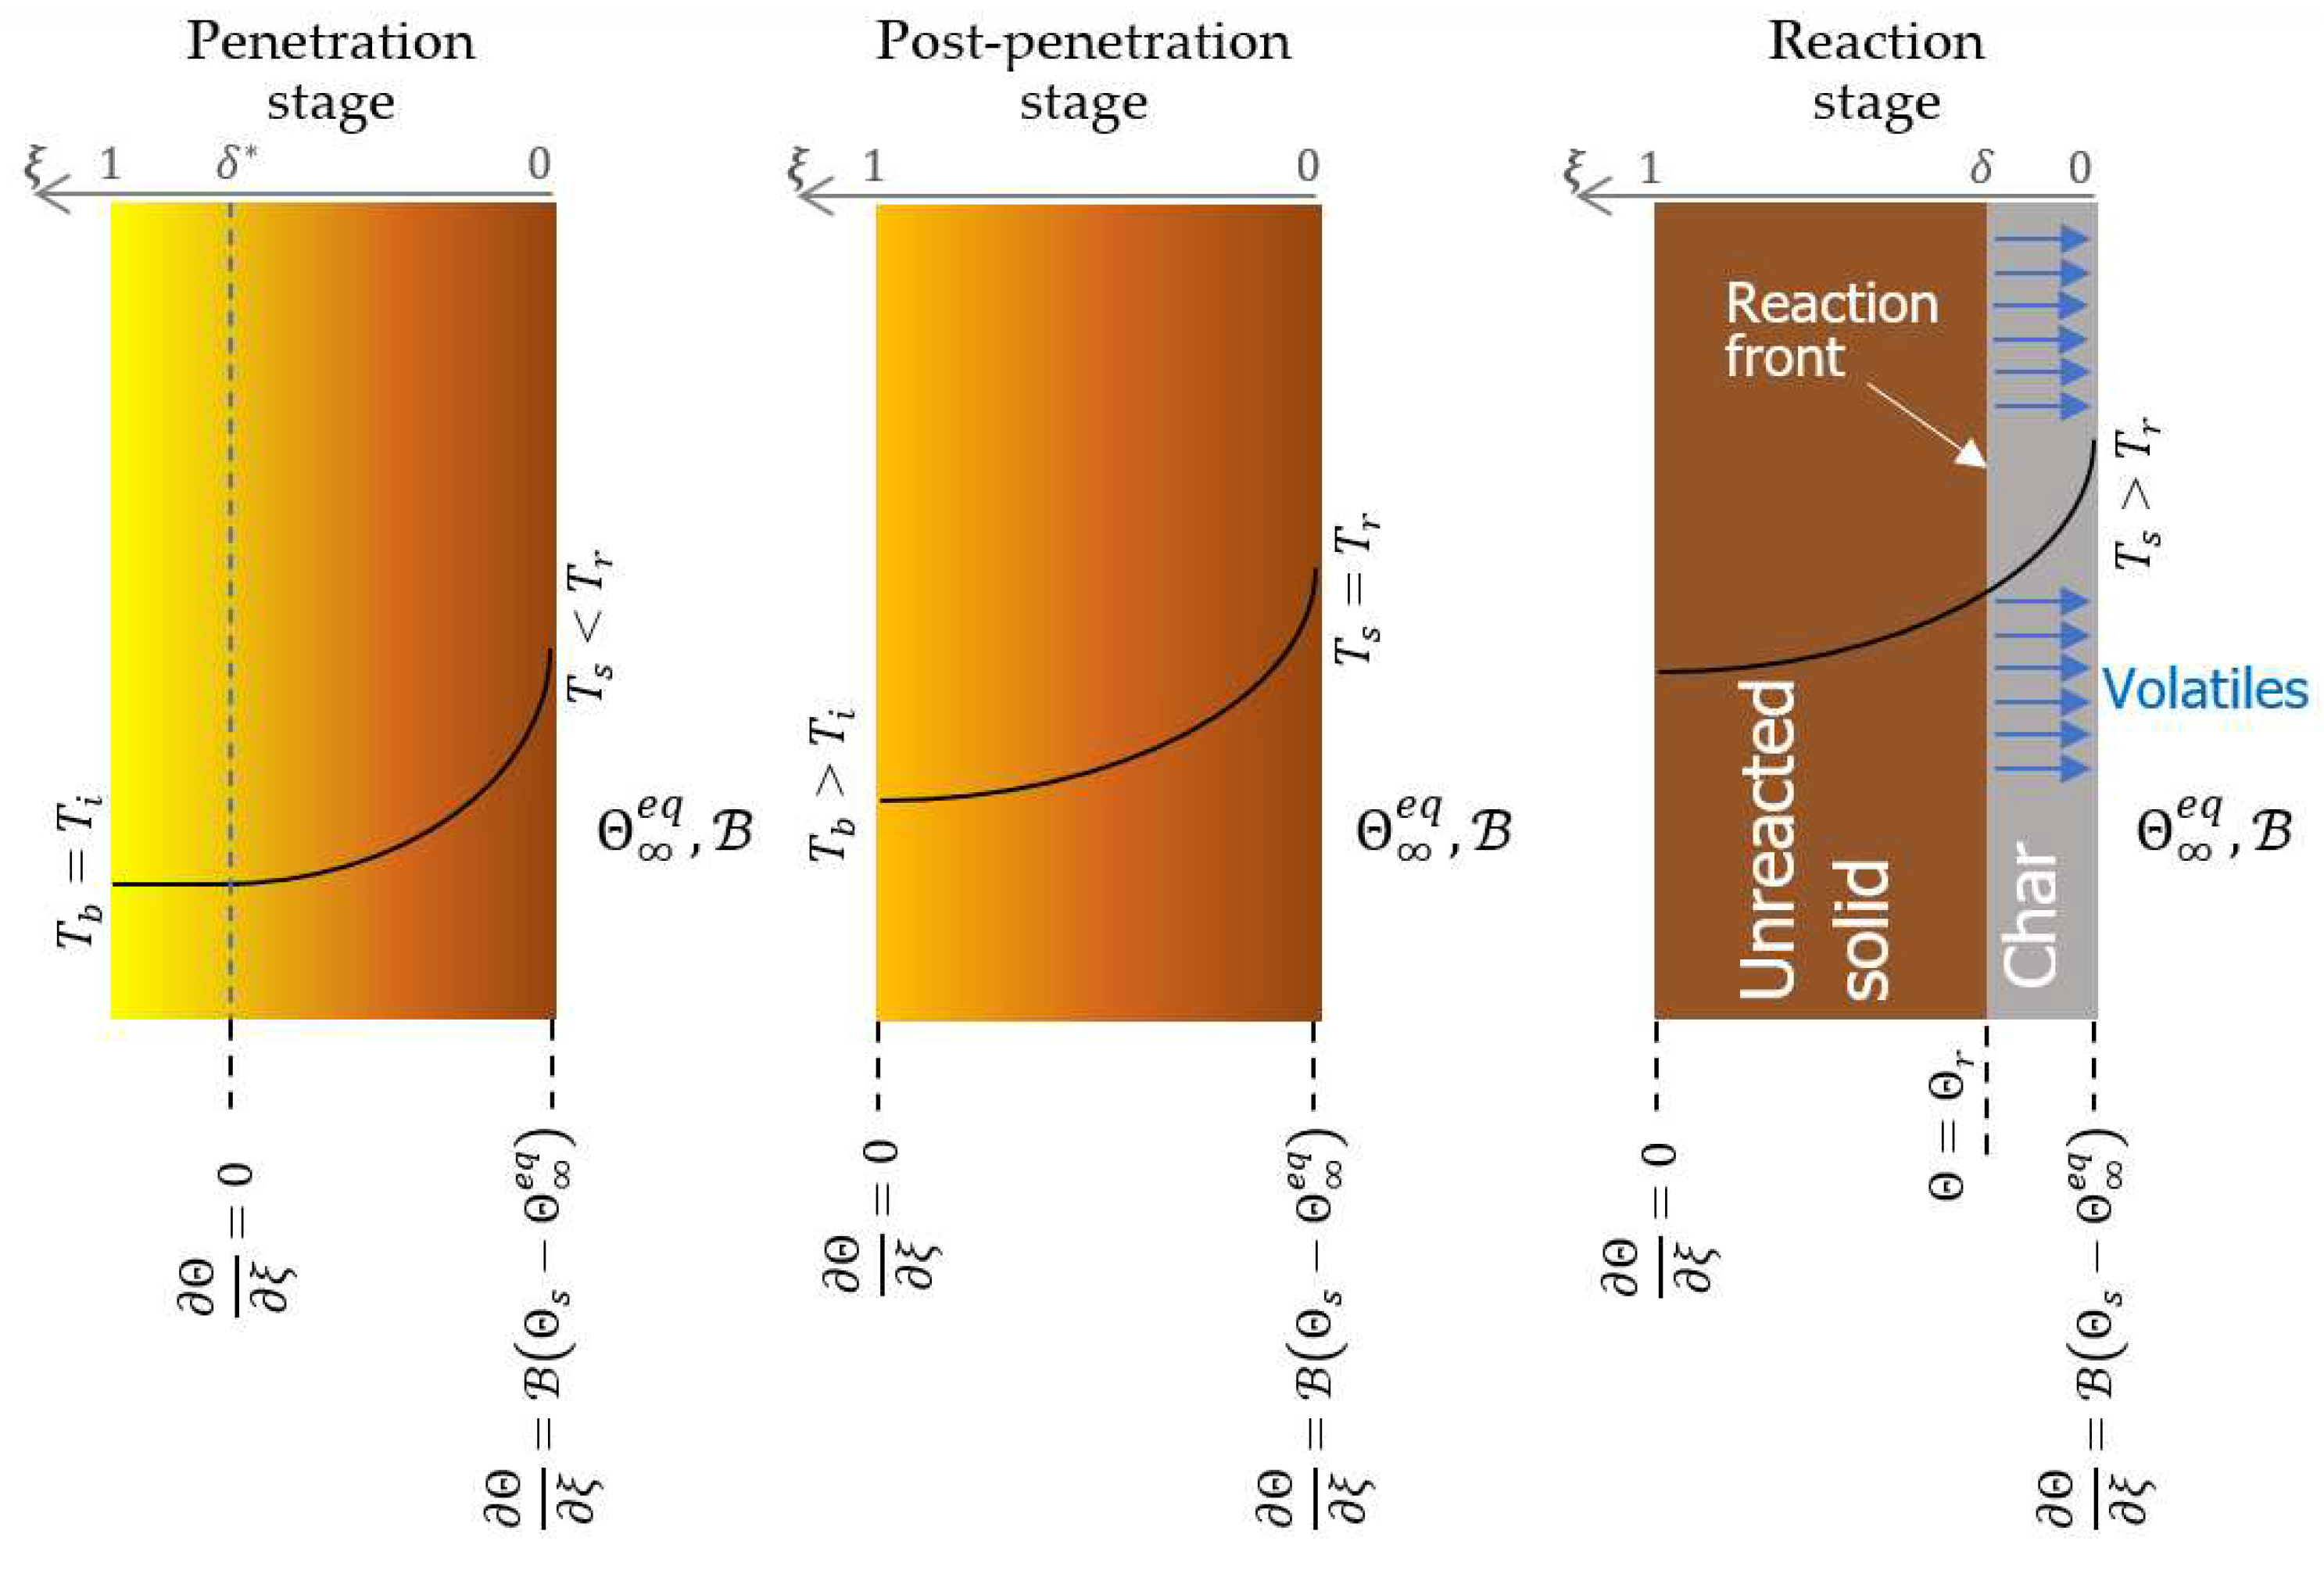
Figure 1 shows the various stages of the decomposition of a thermally thin solid that is initially at a uniform temperature. The solid is heated up until its surface temperature rises to a reaction temperature at which the solid begins to decompose. The heating phase consist of (i) thermal penetration stage, and (ii) post-penetration stage. The formulation to be presented employs the concept of thermal penetration depth (Biot, 1957) and thin reaction-front approximation.
As depicted in
Figure 1, in the penetration stage, a thermal wave initiated at the particle surface travels toward the adiabatic side of the slab (
). The post-penetration stage begins as soon as the temperature at the adiabatic side rises above the initial temperature. At this instant, the thermal wave has penetrated throughout the particle. The transition from the post-penetration to reaction stage occurs once the surface temperature reaches a characteristic reaction temperature,
Tr. A thin reaction-front formed at the surface will advance to the interior locations of the solid leaving a char layer behind whereas the volatiles will flow toward the surface as depicted in
Figure 1. Note that the thermophysical properties will be assumed constant throughout the article.
2.1. Heating phase
The heat transfer equation in nondimensional form can be written as
where
(
) is a dimensionless time (Fourier number),
is the thermal diffusivity,
t is the time,
L is the particle thickness,
is a dimensionless position measured from the surface (
represents the particle surface), and
is a dimensionless temperature defined as
where and denote, respectively, the initial temperature of the body and the surrounding temperature.
During the thermal penetration stage, the initial condition is (). The boundary condition at the thermal penetration depth denoted by may be expressed as . On the other hand, a heat balance at the surface yields another boundary condition as where denotes a Biot number, , and whose value depends on the heat transfer mechanism. For example, corresponds to a convective heat transfer between the solid and its surroundings. If, on the other hand, the body is heated by an external irradiation while losing heat to the surroundings via convection, will be none zero.
Using the initial and boundary conditions defined above and assuming that the spatial temperature distribution approximately follows a quadratic function, a solution of Eq. (1) yields (Haseli and Naterer, 2022)
The temperature profile may then be represented as
During the post-penetration stage, the adiabatic boundary condition occurs at the
. The surface boundary condition is still the same as described previously for the penetration stage. Further, the initial condition is obtained from Eqs. (3) and (4) with
.
With these initial and boundary conditions, a solution of Eq. (1) leads to the following expression for the temperature distribution.
The transition from the post-penetration to reaction stage takes place once
. The dimensionless time at which the reaction begins at the surface is determined by substituting
and
=0 in Eq. (7).
where denotes the dimensionless reaction temperature. Indeed, denotes the total time of the heating stage.
2.2. Reaction phase
Once the reaction begins at the surface, the body can be divided into two regions:
Charred region
Virgin region
where denotes the dimensionless position of the reaction front.
The conservation of energy in integral form may be represented for the entire solid as
where , , , , the subscript "c" refers to the charred region, is the specific enthalpy of reaction (positive for endothermic and negative for exothermic reaction), and denotes the specific heat of volatiles.
The second and third terms on the right side of Eq. (9) account for the heat of solid decomposition and the sensible heat of volatiles, respectively.
The boundary conditions at this stage are , , and where denotes the thermal conductivity ratio.
The temperature profile, assuming a quadratic function satisfying the above boundary conditions, may be expressed as
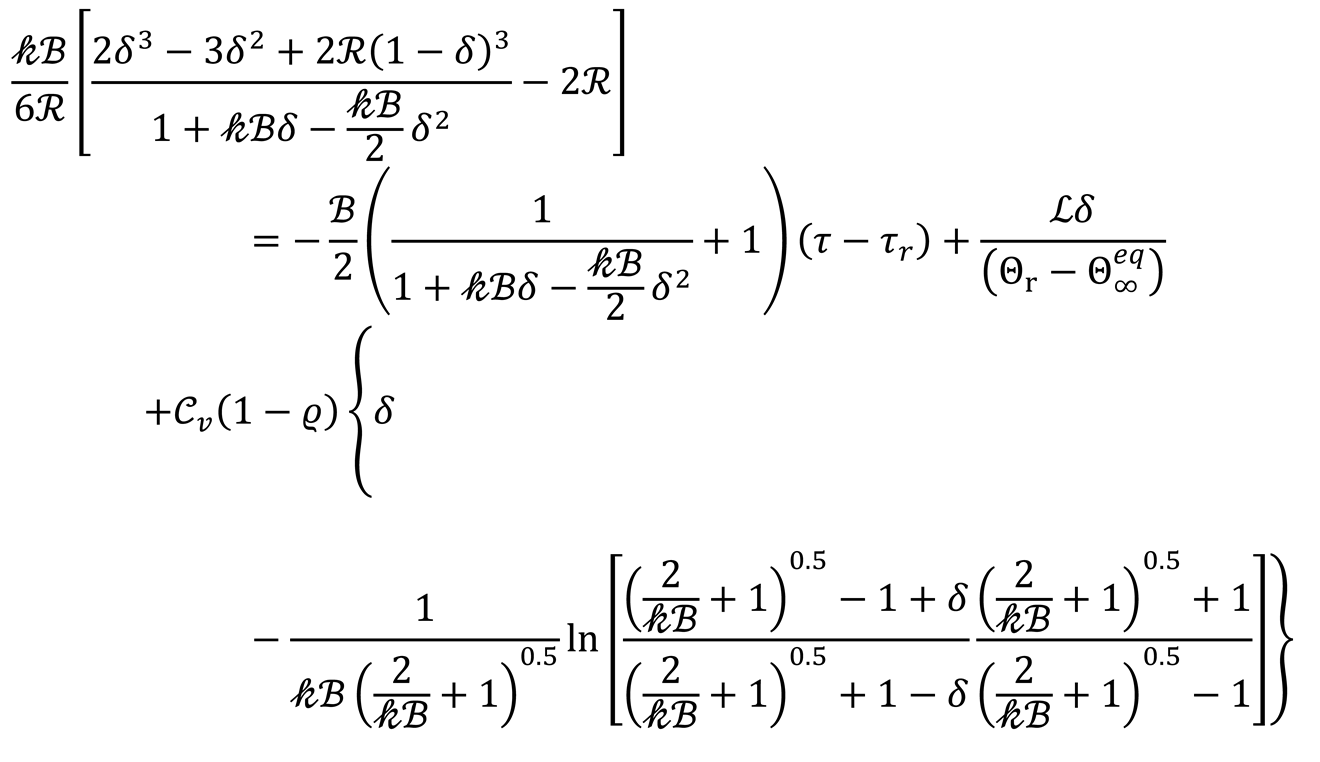
Using Eq. (10) to calculate the integrals in Eq. (9), then integrating with the initial condition
,
, one obtains
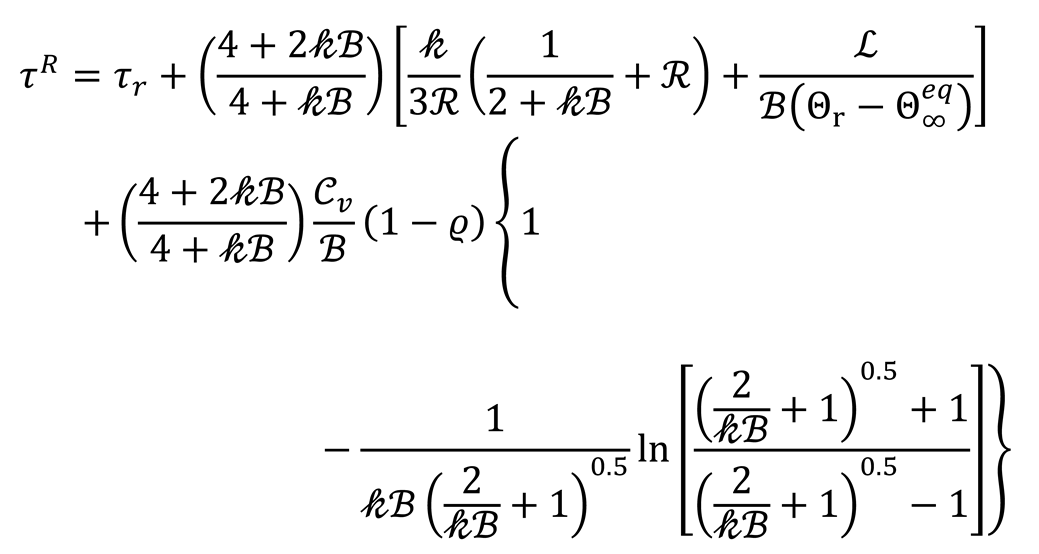
The total reaction time can be determined by substituting
into Eq. (11) which upon rearranging gives
The surface temperature at the end of the reaction may also be estimated using Eq. (10). Hence,
2.3. Validation
The predictability of the formulation presented thus far is examined using the measured data of Lu et al. (2010) who conducted pyrolysis experiments of sawdust particles at a reactor temperature of 1625 K.
Table 1 gives the thermophysical properties used in the calculations as well as the predicted and measured total reaction time of single sawdust particles. The effective thermal conductivity is estimated by accounting for the radiation in the porous structure of the virgin solid and char as well as the thermal conductivity of the volatiles in the charred region (Haseli et al., 2011a; Haseli et al., 2011b)
where
is the thermal conductivity of the virgin solid,
the Stefan-Boltzmann constant,
d the diameter of pore,
the emissivity, and
the thermal conductivity of volatiles. Also,
denotes the porosity of charred region determined as follows.
where is the initial or the virgin solid porosity.
The specific heats of wood, char, and volatiles are calculated using the relations employed in the previous pyrolysis models (Haseli et al., 2011a; Haseli et al., 2011b). The heat of reaction is determined using the correlation of Milosavljevic et al. (1996) which accounts for the exothermicity of char formation and the endothermicity of volatiles creation.
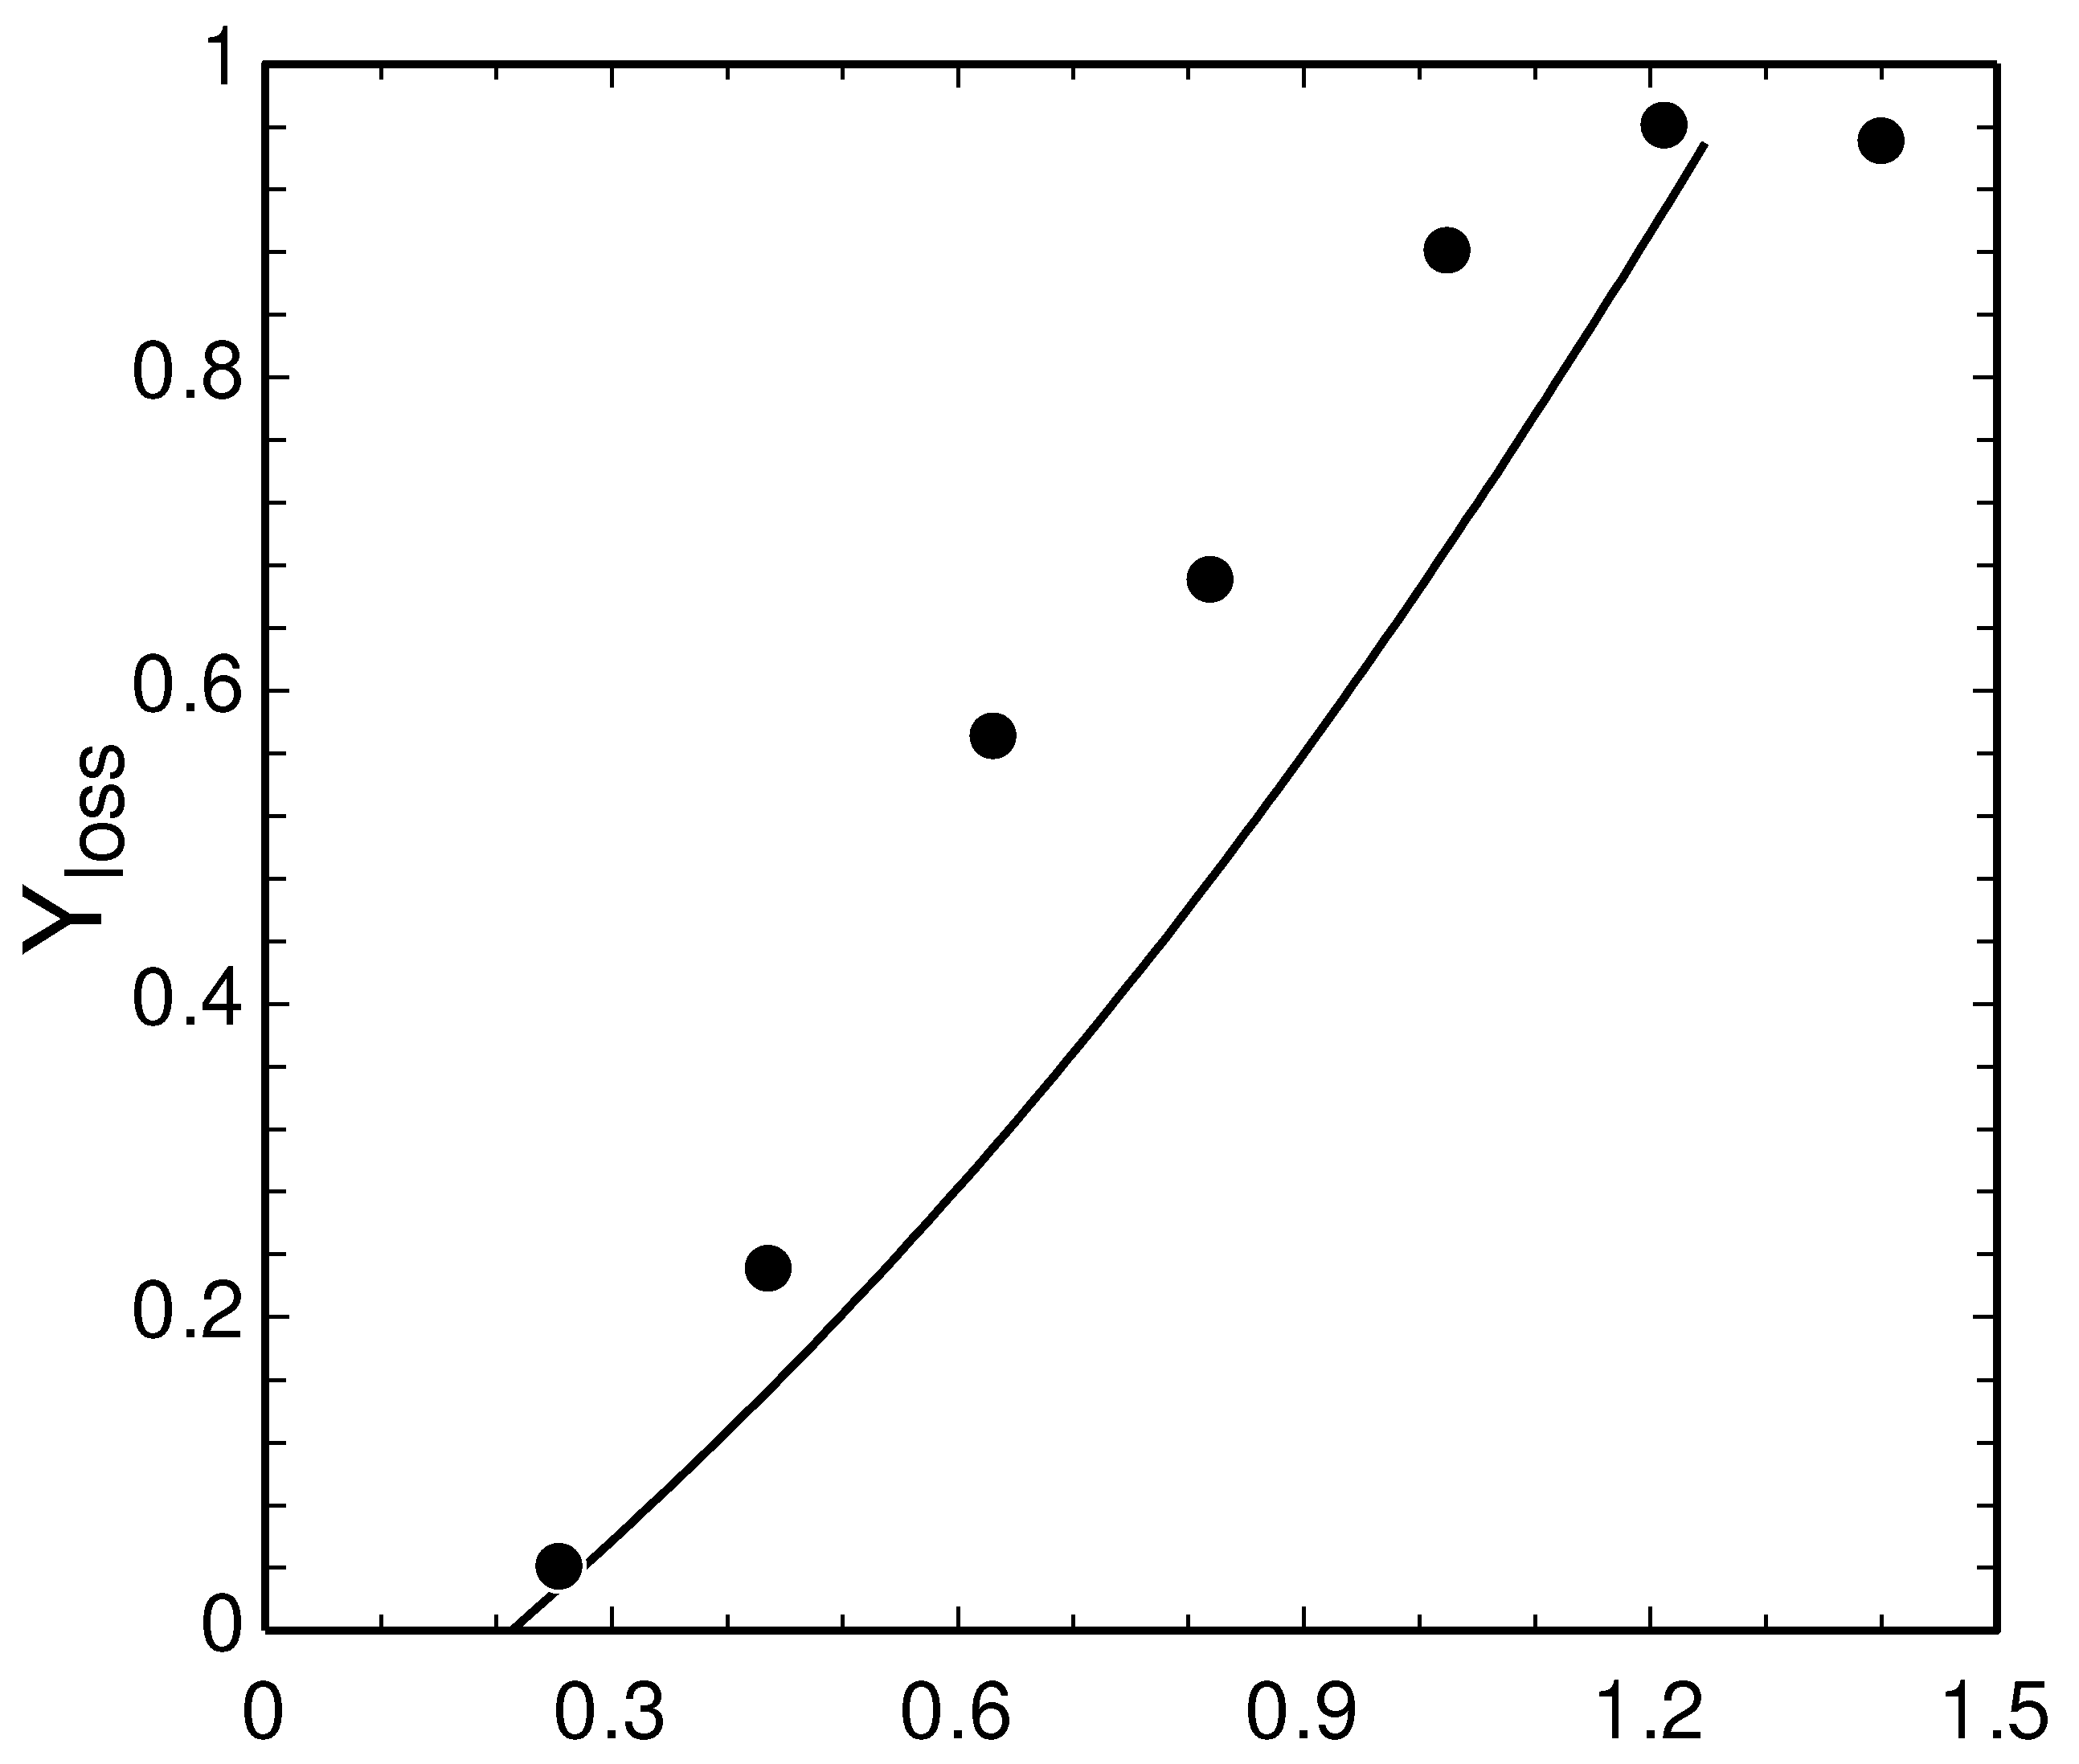
Figure 2 compares the predicted mass loss history of the pyrolyzing sawdust particle with the measurements of Lu et al. (2010). A reaction temperature of 589 K is used which was determined by prescribing the measured heating time to Eq. (8). The total reaction time predicted by the present formulation is 0.364 second which compares well with the measured value of 0.355 second. Given the average experimental error of 8.5% reported by Lu et al. (2010) and the simplicity of the modelling approach, the validation depicted in
Figure 2 is satisfactory.
The accuracy of the solid decomposition model is further assessed using the previously developed detailed 1D pyrolysis model (Haseli et al., 2011a).
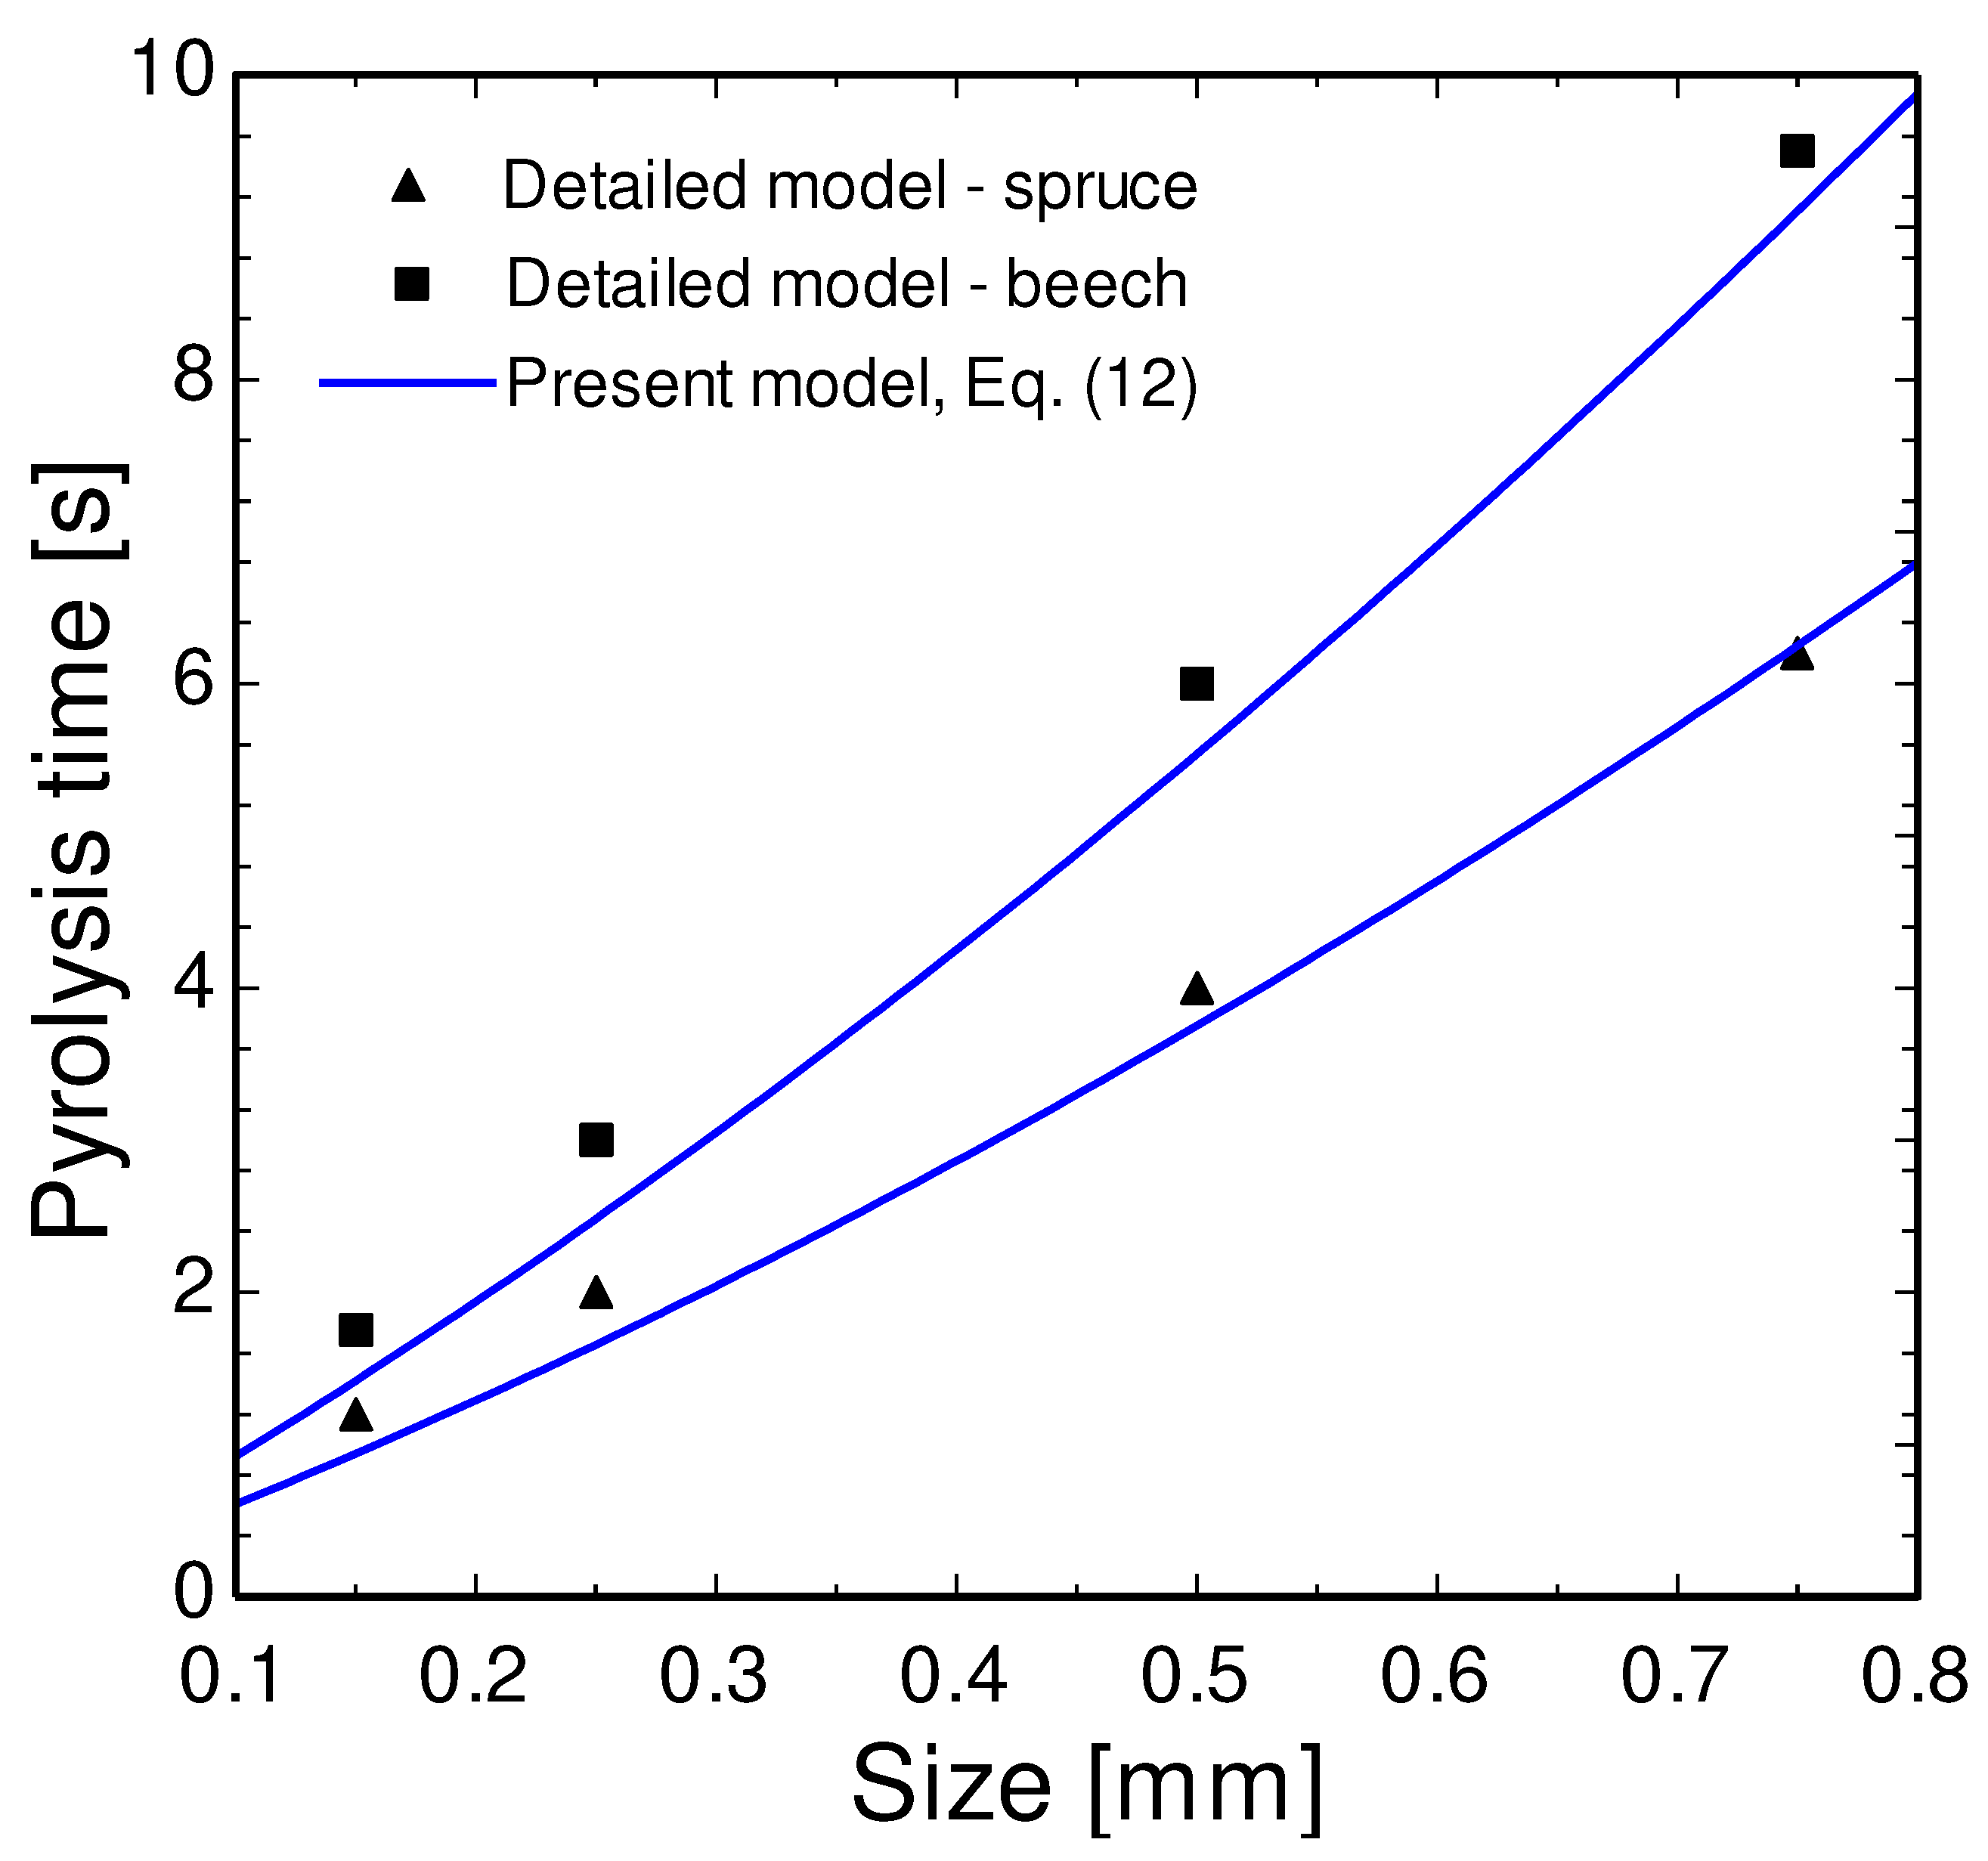
Figure 3 compares the pyrolysis time of spruce and beech particles computed by the present formulation, Eq. (12), and the detailed pyrolysis model. The results in
Figure 3 are obtained for an external heat flux of 100 kW/m
2. The reaction-front temperature employed in Eq. (12) is 700 K. As will be shown in the next section, the reaction front temperature of pyrolyzing wood is dependent on the applied heat flux (see Figure 5). The prediction of Eq. (12) in
Figure 3 qualitatively and quantitatively matches that of the detailed pyrolysis model. Both models predicts that a longer pyrolysis time for beech than spruce at identical particle sizes as the former (700 kg/m
3) is denser than the latter (450 kg/m
3).
3. Determination of Pyrolysis-Front Temperature
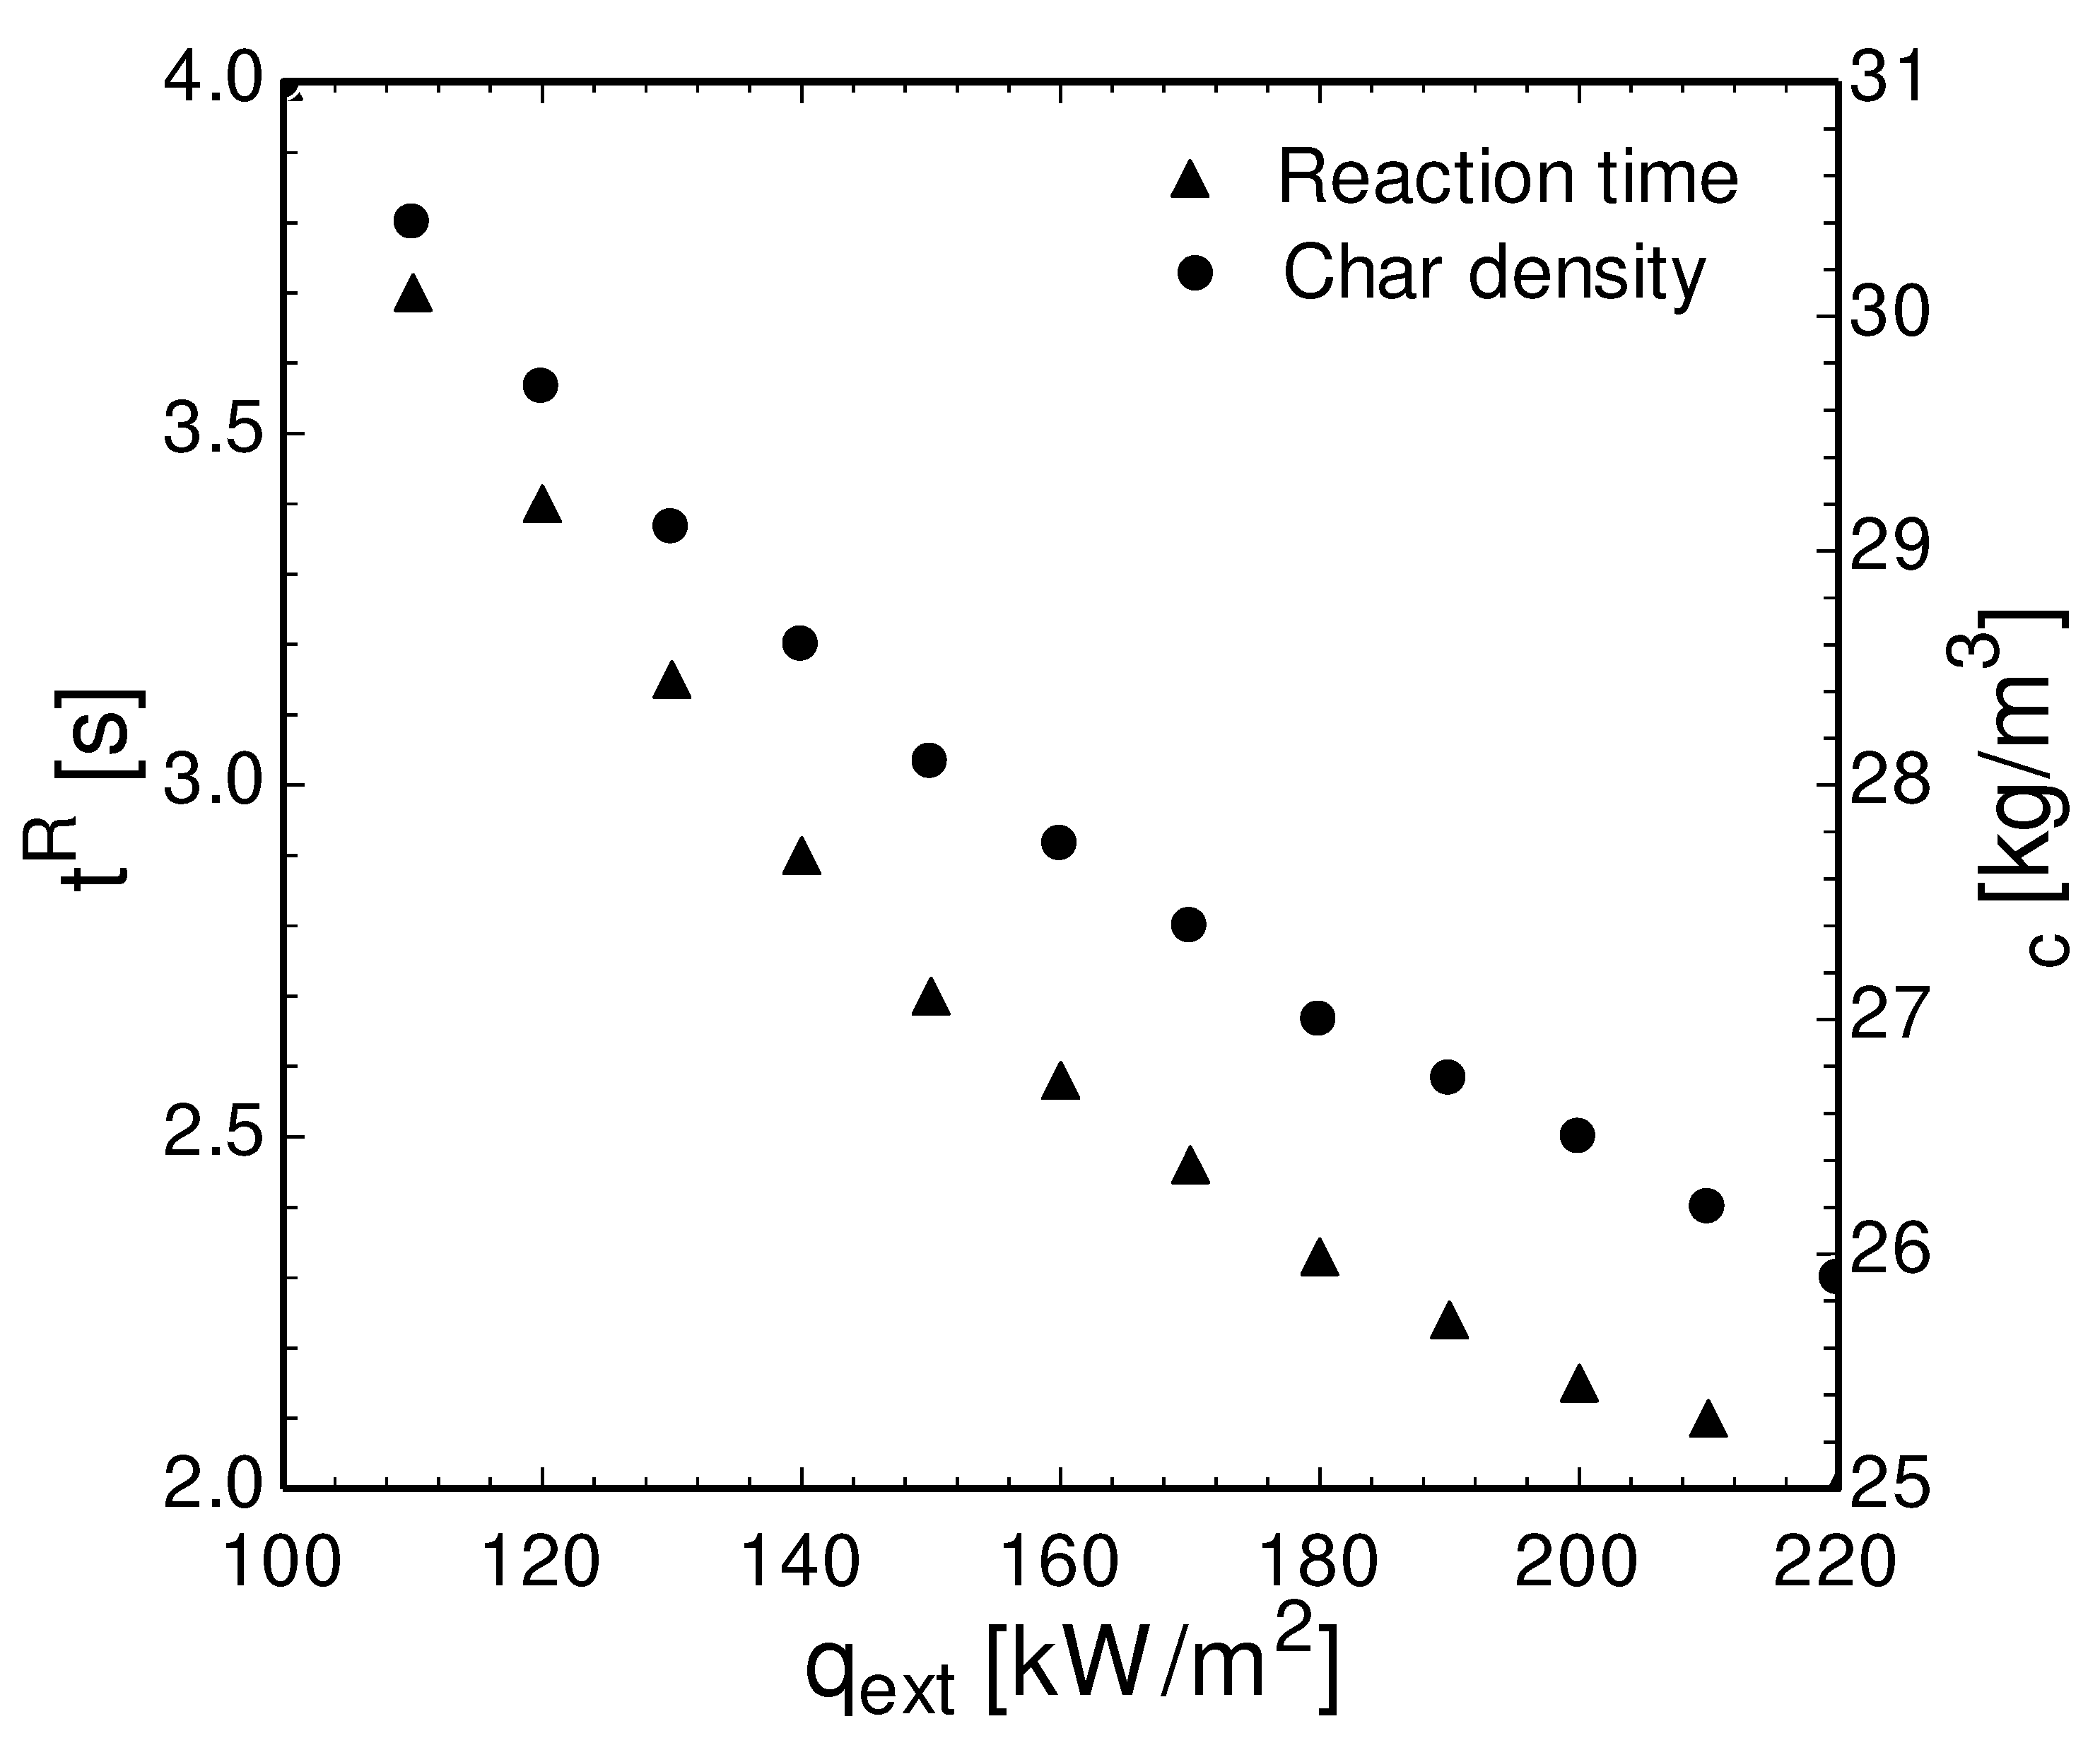
Now, the question is how one may determine the reaction temperature in the absence of experimental data. The method employed for calculation of the average volumetric pyrolysis-front temperature includes incorporation of an empirical relation between the external heat flux and pyrolysis time. Elimination of the pyrolysis time between the empirical relation and Eq. (12) will allow to express the pyrolysis-front temperature as a function of the external heat flux. A typical trend of the total pyrolysis time of single wood particles versus the external heat flux is depicted in
Figure 4. The results shown in
Figure 4 are obtained from Haseli et al. (2011a) whose model accounts for the solid decomposition in accordance with the kinetic scheme of Shafizadeh and Chin (1977). The model is based upon conservation of species mass (biomass, gases, tar, char), energy, and the gas phase momentum and has been validated using experiments.
Of primary importance here is the functional relation of the reaction time
with the external heat flux
. Both the final char density and reaction time of pyrolyzing wood particles exhibit descending trends with the external heat flux. This observation will suffice for development of an analytical model for the pyrolysis-front temperature in the next section. First, we numerically demonstrate the method described above to determine the pyrolysis-front temperature of the wood particles of
Figure 4 at different heat fluxes using the properties of the wood given in
Table 2. It is to be noted that in practice the reaction temperature is expected to vary within the particle. So, the pyrolysis-front temperature to be obtained using the proposed method may be treated as a volumetric average quantity.
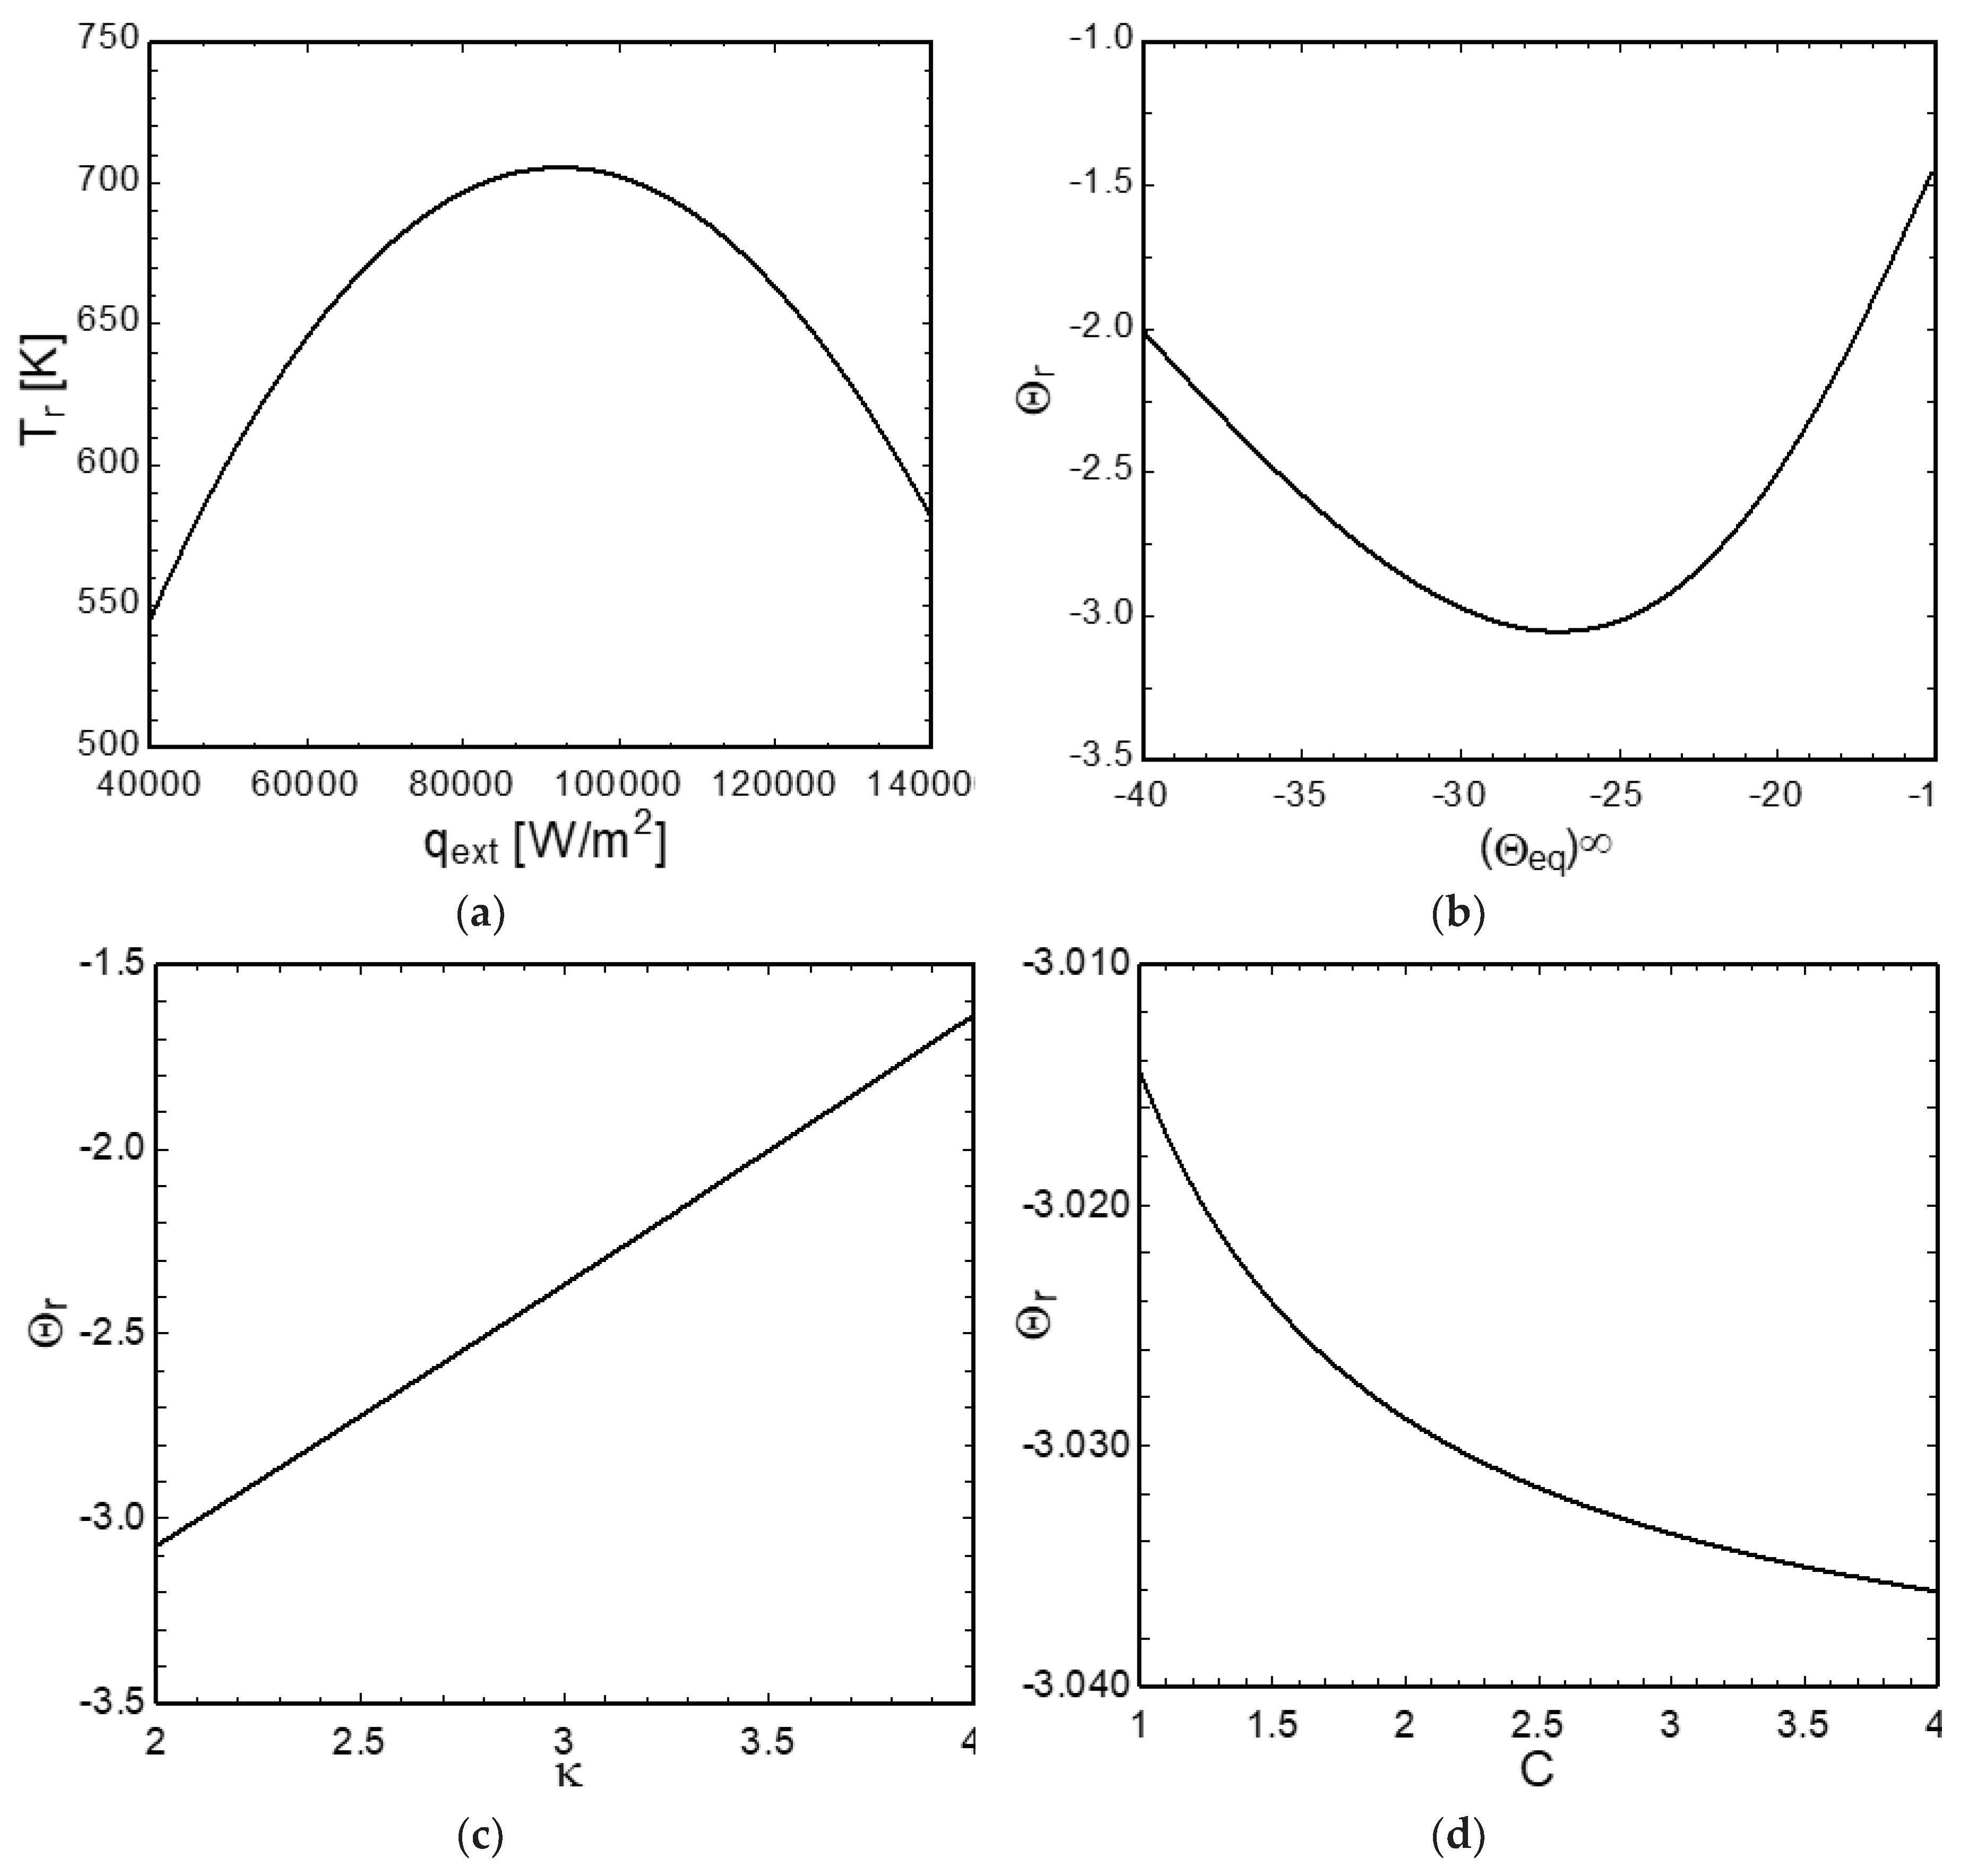
Figure 5 shows the computed average pyrolysis-front temperature for spruce wood at varying irradiation heat flux in both dimensional (a) and dimensionless (b) format. The noticeable observation is that the pyrolysis-front temperature (i) is dependent on the applied heat flux, and (ii) has an extremum at an external heat flux of 91.5 kW/m
2 (equivalent to
). The pyrolysis-front temperature increases from 545.6 K to 705.4 K with an increase in the external heat flux for
(
), but it decreases with a further increase in
beyond the optimum heat flux, i.e., 91.5
.
Park et al. (2009) also investigated the effect of the external heat flux that ranged from 20 to 100 kW/m
2. They found that the pyrolysis-front temperature increased by an increase in the heat flux; this trend is consistent with the results shown in
Figure 5a where the pyrolysis-front temperature exhibits an increasing trend up to a heat flux of close to 100 kW/m
2. The authors noted that with a further increase in the heat flux an asymptotic value could be reached for the pyrolysis-front temperature. This asymptotic temperature value occurring at the vicinity of 100 kW/m
2 external heat flux is coincident with the location of maximum reaction temperature in
Figure 5a.
By inspecting Eqs. (12) and Eq. (8), it can be readily inferred that the total reaction time, , is dependent on the external heat flux through and Both terms are decreasing functions with respect to the external heat flux but increasing with the reaction temperature. The former (the ln term) influences the time of heating stage whereas the latter impacts the time of pyrolysis stage. The comprehensive pyrolysis model (Haseli et al., 2011a, 2011b) considers finite-rate temperature dependent decomposition of biomass through three parallel reaction pathways in that solid is converted into char, tar, and gas. In the present formulation, all these effects are included in the characteristic reaction temperature .
The total pyrolysis time predicted by Eq. (12) is constrained to match that of the comprehensive model. Any difference between the time predicted with the two models is offset through the characteristic reaction-front temperature. At low heat fluxes, the slopes of both and are steep which gradually decrease by increasing the heat flux. Equation (12) that includes the above two terms appears to predict a shorter time at low heat fluxes but longer time at high heat fluxes compared to the comprehensive pyrolysis model. This is why the reaction-front temperature increases with an increase in at low heat fluxes but it decreases at high heat fluxes indicating that there exists a between the two regions of low and high heat fluxes at which the pyrolysis temperature attains a maximum. From the above discussion, the pyrolysis temperature in the simplified particle models developed based on thin reaction-front approximation and infinite reaction rate can be viewed as a fitting parameter.
The effect of thermal conductivity ratio and the specific heat ratio () on the reaction-front temperature is depicted in Figs. 5c and 5d, respectively. The specific heat ratio marginally impacts but it is noticeably sensitive to a change in the thermal conductivity ratio. An increase in the specific heat ratio leads to a slight reduction in equivalent to a marginal increase in . On the contrary, an increase in the thermal conductivity ratio yields a higher (lower ). These trends are consistent with the findings of Park et al. (2009) who reported that the pyrolysis temperature would slightly decrease with a 2.5-fold increase in the char specific heat and slightly increase by a 2-fold increase in the virgin solid specific heat. The authors also found an increase in the pyrolysis temperature (equivalent to a decrease in ) when the thermal conductivity of char was increased (equivalent to decreasing ). In the next section, the existence of an extremum reaction temperature will analytically be examined.
4. Formulation of Pyrolysis-Front Temperature
To obtain an expression for
, the reaction time and char density predicted by the detailed pyrolysis model are algebraically incorporated into Eq. (12). Because the formulation in
Section 2 is presented in a dimensionless form, it is appropriate to describe the reaction time, char density, and heat flux using the dimensionless notations, i.e.,
and
. One may choose various functions, e.g., polynomial, exponential, linear, for
and
to fit the prediction of the detailed model with sufficient accuracy. It should however be noted that the complexity of the formulation to be presented below strictly depends on the type of function assigned to
and
. Among numerous possibilities, a linear function is found to ensure the simplicity of the formulation without relinquishing the accuracy (due to an R
2-value of greater than 0.96 for both
and
).
where
are constant parameters.
Noting that
, Eq. (8) may be rewritten using Eq. (5) as
Substituting Eqs. (17)-(19) into Eq. (12) and rearranging for
yields
The above analysis reveals that
is a function of
, the Biot number
, the thermal conductivity ratio
, the specific heat ratios
and
, and
. Equating the differential of
with respect to
to zero,
, and solving for
leads to
With an increase in
,
will decrease if
but it will increase if
. The dimensionless reaction temperature corresponding to
may be determined by substituting Eq. (25) into Eq. (20) and simplifying as
A relation may also be established between
and
through a combination of Eqs. (25) and (26) as follows.
As an example, we determine the extremum reaction temperature of the pyrolyzing spruce particle using the properties given in
Table 2. At the condition of extremum temperature, we have the following values for the dimensionless parameters:
Using the above quantities in Eqs. (21)-(24), we get
Substituting these values into Eqs. (25) and (27) yields
and
. So, the dimensionless reaction front temperature should increase with
for
and decrease if
. These observations are consistent with the trend of
vs
in
Figure 4 (bottom). Furthermore, the dimensional values of the extremum pyrolysis temperature and the optimum heat flux at
are determined to be 711.3 K and 88.5 kW/m
2, respectively. Both figures compare fairly with the maximum pyrolysis temperature of 705.4 K and the optimum heat flux of 91.5 kW/m
2 in
Figure 4 (top) even though the reaction time is assumed to be a linear function of
; see Eq. (18).
5. Formulation of Ignition Temperature
The expression given by Eq. (20) provides an estimate of the average reaction-front temperature throughout the particle over the conversion time, which is not necessarily the same as the ignition temperature (Dakka et al., 2002). One may find various terminologies in the literature for ignition temperature of a reacting solid, for instance, piloted ignition that requires the presence of a spark ignitor, or auto-ignition where the volatiles temperature rises to auto-ignition level (Bartlett et al., 2019). Past studies (Spearpoint and Quintiere, 2001; Kashiwagi, 1981; Boonmee and Quintiere, 2002, Vermesi et al., 2017; Boonmee and Quintiere, 2005; Boonmee, 2004; McAllister and Finney, 2017) have revealed a dependency of the ignition temperature on irradiation heat flux. In some cases, extremum ignition temperatures have been observed.
Quintiere and co-worders (Spearpoint and Quintiere, 2001; Boonmee and Quintiere, 2005; Boonmee, 2004) experimentally studied the ignition of wood species at external heat flux that varied between 10 and 75 kW/m
2. An interesting trend that one may notice in the work of Quintiere et al. is that the glowing ignition temperature plotted against the external heat flux exhibits a hat-like (~) shape with two distinct local extremums – see
Figure 5 in (Spearpoint and Quintiere, 2001) and
Figure 5(B) in (Boonmee and Quintiere, 2005). The ignition temperature rapidly rises between 10 kW/m
2 and around 20 kW/m
2 where the first extremum is noticeable. It then decreases down to the second extremum beyond which it begins to take off. On the contrary, the flaming ignition decreases monotonically with the incident heat flux.
McAllister and Finney (2017) have reported similar findings who experimented the autoignition of red oak cylinders and disks. The ignition temperature plotted against the heat flux exhibits a hat-like trend for red oak disks whereas the ignition temperature decreases with the heat flux. The authors observed rare signs of smoldering for the disk and significant smoldering with gas phase ignition for the rods. The hat-shape phenomenon can also be observed in the autoignition data of PMMA measured by Kashiwagi (1982) for high heat flux varying between 100 and 200 kW/m2; see Figure 23 his cited article. Kashiwagi (1982) also measured the ignition temperature for red oak and found a decreasing trend with the applied external heat flux. As noted by the author, the red oak ignition at high heat fluxes was due to the volatiles’ ignition.
From the above discussion, the regime of ignition depends on whether the gases released due to the solid decomposition have reached an ignition temperature. The hat-shape phenomenon seems to occur in the absence of gas-phase ignition. To prove this mathematically, a relation will be derived between the ignition temperature and the external heat flux that can explain the above observations using a similar method described in the previous section which led to an expression for the reaction-front temperature, i.e., Eq. (20).
Since experimental studies commonly measure time-to-ignition at a given external heat flux (Moghtaderi et al., 1997b; Spearpoint and Quintiere, 2001; Vermesi et al., 2017; Boonmee and Quintiere, 2005; Boonmee, 2004; McAllister and Finney, 2017), such measurements may then be integrated with the expression obtained from the formulation described in
Section 2.1; i.e., Eq. (8). This treatment allows to eliminate the time-to-ignition,
tig, and to establish an explicit relation between the ignition temperature and the external heat flux. The measured
tig vs
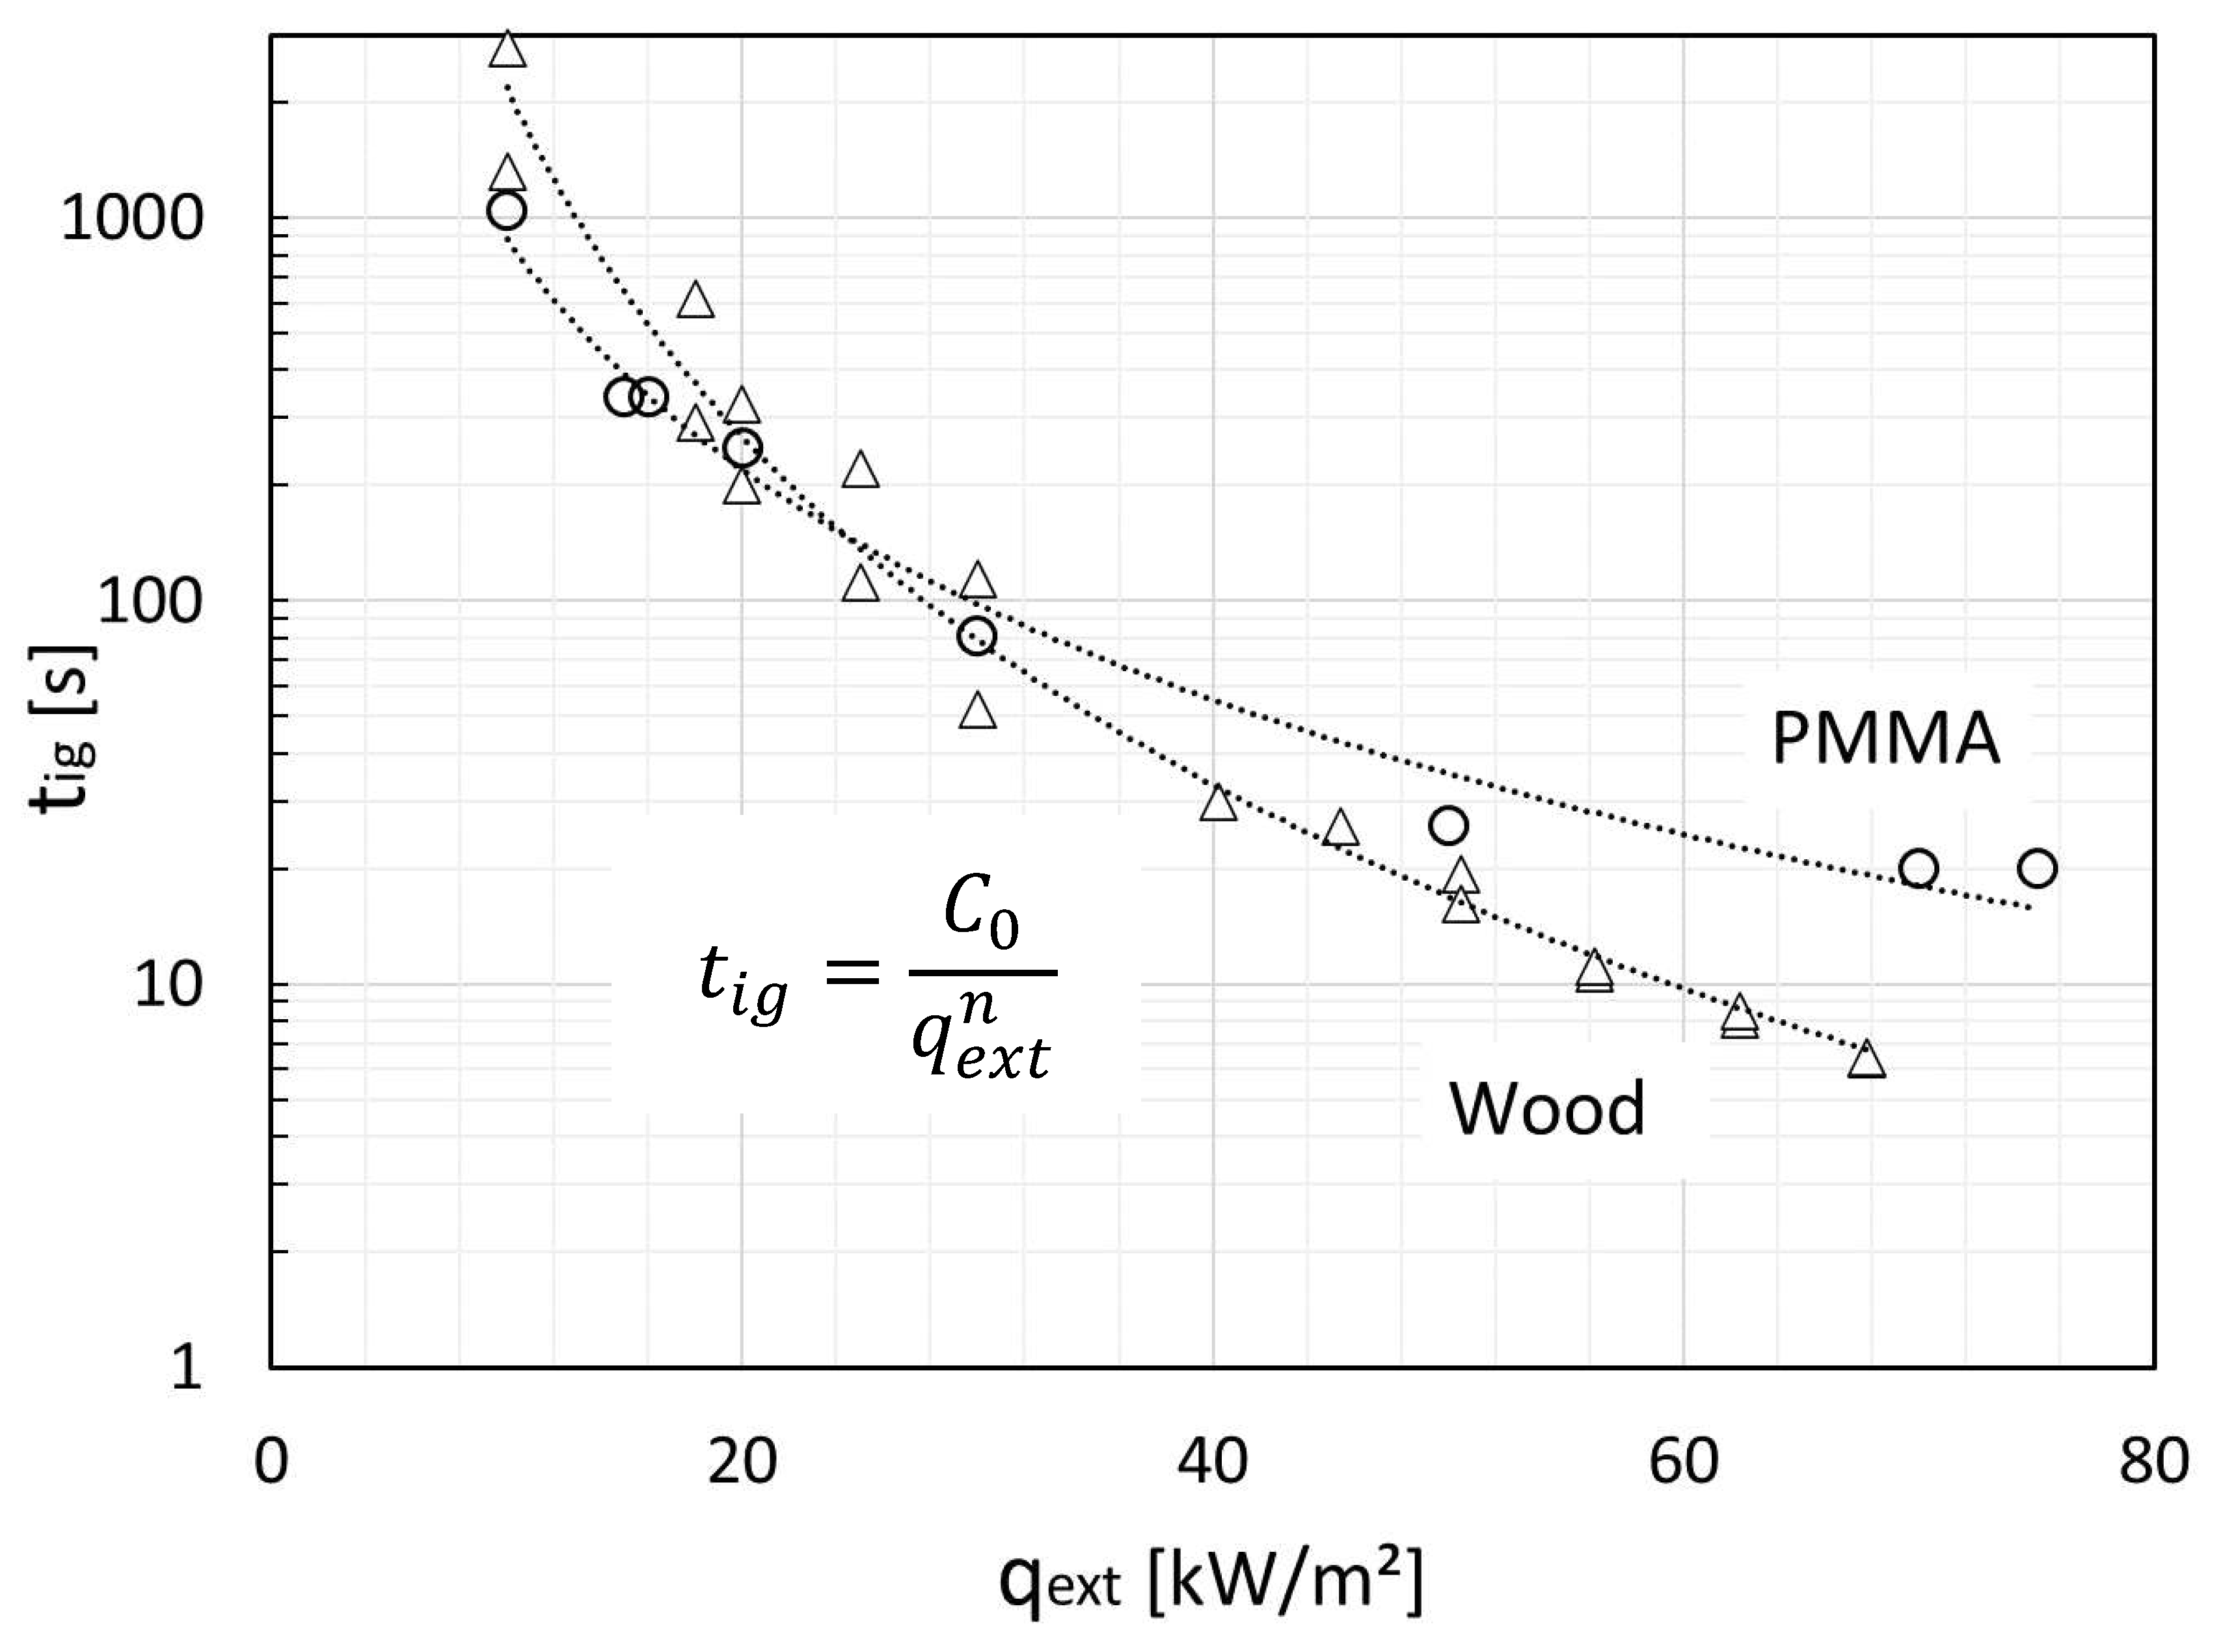
qext data may best be fitted by a power function. An example is shown in
Figure 6 which plots the measured ignition data of wood and PMMA extracted from (Boonmee and Quintiere, 2005; Boonmee, 2004; Quintiere, 2019), and the trendline fitting the data that obeys
where is a correlation constant which is material dependent and n is an exponent coefficient (n = 2 for the PMMA and n = 3 for the wood).
To incorporate Eq. (28) into Eq. (8), it would then be unsuitable to use the dimensionless temperature defined in Eq. (2) so both the reaction temperature and heat flux in Eq. (8) are presented in a normalized form. Thus,
where
,
, and
.
Substituting Eqs. (5) and (28) into Eq. (29) and rearranging for
yields
Equation (30) states that the normalized ignition temperature is a function of
,
, and the dimensionless parameter
that depends on the thermophysical properties. It is to be noted that Eq. (30) is obtained assuming that the solid will remain inert until the ignition. For identical initial and surrounding temperature,
, we have
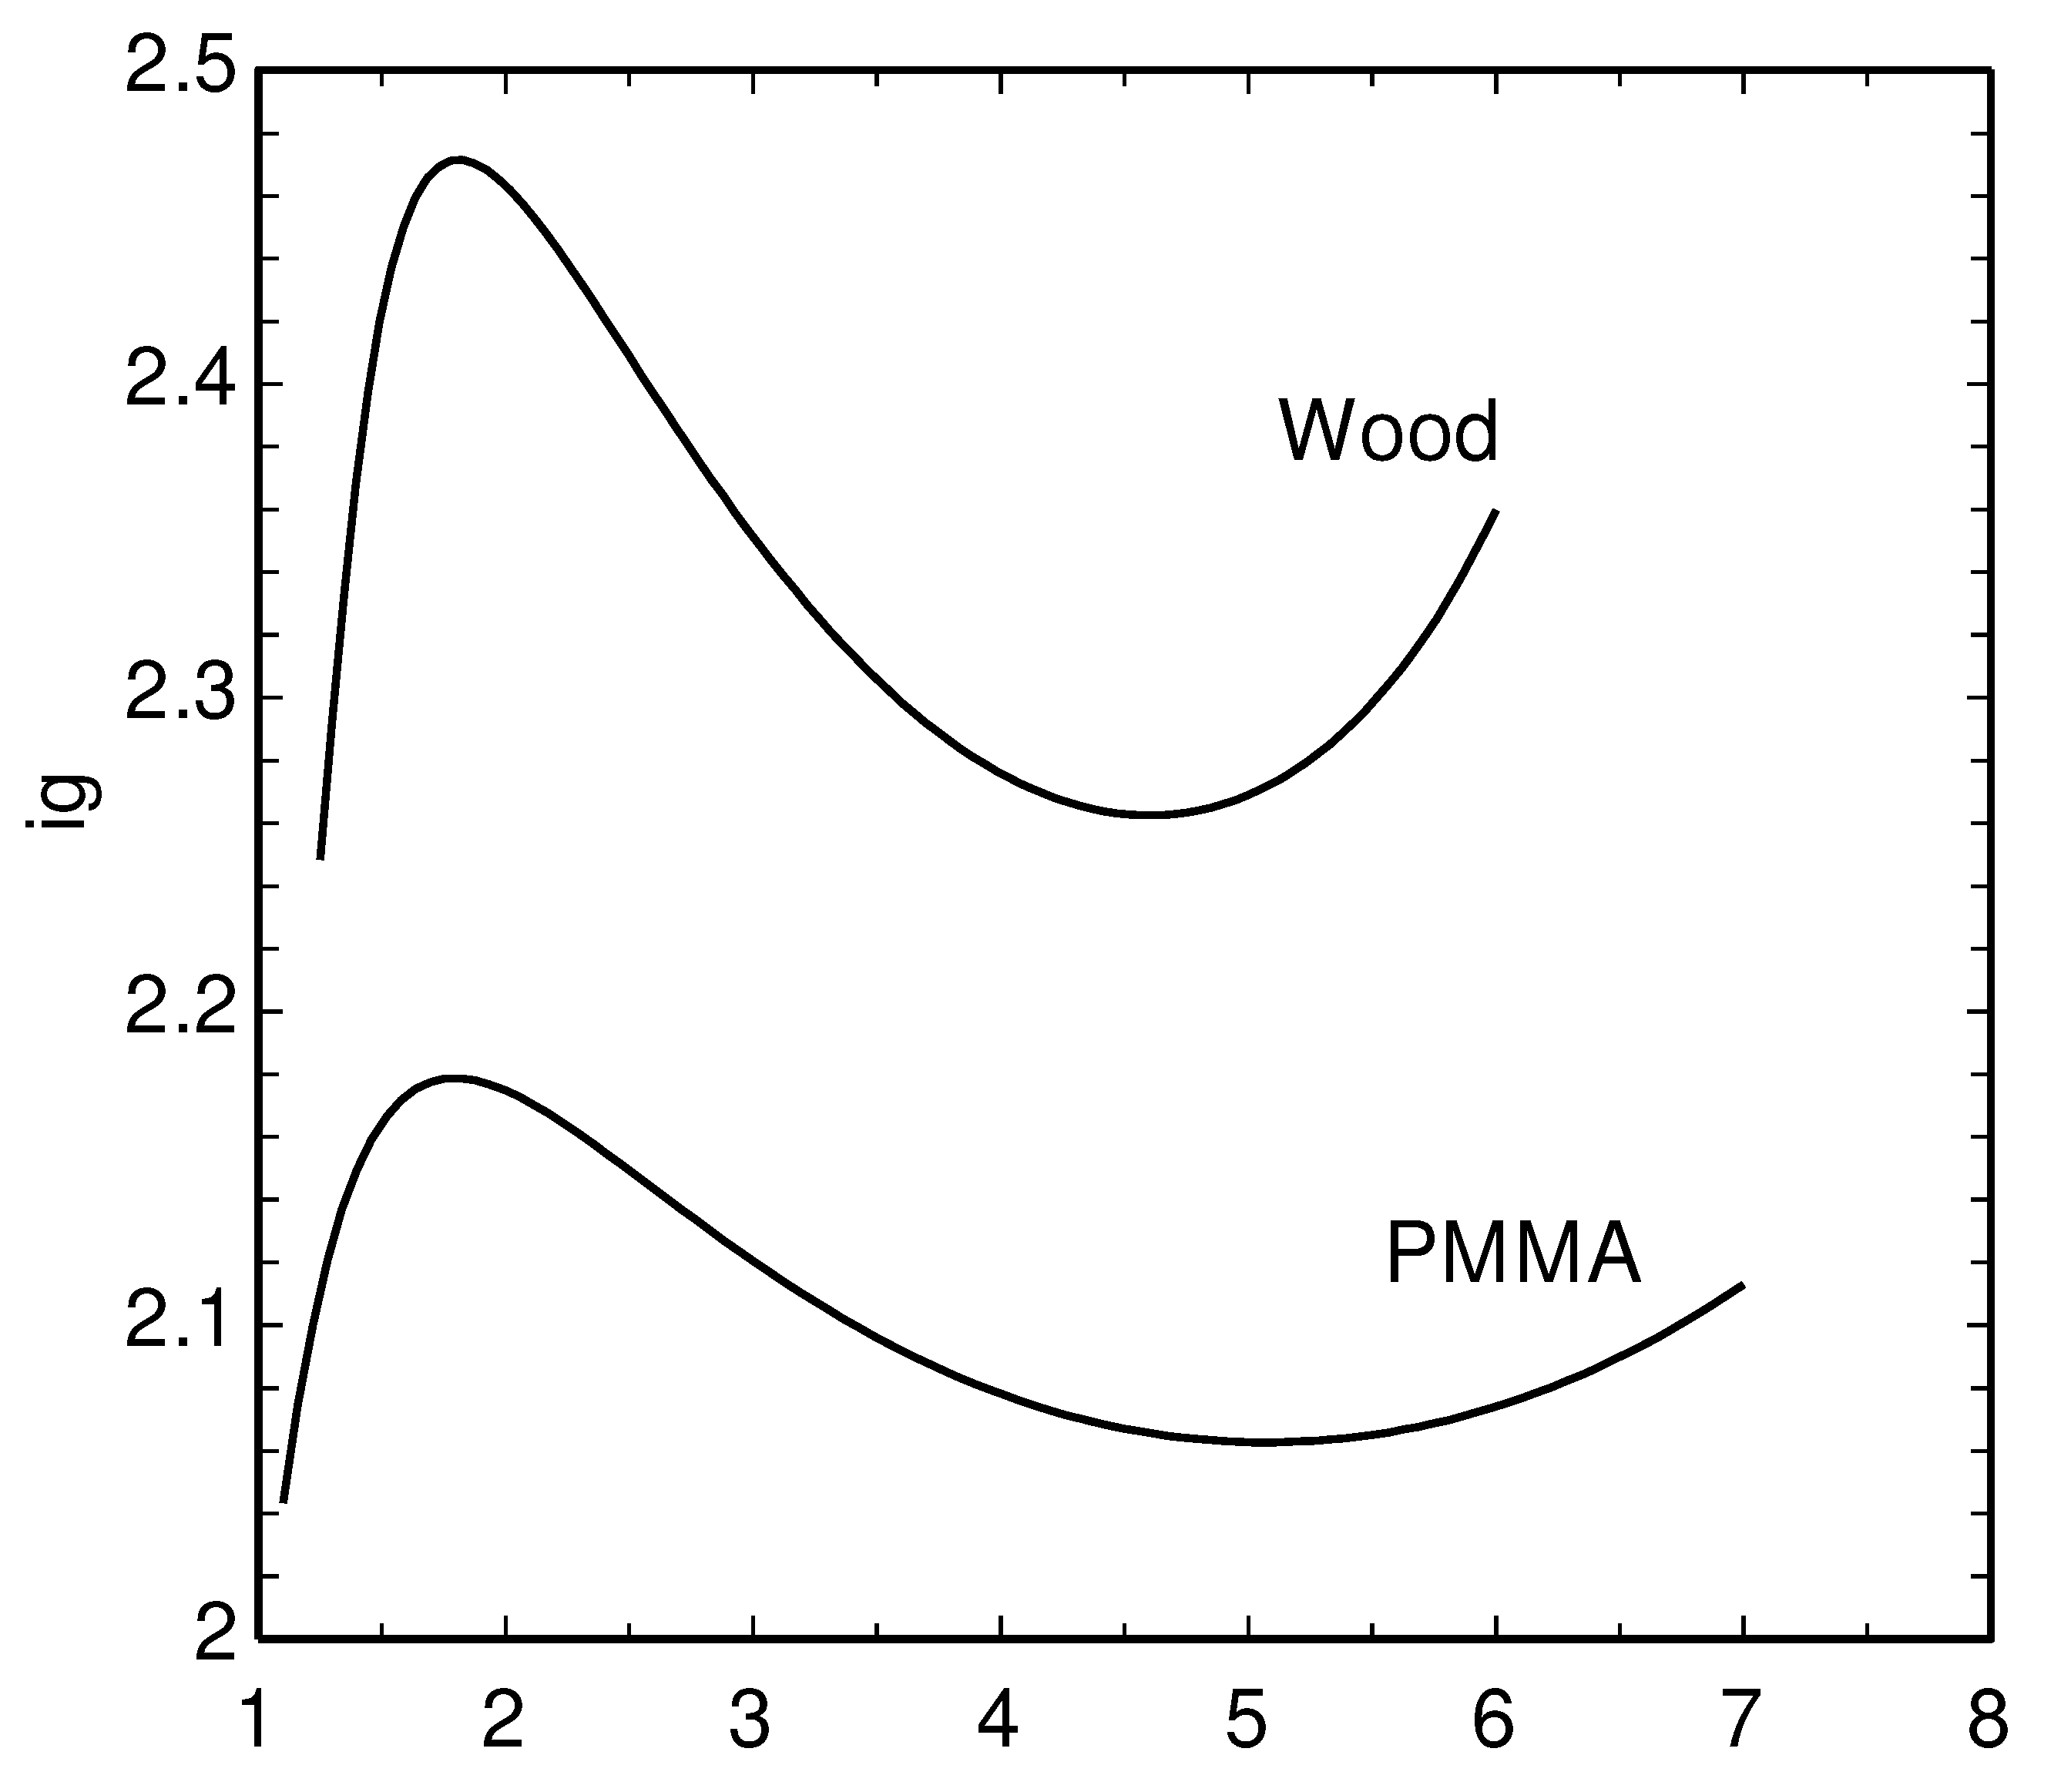
Figure 7 shows the predicted ignition temperature for wood and PMMA. The hat-like (~) trend is qualitatively the same as that observed in past studies (Spearpoint and Quintiere, 2001; Kashiwagi, 1982; Boonmee and Quintiere, 2005; Boonmee, 2004; McAllister and Finney, 2017). The ignition temperature possesses a maximum value at a low heat flux. It then decreases gradually with a further increase in the heat flux and attains a local minimum at a high heat flux. For the PMMA, the extremum temperatures in
Figure 7 are
and
that occur at
and
, respectively. For the wood, the local maximum and minimum temperatures are
2.47 and 2.26 that take place at
1.78 and 4.61, respectively. Note that the ignition temperatures are higher for wood than PMMA at identical normalized heat fluxes; an observation that is consistent with experimental observations of Kashiwagi (1979, 1982).
At high heat fluxes, the
exp term in Eq. (33) is sufficiently small so one may apply the relation
(valid for
) and rewrite it as follows.
Solving
leads to
Equation (35) provides an estimation of the normalized heat flux at the second extremum temperature (the local minimum). Calculating the second derivative of
at
yields
where
,
, and
. Parameter
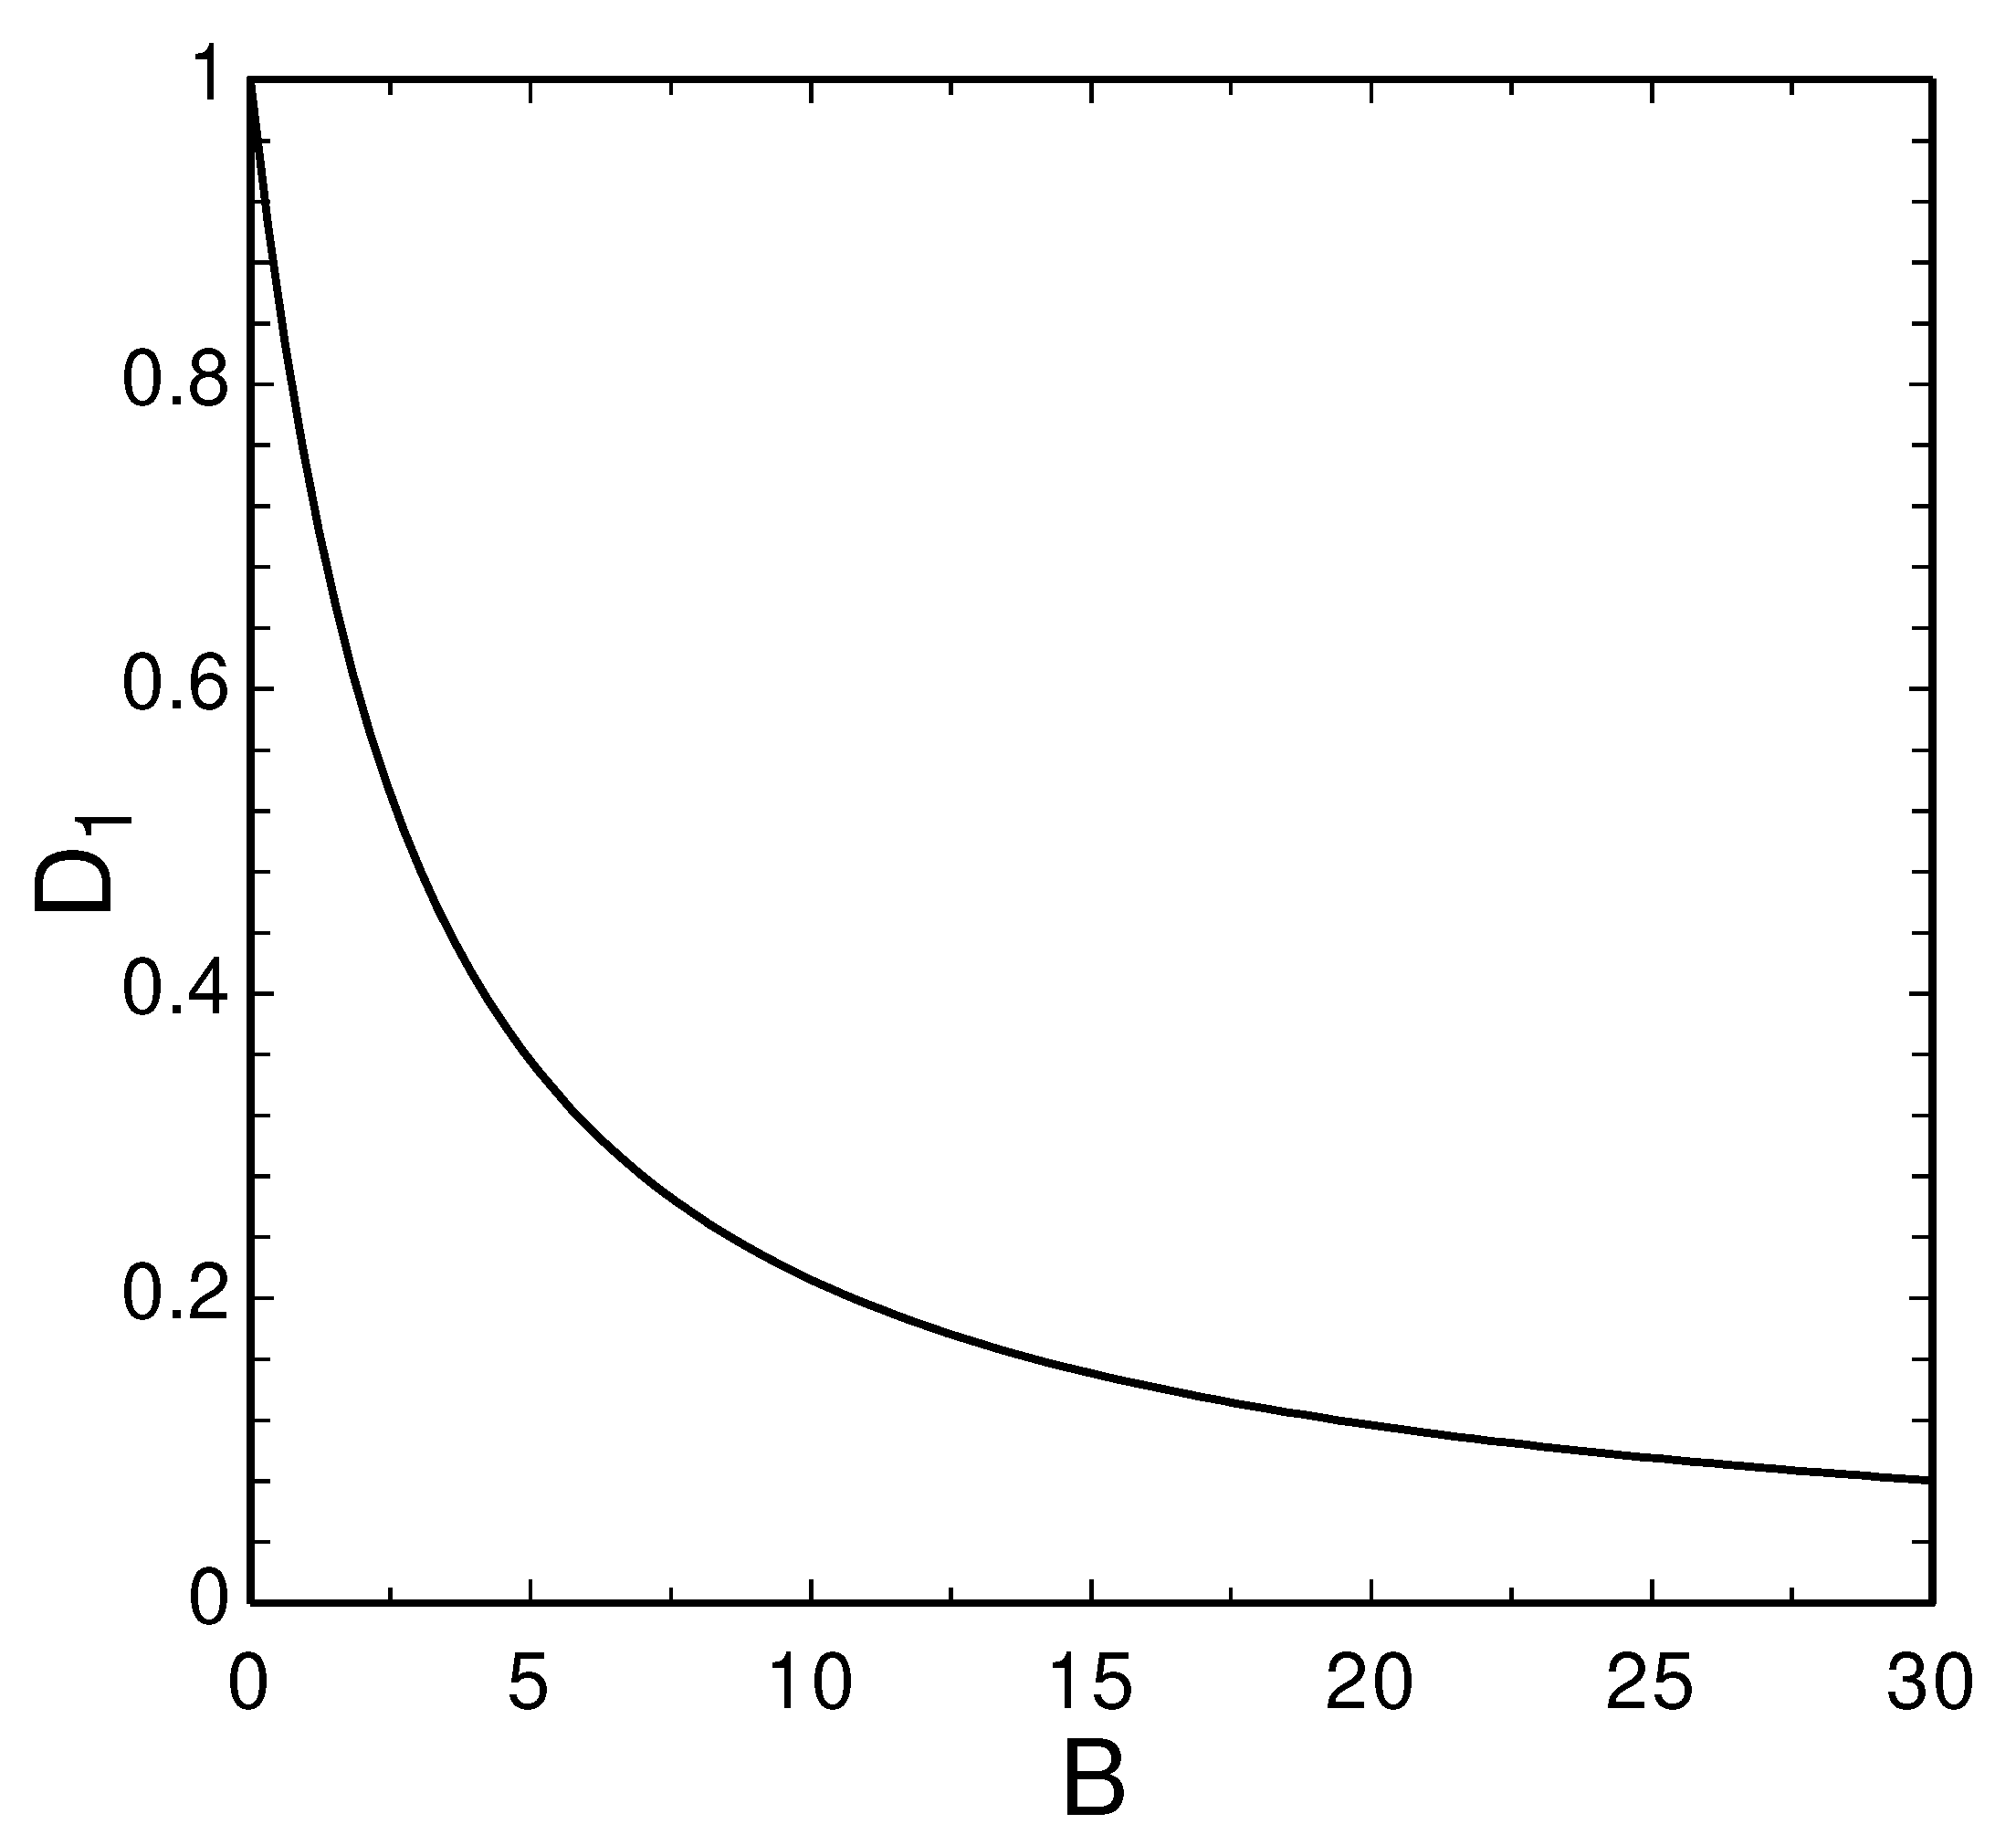
defined in Eq. (32) is a decreasing function of
as depicted in
Figure 8 which shows that
. It can be inferred from Eq. (32) that for
approaching 0,
. It may then be concluded that the right side of Eq. (36) is positive; that is, the heat flux given in Eq. (35) is a local minimum.
Substituting Eq. (35) into Eq. (34), we find
On the other hand, a combination of Eqs. (35) and (37) allows to establish a relation between
and
at the local minimum.
Equation (38) states that the ignition temperature at the local minimum will be higher if the corresponding optimum heat flux is higher. For PMMA with the Biot number of 0.325 (Quintiere, 2019), we have
, and
, which on substituting in Eqs. (35) and (38) yields
and
. These figures are reasonably close to the normalized ignition temperature of
and the normalized heat flux of 4.89 at the location of the second extremum in
Figure 7. On the other hand, for wood the Biot number is 0.631 so
and
. The optimum heat flux and the local minimum ignition temperature obtained from Eqs. (35) and (38) are
and
which compare well with the respected quantities
and
in
Figure 7.
To examine the effect of the Biot number and the new property
, Eq. (33) is used to produce
vs
profiles at different values of
and
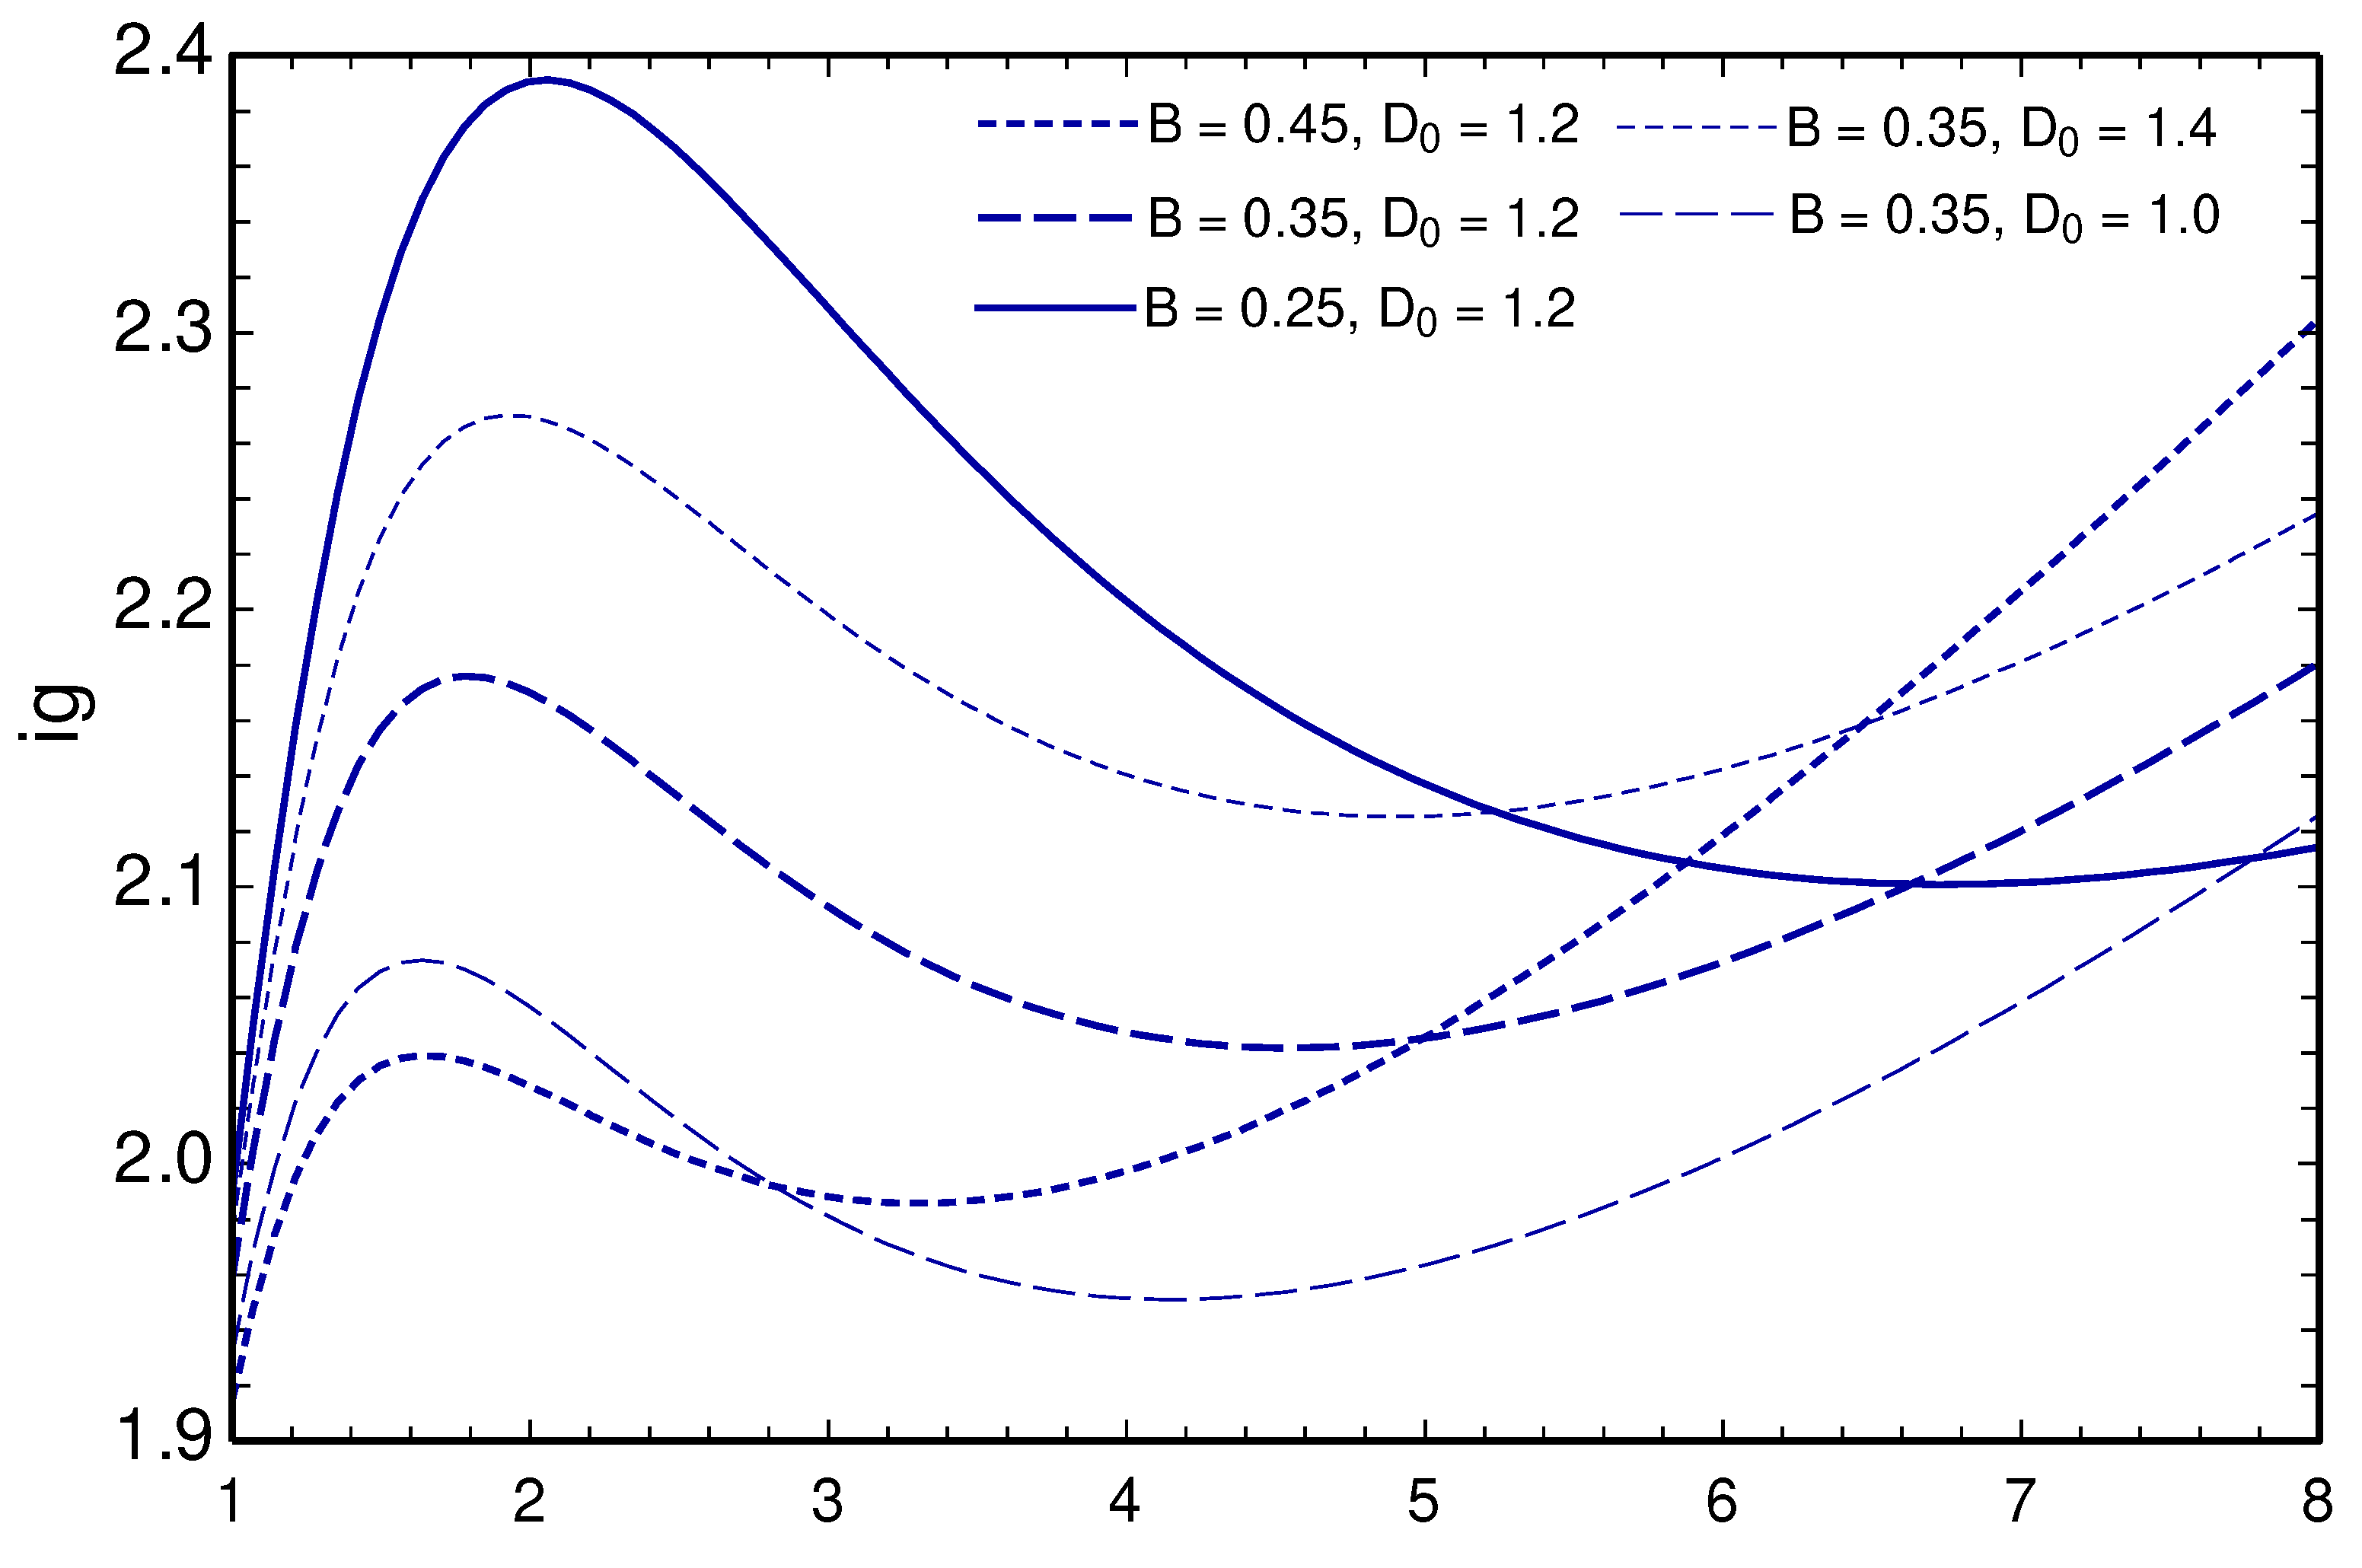
. The results are depicted in
Figure 9. As the Biot number increases, both extremums occur at a lower heat flux whereas the first extremum temperature decreases but that of the second extremum (the local minimum) increases. For low heat fluxes
, the ignition temperature is lower at a higher Biot number. However, this trend is opposite at high heat fluxes
so the ignition temperature may rise with an increase in the Biot number. On the other hand, the ignition temperature is predicted to increase by increasing
nearly uniformly over the range of
shown in
Figure 9. Both extremums shift toward a higher heat flux at a greater
, and the temperature plateau discussed previously is visible in all cases.
6. Conclusions
This study investigated the reaction-front and ignition temperatures of thermally decomposing solids by means of analytical formulation. The method includes eliminating time through incorporating an empirical relation between the process time and applied external heat flux in the model. Explicit expressions are derived for the pyrolysis-front and ignition temperatures i.e., Eqs. (20) and (33), as well as the extremum temperatures, i.e., Eqs. (26) and (37), as a function of the external heat flux and Biot number. The results show that the pyrolysis-front-temperature also depends noticeably on the thermal conductivity ratio () whereas the ignition temperature is found to be dependent on a new property, , defined in Eq. (31). The pyrolysis-front temperature is found to possess a maximum at an external heat flux of 91.5 kW/m2. On the other hand, the ignition temperature exhibits a local maximum at a low heat flux and a local minimum at a higher heat flux – the hat-like trend. These extremum ignition temperatures have experimentally been observed in some past studies where ignition occurred in the absence of the gas phase reaction. It may be concluded that the hat-like phenomenon represents an ignition mode in that no or negligible volatiles oxidation takes place. Including solid and volatiles combustion in the ignition model could help explain other ignition modes. Further experimental studies are needed to examine the proposed method over a wider range of external heat flux and solid material.
Disclosure Statement
The authors report there are no competing interests to declare.
Nomenclature
|
Coefficients of Eq. (20) |
|
Biot number |
|
Specific heat ratio () |
|
|
|
Correlation constant in Eq. (35), W2.s/m2
|
| cp |
Specific heat, J/kg.K |
|
Dimensionless parameters in Eq. (30) |
| d |
Diameter of pore, m |
| h |
Heat transfer coefficient, W/m2.K |
| k |
Thermal conductivity, W/m.K |
|
Thermal conductivity ratio () |
|
Effective thermal conductivity, W/m.K |
|
Dimensionless reaction enthalpy () |
| n |
Correlation coefficient, Eq. (36) |
|
External heat flux, W/m2
|
|
Heat capacity ratio () |
| T |
Temperature, K |
| t |
Time, sec |
| x |
Position, m |
| Greek Letters |
|
Dimensionless reaction front depth |
|
|
Dimensionless thermal penetration depth |
|
|
Porosity of char |
|
|
Normalized temperature () |
|
|
Dimensionless temperature defined in Eq. (2) |
|
|
|
|
|
Dimensionless position |
|
|
Solid density, kg/m3
|
|
|
Density ratio () |
|
|
Stefan-Boltzmann constant |
|
|
Dimensionless time () |
|
|
Dimensionless reaction time |
|
|
Normalized heat flux () |
|
|
Emissivity |
|
| Subscripts |
|
|
Surrounding |
|
| c |
Char |
|
| i |
Initial |
|
| ig |
Ignition |
|
| r |
Reaction |
|
| s |
Surface |
|
| v |
Volatiles |
|
References
- Atreya, A. Olszewski, P. Chen, Y. and Baum, H. R. 2017. The effect of size, shape and pyrolysis conditions on
the thermal decomposition of wood particles and firebrand. Int. J. Heat Mass. 107: 319-328. [CrossRef]
- Babrauskas, V. 2001. Ignition of wood: A review of the state of the art. in: Interflam 2001, Interscience
Communications Ltd., London, pp. 71-88.
- Bartlett, A. I. Hadden, R. M. and Bisby, L. A. 2019. A review of factors affecting the burning behaviour of wood
for application to tall timber construction. Fire Technol. 55: 1-49. [CrossRef]
- Biot, M. A. 1957. New methods in heat flow analysis with application to flight structures. J. Aeronaut. Sci. 24: 857-
873. [CrossRef]
- Boonmee, N. and Quintiere, J. G. 2002. Glowing and flaming autoignition of wood. Proc. Combust. Inst. 29: 289-
296.
- Boonmee, N. 2004. Theoretical and experimental study of autoignition of wood. PhD diss., University of
Maryland, College Park.
- Boonmee, N. and Quintiere, J. G. 2005. Glowing ignition of wood: the onset of surface combustion. Proc. Combust.
Inst. 30: 2303-2310. [CrossRef]
- Chen, Y. Delichatios, M. A. and Motevalli, V. 1993. Material pyrolysis properties, Part I: an integral model for
one-dimensional transient pyrolysis of charring and non-charring materials. Combust. Sci. Technol. 88: 309-328.
- Dakka, S. M. Jackson, G. S. and Torero, J. L. 2002. Mechanisms controlling the degradation of poly(methyl
methacrylate) prior to piloted ignition. Proc. Combust. Inst. 29: 281-287. [CrossRef]
- Fatehi, H. Weng, W. Costa, M. Li, Z. Rabaçal, M. Aldén M. and Bai, X. S. 2019. Numerical simulation of ignition
mode and ignition delay time of pulverized biomass particles. Combust. Flame 206: 400-410.
- Fatehi, H. Weng, W. Li, Z. Bai, X. S. and Aldén M. 2021. Recent development in numerical simulations and
experimental studies of biomass thermochemical conversion. Energy Fuels 35: 6940-6963. [CrossRef]
- Galgano, A. and Di Blasi, C. 2003. Modeling wood degradation by the unreacted-core-shrinking approximation.
Ind. Eng. Chem. Res. 42: 2101-2111.
- Galgano, A. and Di Blasi, C. 2005. Infinite versus finite rate kinetics in simplified models of wood pyrolysis.
Combust. Sci. Technol. 177: 279-303.
- Gómez, M. A. Porteiro, J. Chapela, S. and Míguez J. L. 2018. An Eulerian model for the simulation of the thermal
conversion of a single large biomass particle. Fuel 22: 671-681. [CrossRef]
- Haseli, Y. van Oijen, J. A. and de Goey, L. P. H. 2011a. Numerical study of the conversion time of single
pyrolyzing biomass particles at high heating conditions. Chem. Eng. J. 169: 299-312.
- Haseli, Y. van Oijen, J. A. and de Goey, L. P. H. 2011b. Modeling biomass particle pyrolysis with temperature
dependent heat of reactions. J. Anal. Appl. Pyrol. 90: 140-154. [CrossRef]
- Haseli, Y. van Oijen, J. A. and de Goey, L. P. H. 2011c. A detailed one-dimensional model of combustion of a
woody biomass particle. Bioresource Technol. 102: 9772-9782.
- Haseli, Y. van Oijen, J. A. and de Goey, L. P. H. 2012a. A simplified pyrolysis model of a biomass particle based
on infinitesimally thin reaction front approximation. Energy Fuels 26: 3230-3243.
- Haseli, Y. van Oijen, J. A. and de Goey, L. P. H. 2012b. Predicting the pyrolysis of single biomass particles based
on a time and space integral method. J. Anal. Appl. Pyrol. 96: 126-138. [CrossRef]
- Haseli, Y. van Oijen, J. A. and de Goey, L. P. H. 2013a. A quasi-steady analysis of oxy-fuel combustion of a wood
char particle. Combust. Sci. Technol. 185: 533-547.
- Haseli, Y. van Oijen, J. A. and de Goey, L. P. H. 2013b. Reduced model for combustion of a small biomass particle
at high operating temperatures. Bioresource Technol. 131: 397-404. [CrossRef]
- Haseli, Y. and Naterer, G. F. 2022. Transient heat conduction in a planar slab with convection and radiation
effects. J. Heat Transf. 144: 121401.
- He, F. and Behrendt, F. 2011. A new method for simulating the combustion of a large biomass particle-A
combination of a volume reaction model and front reaction approximation. Combust. Flame 158: 2500-2511. [CrossRef]
- Hernández, N. Fuentes, A. Reszka P. and Fernández-Pello, A.C. 2019. Piloted ignition delay times on optically
thin PMMA cylinders. Proc. Combust. Inst. 37:3993-4000. [CrossRef]
- Kashiwagi, T. 1979. Experimental observation of radiative ignition mechanisms. Combust. Flame 34: 231-244. [CrossRef]
- Kashiwagi, T. 1981. Radiative ignition mechanism of solid fuels. Fire Saf. J. 3: 185-200. [CrossRef]
- Kashiwagi, T. 1982. Effects of sample orientation on radiative ignition. Combust. Flame 44: 223-245. [CrossRef]
- Lu, H. Ip, E. Scott, J. Foster, P. Vickers, M. and Baxter, L. L. 2010. Effects of particle shape and size on
devolatilization of biomass particle. Fuel 89: 1156-1168. [CrossRef]
- Lu, L. Gao, X. Shahnam, M. and Rogers, W. A. 2020. Bridging particle and reactor scales in the simulation of
biomass fast pyrolysis by coupling particle resolved simulation and coarse grained CFD-DEM. Chem. Eng. Sci.
216: 115471. [CrossRef]
- Lu, L. Gao, X. Shahnam, M. and Rogers, W. A. 2021. Simulations of biomass pyrolysis using glued-sphere CFDDEM
with 3-D intra-particle models. Chem. Eng. J. 419: 129564. [CrossRef]
- McAllister, S. and Finney, M. 2017. Autoignition of wood under combined convective and radiative heating.
Proc. Combust. Inst. 36: 3073-3080. [CrossRef]
- Mikkola, E. and Wichman, I. S. 1989. On the thermal ignition of combustible materials. Fire Mater. 14: 87-96. [CrossRef]
- Milosavljevic, I. Oja, V. and Suuberg, E. M. 1996. Thermal effects in cellulose pyrolysis: relationship to char
formation processes. Ind. Eng. Chem. Res. 35: 653-662. [CrossRef]
- Moghtaderi, B. Novozhilov, V. Fletcher, D. and Kent, J. H. 1997a. An integral model for the transient pyrolysis
of solid materials. Fire Mater. 21: 7-16. [CrossRef]
- Moghtaderi, B. Novozhilov, V. Fletcher, D. and Kent, J. H. 1997b. A new correlation for bench-scale piloted
ignition data of wood. Fire Saf. J. 29: 41-59. [CrossRef]
- Parot, R. Rivera, J. I. Reszka, P. Torero, J. L. and Fuent, A. 2022. A simplified analytical model for radiation
dominated ignition of solid fuels exposed to multiple non-steady heat fluxes. Combust. Flame 237: 111866. [CrossRef]
- Park, W. C. Atreya, A. and Baum, H. R. 2009. Determination of pyrolysis temperature for charring materials.
Proc. Combust. Inst. 32: 2471-2479. [CrossRef]
- Park, W. C. Atreya, A. and Baum, H. R. 2010. Experimental and theoretical investigation of heat and mass
transfer processes during wood pyrolysis. Combust. Flame 157: 481-494. [CrossRef]
- Pecha, M. B. Ramirez, E. Wiggins, G. M. Carpenter, D. Kappes, B. Daw, S. and Ciesielski, P. N. 2018. Integrated
particle- and reactor-scale simulation of pine pyrolysis in a fluidized bed. Energy Fuels 32: 10683-10694. [CrossRef]
- Peters, B. and Bruch, C. 2003. Drying and pyrolysis of wood particles: experiments and simulation. J. Anal. Appl.
Pyrol. 70: 233-250. [CrossRef]
- Quintiere, J. G. 2019. Approximate solutions for the ignition of a solid as a function of the Biot number. Fire
Mater. 43: 57-63. [CrossRef]
- Rhodes, B. T. and Quintiere, J. G. 1996. Burning rate and flame heat flux for PMMA in a cone calorimeter. Fire
Saf. J. 26: 221-240. [CrossRef]
- Shafizadeh, F. and Chin, P. P. S. 1977. Thermal deterioration of wood. in: I. S. Goldstein (Ed.), Wood Technology:
Chemical Aspects, ACS Symposium Series, 57-81.
- Spearpoint, M. J. and Quintiere, J. G. 2000. Predicting the burning of wood using an integral model. Combust.
Flame 123: 308-324. [CrossRef]
- Spearpoint, M. J. and Quintiere, J. G. 2001. Predicting the piloted ignition of wood in the cone calorimeter using
an integral model-effect of species, grain orientation and heat flux. Fire Saf. J. 36: 391-415. [CrossRef]
- Torero, J. L. Gerhard, J. I. Martins, M. F. Zanoni, M. A. B. Rashwan, T. L. Brown, J. K. 2020. Processes defining
smouldering combustion: Integrated review and synthesis. Prog. Energy Combust. Sci. 81: 100869. [CrossRef]
- Vermesi, I. DiDomizio, M. J. Richter, F. Weckman, E. J. and Rein, G. 2017. Pyrolysis and spontaneous ignition of
wood under transient irradiation: Experiments and a-priori predictions. Fire Saf. J. 91: 218-225. [CrossRef]
- Wan, K. Zhihu, K. Wang, He, Y. Xia, J. Zhou, Z. Zhou, J. and Cen, K. 2015. Experimental and modeling study of
pyrolysis of coal, biomass and blended coal-biomass particles. Fuel 139: 356-364. [CrossRef]
- Wichman, I. S. and Atreya, A. 1987. A simplified model for the pyrolysis of charring materials. Combust. Flame
68: 231-247. [CrossRef]
- Yang, L. Chen, X. Zhou, X. and Fan, W. 2003. The pyrolysis and ignition of charring materials under an external
heat flux. Combust. Flame 133: 407-413. [CrossRef]
- Zhao, P. García, A. and Burton, T. 2022. Initiation and propagation of curved reaction front in solids: Insights
into solid combustion and battery thermal runaway. Combust. Flame 238: 111951. [CrossRef]
Figure 1.
The temperature profile and the boundary conditions at various stages of decomposition of a thermally thin solid particle. denotes the thermal penetration depth and is the position of the reaction front. Tb and Ts denote back face and surface temperatures, respectively.
Figure 1.
The temperature profile and the boundary conditions at various stages of decomposition of a thermally thin solid particle. denotes the thermal penetration depth and is the position of the reaction front. Tb and Ts denote back face and surface temperatures, respectively.
Figure 2.
Comparison of the predicted (line) and measured (symbols) mass loss history of 0.32-mm pyrolyzing sawdust particle. Note that the predicted is a function of where the final mass loss corresponds to .
Figure 2.
Comparison of the predicted (line) and measured (symbols) mass loss history of 0.32-mm pyrolyzing sawdust particle. Note that the predicted is a function of where the final mass loss corresponds to .
Figure 3.
Comparison of the pyrolysis time of spruce and beech particles predicted by Eq. (12) and a detailed pyrolysis model (Haseli et al., 2011a) at varying particle size and an external heat flux of 100 kW/m2. A reaction-front temperature of 700 K is employed in Eq. (12). The pyrolysis time computed by the detailed model can also be found in Haseli et al. (2012b).
Figure 4.
Char density and reaction time of pyrolyzing spruce particles predicted by a detailed pyrolysis model (Haseli et al., 2011a). Particle size: 1 mm.
Figure 4.
Char density and reaction time of pyrolyzing spruce particles predicted by a detailed pyrolysis model (Haseli et al., 2011a). Particle size: 1 mm.
Figure 5.
Pyrolysis-front temperature of single spruce particles obtained from the combination of the published results (Haseli et al., 2011a) and the present model. (a) reaction temperature vs external heat flux, (b) dimensionless reaction temperature vs dimensionless heat flux. (c) and (d) dimensionless reaction front temperature varying with thermal conductivity ratio and specific heat ratio at an external heat flux of 80 kW/m2.
Figure 6.
Typical measured time-to-ignition data of PMMA and wood against the applied external heat flux and the power-law trendline fitting the data. W2.s/m2 and n = 2 for PMMA, W3.s/m3 and n = 3 for wood. Data are extracted from (Boonmee and Quintiere, 2005; Boonmee, 2004) for wood and (Quintiere, 2019) for PMMA.
Figure 7.
Comparison of the predicted ignition temperature for wood and PMMA.
Figure 7.
Comparison of the predicted ignition temperature for wood and PMMA.
Figure 8.
The graphical dependence of the parameter on the Biot number.
Figure 8.
The graphical dependence of the parameter on the Biot number.
Figure 9.
The effect of Biot number and the dimensionless parameter on the ignition temperature (n = 2).
Figure 9.
The effect of Biot number and the dimensionless parameter on the ignition temperature (n = 2).
Table 1.
Thermophysical properties employed in the calculations of sawdust pyrolysis.
Table 1.
Thermophysical properties employed in the calculations of sawdust pyrolysis.
| Parameter |
Quantity |
Unit |
Source |
| Thermal conductivity |
k = 0.11
kc = 0.07
kv = 0.026 |
W/m.K |
Lu et al. (2010) |
| Density |
ρ = 650
ρc = 33 |
kg/m3
|
| Pore diameter |
ds = 50
dc = 100 |
μm |
| Porosity |
= 0.4 |
- |
| Initial temperature |
300 |
K |
| Surrounding temperature |
1625 |
K |
| Convective heat transfer coefficient |
10 |
W/m2.K |
Rhodes and Quintiere (1996); Parot et al. (2022) |
| Reaction time (measured) |
0.355 |
s |
Lu et al. (2010) |
| Reaction time (predicted) |
0.364 |
s |
Eq. (12) |
Table 2.
Properties of dry spruce wood (Peters and Bruch, 2003).
Table 2.
Properties of dry spruce wood (Peters and Bruch, 2003).
| Property |
Quantity |
Unit |
| Thermal conductivity |
0.35 |
W/m.K |
| Density |
450 |
kg/m3
|
| Surface emissivity |
0.9 |
- |
| Initial temperature |
300 |
K |
| Surrounding temperature |
400 |
K |
|
Disclaimer/Publisher’s Note: The statements, opinions and data contained in all publications are solely those of the individual author(s) and contributor(s) and not of MDPI and/or the editor(s). MDPI and/or the editor(s) disclaim responsibility for any injury to people or property resulting from any ideas, methods, instructions or products referred to in the content. |
© 2023 by the authors. Licensee MDPI, Basel, Switzerland. This article is an open access article distributed under the terms and conditions of the Creative Commons Attribution (CC BY) license (http://creativecommons.org/licenses/by/4.0/).
