1. Introduction
Emotions are the reflection of a person's mental state through internal signals, such as thoughts and feelings, as well as external ones, including facial expressions, behavior, and language. Despite an interest in the topic that spans back to Aristotle [
1], understanding the function, origin, and manifestation of emotions is an active area of research [
2,
3,
4]. Yet, understanding emotions is a central task faced by professionals across disciplines including medical and mental health specialists, social scientists, and psychologists. Understanding individuals' emotions, especially the negative ones, is crucial to avoid mental health issues and their consequences [
5]. Significant positive and negative events, which can occur at any point in an individual’s life, act as stimuli that derive emotions [
6]. Monitoring emotions on a societal level for instance in response to specific events, such as the introduction of policies or legislation, can help governance to respond effectively and avoid the emergence of elevated negative emotions which might lead to polarization, political disorders, or violence. In this paper, we present a methodology to monitor emotions expressed in social media in response to a specific event and evaluate our framework usign case study demonstrator of the emotional response to the COVID-19 vaccination campaign in the United Arab Emirates (UAE).
The COVID-19 outbreak triggered many public emotions that have been affecting mental health. The virus started around the end of December 2019 in Wuhan, China [
7], followed by its declaration as a pandemic on March 11, 2020, by the World Health Organization [
7]. It is caused by Severe Acute Respiratory Syndrome Coronavirus-2 (SARS-COV-2) and negatively impacts other vital organs such as the brain, heart, liver, pancreas, and kidney [
8,
9,
10]; the virus can also cause stroke [
11] and diabetes [
12,
13,
14,
15]. COVID-19 infected over half a billion people and led to over 6 million deaths globally [
16]. Consequently, countries have imposed precautionary measures to contain it, such as social distancing, travel bans, home confinement, business closures, and vaccination [
16]. These preventive actions effectively reduced the number of infections and deaths during the pandemic [
17,
18]. However, overly firm restrictions can have a negative impact on the personal level, such as loss of income, anxiety, and depression. Such measures can also affect economic and social life across the nation [
19,
20,
21,
22].
A representative survey in the United States was conducted on 5,412 adults to detect mental health issues in the population in response to physical distancing and stay-at-home instructions. Researchers found that the majority showed anxiety/depression symptoms (31%), followed by stressor-related disorder symptoms (26%), and the minority had suicidal thoughts (11%) during the COVID-19 pandemic [
23]. Strict lockdown restrictions have also impacted students’ mental health in France. A study found that most students suffered from high levels of anxiety and stress, followed by major depression and suicidal thoughts [
22]. Hence, detecting public emotions related to introducing precautionary measures or events is essential.
In this paper, we aim to detect emotions, i.e., reflections of the mental state of individuals, from their social media posts. Machine learning and natural language processing methods have been developed to automatically detect the positive, negative, or neutral sentiment of texts produced by individuals, typically in the context of a specific topic such as politics [
24] or COVID-19 [
25]. These approaches, however, only distinguish between broad sentiment classes and make no explicit connection to the mental state of the author. The Canadian National Research Council’s Word-Emotion Association Lexicon (EmoLex) [
26] relates English words to three sentiments (negative, positive, and neutral), and Plutchik’s eight emotions [
27,
28,
29] (joy, fear, anger, anticipation, sadness, surprise, disgust, and trust) aiming, to connect verbal expression to the author’s emotional state. Here, we use EmoLex to predict emotions expressed in posts on social media. Our prediction may inform public institutions in defining strategies to promote mechanisms and respond to public perception according to the expressed emotional state.
Many works investigated the sentiments on social media during COVID-19. Researchers studied the emotions toward COVID-19 [
25,
30,
31,
32,
33,
34,
35] in general, and the COVID-19 vaccine specifically [
36,
37]. Our work is distinct in two ways: first, we predict a fine-grained set of eight emotions grounded in the Psychology literature [
27,
28,
29] rather than coarse (positive vs negative) sentiment. Secondly, while some work analyzed expressions of emotion in response to COVID-19 in general, it has been argued that consideration of a precise target of emotion allows for obtaining both more accurate predictions as well as more useful results [
38,
39]. To the best of our knowledge, we are the first to propose a framework that captures fine-grained emotion in response to specific events, such as the event of vaccine introduction in the UAE. In other words, our framework tackles the emotional states of a population to support medical and mental health specialists, as well as social scientists, and psychologists to understand individuals' emotions, especially the negative ones associated with a specific event during a pandemic. This is with the aim to help governments develop a proactive prevention plan to avoid mental health issues and their consequences, such as awareness campaigns, measures exemptions, and surveys to detect mental health issues in individuals and act accordingly. In this paper, we present a general framework for event-specific emotion prediction with a focus on mental health impact and consider the vaccine event in the UAE as a case study. The main contributions of this work are as follows.
We propose a proactive event-based framework that detects public emotions associated with events such as a pandemic and its related measurements.
We implement our framework based Plutchik’s 11 categories of emotions.
We annotate a twitter dataset with Plutchik’s emotions and make it publicly available for researchers.
We evaluate the mostly used algorithms Random Forest and Logistics Regression for the prediction of tweets motions in terms of time efficiency using accuracy, F-measure, AUC, precision, recall, ROC, and resources utilization.
We demonstrate our framework using the COVID-19 vaccine event.
The rest of the paper is organized as follows.
Section 1.1 reviews the related work. We describe our proposed Event-based Social Media Emotion Detection (ML- SMEmot) framework in
Section 2.
Section 3 presents the UAE COVID-19 emotion detection case study demonstrator of the framework’s implementation, lays out our experiments, and analyzes the results.
Section 4 discusses the principal findings and lessons learned. Finally, we conclude the article with future research directions in
Section 5.
1.1. Related Works
Table 1 presents the works in the literature which focused on predicting emotions and/or sentiments on social media using machine learning [
25,
30,
31,
32,
33,
34,
35,
36,
37,
40,
41]. This is based on the properties of the considered datasets, the emotion detection algorithms used, and the annotation strategy. As shown in the table, to annotate the dataset, [
32,
33,
35,
37] used TextBlob [
42], and [
34] used VADER [
43], without manual validation. Furthermore [
30,
36] annotated the data manually. However, [
25,
31,
40] do not report on their annotation method.
Table 2 presents the emotions and sentiments considered each work. Most of these works [
31,
32,
33,
34,
35,
36,
37] focused on detecting the sentiments (negative, neutral, and/or positive). The rest of the works focused on a few emotions, mainly Fear, Sadness and Anger [
25,
30,
31,
40,
41,
44,
45].
Table 2 shows that no work which considers fine-grained set of 8 emotions and 3 sentiments grounded in the psychology literature, such as Plutchik’s [
2,
27,
28,
29]. In this paper, we address this void. In addition, we propose an event-based framework for emotions’ detection, along with manual annotation.
2. Materials and Methods
2.1. Proposed ML- SMEmot Framework
To detect event-specific emotional states of a population using social media posts, we present a machine learning model-building methodology and evaluation strategy. We discuss challenges in emotion detection and propose a solution that we test in the context of pandemic containment events. Public health professionals, policymakers, and mental health epidemiology researchers can use the framework as a step-by-step guide to detect population emotions on social media whenever an event is introduced by policy decision-makers. They can use our data repository [
46] and machine learning models that we developed for emotion detection.
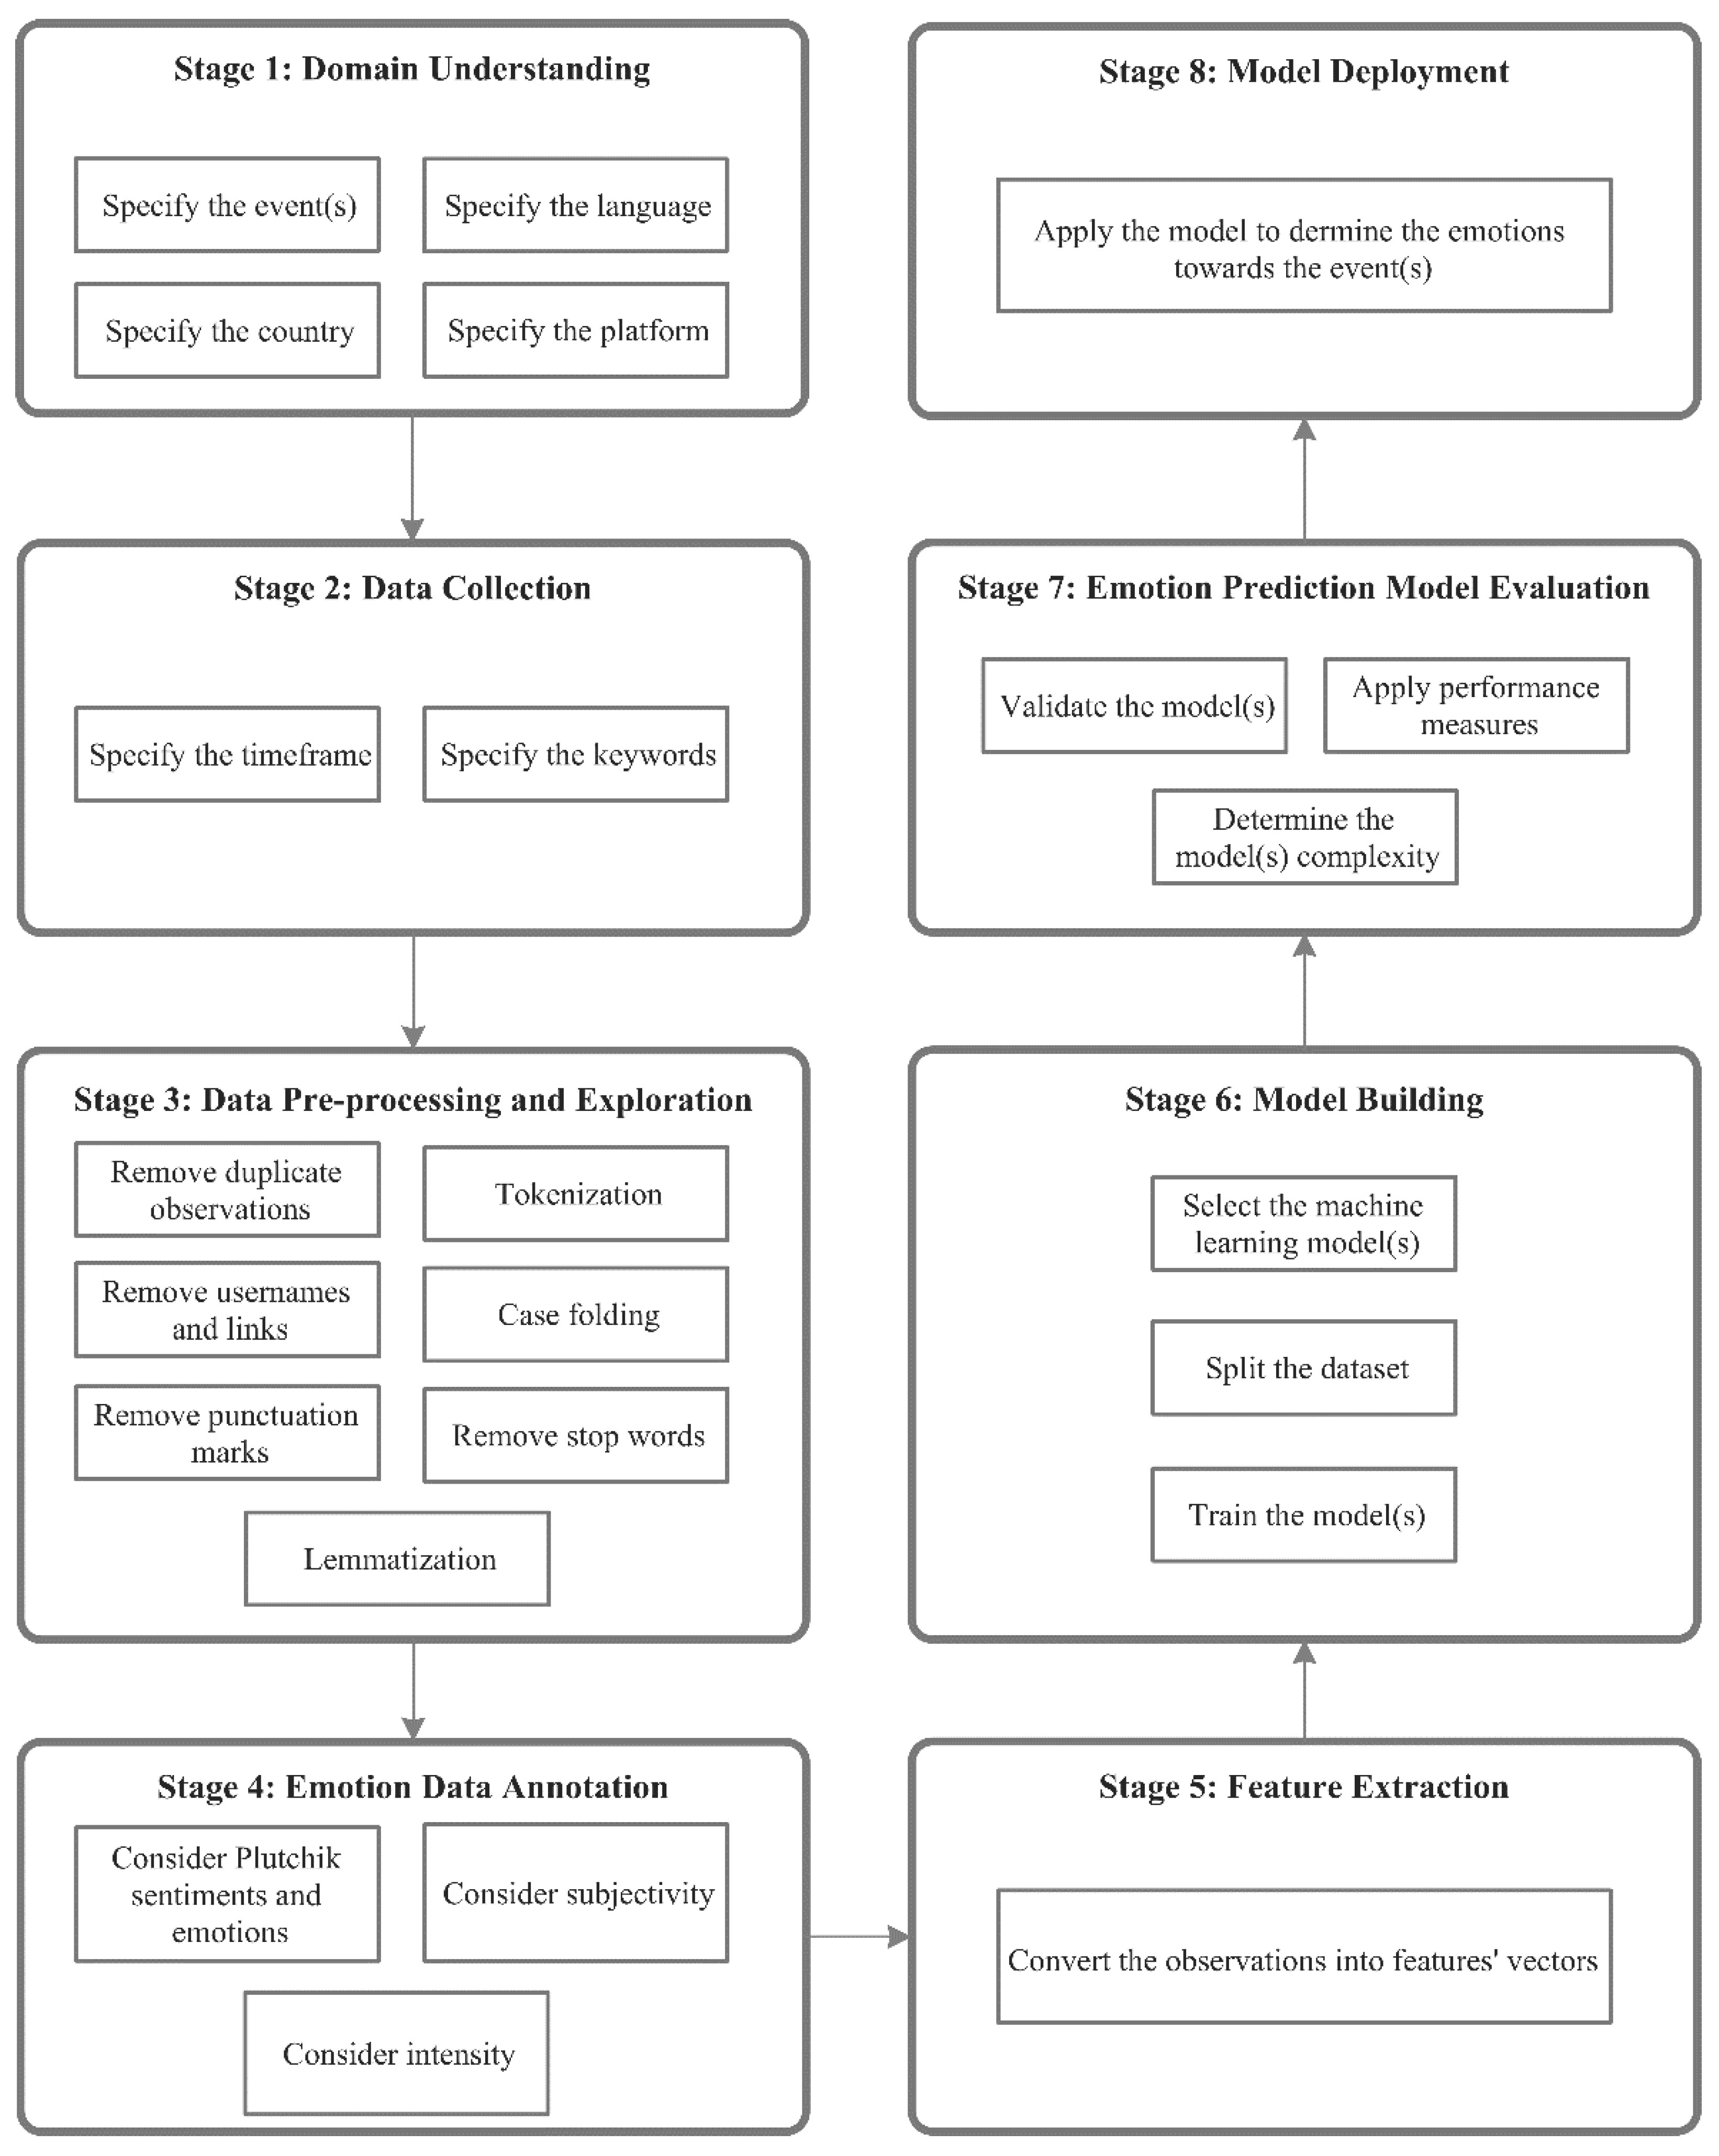
Figure 1 shows our proposed framework. It consists of eight stages: 1) domain understanding, 2) data collection, 3) data pre-processing, 4) data annotation, 5) feature extraction, 6) model building, 7) model evaluation, and 8) model deployment.
The first step in analyzing emotions is to define the problem by specifying the event(s) to be studied in a particular country. Additionally, the language(s) must be specified because the population can express themselves in different languages. Finally, the platform from which the observations (i.e., social media posts) will be extracted must be specified to limit the search. Consequently, the corresponding observations should be extracted based on the time of the event(s) during which it occurred as stated in Equation 1.
where
represents the social media posts in a specific language (L) for a specific country (c),
represent the event's start and end respectively.
There are multiple ways to data collection. Typically, data are obtained by social media platforms' data access APIs, but it may be possible to request it directly from a social media platform or a database owner. During this step, the period related to the event(s) under study must be specified. In addition, a set of keywords related to the event(s) under study must be determined, to extract all and only relevant social media posts. Keywords can be designed in collaboration with domain experts or taken from the prior literature. Social media data can be extracted to a local database or a cloud [
47,
48,
49]
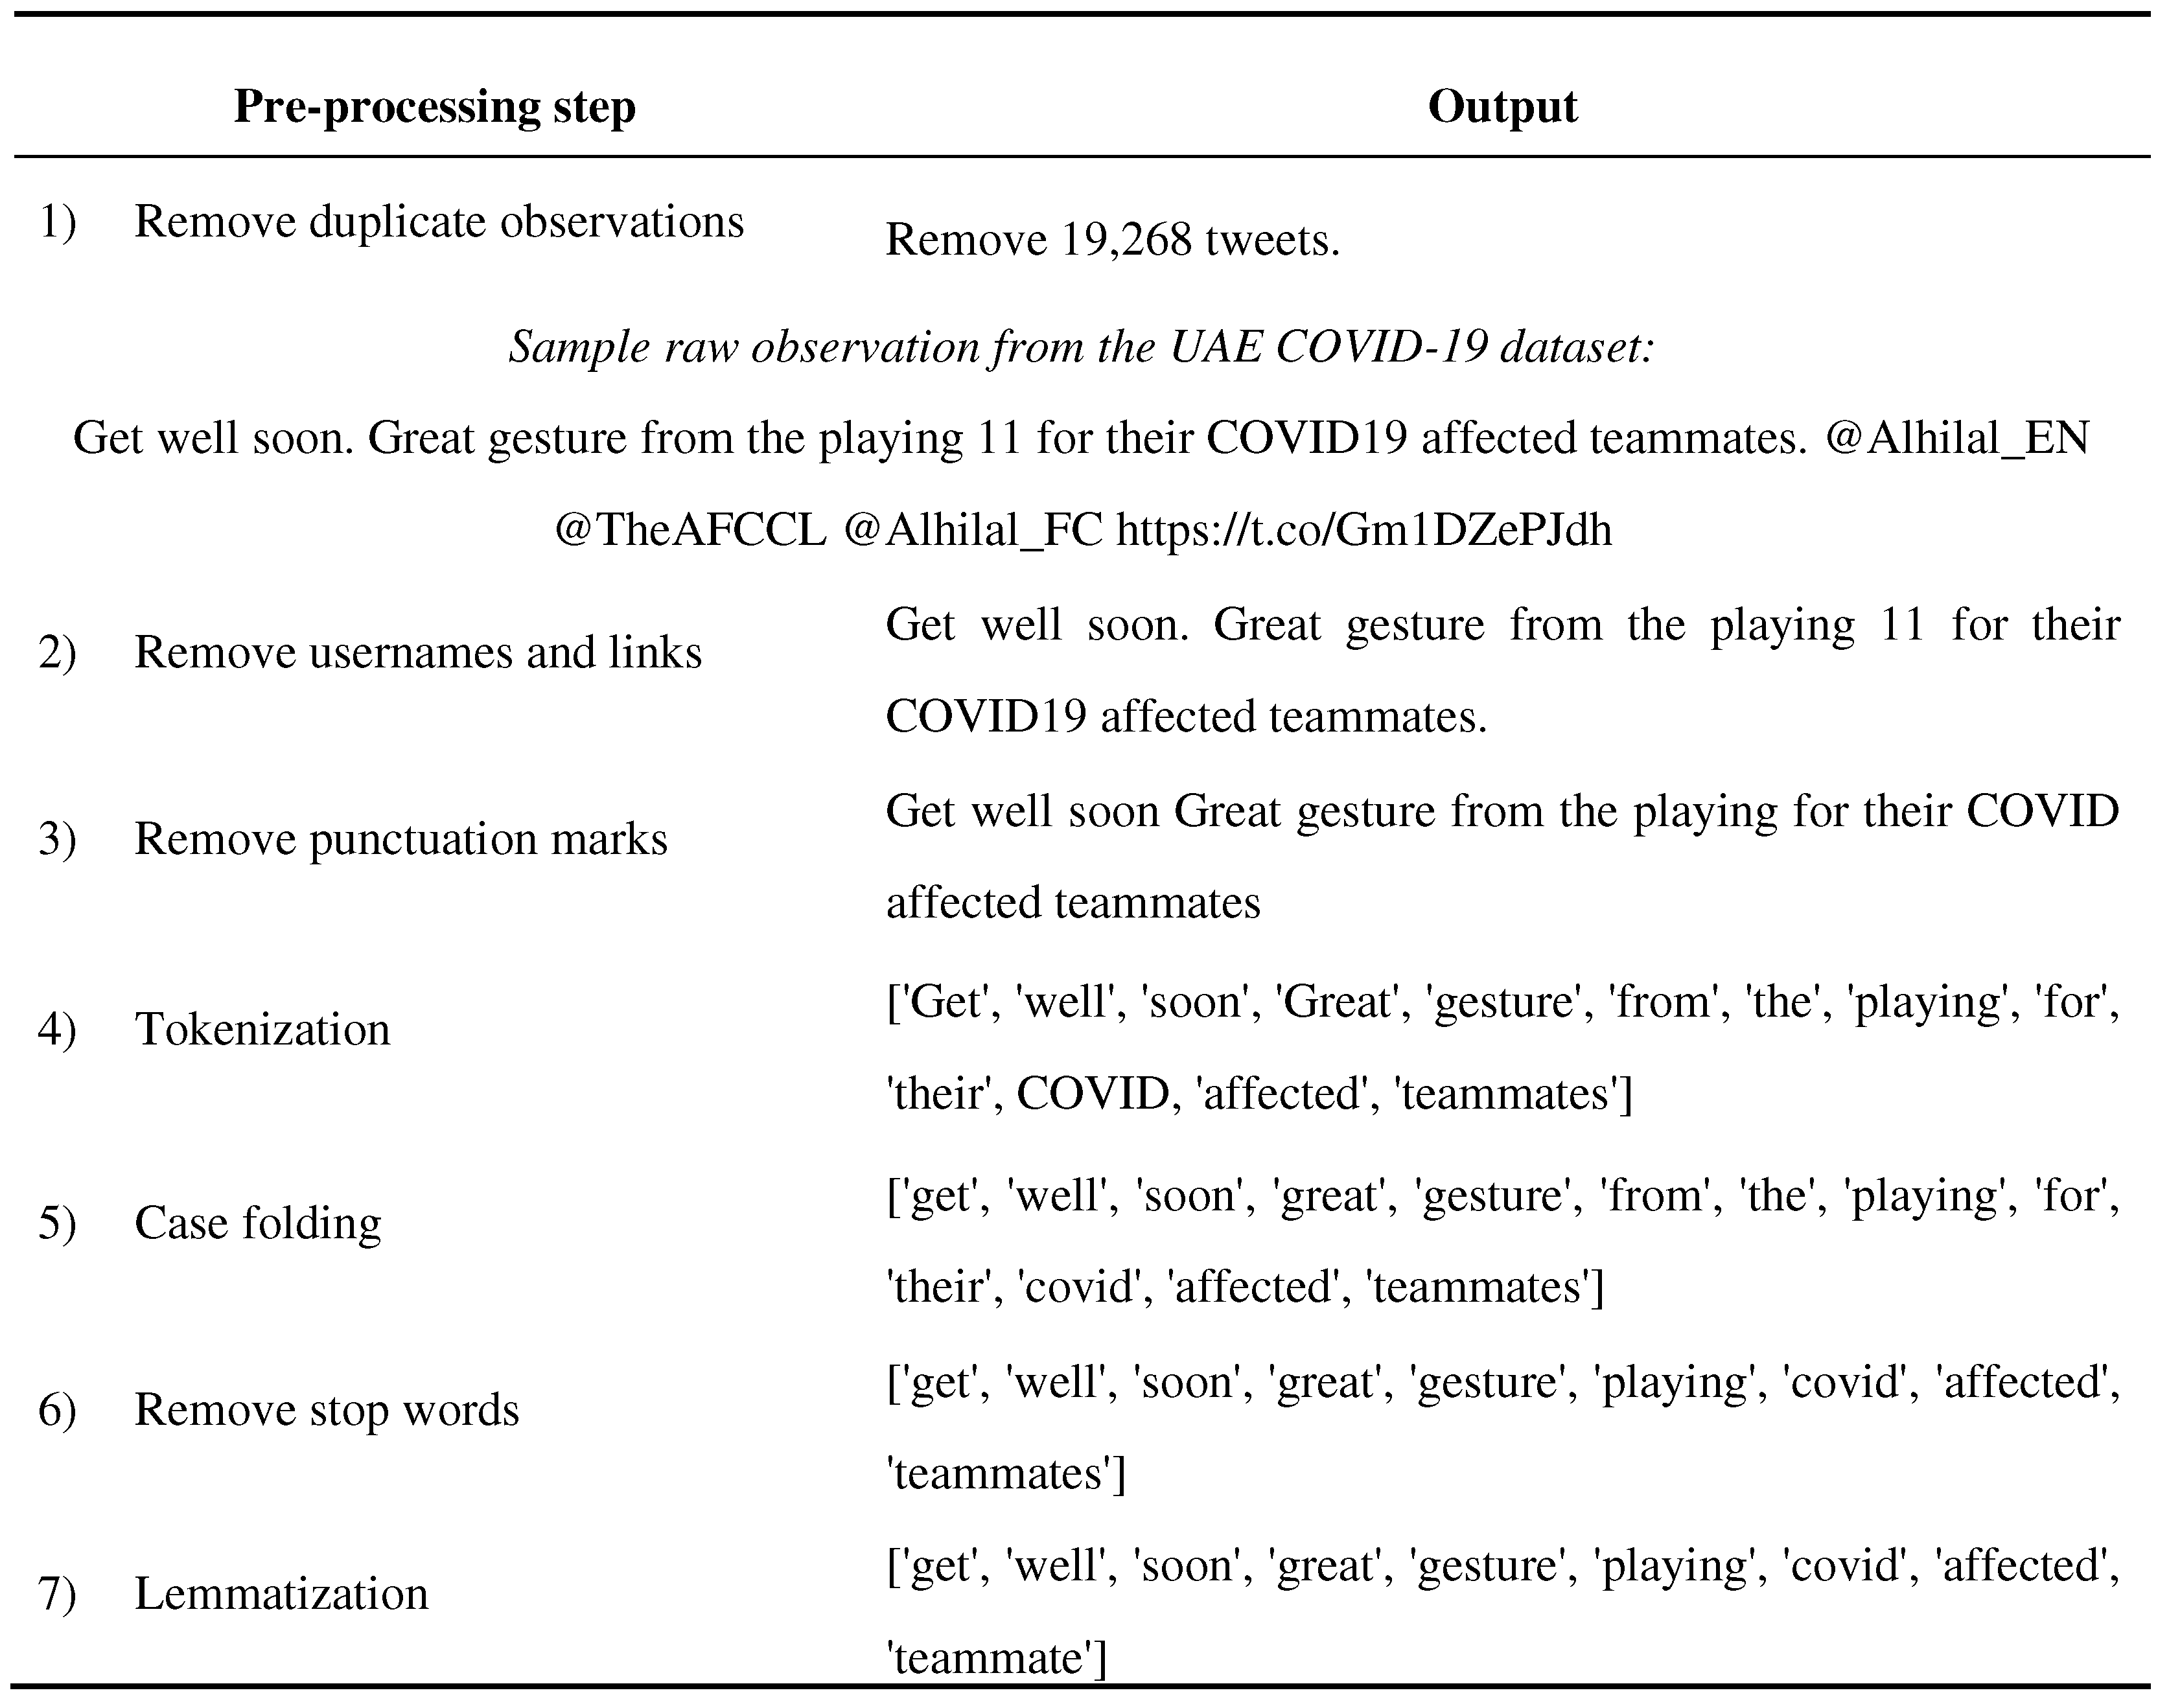
Following common practice in natural language processing, we apply the following pre-processing steps to normalize the text dataset and remove sensitive or irrelevant information, after which the dataset is explored to extract useful insights.
Removing duplicated observations helps produce accurate results regarding the emotions and model performance. Keeping the duplicates would imply a change from the natural data distribution and hence worsen generalization to unseen test cases.
Removing usernames and links when an observation includes a username that indicates the author’s identity. Usernames denoted by '@username,' should be removed to protect user privacy, and as the name translates to no emotions. Similarly, any hyperlinks in the observations are deleted.
Removing punctuation marks such as [", #, $, :, ?, @] from the observation, as they do not carry lexical semantic information about emotions, and can hinder the performance of machine learning algorithms.
Tokenization divides the raw text into atomic chunks, or tokens [
50]. Paragraphs are tokenized into sentences, sentences are tokenized into words, and punctuation is stripped from words. Tokenization helps to interpret the meaning of observations by analyzing the sequence of words.
Case folding is the process of converting all the characters in the text to either upper case or lower case. Therefore, instances of the same word written in different capitalization formats, such as 'Corona,' 'CORONA,' and 'corona,' are now treated as identical by the machine learning approaches.
Removing stop words eliminates purely functional words so that the algorithm focuses on the content words that convey valuable information. Stop words are frequent and do not carry meaning in themselves. Examples of stop words in the English language are ['a', 'an', 'at', 'of', 'the'].
Lemmatization translates an observed word form into its root form or lemma based on its meaning and context [
51]. For instance, 'viruses' and 'virus' would be lemmatized to the root form 'virus' by eliminating inflectional endings. It enables the machine learning algorithm to consider different inflected forms of a word as a single word.
To (i) evaluate the quality of predicted emotions against a gold standard data set, and (ii) train our supervised emotion classifiers on ground truth data, we label observations with the emotion(s) they express. While unsupervised approaches, which do not rely on labeled training data could be an alternative, without guidance from human labels, the algorithm might misinterpret the tasks or ambiguous words in the input. In the emotions data annotation step, the retrieved observations are annotated based on Plutchik sentiments (positive, negative, and neutral) and emotions (anger, anticipation, disgust, fear, joy, sadness, surprise, and trust) while considering each word's subjectivity and intensity. Subjectivity refers to the opinions and judgment of the information by the author, bringing insights into the associated emotion. Intensity quantifies the impact of modifiers on the whole sentence, and thus the associated emotion. For example, “good” implies less intensity than the expression “very good”.
The pre-processed observations (i.e., posts represented as lists of words) are converted into numerical feature vectors which can be processed by the machine learning algorithms. To convert each word in observation to a numerical value, feature extraction techniques such as TF-IDF, Pointwise Mutual Information, Word2Vec, BoW, and Ranking [
52]. Each observation is then represented as a vector of features, and the similarity of two observations can be quantified using standard vector similarity measures such as Cosine similarity.
In this stage, the machine learning model must be selected based on established methodologies in the related works, expert advice, or by exhaustive testing by implementing several models and selecting the best-performing one. A labeled dataset must be split into a training and testing set, for example using a fixed split (e.g., 70% training data and 30% testing data). K-fold cross-validation [
53] is an attractive alternative, where the data set is split K times into different train and test sets and trained/tested with each split once. This is particularly useful in the face of small data sets, as every observation will be used for training and testing while ensuring no overlap between the two sets. Lastly, the classification model will be trained using the training dataset, and its performance is evaluated on the test set.
Model evaluation concerns validating the classification model using the testing dataset. In this step, the model is evaluated based on several performance metrics such as accuracy, precision, recall, F-measure, and AUC. Accuracy is the most widely used evaluation metric [
54]. Lastly, the execution time should be calculated to determine the model’s complexity.
Stage 8: Model deployment
Pending satisfactory evaluation results in Stage 7, in this final stage of the framework, the developed model can be applied to determine residents' emotions toward the specified event(s) in (3.1). The model should be retrained to consider future social media posts.
2.2. The United Arab Emirates (UAE) COVID-19 Emotions Detection Case Study
Vaccination was introduced as a step toward containing the COVID-19 outbreak. However, the proliferation of vaccines, the absence of data about the short- and long-term side effects, and their efficacity against the virus and its evolving mutation drove the explosion of different emotions, such as fear, anticipation, and anger, that could lead to mental health issues. Our primary goal, in this case study, is to understand the emotional response of UAE residents to COVID-19 vaccines and to evaluate the performance of our machine learning event-based emotion detection framework by considering Tweets about the vaccines to gauge the impact on individuals’ emotions.
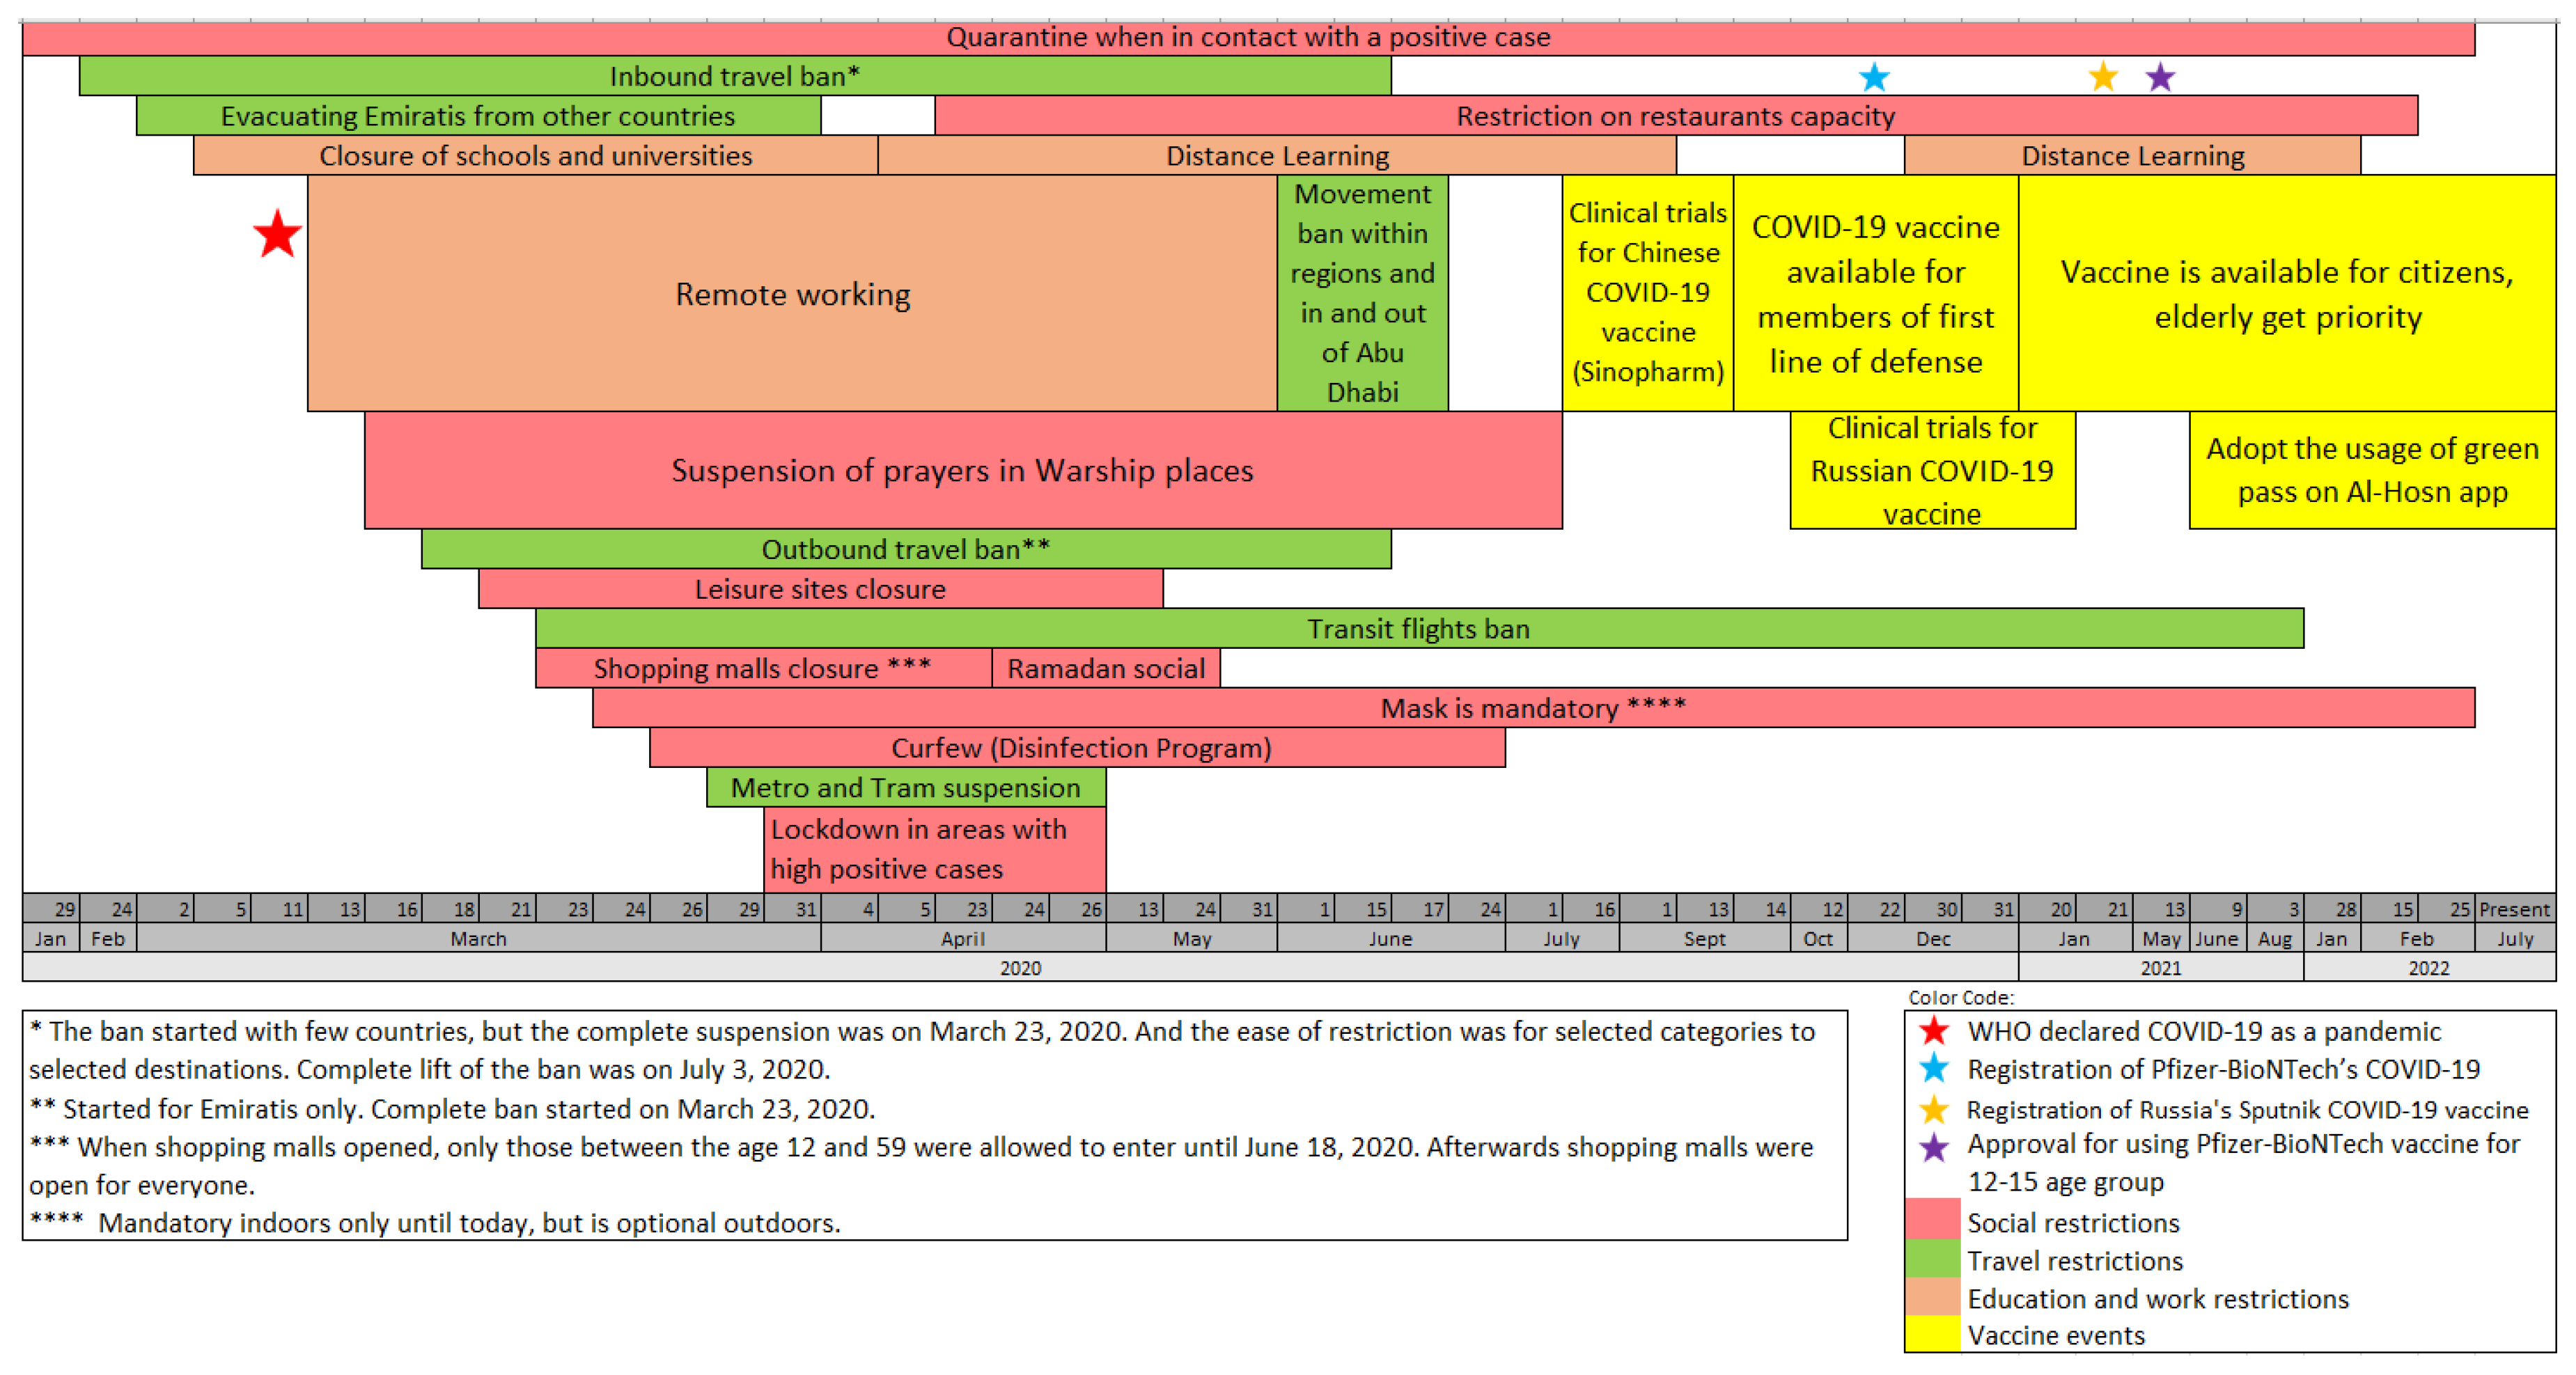
Figure 2 summarizes the data that we extracted from WHO [
7] about the declaration of the pandemic, and the news posts about precautionary measures adopted by the UAE, as announced by the National Emergency Crisis and Disasters Management Authority [
16], to tackle the pandemic since January 29, 2020. In what follows, we will refer to precautionary measures as events. The events related to vaccines started on July 16, 2020. In this case study, we explore emotions related to COVID-19 in the UAE in general. In addition, we evaluate our framework to detect emotions related to vaccine events through different performance measures.
2.2.1. COVID-19 Vaccine-Related Precautionary Measures
To cope with the increasing COVID-19 infections in UAE [
55,
56,
57], on July 16, 2020, the government announced a call for volunteers to undergo clinical trials for potential COVID-19 vaccines. Then, on September 14, it announced the availability of the Sinopharm COVID-19 vaccine for the first line of defense members. The following month, the government announced clinical trials of a Russian adenovirus-based vaccine (Sputnik). Moreover, in December 2020, there was an official registration of Pfizer-BioNTech’s COVID-19 vaccine, with priority given to the elderly.
Towards the end of January 2021, the government announced the eligibility of people aged 16 and above to take the vaccine and the requirements of a Polymerase Chain Reaction (PCR) test every seven days for federal government employees who did not receive the two doses of the vaccine. However, despite the vaccine age eligibility, the Ministry of Health dedicated all vaccination centers only to the elderly and people with chronic diseases in February. They allowed the rest of the population to take the vaccine with time. As of July 2022, more than 24 million doses have been administered.
3. Results
This section explains how we used our ML- SMEmot framework to analyze the emotional response to COVID-19 vaccination in the UAE as expressed in social media.
In this case study, we are interested in collecting English tweets regarding the COVID-19 vaccine-related events in the UAE. Given a population consisting of over 88% expatriates of more than 200 nationalities [
58], English is the most common language in UAE [
59].
We collect tweets posted between 29-01-2020 and 31-07-2022. We divide the duration into three periods: 1) 29-01-2020 – 14-09-2020, from the first case of COVID-19 in UAE until the vaccination announcement, 2) 14-09-2020 – 09-12-2020, from the announcement of vaccination until the commencement of the vaccination program, and 3) 09-12-2020 – 31-07-2022, from the commencement of the vaccination program until the time of writing this paper. Additionally, we use the keywords in
Table 3 to extract the observations using the Snscrape package in Python 3.9. The keywords consist of the ones related to COVID-19 in general and the ones related to vaccination.
We remove duplicate tweets which is posted by the same user ID. However, we kept duplicate tweets posted by different users, i.e., retweets. This is because retweets would emphasize on embedded emotions. For each tweet, we retain the date created and the text, while we remove other irrelevant attributes such as username, retweets count, number of likes and comments. Additionally, we case-folded the tweets to lowercase and removed the word ‘RT’ from the tweets, which indicates retweet.
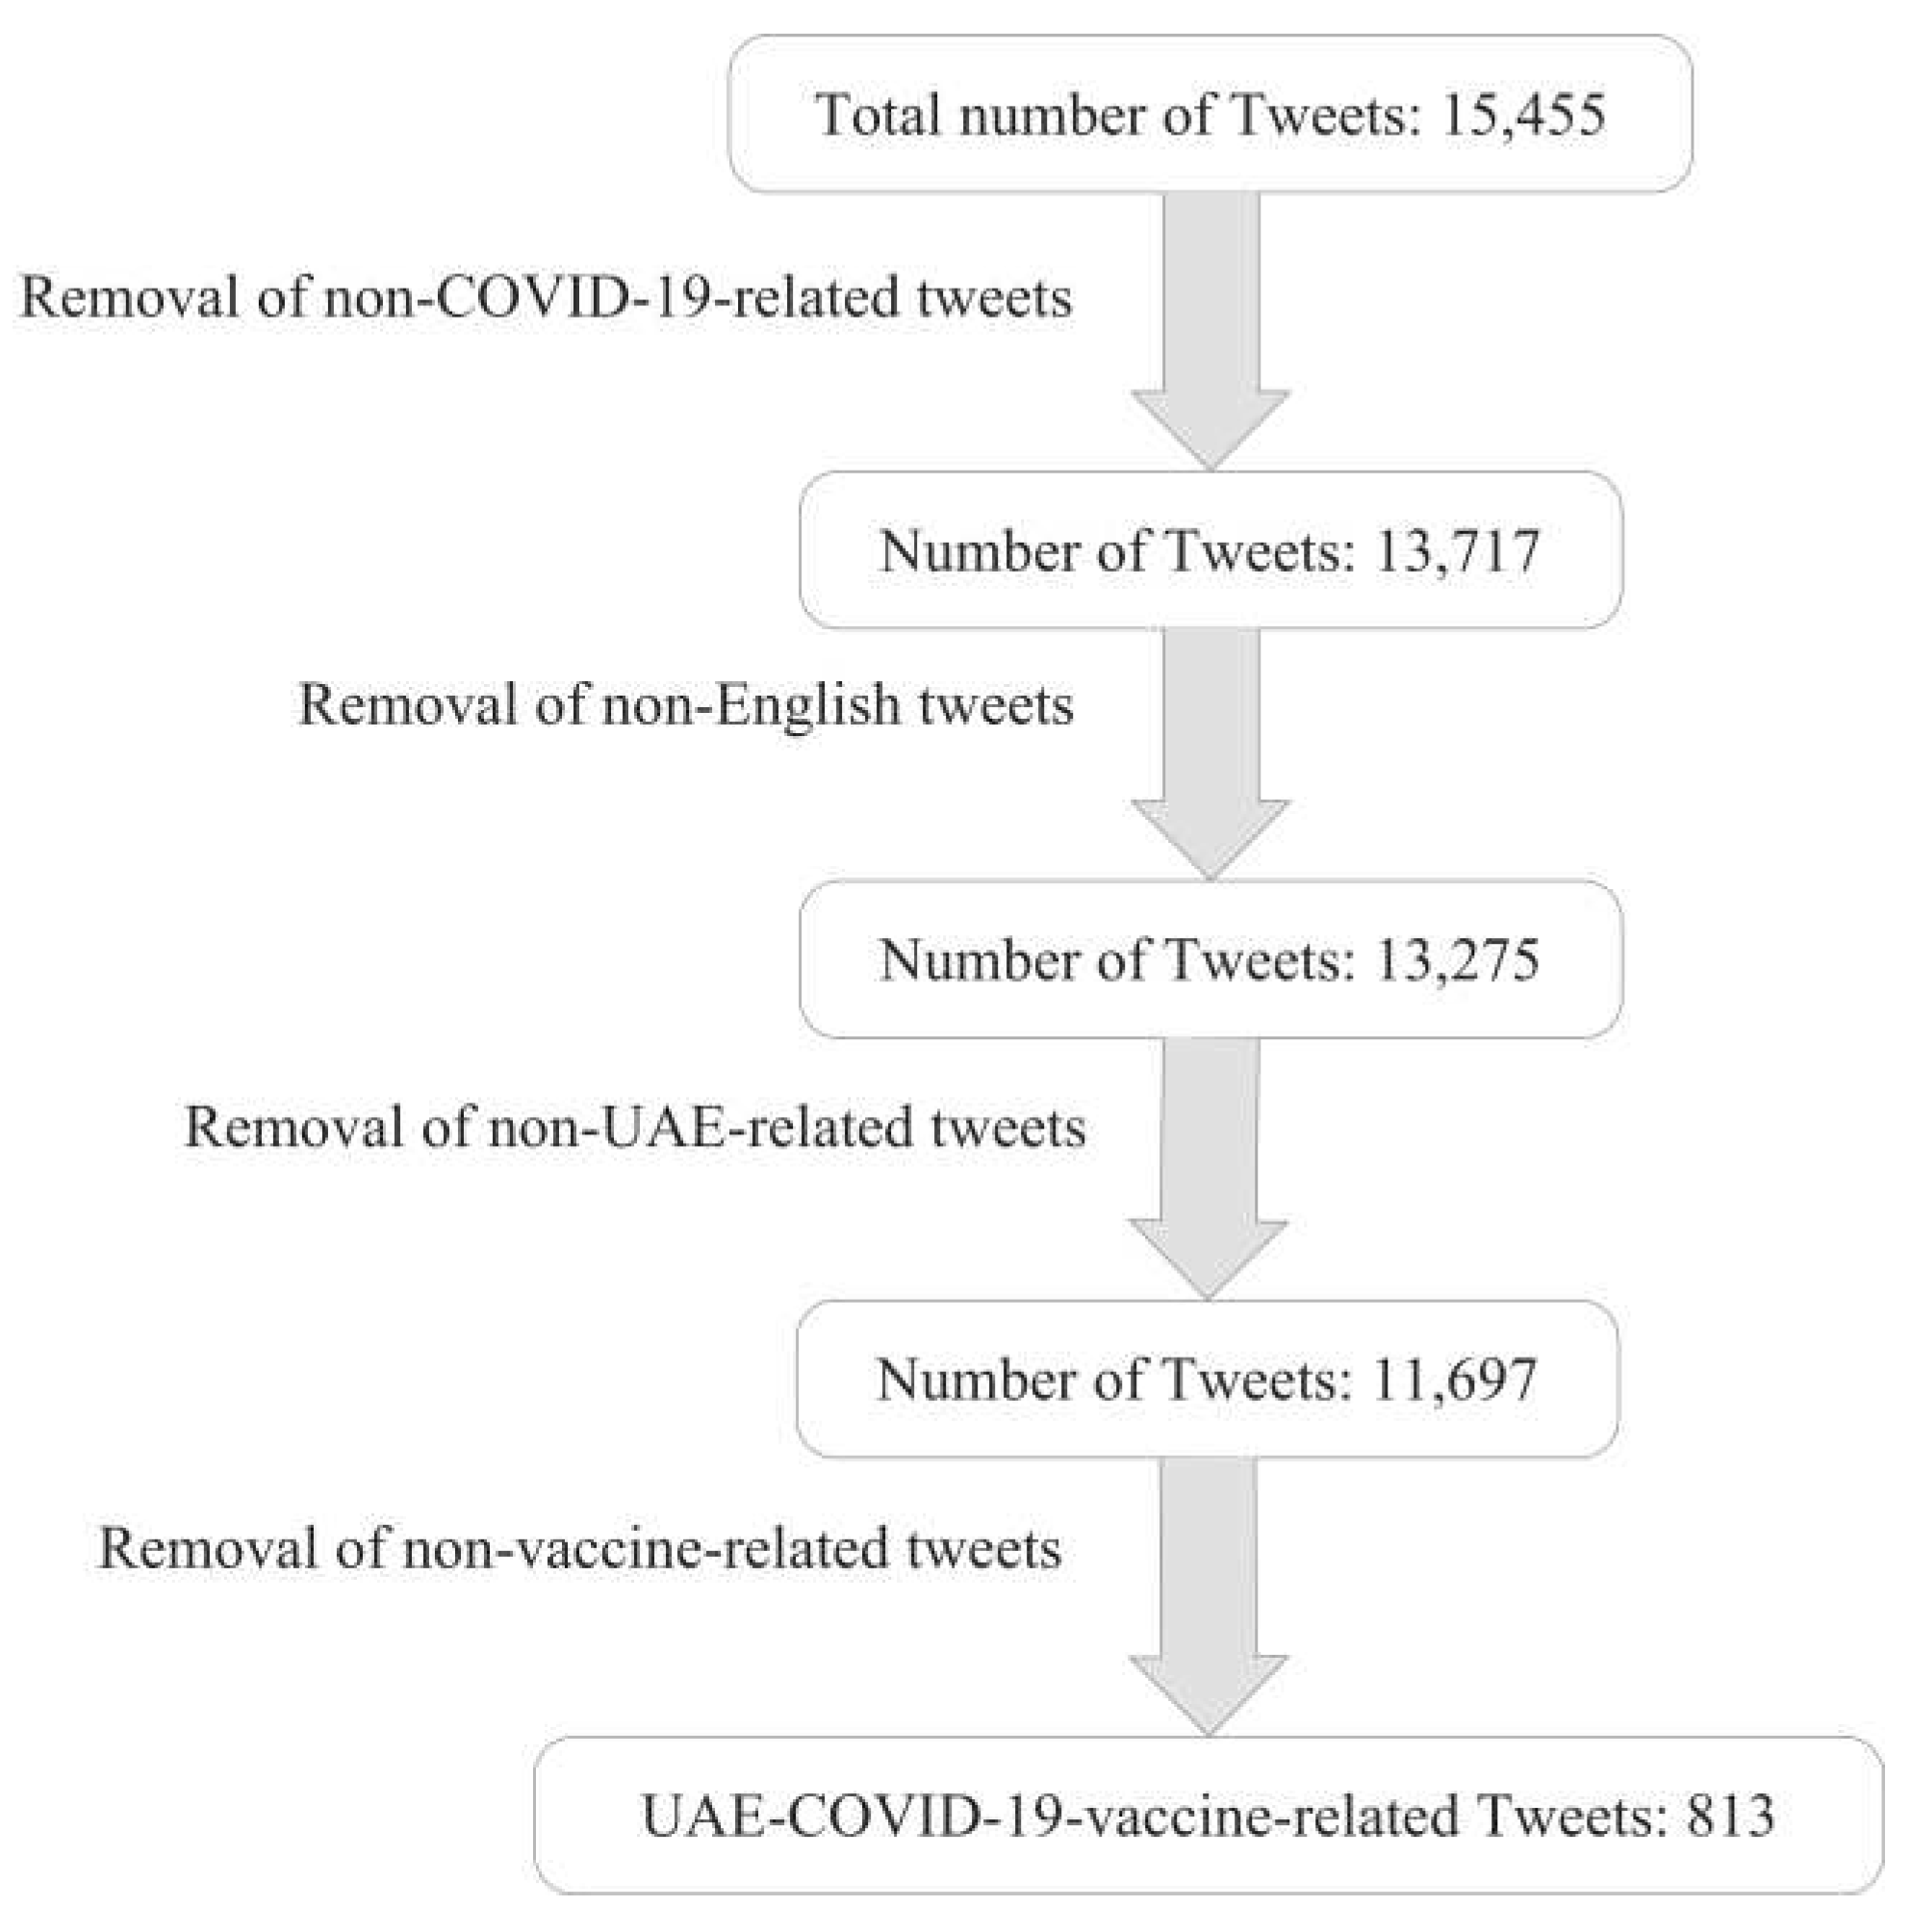
Figure 3 illustrates the steps we took to filter the UAE-COVID-19-vaccine-related tweets. First, we extracted a total of 15,455 tweets that contained at least one of our COVID-19-related keywords, then we manually removed the non-English tweets, which are the ones that include a mix of multiple languages. Furthermore, we manually removed the non-UAE-related tweets which were about other countries’ COVID-19 precautionary measures or situations that were not related in any way to the UAE’s procedure for containing the virus. Finally, we filtered the vaccine-related tweets based on the 25 keywords mentioned in
Table 3, which resulted in a final data set of 813 UAE-related tweets about the event of vaccination.
Table A1 in
Appendix A shows the output for the above-mentioned pre-processing steps on a sample observation taken from our dataset.
Exploratory data analysis
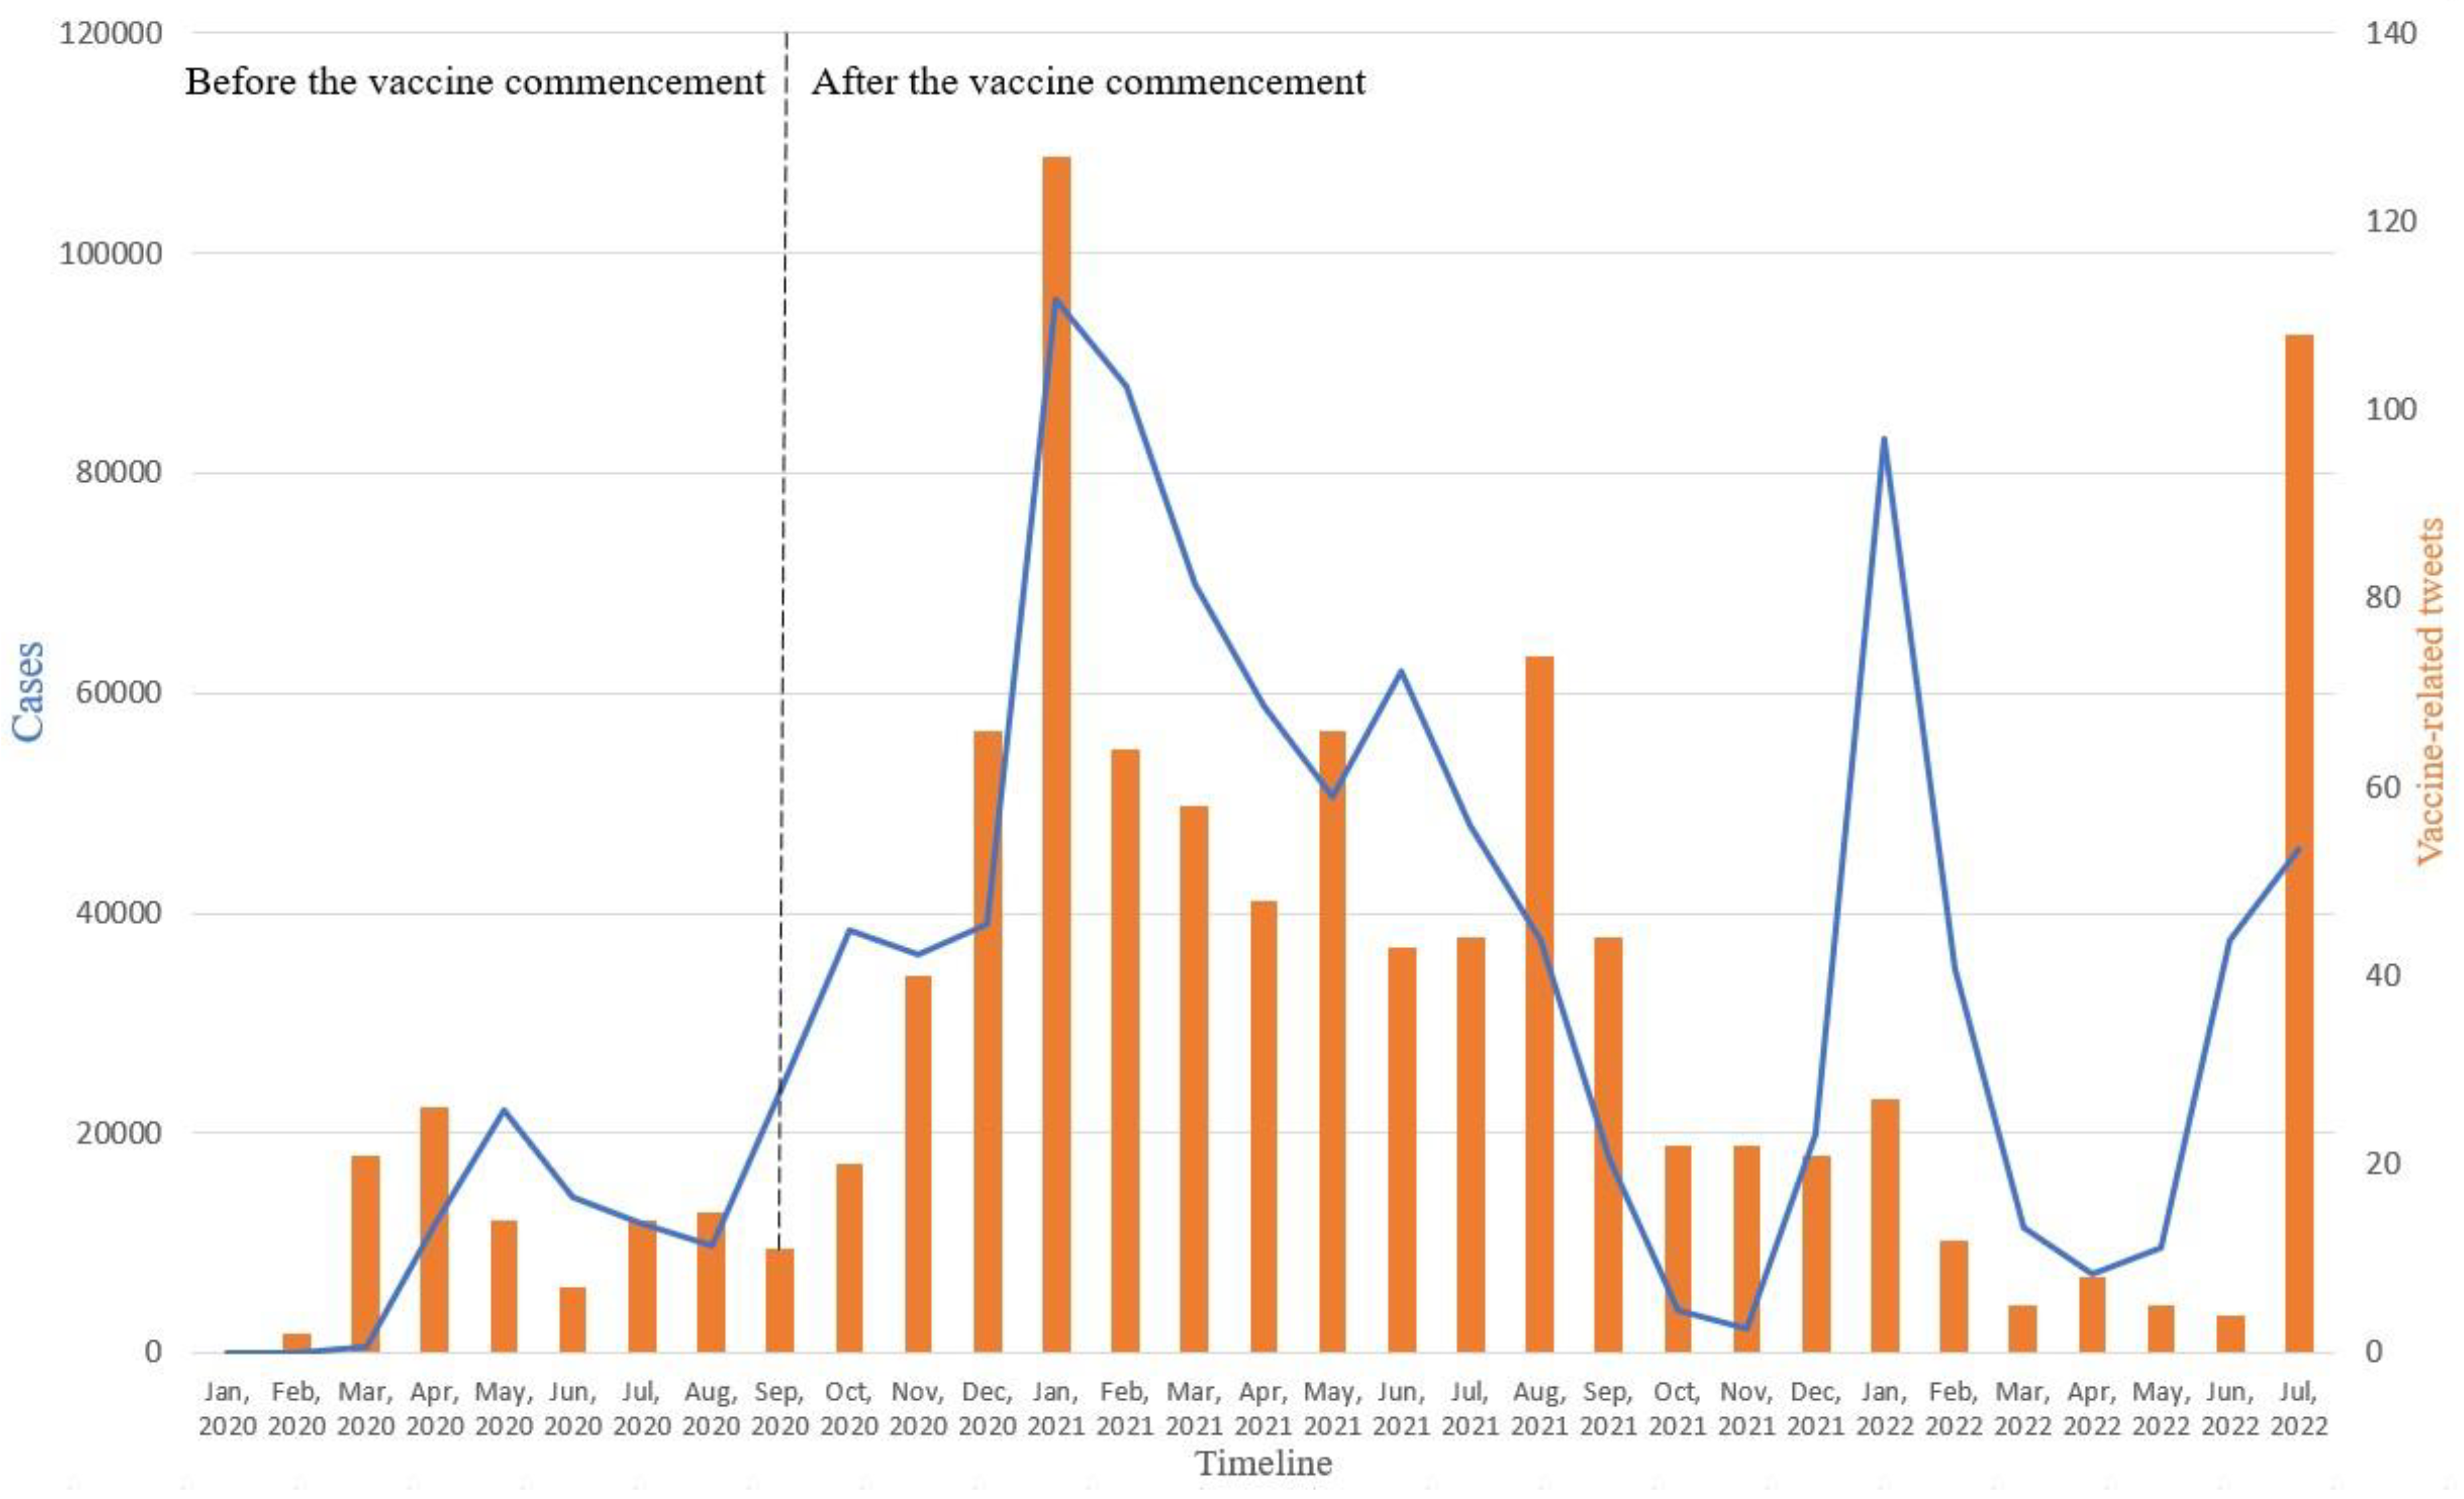
Figure 4 illustrates the number of positive COVID-19 cases on the left y-axis, versus the number of vaccine-related tweets, on the right y-axis each month. The figure shows that in most cases, the changes in positive cases are in line with the changes in vaccine-related tweets. However, in July 2022, we noticed a sudden increase in vaccine-related tweets despite the low positive cases due to the ease of restrictions in the UAE. We hypothesize that the population was getting more aware of the need for the vaccine and booster shots.
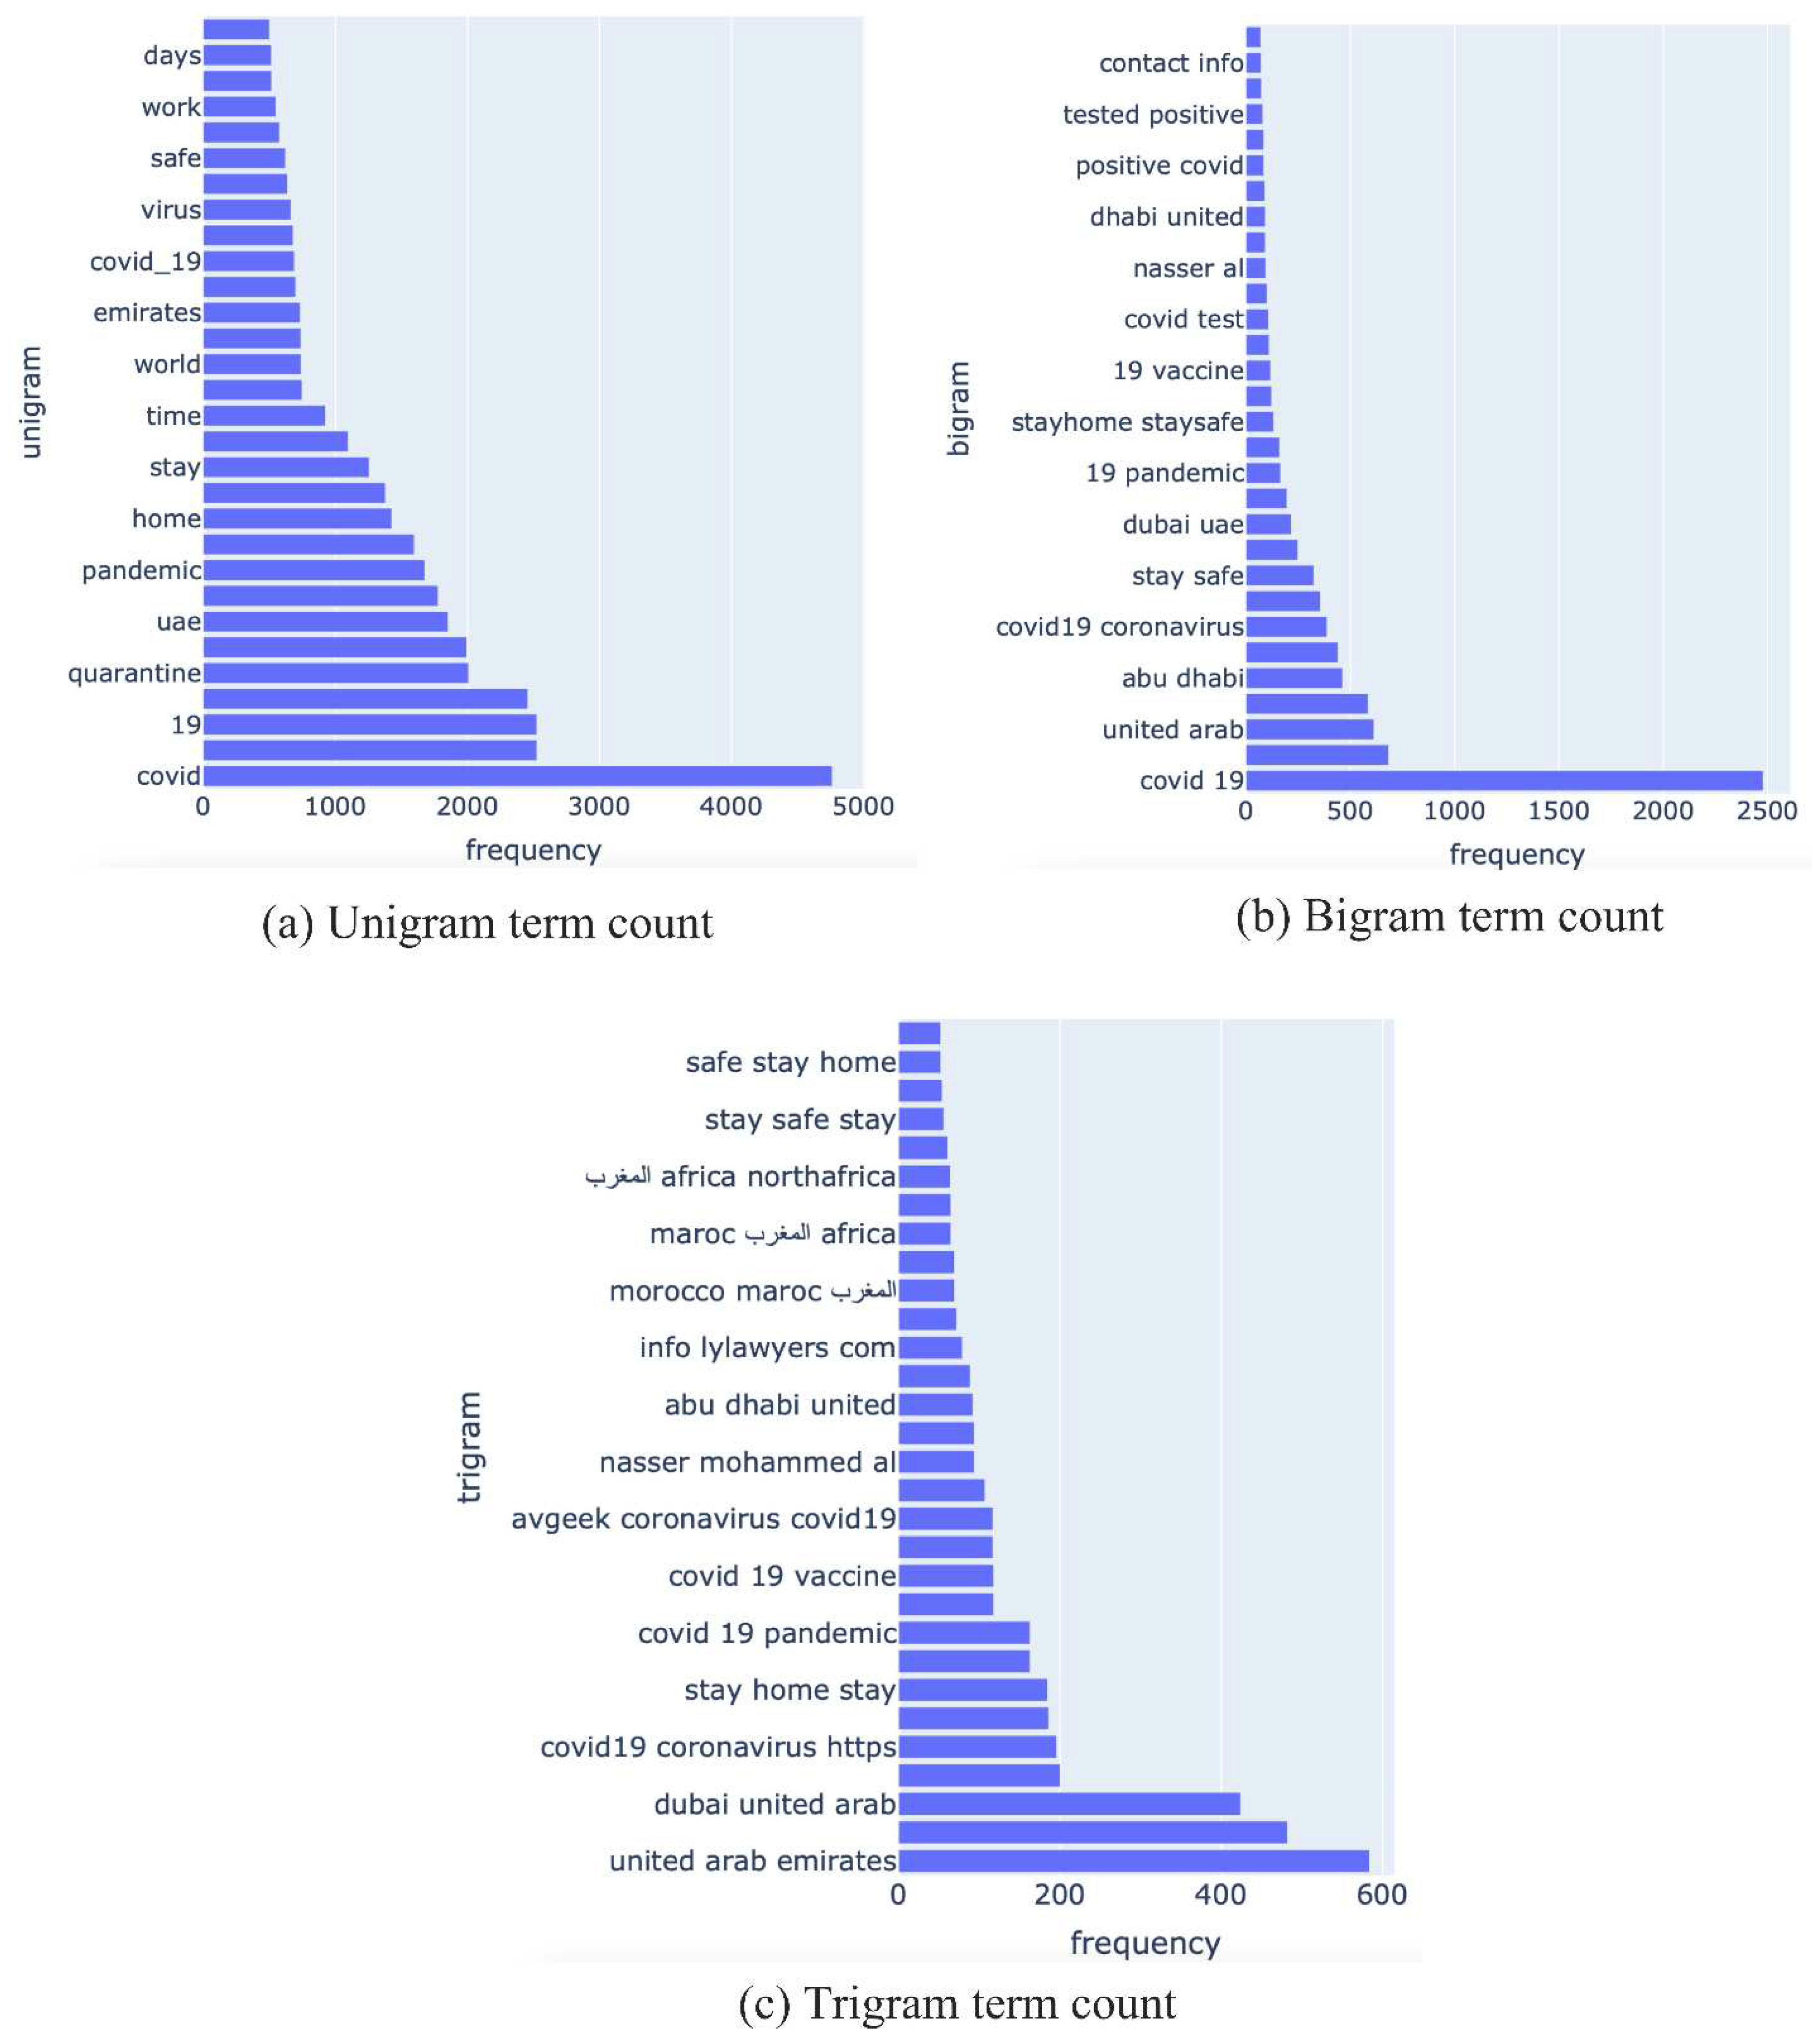
Figure 5 shows counts of unigrams (single words), bigrams (word pairs), and trigrams (sequences of 3 words). These figures show a dominance of keywords (or key phrases) related to COVID-19 and the vaccine.
Figure 5(a) shows that ‘Pfizer’ is tweeted about most, followed by Sinopharm. The reason behind this could be that the Pfizer vaccine is produced by a well-known company or because the success rate of Pfizer exceeded Sinopharm.
Figure 5(c) shows that the tweets related to Pfizer were mostly about the shots taken. Both Dubai (
Figure 5(a)) and Abu Dhabi (
Figure 5(b)) feature frequently in the Tweets.
Figure 5(c) suggests that this is because of the travel restrictions between both cities which impacted daily life on the personal level and nationwide economical level.
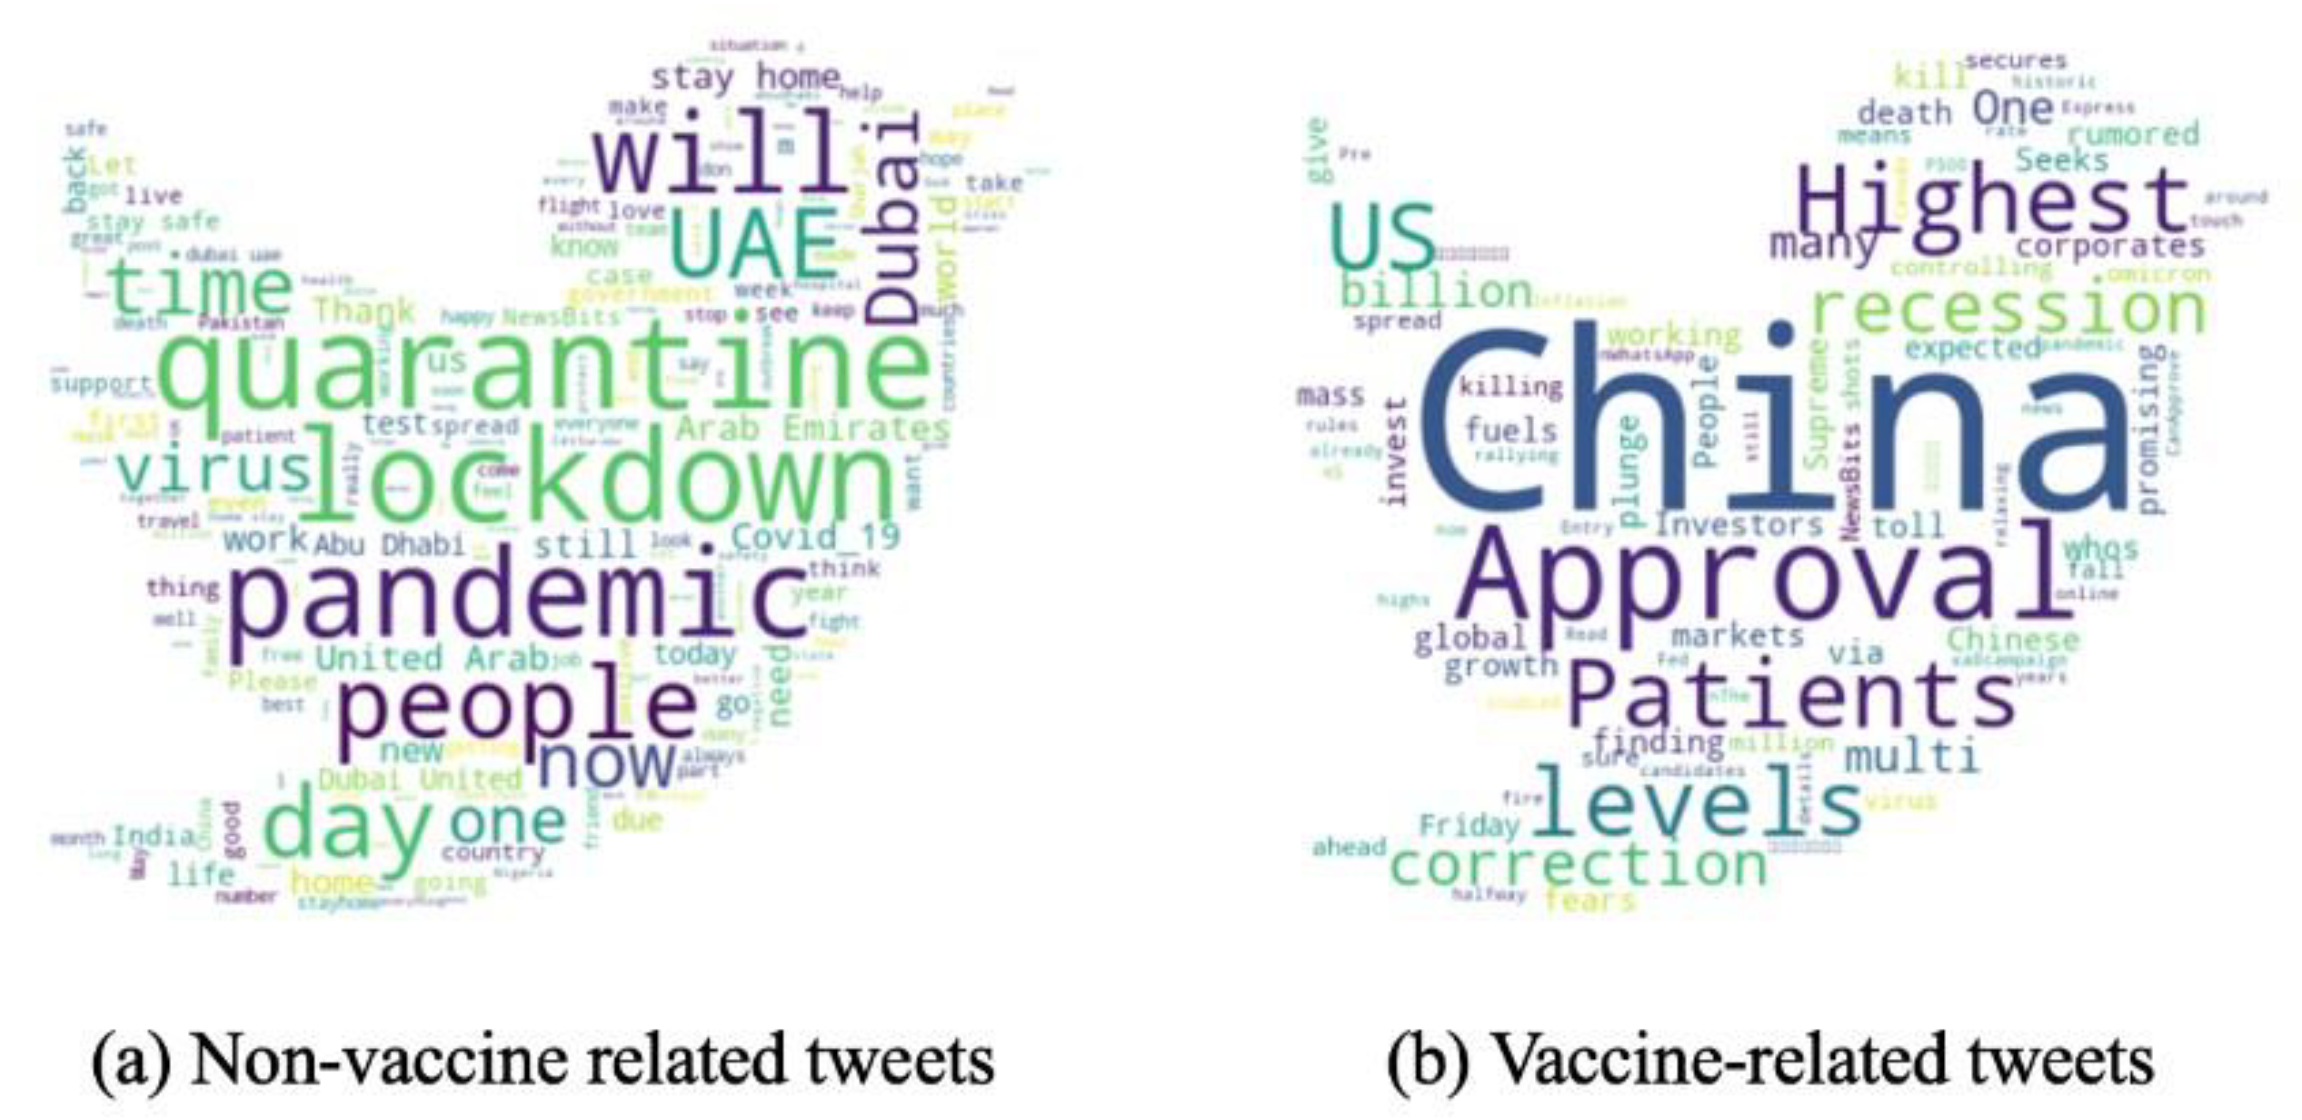
Figure 6 and
Figure 7 illustrate COVID-19-word clouds. To give insights into the tweets’ context during the pandemic, we removed the COVID-19-related terms such as “Covid,” “Covid-19,” “Coronavirus,” “Vaccine,” and “Vaccines”. The reason behind such a decision is that all word clouds represent COVID-19-related tweets; hence, such terms will be the most frequent. However, we did not remove the terms related to the different types of vaccines to find the correlation between each emotion and the vaccine types.
Figure 6(a) represents a word cloud for non-vaccine-(but COVID)-related tweets. People in the UAE mostly tweeted about quarantine and lockdown. They also tweeted about their daily routine using the word “day”.
Figure 6(b) represents a word cloud for vaccine-related tweets. China was the most frequent word since the primary vaccine used in the UAE is the Chinese vaccine, Sinopharm.
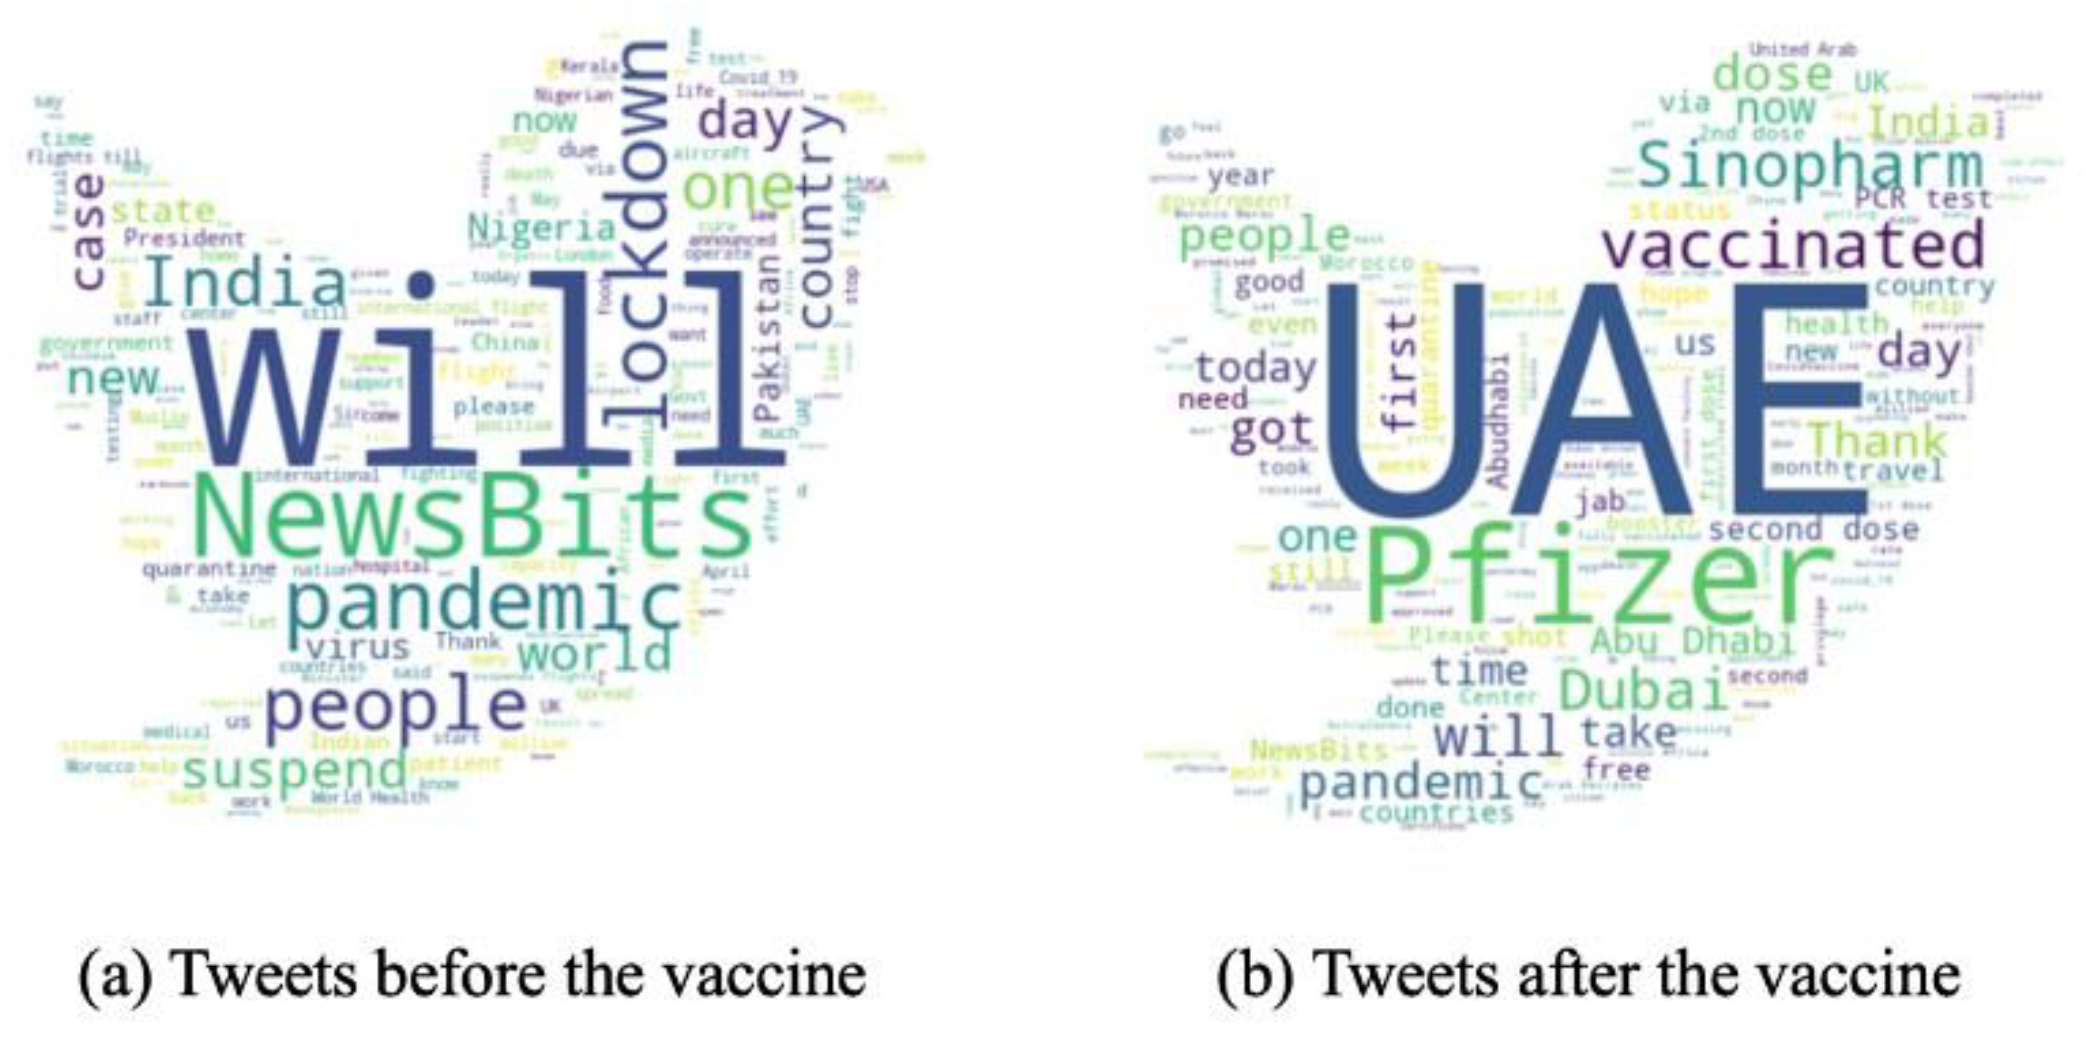
Figure 7 represents the word clouds for the tweets before and after the introduction of the Sinopharm vaccine on 14 September 2020 [
59]. Before the vaccine was introduced, people frequently tweeted about other COVID-related news using the hashtag “NewsBits”. On the contrary, when vaccination started, Pfizer dominated the social media discourse.
For every tweet, we used Python 3.9 TextBlob 0.17.1 [
42], vaderSentiment 3.3.2 [
43], and NRCLex 4.0 [
60] libraries. The latter is based on EmoLex [
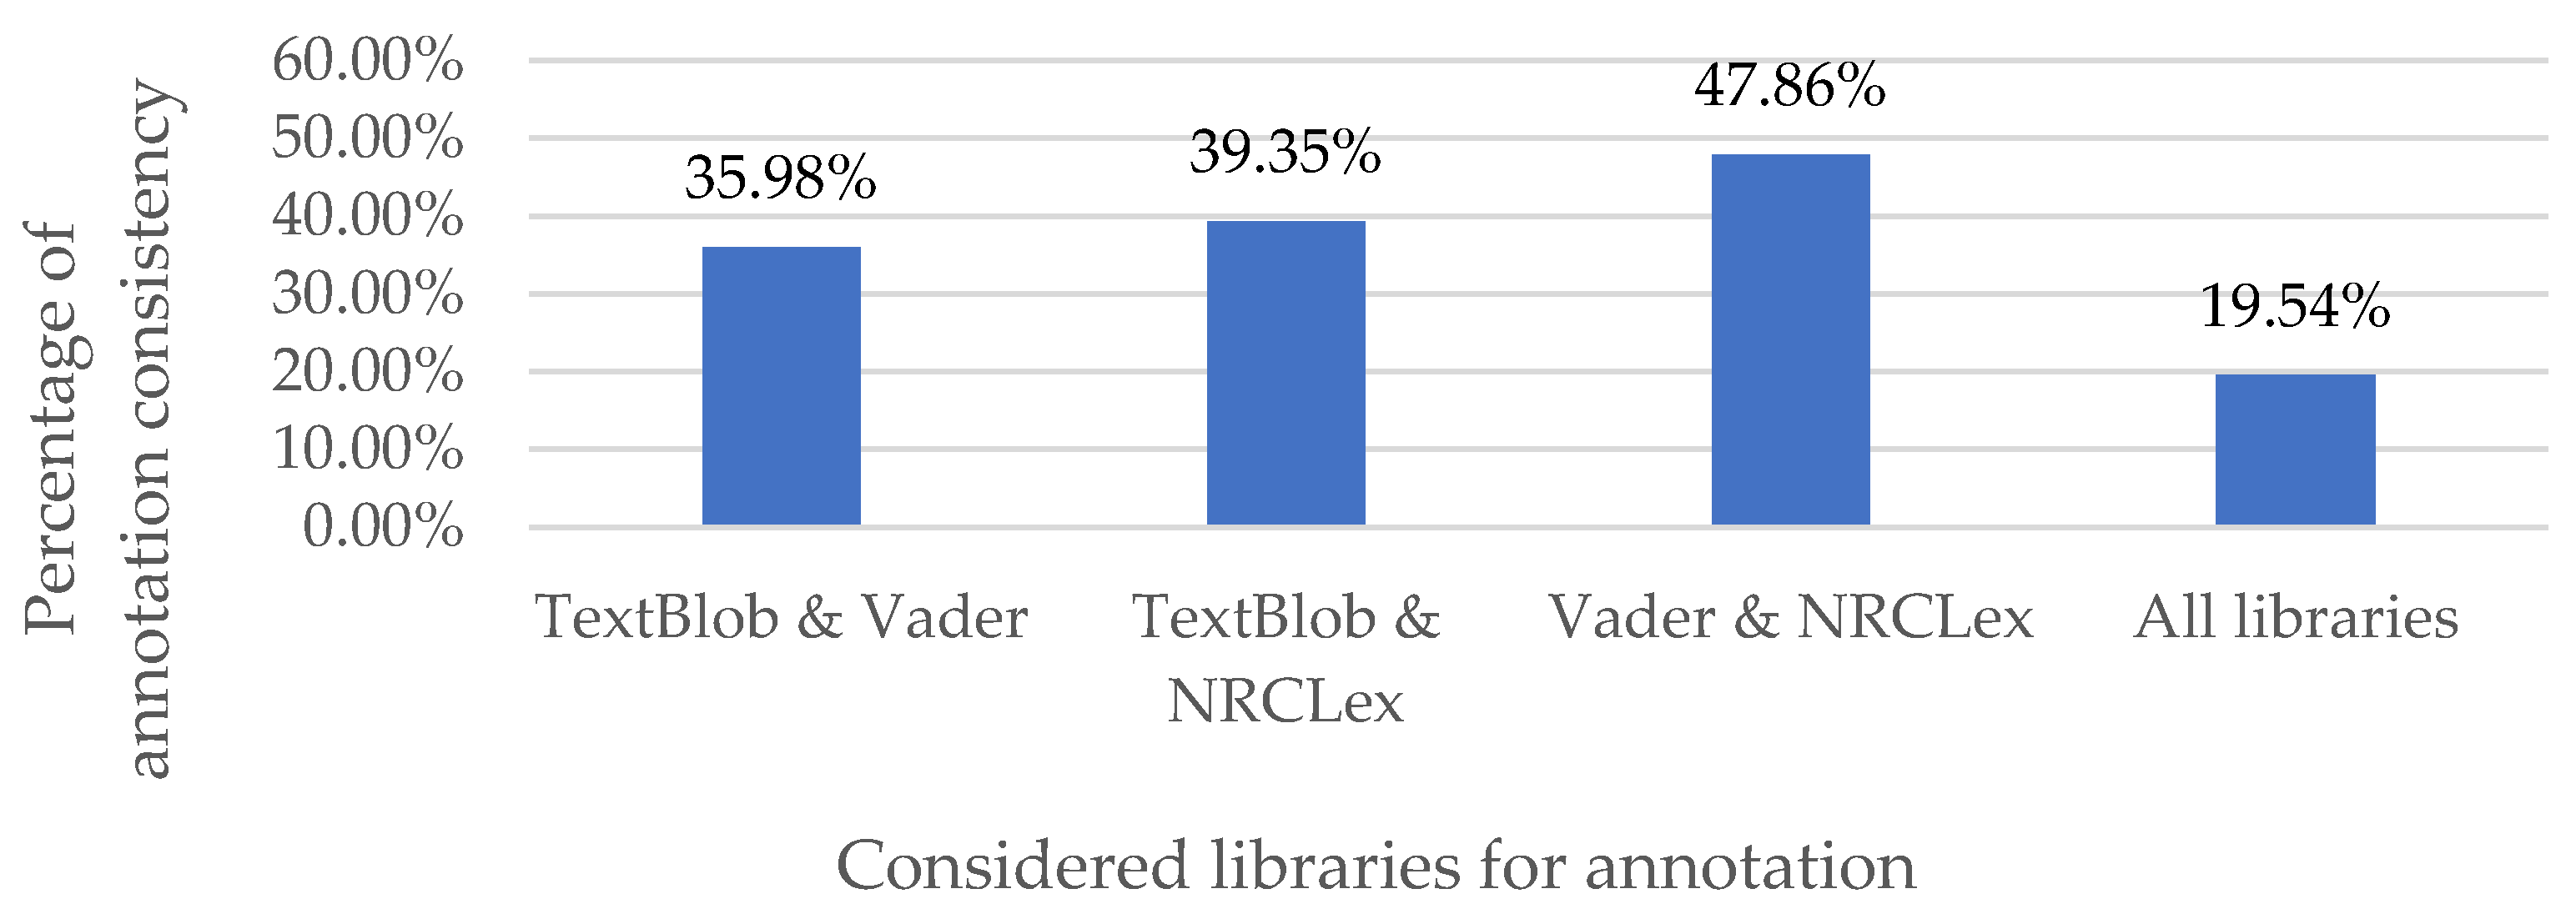
26]. TextBlob and VADER produce the tweets’ sentiment (negative, positive, or neutral), and EmoLext provided Plutchik’s eight emotions (joy, fear, anger, anticipation, sadness, surprise, disgust, trust) and two general sentiments (negative and positive). We automatically tag tweets with a single label using EmoLex emotion if and only if all three libraries agreed on one of the sentiment classes (negative or positive). In all other cases, the authors L.I., N.S., H.M., and A.H. manually single labeled the tweet based on EmoLex with full agreement. In our manual annotations, we also consider the level of the subjectivity of the tweet and its emotional intensity in terms of the existing modifiers.
Figure 8 shows the low rate of agreement of all three methods, implying that most tweets were manually annotated with fine-grained emotions. We added a “neutral” class in our manual annotation phase to indicate tweets that are void of emotion.
In summary, we annotated each tweet with the emotions it expressed in terms of three sentiments (positive, negative, and neutral) and Plutchik‘s eight emotions (anger, anticipation, disgust, fear, joy, sadness, surprise, and trust) [
2]. We considered the tweet’s author's opinion and judgment (subjectivity), and its intensity. The latter depicts the impact of the modifiers on each tweet since it would affect the classification of a tweet into one of the eleven classes (i.e., Plutchik’s sentiments and emotions) [
26].
Emotion-based annotated data exploratory analysis
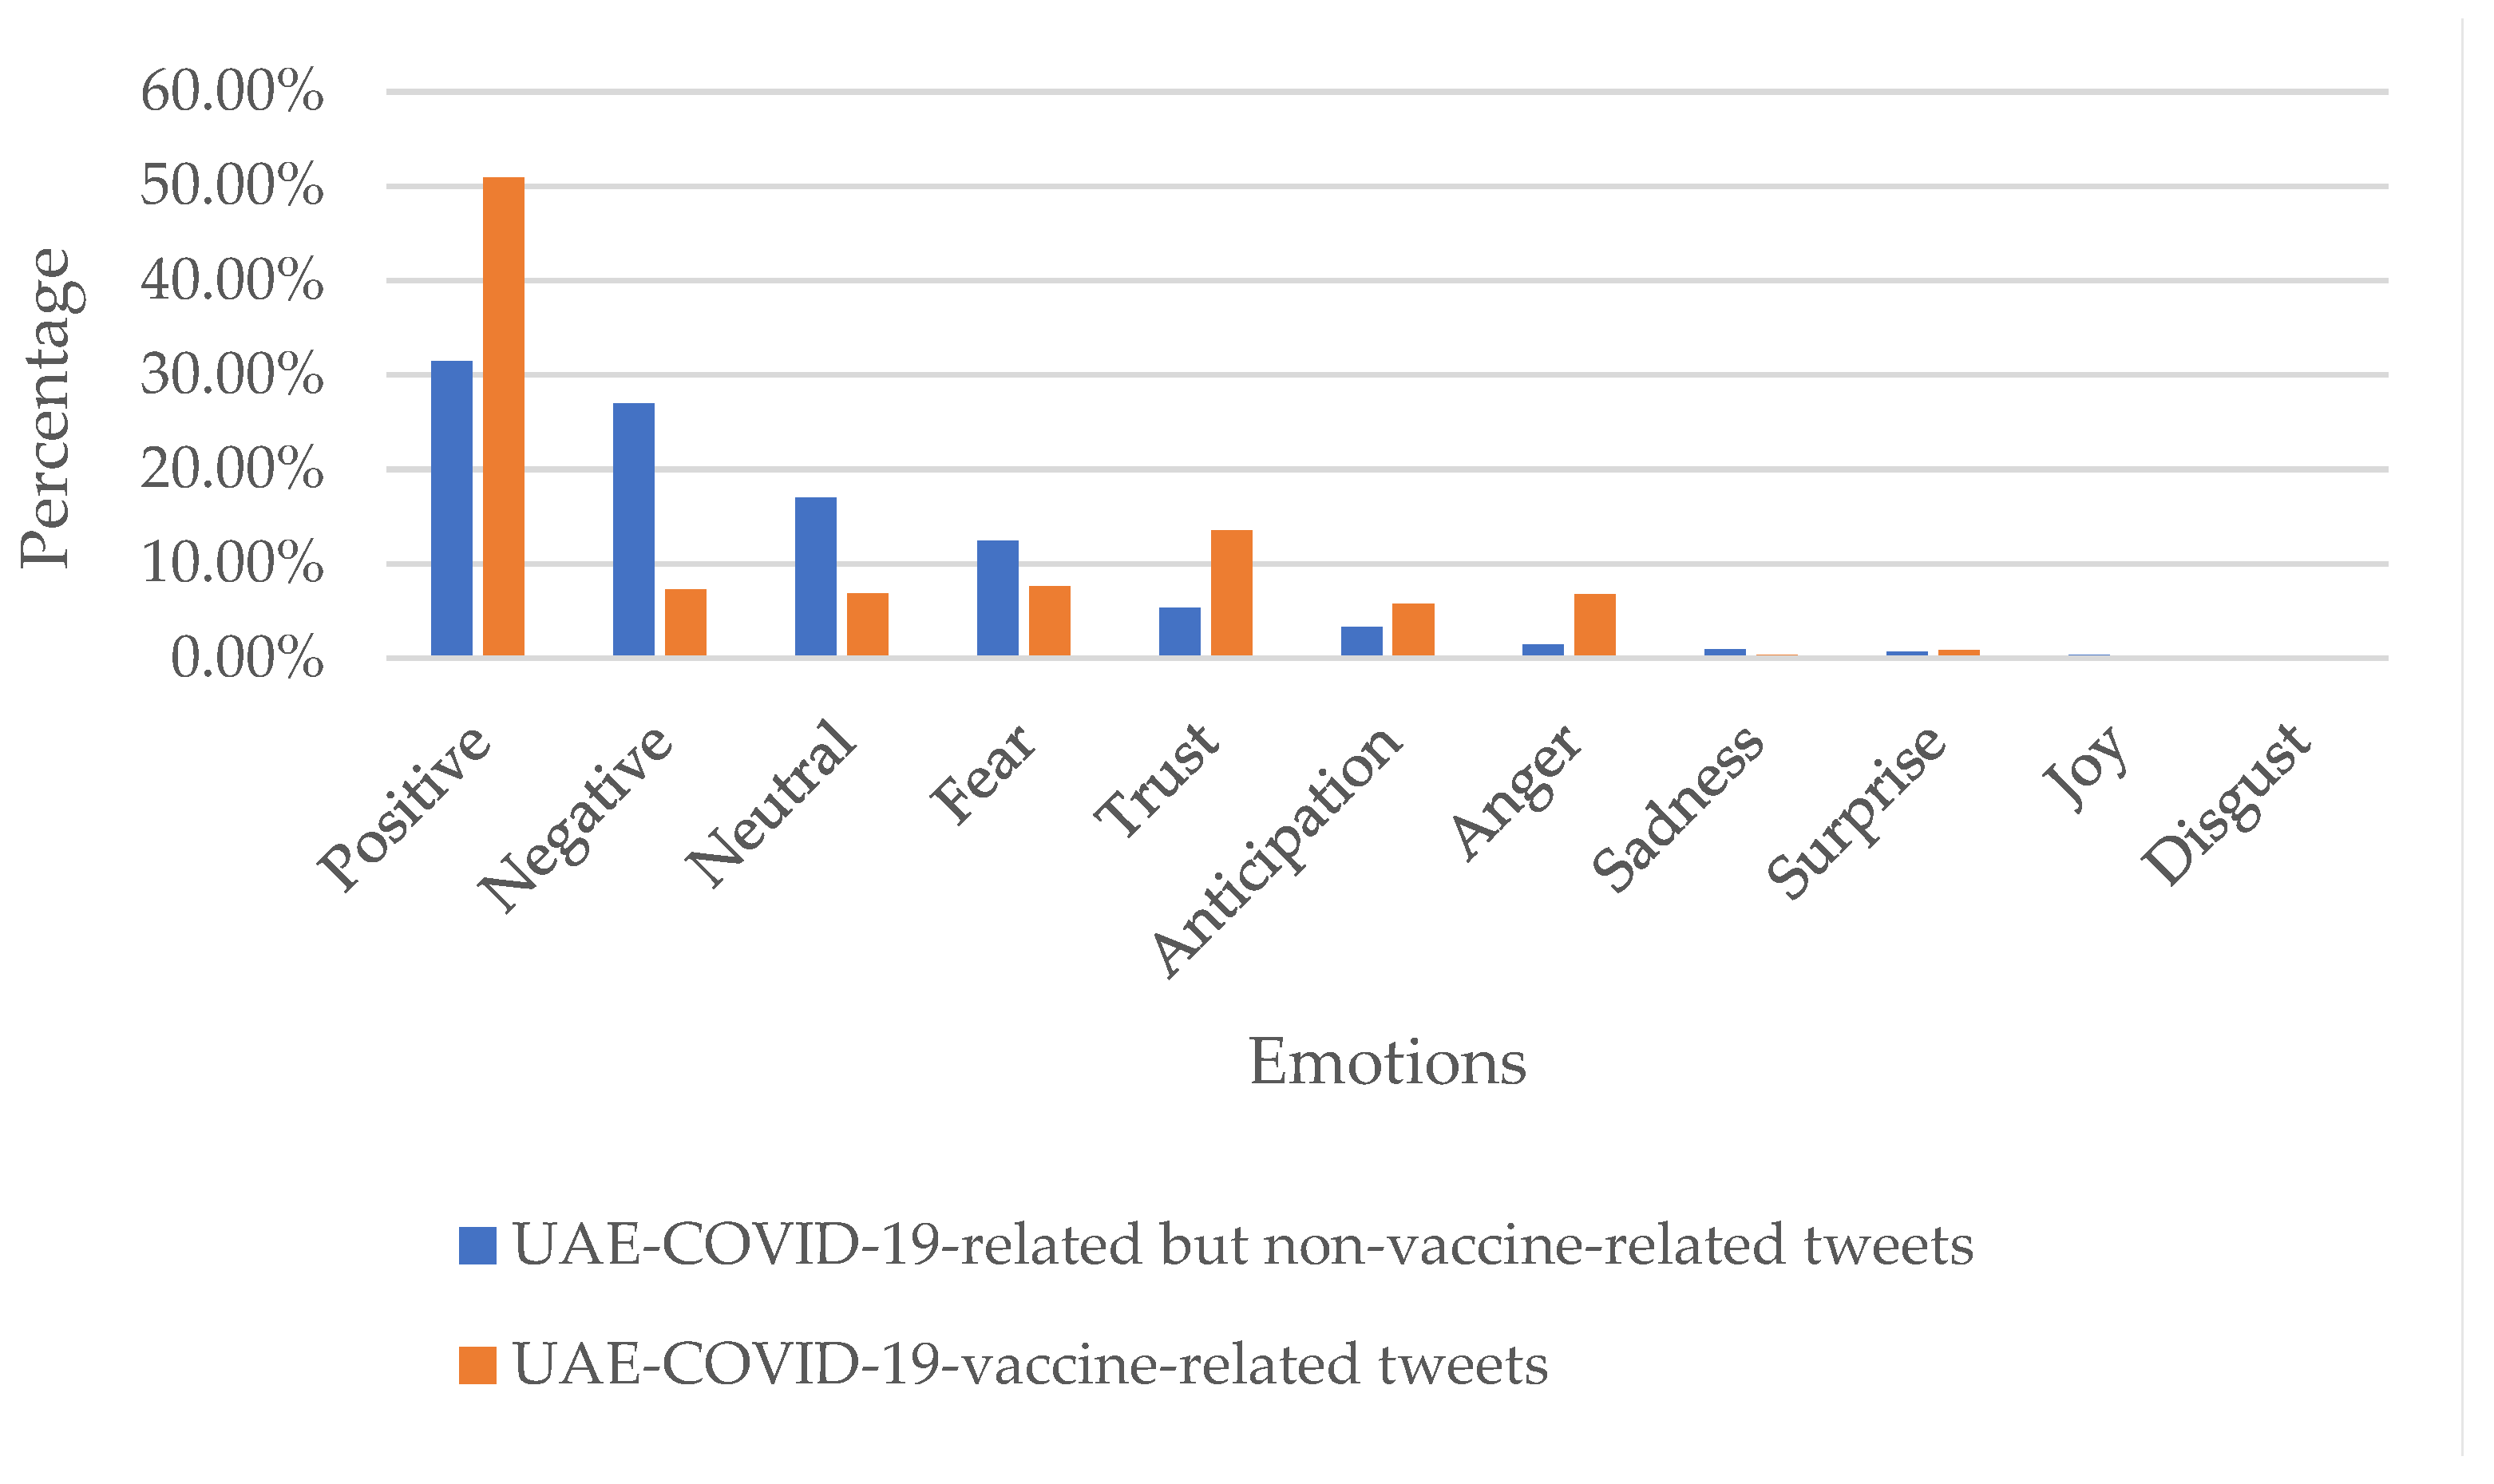
Figure 9 represents the prevalence of different emotions in our manually annotated tweets on UAE-COVID-19 for both vaccine-related (orange) and non-related (blue) tweets. Most of the tweets are classified as positive in both categories. Negative emotions are the second most prevalent in the non-related category, while trust is the second most prevalent emotion (after positive) in the vaccine-related category. Fear is the third most common emotion in general COVID-related tweets, while neutral is the third most prevalent in vaccine-related tweets. None of the tweets were classified as joy or disgust.
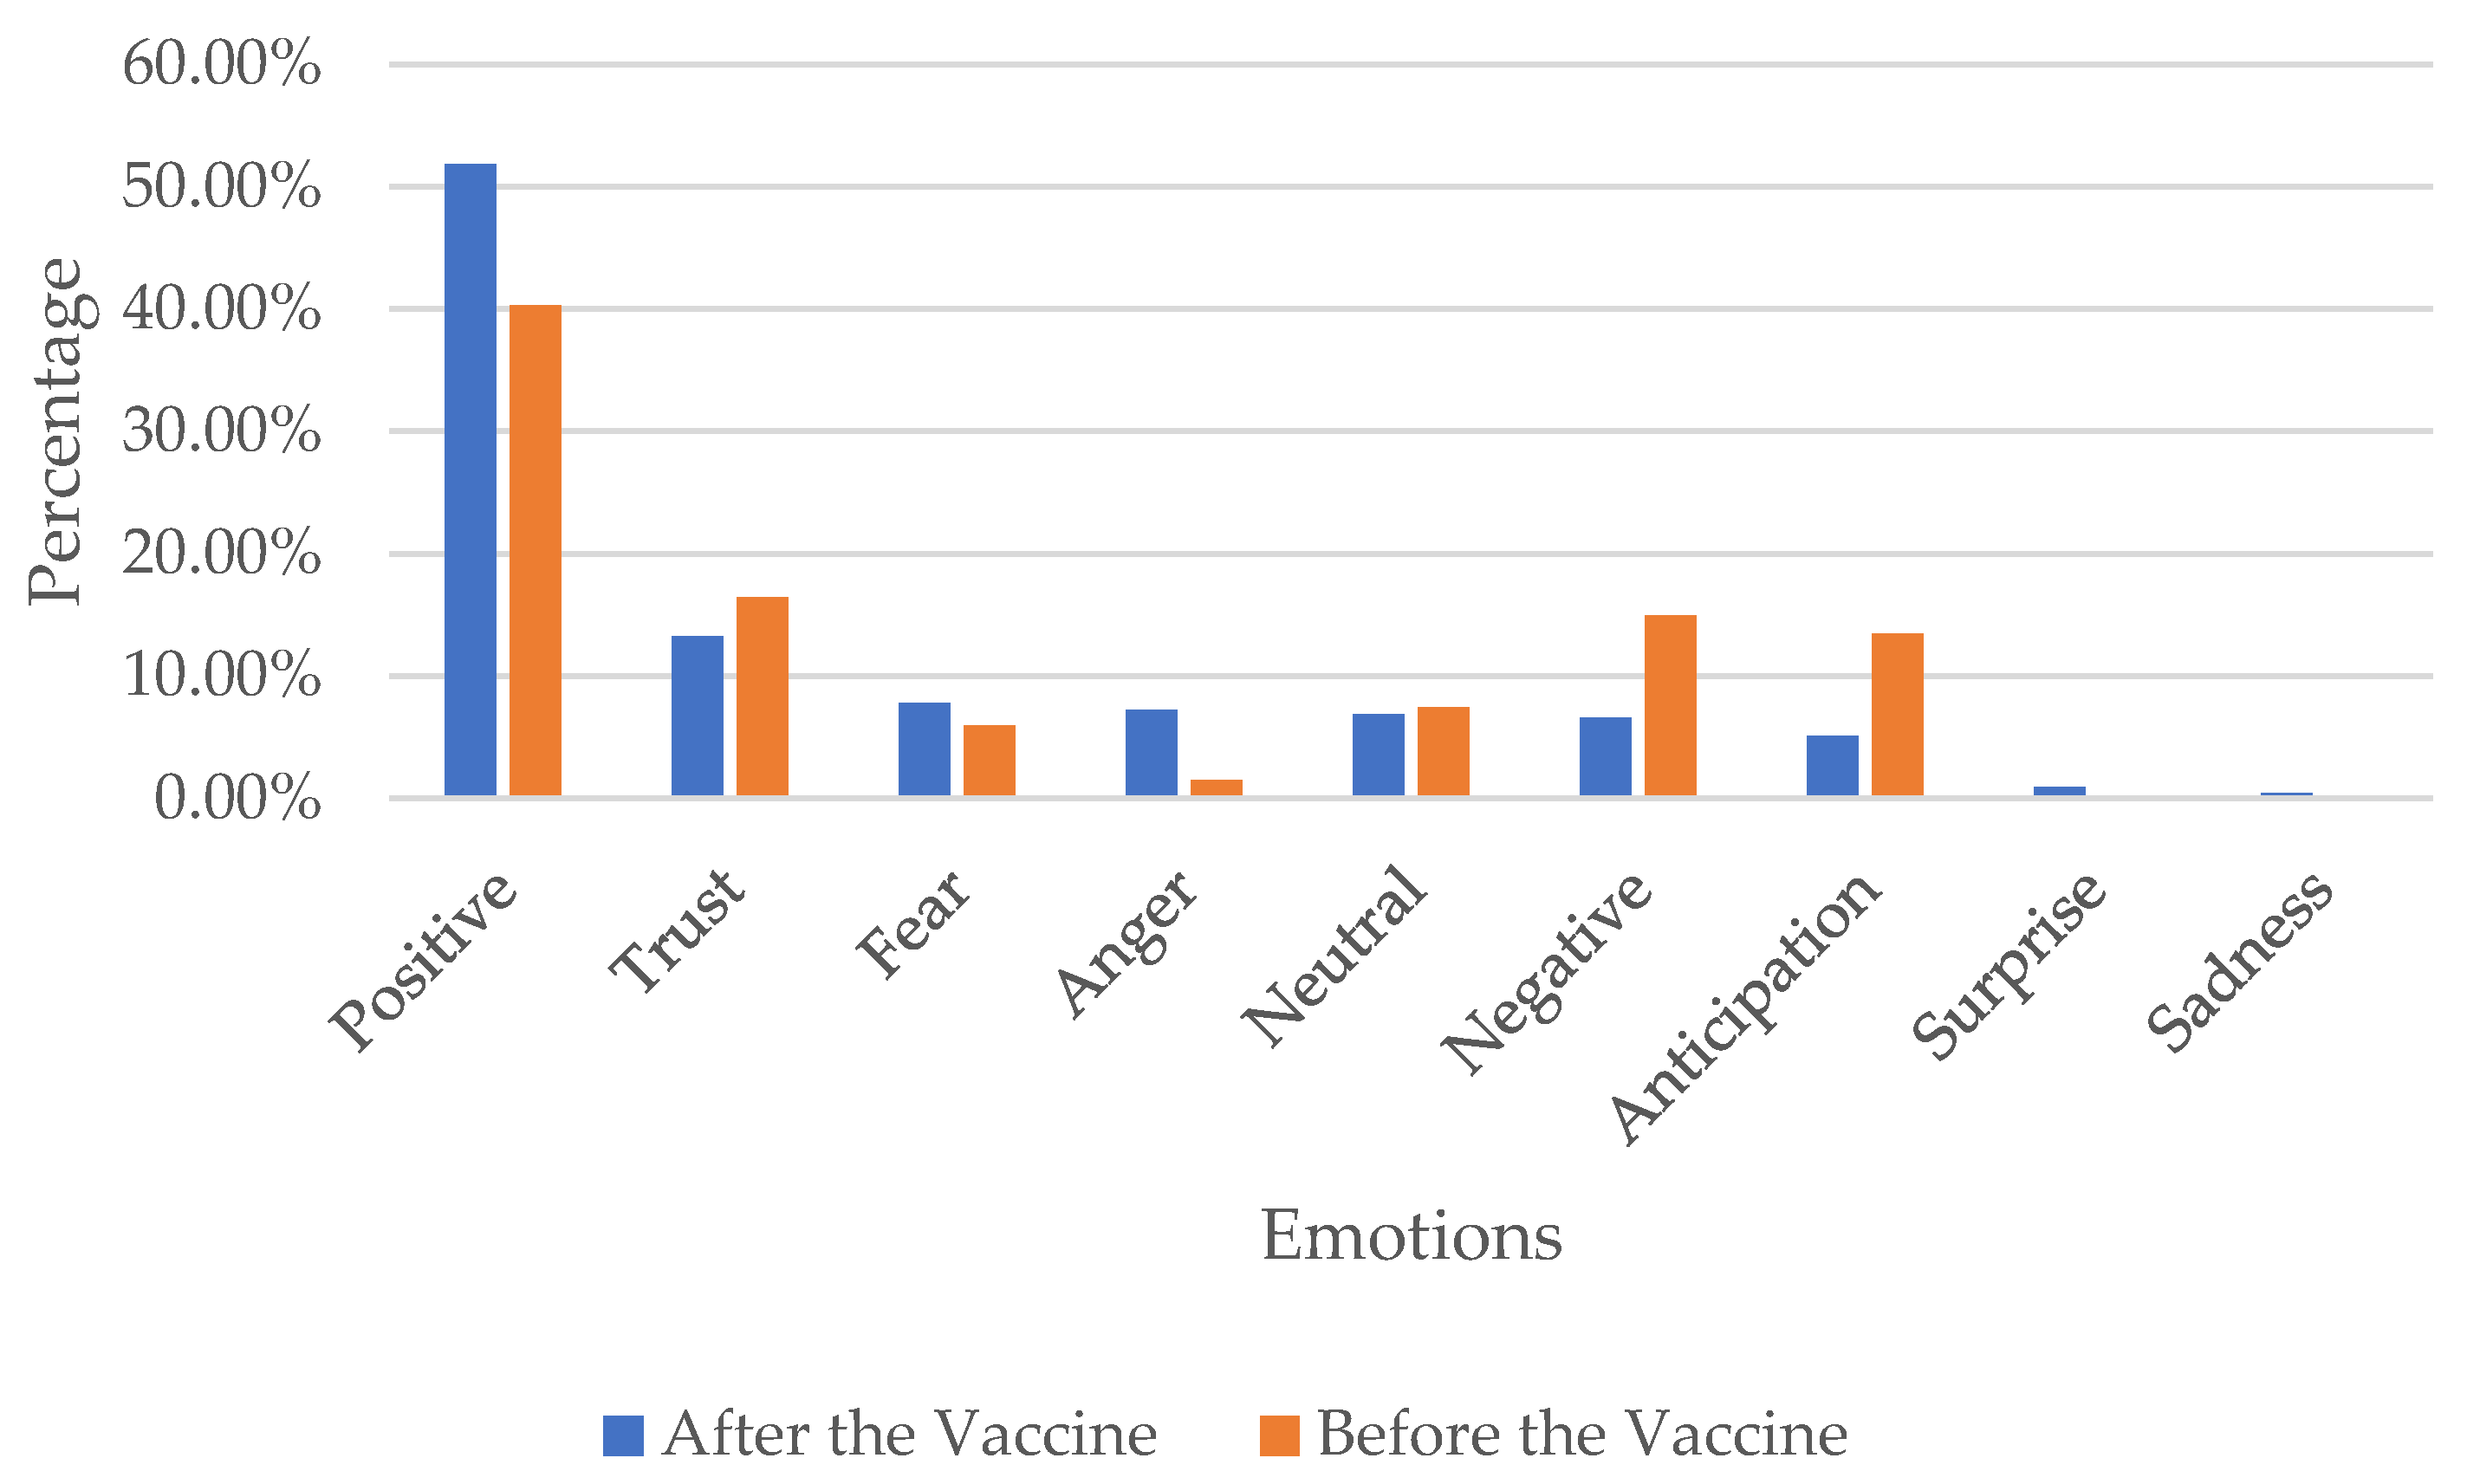
Figure 10 presents the emotions based on manual annotation before and after the vaccine commencement (September 14, 2020). People in the UAE tweeted more positive and fewer negative tweets after the vaccine when compared to the tweets before the vaccine (and vice versa). We also find that anger increased after the introduction of the vaccine, while trust declined slightly. Overall, the manual annotation suggests that the UAE’s population’s emotions were dominated by positive responses throughout. Before the vaccine, people in the UAE stayed mainly positive, with high trust in the government’s decisions. However, although positive emotions dominated after the vaccine, fear of the vaccine’s side effects was expressed. A relaxation of restrictions may account for additional fear among parts of the population. Overall, positive and trust emotions dominate in the tweets, suggesting broad support of government decisions among social media users.
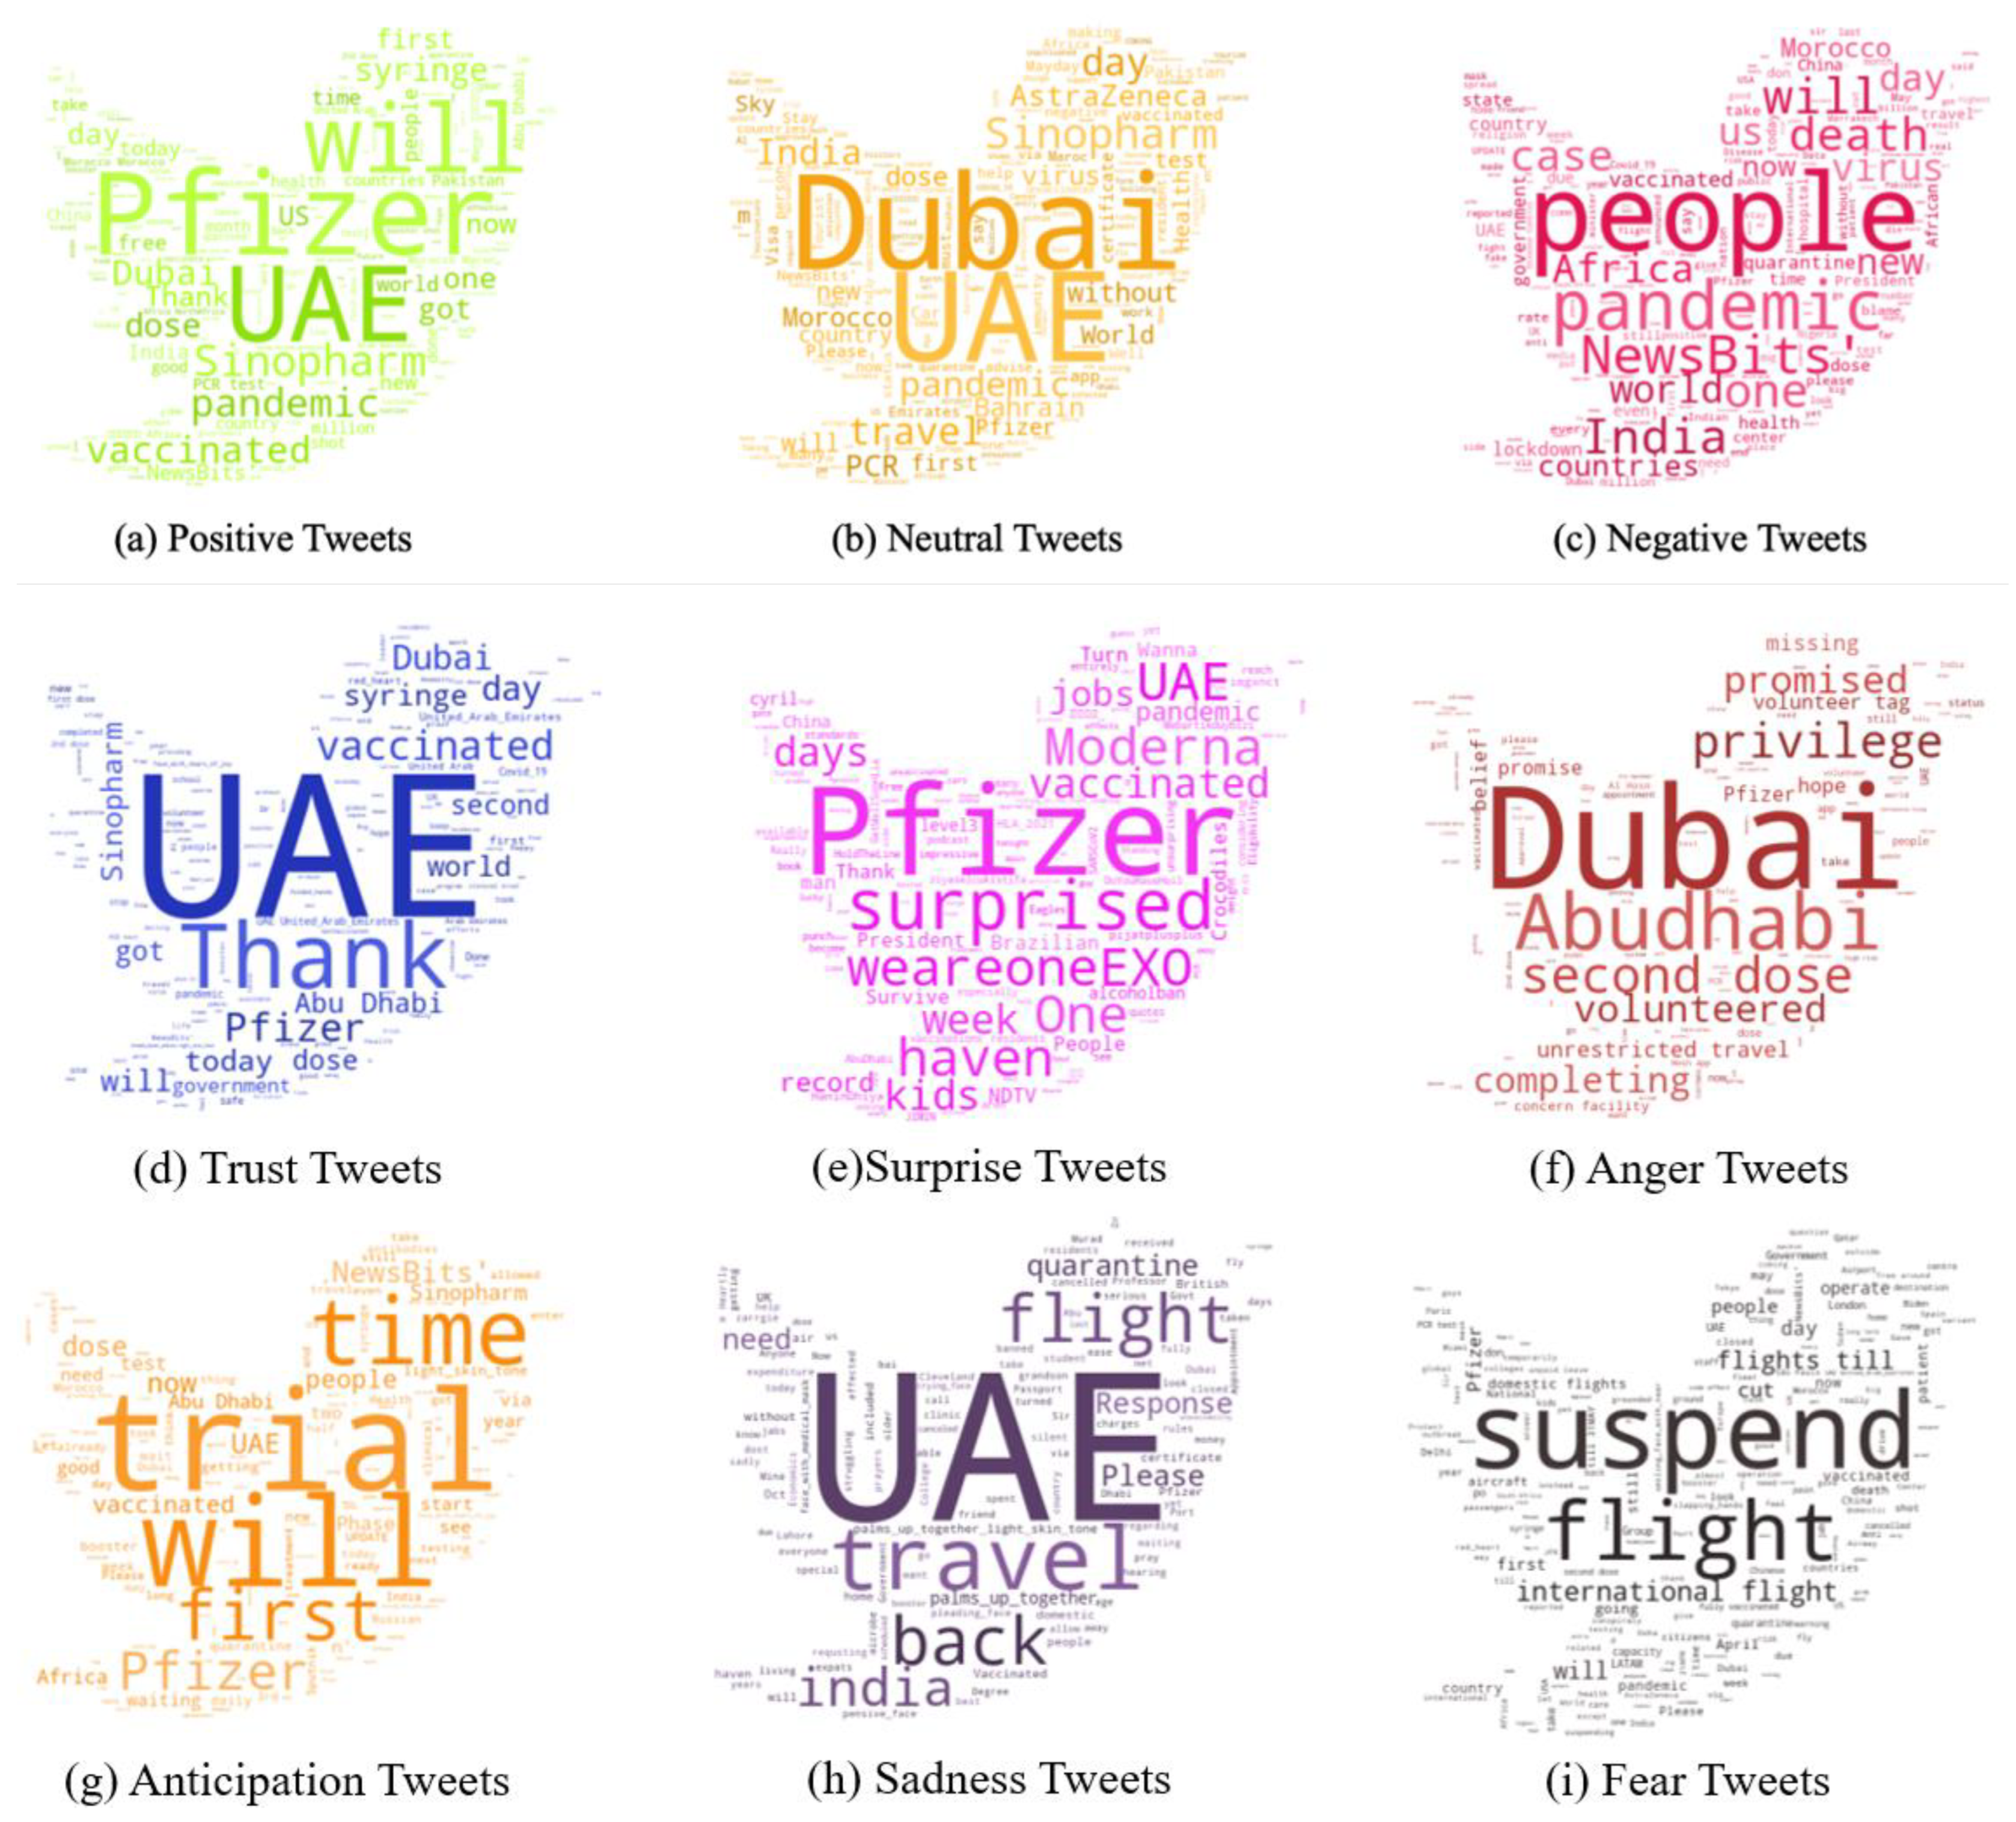
Figure 11 represents a word cloud for each emotion based on the manual annotation. We can see that people in the UAE mention Pfizer in tweets with positive sentiments or the emotions of surprise or anticipation. The UAE, Dubai, and the capital Abu-Dhabi mainly were mentioned in tweets with positive, neutral, and trust emotions. People tweet express trust in the government’s decisions in handling the pandemic and the vaccination process but also tweet about the cities of Abu Dhabi and Dubai with anger. This is due to lockdowns, and movement restrictions between the two cities. Both sad and fearful tweets focus on travel bans and flight suspensions between UAE and India, as Indians could not travel to their home country during the interruption period.
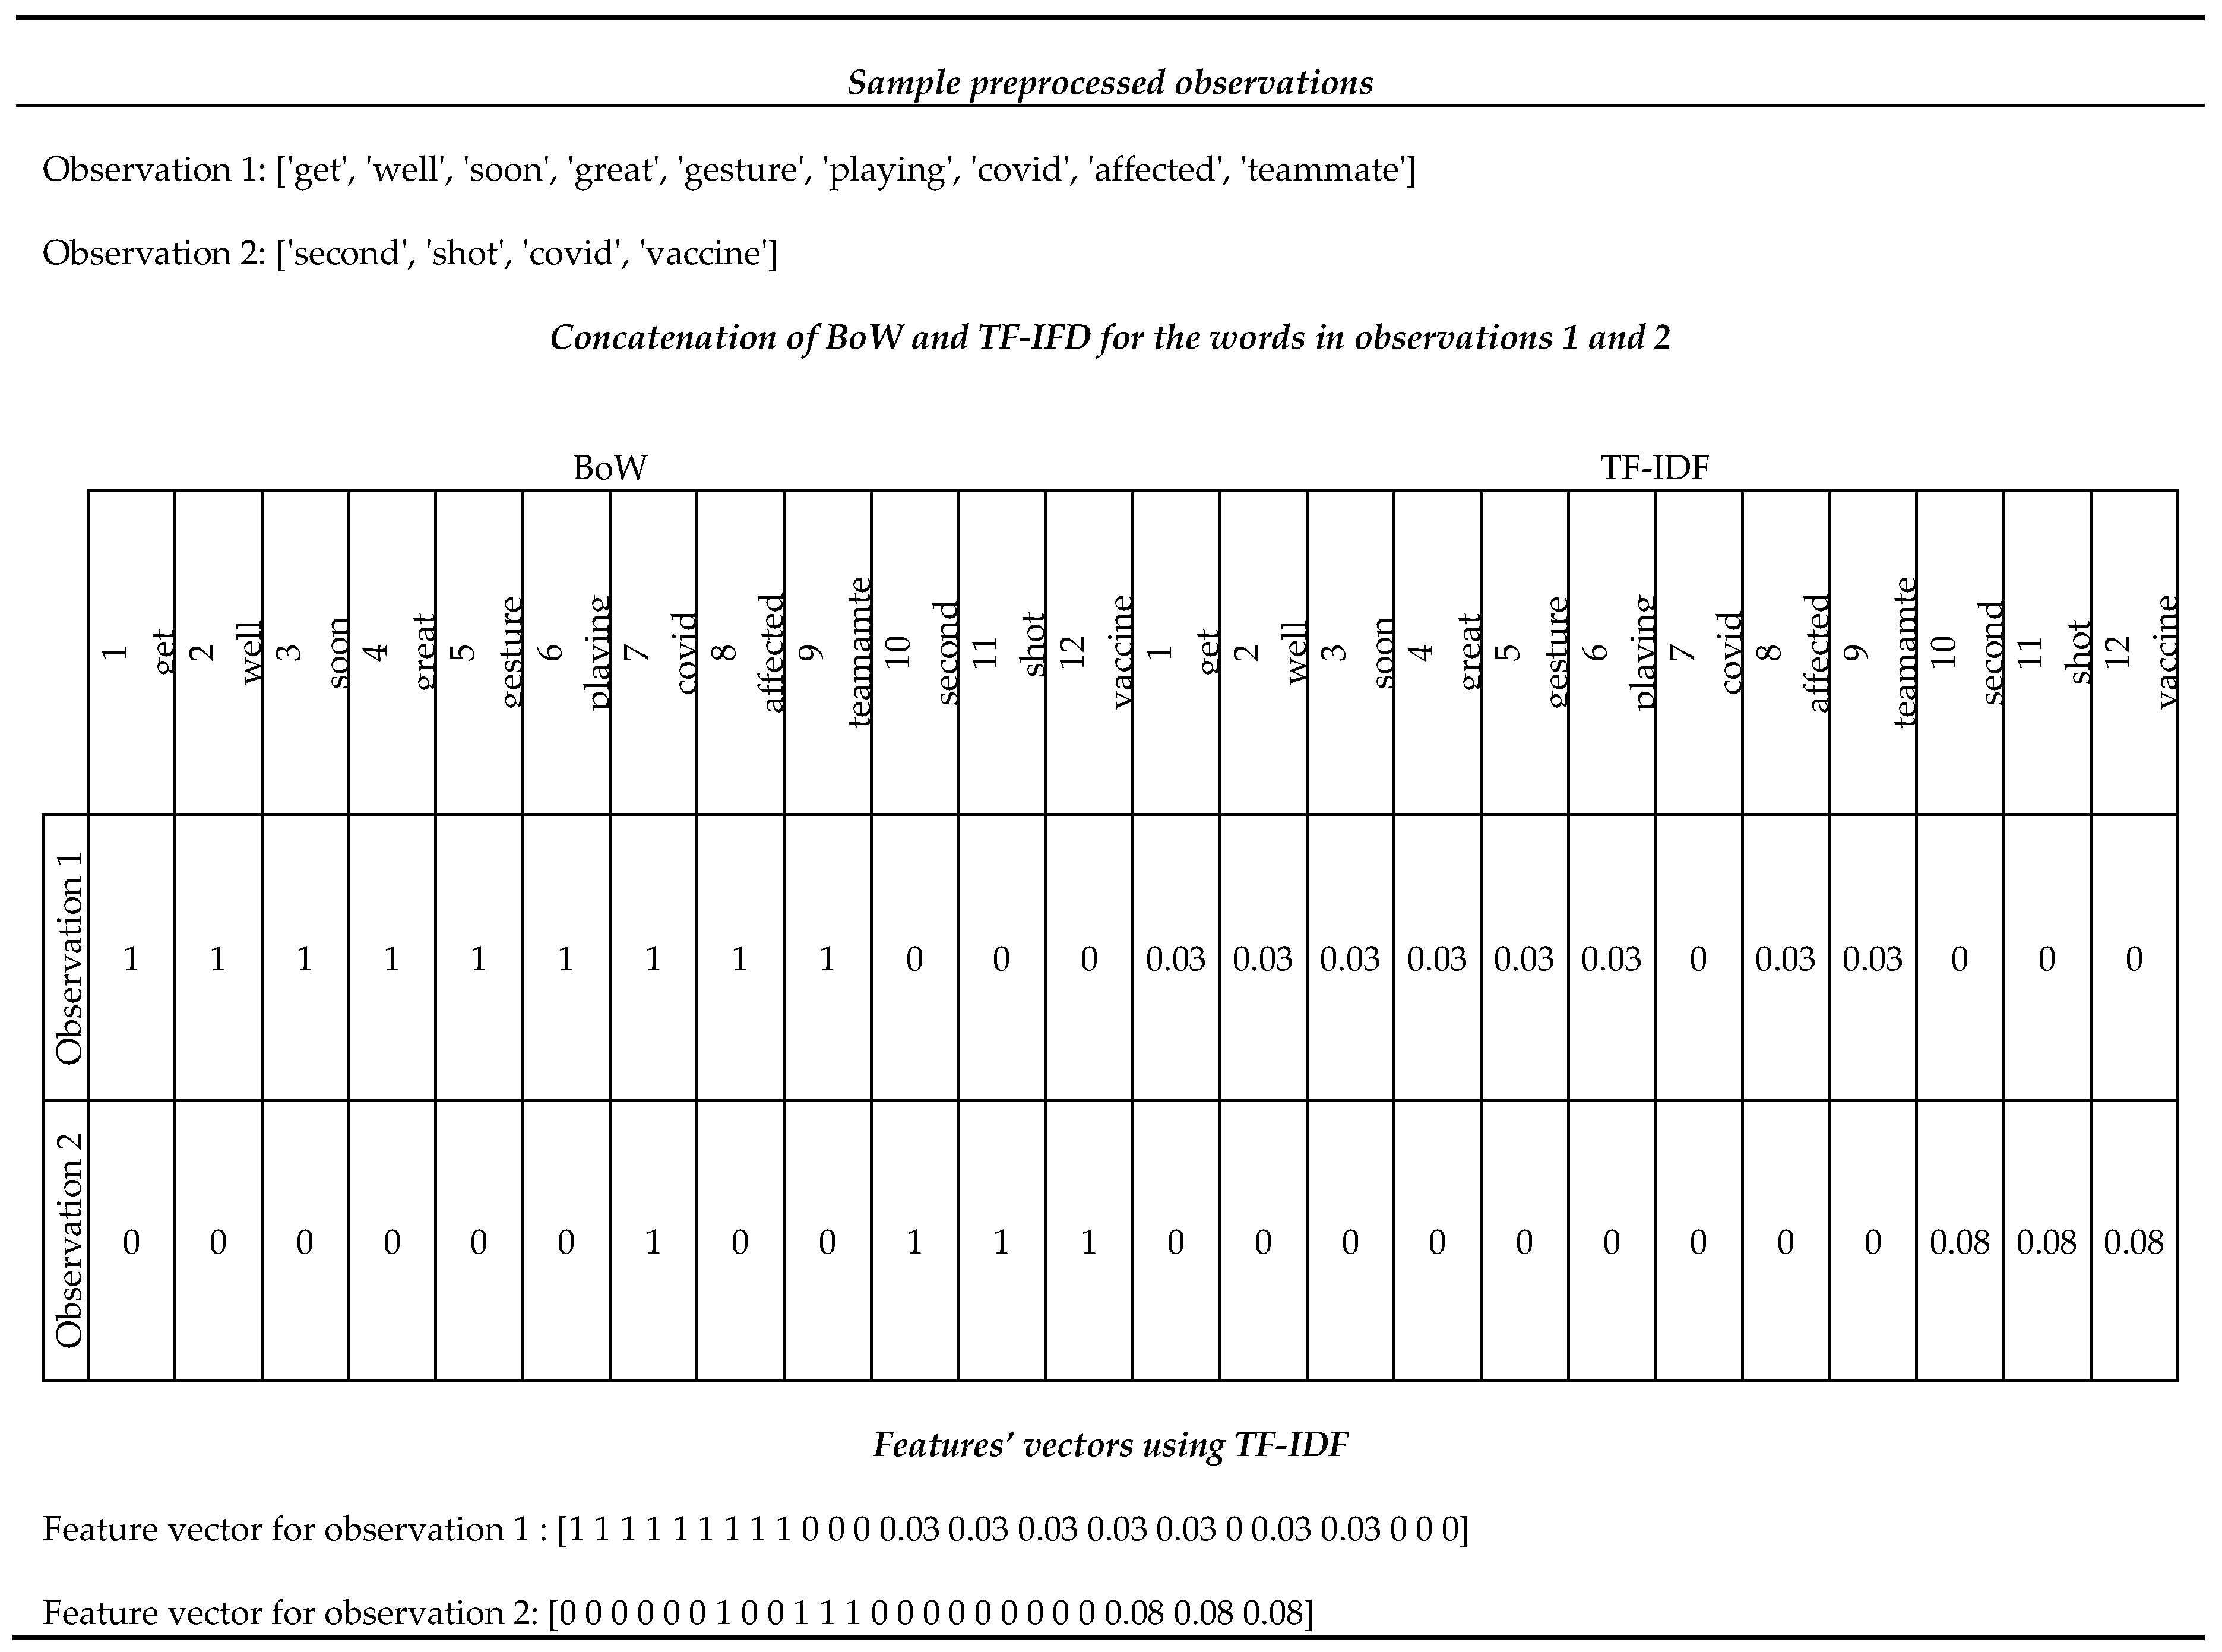
After annotation of tweets with gold emotion labels, we transform each tweet’s text into a feature vector over numeric features which is accepted as input by the machine learning algorithms we will apply to predict tweet emotion classes automatically [
61]. We use the concatenated Bag of Words (BoW) and Term Frequency-Inverse Document Frequency (TF-IDF) representations as numeric features. This method is the most accurate for sentiment analysis in the literature and performs better than BoW and TF-IDF alone [
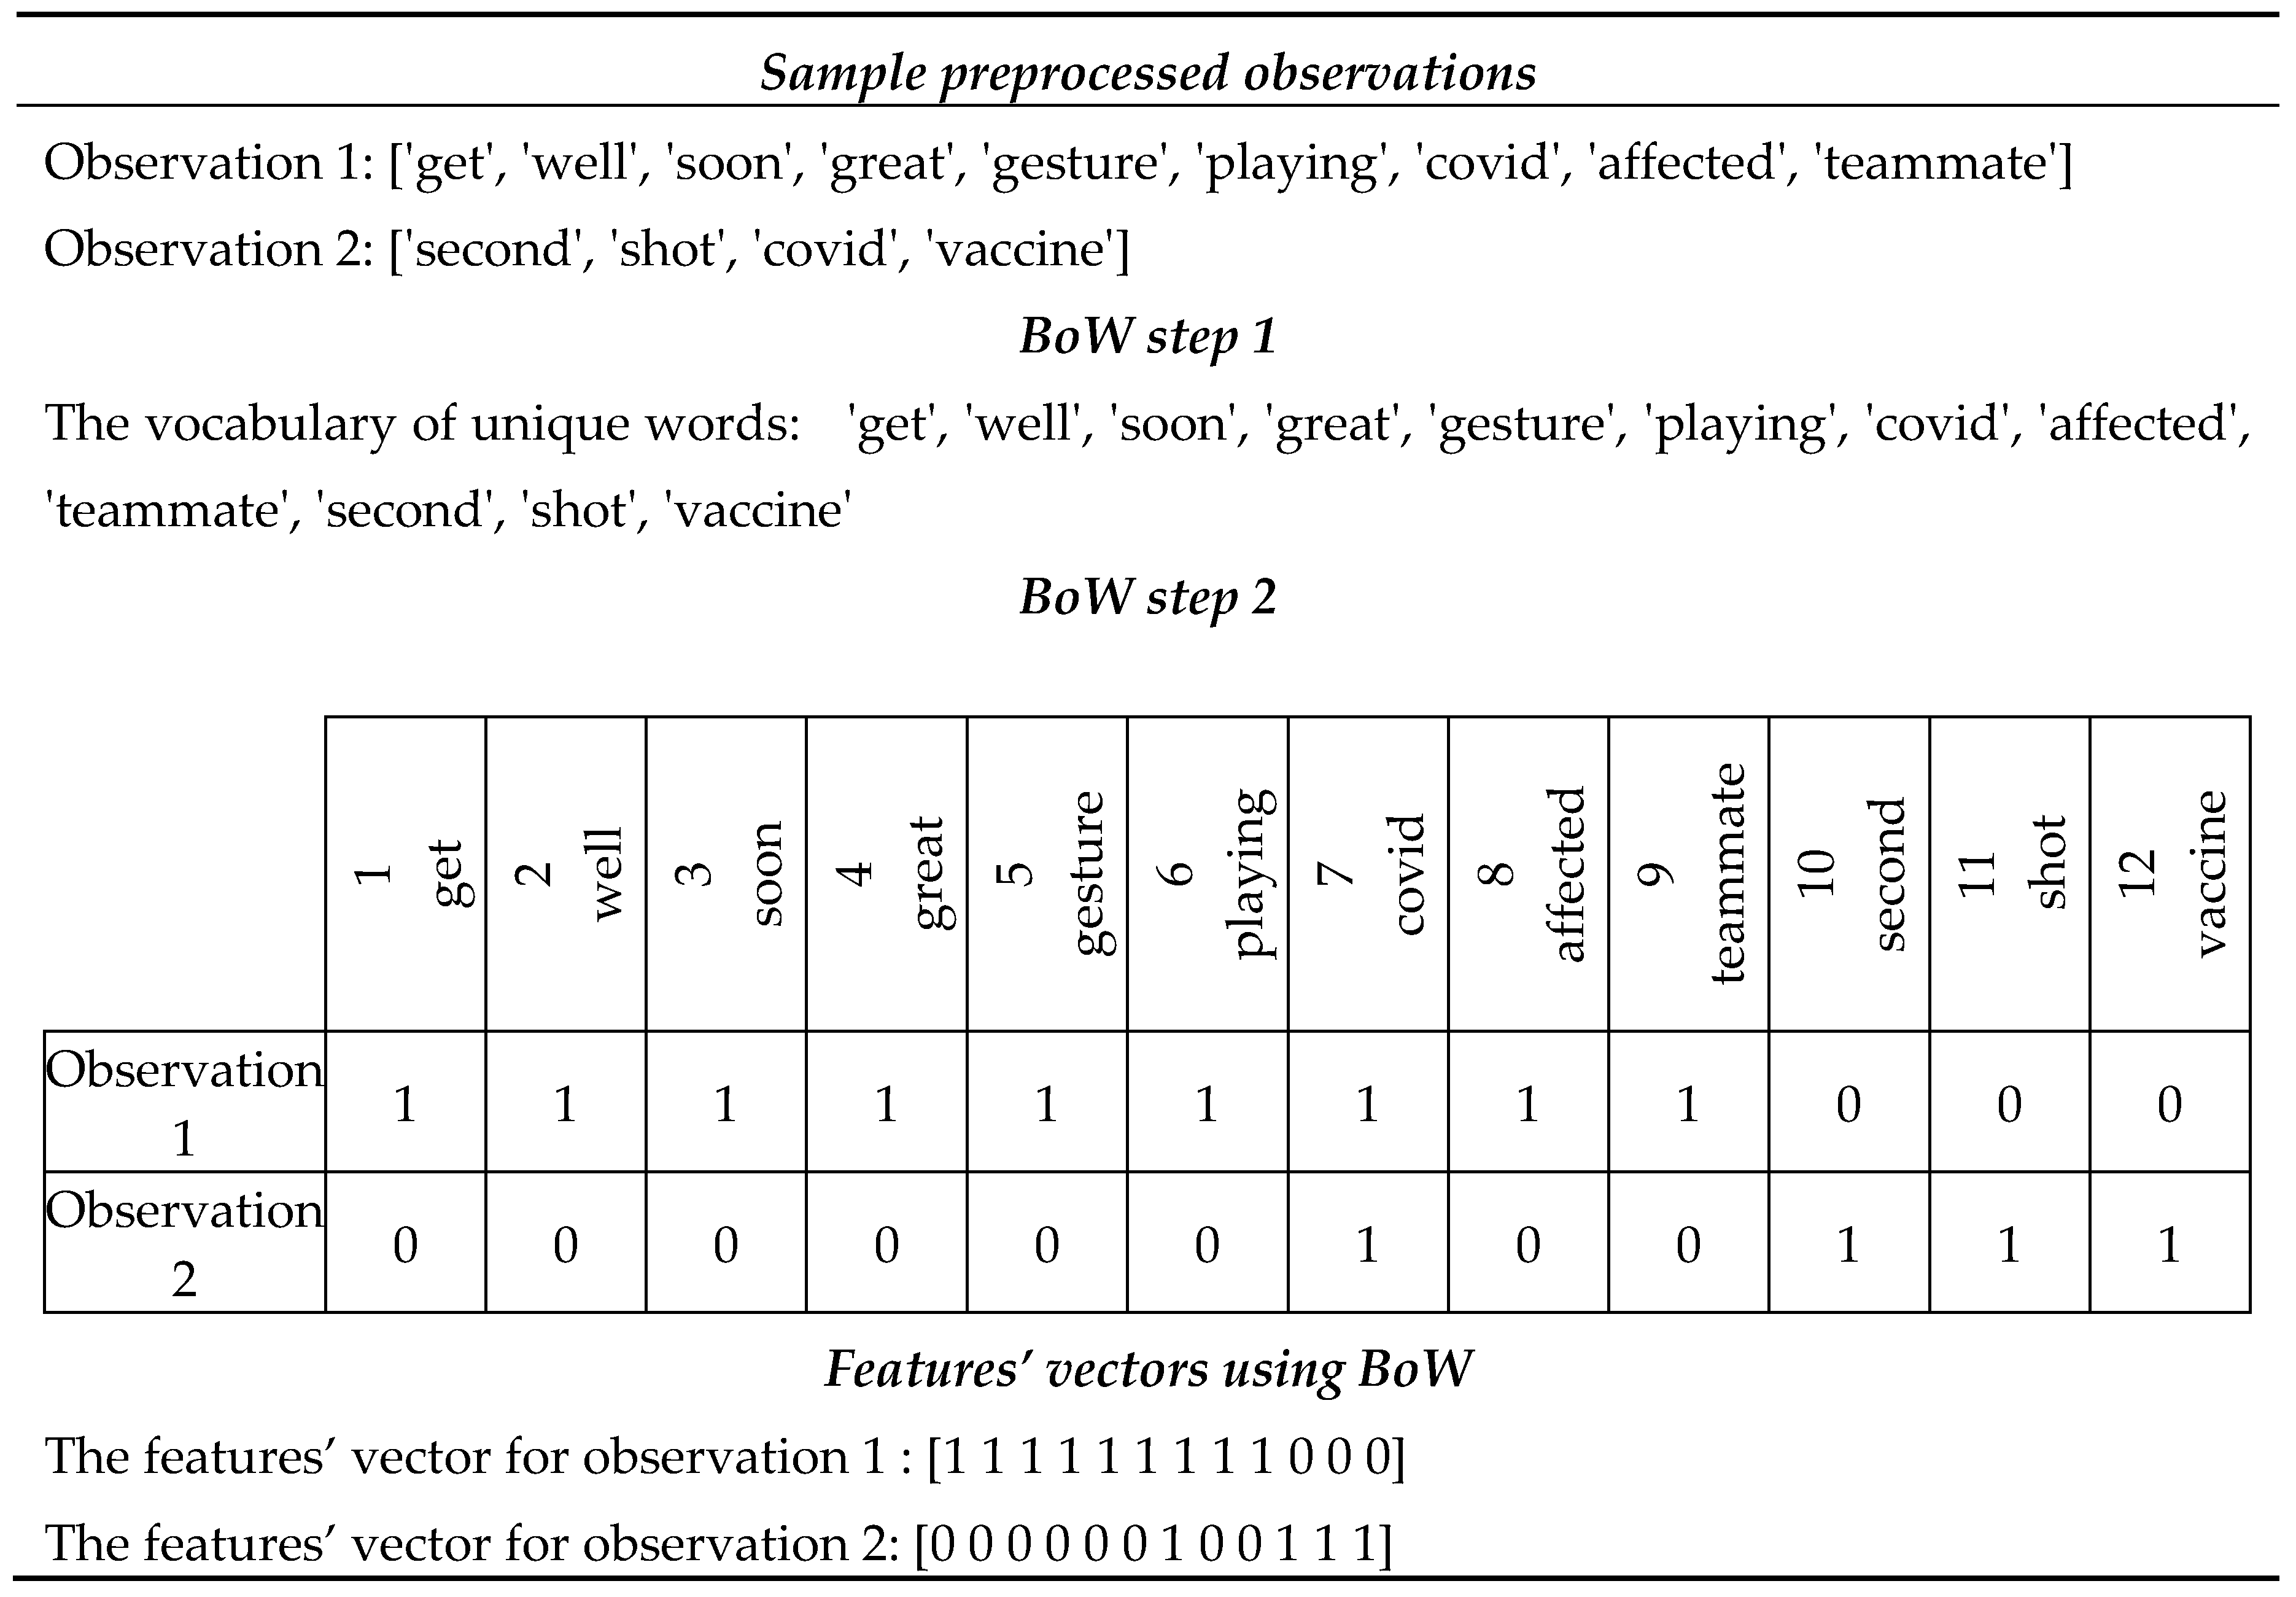
32]. The BoW is a technique that calculates the frequency of each word in a tweet regardless of its order, where the frequency of a word represents its importance [
52] and is used as a feature [
62]. It consists of two steps: 1) establishing the dimensions of the feature vector as the vocabulary of unique words in all the observations and 2) creating a vector for each observation in the dataset by instantiating each vector dimension with the term frequency of a particular word in the corresponding observation. An example of BoW is available in
Appendix A.
TF-IDF is a statistical technique that depicts how vital the word is to a tweet in a collection of tweets [
63]. It removes the limitation of BoW, where the most common word is given more importance. Instead, this technique compares the word’s frequency in a targeted tweet against the word’s average frequency in the whole collection. Intuitively, a word that is frequent in the target tweet but infrequent in the collection overall is an important feature as it is distinctive for the tweet at hand. Words that are frequent overall (e.g., ”the’’, or ”COVID”) are less distinctive and receive a lower TF-IDF score. E.g., unlike the word ”COVID” which is very frequent, the word "Pfizer" might be mentioned in only a small subset of tweets and is hence considered distinctive. If we aim to represent tweets related to the vaccine, the word "Pfizer" would receive a higher TF-IDF weight compared to the word "COVID" [
52].
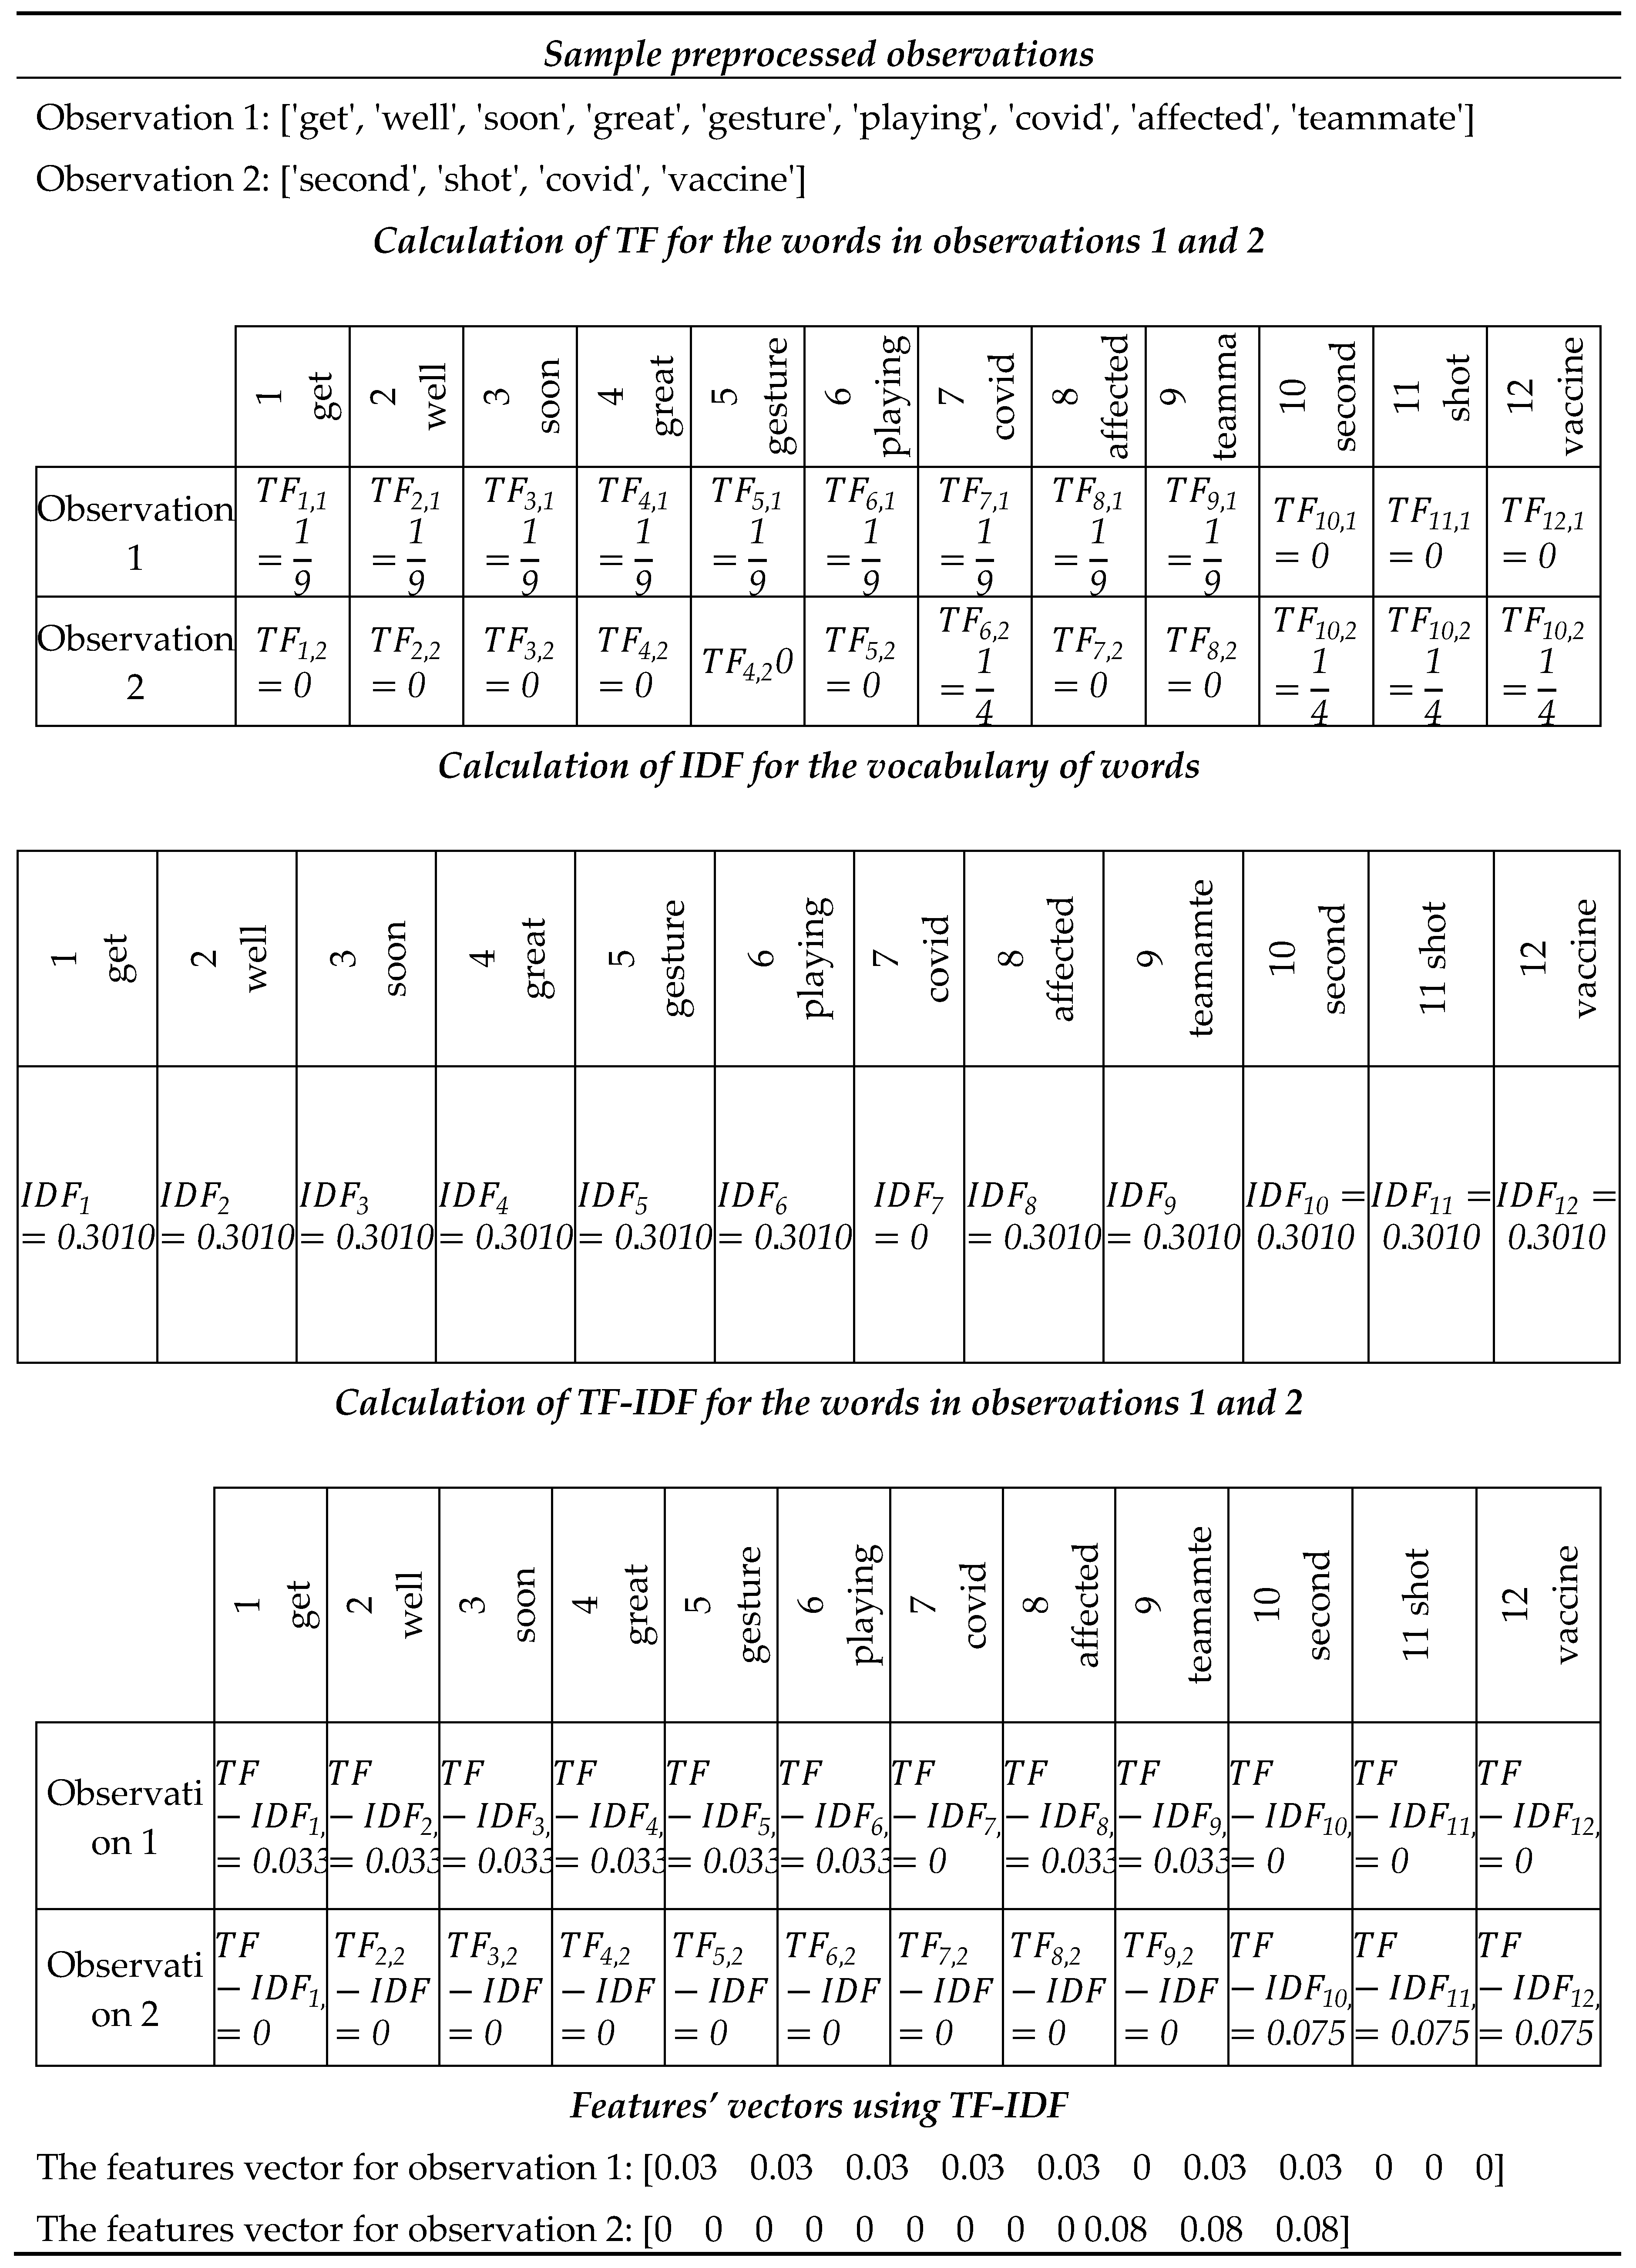
The TF-IDF for each unique word in each tweet is calculated using Equation (2).
where
is the TF-IDF for the word w in the
tweet.
is the term frequency of the word w in the
tweet. The
is calculated by dividing the number of times a word is repeated in a tweet by the total number of words in the same tweet (Equation 3).
is the inverse document frequency for the word, i.e., the reciprocal of the number of documents that contain w.
is calculated by squashing the division of the total number of tweets in the dataset by the number of tweets that includes the specific word through the log10 function (Equation 4). The log function is a convenient way to handle a large number of tweets and dampen an overly high impact of extremely high values [
52]. In this formula, terms common in each tweet in the dataset, such as "the" or "and," will rank low according to TF-IDF. However, words that frequently appear in a tweet, while not appearing many in other tweets, would mean that such words are relevant; i.e., the word "china" will rank high and is considered relevant to the topic “vaccine”. If we aim to find tweets related to the Chinese vaccine, the word "china" would be highly weighted compared to the word "the" [
52].
where
represents the number of times the word appears in the
tweet, and
represents the total number of words in the
tweet.
represents the total number of tweets in the dataset, and
indicates the
tweet. An example of TF-IDF is available in
Appendix C.
Appendix D shows an example of the feature extraction using concatenated BoW and TF-IDF.
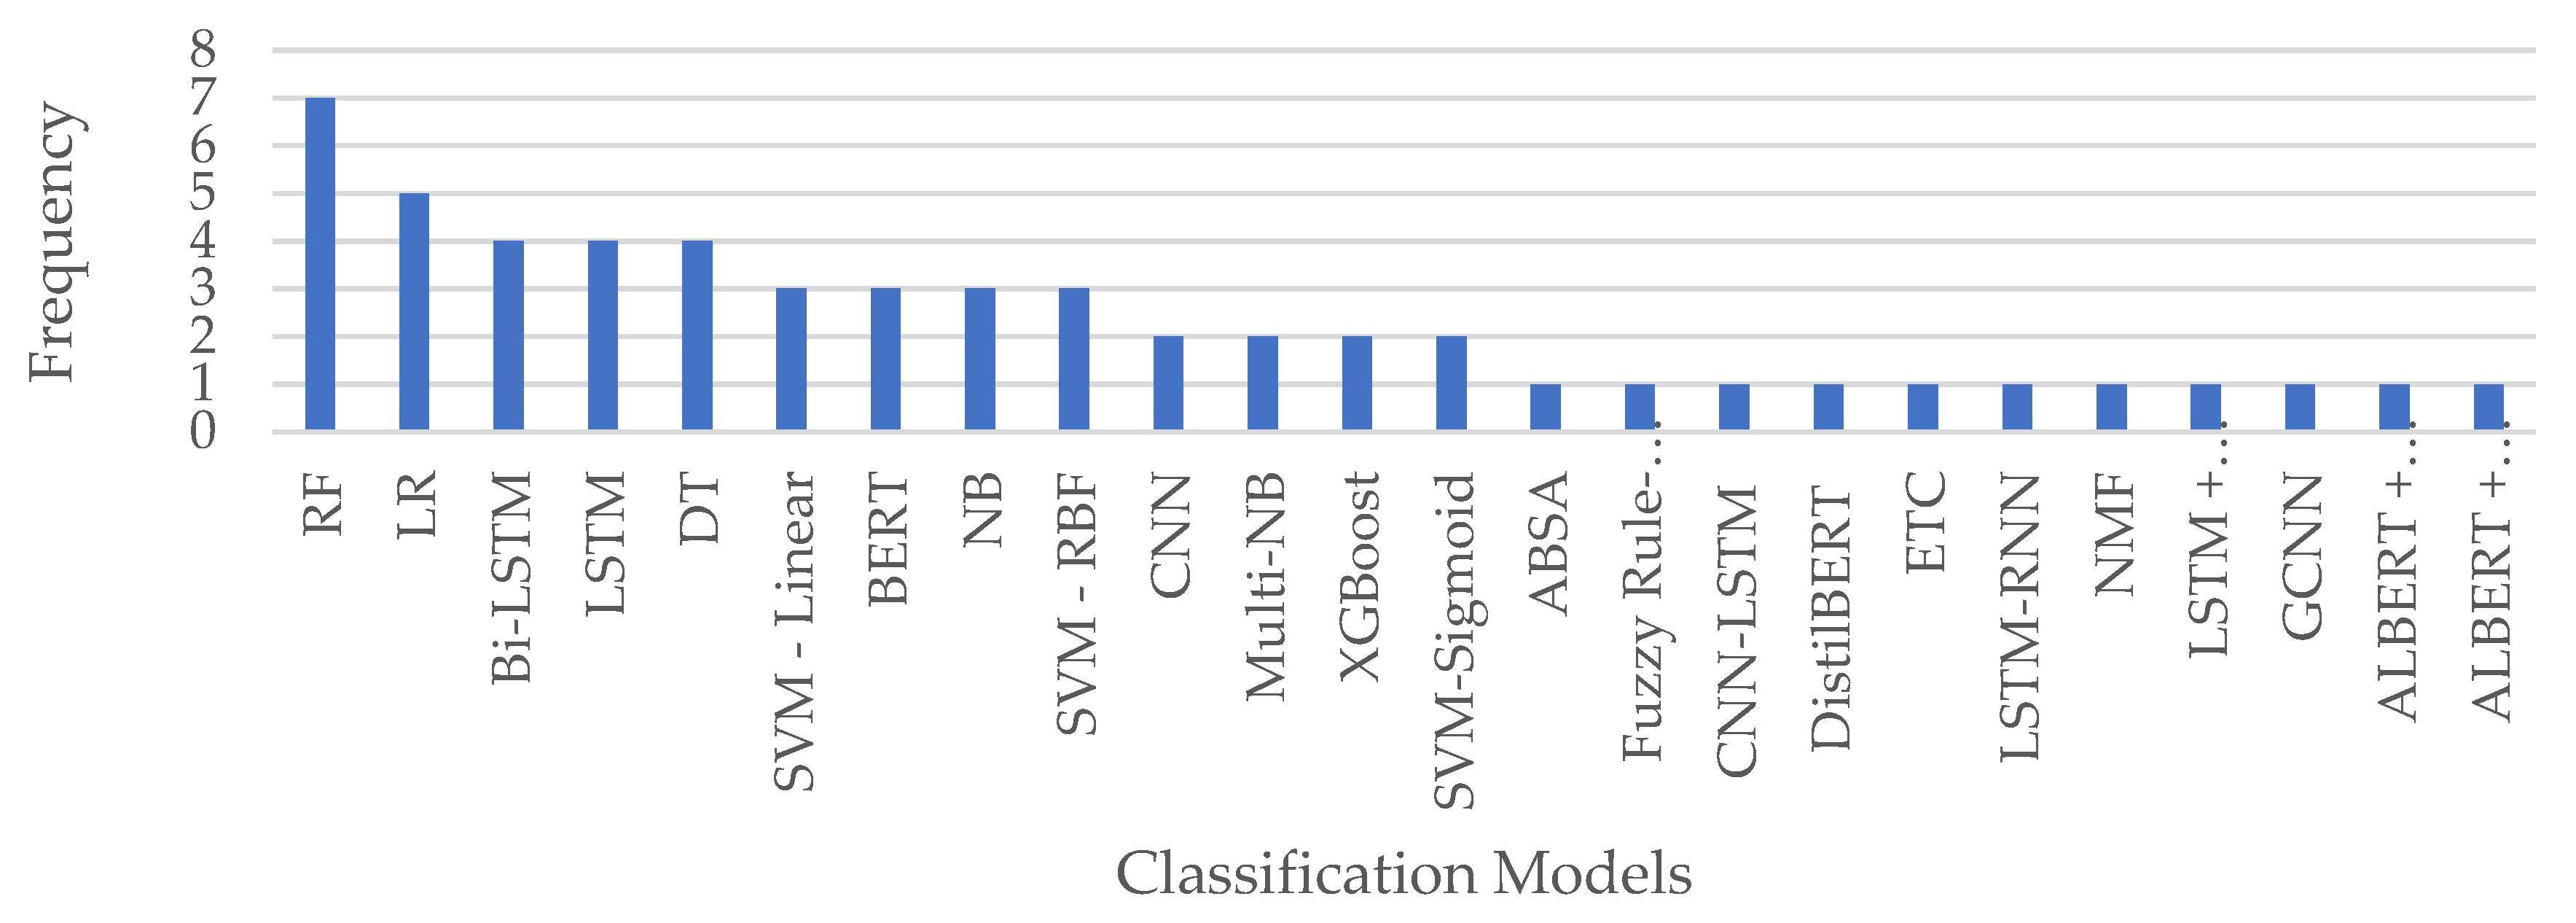
We select Random Forest (RF) and Logistic Regression (LR) to evaluate our proposed framework, as these are the most used machine learning models from the literature as illustrated in
Figure 12.
Random Forest (RF)
RF is a supervised classification machine learning model based on a decision tree. This model builds several trees by first selecting random samples from the dataset. It successively selects a feature that most cleanly splits the current data set into parts that belong to as few different gold classes as possible. It does so recursively until each of the final splits corresponds to only a single gold class [
64]. At test time, an unseen tweet is passed through the tree, choosing paths according to its feature values, and the final predicted class corresponds to the class of the leaf node it ends up in. In a random forest, such predictions from multiple trees are collected, and the final label is predicted by a majority vote as stated in Equation (5).
where
is the emotion of a tweet and
is the number of decision trees.
Logistic Regression (LR)
LR is another supervised machine learning model which predicts one of two classes by (1) multiplying the feature vector representing a tweet with a learned weight vector and (2) passing the result through a Sigmoid function that predicts the likelihood of a tweet belonging to a certain emotion or class on a scale from 0 (the tweet certainly does not express the emotion) to 1 (the tweet expresses the emotion with 100% certainty) [
65]. In this case study, we will use LR as a multiclass model.
where
represents the probability of each emotion classification,
is the tweet, and
and
are the regression coefficients representing the intercept and the slope respectively. The regression coefficient values are calculated using maximum likelihood estimation.
Experimental environment and hyperparameter tuning
To evaluate the performance of our framework, we use the COVID-19-vaccine-events-related dataset, which consists of 813 tweets (
Figure 10) and emotion labels, as shown in Figure 15. The experiments were run on Ubuntu 20.04 with 1024 GB RAM and 2 AMD EPYC 7552 48-Core, 96-Thread, 2.20 GHz Processors, using Python 3.9. Through Python, we used the following packages: Keras, NumPy, Pandas, Scikit-learn, TensorFlow, and Matplotlib for plotting the figures. As shown in
Table 4, for the hyperparameter tuning, we used the optimal values obtained in the literature for each parameter of the algorithms under study. The optimal parameters used in our experiments are calculated based on the GridSearchCV method as shown in
Table 4.
To develop the machine learning model, we split the dataset using 10-fold cross-validation. Moreover, we validate the model using the following evaluation metrics:
Accuracy: It is the rate of correct classifications by the model. The accuracy score lies between 0 and 1, with 1 indicating that the model correctly classifies all the observations in the testing dataset.
Precision: It is defined as the correct class classification rate out of all the class predictions. The precision value lies between 0 and 1, with 1 indicating that every observation classified in a class belongs to that class.
Recall: It is defined as the correct class classification rate out of all the class observations. The recall value lies between 0 and 1, with 1 indicating that all the observations from a class are indeed classified as belonging to that class.
F-measure: It is defined as the harmonic mean of precision and recall. The value of the F-measure lies between 0 and 1, with 1 indicating a perfect value of precision and recall.
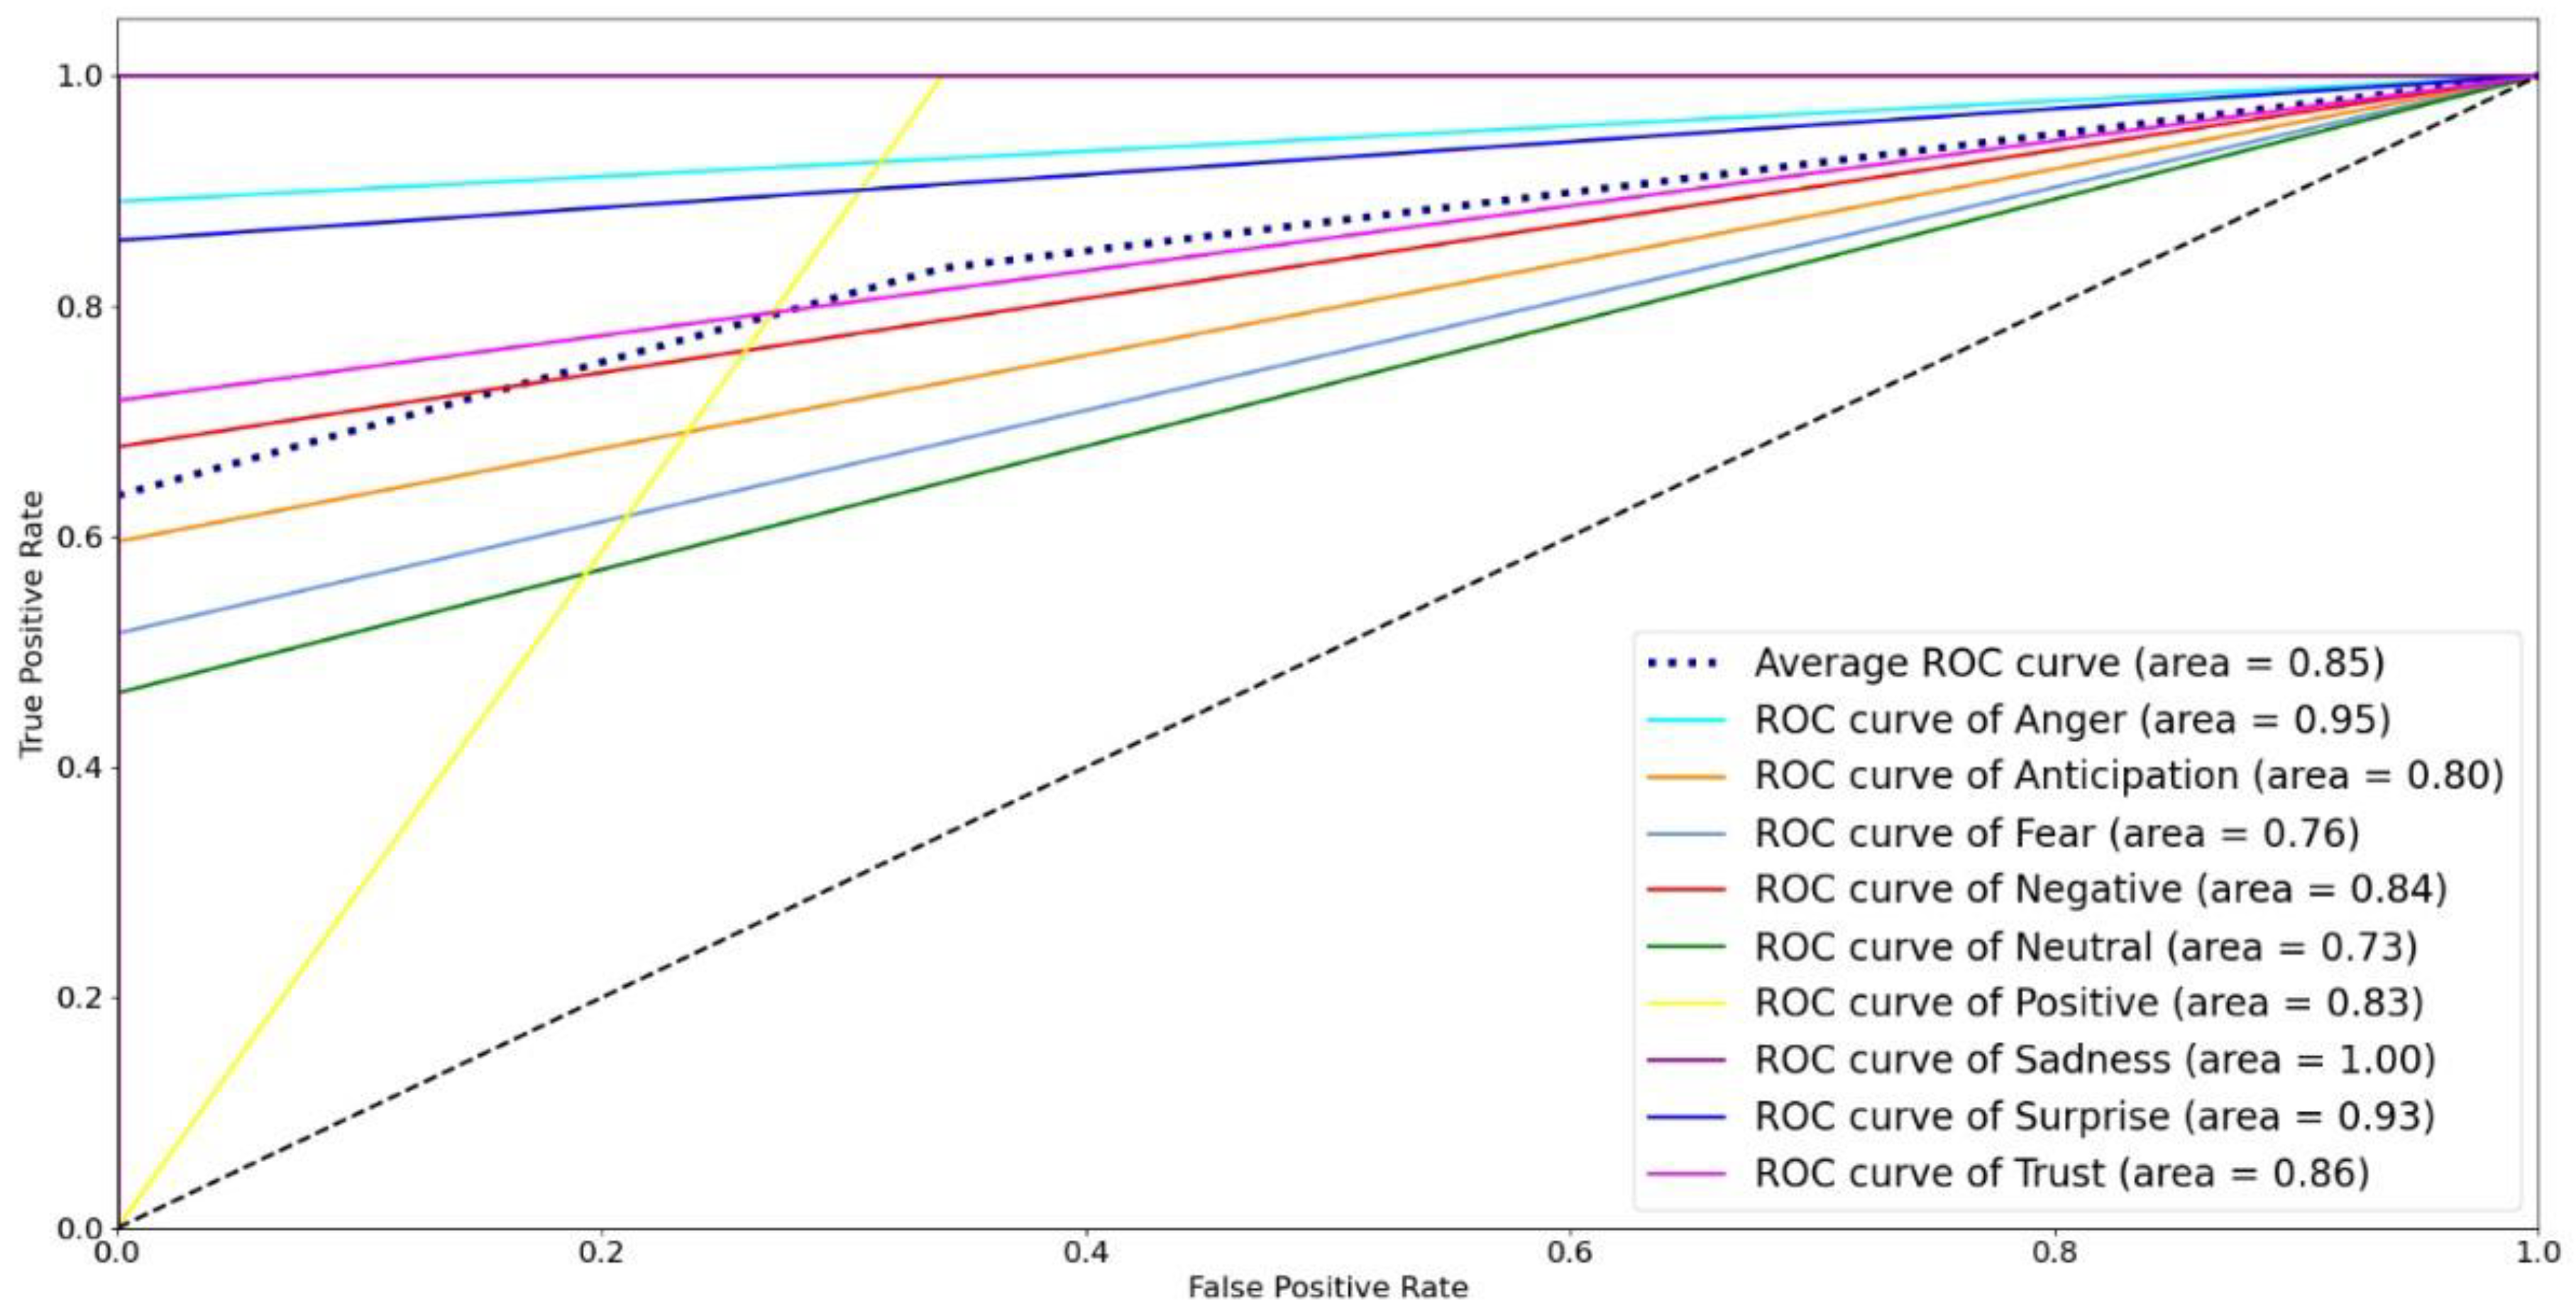
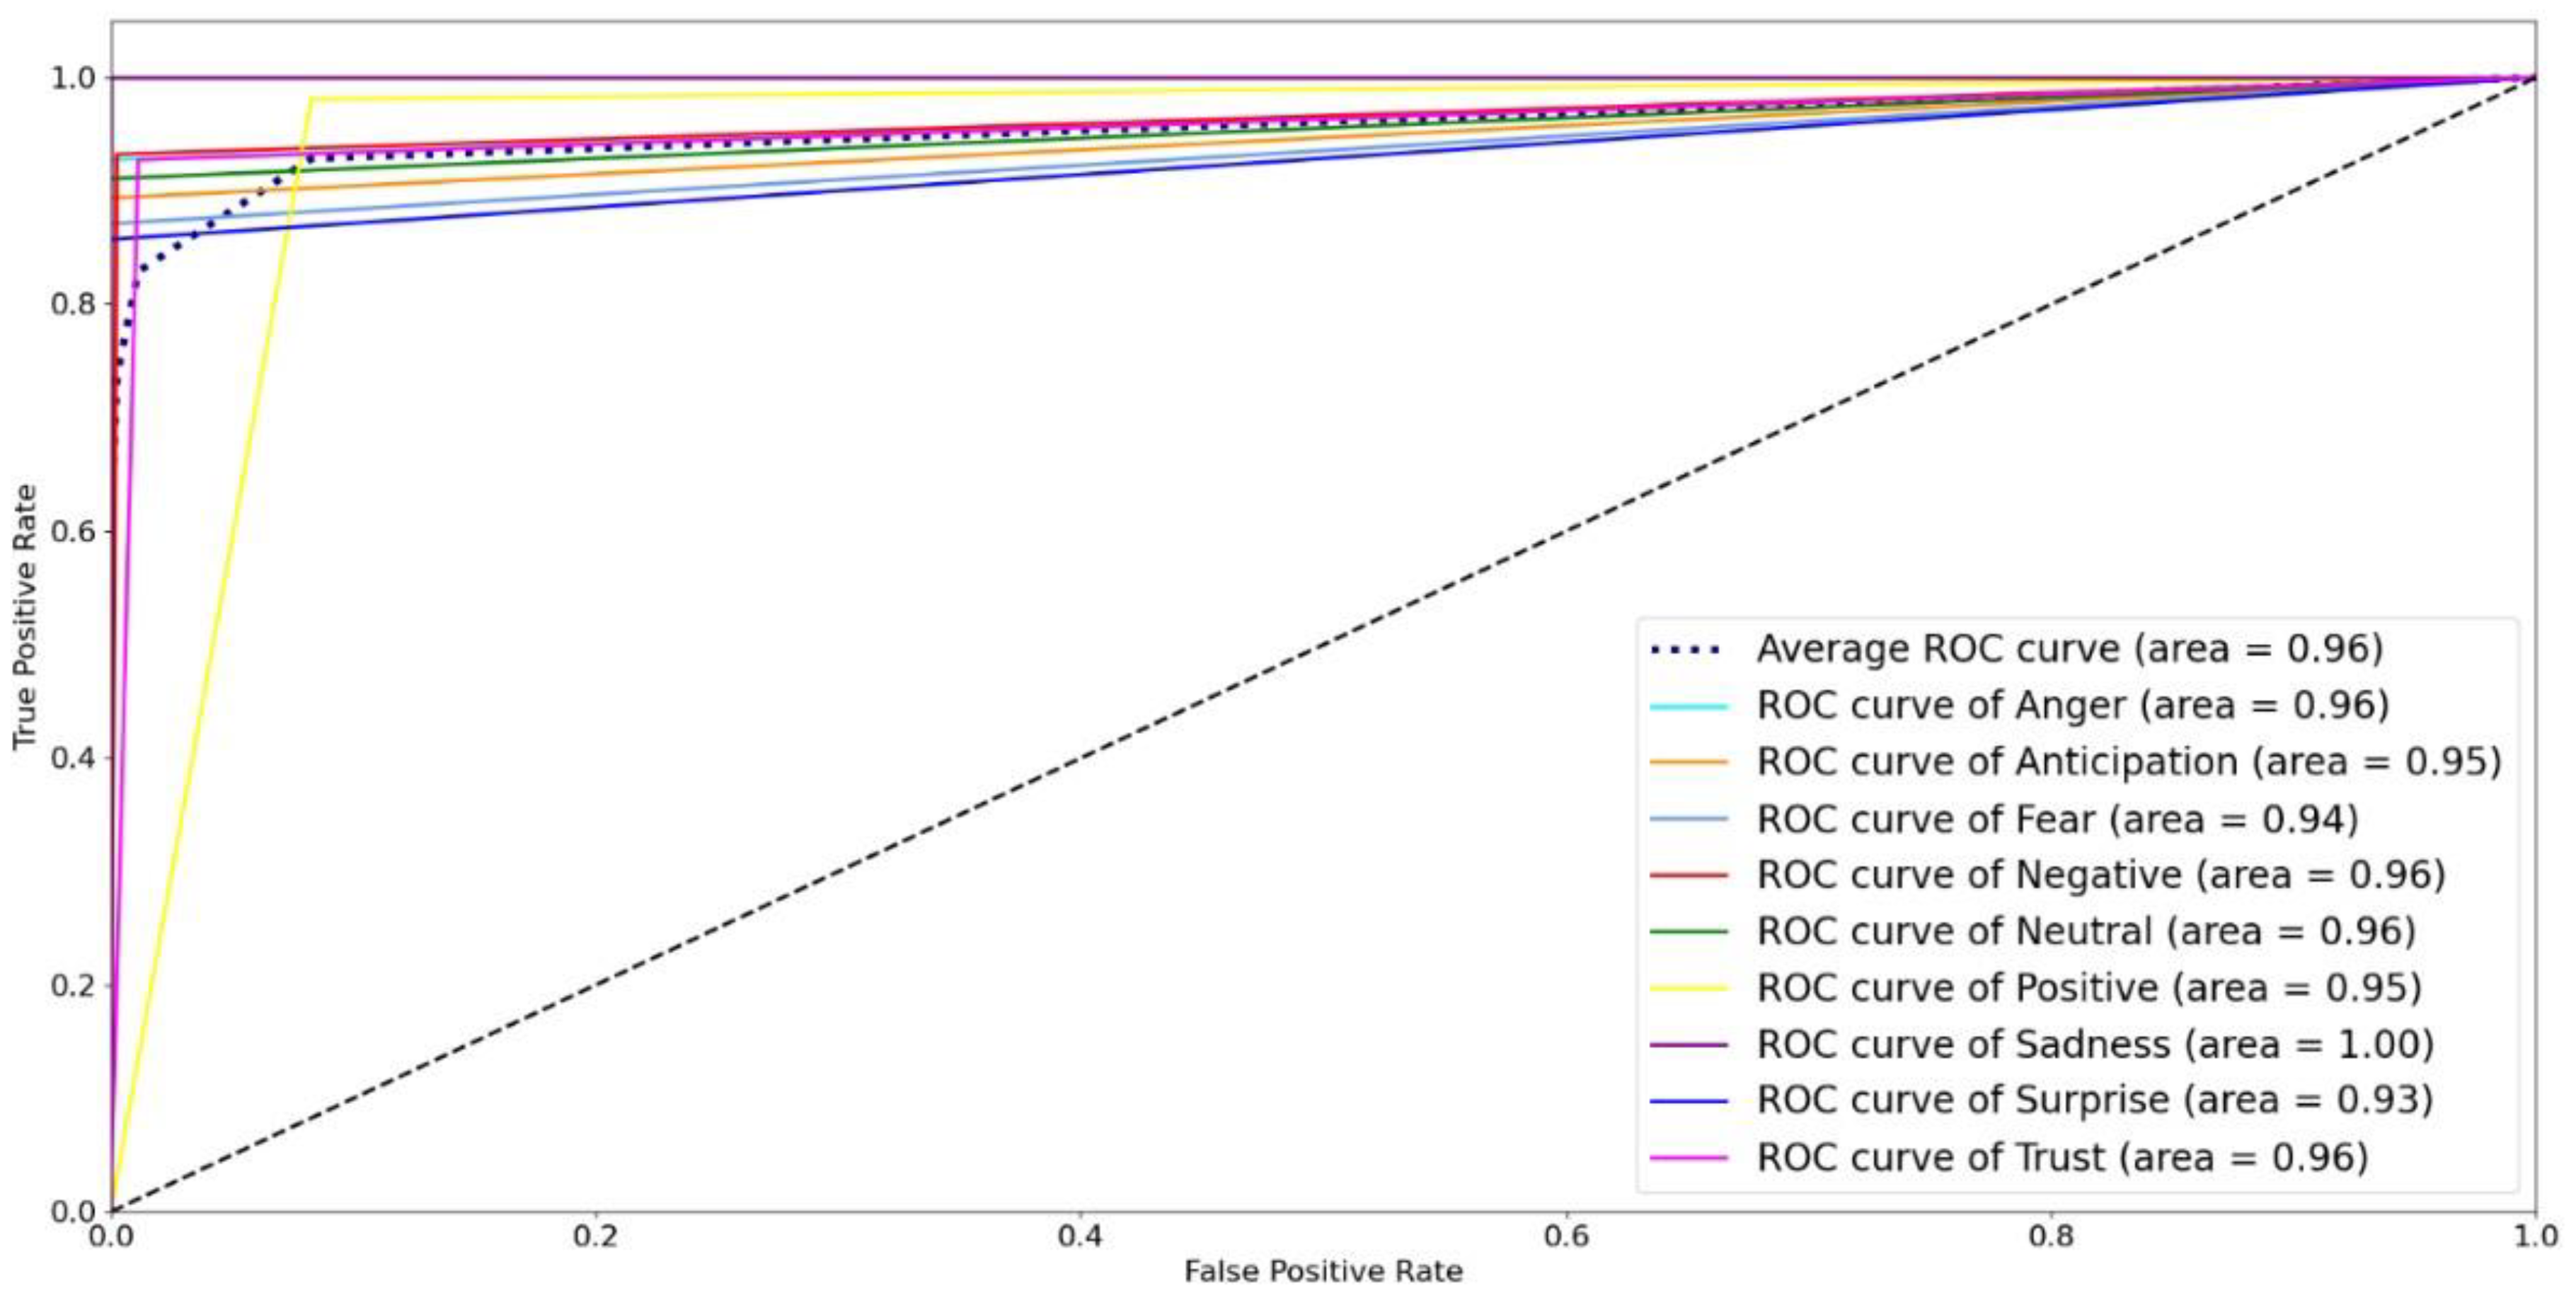
ROC Curve: It is a probabilistic curve representing the performance of a classification model at different classification thresholds. This is by plotting the True Positive Rate (TPR) against the False Positive Rate (FPR).
AUC: It measures the classifier’s ability to differentiate between classes. AUC is calculated as the two-dimensional area under the ROC curve. Its value lies between 0 and 1, with 1 indicating that the classifier perfectly differentiates between the classes and 0 indicating that all the positive observations are classified as negative and all the negative ones as positive.
Total Execution Time: It is defined as the total time the classifier takes for training (model building) and validation.
CPU Usage: This measures the percentage of the CPU’s capacity being utilized during the machine learning models’ execution.
Memory Usage: This measures the percentage of the RAM’s capacity being utilized during the machine learning models’ execution.
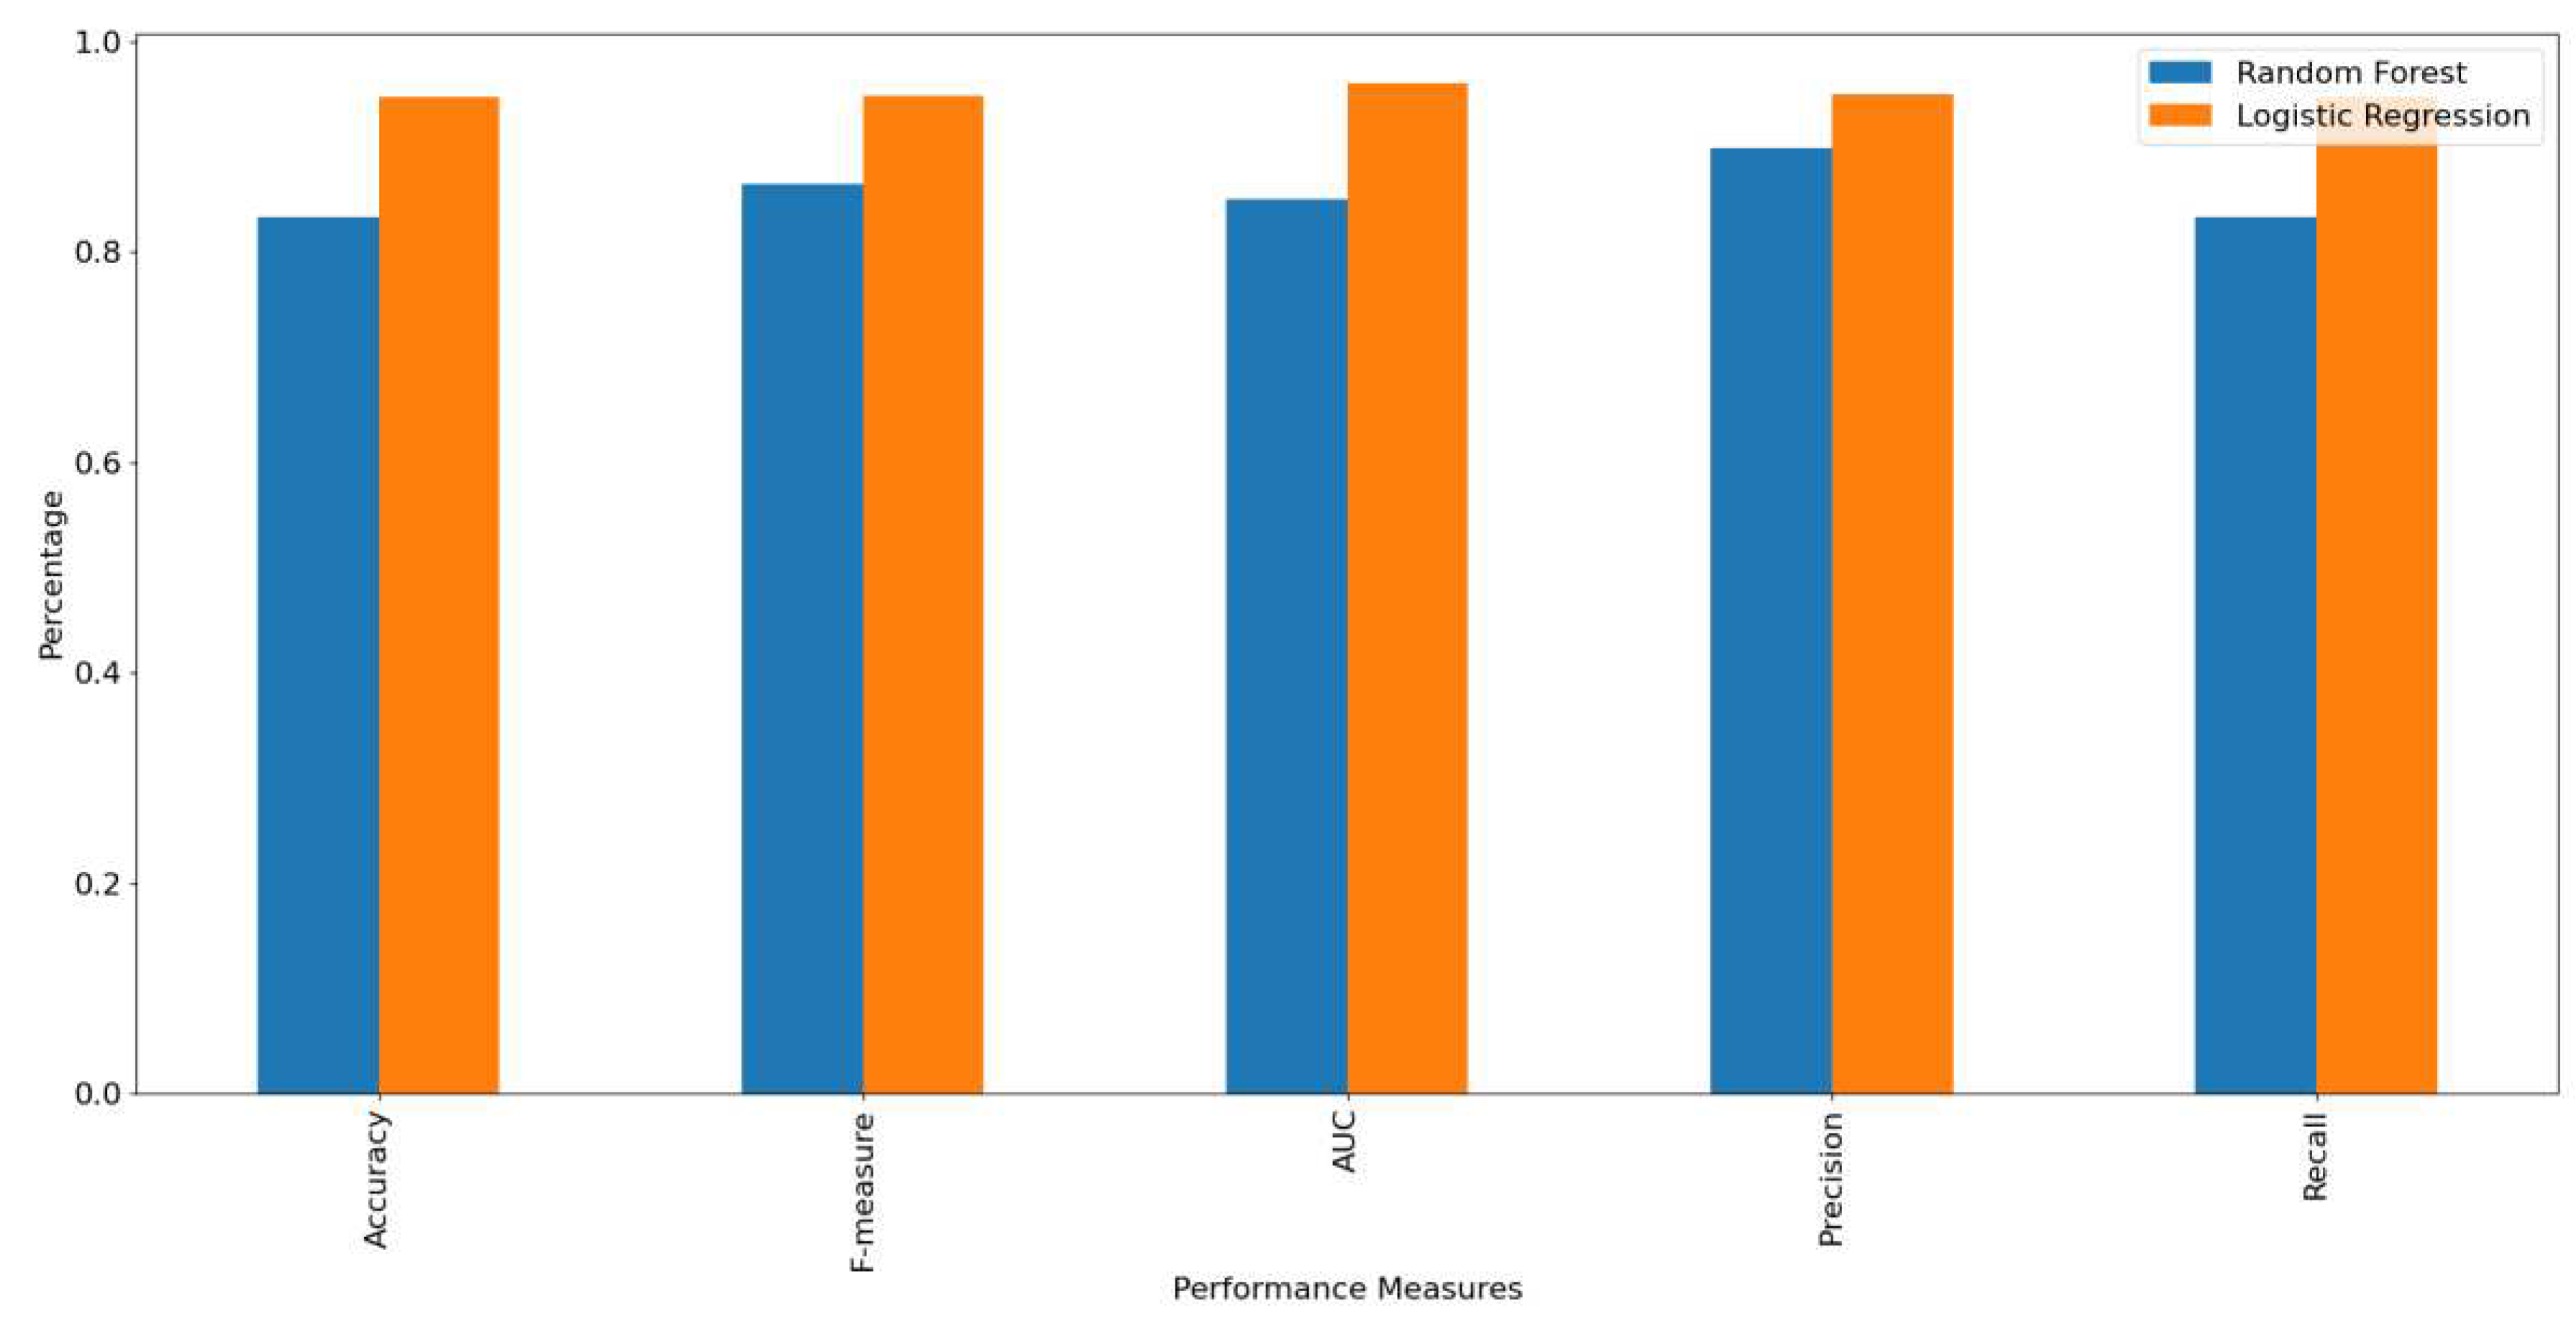
Figure 13 shows the accuracy, F-measure, AUC, precision, and recall, of the RF and LR classifiers. The figure shows that the LR outperformed RF in all measures. This is due to the divergence in variables because LR develops an accurate model for a dataset when the number of features is greater than the number of observations, as in the dataset considered under study, where the number of features is 10.16 times the number of observations. Finally, we present the RF and LR ROC curves and the AUC values in
Figure 14 and
Figure 15, respectively. The ROC curve for the sadness emotion in both classifiers is equal to 1 as all tweets are classified correctly, bearing in mind the small number of tweets classified with such emotion. Additionally, the ROC curve for all emotions increased or remained the same for LR compared to RF, indicating LR detected more true values (average of 92.3%) than RF (average of 74.9%) for all emotions. We conclude that the LR is most suitable for classifying tweets’ emotions. Finally,
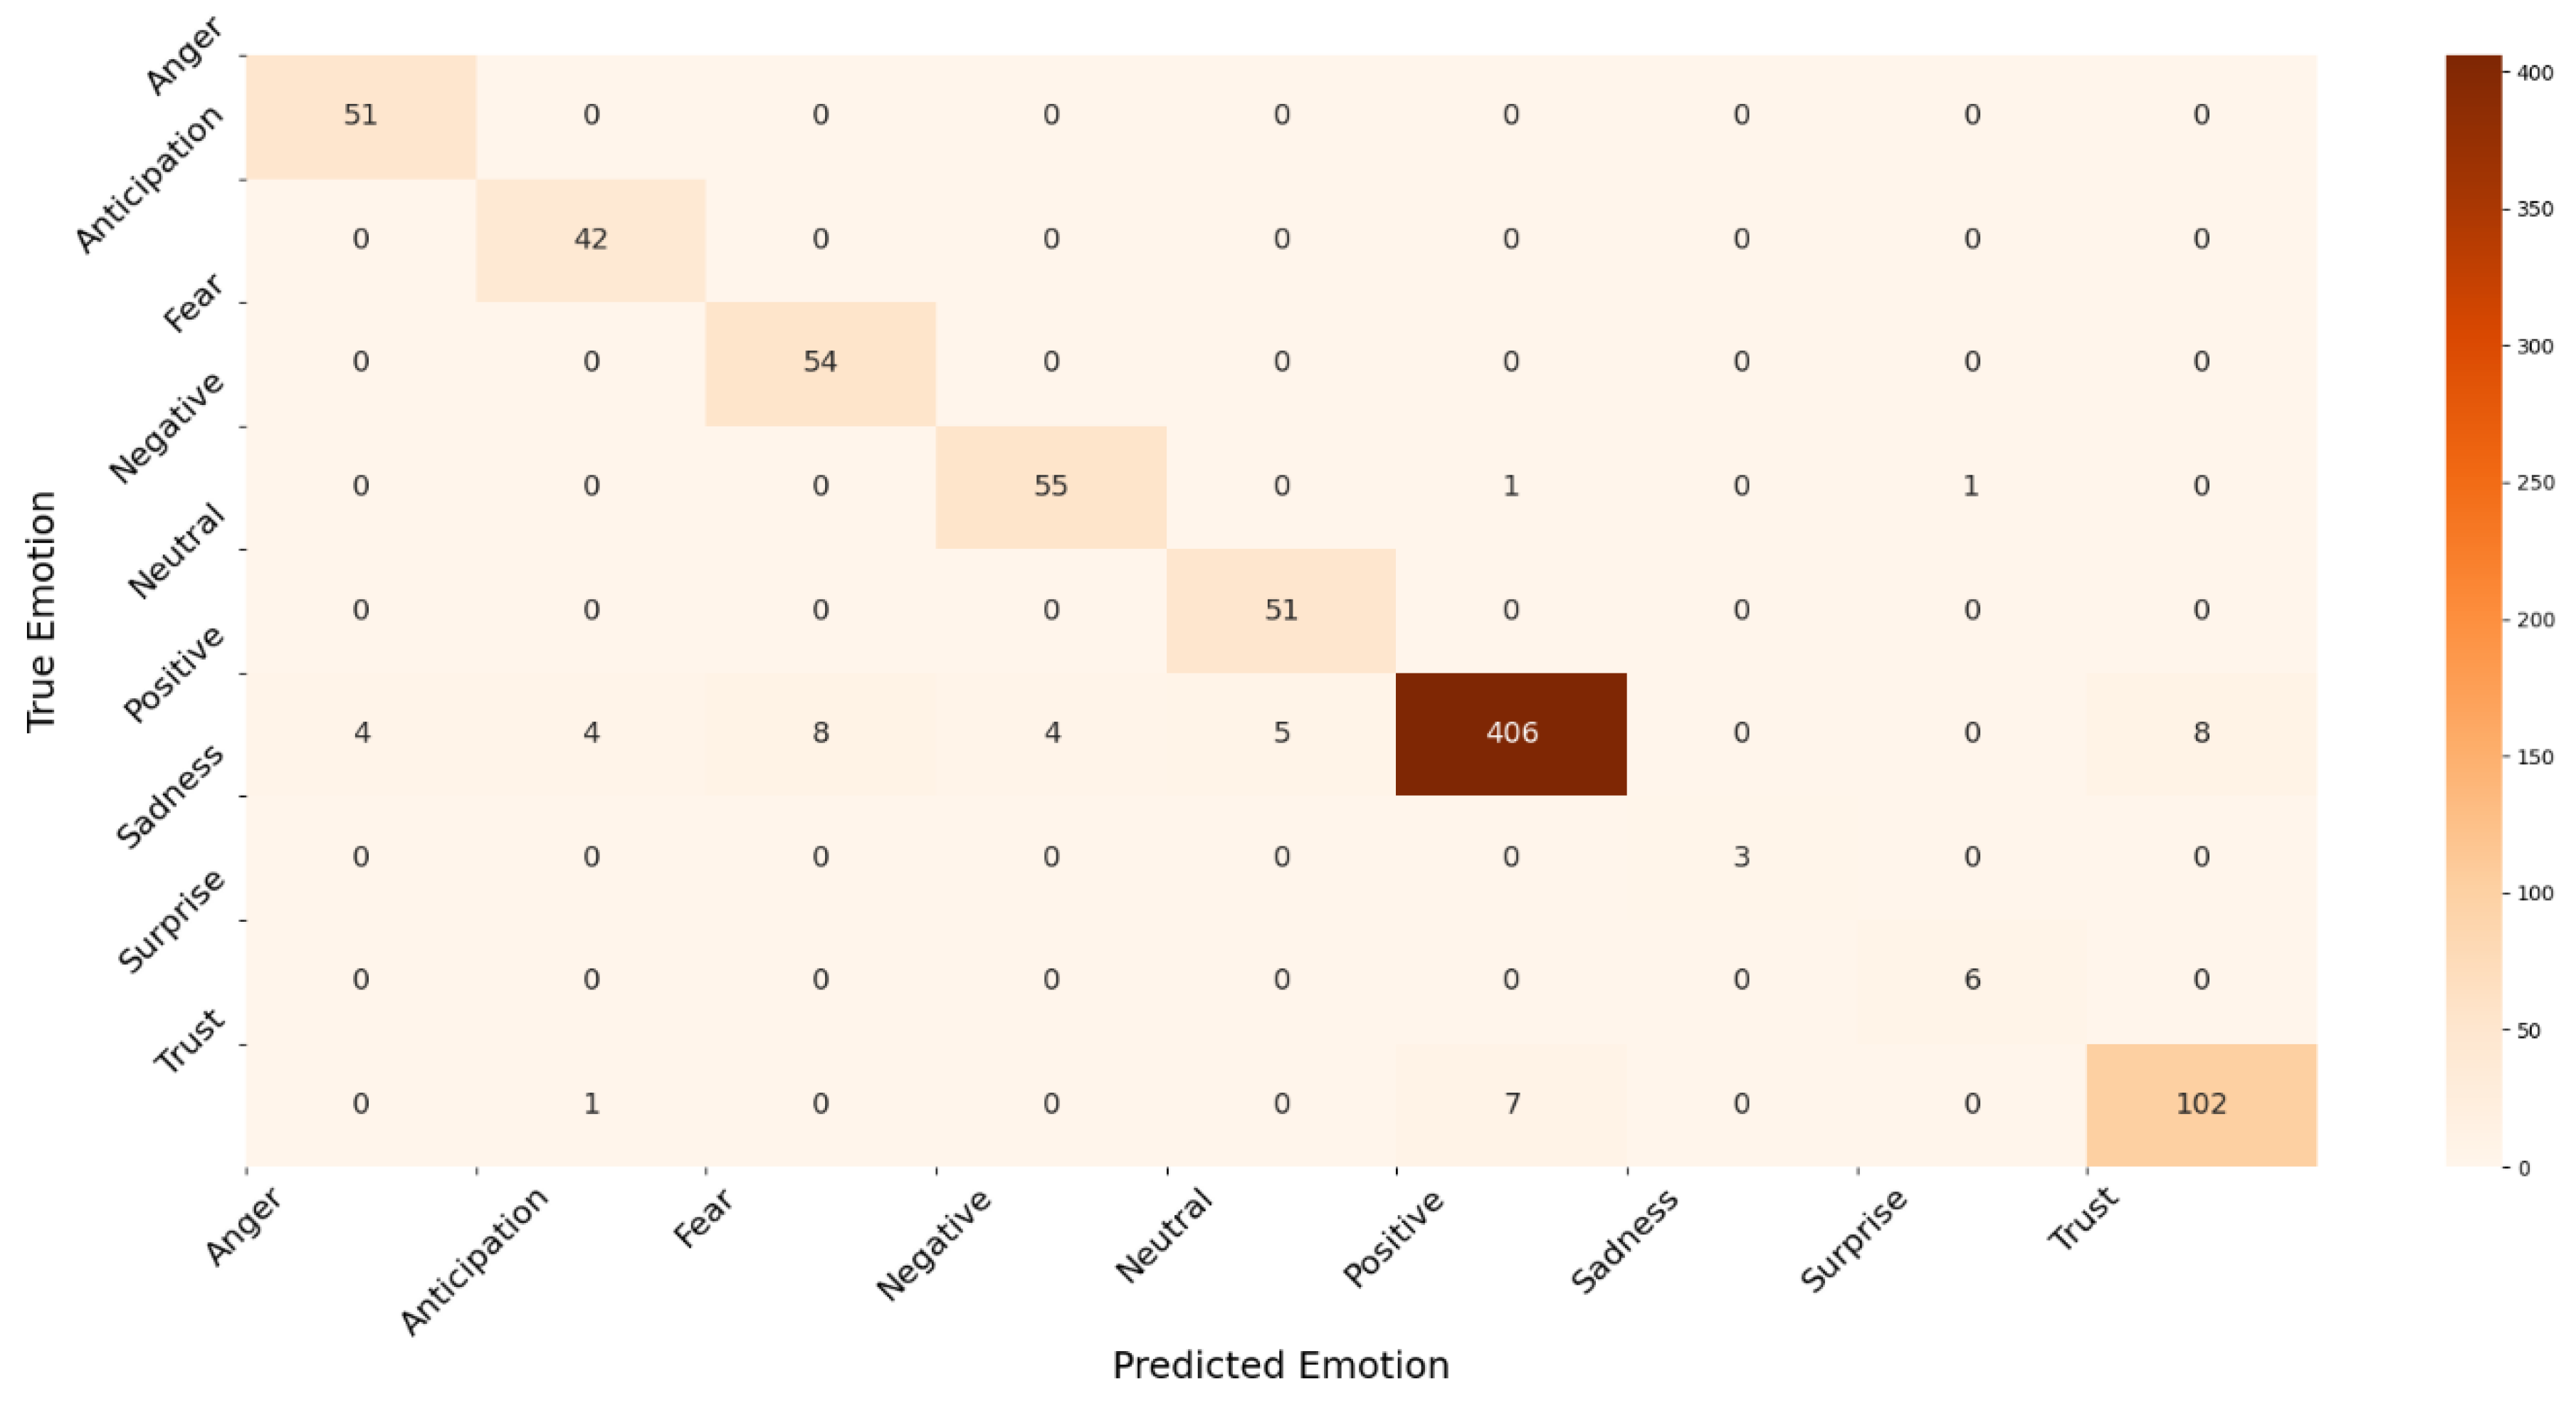
Figure 16 and
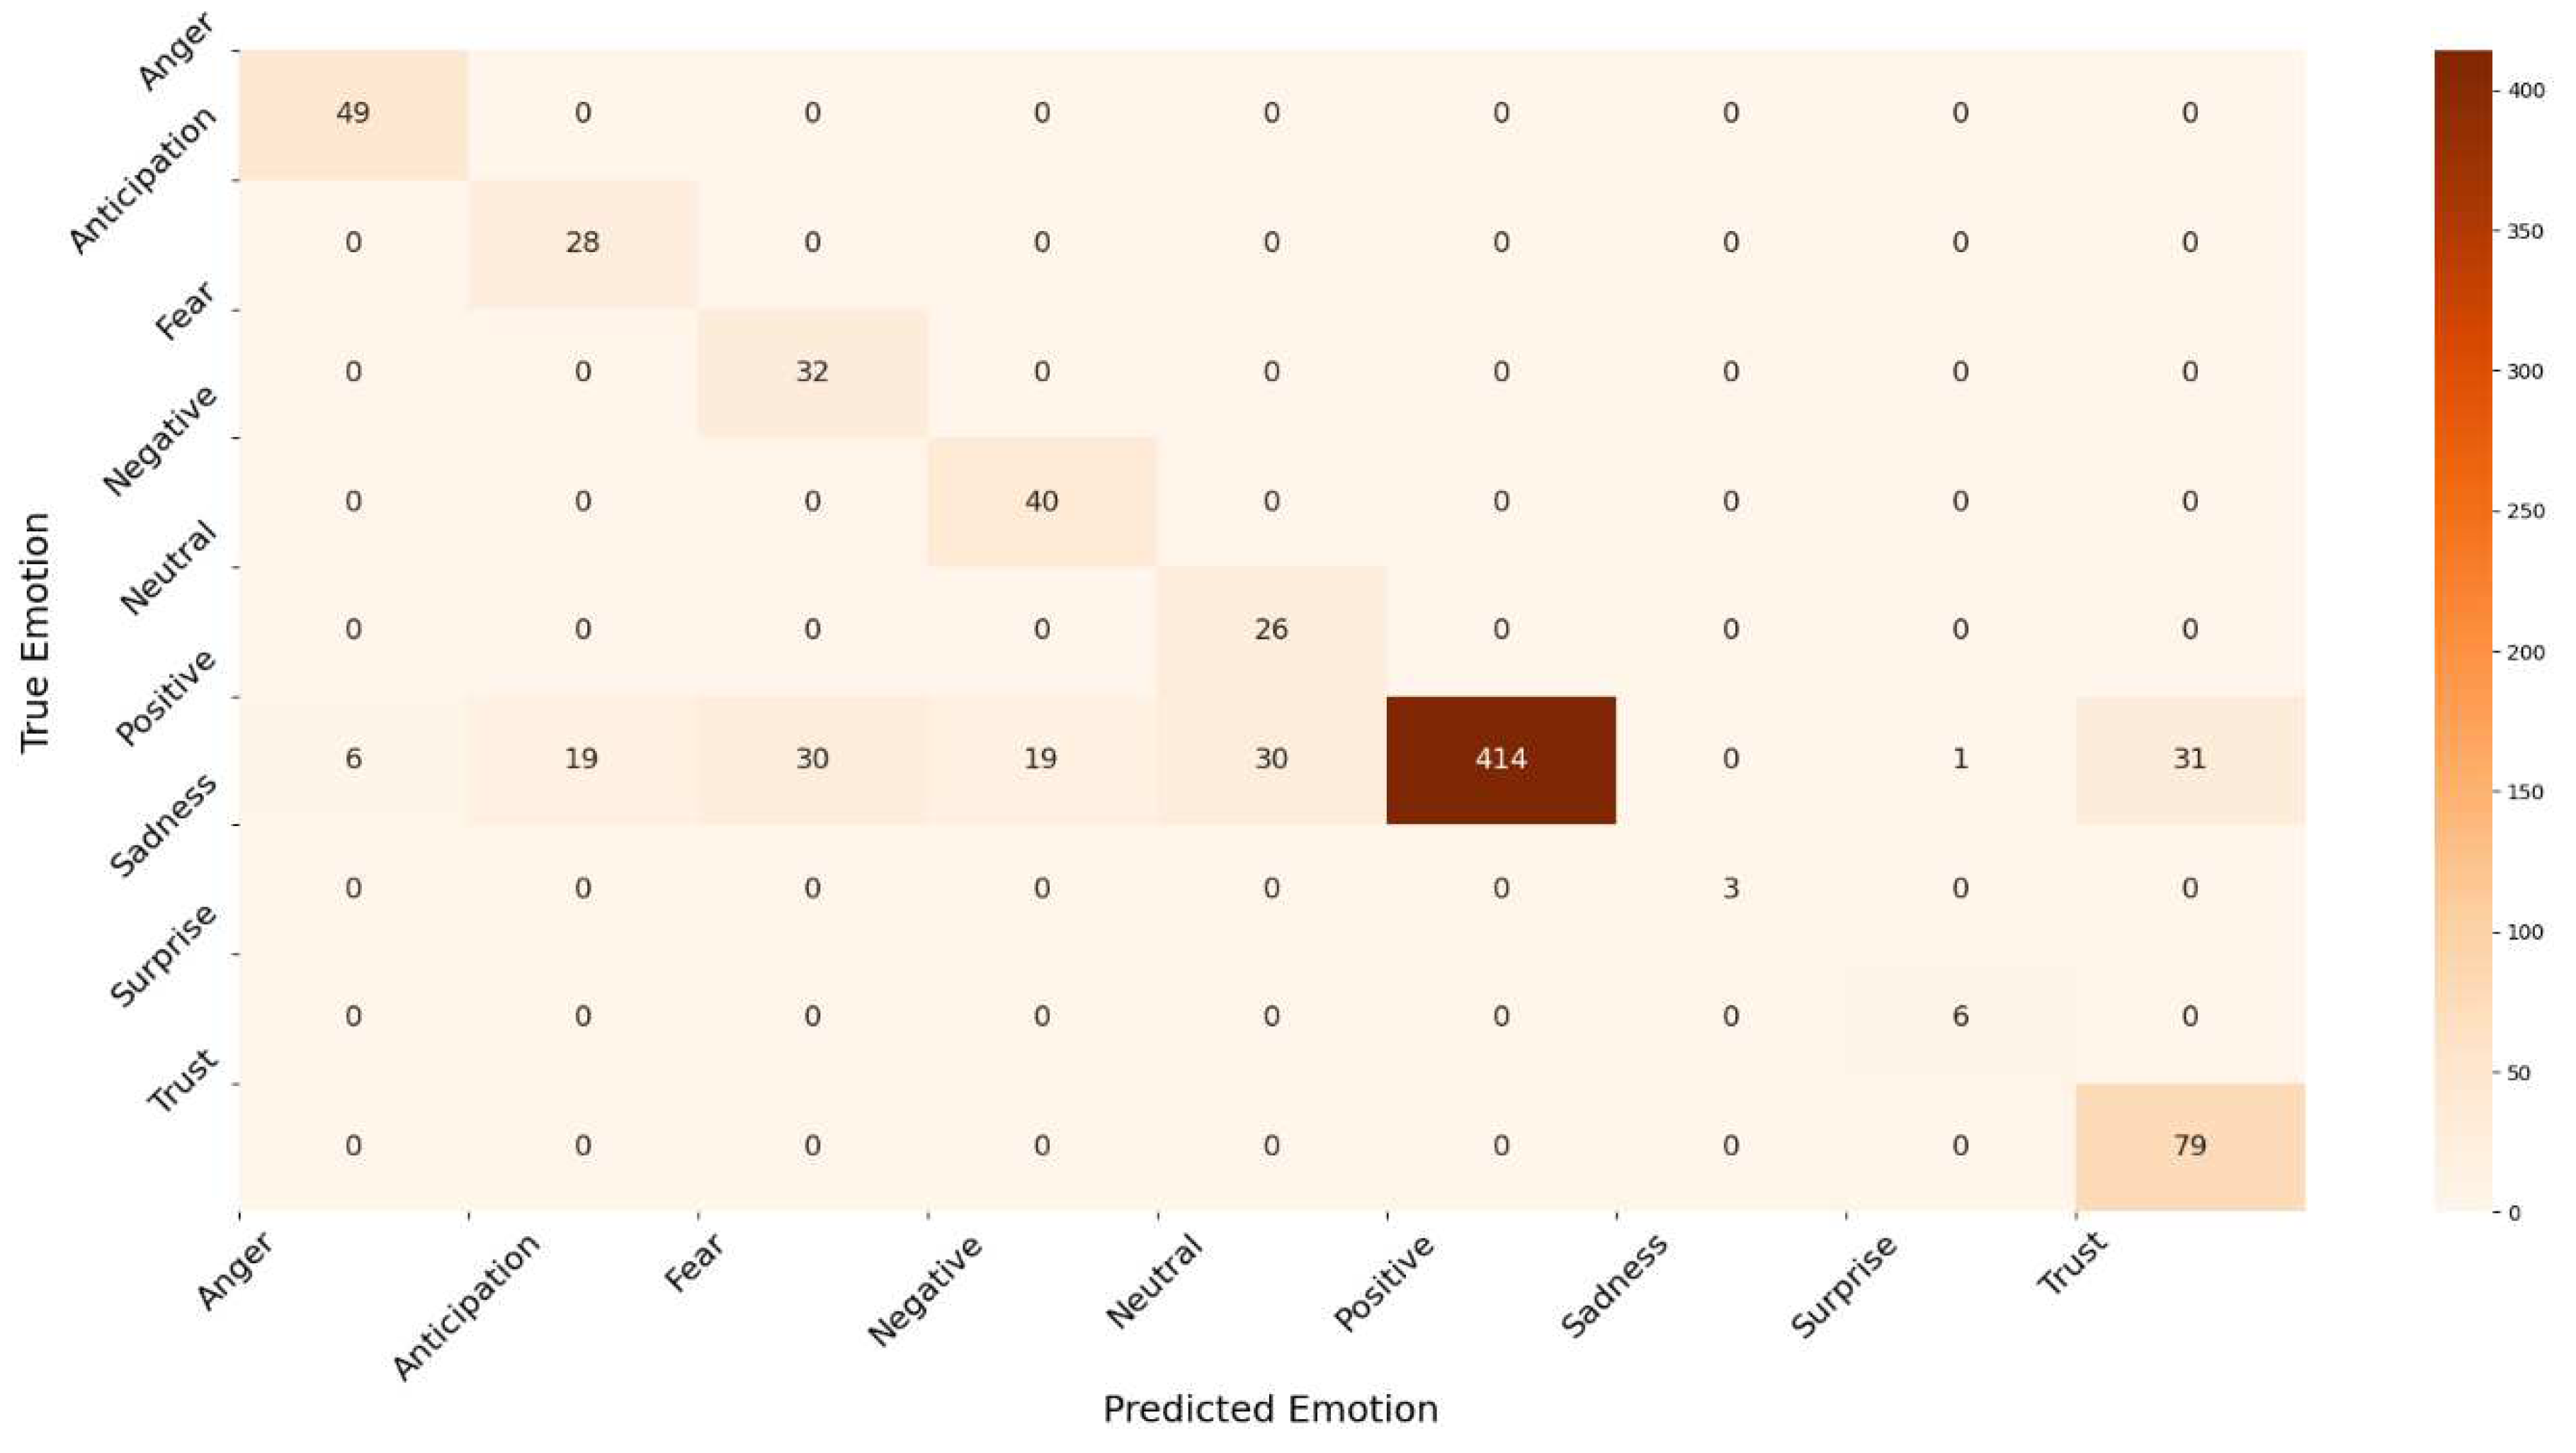
Figure 17 illustrate the confusion matrix of RF and LR, respectively. The insights of the figures are in line with the ROC curves, as it is clear that there are more emotions correctly classified in LR than RF, which explains the performance illustrated in
Figure 13.
Machine Learning algorithms should be time efficient as time to analyze the emotions for events such as a pandemic is critical to develop a proactive prevention plan.
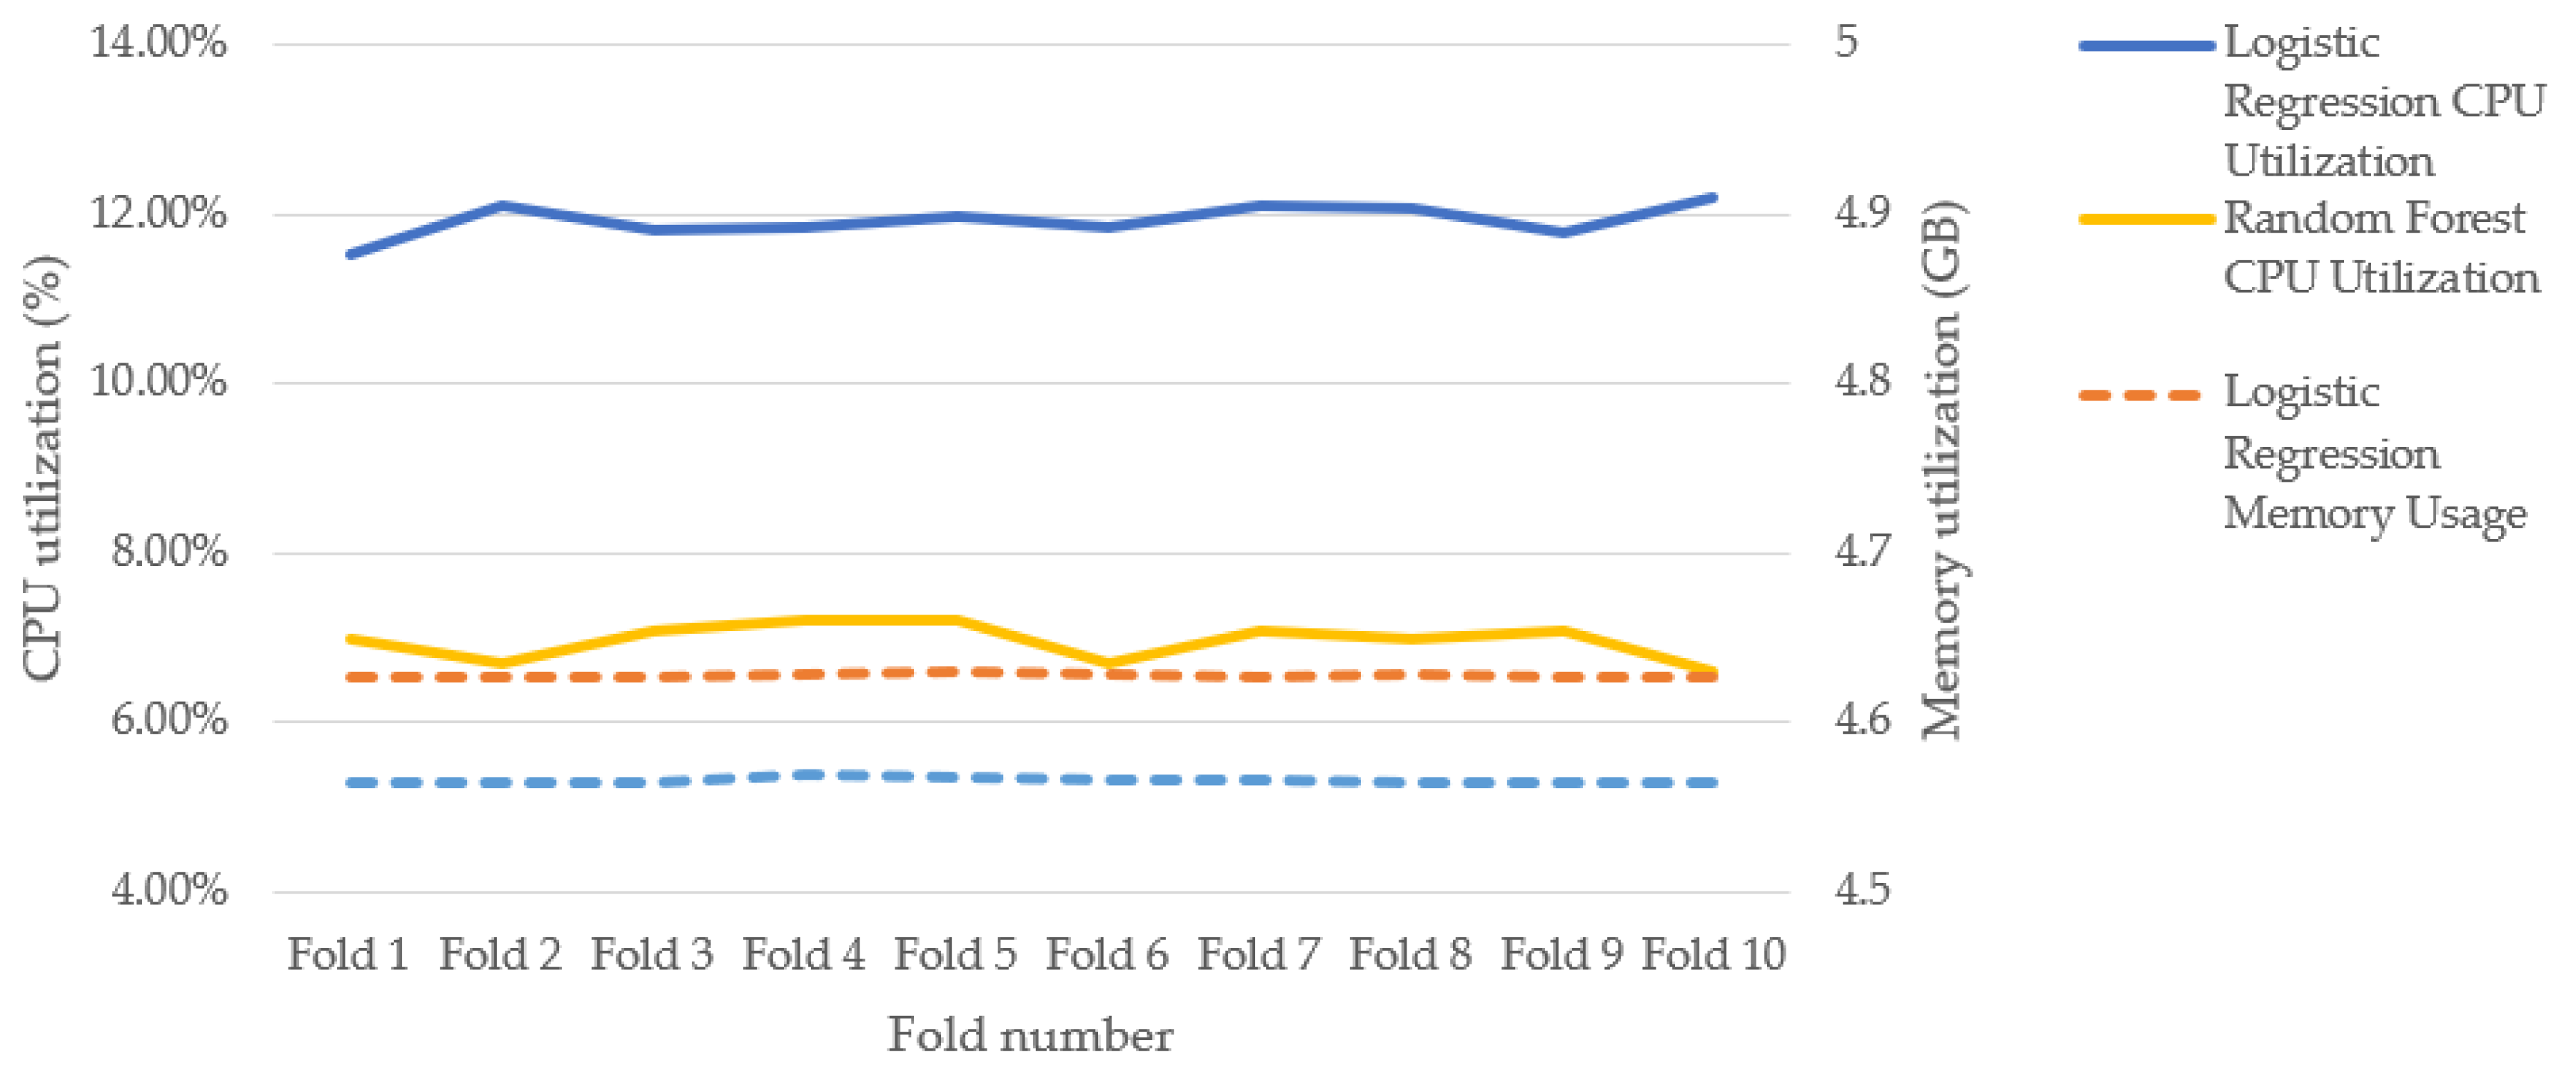
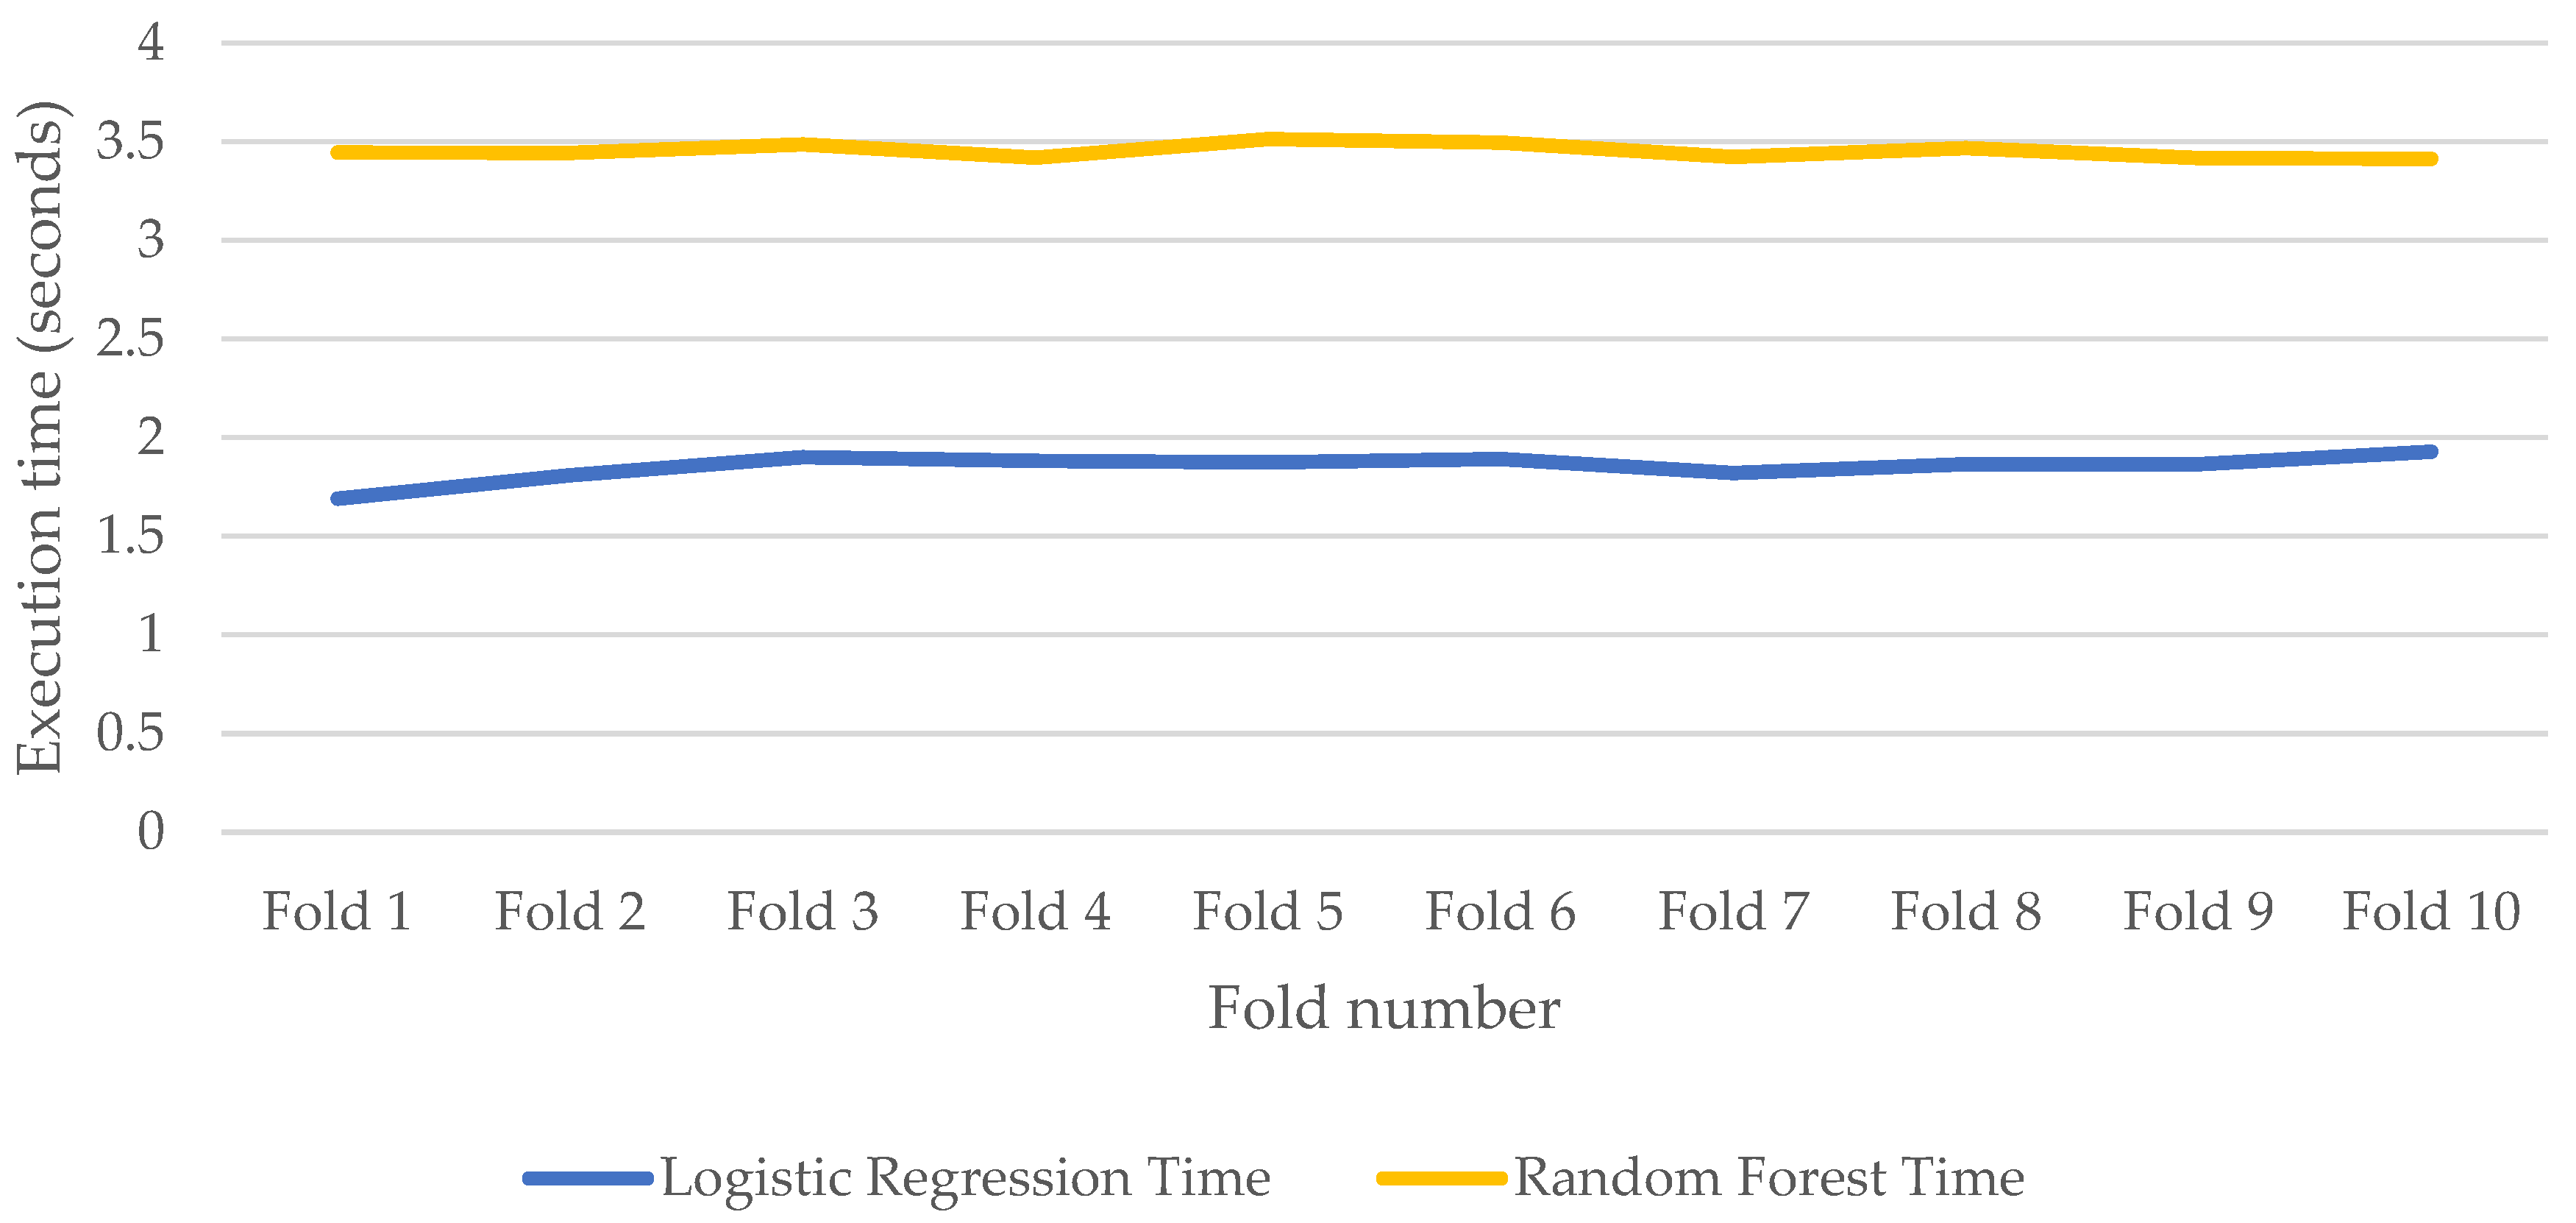
Figure 18 and
Figure 19 show the CPU and memory utilizations, and execution times respectively while training RF and LR for model development.
Figure 18 show that RF consumes less CPU than LR. This is because LR takes all features into account during the development of the model while RF considers a subset of the features. Based on the optimal values (
Table 4) for the experiments, RF takes the square root of the number of features (
The figure also shows that both models have similar memory usage. However, RF takes longer time to run than LR, as shown in
Figure 19. This is because the time complexity for RF is
, where n refers to the number of trees, f refers to the number of features, d is the maximum depth of the trees, and t is the number of tweets in the dataset; while the time complexity for LR
.
5. Conclusions
The COVID-19 pandemic created a sense of fear and other negative emotions. Additionally, the events associated with the pandemic and the increasing number of infections and deaths led to negative emotions affecting mental health. Several works in the literature studied the emotions associated with COVID-19 through machine learning. However, this paper is the first to propose a machine learning-based framework to detect emotions based on the occurrence of specific events and uses the UAE as a case study and the COVID-19 vaccine as an event. In addition, we detect 11 emotion classes related to introducing precautionary measures or events. We implemented the proposed framework using the ML widely used machine learning algorithms Random Forest (RF) and Logistic Regression (LR). Our experimental results show that LR outperforms RF.
There are a few limitations in this paper, including the fact that what individuals share on social media is not necessarily what they feel; the text is not a direct signal of emotions that would warrant judging the mental health state on an individual level. We argue, however, that social media expressions are a valuable indicator for a population-level response. Moreover, the Twitter population is not representative of the general UAE population, therefore, countermeasures should not be based solely on tweets. However, our framework presents a generic systematic approach to detecting emotions and is not specific to a particular social media type or a sample of the population. It can be applied to a population at the national level, considering all social media types, for better insights into population emotions to provide signals to policymakers following the introduction of measures or legislation.
Author Contributions
Conceptualization, L.I.; methodology, L.I., N.S., H.M. A.H, and L.F..; software, L.I., N.S., H.M. and A.H.; validation, L.I., N.S., H.M., and A.H..; formal analysis, L.I., N.S., H.M. and A.H; investigation, L.I., N.S., H.M. and A.H.; resources, L.I., N.S., H.M. and A.H.; data curation, L.I., N.S., H.M. and A.H.; writing—original draft preparation, L.I.; writing—review and editing, L.I., N.S., H.M. A.H, and L.F.; visualization, L.I., N.S., H.M. and A.H.; supervision, L.I.; project administration, L.I.; funding acquisition, L.I. All authors have read and agreed to the published version of the manuscript.
Figure 1.
Proposed ML- SMEmot framework.
Figure 1.
Proposed ML- SMEmot framework.
Figure 2.
Main precautionary measures and restrictions to tackle COVID-19 in the UAE.
Figure 2.
Main precautionary measures and restrictions to tackle COVID-19 in the UAE.
Figure 3.
Tweets filtering steps.
Figure 3.
Tweets filtering steps.
Figure 4.
The number of positive cases versus the number of vaccine-related tweets each month.
Figure 4.
The number of positive cases versus the number of vaccine-related tweets each month.
Figure 5.
Term count (unigram, bigram, and trigram) for vaccine-related tweets.
Figure 5.
Term count (unigram, bigram, and trigram) for vaccine-related tweets.
Figure 6.
Word cloud for non-vaccine-related and vaccine-related tweets.
Figure 6.
Word cloud for non-vaccine-related and vaccine-related tweets.
Figure 7.
Word clouds for tweets before and after the Sinopharm vaccine.
Figure 7.
Word clouds for tweets before and after the Sinopharm vaccine.
Figure 8.
Percentage of Annotation Consistency between TextBlob, Vader, and NRCLex libraries.
Figure 8.
Percentage of Annotation Consistency between TextBlob, Vader, and NRCLex libraries.
Figure 9.
Manually annotated emotions for UAE-COVID-19-related vaccine-related and non-vaccine-related tweets. The emotions Joy and Disgust were presented in the non-vaccine related but not in the vaccine-related tweets.
Figure 9.
Manually annotated emotions for UAE-COVID-19-related vaccine-related and non-vaccine-related tweets. The emotions Joy and Disgust were presented in the non-vaccine related but not in the vaccine-related tweets.
Figure 10.
Tweets emotions before and after the vaccine based on manual annotation.
Figure 10.
Tweets emotions before and after the vaccine based on manual annotation.
Figure 11.
Word clouds for UAE-COVID-19 tweets based on manual annotation of emotion.
Figure 11.
Word clouds for UAE-COVID-19 tweets based on manual annotation of emotion.
Figure 12.
Frequency of classification models used in literature for COVID-19 sentiment analysis.
Figure 12.
Frequency of classification models used in literature for COVID-19 sentiment analysis.
Figure 13.
Performance measures for the emotion prediction models.
Figure 13.
Performance measures for the emotion prediction models.
Figure 14.
ROC curves for Random Forest model.
Figure 14.
ROC curves for Random Forest model.
Figure 15.
ROC curves for Logistic Regression model.
Figure 15.
ROC curves for Logistic Regression model.
Figure 16.
Confusion matrix for Random Forest model.
Figure 16.
Confusion matrix for Random Forest model.
Figure 17.
Confusion matrix for Logistic Regression model.
Figure 17.
Confusion matrix for Logistic Regression model.
Figure 18.
CPU and memory utilizations of Random Forest and Logistic Regression models during training.
Figure 18.
CPU and memory utilizations of Random Forest and Logistic Regression models during training.
Figure 19.
Execution time of Random Forest and Logistic Regression models during training.
Figure 19.
Execution time of Random Forest and Logistic Regression models during training.
Table 1.
Comparison between related work and this work.
Table 1.
Comparison between related work and this work.
| Work |
Country |
Language(s) |
Data source |
Data period |
Dataset size |
Data Annotation Method |
Algorithm(s) |
Data splitting |
Evaluation metrics |
| Sentiment analysis |
Feature extraction |
| [25] |
Worldwide |
English |
Twitter |
July 25, 2020 |
170,000 tweets |
NR |
LSTM with attention layers |
TF-IDF |
NR |
Accuracy, Precision, Recall, and F-measure |
| [30] |
The US and Brazil |
English and Portuguese |
Twitter |
April - August 2020 |
English: 7,144,349 tweets Portugues: 7,125,530
tweets |
Manual |
Logistic Regression, Random Forest, and Linear SVM |
SBert, mUSE, and FastText |
NR |
Precision and F-measure |
| [31] |
India |
English and Indian |
Twitter |
March to May 2020 |
150,000 tweets |
NR |
LSTM, BiLSTM, and BERT |
Word2vec and GloVe |
90% Training, 10% Testing |
BCE, Hamming, Jaccard, and LRAP loss functions, and F- Macro and Micro |
| [32] |
NR |
NR |
Twitter |
tweets of May 30, 2020 |
7528 tweets |
TextBlob |
Random Forest, XGBoost, SVM, Extra Tree Classifier, and Decision Tree |
Concatenated BoW and TF-IDF |
80% train 20% test |
Accuracy, Precision, Recall, and F-measure |
| [33] |
NR |
NR |
Twitter |
February to March 2020 |
90,000 tweets |
TextBlob |
SVM, Naïve Bayes, Decision Tree, Random Forest, CNN, and BiLSTM |
TF-IDF, Word2Vec, GloVe, HyRank, IWV, and FastText |
3 random categories |
Accuracy |
| [34] |
NR |
NR |
Twitter |
Dataset 1: December 2019 - May 2020
Dataset 2: January - March 2020 |
Dataset 1: 23,000 tweets
Dataset 2: 226,668 tweets |
VADER |
Proposed Fuzzy Rule Model |
Bag-of-words and Doc2Vec |
NR |
Sensitivity, Precision, Recall, F-measure, Log Loss, and Mean Absolute Error |
| [35] |
NR |
English |
Twitter |
23 March 2020-10 May 2021 |
31,233 tweets |
TextBlob |
SVM, Logistic Regression, Random Forest, Multi Naïve Bayes, LSTM |
NR |
75% train
25% test |
Accuracy, Precision, Recall, and F-measure |
[36]
|
Philippines |
English and Tagalog |
Twitter |
1-31 March 2021 |
993 tweets |
Manual |
Naïve Bayes |
TF-IDF |
10-fold cross-validation |
Accuracy, precision, and recall |
| [37] |
NR |
English |
Twitter |
NR |
25,004 tweets |
TextBlob |
Random Forest, Decision Tree, Logistic Regression, SVM |
NR |
70% train 30% test |
Accuracy, F-measure, precision, and recall |
| [40] |
NR |
English |
Twitter |
July – Sept 2021 |
113,969 tweets |
NR |
Graph Convolutional Neural Network, ALBERT, ALBERT + LSTM |
LIWC |
10-fold cross-validation |
Precision, Recall, and F-measure |
| [41] |
NR |
English |
Twitter |
March 2008 – October 2021 |
3,654,544 tweets |
previously collected annotator-rated emotions |
Bert |
NR |
80% train
20% test |
F-measure |
| [45] |
Indonesia |
Indonesian |
Twitter |
NR |
4,401 tweets |
Previously annotated |
BiLSTM, SVM, Logistic Regression |
Word2Vec, FastText |
10-fold cross-validation |
Accuracy, Precision, Recall, and F-measure |
| This study |
UAE |
English |
Twitter |
Jan 29, 2020 – July 31, 2022 |
15,455 tweets |
Manual |
Random Forest and Logistic Regression |
Concatenated BoW and TF-IDF |
10-fold cross-validation |
Accuracy, precision, recall, F-measure, ROC curve, AUC (Area Under the Curve), and execution time |
Table 2.
Emotions considered in the literature and this study.
Table 2.
Emotions considered in the literature and this study.
| Work |
Emotions |
Emotions Framework |
| Anger |
Anticipation |
Disgust |
Fear |
Joy |
Sadness |
Surprise |
Trust |
Neutral |
Negative |
Positive |
| [25] |
✓ |
✗ |
✗ |
✓ |
✓ |
✓ |
✗ |
✗ |
✗ |
✗ |
✗ |
✗ |
| [30] |
✓ |
✗ |
✗ |
✓ |
✓ |
✓ |
✗ |
✗ |
✗ |
✗ |
✗ |
✗ |
| [31] |
✗ |
✗ |
✗ |
✓ |
✗ |
✓ |
✗ |
✗ |
✗ |
✓ |
✓ |
✗ |
| [32] |
✗ |
✗ |
✗ |
✗ |
✗ |
✗ |
✗ |
✗ |
✓ |
✓ |
✓ |
✗ |
| [33] |
✗ |
✗ |
✗ |
✗ |
✗ |
✗ |
✗ |
✗ |
✓ |
✓ |
✓ |
✗ |
| [34] |
✗ |
✗ |
✗ |
✗ |
✗ |
✗ |
✗ |
✗ |
✓ |
✓ |
✓ |
✗ |
| [35] |
✗ |
✗ |
✗ |
✗ |
✗ |
✗ |
✗ |
✗ |
✓ |
✓ |
✓ |
✗ |
| [36] |
✗ |
✗ |
✗ |
✗ |
✗ |
✗ |
✗ |
✗ |
✓ |
✓ |
✓ |
✗ |
| [37] |
✗ |
✗ |
✗ |
✗ |
✗ |
✗ |
✗ |
✗ |
✓ |
✓ |
✓ |
✗ |
| [40] |
✓ |
✗ |
✓ |
✓ |
✓ |
✓ |
✓ |
✗ |
✓ |
✗ |
✗ |
✗ |
| [41] |
✓ |
✗ |
✓ |
✓ |
✓ |
✓ |
✓ |
✗ |
✗ |
✗ |
✗ |
✗ |
| [45] |
✓ |
✗ |
✗ |
✓ |
✓ |
✓ |
✗ |
✗ |
✗ |
✗ |
✗ |
✗ |
| This study |
✓ |
✓ |
✓ |
✓ |
✓ |
✓ |
✓ |
✓ |
✓ |
✓ |
✓ |
✓ |
Table 3.
Keywords used to extract data from Twitter.
Table 3.
Keywords used to extract data from Twitter.
| Keywords |
|---|
| COVID-19 |
Coronavirus, Corona, Covid, COVID-19, Sarscov2, ncov2019, Lockdown, Social distance, Quarantine, Stay home, Work from home, Pandemic, Outbreak, Travel ban, Travel restriction |
| Vaccination |
Vaccination, Covid vaccine, Vacc, Vax, Sinopharm, Pfizer-BioNTech, Pfizer, Sputnik V, Sputnik, AstraZeneca |
Table 4.
Hyperparameter tuning for the machine learning algorithms under study.
Table 4.
Hyperparameter tuning for the machine learning algorithms under study.
| Algorithm |
Hyperparameters |
Optimal value(s) used in the literature |
Value(s) used in our experiments |
| RF |
Number of estimators/trees |
300 [32], 600 [25], NR [30,33,37,44] |
300*, 600 |
| Splitting criteria |
NR [25,30,32,33,37,44] |
Gini* & Entropy |
| Maximum tree depth |
300 [32,33], 50 [25], NR [30,37,44] |
50*, 300 |
| Minimum number of samples |
2,5*,10 [25], NR [30,32,33,44] |
5 |
| Minimum number of samples at a leaf node |
NR [25,30,32,33,37,44] |
1 |
| Minimum weighted fraction of the total of weights at a leaf node |
NR [25,30,32,33,37,44] |
0 |
| Maximum number of features |
NR [25,30,32,33,37,44] |
None, sqrt*, and log2 |
| Maximum leaf node |
NR [25,30,32,33,37,44] |
None (Unlimited) |
| Minimum impurity |
NR [25,30,32,33,37,44] |
0 |
| Bootstrap samples usage |
NR [25,30,32,33,37,44] |
True |
| Out-of-bag samples usage |
NR [25,30,32,33,37,44] |
False |
| Number of jobs to run in parallel |
NR [25,30,32,33,37,44] |
-1 (all available cores are used) |
| Random state |
27 [32], NR [25,30,33,37,44] |
27 |
| Verbose |
NR [25,30,32,33,37,44] |
0 |
| Class weight |
NR [25,30,32,33,37,44] |
Balanced_subsample |
| LR |
Solver |
lbfgs [35], NR [25,30,37,45] |
lbfgs |
| Max iteration |
1000 [35], NR [25,30,37,45] |
1000 |
