Preprint
Article

Relationships Between Mortar Spread and the Fresh Properties of SCC with Local Metakaolin

Altmetrics

Downloads

123

Views

29

Comments

0

A peer-reviewed article of this preprint also exists.

Submitted:

17 July 2023

Posted:

18 July 2023

You are already at the latest version

Alerts
Abstract
Self-compacting concrete (SCC) production is a complex operation that requires finding a good combination and a suitable dosage of each of its constituents. Several formulation methods have been developed to meet the workability requirements of SCC. In this paper, the relationships between the fresh properties of SCC based on local metakaolin (MK) and the spreading of its mortar was investigated. The results showed the existence of good correlations between the spreading of the mortar and the fresh state properties of the related SCC and that the MK substitution rate did not affect these correlations. The choice of the mortar flow rate should target appropriate fresh properties of the SCC and a viscosity enhancing agent (VEA) could be used if the mix is too fluid and present an instability.
Keywords: 
Subject: Engineering  -   Civil Engineering

1. Introduction

Self-compacting concrete (SCC) is distinguished from ordinary concrete mainly by its properties in the fresh state and its ability to flow without segregation or bleeding during transportation and placement [1]. The mix design of SCC is based on the same criteria usually chosen for the formulation of vibrated concretes (i.e: workability, strength and durability). However, in addition to these criteria, SCC must satisfy two contradictory properties in the fresh state: good fluidity to ensure good placement and good viscosity to guarantee adequate resistance to segregation [2].
Several SCC mix design methods have been developed, based on different experimental approaches (Japanese approach, Swedish CBI approach, French LCPC approach, etc.) to meet the workability requirements of SCC [3,4]. The Japanese approach of Okamura [5], which divides the concrete into two parts: the gravel and the mortar which ensures the fluidity of the concrete, was adopted in this work. Firstly, it fixes the dosage of the coarse aggregates in the concrete and that of the sand in the mortar by adjusting only the quantity of water and superplasticizer (SP) by using tests on mortars [6,7]. In fact, there is a good correlation between the fresh state behavior of the SCC and its mortar, mainly when the quantities of water and admixture are varied [8]. In addition, tests on self-compacting mortar are easy to perform than that of SCC and many authors confirmed that the rheology properties of concrete correlate well with that of its mortar [8].
In recent years, there has been an interest in using metakaolin as partial replacement of cement in traditional or self-compacting concrete [9,10,11,12]. This paper presents some results of an extensive study [13], which aims to extend the knowledge of the relationships between the fresh state properties of SCC and the spread of its related mortar containing metakaolin (MK). For this purpose, different percentages of a local MK have been used as a partial substitution to Portland Limestone Cement (PLC) to illustrate the rheological behavior and the correlated relationships that can be obtained. Fresh properties of self-compacting mortars (SCM) were obtained by using mini-cone spreading test and a V-funnel flow test. On the other hand, the properties of the SCC in the fresh state were evaluated, according to the European standard [14].

2. Experimental program

2.1. Materials

In the present investigated all the mixtures of SCC or SCM were formulated with a PLC cement, type CEM II/A-L 42.5 R, containing 15% fine limestone, with a density equal of 3.03 g/cm3 and a Blaine fineness of 4449 cm2/g. The produced mineral addition MK was obtained from a local kaolin which was thermally activated at a temperature of 850°C for 3 hours. The MK obtained had a density of 2.6 g/cm3, a BET surface area around 140,000 cm2 /g and an average pozzolanic activity [13]. The chemical composition of the PLC cement and the MK used are given in [13]. An ether polycarboxylates superplasticizer (SP), with a density is 1.07 g/cm3 was used. Coarse aggregates 3/8 mm and 8/15 mm with a density 2.64 g/cm3 and 2.66 g/cm3, respectively were used. The fine aggregates used was an alluvial sand with a density of 2.63 g/cm3 and an absorption coefficient of 0.65%. The particle size distribution of the aggregates is given in Table 1.

2.2. Methods

The formulation of the SCC mixtures was based on the general Okamura method, with an improvement made to the method for selecting the fine aggregate content. The volume of sand in the mortar and the dosages of water and SP in mass of binder were selected based on the slump flow and the V-funnel tests [15]. For the selection of air contents and coarse aggregates, the Okamura method is maintained. SCC is usually considered as a coarse aggregate in a mortar matrix and the SCM could serve as a base for the design of SCC as the workability of SCC could be obtained from the spread test and the v-funnel test of SCM [16].
In fact, according to Domone [15], the spread of SC mortars between 280 and 340 mm, leads to the spread classes of SCC comprised between 550 and 850 mm as recommended by the European guidelines whereas the two viscosity classes of SCC provided by the V-funnel flow time of less than 8 seconds and 8 to 25 seconds correspond to the flow times of SCM of less than 3.6 seconds and 3.6 to 13.1 seconds, respectively. Safiuddin [17], also reported that a spread of SCM between 275 and 335 mm will generally produce a SCC with a spread of between 550 and 850 mm.
A mortar spread between 275 and 335 mm [17], with an average of 305 ± 10 mm, and a V-funnel flow time between 2 and 10 seconds [18], were chosen as representative values for the characterization of SCM. Bleeding and segregation were visually checked during the spreading test [16]. After a preliminary test stage [19], a sand/mortar volume of 50%, an SP dosage of 1.1% by weight of cement, a water/cement (W/C) ratio of 0.42 and a cement dosage of 667 kg/m3 were considered for the control SCM without MK. A mortar spread between 275 and 335 mm [13], with an average of 305 ± 10 mm, and a V-funnel flow time between 2 and 10 seconds [14], were chosen as representative values for the characterization of SC Mortars. Bleeding and segregation were visually checked during the spreading test [16]. The dosage of SP was adjusted and increased with the increase in MK content as partial substitution of PLC cement [20]. A total of six mixtures including control SCM (PLC, 5MK, 10MK, 15MK, 20MK and 25MK) were used for the formulation of SCC, by simultaneous variation of the percentage of MK from 0 to 25% by mass of binder and by steps of 5% and dosages in SP of 1.1 to 2.0% by mass of binder. The volume of sand as well as the water/binder (W/B) ratio were kept constant. The fine aggregates, coarse aggregates (3/8) and coarse aggregates (8/15) contents were 870 kg/m3, 290 kg/m3 and 580 kg/m3, respectively.
After fixing the sand volume and optimizing the water and SP dosages of the various SCM, coarse aggregates for SCC mixes were selected from a range of 31 to 35% of concrete volume to ensure an adequate flow and passage capacity [18]. The air content was assumed to be equal to 1% for a maximum grain size (Dmax) of 20 mm [21]. Thus, for the six SCC mixtures formulated, the binder dosage, W/B ratio and the aggregate content (G/S) were kept constant at 441 kg/m3, 0.42 and 1, respectively and their proportions are in the typical ranges of the constituents of the SCC proposed by [22,23]. Fresh state SCCs were characterized according to European guidelines [14,24] using slump spread, V-flow time, L-box and sieve stability test.

3. Results and Discussion

A good relationship between the filling capacity of SCC, evaluated by L-box test and the fluidity of their related mortars has been observed [13]. In this context, the appearance and nature of the relationships that may exist between the fresh state properties of SCC containing MK and the spreading of its mortar were investigated.

3.1. Filling ability tests of SCC vs. spread of mortar

The partial substitution of PLC cement by 0% to 25% of MK increases the slump flow value and decreases the flow time T500 which is the moment when the concrete reaches a diameter of 500 mm. This means that the addition of MK to SCC increases their filling capacity, expressed by the degree of filling (fluidity or spreading) and the filling rate (viscosity or T500). However, this increase is not regular as can be seen in Figure 1. Therefore, the effect of the constituents of SCM with a volume of 66% of the rheological properties of SCC containing a volume of 33% of aggregates will be studied by comparing on one side the filling capacity, the spreading flow and the resistance to segregation of SCC and on the other side the spreading of the related SCC.
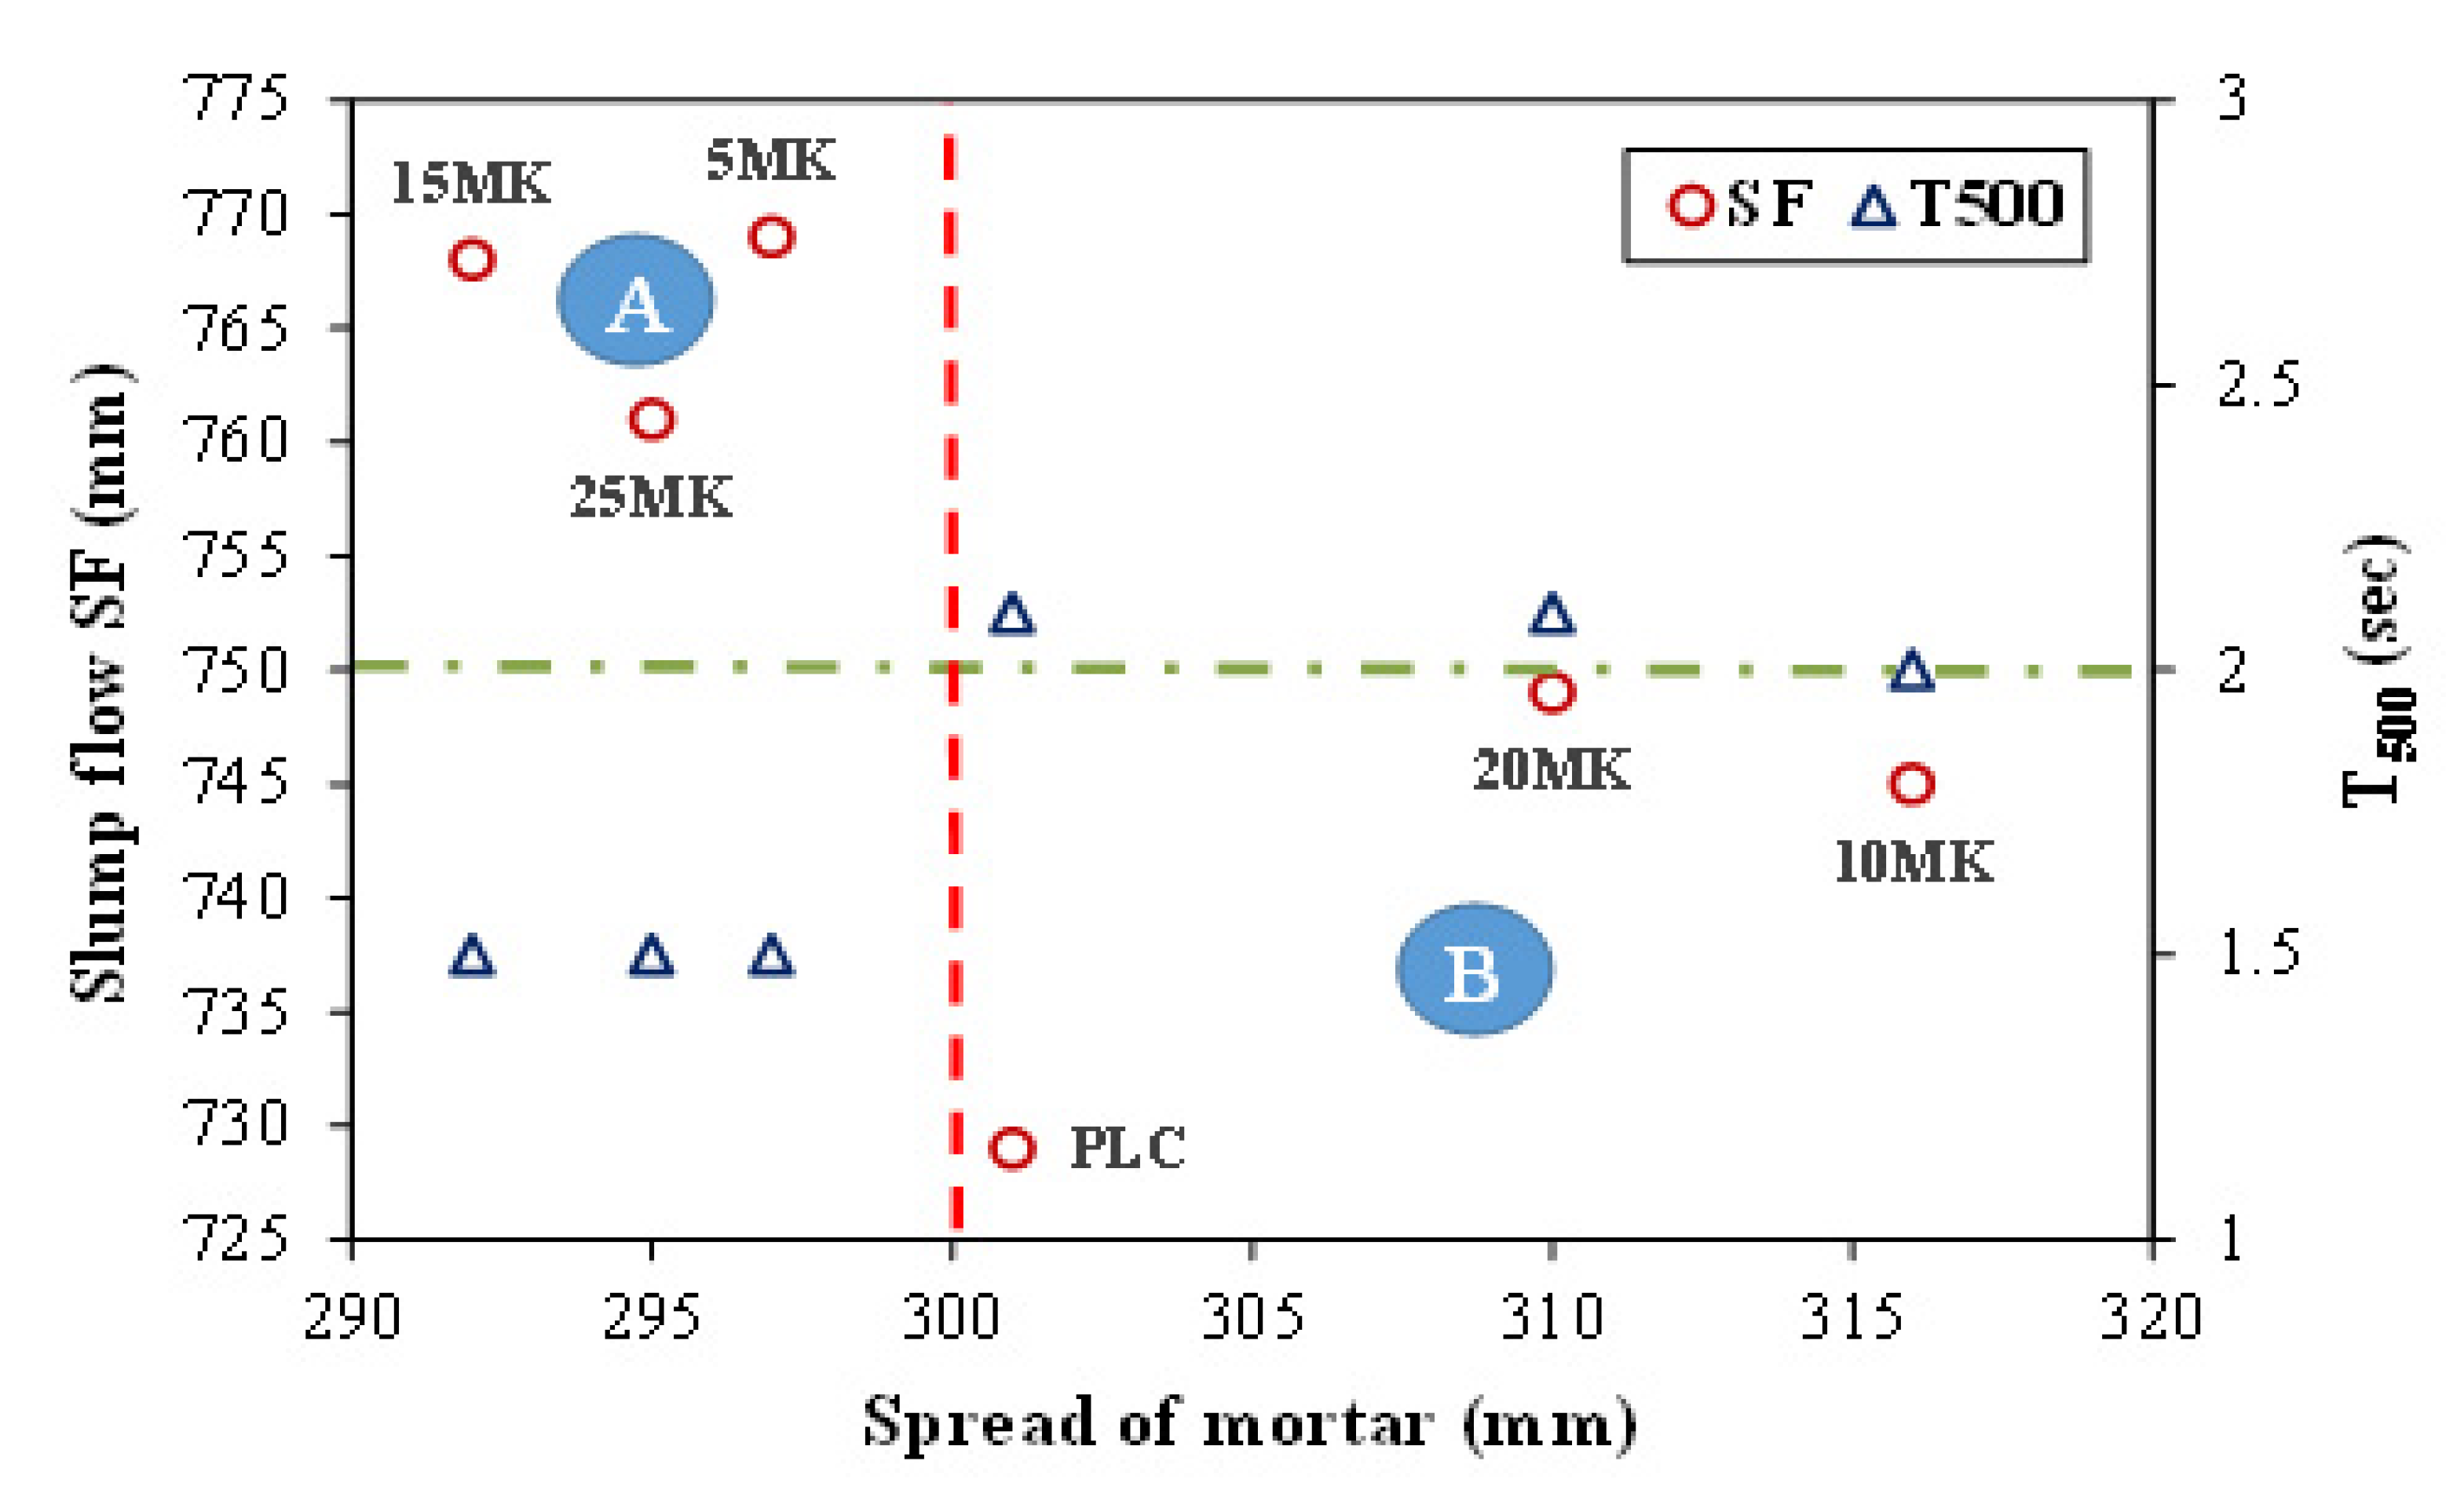
From Figure 2, it can be seen that SCC mixtures can be classified into two categories of SCM; Category A, corresponding to SCC with spread in SCM < 300 mm, such as those of 5MK, 15MK and 25MK and category B, relative to SCC with spread in SCM ≥ 300 mm, such as those of 0MK, 10MK and 20MK. The first category has SCC spreads > 750 mm and flow time T500 < 2 s, which corresponds to SCC with lower viscosity and a probable risk of segregation [20]. The opposite trend is seen in the second category (spreads of the SCCs ≤ 750 mm and flow time T500≥ 2 s), which corresponds to the results of the required SCC [24].
It can be observed that the components of the SCM play a major role on their related SCC mixes and that there is a good relationship between the SCM and their related SCC. This relationship depends, in particularly, on the dosage of SP which influences the spreading diameters of the mortars adopted in an average of 305 ± 10 mm and that the rate of incorporation of MK influences the SCC according to their spreading diameters of mortars (< or ≥ 300 mm) and their categories A or B (Table 2).
It can be seen that the increase in the rate of MK in the SCC gradually increases the fluidity of the SCC of category B (729 mm, 745 mm and 749 mm) relative to the 0MK, 10MK and 20MK, respectively. In the case of SCC with category A, the fluidity decreases from 769 mm to 768 mm and 761 mm for 5MK, 15MK and 25MK, respectively.
However, the viscosity of SCC, which is the resistance of a material to flow avoiding its internal frictions [24], is constant for each category. It is acceptable for category B (T500 ≥ 2 s) and lower for category A (T500 < 2 s). The flow of SCC with low viscosity is very fast at the beginning then the flow slows down. On the other hand, SCC with high viscosity continues to flow slowly for a prolonged period [10] as the high viscosity contributes to improve the suspension of the aggregates in the mix, and consequently preventing the segregation of the gravel and keeping the mix homogeneous [19].
Sedran [25], reported that the SP has mainly an effect on the spreading. However, the water content strongly affects both the fluidity and the viscosity of the mixture. From Table 2, it is clearly seen that there is an irregular deformability at the level of the SCM and this could be due to the effect of the SP.
The high fluidity and low viscosity SCC with category A (Figure 2) may be due to the effect of water content of the mix when using MK which requires higher water demand and improves significantly the viscosity of SCC [19], which helps to enhance the segregation resistance of concrete. Moreover, a high viscosity is necessary for the segregation resistance of SCC but should not be excessively high so that the coarse aggregate cannot pass through the space, between the rebars [26]. Therefore, to increase the segregation resistance of category A SCC, it is necessary to increase the viscosity, by reducing the W/B or by incorporating a viscosity enhancing agent (VEA) or more economically, by using aggregate with a maximum diameter of 10 mm [21]. According to Yahia et al. [27], adequate resistance to segregation is obtained by reducing the W/C, increasing the cohesion of the paste, adding finer particles or by using a viscosity agent. Chai [21], also reported that a VEA can be used, if the W/B is greater than 0.37 for a SCC with a Dmax equal to 20 mm and no VEA should be used, if the W/B is between 0.40 and 0.50 and the Dmax is of the order of 10 mm.
According to Barbhuiya [28] and Khayat [29], there are two ways to improve the viscosity of the concrete: by increasing the binder content or by incorporating a VEA. The first approach is to lower the W/B to maintain adequate cohesive friction between mortar and coarse aggregate, and ensure uniform flow of SCC through restricted sections [29]. The other way is to incorporate a low to moderate dosage of a VEA without lowering the W/B (because the W/B ratio is constant for all mixtures). This can reduce the coarse volume of the aggregate and reduce the risk of blockage, which is particularly useful in mixes containing a moderate content of SCM and fillers [29]. Furthermore, the use of a VEA in SCC is not always necessary. However, VEA may be beneficial for SCC containing discontinuous, angular, plate and elongated coarse aggregates and lower content of cementitious materials [26].
Finally, the targeted average value of the SCM (spread of 305 ± 10 mm) resulted in spreads in SCC between 729 and 769 mm and flow times T500 between 1.50 and 2.10 s. In order to avoid the probability of having too low viscosity or a risk of possible segregation of SCC mixtures with a spread >750 mm, the workability and the ability to fill category A concretes formulated in this way must be checked, using the SCC workability tests and the necessary adjustments should be made [25].
(1)
either that the water content of the SCC will be checked and adjusted downwards in such a way that there will be a spread of category B and consequently, an SCC with a spread ≤ 750 mm and a flow time T500 ≥ 2 s will be produced but the W/B ratio will not be constant for all the mixtures or (2) adding a VEA to the SCC of category A, which belongs to the spreading class SF3 (760 to 850 mm), whose resistance to segregation is more difficult to control [22].
(2)
Thus, according to Safiuddin [26], it is recommended to use a VEA in SCC when the mixtures are too fluid and present a risk of segregation which should be improved without changing the primary proportions of concretes. However, the Japanese approach used in this work was developed for concretes without VEA [30] and is extended to concretes with VEA [25].
The spread value in mortar that was found to be acceptable (spread ≥ 300 mm), was suggested by Chai, to produce a successful SCC [18]. However, other researchers have found a successful SCC with spread values in SC Mortars < 300 mm. It has been reported that the Japanese experience have indicated that values between 250 and 280 mm for mini-cone spreading, and 6 and 10 seconds for V-funnel flow time will produce a successful SCC [18]. A target spread of 240 to 260 mm and a V-funnel flow time of 7 to 11 seconds were suggested by EFNARC [24]. It has been suggested target values for spread and V-funnel flow times, equal to 245 mm and 10 seconds, respectively [31].
Therefore, in order to produce a successful SCC, the choice of mortar spread value should aim for a SCC spread target value. According to Chai [21], a spread value between 600 and 700 mm and between 650 and 750 mm will be sufficient for SCC with Dmax of 10 and 20 mm, respectively. Below the lower limit, concrete may have insufficient fluidity to pass through and around obstacles, and above the upper limit, segregation is likely to occur [32]. Moreover, 90% of the cases analyzed by Dommone [33], the SCC formulated around the world, had spreads between 600 and 750 mm.

3.2. V-funnel flow time of SCC vs. spread of mortar

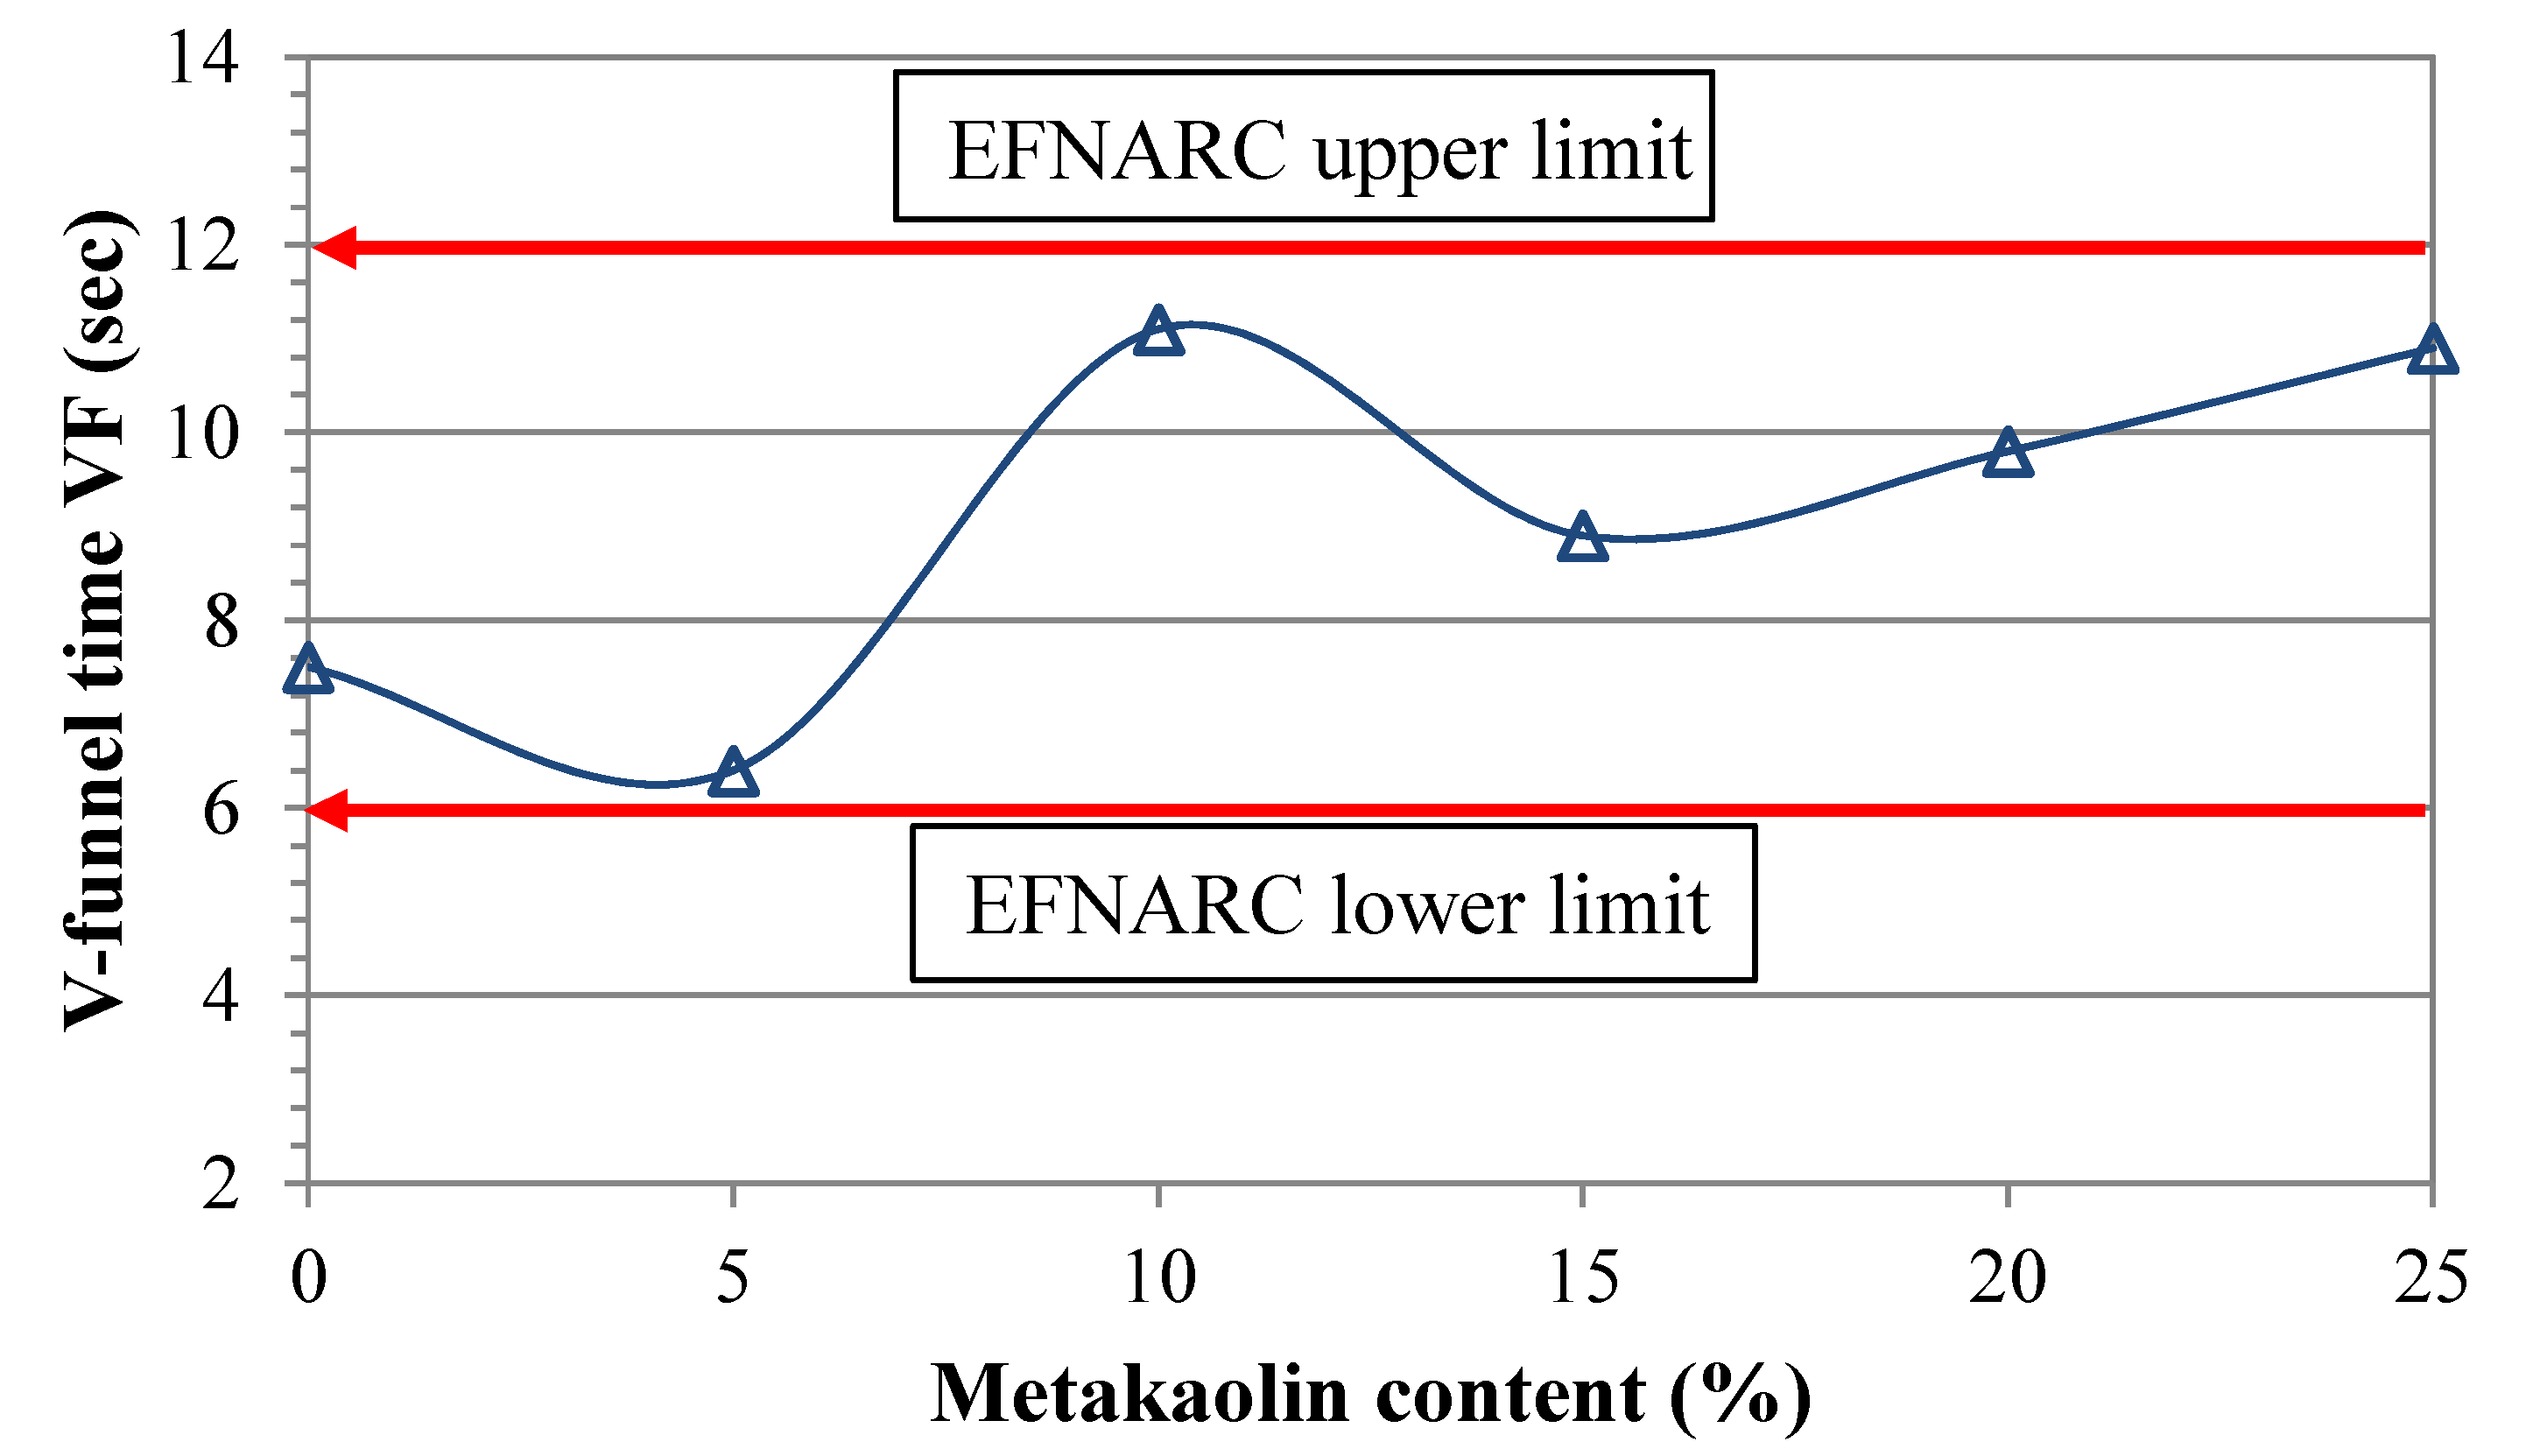
The measurement of the V-funnel flow time (Tv) is considered as an alternative to the measurement of the flow time T500 [34]. The results of the T500 and the Tv were used to evaluate the viscosity and fluidity of SCC [19]. The substitution of cement by 5% of MK at constant SP dosage and constant W/B ratio, the fluidity of SCM with MK was reduced and the viscosity was increased [35]. The decreases of the slump flow with the use of MK for a given W/B ratio was noticed [22]. According to Hassan et al. [19], the increase in T500 or Tv indicates an increase in the viscosity of the mixture or a decrease in the fluidity of the mixture of the 5MK SCC (Figure 3). It is clearly seen that the viscosity of 5MK, evaluated by the time Tv, decreased contrary to T500 and the fluidity of SCC increased instead of being reduced (Figure 1). This may be due to the fine limestone of the PLC cement used, which reduced both the water content of the mix [36], by contributing to the lubrication of the coarse aggregates and consequently improving the fluidity of the SCC at low levels of MK [20].
According to Figure 3, as the dosage of SP increased, the viscosity increased as shown by the increase of the flow time (Tv) compared to control concrete for mixes having 10% of MK and above as also reported by other researchers [20]. According to Hassan et al. [19], the increase in T500 or Tv indicates an increase in the viscosity of the mixture or a decrease in the fluidity of the mixture. The clay nature of the MK contributes to the increase in the viscosity and consequently decreases the fluidity and therefore reduces the risk of segregation of SCC.
However, it can be seen clearly that the flow time increases and the spread flow for mixtures 15MK and 25MK. On the other hand, the opposite trend is observed for mixtures 10MK and 20MK. It can also be noted that there is a good relationship between the spread of the SCM and the filling capacity of the related SCC measured by the V-funnel test (Figure 4) and that the level or the rate of cement substitution by MK still affects the SCC according to their mortar spreading diameter (< or ≥ 300 mm). Increasing the content of MK decreases the Tv of SCC for slump flow of SCM≥ 300 mm (category A) and increases in the same time the Tv of SCC for SCM with slump flow less than 300mm (category A). This indicates that the substitution of cement by MK does not change the correlations established between the SCC and its related SCM.
Even though all the formulated SCC mixes are within the viscosity range (Tv = 6 – 12 s), recommended by EFNARC for a particle size Dmax ≤ 20 mm [24], a flow time of 10 seconds is considered more suitable for SCC [20]. According to Domone et al. [32], if the flow time is higher than 10 seconds, the concrete is either too viscous for satisfactory handling and placement, or is unstable as the aggregate particles get stuck and block the flow. SCC mixes with 10% and 25% of MK gave a flow time of 11.10 seconds and 10.90 seconds, respectively and a spread flow of 745 and 761 mm, respectively and hence it can be concluded that SCC with 10MK (category B) is too viscous for satisfactory handling and placement. On the other hand, SCC of 25MK (category A) is unstable, so that the aggregates particles are blocked and consequently will block the flow.

3.3. L-box test of SCC vs. spread of mortar

The L-box test is used to measure the filling capacity and passing capacity of SCC through confined areas [37,38,39] with no segregation or blockage. However, in order to obtain adequate passing capacity, the coarse aggregate content should be less than the maximum amount recommended (≤ 35% of the concrete volume) [26]. On the other hand, increasing the cement content from 450 kg/m3 to 500 kg/m3, the passing capacity of the mixtures will be greatly improved [19].
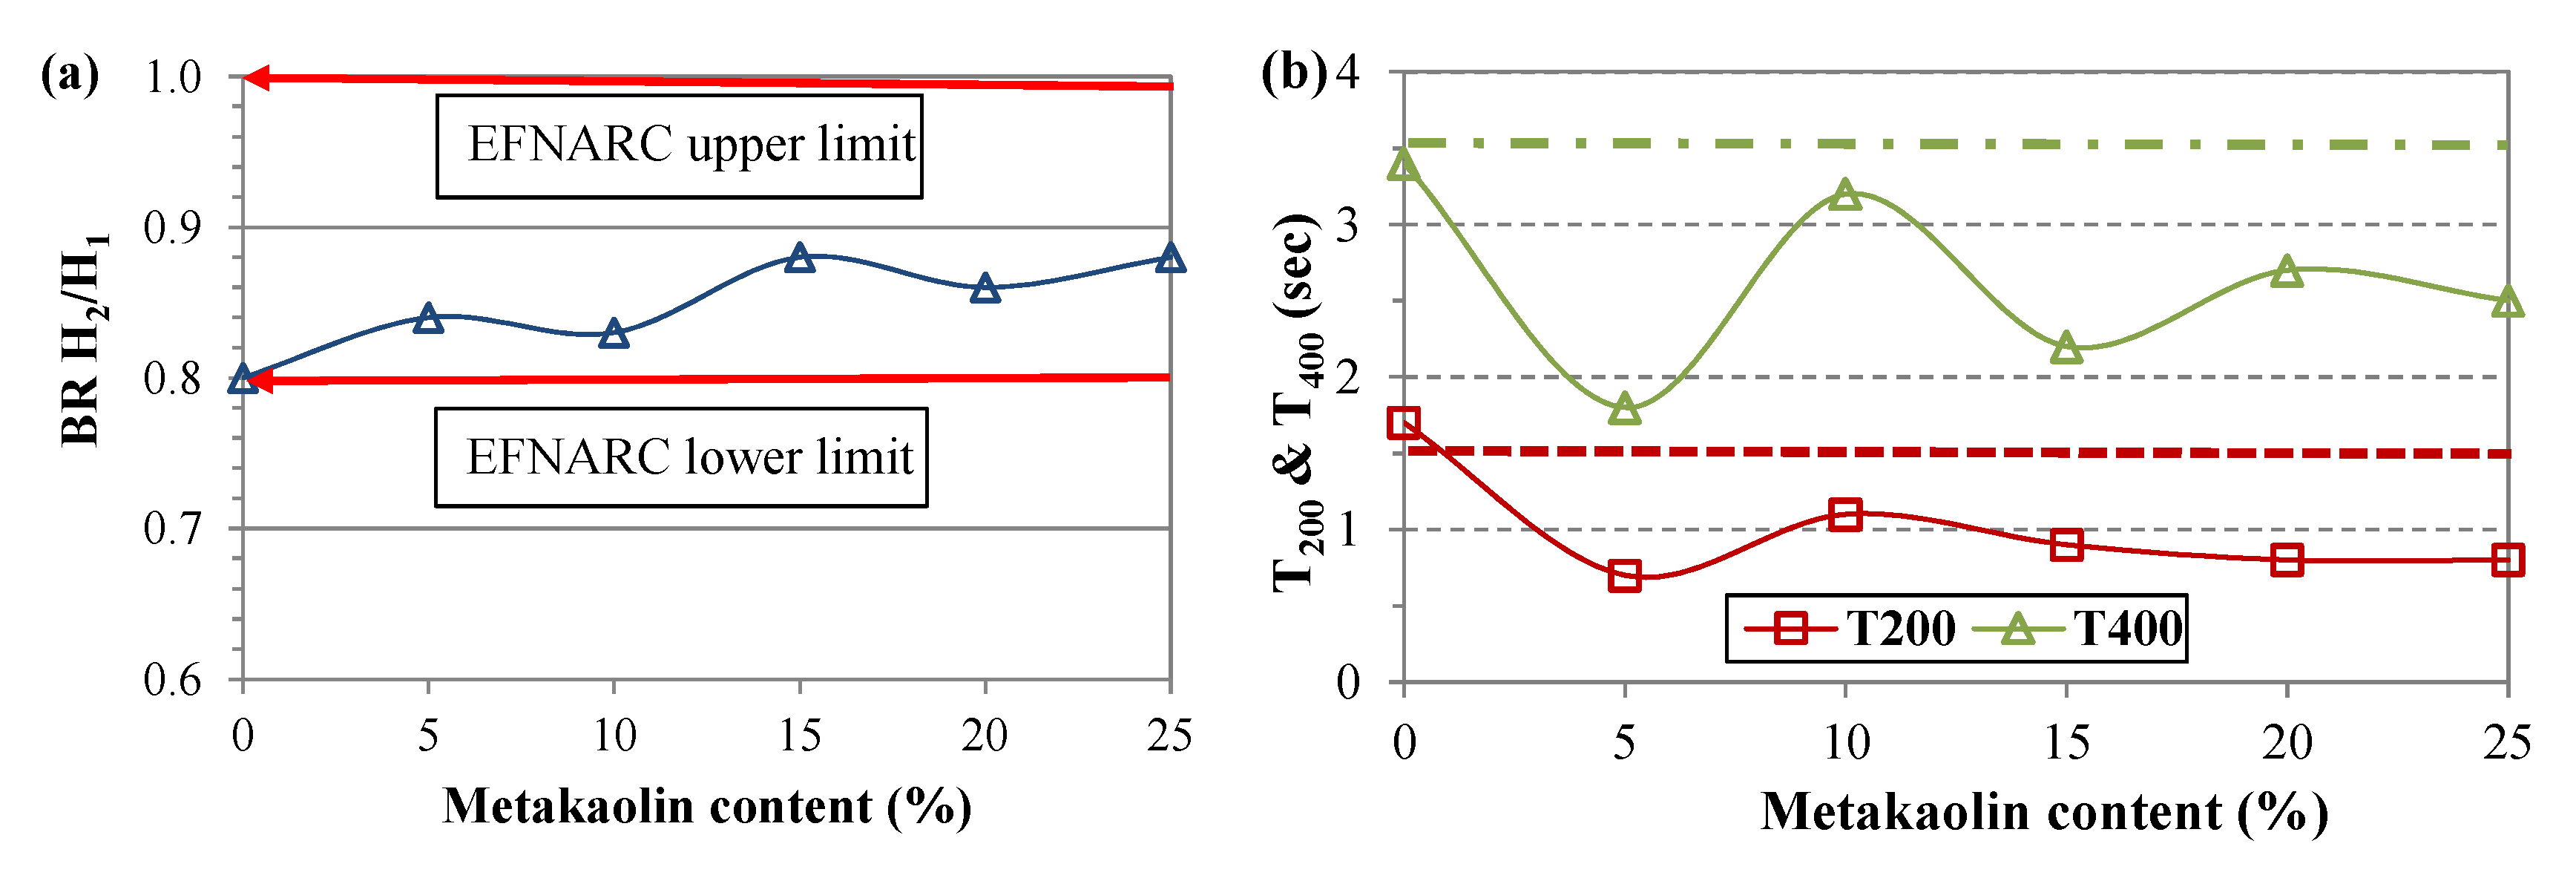
The ability to flow or pass, in narrow openings and areas of high reinforcement density, is assessed by measuring the filling rate (H2/H1), expressed by the ratio of the height of the concrete in the vertical part of the box and the height of the concrete at the end of the horizontal part of the box [19]. The concrete flow time values t200 and t400 (the times when the concrete reaches the distance 200 mm and 400 mm from the horizontal arm, respectively) are used to evaluate the speed deformation of the SCC [19] and give an indication of the ease of concrete flow [24]. These measured parameters show similar trends as those of the filling capacity measured by the slump flow test (Figure 1).
According to Figure 5, it can be seen that the partial substitution of PLC cement by MK increases the value of filling rate (H2/H1 ≥ 0.8) for passing through 3 bars, suitable for areas with narrower and denser reinforcement) and decreases those of the flow times t200 and t400. Mixtures of SCC with MK have a higher passage capacity than that of the control concrete. Similar results have been found by other researchers, indicating that the addition of (SCM) increases the passing capacity of the SCC [19]. Moreover, MK has been shown to increase the viscosity of the mixture, to contribute to the improvement of the suspension of particles in the mixtures of SCC and to lead to greater passing capacity and greater resistance to segregation [19]. However, the rate of incorporation of MK influences greatly the flowability of the SCC according to their spreading diameter of mortar (< or ≥ 300 mm). The increase in the rate of cement substitution by MK in the SCC increases as the value of the filling rate increases according to the category type. The successive increase values of category A (0.84; 0.88 and 0.88) are slightly higher than SCC with category B (0.80; 0.83 and 0.86). On the other hand, for the flow times t200 and t400, the values of category A increase successively and the values of category B decrease successively as the content of MK increases. This indicates that the substitution of cement by MK does not change the correlations established between the mortar and its SCC. It can be concluded that the results of the L-box test agree and exhibit similar trends with the results of the previous tests and that there is a good relationship between the spread of the SCM and the flowability of the related SCC measured by the L-box test as illustrated by Figure 5.
Sonebi et al. [38] reported that the filling rate represented by the H2/H1 ratio is influenced by three parameters, the water dosage, the SP dosage and the volume of gravel in the mixture. The increase in the first two parameters leads to an increase in the filling rate. However, the increase in the volume of gravel leads to a reduction in the filling rate and so an increase in the risk of blockage of the coarse aggregates behind the steel bars of the L-shaped box. Thus, it can be noted that in our case the increase in the filling rate of the SCC is due to the increase in the first two parameters (the W/B ratio is greater than 0.37 for an SCC with a Dmax equal to 20 mm and the SP dosage increases as the MK level increases). Nevertheless, this elevation of the filling rate still depends on the spreading diameter of the mortar (< or ≥ 300 mm) as mentioned elsewhere.
In addition, SCC (category A) with higher filling rate and low t200 and t400 values have an ability to flow in the presence of obstacles compared to those of category B. Moreover, the incorporation of MK has a negative effect on filling rate of category A due to the concomitant increase in viscosity [35]. SCC flowability was 0.84, 0.88 and 0.88 for 5MK, 15MK and 25MK mixes, respectively which is in the range of (0.8 – 1.0) suggested by EFNARC for a particle size Dmax ≤ 20 mm [24] but slightly out of the range proposed according to the Swedish experience for good passing ability [23]. This is the case for SCC category B, where the flowability was 0.80, 0.83 and 0.86 for PLC, 10MK and 20MK mixes respectively. On the other hand, according to Assié [3], the absence of a VEA increases the flow of SCC by increasing the filling rate as is the case for SCC category A with high fluidity which may be due to their instability.

3.4. J-Ring difference height of SCC vs. spread of mortar

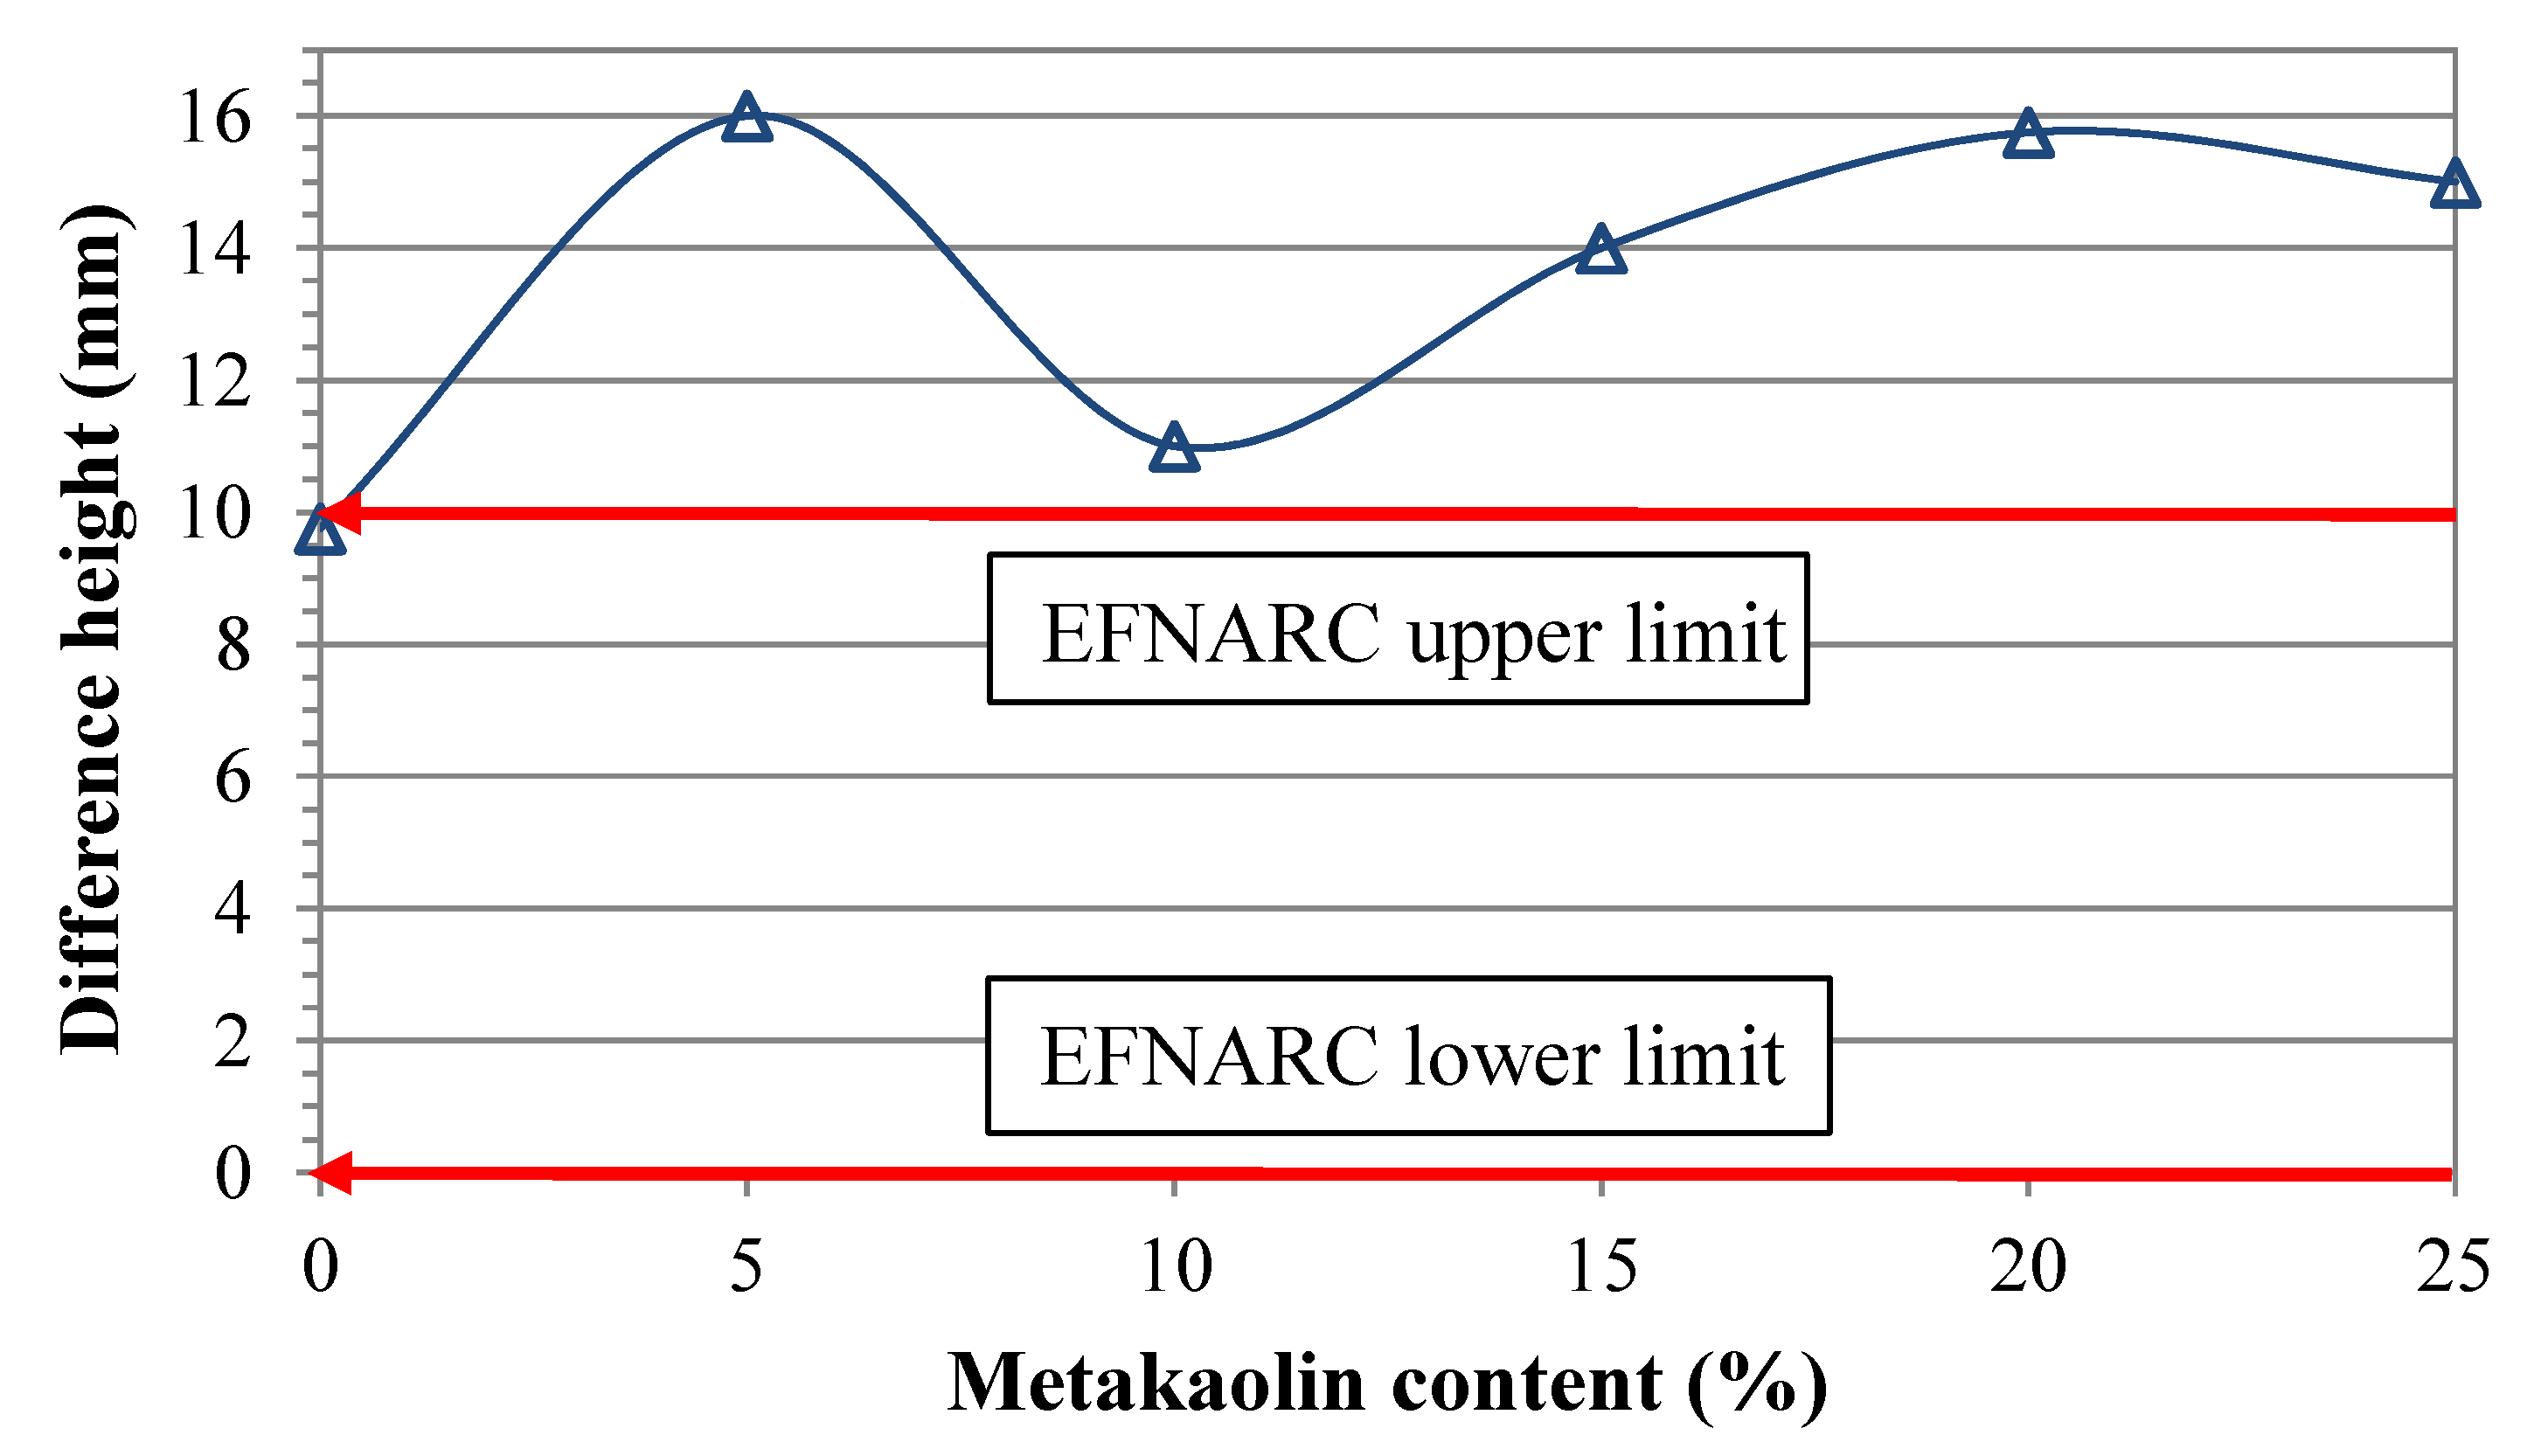
The J-ring flow test is used to determine the passing ability of SCC through confined areas with high reinforcement density [ 24,40,41]. It can be used as an alternative to L-box test. However, the results are not directly comparable [40]. The degree of filling of the ring flow spread with class PJ2 was greater than the value of 10 mm suggested by EFNARC [24] for all the mixtures containing MK as shown in Figure 6. These SCC mixtures with MK can be chosen for structures with widely spaced reinforcements [41]. It can be seen from this figure that the 5MK mix has a high blocking rate. This may be due to its instability in which the aggregate particles block its flow. According to Safiuddin [26], the viscosity of the mortar must be high to resist the separation of coarse aggregates. However, it should not be excessively high so that the coarse aggregates cannot pass through the space between the rebars.
Figure 6 indicates that the filling rates of the ring spreading of SCC have similar tendencies as those of the filling capacity measured by the spreading test according to their mortar spreading diameter (< or ≥ 300mm). It is noticed as the flow spreading test, that the increase of MK content in the SCC mixtures, increases progressively the degree of filling PJ of SCC with category B and decreases progressively the degree of filling PJ of SCC with category A.
Figure 7 shows similar tendency for J-Ring results as spreading and spreading time with and without J-Ring have similar trends relative to each other. Indeed, the rate of substitution of cement by MK always influences the SCC according to their mortar spreading diameter (< or ≥ 300 mm). In the case of SCC with category A, flow spreads and flow times (SCM spread < 300 mm) are higher and lower, respectively, than their SCC with category B. Flow times with and without J-Ring diverge from each other due to the decrease in flow capacity with increased risk of blockage. Furthermore, the difference between the flow spread with and without J-Ring of SCC containing MK increases between 25 and 50 mm as the MK content increases. This clearly indicates a remarkable minimal blockage [39], which could be suitable for normal applications with unreinforced or lightly reinforced concrete sections [26].

3.5. Segregation resistance test of SCC vs. spread of mortar

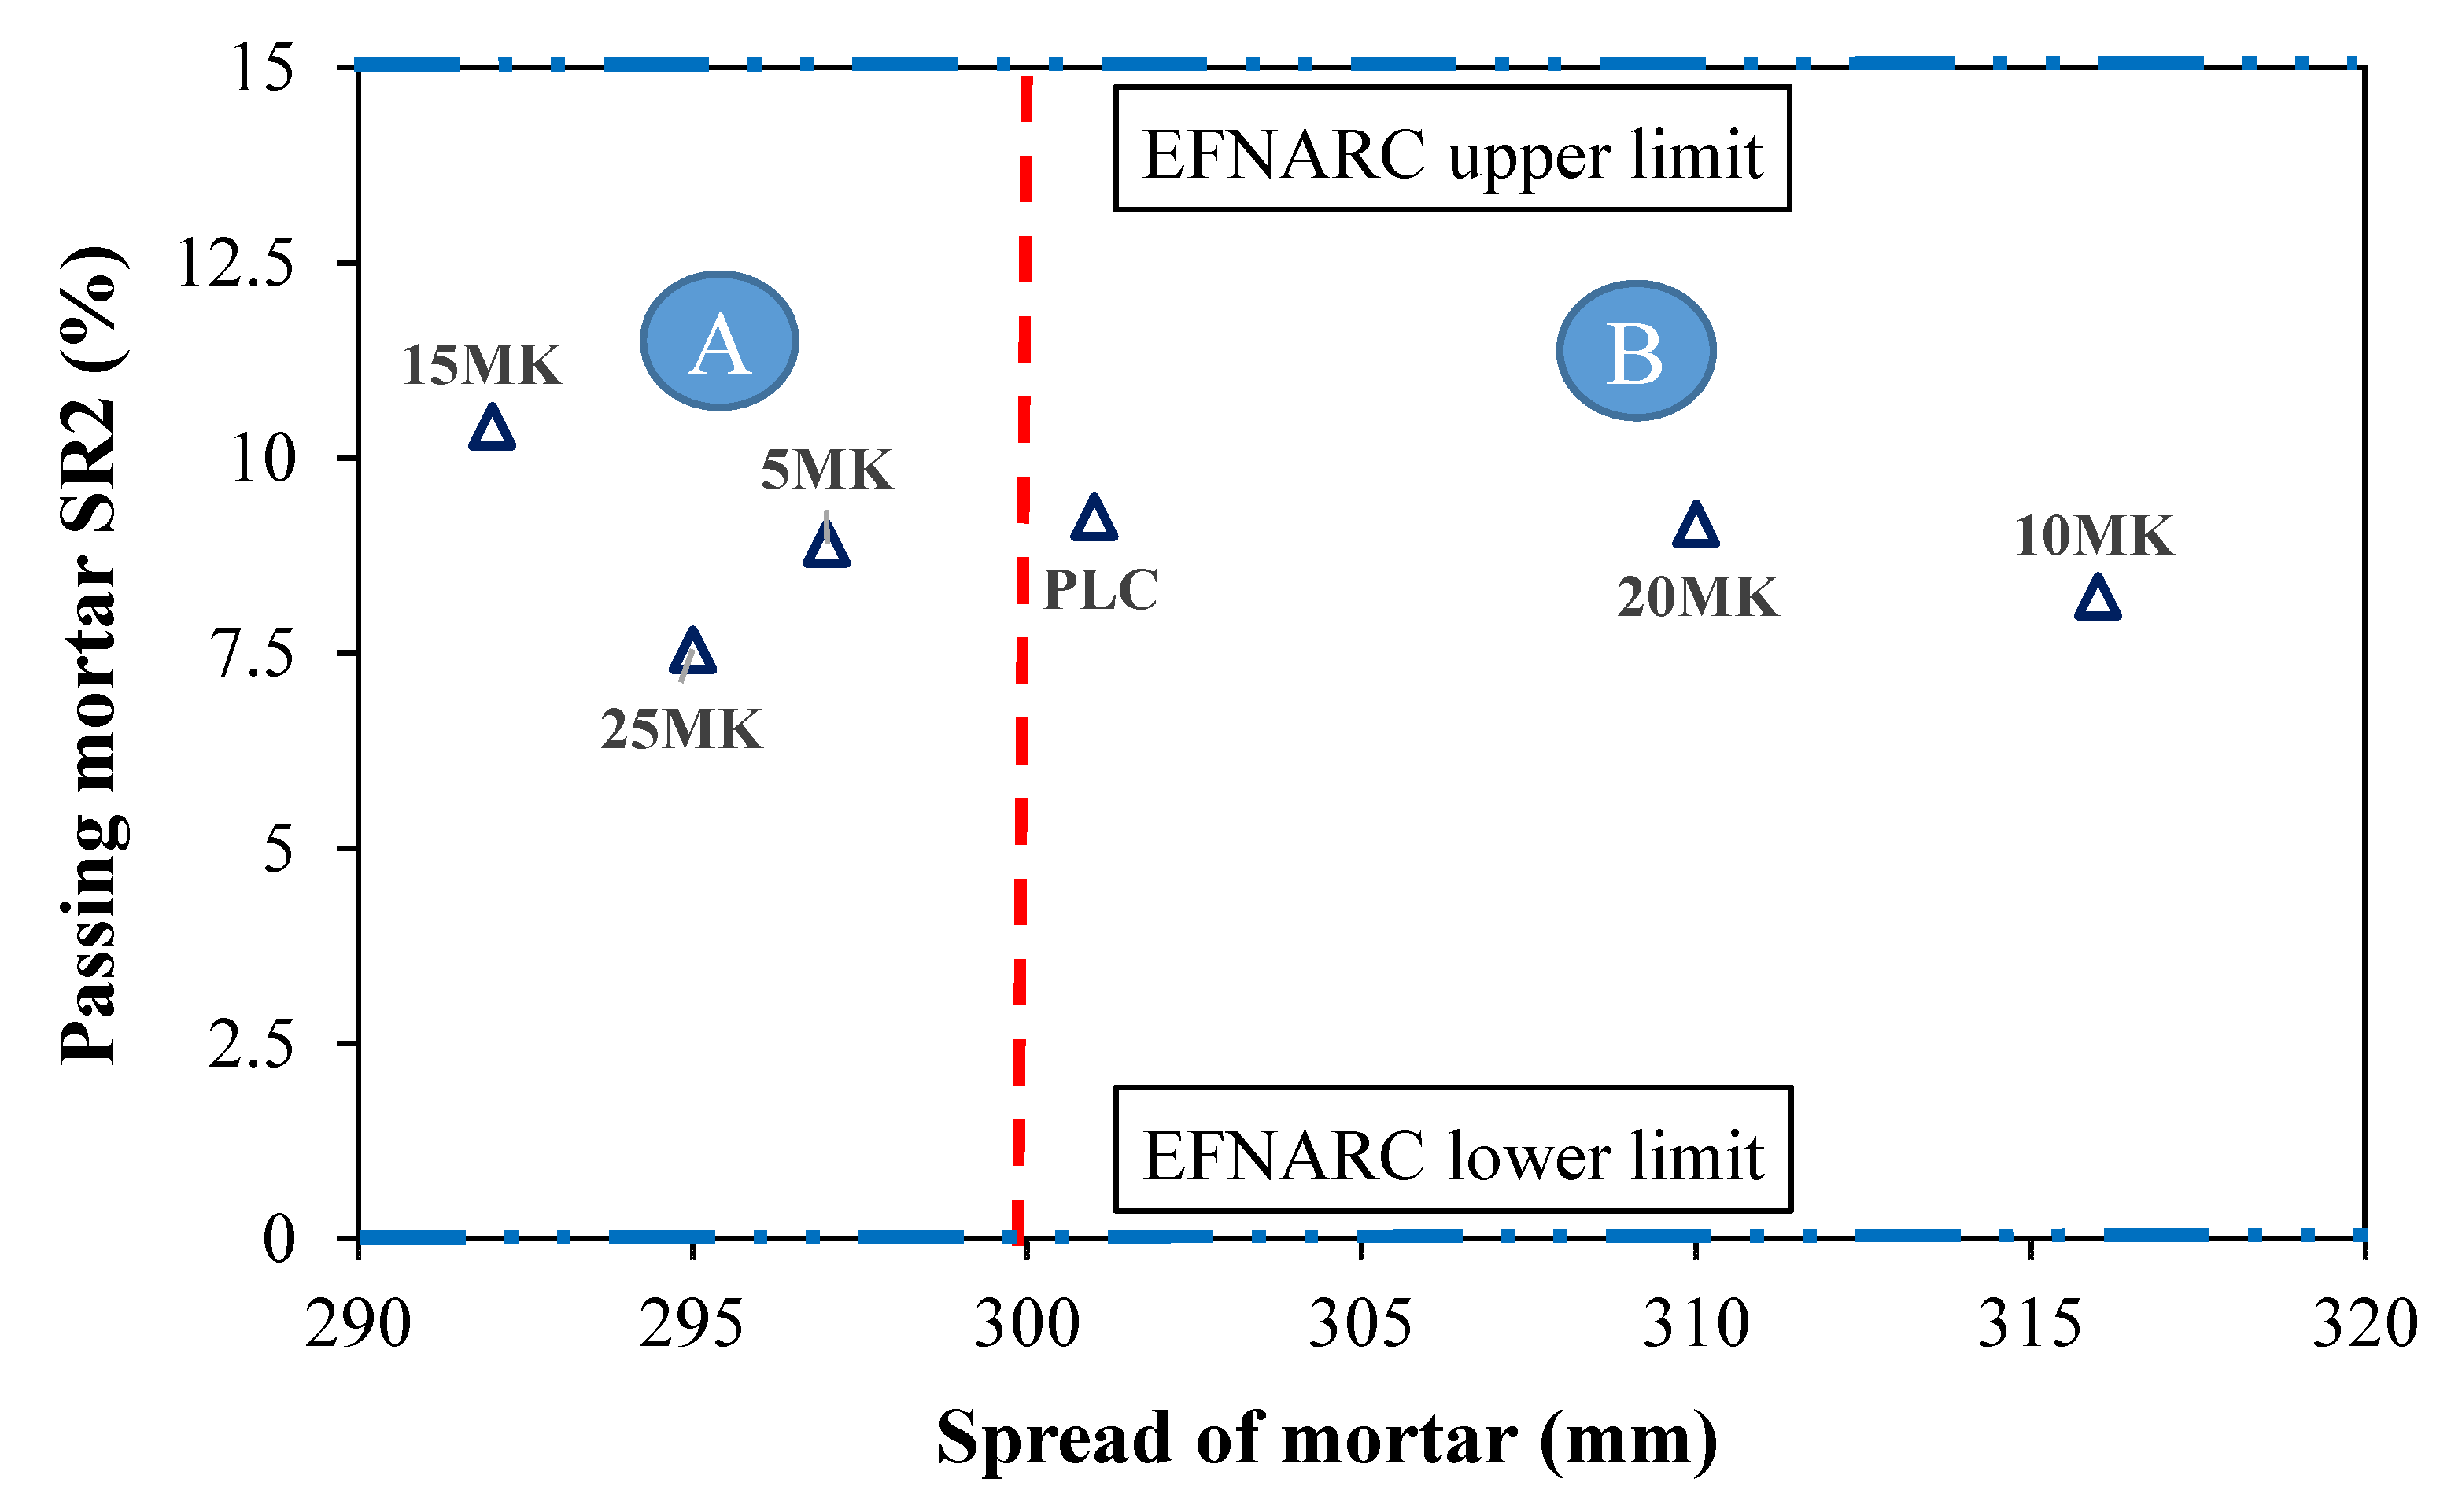
The segregation of SCC occurs mainly as a separation between coarse aggregates and mortar, i.e., the separation between the solid phase and the liquid phase [42]. The resistance to sieve segregation has been used to evaluate the segregation of coarse aggregates of SCC mixes [19]. Figure 8 illustrates the segregation resistance of the SCC vs flow spread of mortars. It can be seen that from this figure, that all the SCC with and without MK present a homogeneous and stable concrete at rest [43]. All the SCC have a segregation rate between 5 and 15%, which classified as class SR2 ≤ 15%. This limit of 5 to 15% is recommended for optimal resistance to segregation [41]. It can be observed from this figure that SCC with category B (spread in SC Mortar ≥ 300 mm) are more stable than those of category A.
According to standard EN 206-9 [14], the stability of the SCC is an important parameter to be taken into consideration, in the case of higher spread classes and lower viscosity classes. This is the case of SCC with category A (spread in SCM < 300 mm), where the spreads were in the highest class SF3 (760 to 850 mm) and the viscosities in the lowest class VS1 (< 2 s). To mitigate this problem, a VEA should be used. On the other hand, the segregation of coarse aggregates is strongly affected by the viscosity of the mixture where its increase reduces the probability of segregation [19]. The fluidity of concrete could be maintained by SP whereas the stability and the reduction of segregation and bleeding are maintained by VEA and powder content [44]. According to Saifuddin [22], the optimum flow capacity and resistance to segregation can be obtained by adjusting the fluidity and viscosity of the concrete through an appropriate combination of cement and SCM, by limiting the W/B ratio and adding an appropriate dosage of SP and possibly adding an appropriate dosage of VEA.

4. Conclusions

Based on this experimental investigation on the formulation of SCC through its SCM, the following conclusions can be given:
  • ✓ A good relationship exists between the spreading of SCM and the fresh properties of the related SCC. The choice of spreading of SCM ≥ 300 mm (PLC, 10MK and 20MK) leads to the desired properties of SCC.
  • ✓ The content of MK as cement substitution does not change the relationship between the SCM and its related SCC properties.
  • ✓ The choice of spreading value of the SCM must target for an SCC with a Dmax equal to 20 mm: spread value of SCC between 600 mm and 750 mm, flow time (Tv) of 10 s, filing rate value between 0.80 and 0.85 and Pj value ≤ 10 mm.
  • ✓ The use of VEA for SCC with higher spread (class SF) and low viscocity (class VS1) is needed to have a good resistance to seggregation.

References

  1. AFGC. Recommendations for the use of self-compacting concrete. Scientific and technical documents. 2008 [English ed.].
  2. Haddad, O. Contribution to the development of tools for the formulation of SCC related to fresh properties and strength at early ages. PhD thesis. University of Cergy–Pontoise, France, 2007 [in French].
  3. Assié, S. Durability of self-compacting concrete. PhD thesis. INSA de Toulouse, France, 2004 [in French].
  4. Jin, J. Properties of mortar for self-compacting concrete. PhD thesis. University College London, (January 2002).
  5. Turcry, Ph. , Loukili A. Different approaches for the formulation of self-compacting concrete : influence on the rheological and mechanical characteristics. Revue Française de Génie Civil. Taylor & Francis 7 (4) (2003) 425–450 [in French].
  6. Okamura, H. , Ouchi M. Self-compacting concrete. Journal of advanced Concrete Technology. Japan Concrete Institute1 (1) (2003) 5–15.
  7. Niknezhad, D. Contribution for the study of mechanical behaviour, shrinkage and transport properties of self-compacting concrete with mineral additions: Experimental and numerical approach. PhD thesis. INSA Rennes, 2015 [in French].
  8. Turcry, P. Shrinkage and cracking of self-compacting concrete.: influence of the formulation. PhD thesis. Ecole Centrale de Nantes, 2004 [in French].
  9. Khatib, J. M. , Siddique, R., Halliday, C., & Khatib, S. (2014). Lime activated fly ash paste in the presence of metakaolin. Procedia Engineering 95, 415–418. [CrossRef]
  10. Khatib, J. M. , Baalbaki, O., & ElKordi, A. A. (2018). Metakaolin. In Waste and supplementary cementitious materials in concrete (pp. 493-511). Woodhead Publishing. [CrossRef]
  11. Ouldkhaoua, Y. , Benabed, B., Abousnina, R., Kadri, E. H., & Khatib, J. (2020). Effect of using metakaolin as supplementary cementitious material and recycled CRT funnel glass as fine aggregate on the durability of green self-compacting concrete. Construction and Building Materials, 235, 117802. [CrossRef]
  12. Singh, H. , & Siddique, R. (2022). Utilization of crushed recycled glass and metakaolin for development of self-compacting concrete. Construction and Building Materials, 348, 128659. Construction and Building Materials. [CrossRef]
  13. Barkat, A. , Kenai S., Menadi B., Kadri E., Soualhi H. Effects of local metakaolin addition on rheological and mechanical performance of self-compacting limestone cement concrete. Journal of Adhesion Science and Technology 33(9) (2019) 963–985.
  14. European Standard EN 206–9. Concrete – Part 9: Additional rules for Self-compacting Concrete (SCC). European Committee for Standardization. 2010.
  15. Domone, P. Mortar tests for self-consolidating concrete – Simple evaluation of materials and mixture proportions. A contribution from ACI Committee 236. Concrete International (April 2006) 39–45.
  16. Turk, K. Viscosity and hardened properties of self-compacting mortars with binary and ternary cementitious blends of fly ash and silica fume. Construction and Building Materials 37 (2012) 326–334. [CrossRef]
  17. Safiuddin, Md. , West J.S., Soudki K.A. Flowing ability of the mortars formulated from self-compacting concretes incorporating rice husk ash. Construction and Building Materials 25 (2011) 973–978. [CrossRef]
  18. Domone, P. , Jin J. Properties of mortar for Self-Compacting Concrete. Proceedings of RILEM International Symposium on Self-Compacting Concrete. Stockholm (September 1999). RILEM Proceedings PRO 7, Paris 109–120.
  19. Hassan, A.A.A. , Ismail M.K., Mayo J. Mechanical properties of self-consolidating concrete containing lightweight recycled aggregate in different mixture compositions. Journal of Building Engineering 4(2015) 113–126. [CrossRef]
  20. Perlot, C. , Rougeau P., Dehaudt S. Slurry of metakaolin combined with limestone addition for self-compacted concrete. Application for precast industry. Cement & Concrete Composites 44 (2013) 50–57. [CrossRef]
  21. Chai H-W. Design and testing of self-compacting concrete. PhD thesis. University of London, 1998. [CrossRef]
  22. EFNARC. European guidelines for self-compacting concrete: specification, production and use, Self-compacting concrete. European project group 2005.
  23. RILEM Report 23. Self-compacting concrete – State-of-the-Art Report of RILEM Technical Committee 174-SCC, RILEM publications (2000).
  24. EFNARC. Specification and guidelines for self-compacting concrete. Norfolk (UK), European federation for specialist construction chemicals and concrete systems; 2002 [English ed.].
  25. Sedran, T. Rheology and rheometers of concrete. Application to self compacting concrete. PhD thesis. Ecole nationale des ponts et chaussées, Paris, 1999 [in French].
  26. Safiuddin, Md. Development of Self-Consolidating High Performance Concrete Incorporating Rice Husk Ash. PhD thesis. University of Waterloo, Ontario, Canada, 2008.
  27. Yahia, A. , Tanimura M., Shimabukuro A., Shimoyama Y. Effect of Rheological Parameters on Self-Compactability of Concrete Containing Various Mineral Admixtures. Proceedings of the First International RILEM Symposium on Self-Compacting Concrete. Stockholm, Sweden (1999) 523–535.
  28. Barbhuiya S. Effects of fly ash and dolomite powder on the properties of self-compacting concrete. Construction and Building Materials 25 (2011) 3301–3305. [CrossRef]
  29. Khayat, K.H. Workability, testing, and performance of self-consolidating concrete. ACI Materials Journal 96 (3) (1999) 346–354.
  30. Phan, T.-H. Rheology and stability of cement pastes used in the formulation of fluid concretes. PhD thesis. Ecole normale supérieure de Cachan, 2007 [in French].
  31. Koehler, E.P. Aggregates in Self-Consolidating Concrete. PhD thesis. The University of Texas at Austin, 2007.
  32. Domone, P.L. , Chai H.-W., Jin J. Optimum mix proportioning of self-compacting concrete. Proceedings on International Conference on Innovation in Concrete Structures: Design and Construction. University of Dundee, September 1999. ed Dhir R K and Jones M R, Thomas Telford, London, 277–285.
  33. Domone, P.L. Self-compacting concrete: An analysis of 11 years of case studies. Cement & Concrete Composites 28 (2006) 197–208. [CrossRef]
  34. De Schutter, G. Guidelines for Testing Fresh Self-Compacting Concrete. European Research Project: Measurement of Properties of Fresh Self-Compacting Concrete, TESTING-SCC, (September 2005).
  35. Siddique, R. , Klaus J. Influence of metakaolin on the properties of mortar and concrete: A review. Applied Clay Science 43 (2009) 392–400. [CrossRef]
  36. Escadeillas, G. Cements with limestone fillers: contribution to their optimization by studying the mechanical and physical properties. PhD thesis. University of Paul-Sabatier Toulouse, France, 1988 [in French].
  37. Felekoğlu, B. , Türkel S., Baradan B. Effect of Water/Cement Ratio on the Fresh and Hardened Properties of Self-Compacting Concrete. Building and Environment 42 (2007) 1795–1802. [CrossRef]
  38. Sonebi, M. , Grünewald S., Walraven J. Filling Ability and Passing Ability of Self-Consolidating Concrete. ACI Materials Journal 104 (2) (2007) 162–170.
  39. Sua-iam, G. , Sokrai P., Makul N. Novel Ternary Blends of Type 1 Portland Cement, Residual Rice Husk Ash, and Limestone Powder to Improve the Properties of Self-Compacting Concrete. Construction and Building Materials125 (2016) 1028–1034. [CrossRef]
  40. European Standard EN 12350–12. Testing fresh concrete – Part 12: Self-compacting concrete – J-ring test. European Committee for Standardization. 2010.
  41. Liu, M. Wider application of additions in Self-compacting concrete. PhD thesis. University College London, 2009.
  42. Yan, W. , Cui W., Qi L. Effect of aggregate gradation and mortar rheology on static segregation of self-compacting concrete. Construction and Building Materials 259 (2020) 119816.
  43. El-Barrak, M. Contribution to the study of the aptitude to flow of self-compacting concrete at the fresh state. PhD thesis. University of Toulouse III, France, 2005 [in French].
  44. Prakash, R. , Raman S. N., Divyah N., Subramanian C., Vijayaprabha C., Praveenkumar S. Fresh and mechanical characteristics of roselle fibre reinforced self-compacting concrete incorporating fly ash and metakaolin. Construction and Building Materials 290 (2021) 123209. [CrossRef]
Figure 1. SCC filling ability tests. (a) SCC slump flow. (b) SCC T500 slump flow time.
Preprints 79665 g001
Figure 2. Filling ability tests of SCC vs. spread of mortar.
Preprints 79665 g002
Figure 3. SCC V-funnel flow time.
Preprints 79665 g003
Figure 4. V-funnel flow time of SCC vs. spread of mortar.
Preprints 79665 g004
Figure 5. SCC L-box tests. (a) SCC Blocking ratio. (b) SCC T200 and T400.
Preprints 79665 g005
Figure 6. SCC J-Ring difference height.
Preprints 79665 g006
Figure 7. SCC filling ability tests with and without J-Ring vs. metakaolin content.
Preprints 79665 g007
Figure 8. Segregation resistance test of SCC vs. spread of mortar.
Preprints 79665 g008
Table 1. Grain size of the used aggregates.
Sieve size (mm)
16 12.5 10 8 6.3 5 2.5 1.25 0.63 0.315 0.16 0.08
15– 8 mm 100 98 61 26 6 1 0
8– 3 mm 100 100 100 98 77 50 5 1 1 1
Sand 100 100 100 100 100 100 99 98 91 51 9 2.55
Table 2. Mortars and SCC categories filling ability.
Category A B
MK (%) 5MK 15MK 25MK PLC 10MK 20MK
SP (%) 1.1 1.5 2.0 1.1 1.3 1.8
Spread (mm) 297 292 295 301 316 310
V-funnel (s) 5.10 6.25 9.45 4.20 5.15 8.00
Slump flow (mm) 769 768 761 729 745 749
Preprints 79665 i001 (s) 1.50 1.50 1.50 2.10 2.00 2.10
Disclaimer/Publisher’s Note: The statements, opinions and data contained in all publications are solely those of the individual author(s) and contributor(s) and not of MDPI and/or the editor(s). MDPI and/or the editor(s) disclaim responsibility for any injury to people or property resulting from any ideas, methods, instructions or products referred to in the content.
Copyright: This open access article is published under a Creative Commons CC BY 4.0 license, which permit the free download, distribution, and reuse, provided that the author and preprint are cited in any reuse.
Prerpints.org logo

Preprints.org is a free preprint server supported by MDPI in Basel, Switzerland.

Subscribe

© 2024 MDPI (Basel, Switzerland) unless otherwise stated