1. Introduction
According to world statistics, ovarian cancer ranks seventh in cancer mortality among women [
1]. Despite ovarian cancer mortality has declined by more than 30% over the past 50 years due to improvements in treatment, survival rate is still fewer than 50% at 5 years after diagnosis [
2]. The main methods of treatment of advanced ovarian cancer are a combination of surgery and chemotherapy (paclitaxel and platinum drugs in combination with bevacizumab or PARP inhibitors), the optimal order of which has not yet been determined. Cancer antigen 125 (CA125) is commonly used as a marker of ovarian cancer, but elevated levels are detected in only 50% of disease stage I and 80% of disease stage III-IV, and should be interpreted in conjunction with clinical signs and ultrasound findings due to nonspecificity and occurrence in other diseases [
3,
4,
5,
6]. It is used to monitor the patient’s response to neo-adjuvant and adjuvant treatments [
7,
8], or to predict the overall survival probability at 3 months after the end of primary treatment: risk of death is 51% at 24 months and up to 79% at 60 months if a CA125 value is above 35 [
9]. Significantly improvement diagnosis of early stage invasive serous ovarian/tubal carcinoma was the result of the two fully completed largest population clinical trials, using multimodal screening strategy (measurement serum level CA 125 and transvaginal ultrasound) [
10,
11]. But there was no significant reduction in
ovarian cancer mortality compared to no screening cohort.
Different researcher teams are still elaborating new strategies ovarian cancer screening selecting biomarkers alone or in combination with CA 125, such as ROMA, CPH1, OVA1, Overa [
12,
13]. These approaches were developed to improve detecting early-stage disease aimed to reduce ovarian cancer mortality. But the aggressive behavior of a tumor is caused by its biological properties (
extensive stromal reaction and increased invasiveness), which determine the failure of cytoreductive surgery, as well as сhemoresistance [
14]. Recent studies revealed that hormone receptor status defines tumor invasive properties and longevity, in particular, low levels of progesterone receptor (PGR) expression are associated with a more aggressive disease course and worse outcome in LGSOC and HGSOC [
15,
16], endometrioid carcinoma [
17]. On the contrary, improved survival rate in patients with poorly differentiated epithelial ovarian tumors was associated with high serum progesterone in combination with expression of PGR [
18]. The protective effect of progesterone may be due in part to PGR mediated suppression of progesterone receptor membrane component-1 providing the sensitivity of ovarian cancer cells to platinum-based chemotherapy [
19].
The main regulators of signalling pathways in a cell through gene expression level control at the transcriptional and post-transcriptional levels are small non-coding RNAs, including microRNAs (miRNAs) and piwiRNA (piRNA). Changed profiles of many miRNAs, implicated in pathogenesis of the gynecological diseases, have been identified [
20,
21] and showed a clear histotype specific pattern [
22]. Role of piRNAs in diverse kinds of cancers have been also demonstrated [
23]. Recently, PIWI proteins and piRNAs play a prometastatic role in ovarian carcinoma, contributing to disease progression, and are considered as potential diagnostic and prognostic biomarkers for ovarian cancer [
24,
25].
Therefore, in the present study, it was of interest to find the relationship between the level of progesterone receptor expression in serous tumors and small non-coding RNAs, which are potential regulators of CA125 and epithelial-mesenchymal transition, forming an aggressive tumor phenotype and its chemoresistance. It was important to develop a noninvasive method of diagnosing progesterone receptor-negative tumor for the proper management of patients with this type of tumor.
3. Discussion
Ovarian cancer is the most lethal gynecologic cancer with a 5-year survival rate of less than 50 percent [
2]. The biological properties of the tumor (increased invasiveness, profound chromosomal instability in the cancer cells, and chemoresistance) dictated by the tumor microenvironment, especially cancer-associated fibroblasts, natural killer (NK) cells, Th2 cells [
14,
32,
35,
36]. It was revealed that hormone receptor status defines tumor invasive properties [
15,
18,
38,
39,
40]. Increased expression levels of estrogen and progesterone receptors provides the better outcome for patients with ovarian cancer than reduced hormone receptors levels. In particular, aggressive form of the disease is characterized by low levels of PGR expression and worse outcome. Moreover, several polymorphisms in the hormone-binding domain in the PGR gene has been associated with increased risk of ovarian cancer [
41,
42,
43]. The protective effect of progesterone may be due to PGR mediated suppression of progesterone receptor membrane component-1 (PGRMC1), increasing the sensitivity of ovarian cancer cells to platinum-based chemotherapy [
19]. Thereby, targeted depletion of PGRMC1 could be used as an additional therapy to cisplatin. Recently, chemopreventive effect of synthetic progestin Norethindrone was demonstrated in epithelial ovarian cancer cells SKOV3 by upregulation of TP53 expression and downregulation of VEGF, HIF-1α, COX-2, and PGRMC1 expression, leading to significantly reduced SKOV3 cell growth, increased apoptosis and necrosis, and inhibiting cell migration [
44]. The present study was aimed to explore and evaluate the candidate factors, namely miRNA, piRNA, mRNA, associated with the PGR-negative serous ovarian tumors, to develop a non-invasive test for identification this aggressive and chemoresistant tumor phenotype before any treatment and to and be prepared to use targeted therapies in addition to conventional treatment regimens.
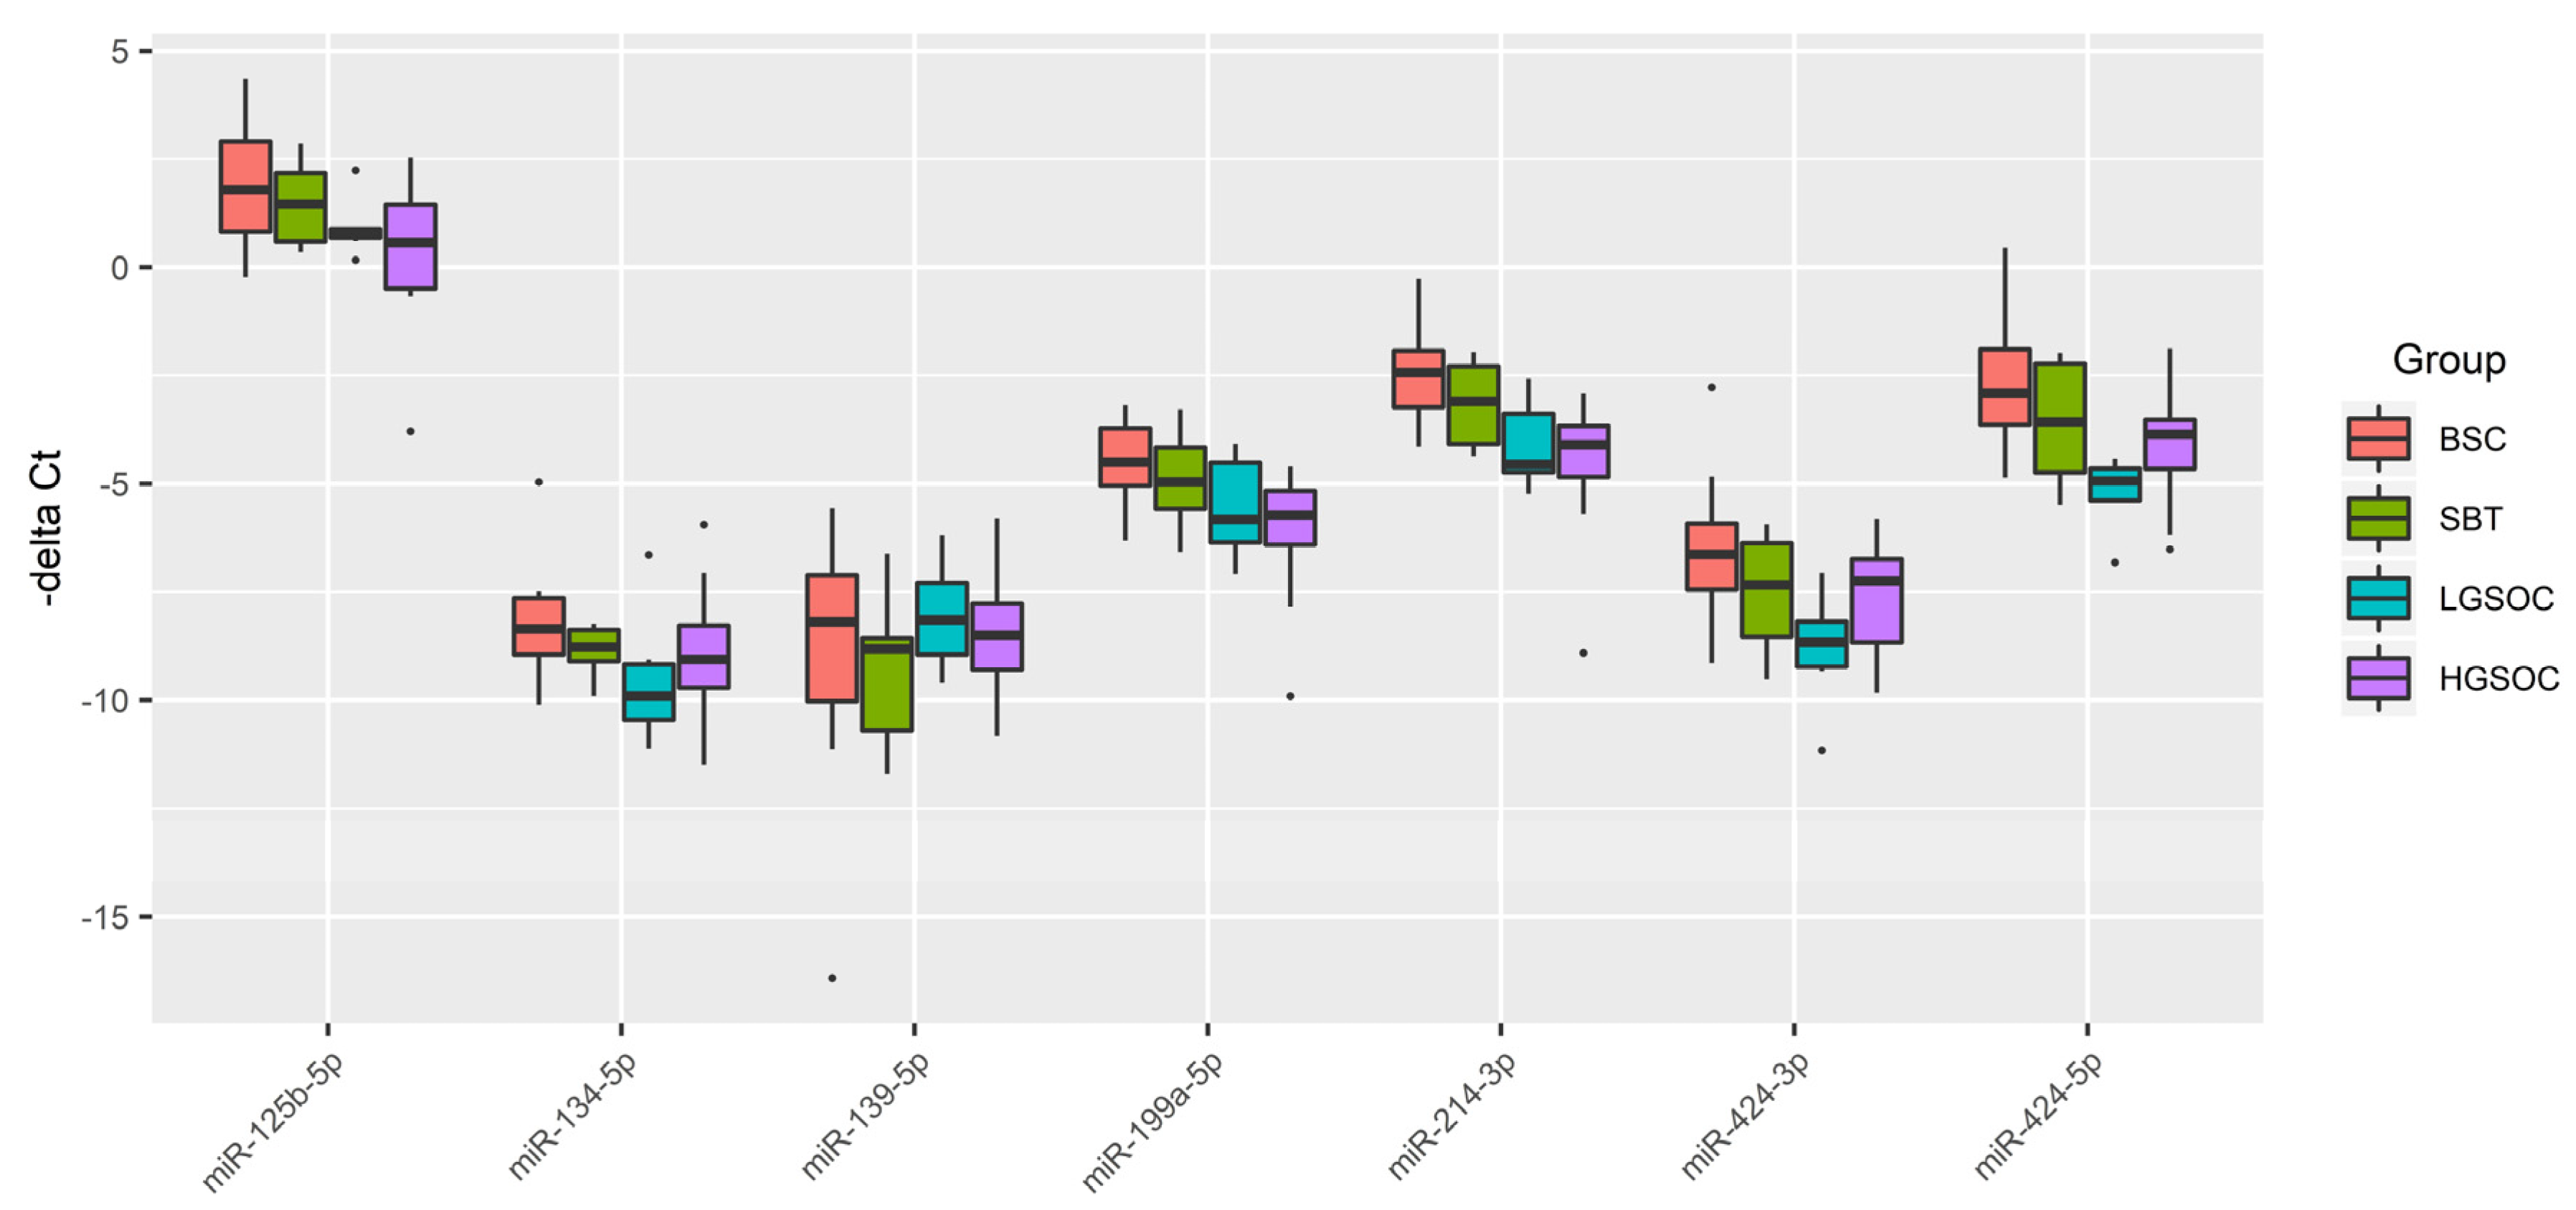
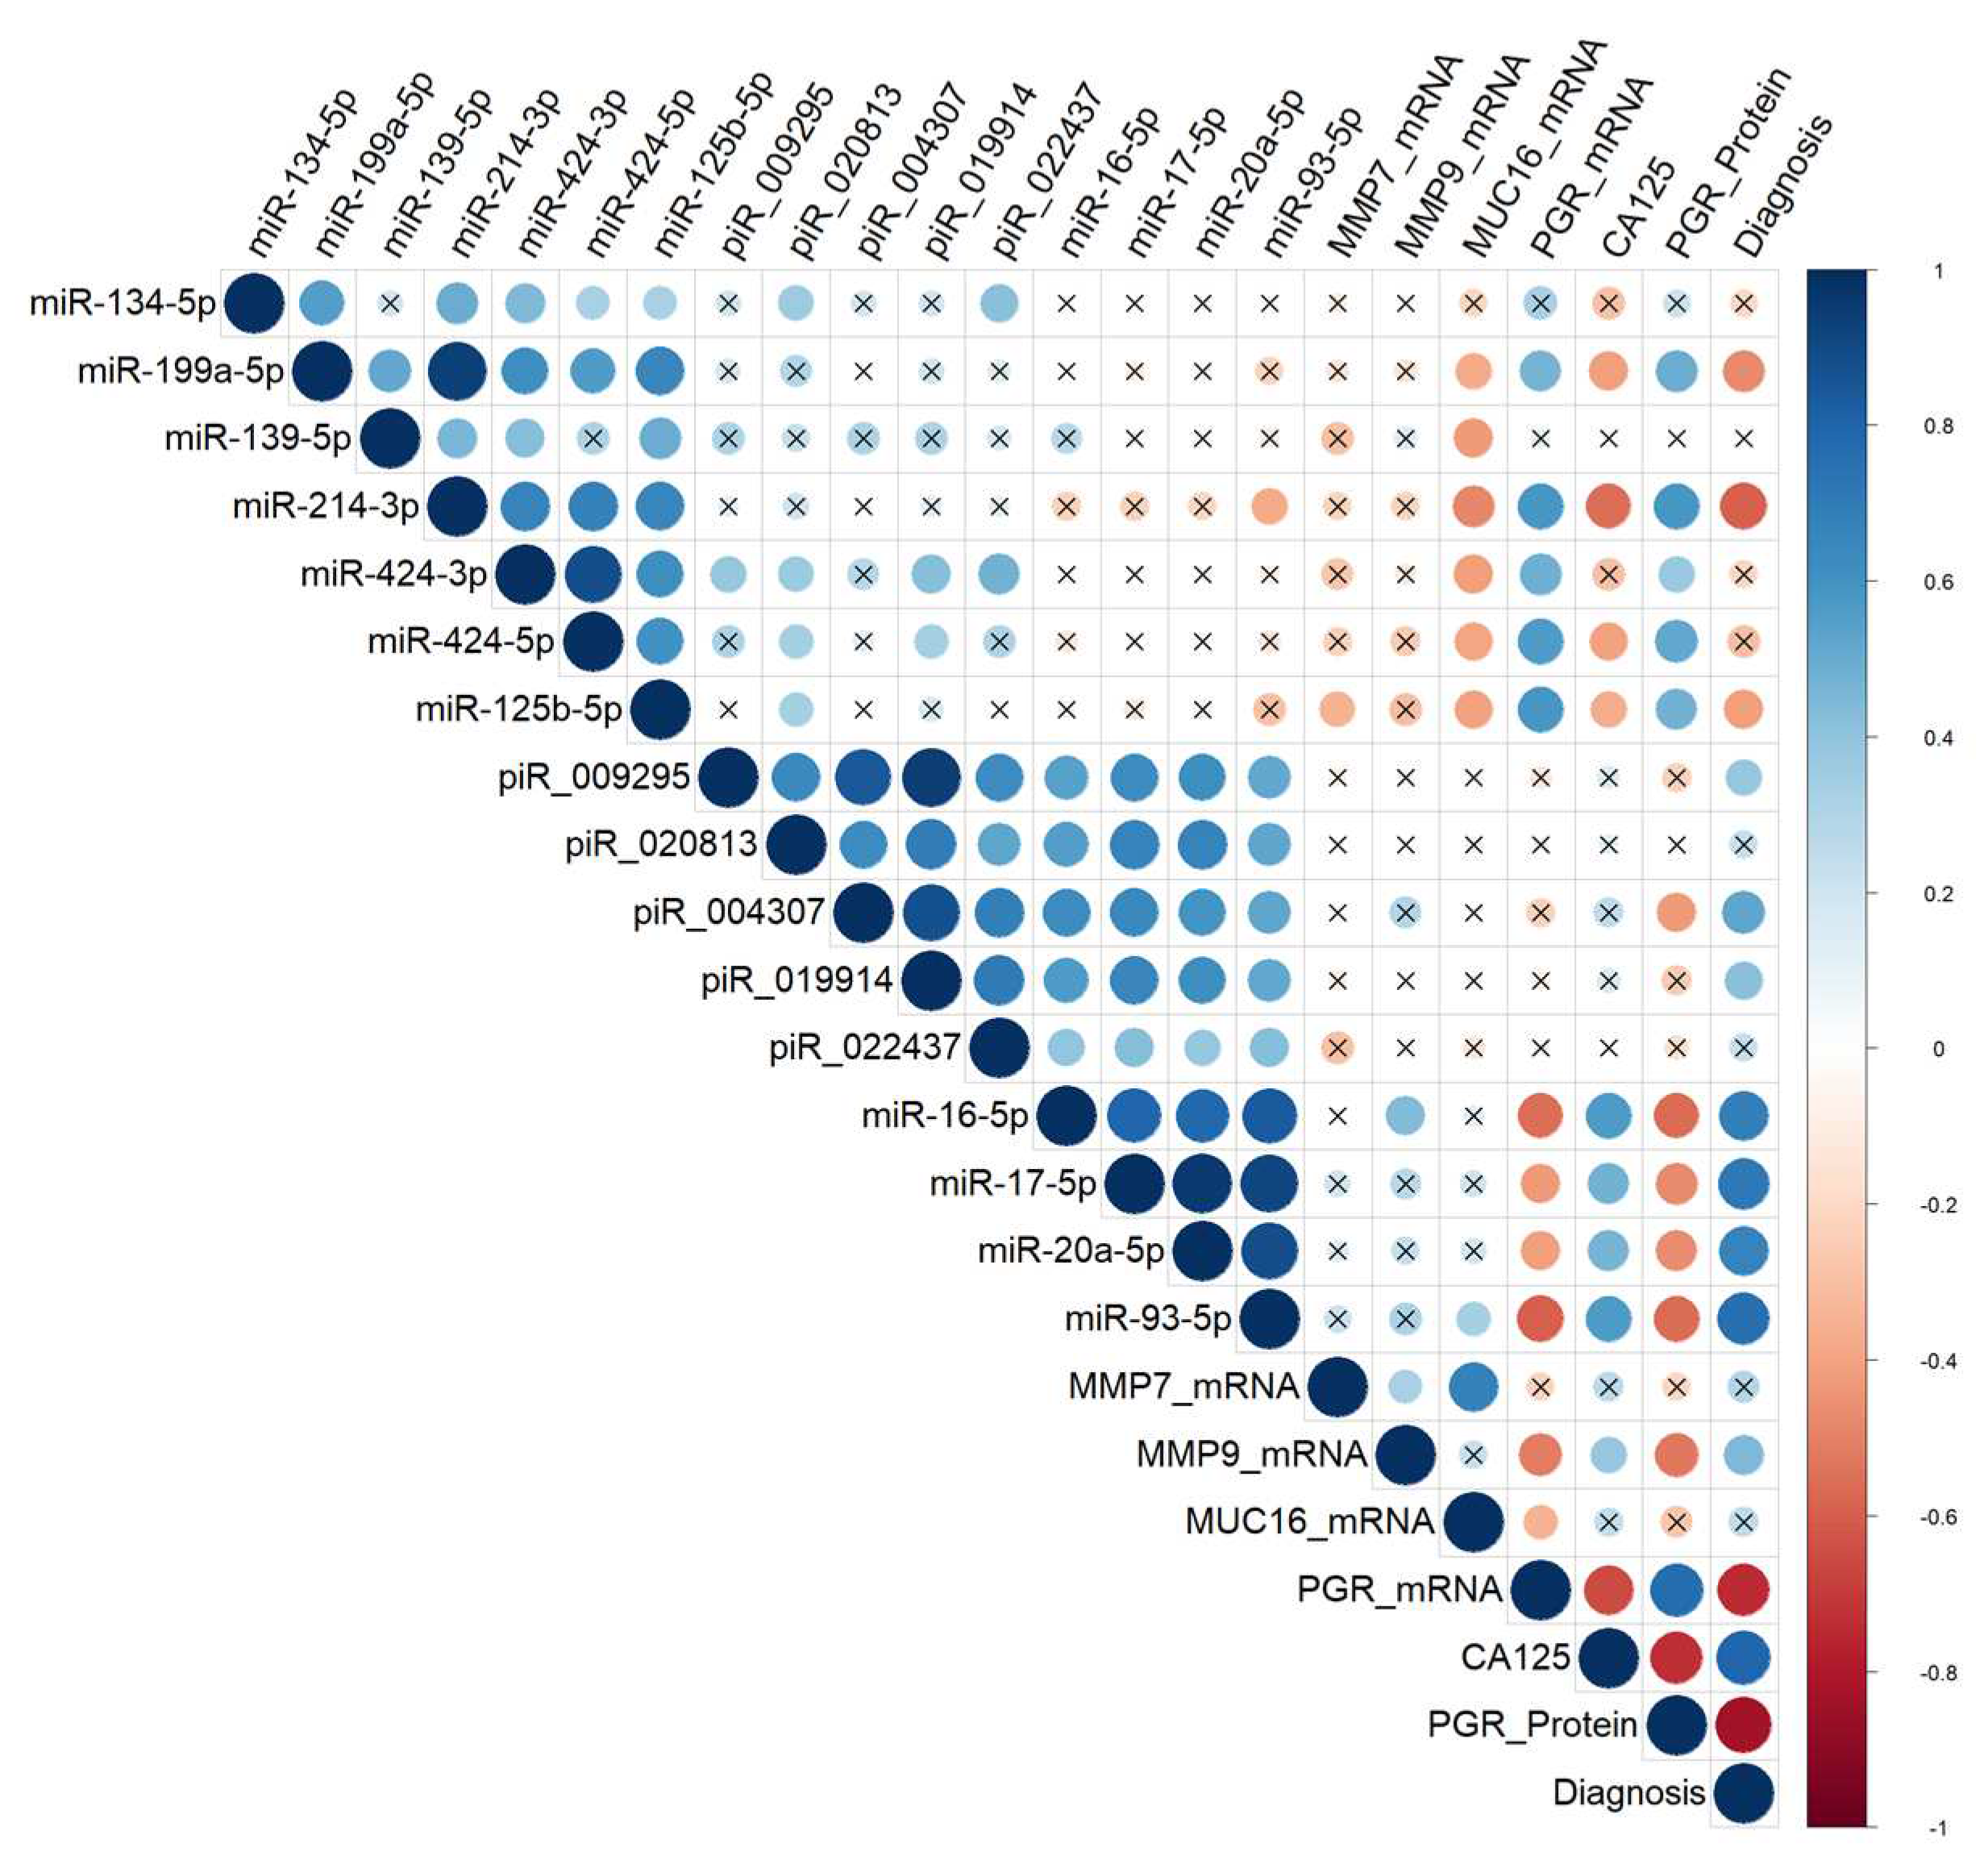
We found a significant inverse correlation between the PGR expression level in ovarian tumor tissues and the CA125 serum level, which in turn significantly inversely correlated with the expression level of its potential regulators miR-199a-5p, miR-214-3p, miR-424-3p, miR-424-5p, miR-125b-5p, whose target genes are MUC16 and/or MMP7 and/or MMP9 according to miRWalk database. It was found that the downregulation of miR-199a-5p expression might be implicated in ovarian cancer progression in connection with the revealed negative correlation with tumor infiltration, tumor size, lymphatic metastasis and TNM stage in ovarian cancer [
45]. Moreover, downregulated expression of miR-199a-5p was found in ascites-derived spheroids of the primary tumour site origin which form new metastatic niches due to high invasive capability [
46]. Mir-214-3p has a suppressive effect on CDK6 [
47] and on MAPK1 [
48], and mir-214-3p downregulation facilitates the cell-cycle progression, proliferation, migration, and invasion of ovarian cancer cells. miR-424-3p has a proven capability to sensitize ovarian cancer cells to cisplatin by decreasing the expression of an anti-apoptotic protein galectin-3; in the case of galectin-3 overexpression, chemoresistance occurs [
49]. In ovary cancer cells, miR-424/503 cluster is silenced by DNA hypermethylation, thereby canceling suppression of the expression of kinesin family member 23 by miR-424-5p and promoting cell proliferation and migration [
50]. It is important to note that kinesins play an important regulatory role in the formation of spindles, separation of chromosomes, and cytokinesis, and in case of abnormal expression/function of kinesins, daughter cells become aneuploidic, thereby resulting in tumorigenesis [
51]. In particular, elevated levels of KIF23 in ovarian, breast, lung cancer are associated with adverse outcomes [
52,
53,
54]. miR-125b-5p may be considered as a platinum chemoresistance marker in connection with its strong downregulation in the tumorspheres originated from the SKOV-3 platinum-resistant cell line [
55]. This relationship between chemoresistance and expression level of miR-125b-5p may be explained by direct targeting of BCL2 mRNA by miR-125b-5p thereby increasing the sensitivity of cancer cells to cisplatin treatment as it has been demonstrated for gallbladder cancer where low miR-125b-5p expression and high expression of Bcl2 was correlated with poor prognosis [
56].
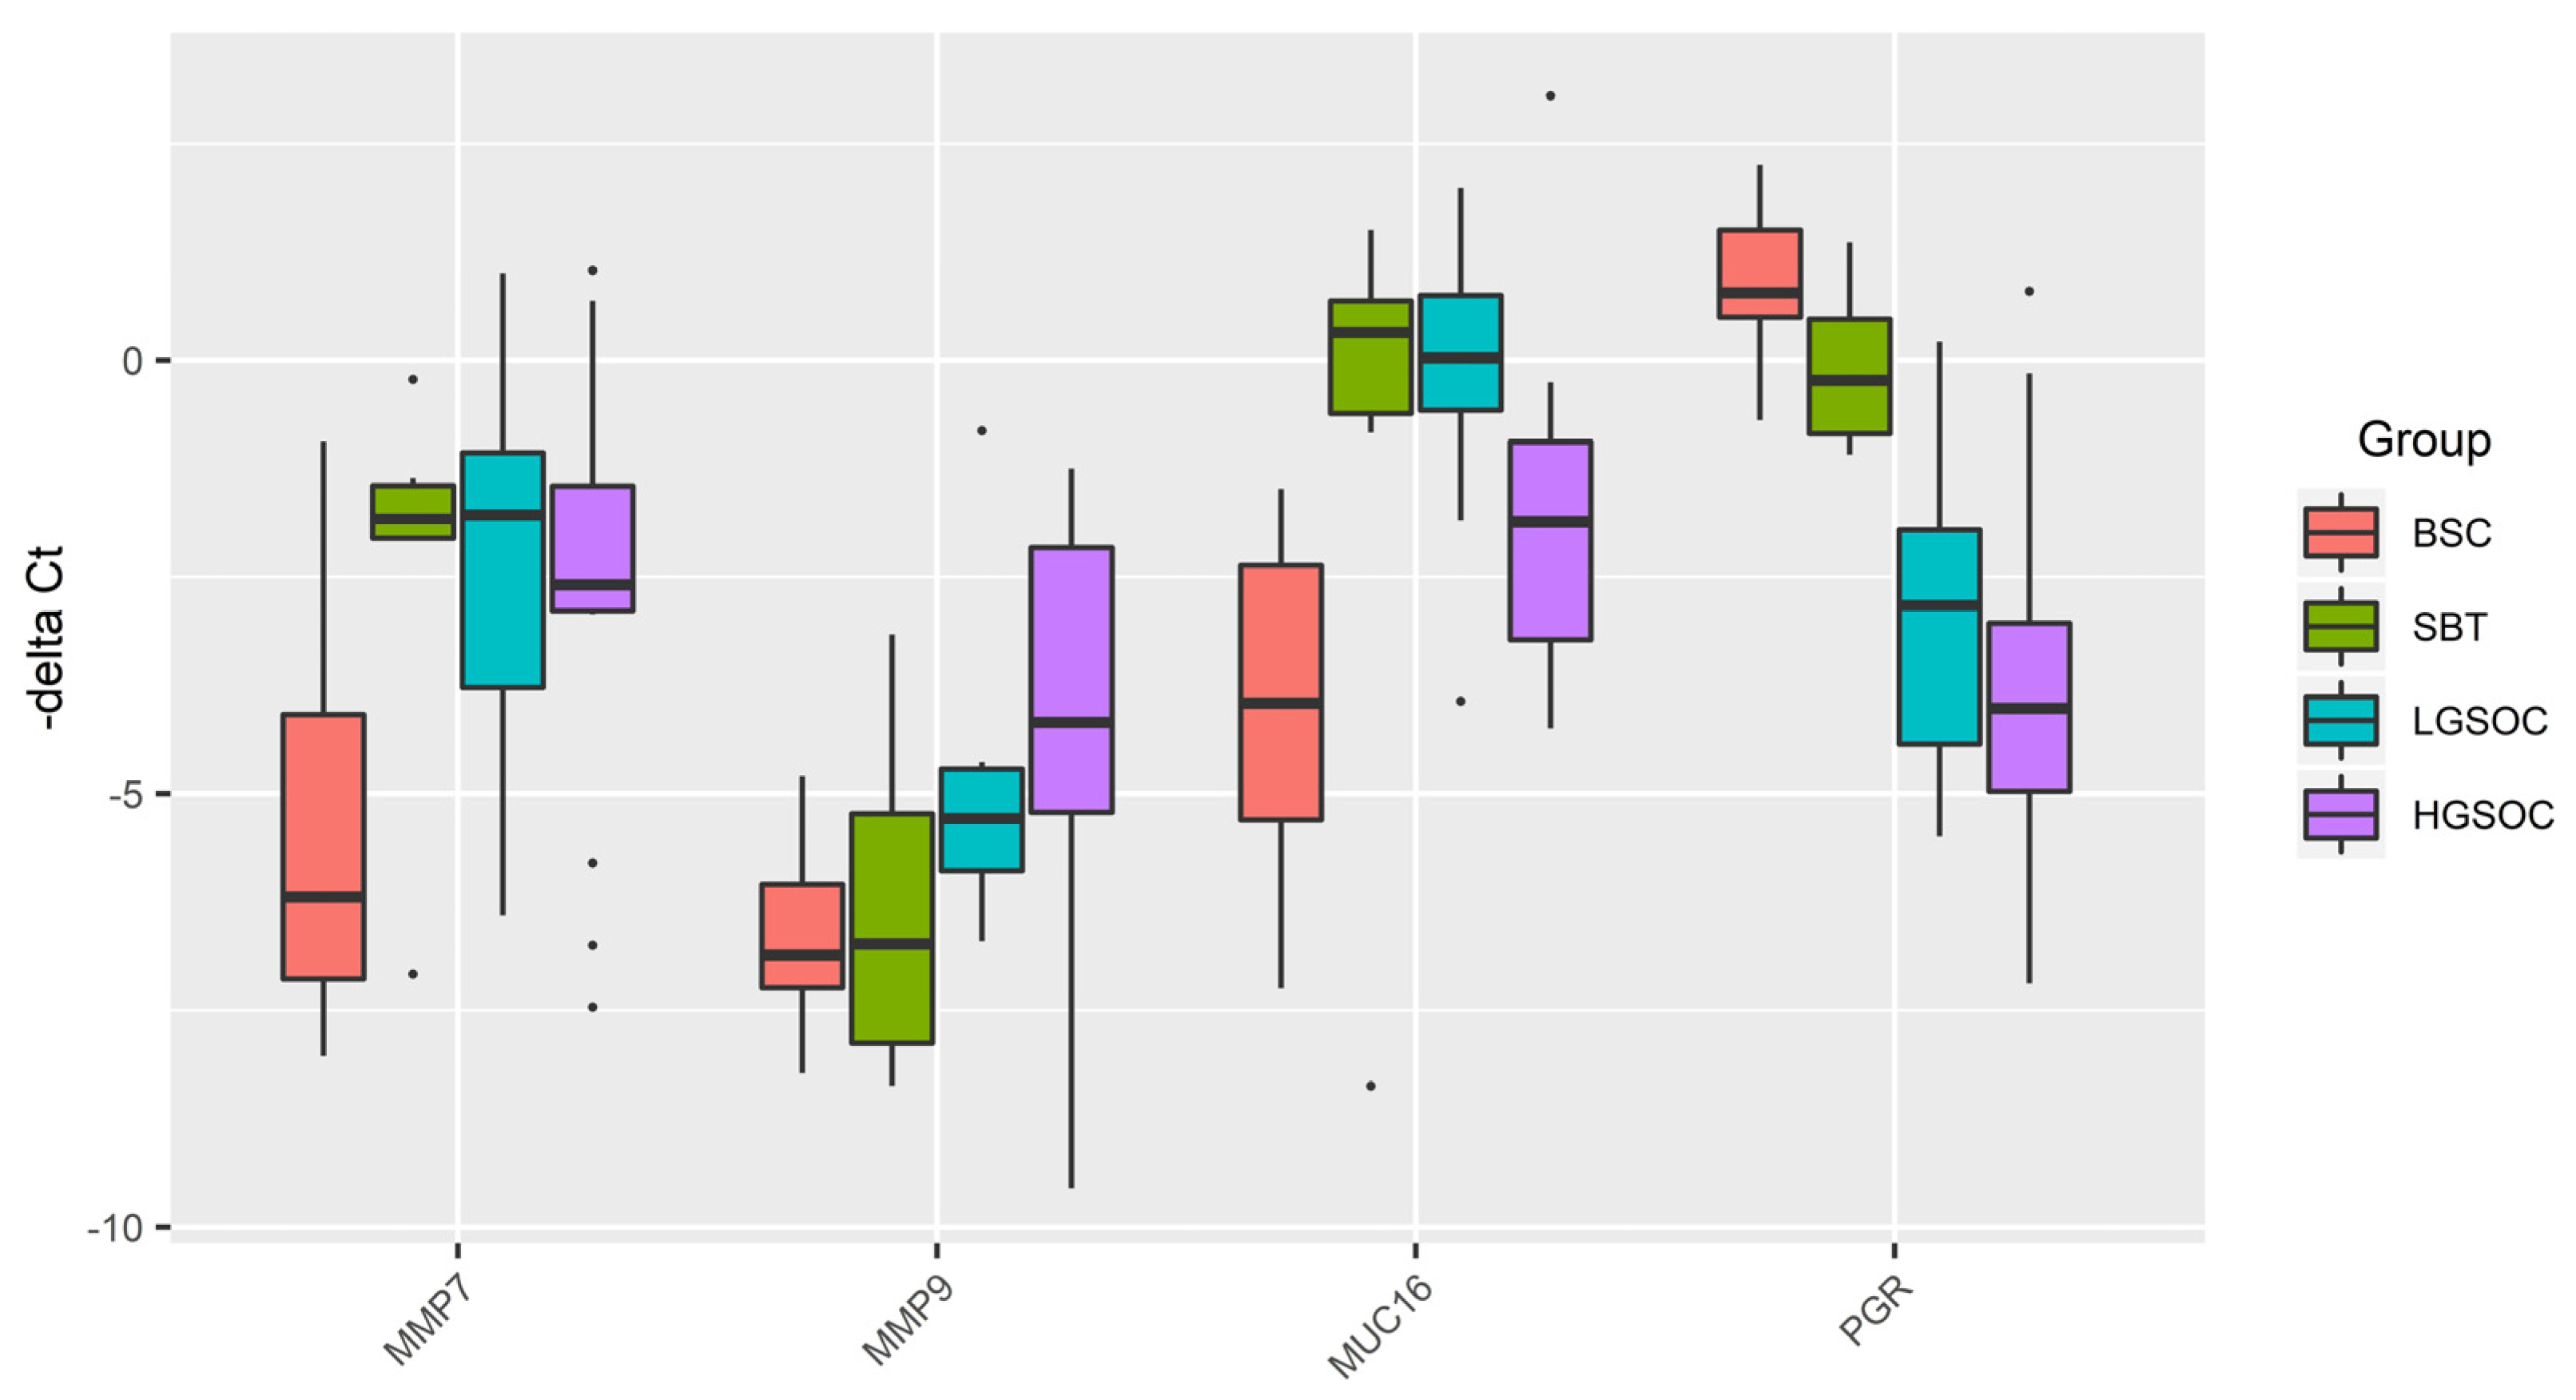
In the present study we found that MMP7 mRNA level was significantly directly correlated with the level of MUC16 mRNA and MMP9 mRNA, which, in turn, was inversely correlated with the level of PGR. We have found a direct correlation between the PGR and the miR-199a-5p, miR-214-3p, miR-424-3p, miR-424-5p, miR-125b-5p expression levels, and in the case of downregulation of these miRNAs in a PGR-negative serous tumor, the levels of MUC16, MMP7, and MMP9 can be increased, enhancing the ability of ovarian cancer cells to migrate, adhere to secondary sites and form metastasis [
27], and providing tumor chemoresistance as discussed above. The maintenance of MMP7 concentration at a high level may be due to the induction of MMP-7 expression via a p38 mitogen-activated protein kinase (MAPK)-dependent pathwayas the result of the interaction of the carboxy-terminal portion of the MUC16/CA125 protein and mesothelin present on mesothelial cells lining the peritoneum [
28,
29]. Because high mesothelin correlates with chemoresistance and poor survival in epithelial ovarian carcinoma [
57], several clinical trials are underway to evaluate the safety and efficacy of mesothelin-targeted drugs in platinum-resistant ovarian cancer [
58,
59].
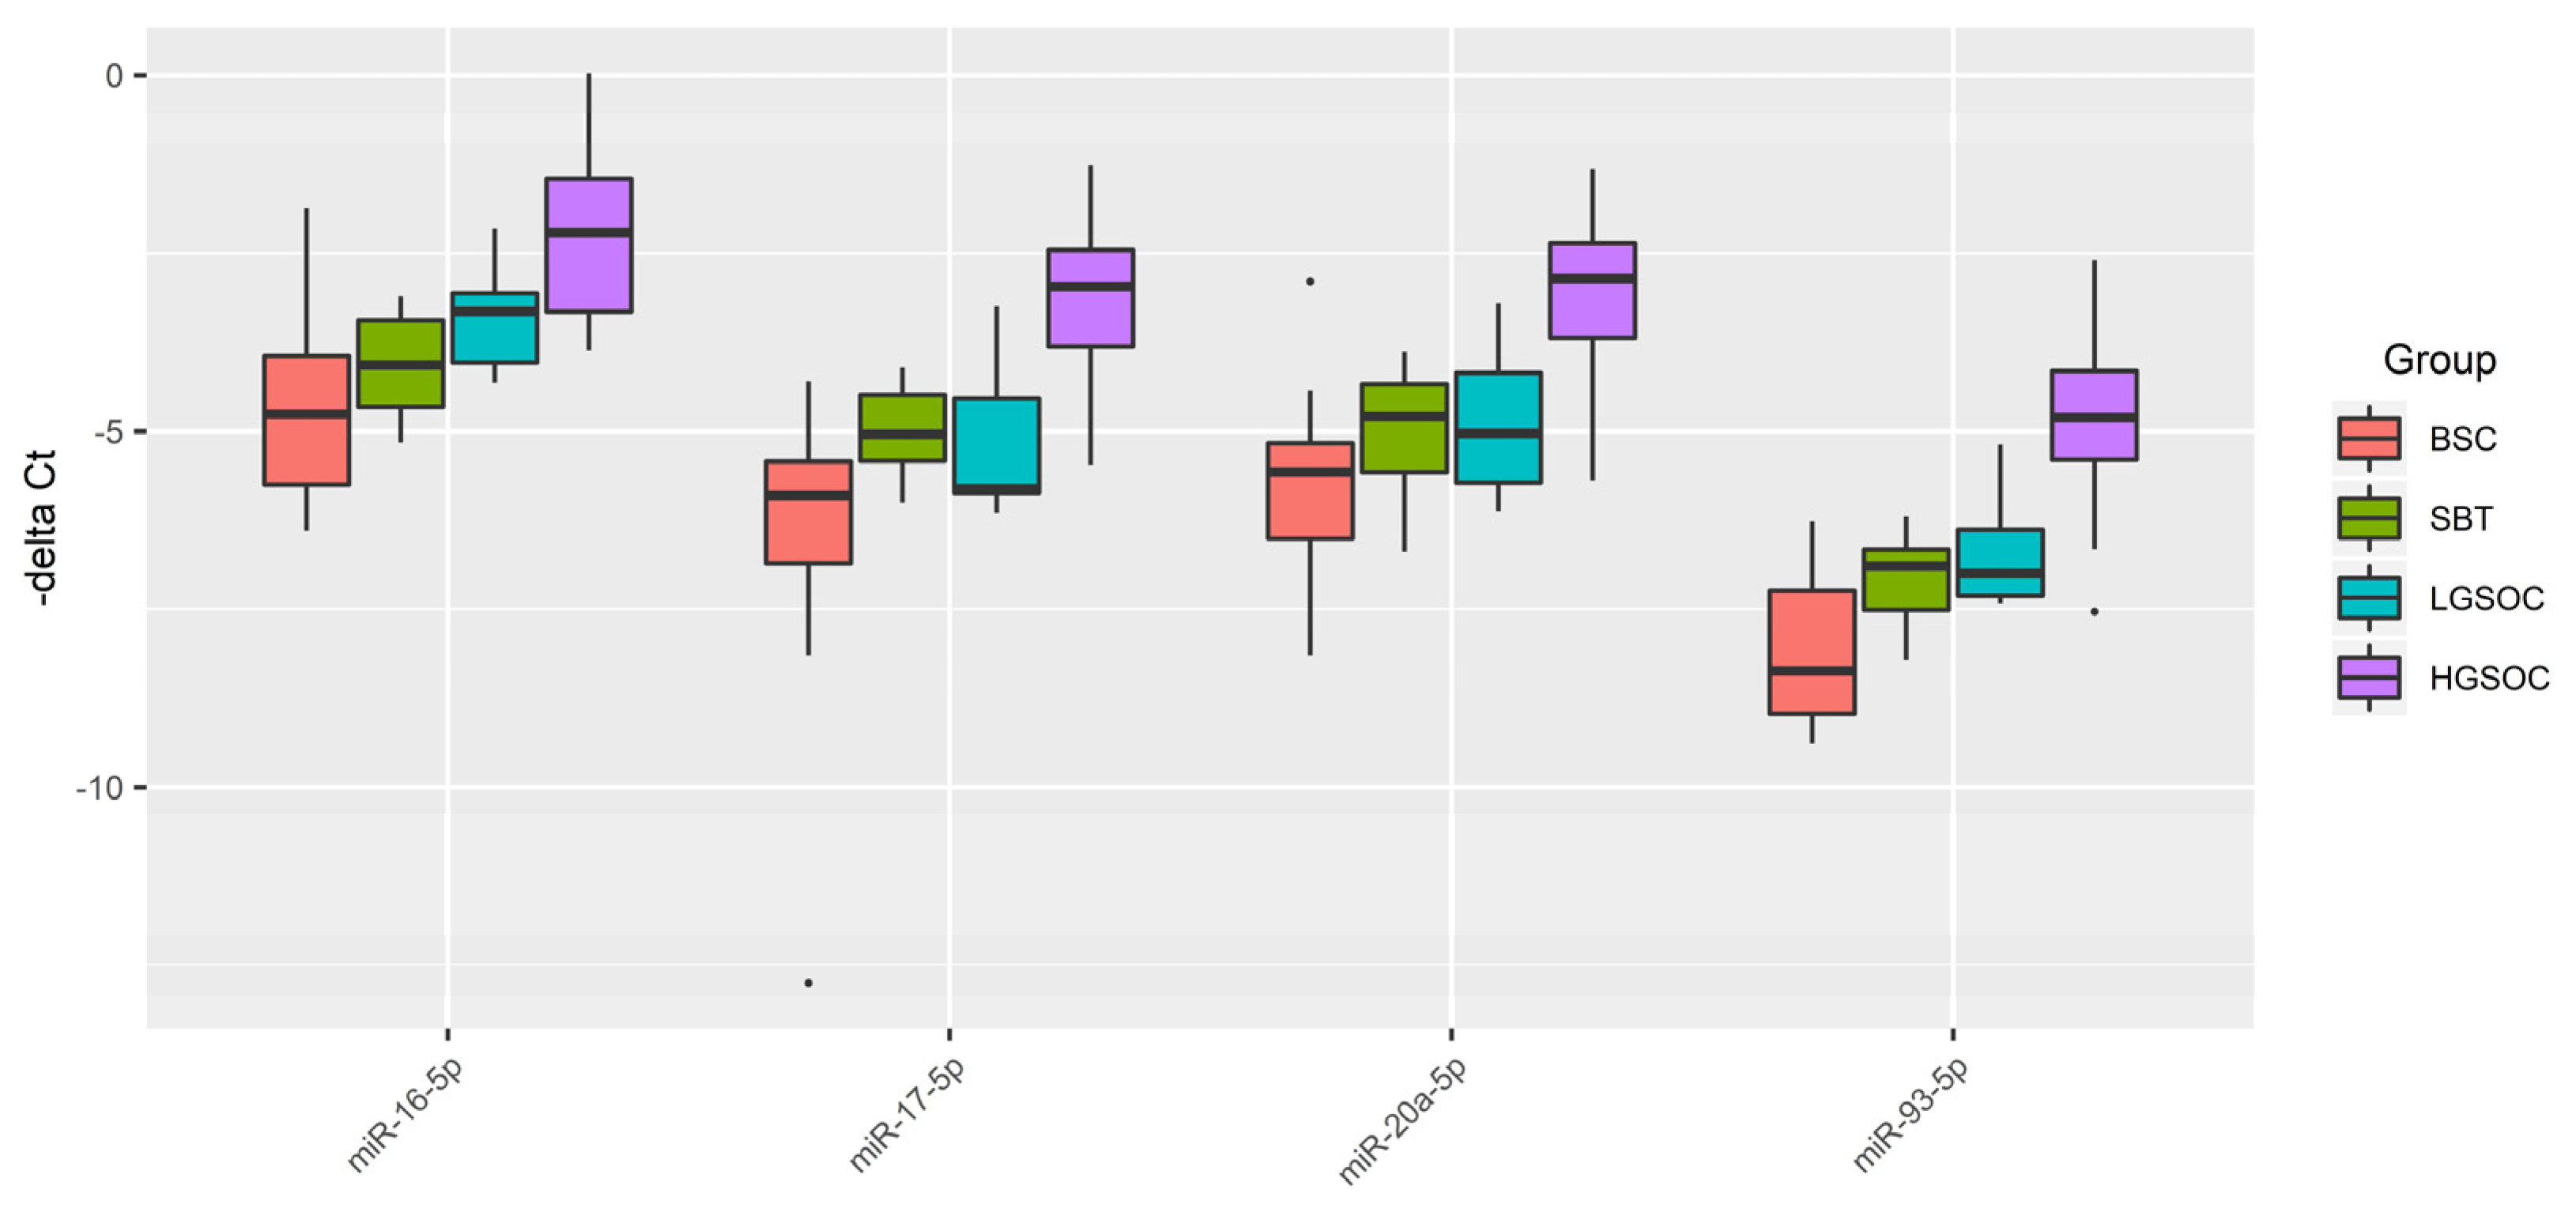
In the present study, the tissue content of miR-16-5p, miR-17-5p, miR-20a-5p, miR-93-5p, responsible for epithelial-mesenchymal transition (EMT) of the cell [
60,
61,
62,
63,
64], significantly directly correlated with the blood serum CA125 concentration and significantly inversely correlated with the PGR expression level in the tumor tissue. Found here increased levels of miR-20a-5p, miR-16-5p, miR-17-5p and miR-93-5p in tumor tissues and and peripheral blood from patients with HGSOC serous ovarian cancer are in good agreement with the literature data on the same direction of changes in the biological samples from patients with serous ovarian tumors [
16,
65,
66,
67,
68]. It should be noted that a sharp significant decrease in the level of PGR mRNA was found in the present study in the LGSOC and HGSOC group, with a more pronounced drop in the case of the latter. This observation, along with a significant increase in the expression level of miR-20a-5p, miR-16-5p, miR-17-5p and miR-93-5p in the HGSOC group, probably indicates the most aggressive carcinoma phenotype among other types of serous tumors.
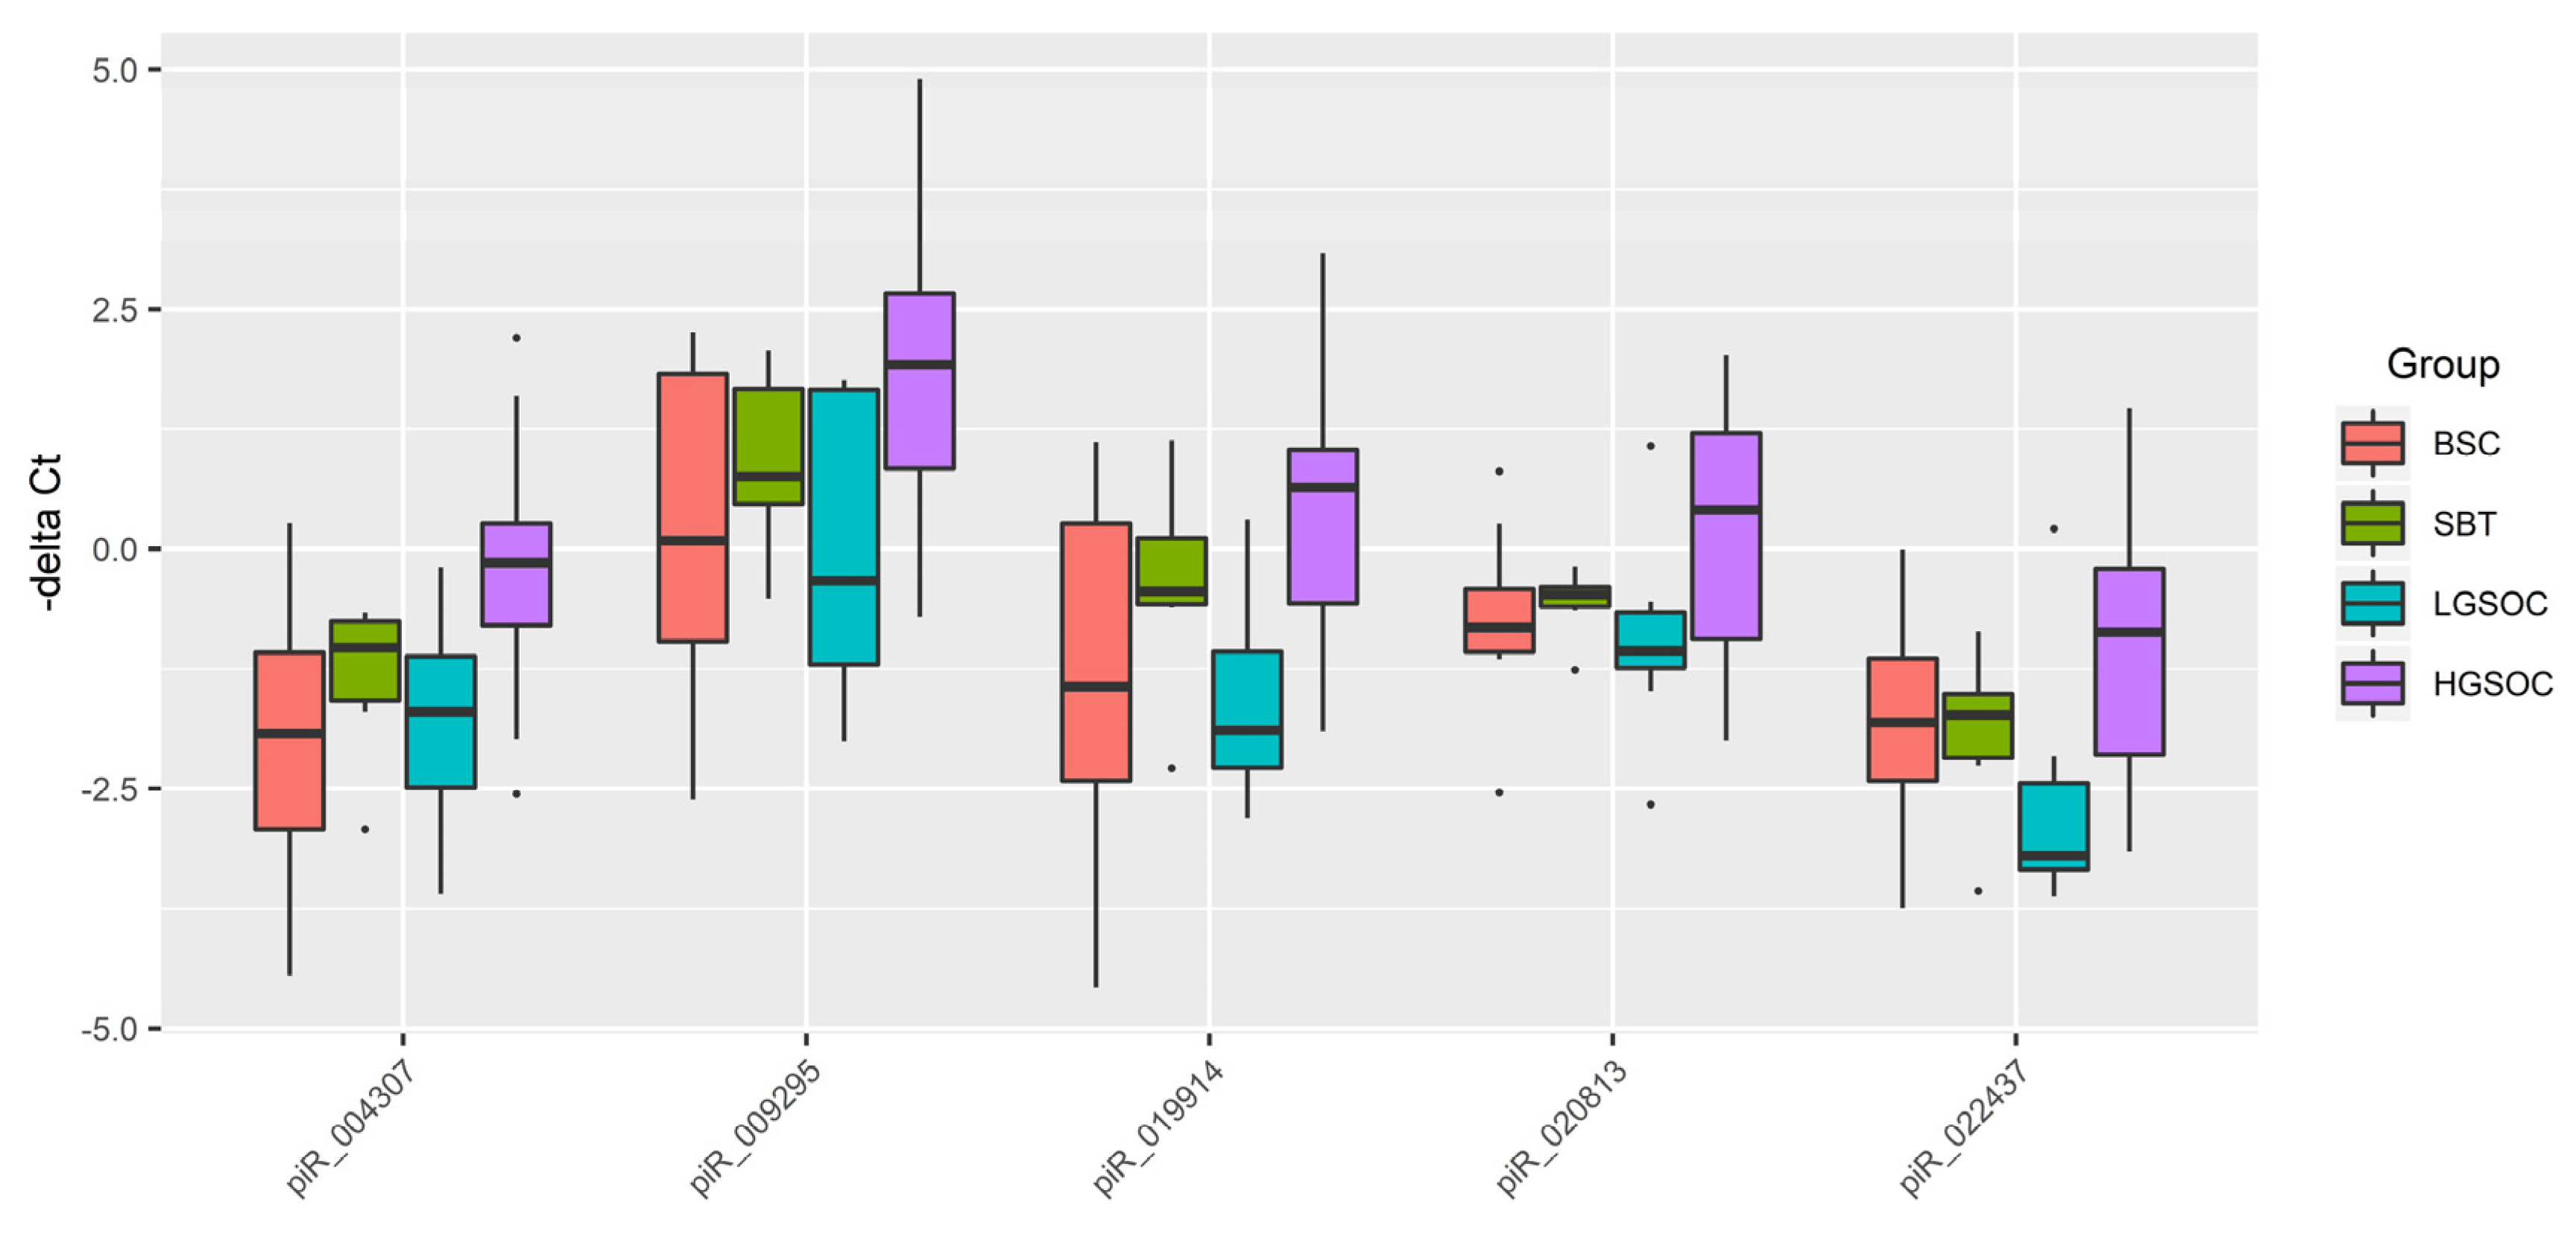
Levels of the EMT-associated miRNAs significantly directly correlated with the content of hsa_piR_022437, hsa_piR_009295, hsa_piR_020813, hsa_piR_004307, hsa_piR_019914 in serous ovarian tumor tissues. Among them, expression level of hsa_piR_004307 significantly inversly correlated with the PGR expression level in the tumor. One of the functions of piRNA is to regulate the stability of the cell genome by interacting in the nucleus with the retrotransposon transcript as part of the RISC complex, which contacts with histone deacetylase and methyltransferase, and DNA methyltransferase, which block further transcription of the retrotransposon, thereby preventing its activity and integration into different parts of the genome [
30]. In addition to the suppressor activity of piRNAs against transposons, their regulatory effects on various signaling pathways in the cell through both destabilization of the target mRNA and inhibition of translation or stabilization of the target mRNA and activation of translation are also known to exist [
30,
31,
69,
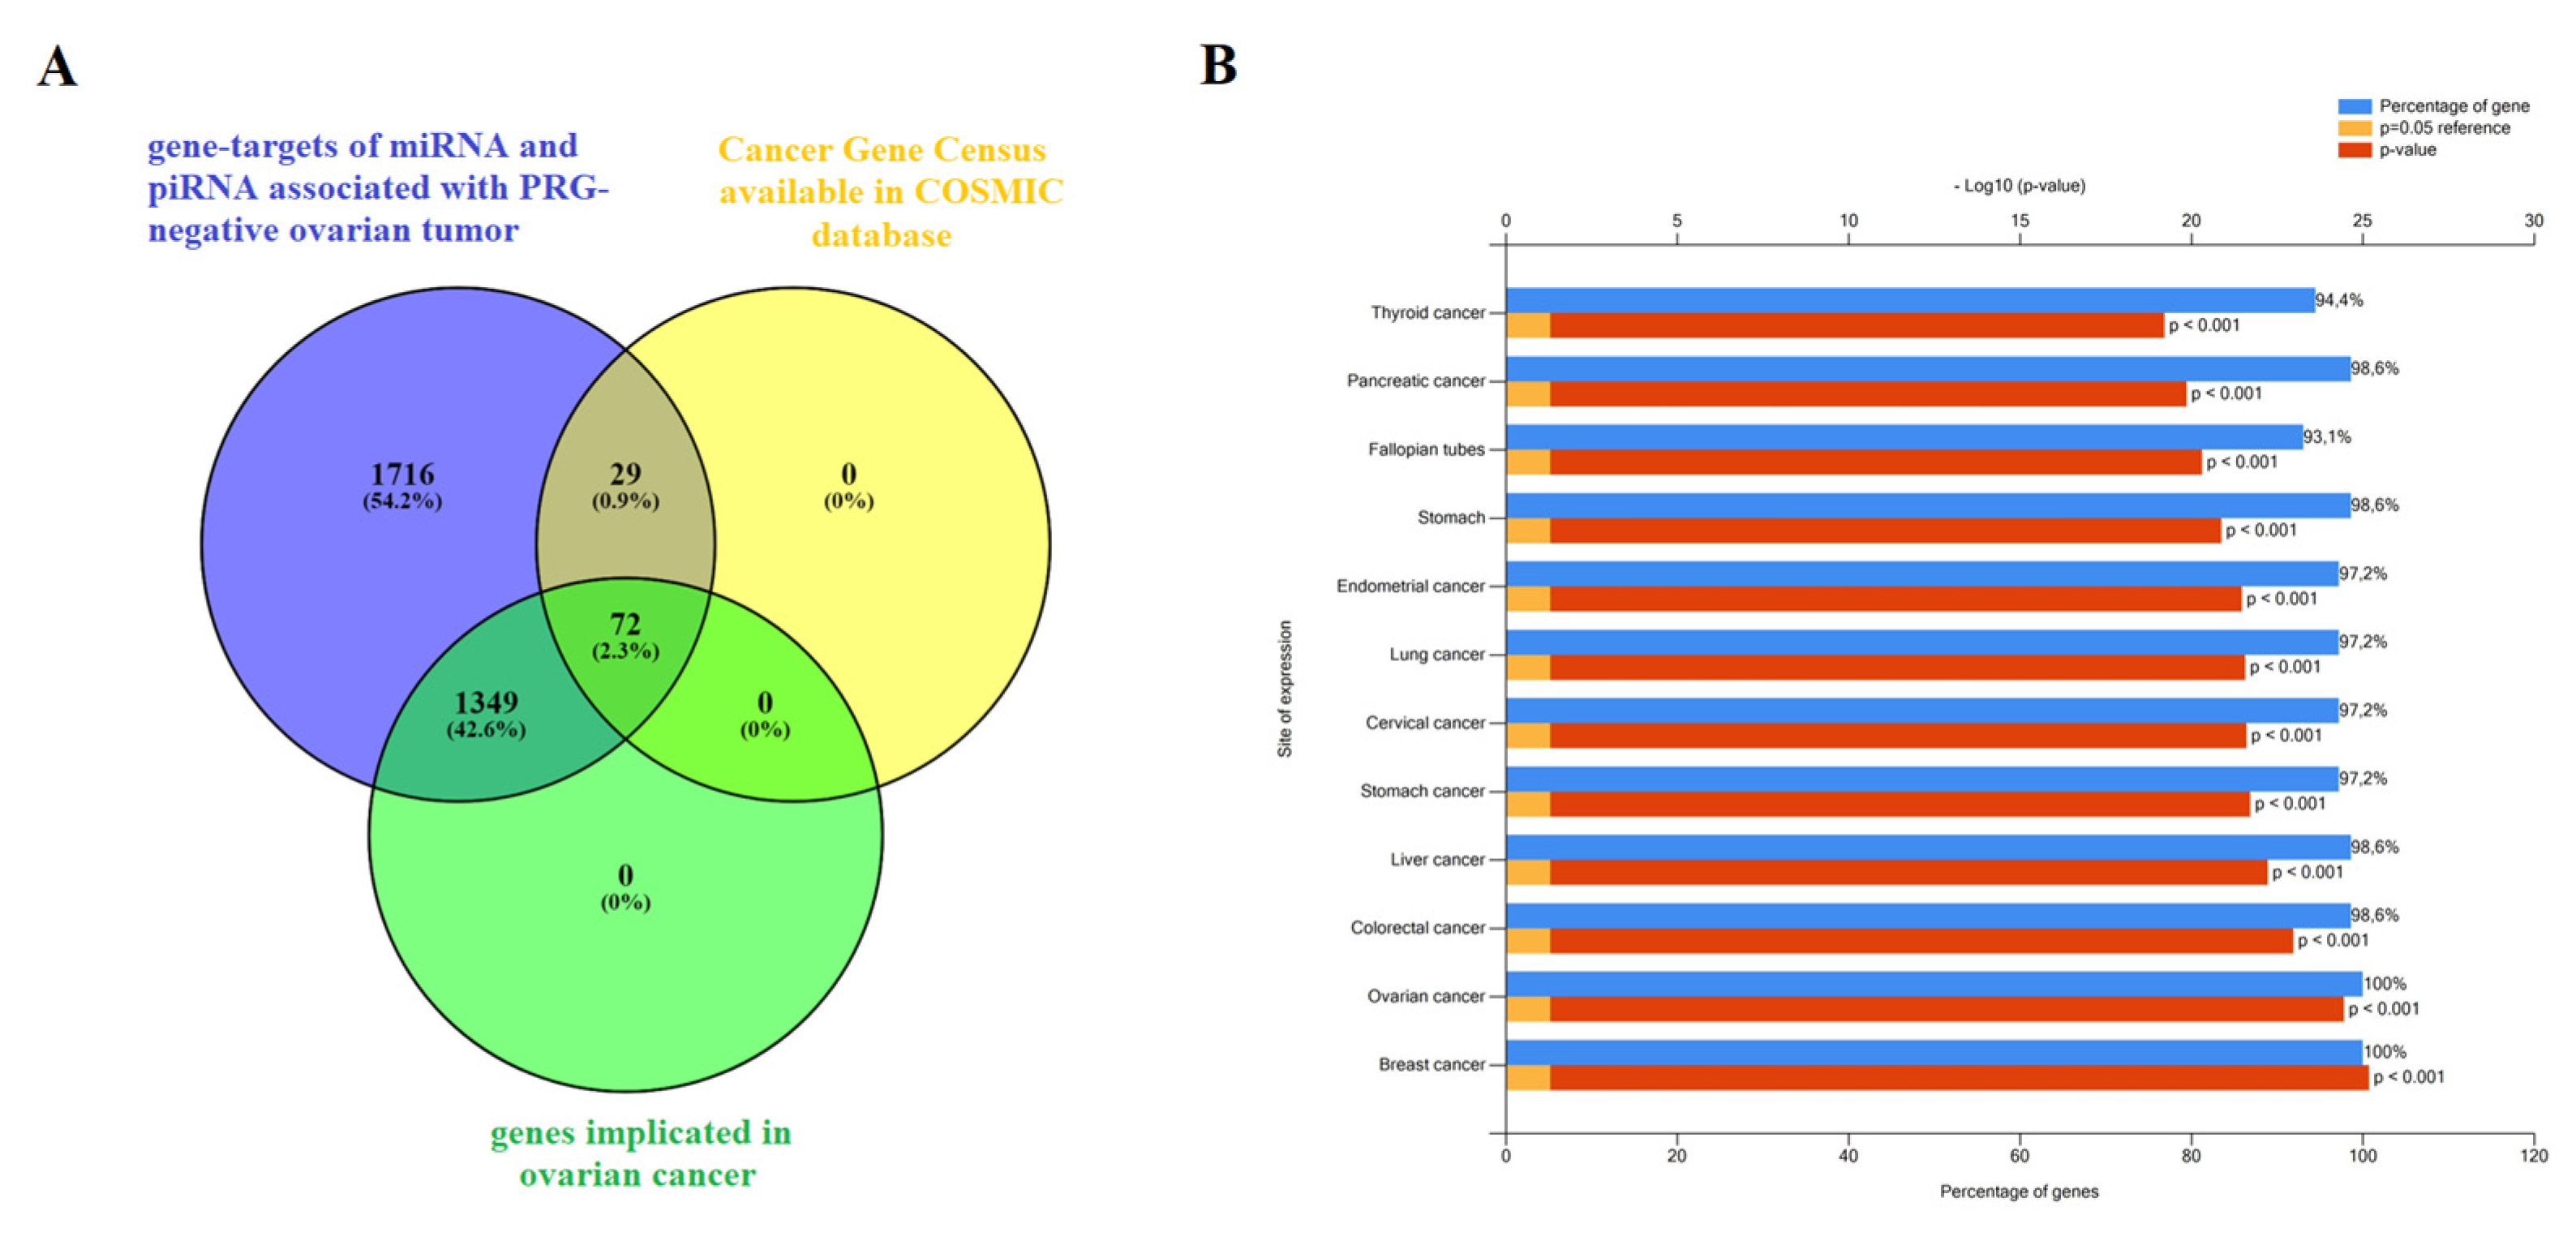
70]. When analyzing potential target genes of hsa_piR_022437, hsa_piR_009295, hsa_piR_020813, hsa_piR_004307, hsa_piR_019914 and two miRNAs, miR-16-5p and miR-93-5p, involved in the identification of PGR-negative serous ovarian tumors by logistic regression method, the participation of 72 genes in pathogenesis of ovarian, breast, colorectal, liver, stomach, cervical, lung, endometrial, pancreatic, and thyroid cancers was proved, including the occurrence of mutations in these genes according to the Cancer Gene Census. Perhaps there are common pathogenetic mechanisms of epithelial cancers by altering the functional activity of this group of genes, in particular, under the action of miRNAs and piRNAs, used as prognostic parameters in developed logistic regression models.
The genome sequences, coding certain piRNA classes, are located within protein-coding genes, and functional piRNA molecules are mainly produced from the 3'-untranslated regions (3'-UTRs) of mRNA during their translation [
71]. In addition, mRNAs 3'-UTR, producing piRNAs, usually contain transposon sequences whose activity is controlled by these piRNAs at the post-transcriptional level [
72]. It is important to note that some piRNAs associated with the PGR-negative tumor phenotype are located in the loci of protein-coding genes and/or transposon, namely: the hsa_piR_022437 DNA sequence is related to retrotransposon SINE and located in the SUN1 gene involved in directed cell migration [
73], and hsa_piR_009295 DNA sequence is located in the centrosome linker protein rootlein (encoding for CROCC gene with alternative name – TAX1BP2), whose overexpression inhibites centrosome duplication, whereas depletion results in centrosome hyperamplification [
74] that is linked to oncogenesis [
75,
76]. Centrosome aberrations may induce the dissemination of metastatic cells and contribute to aggressive cancer subtypes [
77].
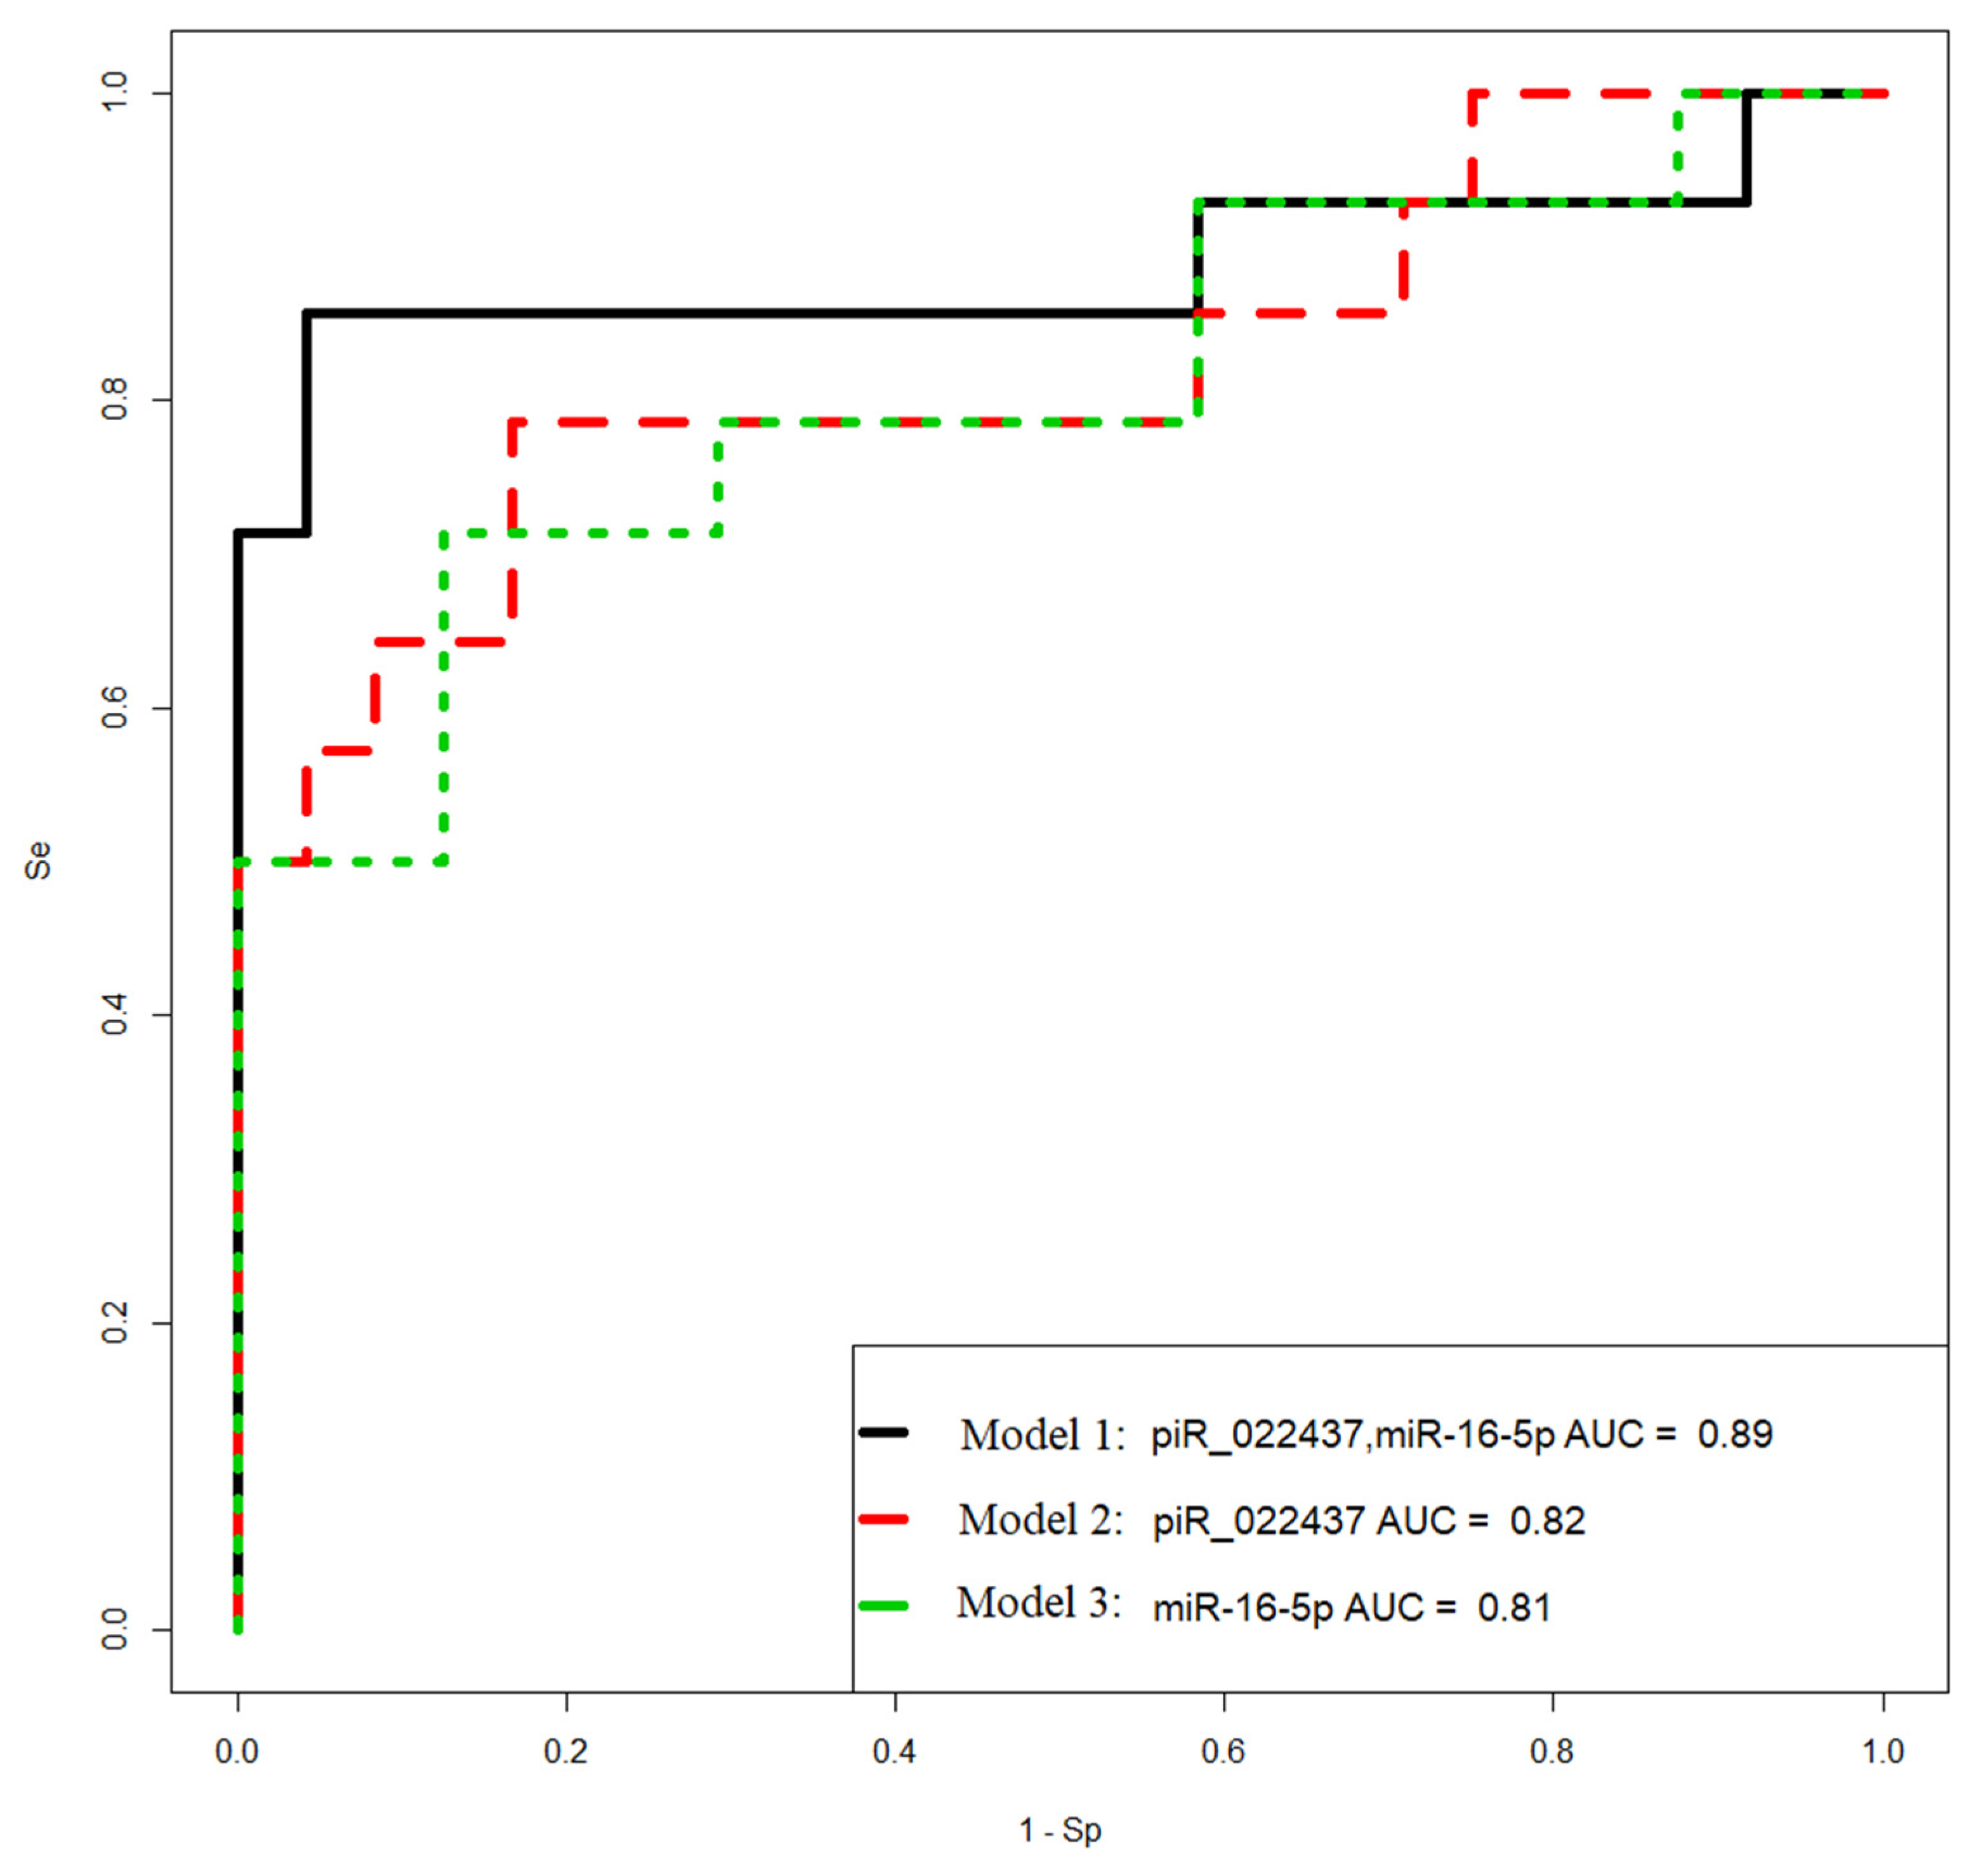
After examining the tumor response to adjuvant chemotherapy, we found that in PGR-negative LGSOC and HGSOC, there was disease stabilization/progression in 75% and 100% cases, respectively. Thus, a substantial proportion of patients with primary PGR-negative LGSOC and HGSOC were resistant to platinum-based treatment that requires novel therapeutic and preventive approaches. In the present research, we developed non-invasive method based on regression analysis of hsa_piR_022437 и miR-16-5p content in the blood plasma from patients which can be used to diagnose PGR-negative tumor phenotype with 86% sensitivity before surgery and chemotherapy to choose the treatment strategy for this most aggressive type of ovarian cancer. Recently, a trial to investigate the effect of the addition of hyperthermic intraperitoneal chemotherapy (HIPEC) to interval cytoreductive surgery was conducted among patients with stage III epithelial ovarian cancer who were receiving neoadjuvant chemotherapy, and this procedure resulted in longer recurrence-free survival and overall survival than surgery alone [
78]. It may be so that besides administration of HIPEC with cisplatin it is necessary to add targeted therapy aimed at depletion of PGRMC1, decreased mesothelin expression and Th2 infiltration to increase the effectiveness of treatment and longevity of the patient with highly aggressive serous ovarian tumor as PGR-negative type.
4. Materials and Methods
4.1. Patients enrolled in the study
38 women enrolled in the study aged between 29 and 71-years-old with primary ovarian tumors were referred to the National Medical Research Center for Obstetrics, Gynecology, and Perinatology, named after Academician V.I. Kulakov of the Ministry of Healthcare of the Russian Federation for clinical and instrumental additional examination and surgical intervention in the volume depending on the stage of the disease, which was histologically verified according to FIGO. After adjuvant chemotherapy (carboplatin AUC 6 + paclitaxel 175 mg/m2), tumor response was evaluated according to the RECIST 1.1 criteria. The following groups were formed: benign serous cystadenoma, n = 10; borderline serous cystadenoma, n = 6; low-grade serous ovary cancer, n = 8; high-grade serous ovary cancer, n = 14.
4.2. RNA Isolation from Peripheral Blood Plasma
S-MONOVETTE tubes containing EDTA KE (Sarstedt AG&Co., Ltd., Nümbrecht, Germany, cat. No. 04.1915.100) were used to sample venous blood from patients entrolled in the study. 200 µL of blood plasma collected after two-step centrifugation for 20 min at 300× g (4 °C) and for 10 min at 16,000× g, were used for RNA extraction applying an miRNeasy Serum/Plasma Kit (Qiagen, Germany, cat. No. 217184).
4.3. RNA isolation from ovarian tumors
Ovarian tumor samples were collected during surgery and immediately frozen in liquid nitrogen or embedded in paraffin blocks after fixation with neutral formalin, for subsequent total RNA extraction in the former case using the miRNeasy Micro Kit (Qiagen, Hilden, Germany, catalog No. 217084), followed by the RNeasy MinElute Cleanup Kit (Qiagen, Germany, catalog No. 74204) or in the latter case using deparaffinization solution (Qiagen, Hilden, Germany, catalog No.19093) and RNeasy FFPE Kit (Qiagen, Hilden, Germany, catalog No. 73504). Qubit fluorometer 3.0 (Life Technologies, Petaling Jaya, Malaysia, cat.Q33216) was used for RNA concentration measurement. Total RNA quality was examined on the Agilent Bioanalyzer 2100 (Agilent, Waldbronn, Germany, cat. No G2939A) using the RNA 6000 Nano Kit (Agilent Technologies, Santa Clara, CA, USA, cat. No. 5067-1511).
4.4. Small RNA Deep Sequencing
500 ng of total RNA from frozen tumor tissues were used for cDNA libraries synthesis applying the NEBNext® Multiplex Small RNA Library Prep Set for Illumina® (Set11 and Set2, New England Biolab®, Frankfurt am Main, Germany, cat. No. E7300S, E7580S). After amplification for 14 PCR cycles and purification in the 6% polyacrylamide gel, cDNA libraries were sequenced on the NextSeq 500 platform (Illumina, San Diego, AC, USA, cat. No. SY-415-1001). Deep sequencing data were processed as described in our previous publication [
37], using Cutadapt to remove adapters, bowtie aligner [
79] to map all trimmed reads in the range of 16 bp - 50 bp to the GRCh38.p15 human genomes, miRBase v21, and piRNABase, featureCount tool from the Subread package [
80] to count aligned reads, and the DESeq2 package [
81] to carry out differential expression analysis of the sncRNA.
4.5. Reverse Transcription and Quantitative Real-Time PCR of small noncoding RNA
Seven microliters of total RNA obtained in 4.2. or 250 ng of total RNA from FFPE samples obtained in 4.3. were converted into cDNA in accordance with the miScript® II RT Kit protocol (Qiagen, Germany, cat. No. 218161). After completion of the reaction and dilution of the sample by 20 times, cDNA (2 µL) was amplified during real-time PCR using a forward primer specific for the studied RNA (
Table S5) and the miScript SYBR Green PCR Kit (Qiagen, Germany, cat. No. 218075). The following PCR conditions for miRNA and piRNA amplification were used: (1) 15 min at 95 °C and (2) 40 cycles at 94 °C for 15 s, an optimized annealing temperature (46.2–62 °C) for 30 s and 70 °C at 30 s in a StepOnePlusTM thermocycler (Applied Biosystems, Waltham, MA, USA, cat. No. 4376600). miR-30d-5p was used as the reference RNA to quantify miRNA and hsa_piR_004308 was used as the reference RNA to quantify piRNA in the blood plasma sample by the ∆Ct method. The relative expression of miRNA and piRNA in the FFPE ovarian tumor sections was determined by the ∆Ct method using SNORD68 as the reference RNA.
4.6. Reverse Transcription and Quantitative Real-Time PCR of mRNA
125 ng of total RNA from FFPE ovarian tumor sections, were converted into cDNA in a reaction mixture (25 µL) containing 10 µM random hexameric primer (Evrogen, Russia), 1x M-MLV RT buffer (M531A, Promega), 1x dNTP mix (0.2 mM each, Evrogen, Russia), 200 U M-MLV reverse transcriptase (M1708, Promega) at 37 ℃ over 60 min, followed by incubation at 95 ℃ over 10 min; then, the sample volume was adjusted with deionized water to 100 µL. The synthesized cDNA (2 µL) was used as a template for real-time PCR in a reaction mixture (20 µL) containing 150 nM each of the forward and reverse primers specific for the studied mRNA (
Table S5) in a 1x qPCRmix-HS SYBR+HighROX (Evrogen, Russia). The following PCR conditions were used: (1) 5 min at 95 °C and (2) 40 cycles at 95 °C for 20 s, an optimized annealing temperature (48.9 – 63.8 °C) for 20 s and 72 °C at 30 s in a CFX96 Real-Time System (C1000 Touch Thermal Cycler plus CFX96 Optics Module, BioRad, Singapore). The relative expression of mRNA was determined by the ∆Ct method using geometric mean of ACTB, TUBA, GAPDH as the reference RNAs.
4.7. Immunohistochemistry
PGR immunohistochemical staining of formalin-fixed paraffin-embedded specimens of serous ovarian tumors was performed as described in our previous publication [
16] according to the Allred scale [
82].
4.8. Statistical Analysis of the Obtained Data
Scripts written in R language [
80] and RStudio [
83] were used for statistical processing as described in our previous publication [
16] applying Shapiro–Wilk test, the Mann–Whitney test for paired comparison, Spearman’s nonparametric correlation test, logistic regression analysis. Study results were considered reliable if the value of statistical significance (p) was less than 0.05.
Author Contributions
Conceptualization, A.V.Ti., I.S.F and O.A.M.; methodology, A.V.Ti., I.S.F., A.V.A, and A.V.Tr.; software, I.S.F., validation, A.V.Ti., I.S.F. and A.V.A; investigation, A.V.Ti., I.S.F., A.V.A, and A.V.Tr; resources, G.N.K. and A.V.A.; data curation, M.V.S. and G.N.K.; writing—original draft preparation, A.V.Ti..; writing—review and editing, I.S.F.; visualization, I.S.F; supervision, G.T.S.; project administration, V.E.F.; funding acquisition, V.E.F. All authors have read and agreed to the published version of the manuscript.
Figure 1.
Box-plot of the expression level of miRNAs potentially regulating the level of CA-125 in serous ovarian tumors.
Figure 1.
Box-plot of the expression level of miRNAs potentially regulating the level of CA-125 in serous ovarian tumors.
Figure 2.
Box-plot of MMP7, MMP9, MUC16, and PGR mRNA expression level in serous ovarian tumors.
Figure 2.
Box-plot of MMP7, MMP9, MUC16, and PGR mRNA expression level in serous ovarian tumors.
Figure 3.
Box-plot of the expression level of miRNAs potentially regulating EMT in the serous ovarian tumors.
Figure 3.
Box-plot of the expression level of miRNAs potentially regulating EMT in the serous ovarian tumors.
Figure 4.
Box plot of piRNA expression level in FFPE sections of serous ovarian tumors.
Figure 4.
Box plot of piRNA expression level in FFPE sections of serous ovarian tumors.
Figure 5.
Correlation analysis of the miRNA, piRNA, mRNA expression levels, PGR protein level in 38 FFPE-samples of serous tumors and corresponding patient’s blood serum CA125 level. Dot means significant correlations (p < 0.05), cross means non-significant correlations, among which direct correlations are highlighted in blue, and inverse correlations are highlighted in red. The larger the size of the dot, the more significant the correlation. The analyzed samples were ranged, according to the diagnosis (type of the serous tumor) in the following way: “BSC” < “SBT” < “LGSOC” < “HGSOC”.
Figure 6.
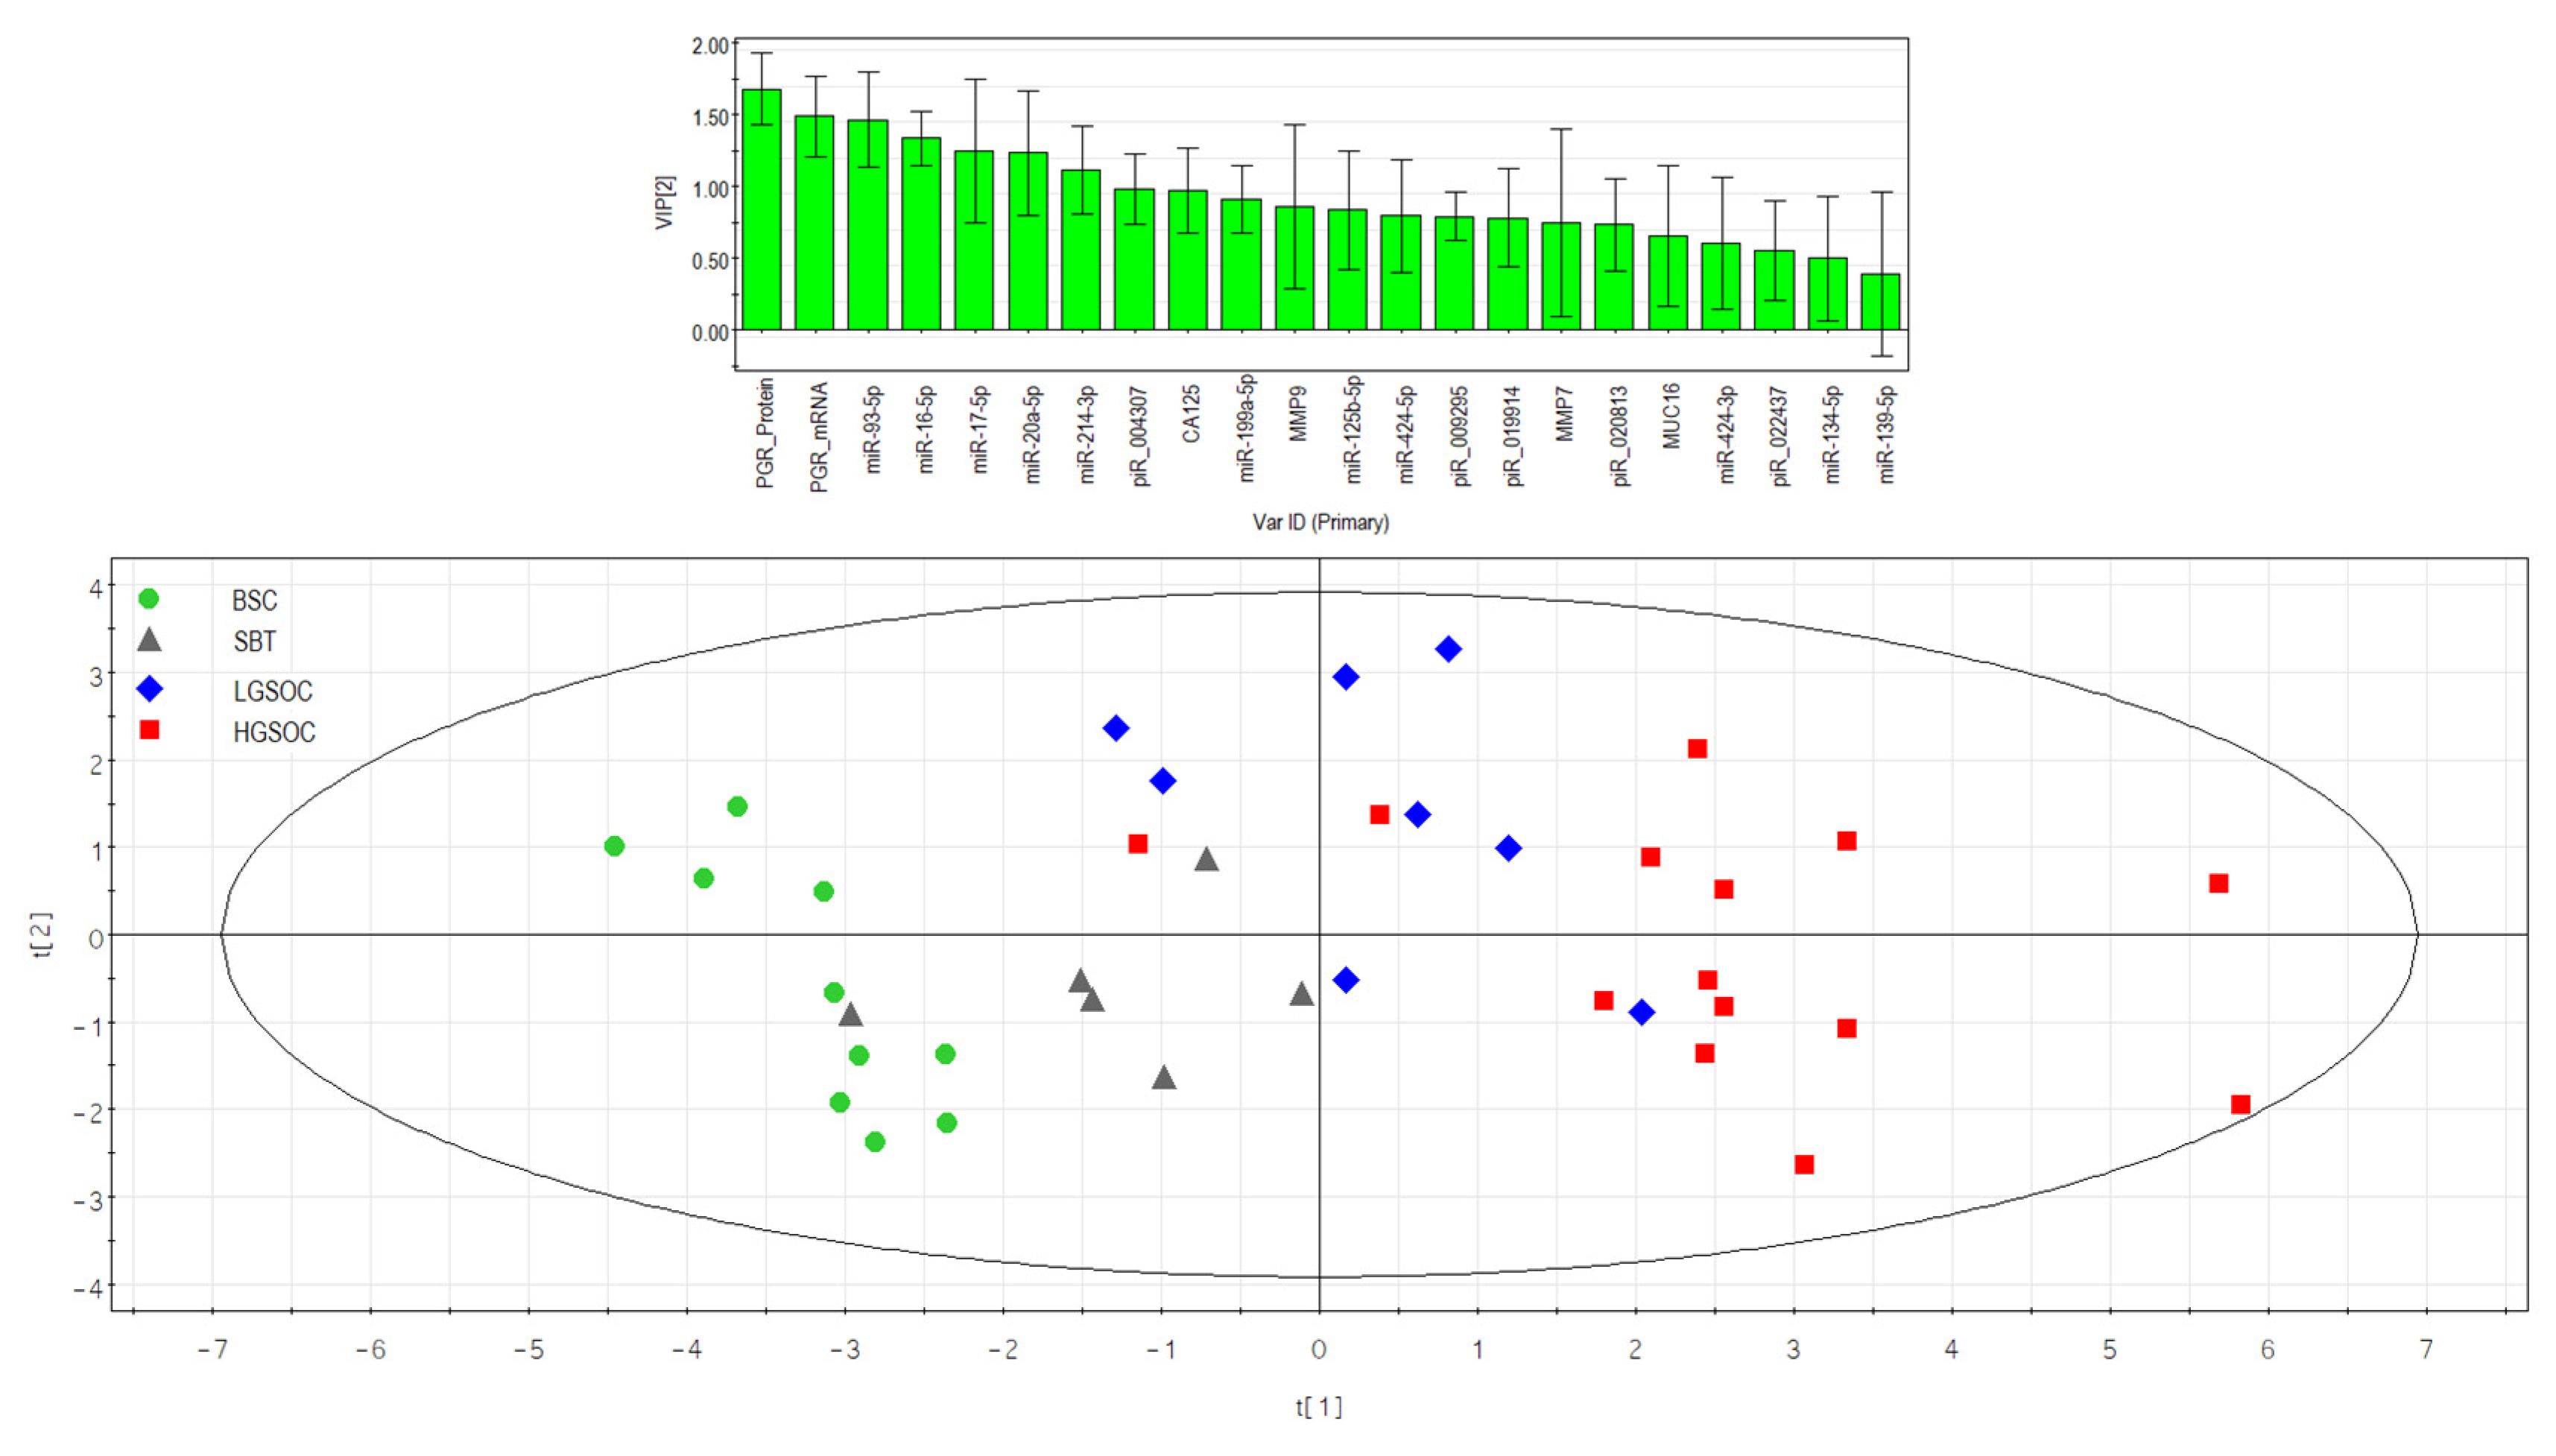
Partial least squares analysis (PLS) of “-ΔCt” RT-PCR data on the expression of miRNA, piRNA, mRNA, PGR protein in the 38 FFPE-samples of serous ovarian tumors and corresponding CA125 level in blood serum of patients. Score plot with the imposition of information of the molecular biological parameter value on the serous tumor type (BSC, SBT, LGSOC, and HGSOC) is presented in the bottom of the Figure. Variable Importance in Projection (VIP) score is presented at the top of the Figure.
Figure 7.
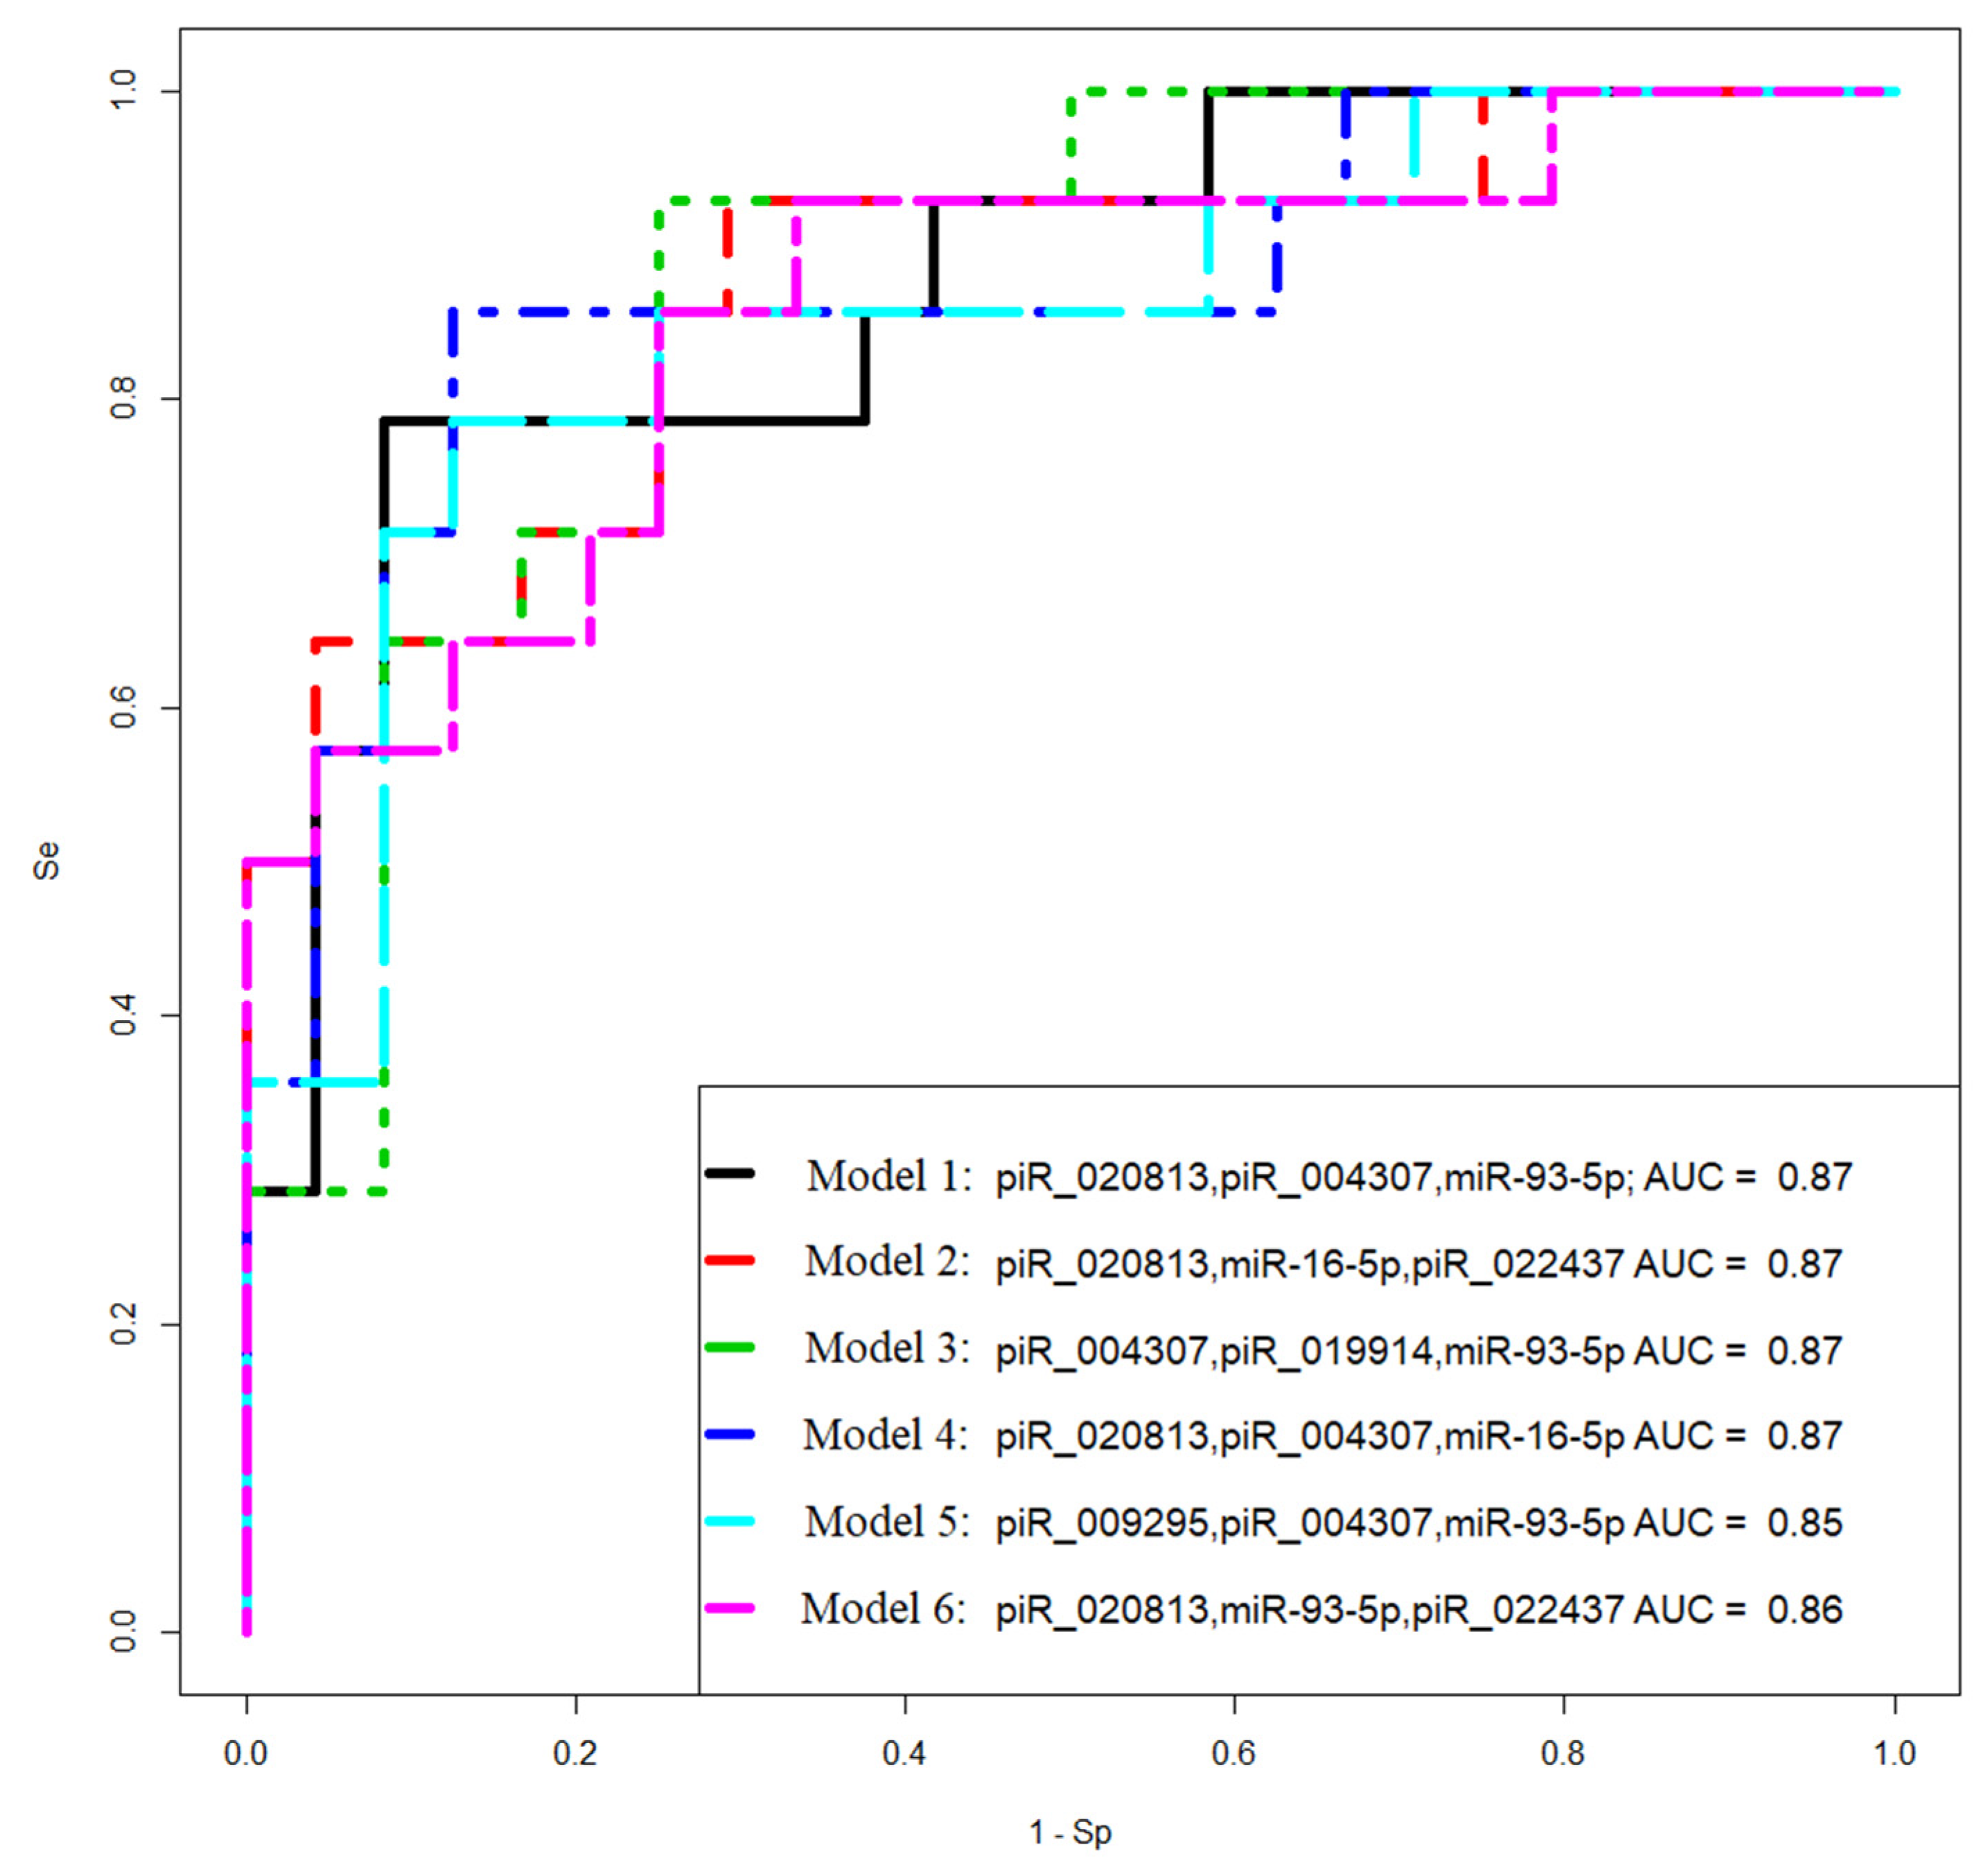
Receiver operating characteristic (ROC) curves of the logistic regression models to identify PGR-negative serous tumors based on the level of miRNA and piRNA in FFPE-samples of BSC, SBT, LGSOC, and HGSOC.
Figure 7.
Receiver operating characteristic (ROC) curves of the logistic regression models to identify PGR-negative serous tumors based on the level of miRNA and piRNA in FFPE-samples of BSC, SBT, LGSOC, and HGSOC.
Figure 8.
Receiver operating characteristic (ROC) curves of the logistic regression models to identify PGR-negative serous tumors based on the level of miRNA and piRNA in blood plasma samples from patients with BSC, SBT, LGSOC, and HGSOC.
Figure 8.
Receiver operating characteristic (ROC) curves of the logistic regression models to identify PGR-negative serous tumors based on the level of miRNA and piRNA in blood plasma samples from patients with BSC, SBT, LGSOC, and HGSOC.
Figure 9.
Functional significance of genes potentially regulated by miRNA and piRNA, associated with PGR-negative serous ovarian carcinoma phenotype. (
A) Venn diagram of gene-targets for miRNA and piRNA from
Figure 7 and
Figure 8 logistic regression models (
Table S4, Sheet 2), genes, implicated in ovarian cancer according to FunRich3.1.3 (
Table S4, Sheet 8), and genes, containing mutations that have been causally implicated in cancer according to the Cancer Gene Census from COSMIC database (
Table S4, Sheet 11). (
B) Site of expression of 72 genes, common for three gene lists as shown in (
A), according to FunRich3.1.3 (
Table S4, Sheet 12).
Table 1.
Sample characteristics of the patients with serous ovary tumors.
Table 1.
Sample characteristics of the patients with serous ovary tumors.
| Patient ID |
Age, years |
FIGO |
1—primary tumor resection, 2—complete cytoreduction (size of residual tumor foci less than 2.5 mm), 3—suboptimal cytoreduction (size of residual tumor foci 2.5 mm - 2, 5 cm) |
RECIST 1.1 MRI/CT criteria: 1-Complete Response, 2-Partial Response, 3-Stable Disease, 4-Progressive Disease |
Diagnosis |
ID, FFPE sample |
progesterone receptor expression in tumor, Allred Score* |
ID, blood plasma sample |
CA 125 level before treatment, U/ml |
| P1 |
34 |
- |
1 |
- |
BSC |
1 |
8 |
959 |
12 |
| P2 |
41 |
- |
1 |
- |
BSC |
7 |
8 |
724 |
18 |
| P3 |
45 |
- |
1 |
- |
BSC |
10 |
8 |
957 |
26 |
| P4 |
53 |
- |
1 |
- |
BSC |
17 |
8 |
802 |
12 |
| P5 |
36 |
- |
1 |
- |
BSC |
18 |
8 |
806 |
3 |
| P6 |
46 |
- |
1 |
- |
BSC |
24 |
8 |
866 |
3 |
| P7 |
48 |
- |
1 |
- |
BSC |
26 |
8 |
849 |
19 |
| P8 |
43 |
- |
1 |
- |
BSC |
31 |
8 |
908 |
11 |
| P9 |
38 |
- |
1 |
- |
BSC |
32 |
8 |
745 |
4 |
| P10 |
45 |
- |
1 |
- |
BSC |
37 |
8 |
705 |
9 |
| P11 |
32 |
Ia |
1 |
- |
SBT |
2 |
7 |
956 |
64 |
| P12 |
35 |
Ia |
1 |
- |
SBT |
22 |
8 |
453 |
15 |
| P13 |
43 |
Ia |
1 |
- |
SBT |
25 |
7 |
900 |
9 |
| P14 |
36 |
Ia |
1 |
- |
SBT |
27 |
7 |
510 |
55 |
| P15 |
39 |
IB |
1 |
- |
SBT |
33 |
7 |
817 |
12 |
| P16 |
43 |
Ia |
1 |
- |
SBT |
38 |
6 |
685 |
3 |
| P17 |
34 |
IIIC |
2 |
1 |
LGSOC |
16 |
4 |
686 |
45 |
| P18 |
54 |
IIIC |
3 |
4 |
LGSOC |
34 |
0 |
752 |
521 |
| P19 |
46 |
IIIC |
3 |
3 |
LGSOC |
5 |
0 |
1004 |
41 |
| P20 |
30 |
IIIC |
3 |
3 |
LGSOC |
6 |
0 |
554 |
604 |
| P21 |
45 |
IIIC |
2 |
1 |
LGSOC |
8 |
4 |
731 |
173 |
| P22 |
29 |
IIIC |
2 |
4 |
LGSOC |
15 |
5 |
796 |
550 |
| P23 |
40 |
IIB |
2 |
1 |
LGSOC |
28 |
6 |
729 |
441 |
| P24 |
53 |
IIIA |
2 |
1 |
LGSOC |
29 |
6 |
965 |
372 |
| P25 |
63 |
IIIC |
3 |
4 |
HGSOC |
3 |
0 |
19 |
42 |
| P26 |
51 |
IIIC |
2 |
4 |
HGSOC |
4 |
0 |
448 |
3808 |
| P27 |
38 |
IIIC |
3 |
4 |
HGSOC |
9 |
0 |
2008 |
1244 |
| P28 |
71 |
IIIC |
3 |
4 |
HGSOC |
11 |
0 |
13 |
517 |
| P29 |
33 |
IIIC |
3 |
2 |
HGSOC |
12 |
6 |
939 |
59 |
| P30 |
51 |
IIIC |
2 |
3 |
HGSOC |
13 |
0 |
679 |
2000 |
| P31 |
45 |
IIB |
2 |
3 |
HGSOC |
14 |
0 |
782 |
517 |
| P32 |
48 |
IC |
2 |
4 |
HGSOC |
19 |
0 |
11 |
190 |
| P33 |
41 |
IIIC |
2 |
1 |
HGSOC |
20 |
3 |
672 |
1088 |
| P34 |
54 |
IIIC |
3 |
4 |
HGSOC |
21 |
0 |
649 |
200 |
| P35 |
42 |
IIIC |
2 |
1 |
HGSOC |
23 |
3 |
684 |
1293 |
| P36 |
57 |
IIC |
3 |
4 |
HGSOC |
30 |
0 |
15 |
198 |
| P37 |
77 |
IIIC |
2 |
2 |
HGSOC |
35 |
4 |
1060 |
1203 |
| P38 |
45 |
IIA |
2 |
3 |
HGSOC |
36 |
0 |
22 |
60 |
Table 2.
Comparison of SBT, LGSOC and HGSOC groups relative to BSC by miRNA expression levels in serous ovarian tumors.
Table 2.
Comparison of SBT, LGSOC and HGSOC groups relative to BSC by miRNA expression levels in serous ovarian tumors.
| miRNA |
Group |
Me, -∆Ct |
Q1 |
Q3 |
Wilcoxon-Mann-Whitney test, p-value |
Potential gene-target |
| miR-125b-5p |
BSC |
1,79 |
0,83 |
2,91 |
|
MUC16, MMP7 |
| SBT |
1,46 |
0,6 |
2,18 |
0,492258 |
| LGSOC |
0,79 |
0,68 |
0,89 |
0,101102 |
| HGSOC |
0,57 |
-0,49 |
1,45 |
0,022015 |
| miR-134-5p |
BSC |
-8,35 |
-8,95 |
-7,64 |
|
MUC16, MMP9 |
| SBT |
-8,78 |
-9,1 |
-8,38 |
0,367632 |
| LGSOC |
-9,9 |
-10,45 |
-9,17 |
0,026647 |
| HGSOC |
-9,06 |
-9,71 |
-8,27 |
0,234983 |
| miR-139-5p |
BSC |
-8,19 |
-10,03 |
-7,12 |
|
MMP9 |
| SBT |
-8,81 |
-10,7 |
-8,57 |
0,635365 |
| LGSOC |
-8,15 |
-8,94 |
-7,29 |
0,572604 |
| HGSOC |
-8,5 |
-9,3 |
-7,77 |
0,752095 |
| miR-199a-5p |
BSC |
-4,5 |
-5,05 |
-3,72 |
|
MUC16, MMP7 |
| SBT |
-4,96 |
-5,58 |
-4,16 |
0,562188 |
| LGSOC |
-5,83 |
-6,35 |
-4,51 |
0,067599 |
| HGSOC |
-5,73 |
-6,41 |
-5,17 |
0,007251 |
| miR-214-3p |
BSC |
-2,43 |
-3,24 |
-1,93 |
|
MUC16, MMP7 |
| SBT |
-3,1 |
-4,08 |
-2,29 |
0,263487 |
| LGSOC |
-4,55 |
-4,73 |
-3,38 |
0,006216 |
| HGSOC |
-4,09 |
-4,84 |
-3,67 |
0,000274 |
| miR-424-3p |
BSC |
-6,63 |
-7,45 |
-5,93 |
|
MUC16, MMP9 |
| SBT |
-7,34 |
-8,54 |
-6,37 |
0,313187 |
| LGSOC |
-8,66 |
-9,23 |
-8,19 |
0,006216 |
| HGSOC |
-7,25 |
-8,67 |
-6,75 |
0,137503 |
| miR-424-5p |
BSC |
-2,91 |
-3,63 |
-1,89 |
|
MUC16 |
| SBT |
-3,57 |
-4,74 |
-2,23 |
0,492258 |
| LGSOC |
-4,94 |
-5,39 |
-4,65 |
0,001371 |
| HGSOC |
-3,86 |
-4,65 |
-3,52 |
0,041717 |
Table 3.
Comparison of SBT, LGSOC and HGSOC relative to BSC by the mRNA expression level in serous ovarian tumors.
Table 3.
Comparison of SBT, LGSOC and HGSOC relative to BSC by the mRNA expression level in serous ovarian tumors.
| mRNA |
Group |
Me, -∆Ct |
Q1 |
Q3 |
Wilcoxon-Mann-Whitney test, p-value |
| MMP7 |
BSC |
-6,19 |
-7,14 |
-4,09 |
|
| SBT |
-1,84 |
-2,05 |
-1,45 |
0,041958 |
| LGSOC |
-1,79 |
-3,78 |
-1,07 |
0,034279 |
| HGSOC |
-2,59 |
-2,89 |
-1,45 |
0,030588 |
| MMP9 |
BSC |
-6,86 |
-7,24 |
-6,05 |
|
| SBT |
-6,74 |
-7,88 |
-5,23 |
0,874875 |
| LGSOC |
-5,29 |
-5,89 |
-4,72 |
0,011655 |
| HGSOC |
-4,18 |
-5,22 |
-2,16 |
0,022015 |
| MUC16 |
BSC |
-3,96 |
-5,3 |
-2,37 |
|
| SBT |
0,32 |
-0,61 |
0,68 |
0,031219 |
| LGSOC |
0,03 |
-0,57 |
0,75 |
0,002057 |
| HGSOC |
-1,86 |
-3,23 |
-0,94 |
0,018545 |
| PGR |
BSC |
0,78 |
0,5 |
1,5 |
|
| SBT |
-0,23 |
-0,84 |
0,47 |
0,093407 |
| LGSOC |
-2,83 |
-4,43 |
-1,95 |
0,000183 |
| HGSOC |
-4,02 |
-4,97 |
-3,03 |
3,06E-05 |
Table 4.
Comparative analysis of the expression level of miRNAs implicated in EMT in the SBT, LGSOC and HGSOC relative to BSC groups.
Table 4.
Comparative analysis of the expression level of miRNAs implicated in EMT in the SBT, LGSOC and HGSOC relative to BSC groups.
| miRNA |
Group |
Me, -∆Ct |
Q1 |
Q3 |
Wilcoxon-Mann-Whitney test, p-value |
| miR-16-5p |
BSC |
-4,76 |
-5,75 |
-3,94 |
|
| |
SBT |
-4,07 |
-4,65 |
-3,44 |
0,263487 |
| |
LGSOC |
-3,32 |
-4,03 |
-3,07 |
0,034279 |
| |
HGSOC |
-2,21 |
-3,32 |
-1,46 |
9,89E-05 |
| miR-17-5p |
BSC |
-5,9 |
-6,86 |
-5,42 |
|
| |
SBT |
-5,04 |
-5,42 |
-4,49 |
0,072677 |
| |
LGSOC |
-5,81 |
-5,86 |
-4,54 |
0,274281 |
| |
HGSOC |
-2,97 |
-3,81 |
-2,45 |
3,06E-05 |
| miR-20a-5p |
BSC |
-5,57 |
-6,51 |
-5,17 |
|
| |
SBT |
-4,79 |
-5,58 |
-4,34 |
0,313187 |
| |
LGSOC |
-5,03 |
-5,72 |
-4,18 |
0,236985 |
| |
HGSOC |
-2,86 |
-3,69 |
-2,36 |
0,000504 |
| miR-93-5p |
BSC |
-8,37 |
-8,97 |
-7,23 |
|
| |
SBT |
-6,89 |
-7,51 |
-6,67 |
0,093407 |
| |
LGSOC |
-7 |
-7,31 |
-6,38 |
0,067599 |
| |
HGSOC |
-4,81 |
-5,4 |
-4,15 |
3,06E-05 |
Table 5.
Comparative analysis of the piRNA expression level in the SBT, LGSOC and HGSOC relative to BSC groups in FFPE sections of tumor tissues.
Table 5.
Comparative analysis of the piRNA expression level in the SBT, LGSOC and HGSOC relative to BSC groups in FFPE sections of tumor tissues.
| piRNA |
Group |
Me, -∆Ct |
Q1 |
Q3 |
Wilcoxon-Mann-Whitney test, p-value |
| hsa_piR_004307 |
BSC |
-1,92 |
-2,92 |
-1,08 |
|
| |
SBT |
-1,03 |
-1,58 |
-0,75 |
0,21978 |
| |
LGSOC |
-1,7 |
-2,49 |
-1,12 |
0,761826 |
| |
HGSOC |
-0,14 |
-0,8 |
0,27 |
0,003067 |
| hsa_piR_009295 |
BSC |
0,09 |
-0,97 |
1,83 |
|
| |
SBT |
0,76 |
0,47 |
1,67 |
0,492258 |
| |
LGSOC |
-0,33 |
-1,2 |
1,66 |
0,696467 |
| |
HGSOC |
1,92 |
0,84 |
2,67 |
0,022015 |
| hsa_piR_019914 |
BSC |
-1,43 |
-2,41 |
0,27 |
|
| |
SBT |
-0,44 |
-0,57 |
0,12 |
0,427822 |
| |
LGSOC |
-1,89 |
-2,28 |
-1,07 |
0,828557 |
| |
HGSOC |
0,64 |
-0,57 |
1,04 |
0,015536 |
| hsa_piR_020813 |
BSC |
-0,82 |
-1,07 |
-0,42 |
|
| |
SBT |
-0,48 |
-0,6 |
-0,4 |
0,562188 |
| |
LGSOC |
-1,06 |
-1,24 |
-0,66 |
0,359934 |
| |
HGSOC |
0,41 |
-0,94 |
1,21 |
0,137503 |
| hsa_piR_022437 |
BSC |
-1,81 |
-2,42 |
-1,14 |
|
| |
SBT |
-1,73 |
-2,18 |
-1,51 |
1 |
| |
LGSOC |
-3,2 |
-3,34 |
-2,44 |
0,083139 |
| |
HGSOC |
-0,87 |
-2,14 |
-0,2 |
0,154081 |
Table 7.
Parameters of
Figure 8 logistic regression models.
Table 7.
Parameters of
Figure 8 logistic regression models.
| Coefficient |
coefficient value (95% CI) |
Wald test |
p_value |
Odds ratio (95% CI) |
sensitivity |
specificity |
| model 1 |
0.8571 |
0.9583 |
| (Intercept) |
-4.296(-7.698;-1.991) |
-3.048 |
0.002 |
0.013(0.0004;0.136) |
|
|
| piR_022437 |
1.288(0.399;2.683) |
2.312 |
0.02 |
3.628(1.49;14.64) |
|
|
| miR-16-5p |
0.746(0.137;1.531) |
2.173 |
0.029 |
2.109(1.147;4.625) |
|
|
| model 2 |
0.7857 |
0.8333 |
| (Intercept) |
-2.084(-3.604;-0.936) |
-3.138 |
0.001 |
0.124(0.027;0.392) |
|
|
| piR_022437 |
1.384(0.6;2.561) |
2.861 |
0.004 |
3.991(1.822;12.957) |
|
|
| model 3 |
0.7143 |
0.875 |
| (Intercept) |
-3.326(-5.932;-1.428) |
-2.956 |
0.003 |
0.035(0.002;0.239) |
|
|
| miR-16-5p |
0.921(0.36;1.671) |
2.815 |
0.004 |
2.513(1.434;5.319) |
|
|
