3.1. Structural stability and electron-phonon properties of ZrO2.
At the first stage of modeling, the structural-energy relaxation of pure ZrO2 phases was carried out using the VASP package. To find the optimal cutoff energy for the ENCUT plane wave basis functions and the corresponding number of k-points in the Brillouin zone, we tested the convergence of the total unit cell energy as a function of ENCUT and KPOINTS.
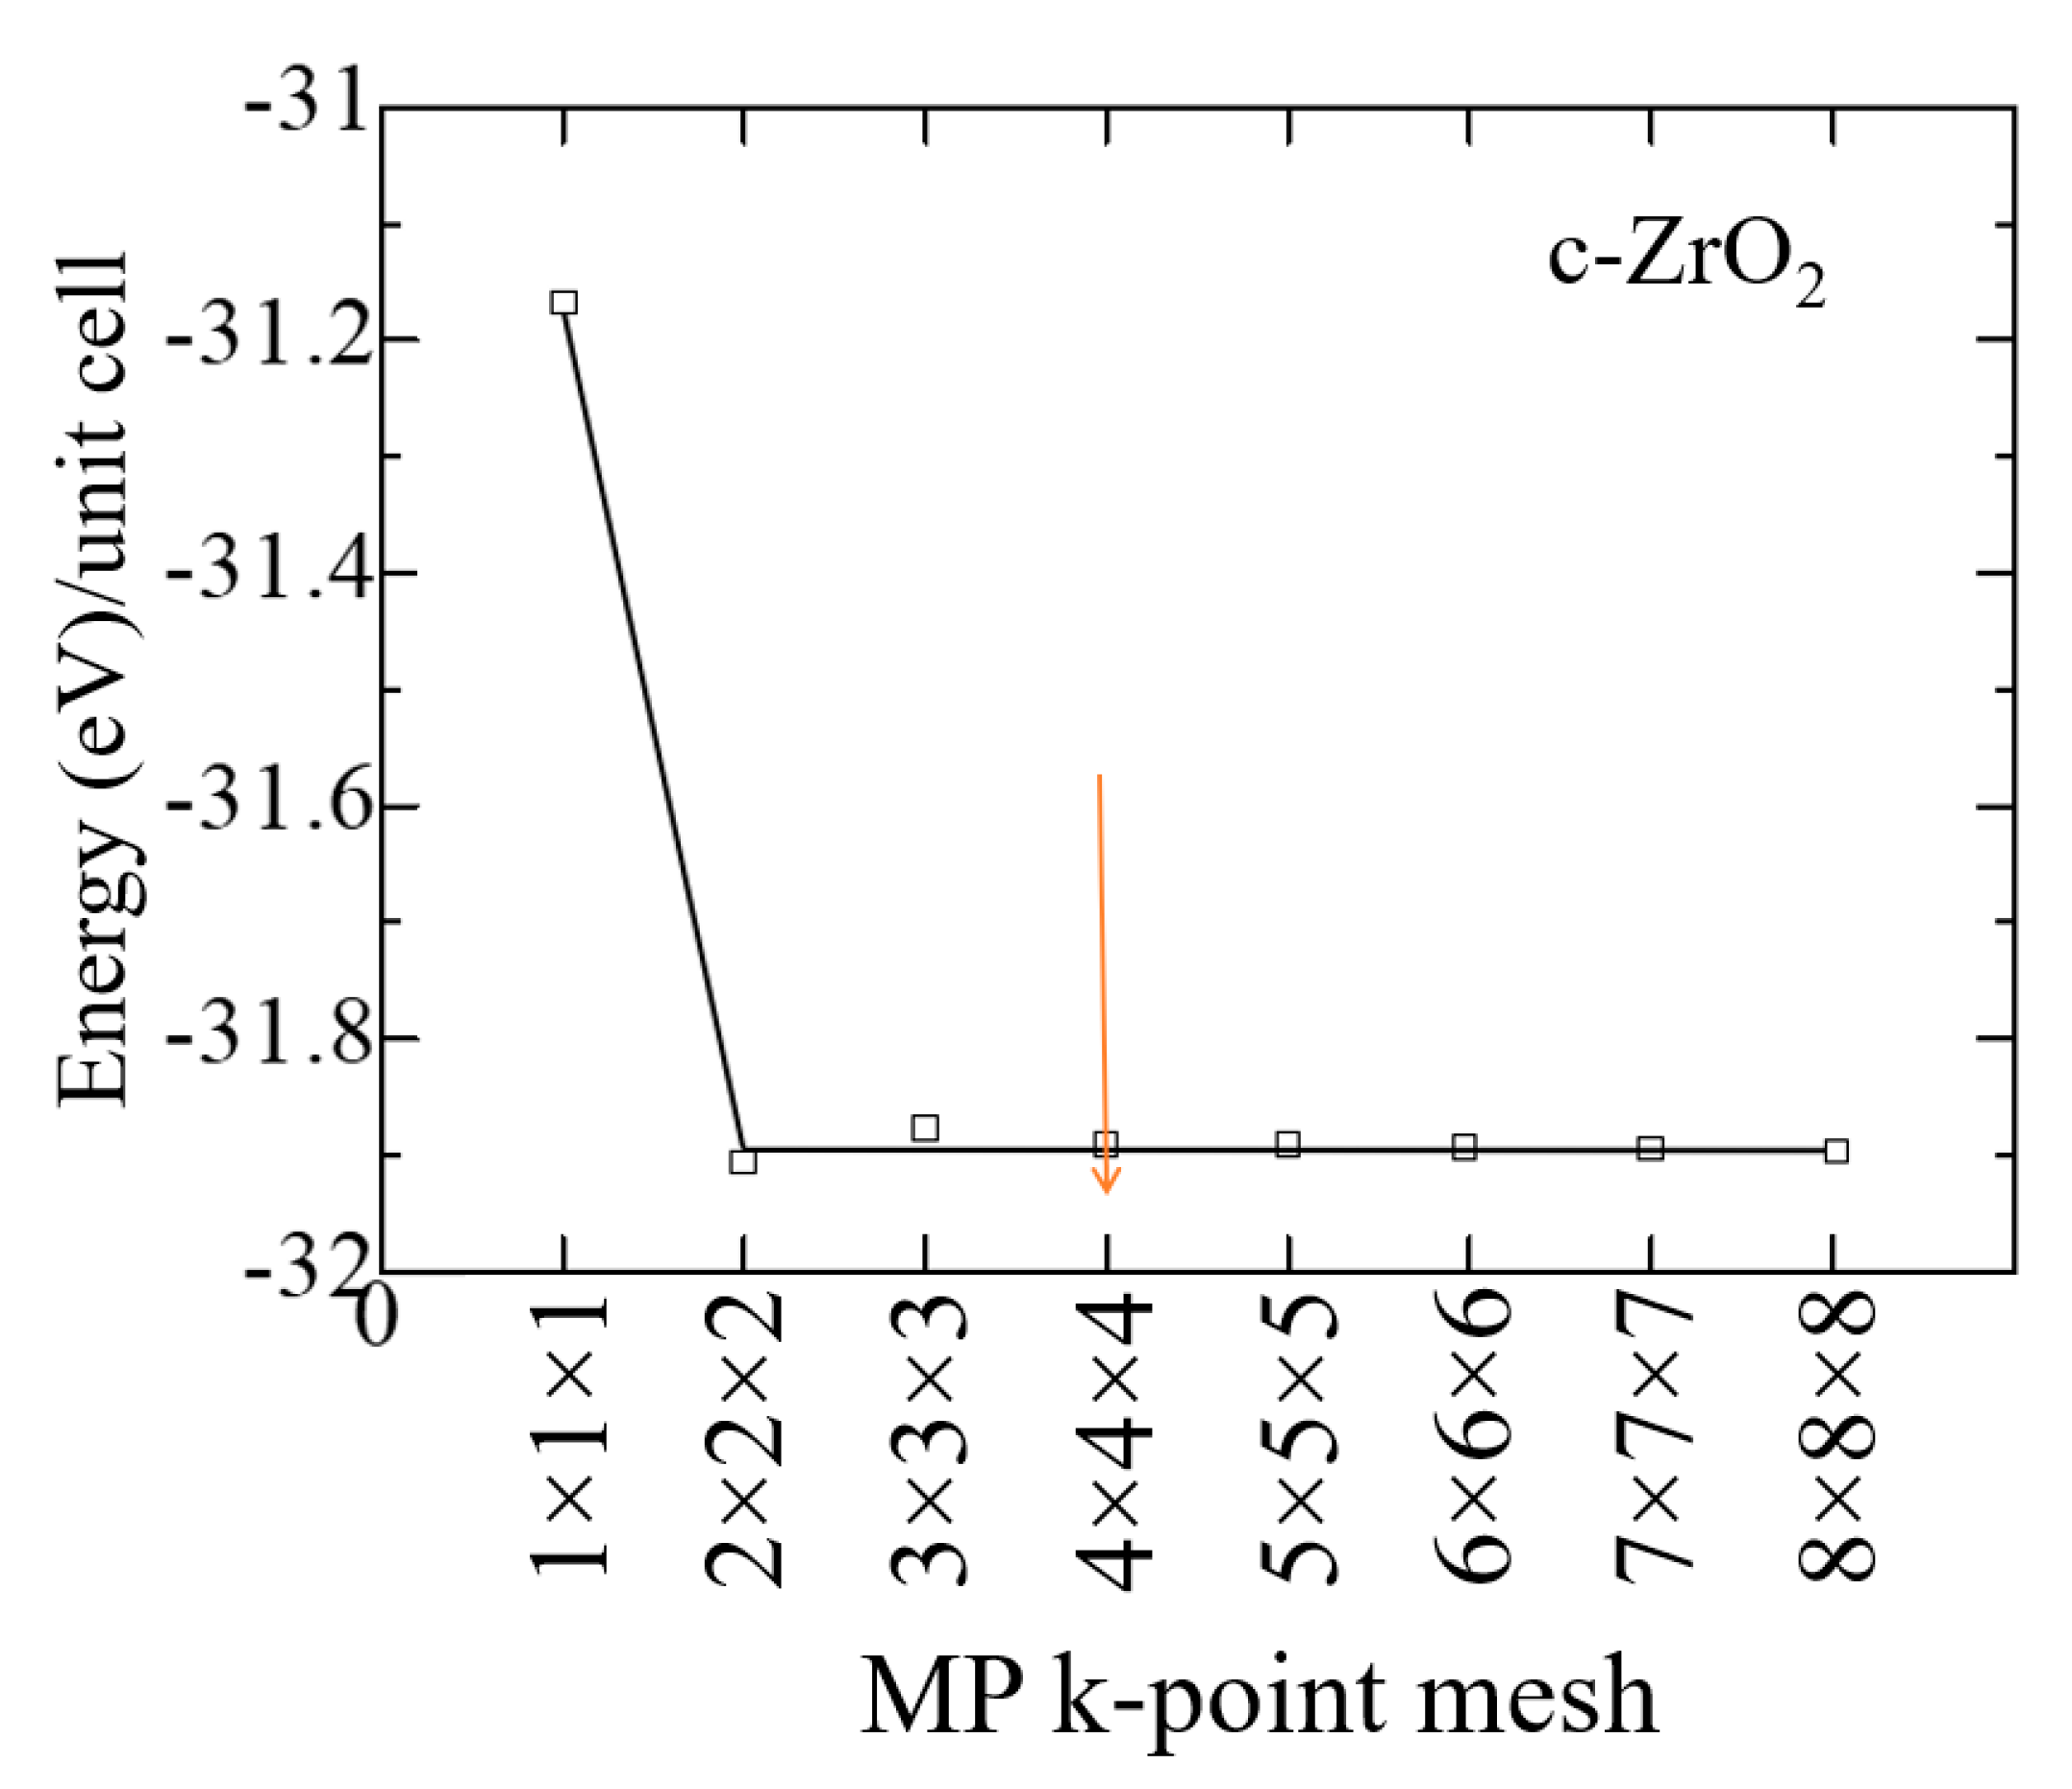
The results of the k-point convergence test for ZrO
2 cubic phases are shown in
Figure 3. 2 and performed to build a grid from k-point data with an initial value of ENCUT = 1.3*ENMAX. Based on the results obtained, it can be concluded that for a 4x4x4 k-point grid with the Monkhrost-Pack scheme, it is optimal for the geometric relaxation of ZrO2. However, when calculating the electronic structure of these compounds, the number of k-points was at least doubled in order to obtain a better density of states (DOS).
Figure 2.
The total energy of the c-ZrO2 unit cell as a function of the number of k-points under the condition ENCUT=1.3*ENMAX.
Figure 2.
The total energy of the c-ZrO2 unit cell as a function of the number of k-points under the condition ENCUT=1.3*ENMAX.
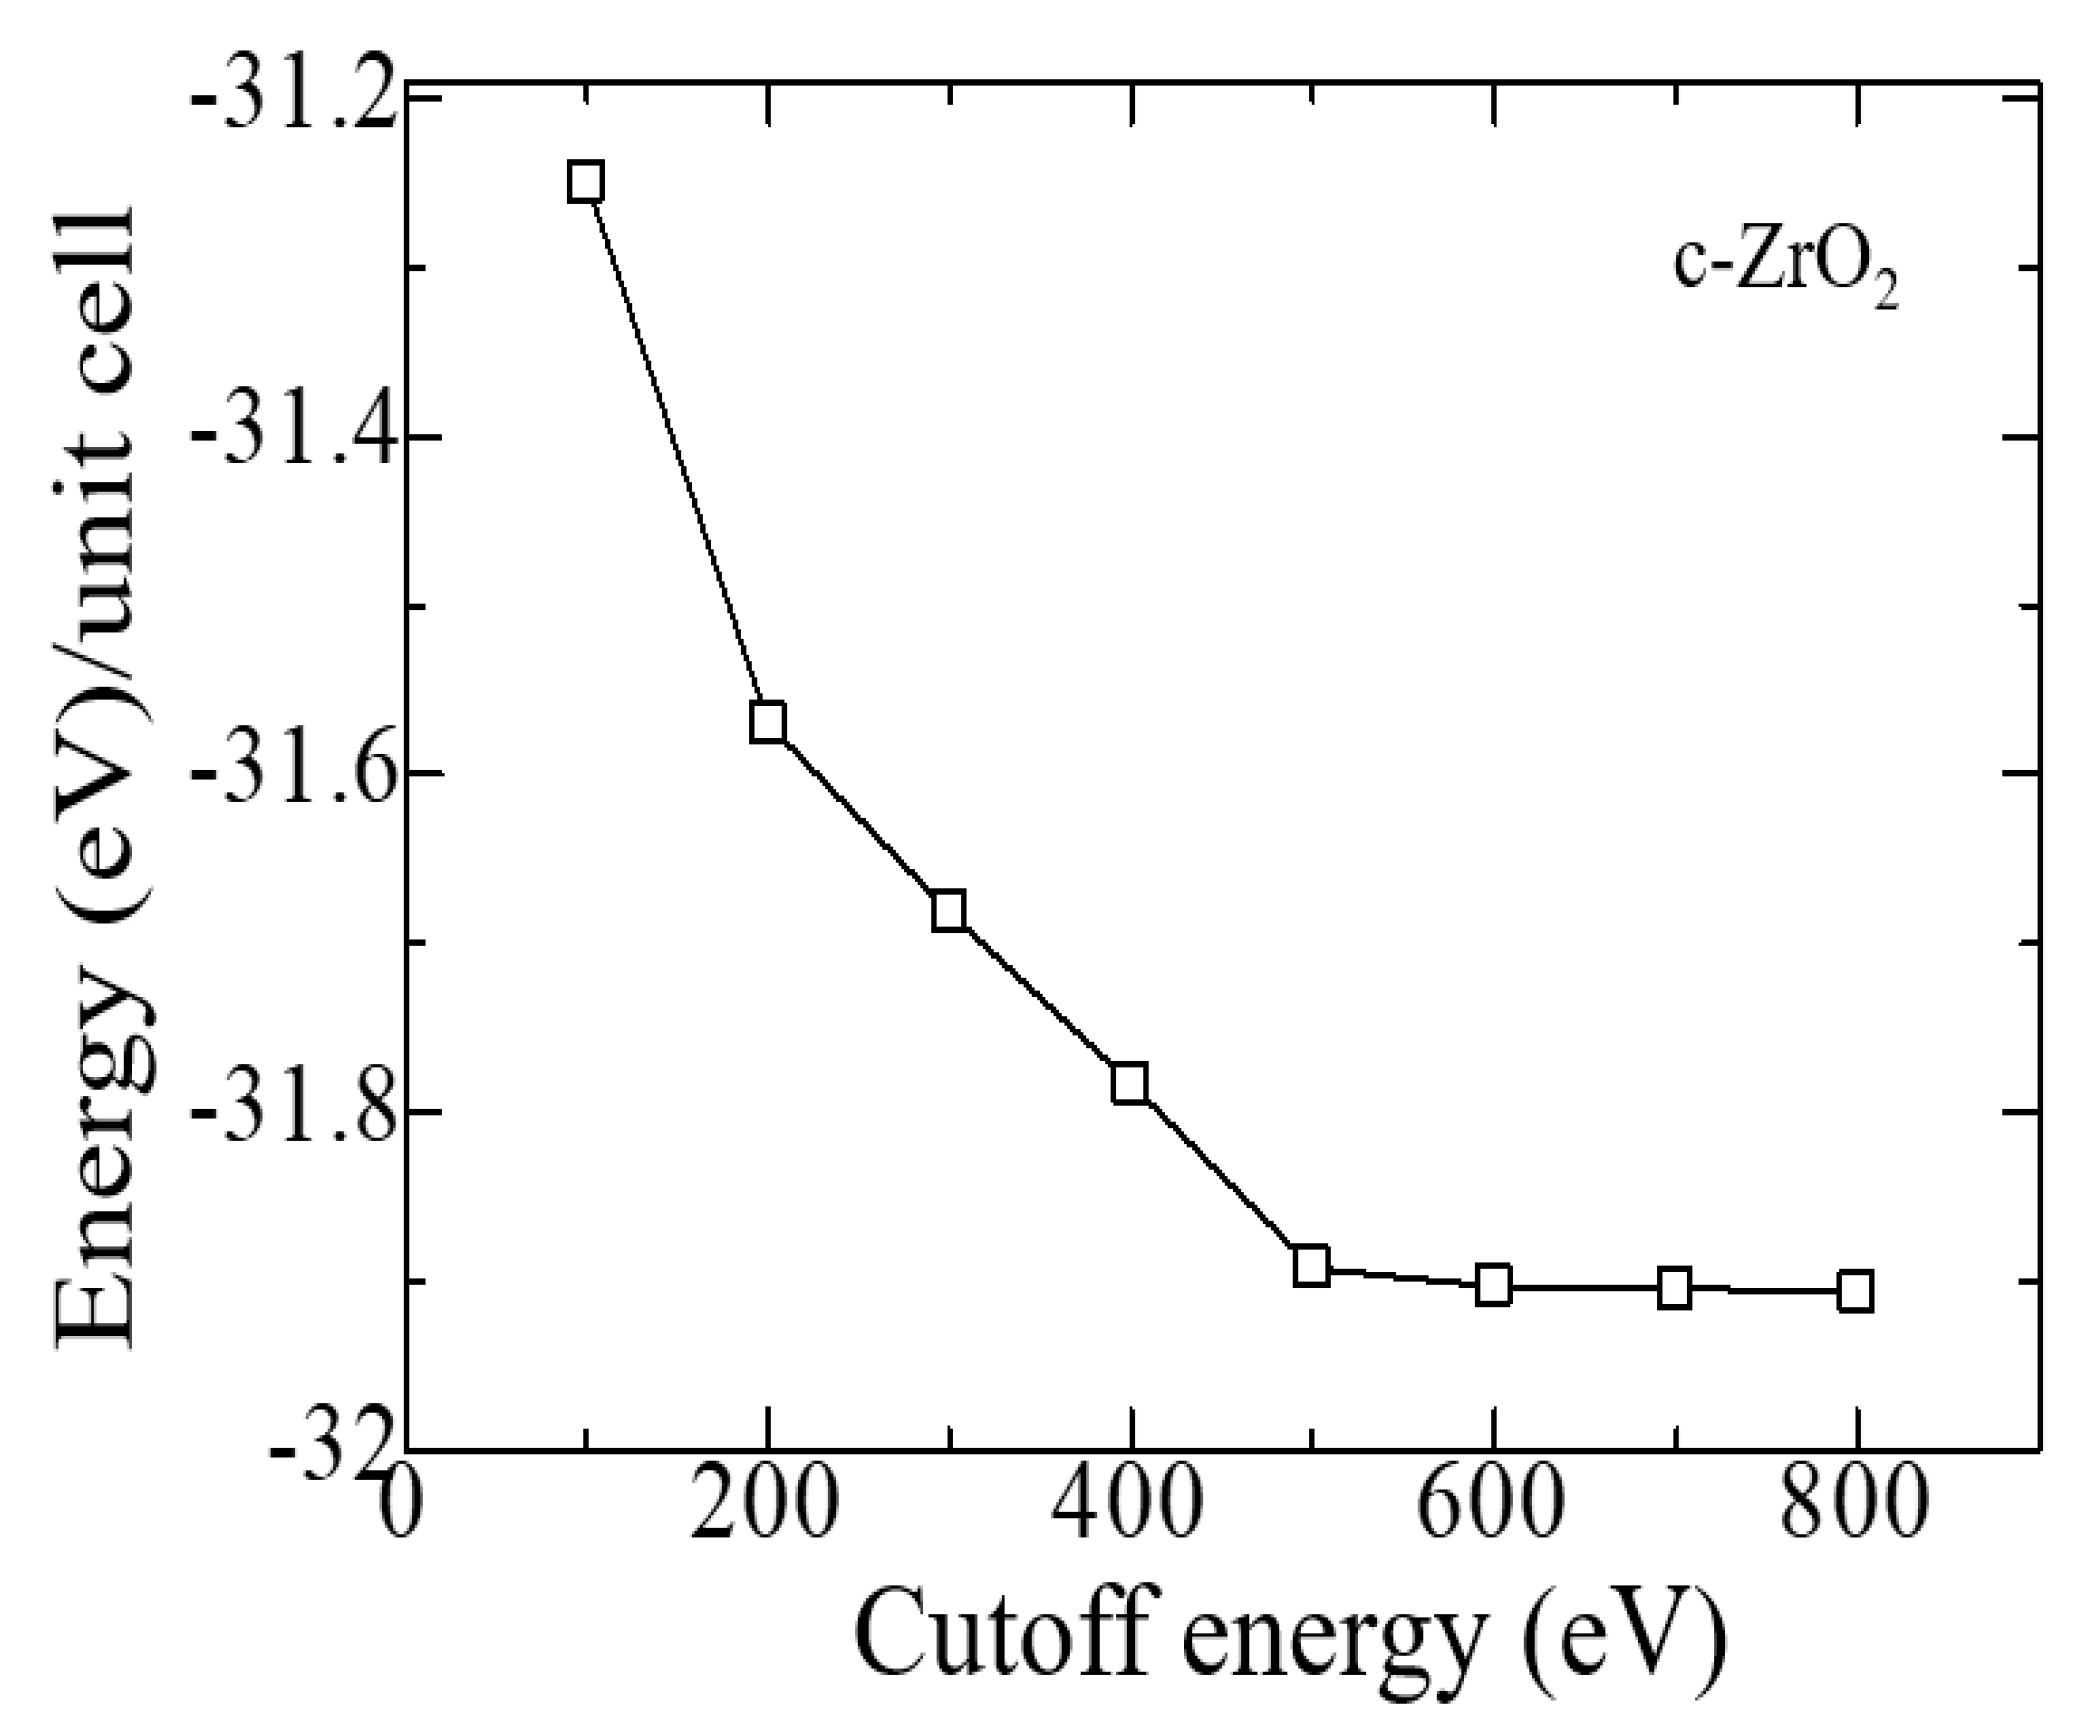
Similar tests were carried out to establish the cutoff energy, which shows that the choice of 600 eV is suitable for calculations, and a further increase in this energy increases the cost of the calculation without affecting its accuracy (
Figure 3). Therefore, all further calculations were carried out at ENCUT = 600 eV.
Figure 3.
Total energy of the c-ZrO2 unit cell as a function of the cutoff energy (4 × 4 × 4 k-points).
Figure 3.
Total energy of the c-ZrO2 unit cell as a function of the cutoff energy (4 × 4 × 4 k-points).
Similar convergence tests were also carried out for the tetragonal and monoclinic phases of ZrO
2 using the GGA potential. In
Table 1 compares the calculated values of the crystal lattice constants of the ZrO
2 phase, obtained from two exchange-correlation potentials, with the literature results.
According to the results given in
Table 1, it can be seen that during the transition from the high-temperature phase to the low-temperature phase, the lattice distortion leads to a displacement of O ions in the c direction by the value of dz, expressed in relative units. As a result of distortion in the tetragonal phase, all Zr-O bonds will become nonequivalent. According to
Table 3, the SCAN functionality describes the geometry much better than the standard GGA-PBE. However, it is also seen from the available data that GGA and SCAN almost identically describe the energy difference between the monoclinic and tetragonal phases of ZrO
2. Since the SCAN exchange-correlation functional describes the structural properties well, we decided to use this functional in the future when describing the geometry of other systems.
Table 2 compares the total energies calculated by the GGA method for systems of the monoclinic, tetragonal, and cubic phases of ZrO
2. It can be seen that among all systems, the most stable phase with the lowest energy is m-ZrO
2, that is, in fact, in terms of the field energy at low temperatures, the stable phase is monoclinic with the space group P21/c.
Table 2.
GGA- calculated total electronic energies of c-ZrO2, t-ZrO2, m-ZrO2.
Table 2.
GGA- calculated total electronic energies of c-ZrO2, t-ZrO2, m-ZrO2.
| System |
Energy |
ΔE |
| m-ZrO2
|
-115.179 |
0 |
| t-ZrO2
|
-114.754 |
0.425 |
| c-ZrO2
|
-114.346 |
0.833 |
Table 3.
Calculated and experimental band gap of c-ZrO2, t-ZrO2, m-ZrO2 in eV.
Table 3.
Calculated and experimental band gap of c-ZrO2, t-ZrO2, m-ZrO2 in eV.
| System |
This work |
Experiment [55] |
| GGA |
SCAN |
HSE06 |
VUV |
| m-ZrO2
|
3.9 |
3.8 |
5.288 |
5.78 |
| t-ZrO2
|
4.42 |
4.37 |
5.898 |
5.83 |
|
c-ZrO2
|
4.03 |
3.93 |
5.140 |
6.10 |
Further, using the Phonopy code in the VASP package, the thermodynamic properties and phonon spectra of the ZrO
2 phase were calculated for a more detailed discussion and substantiation of the structural stability of the ZrO
2 monoclinic phase.
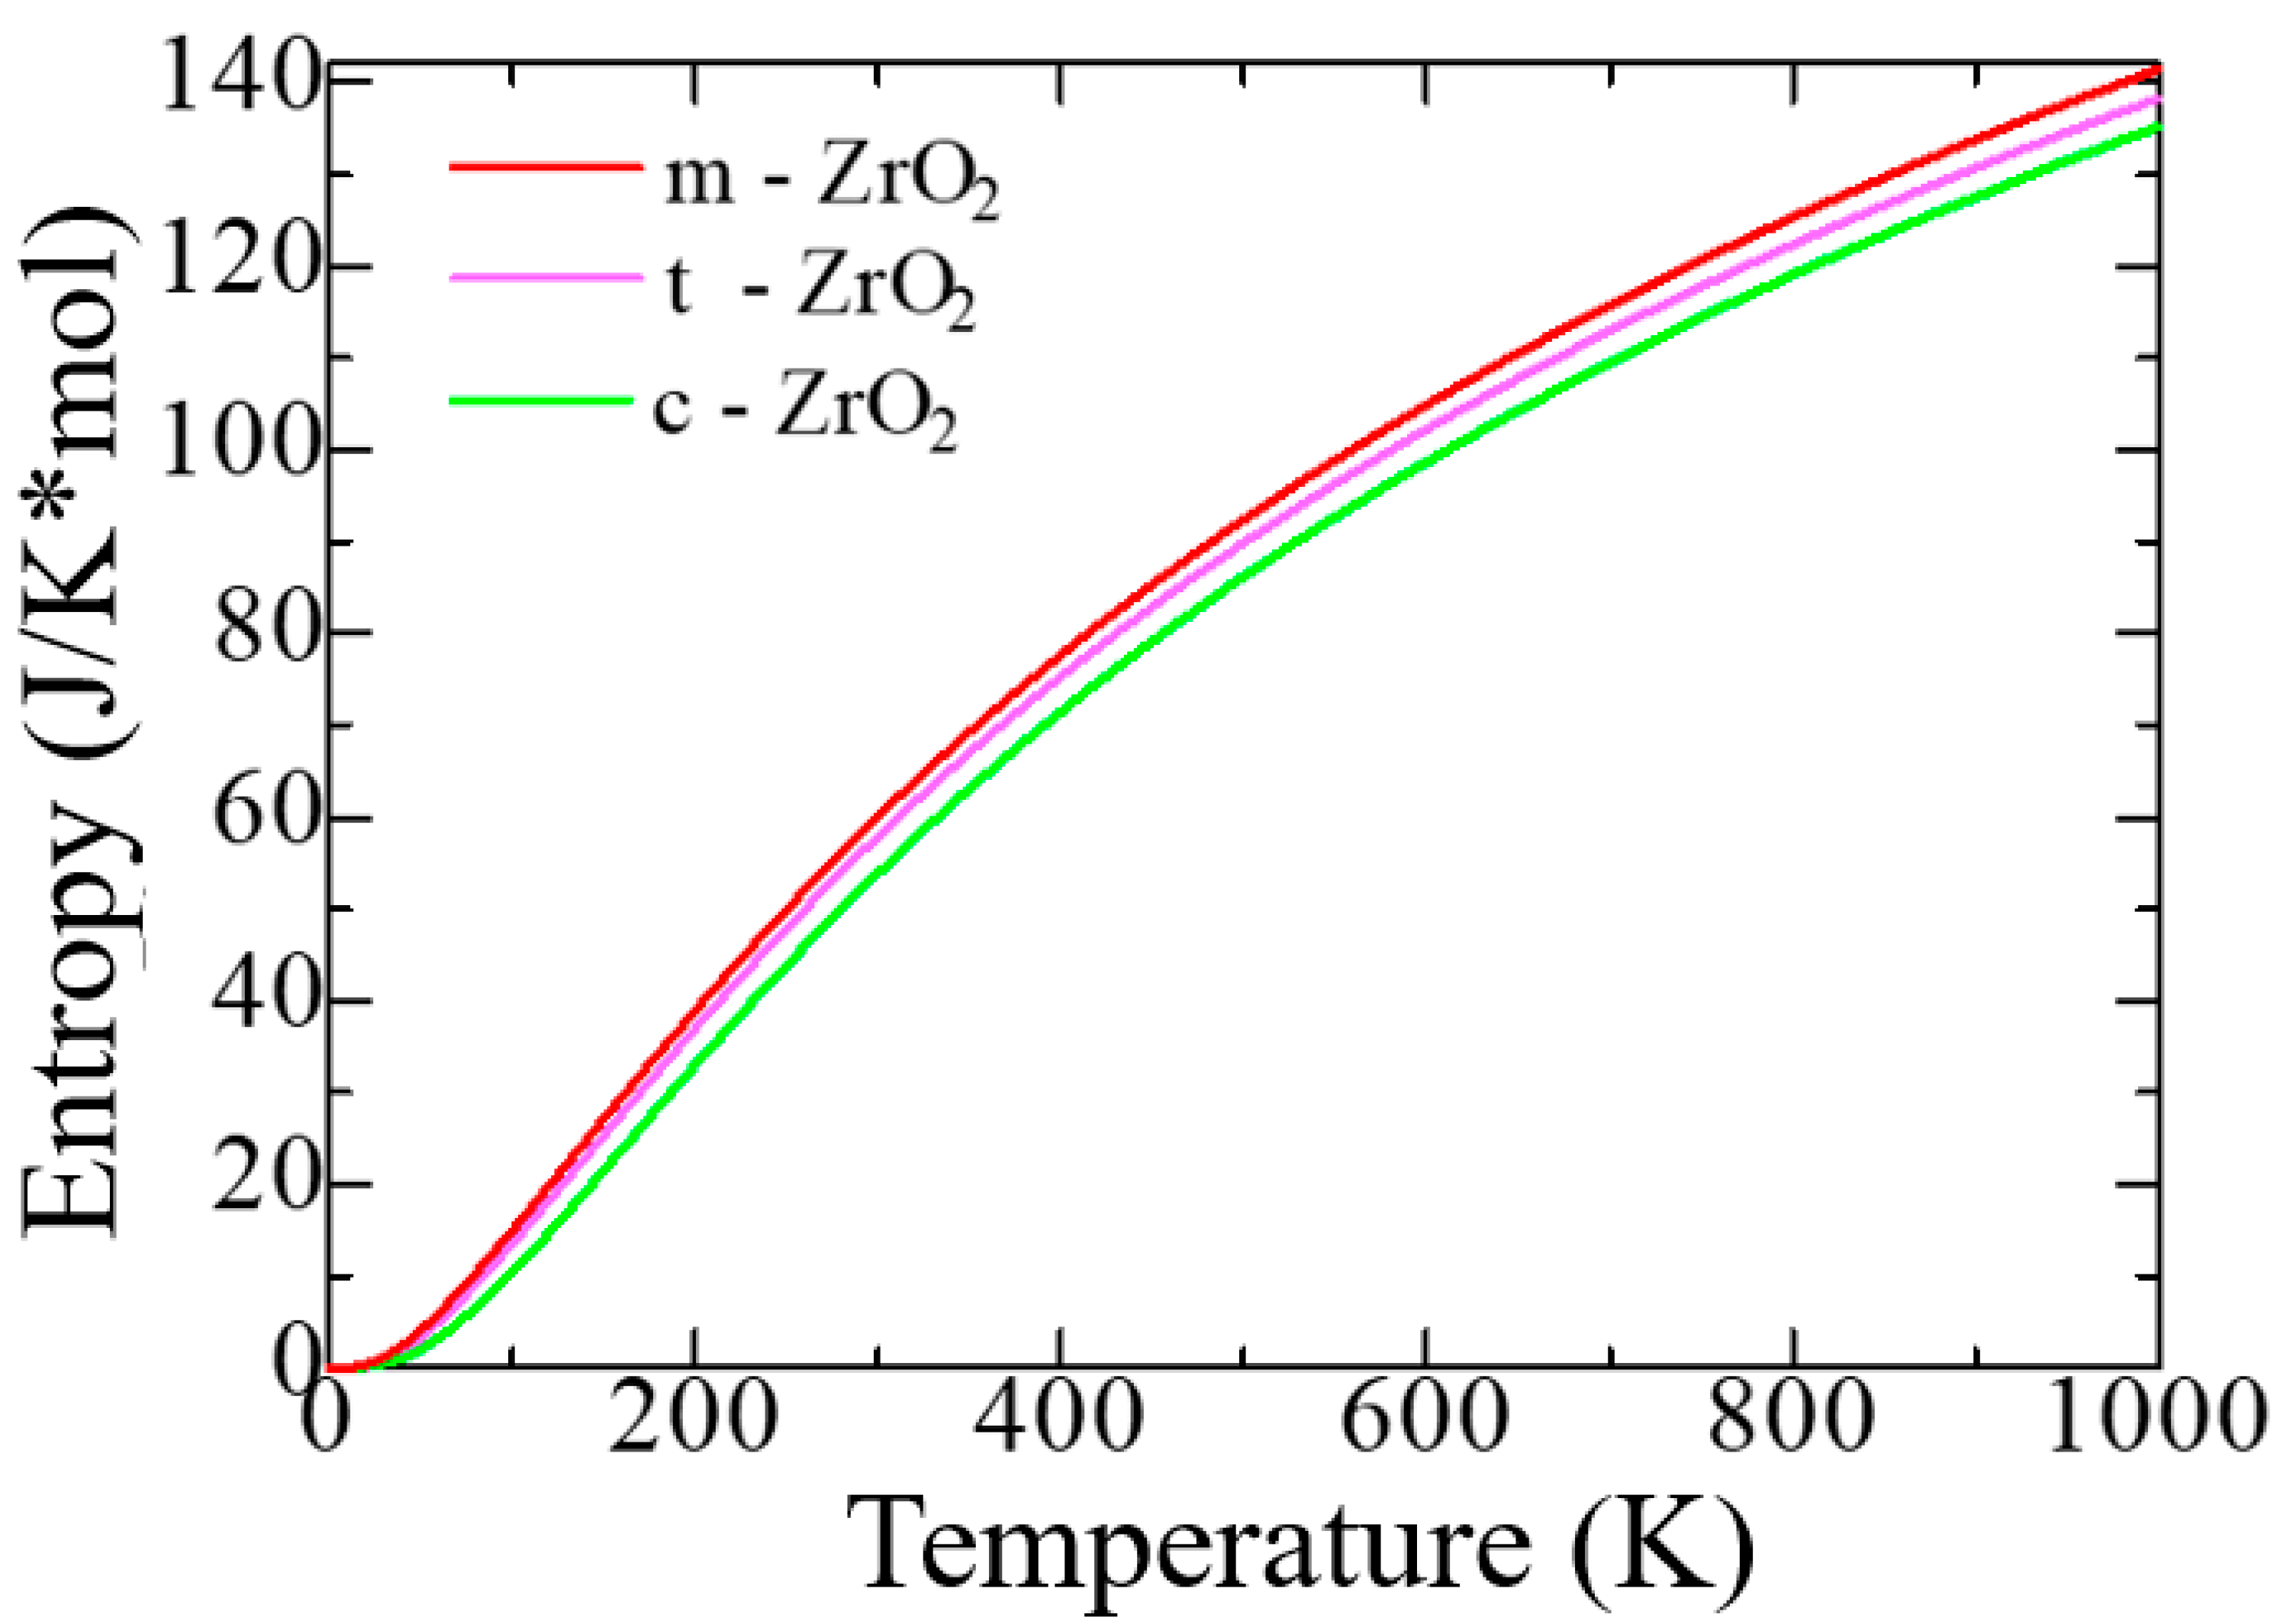
Figure 4 shows the change in the entropy of the unit cells of the ZrO
2 phase as a function of temperature.
According to
Figure 4, as the transition from monoclinic to tetragonal and cubic phases, the entropy of these compounds decreases, which corresponds to the criterion of inverse dependence of enthalpy or direct dependence of entropy and stability of solid systems [
53]. Thus, the monoclinic phase is the most stable with the highest entropy among other ZrO
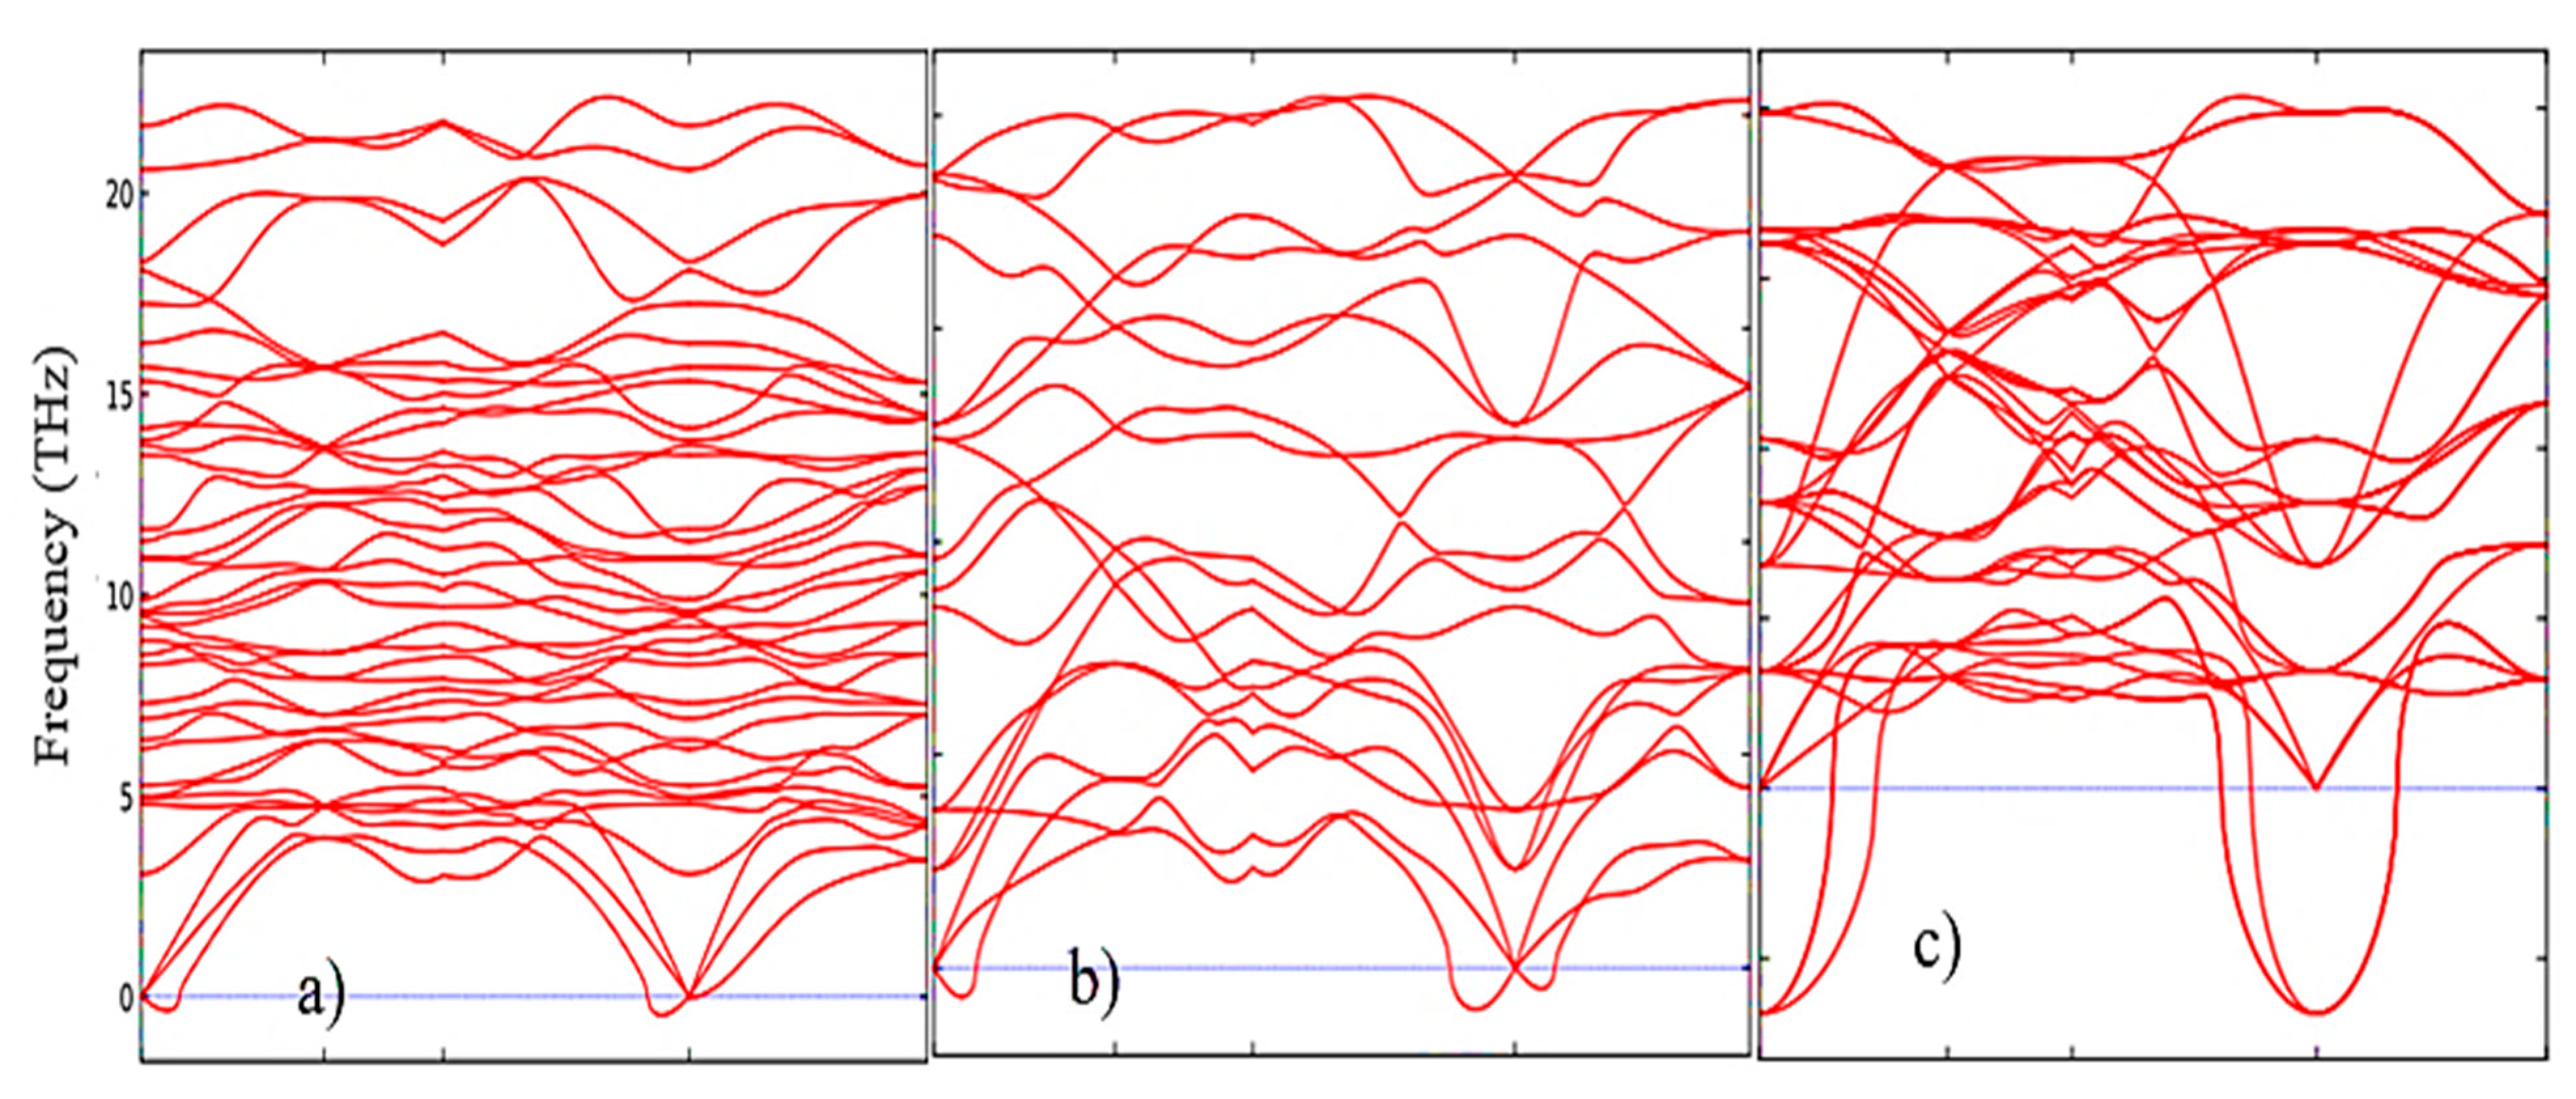
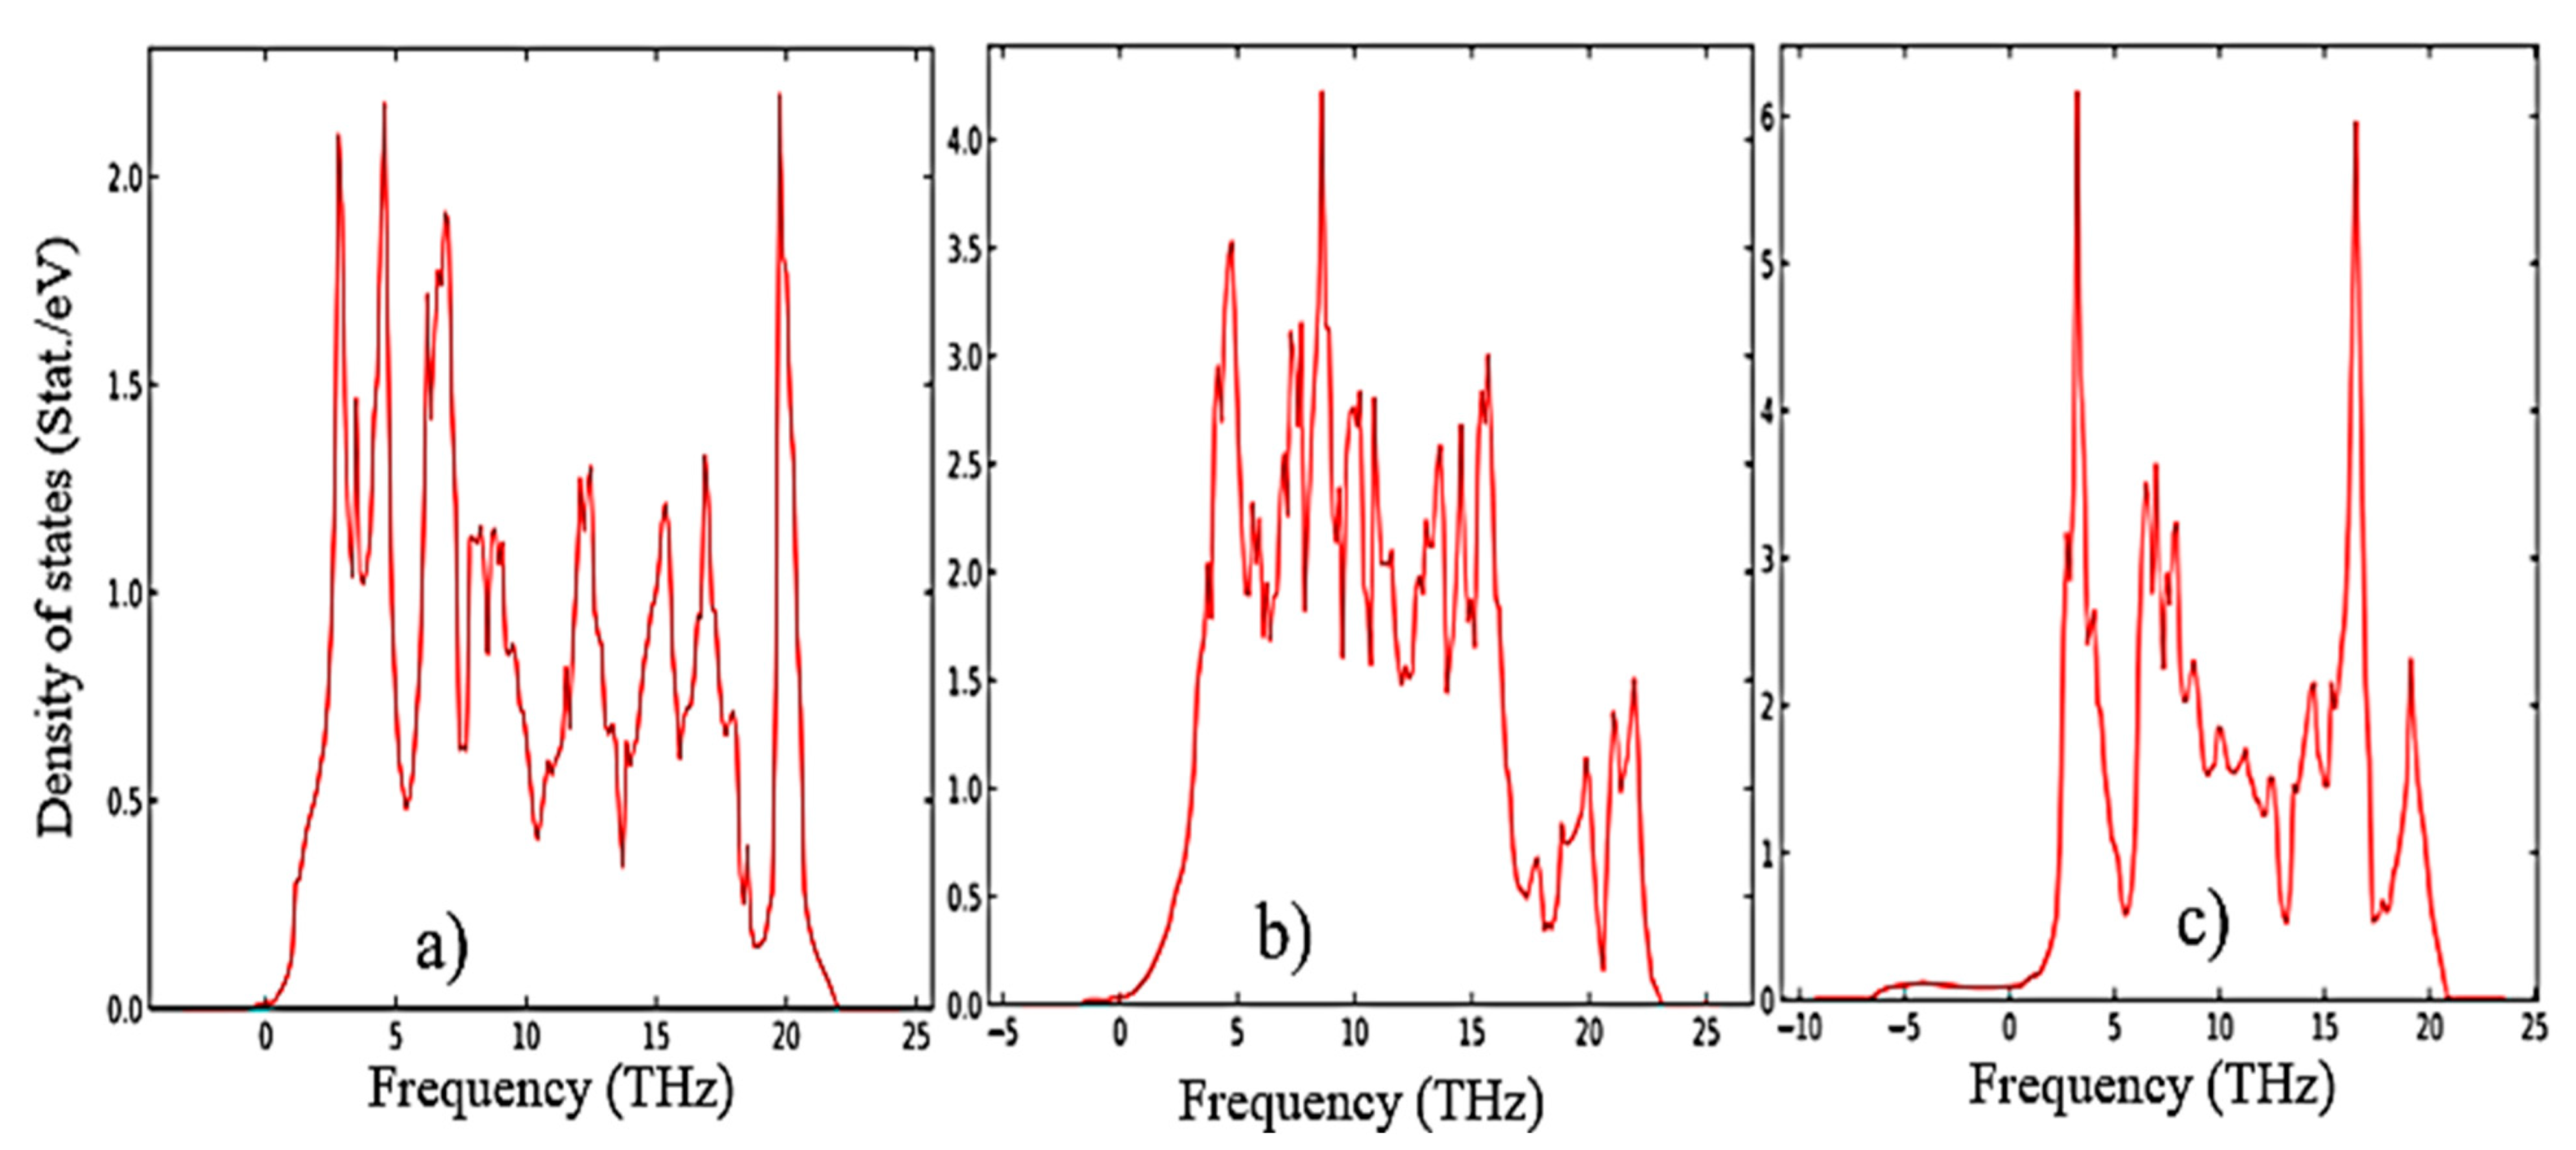
2 phases. This pattern can be clearly observed after analyzing the pattern of phonon frequencies of the three phases of ZrO
2 (
Figure 5a–c), from which it is clearly seen that the monoclinic phase has the smallest negative modes than the other two phases.
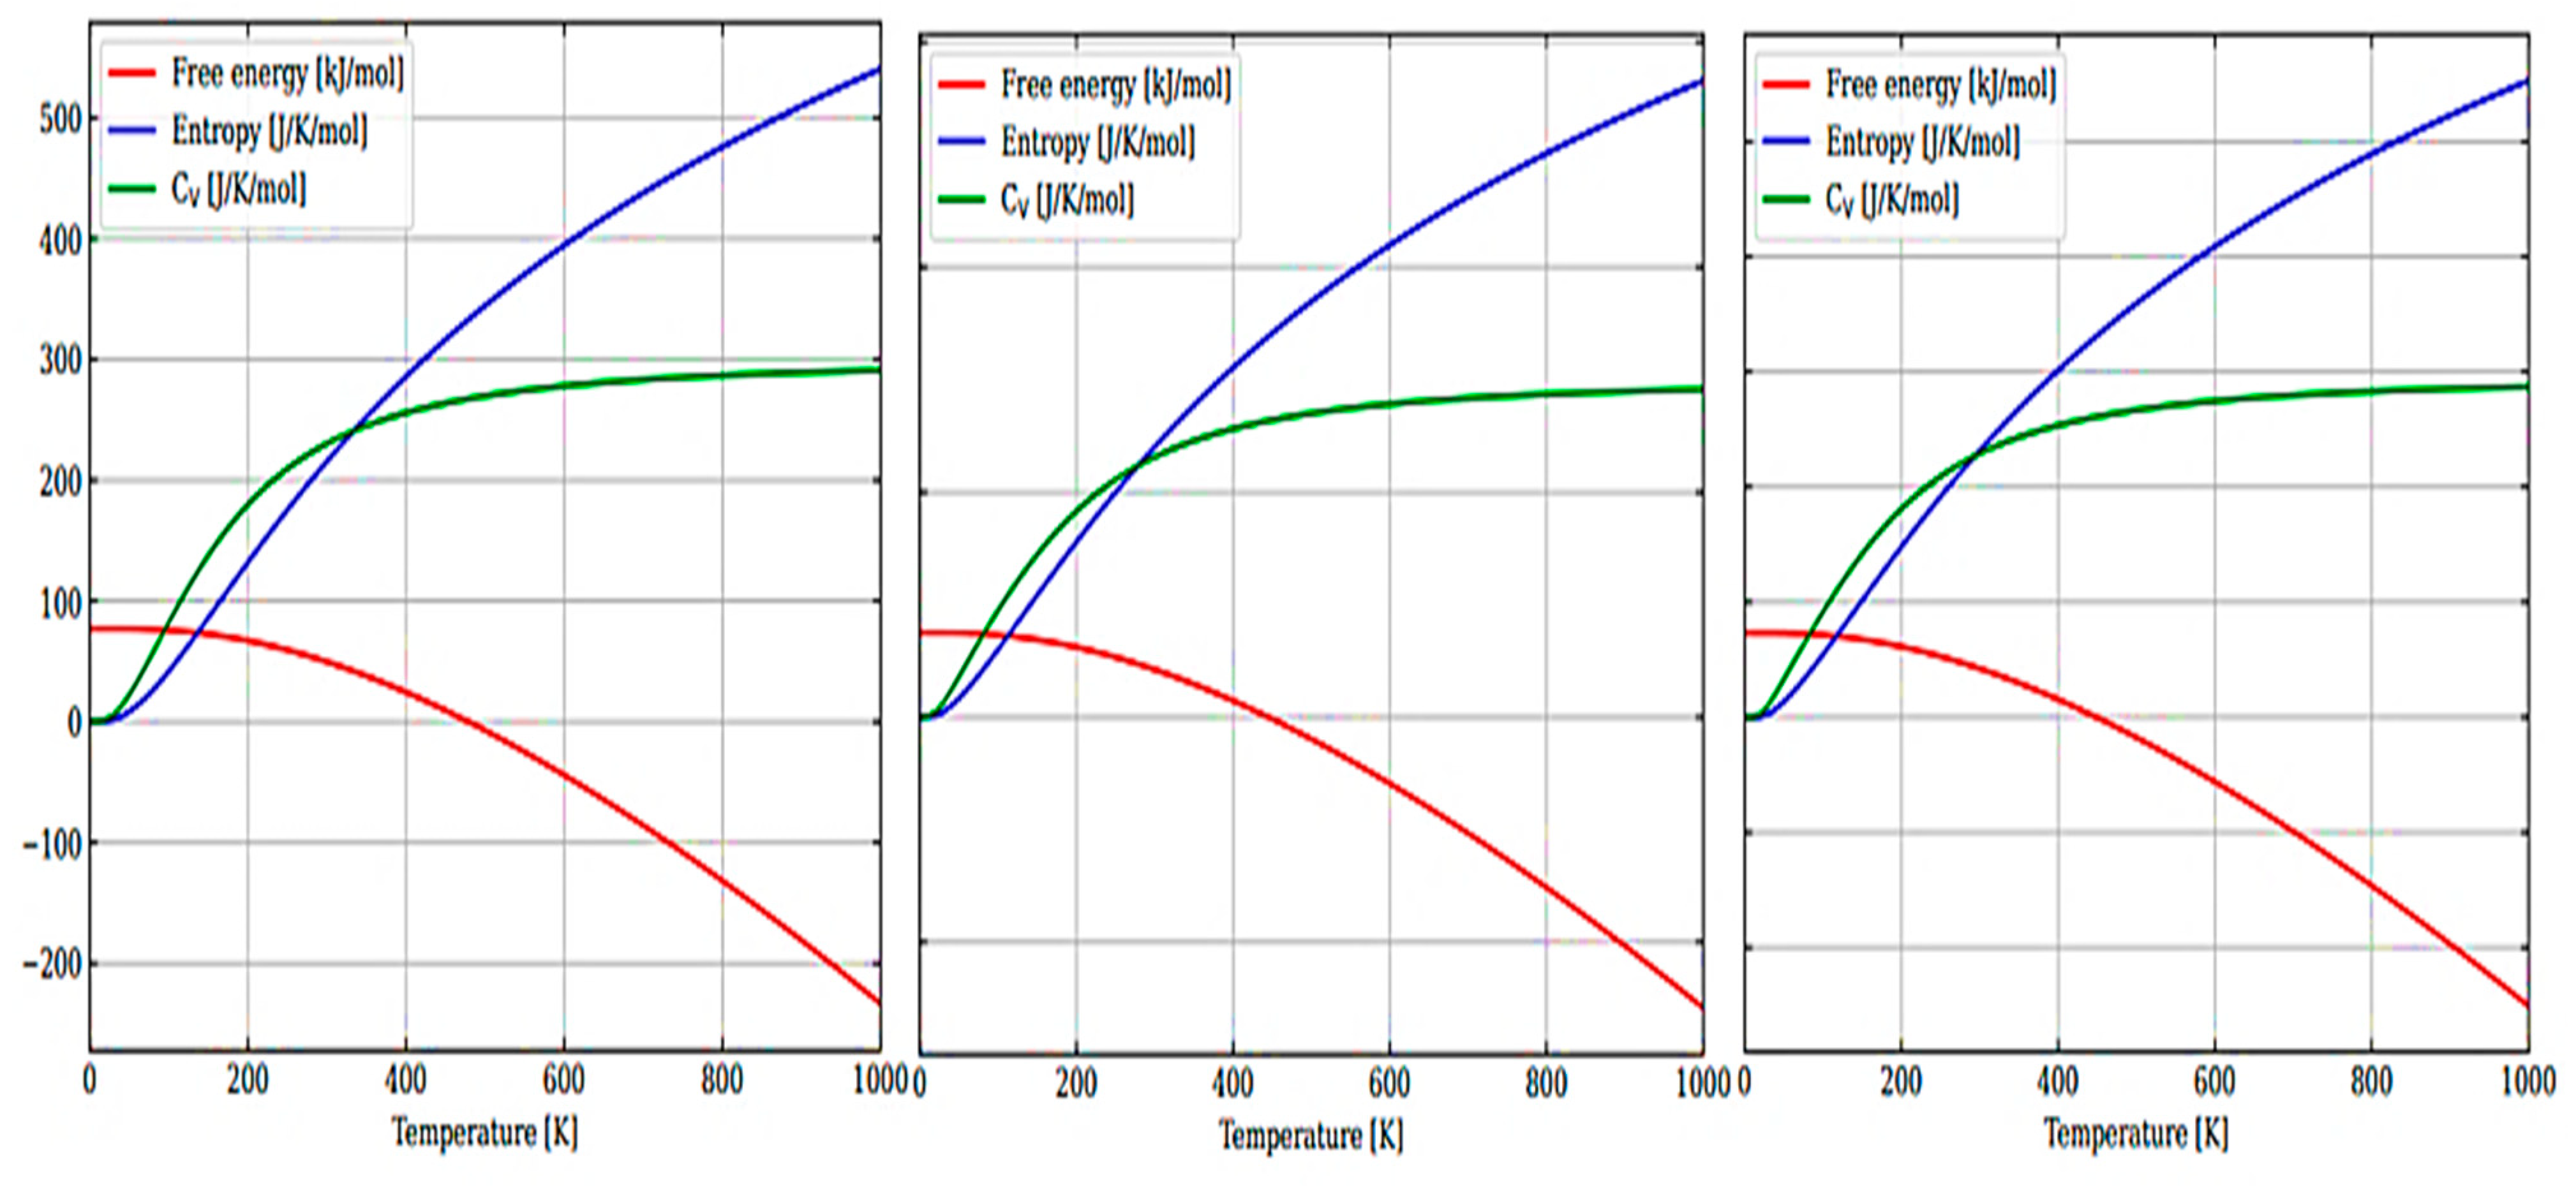
Figure 6(a–c) show the temperature dependence of the free energy, entropy, and heat capacity of a 12-atom supercell for m-ZrO
2, t-ZrO
2, and m-ZrO
2.
The results of calculations of the density of phonon states presented in
Figure 7(a–c) indicate that as the transition from monoclinic to tetragonal and cubic phases, the density of electronic states increases, and they also agree well with the results shown in
Figure 5 and confirm that the monoclinic phase is the most stable among the other phases of ZrO
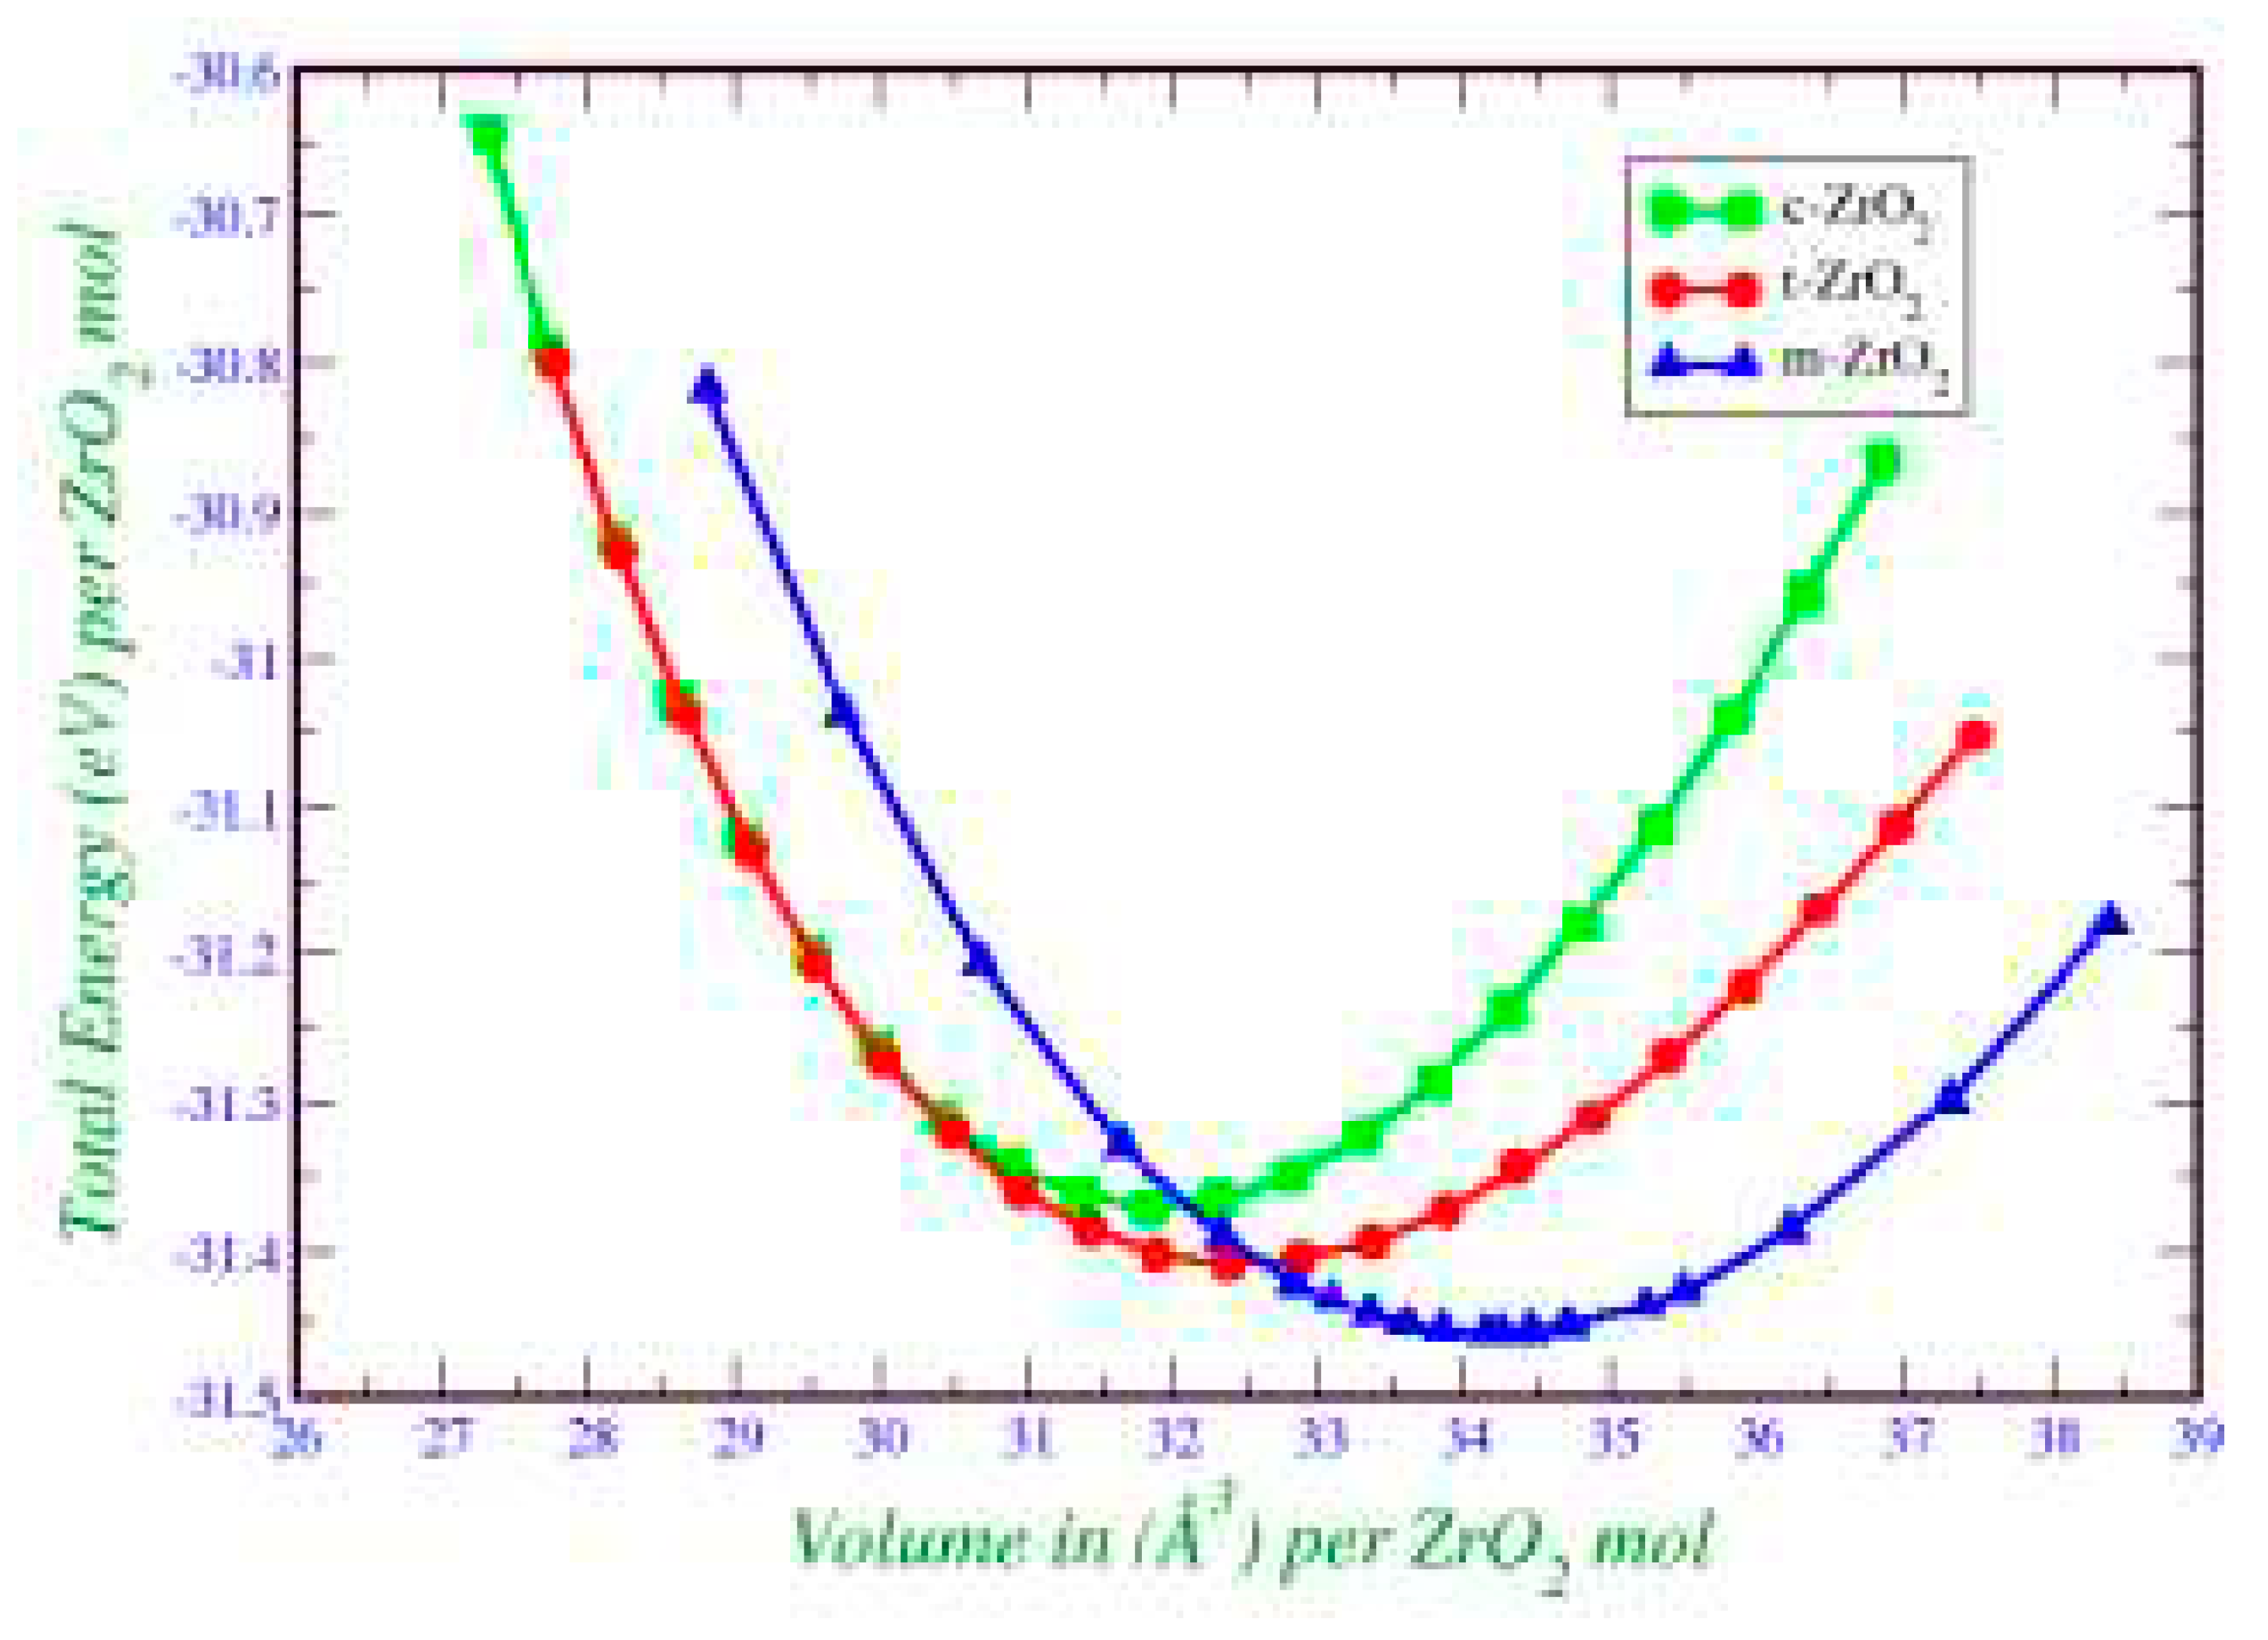
2. This is also confirmed by the result of the Energy/Volume diagram presented in
Figure 8. Therefore, for further stabilization by doping with Y
2O
3, it is reasonable to choose a monoclinic phase.
Next, using the well-optimized structures of the three phases of ZrO
2, we performed calculations to study their electronic properties. Using the GGA and SCAN functionals and the HSE06 hybrid functional, we found the band gaps of these systems (
Table 3), analyzed their orbital structure, and modeled the change in the position of the Fermi level in these systems.
According to the results presented in
Table 3, the GGA and SCAN functionals showed a rather small band gap compared to the HSE06 hybrid functional [
56], which makes it possible to overcome the underestimation of the band gap. On the other hand, it is obvious that the standard SCAN and GGA functionals greatly underestimate the band gap. Given the suitability of HSE06 for estimating the band gap energy, we further used this hybrid functional to describe all the problems associated with the electronic properties of the systems under study.
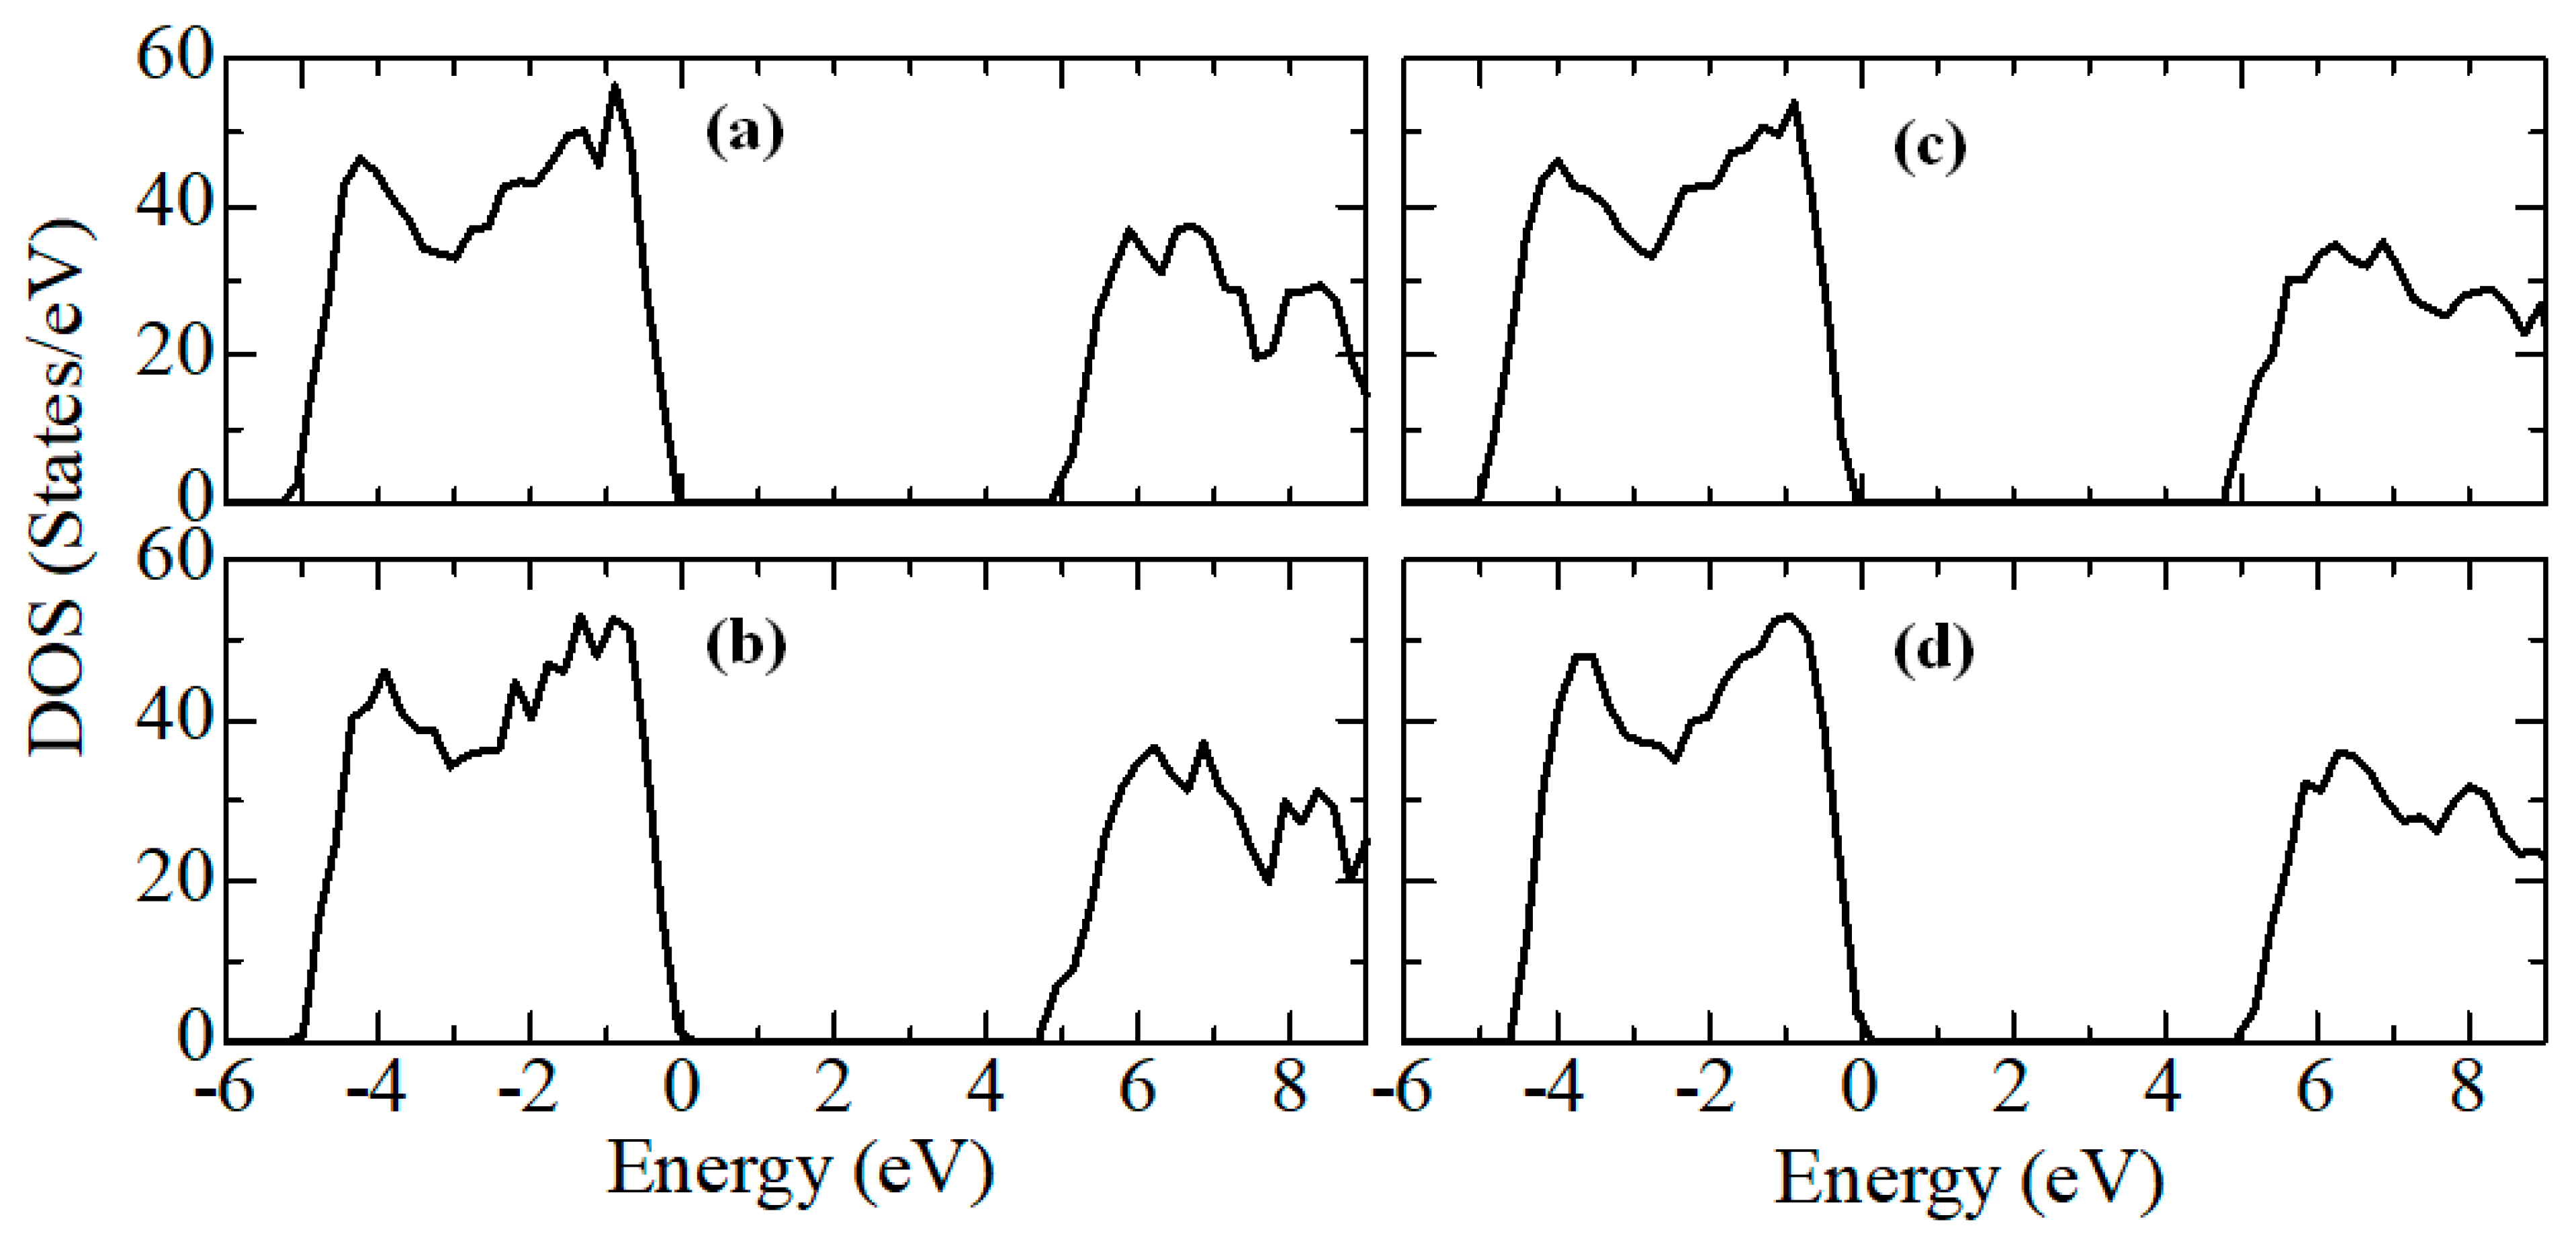
Next, for ZrO
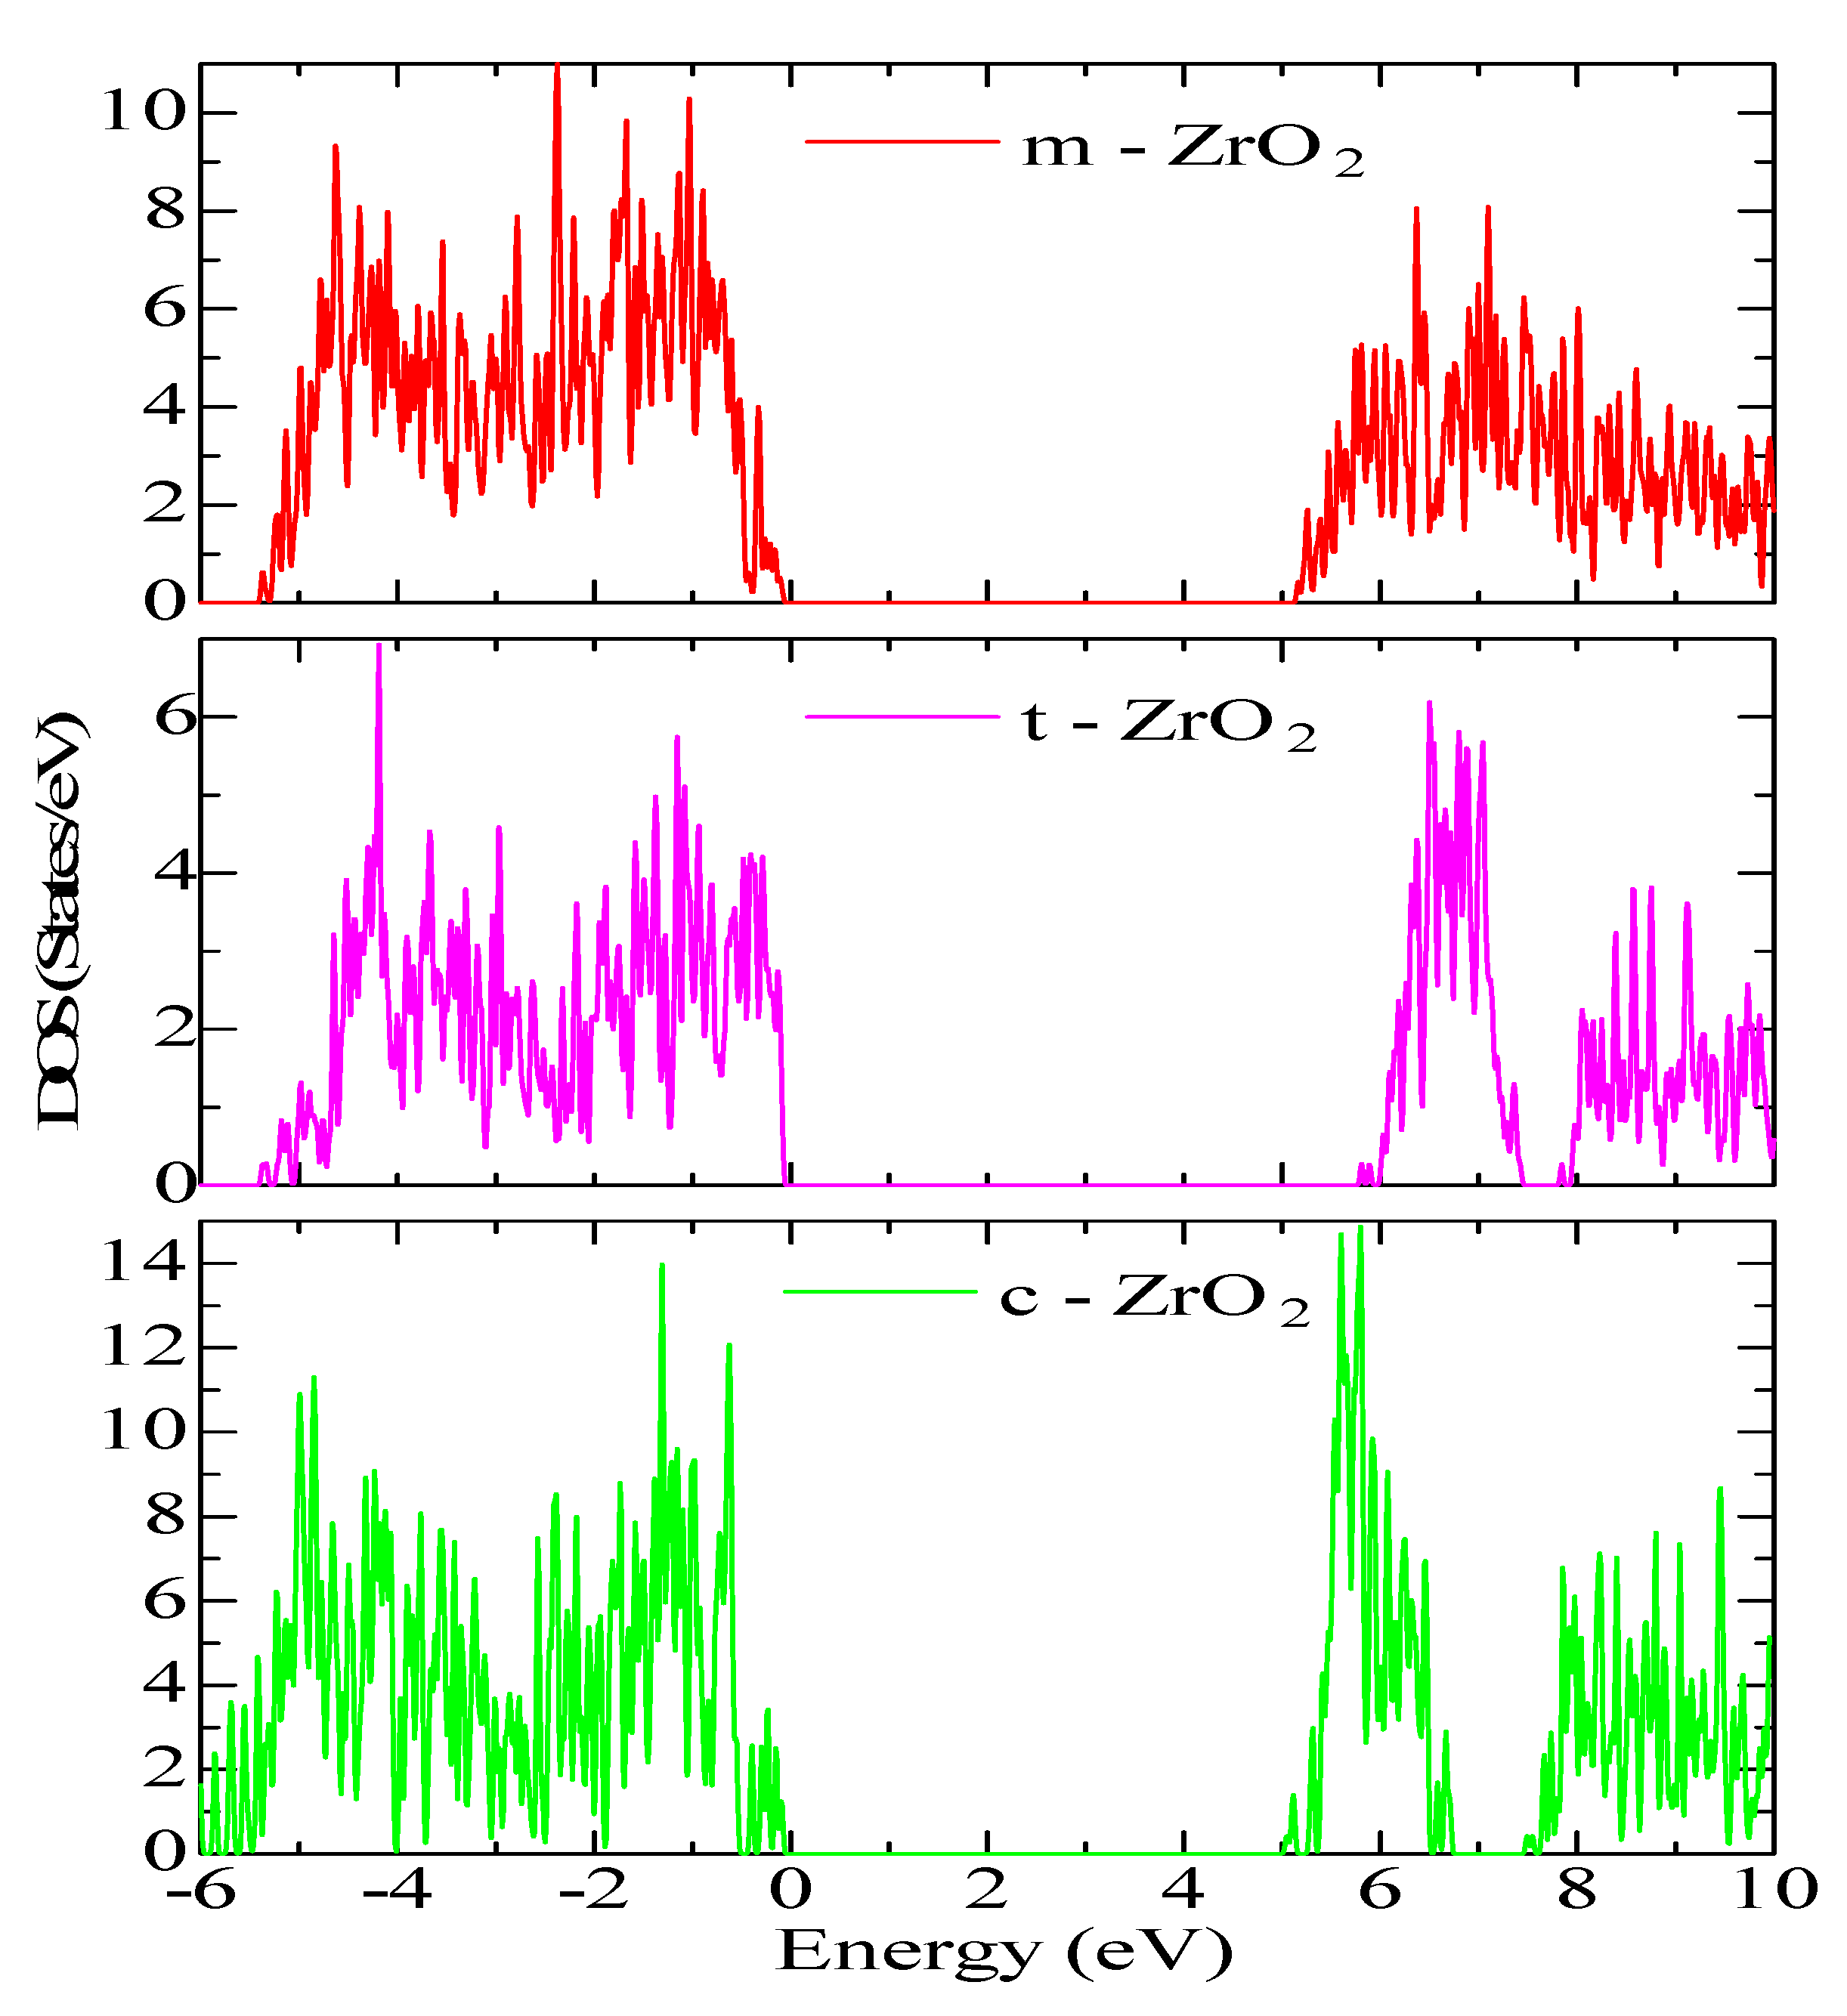
2 structures relaxed using the SCAN functional, calculations were made of the density of available electronic states at the Fermi level (
Figure 9), which is crucial for interpreting the electronic properties of ZrO
2 and the transport characteristics of electronic devices based on this.
According to
Figure 9, the density of electronic states for c-ZrO
2 is somewhat overestimated compared to other phases. In addition, secondary energy gaps are observed in the energy diagram of the tetragonal and cubic phases. Also, this gap increases during the transition from the tetragonal to the cubic phase.
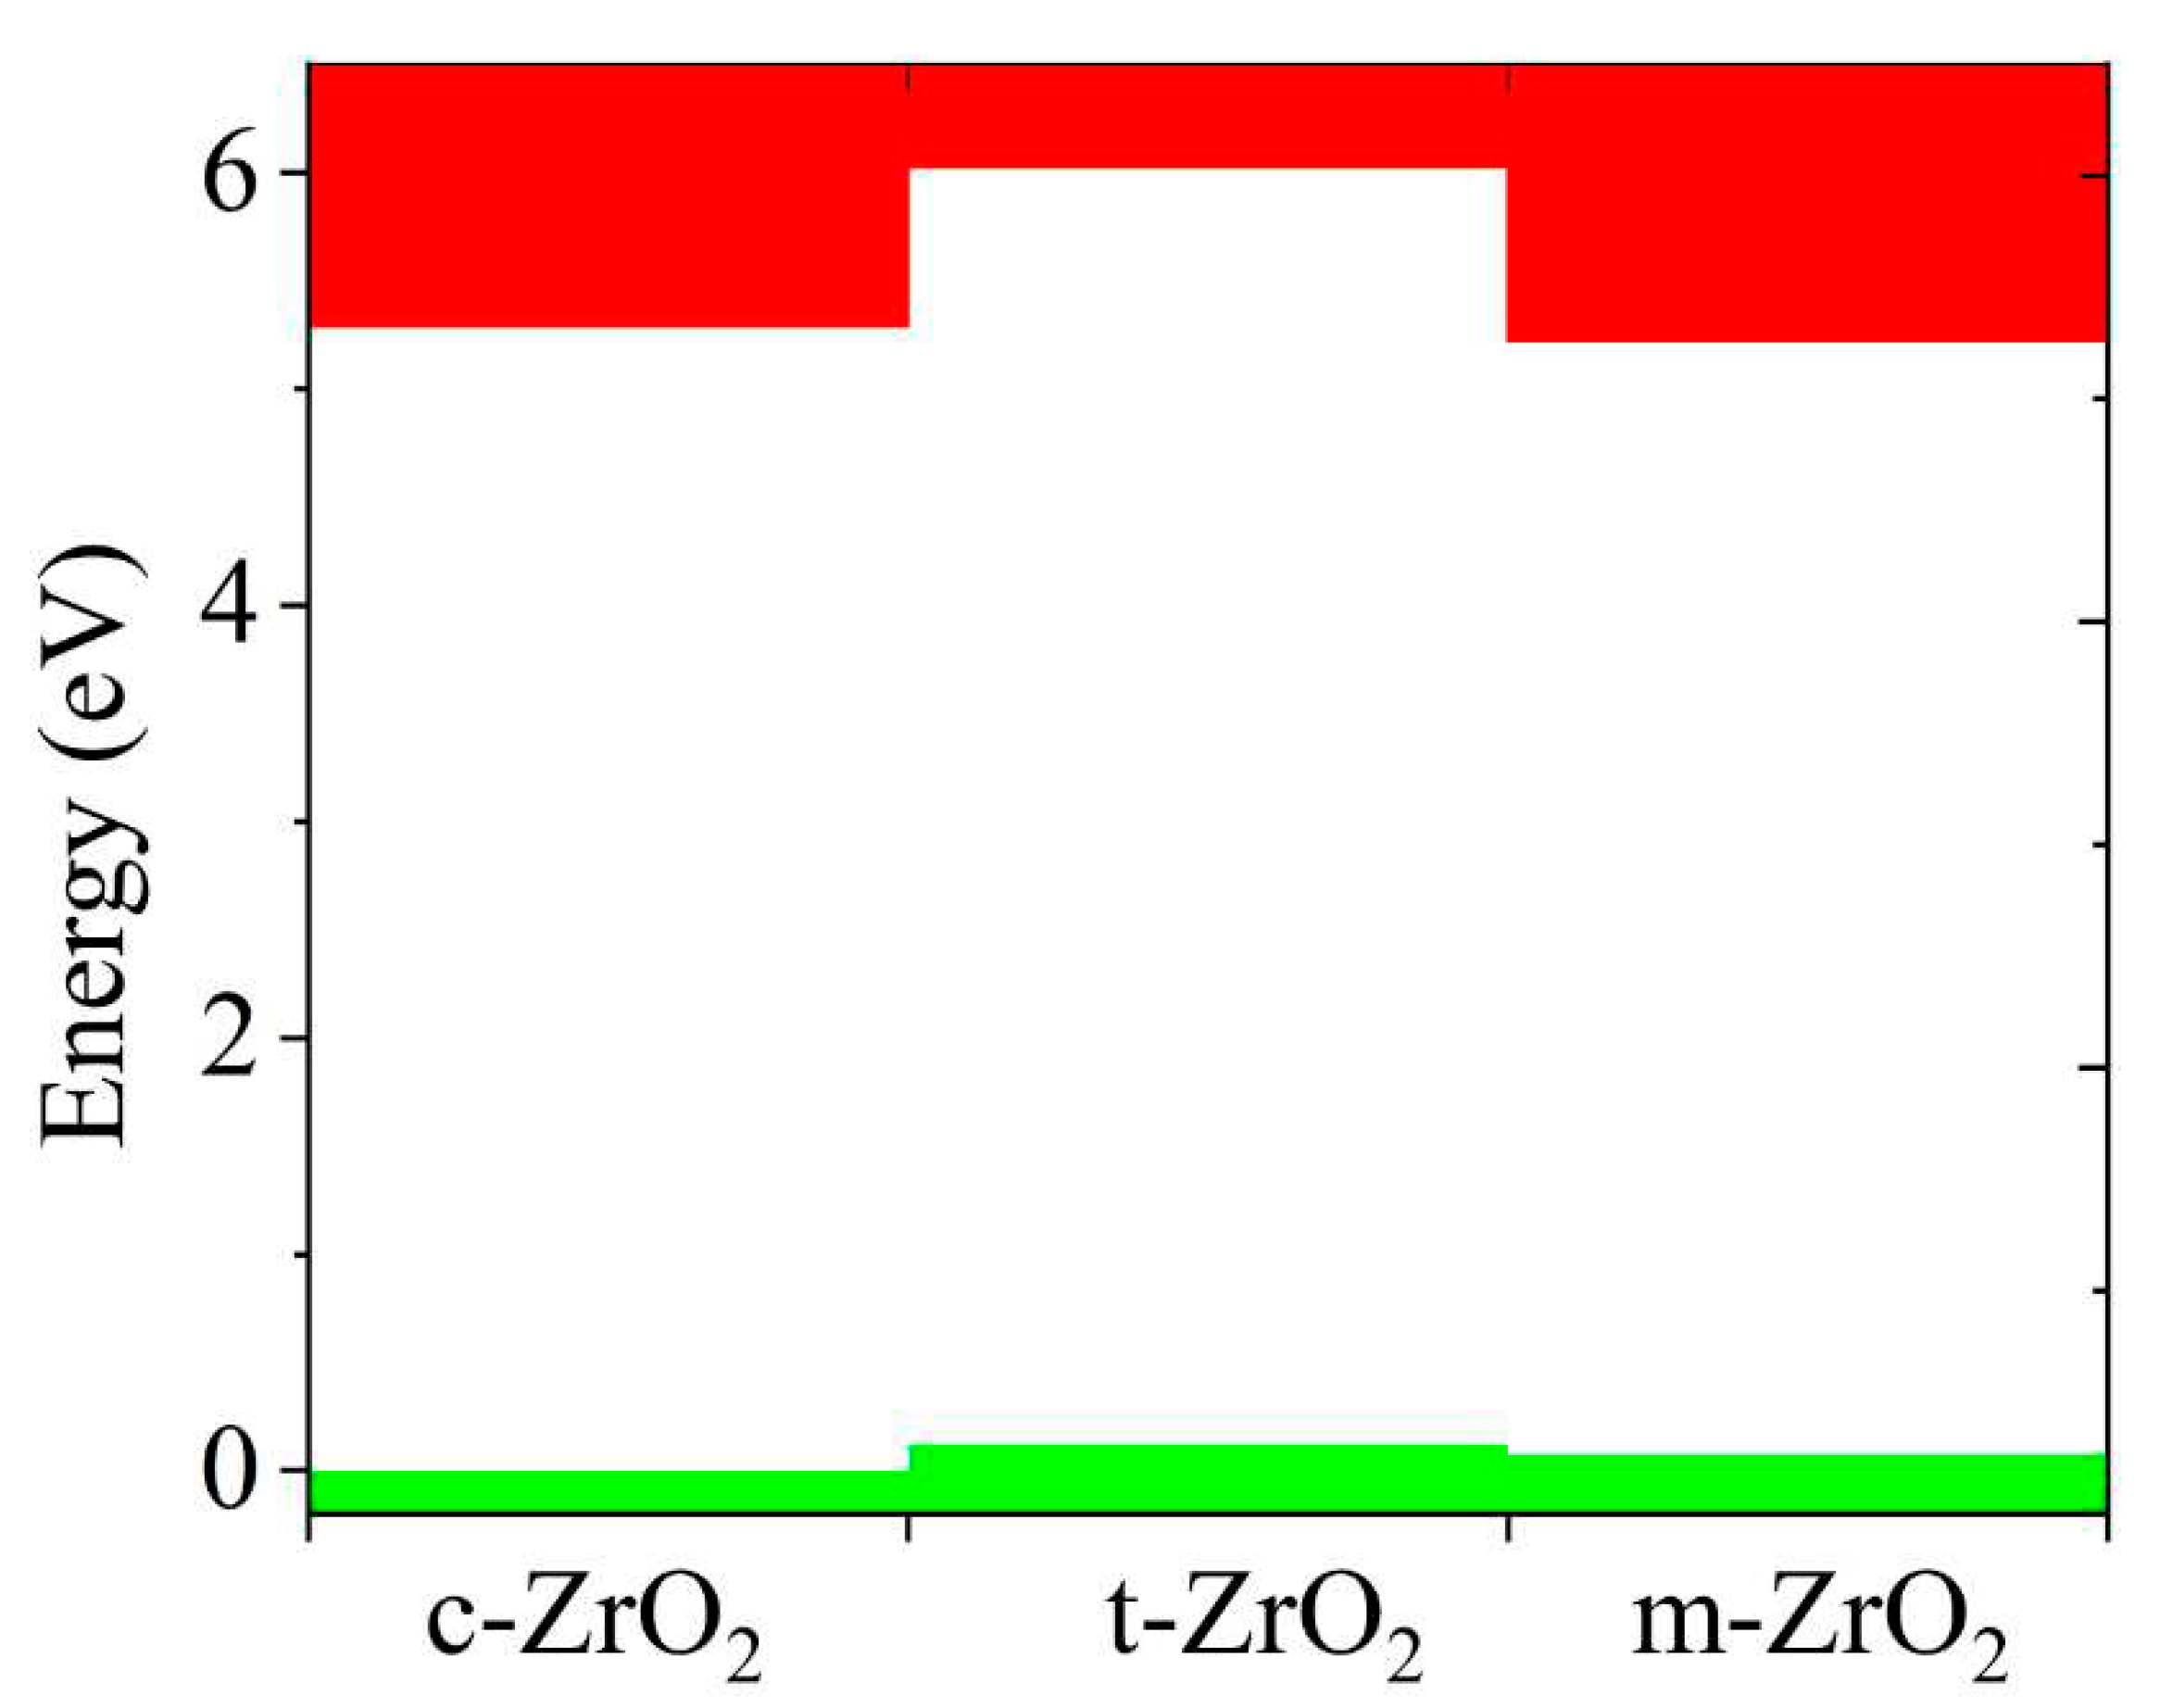
Next, the position of the Fermi level in ZrO
2 crystals and the shift of this level during their phase transformation were determined. As can be seen from
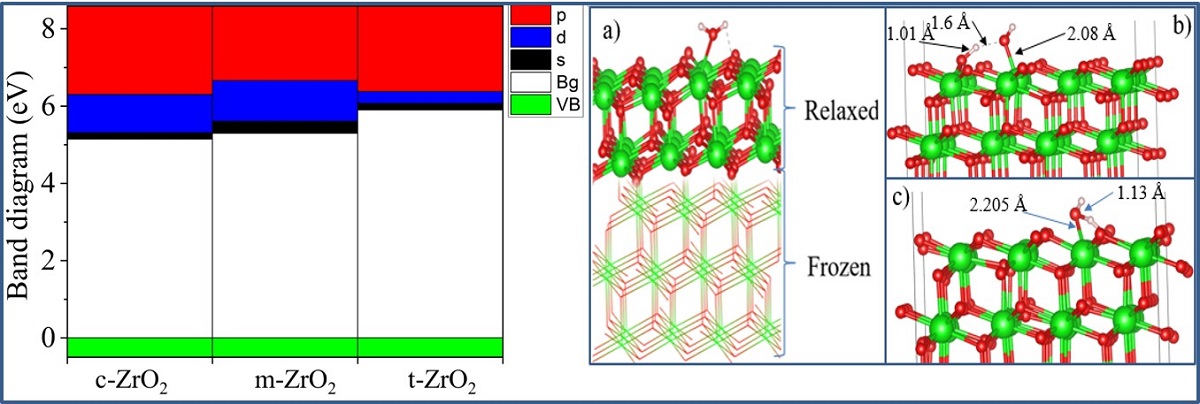
Figure 10, if we take the position of the Fermi level (maximum of the valence band) for the monoclinic phase as a reference point, then during the m-t phase transformation of ZrO
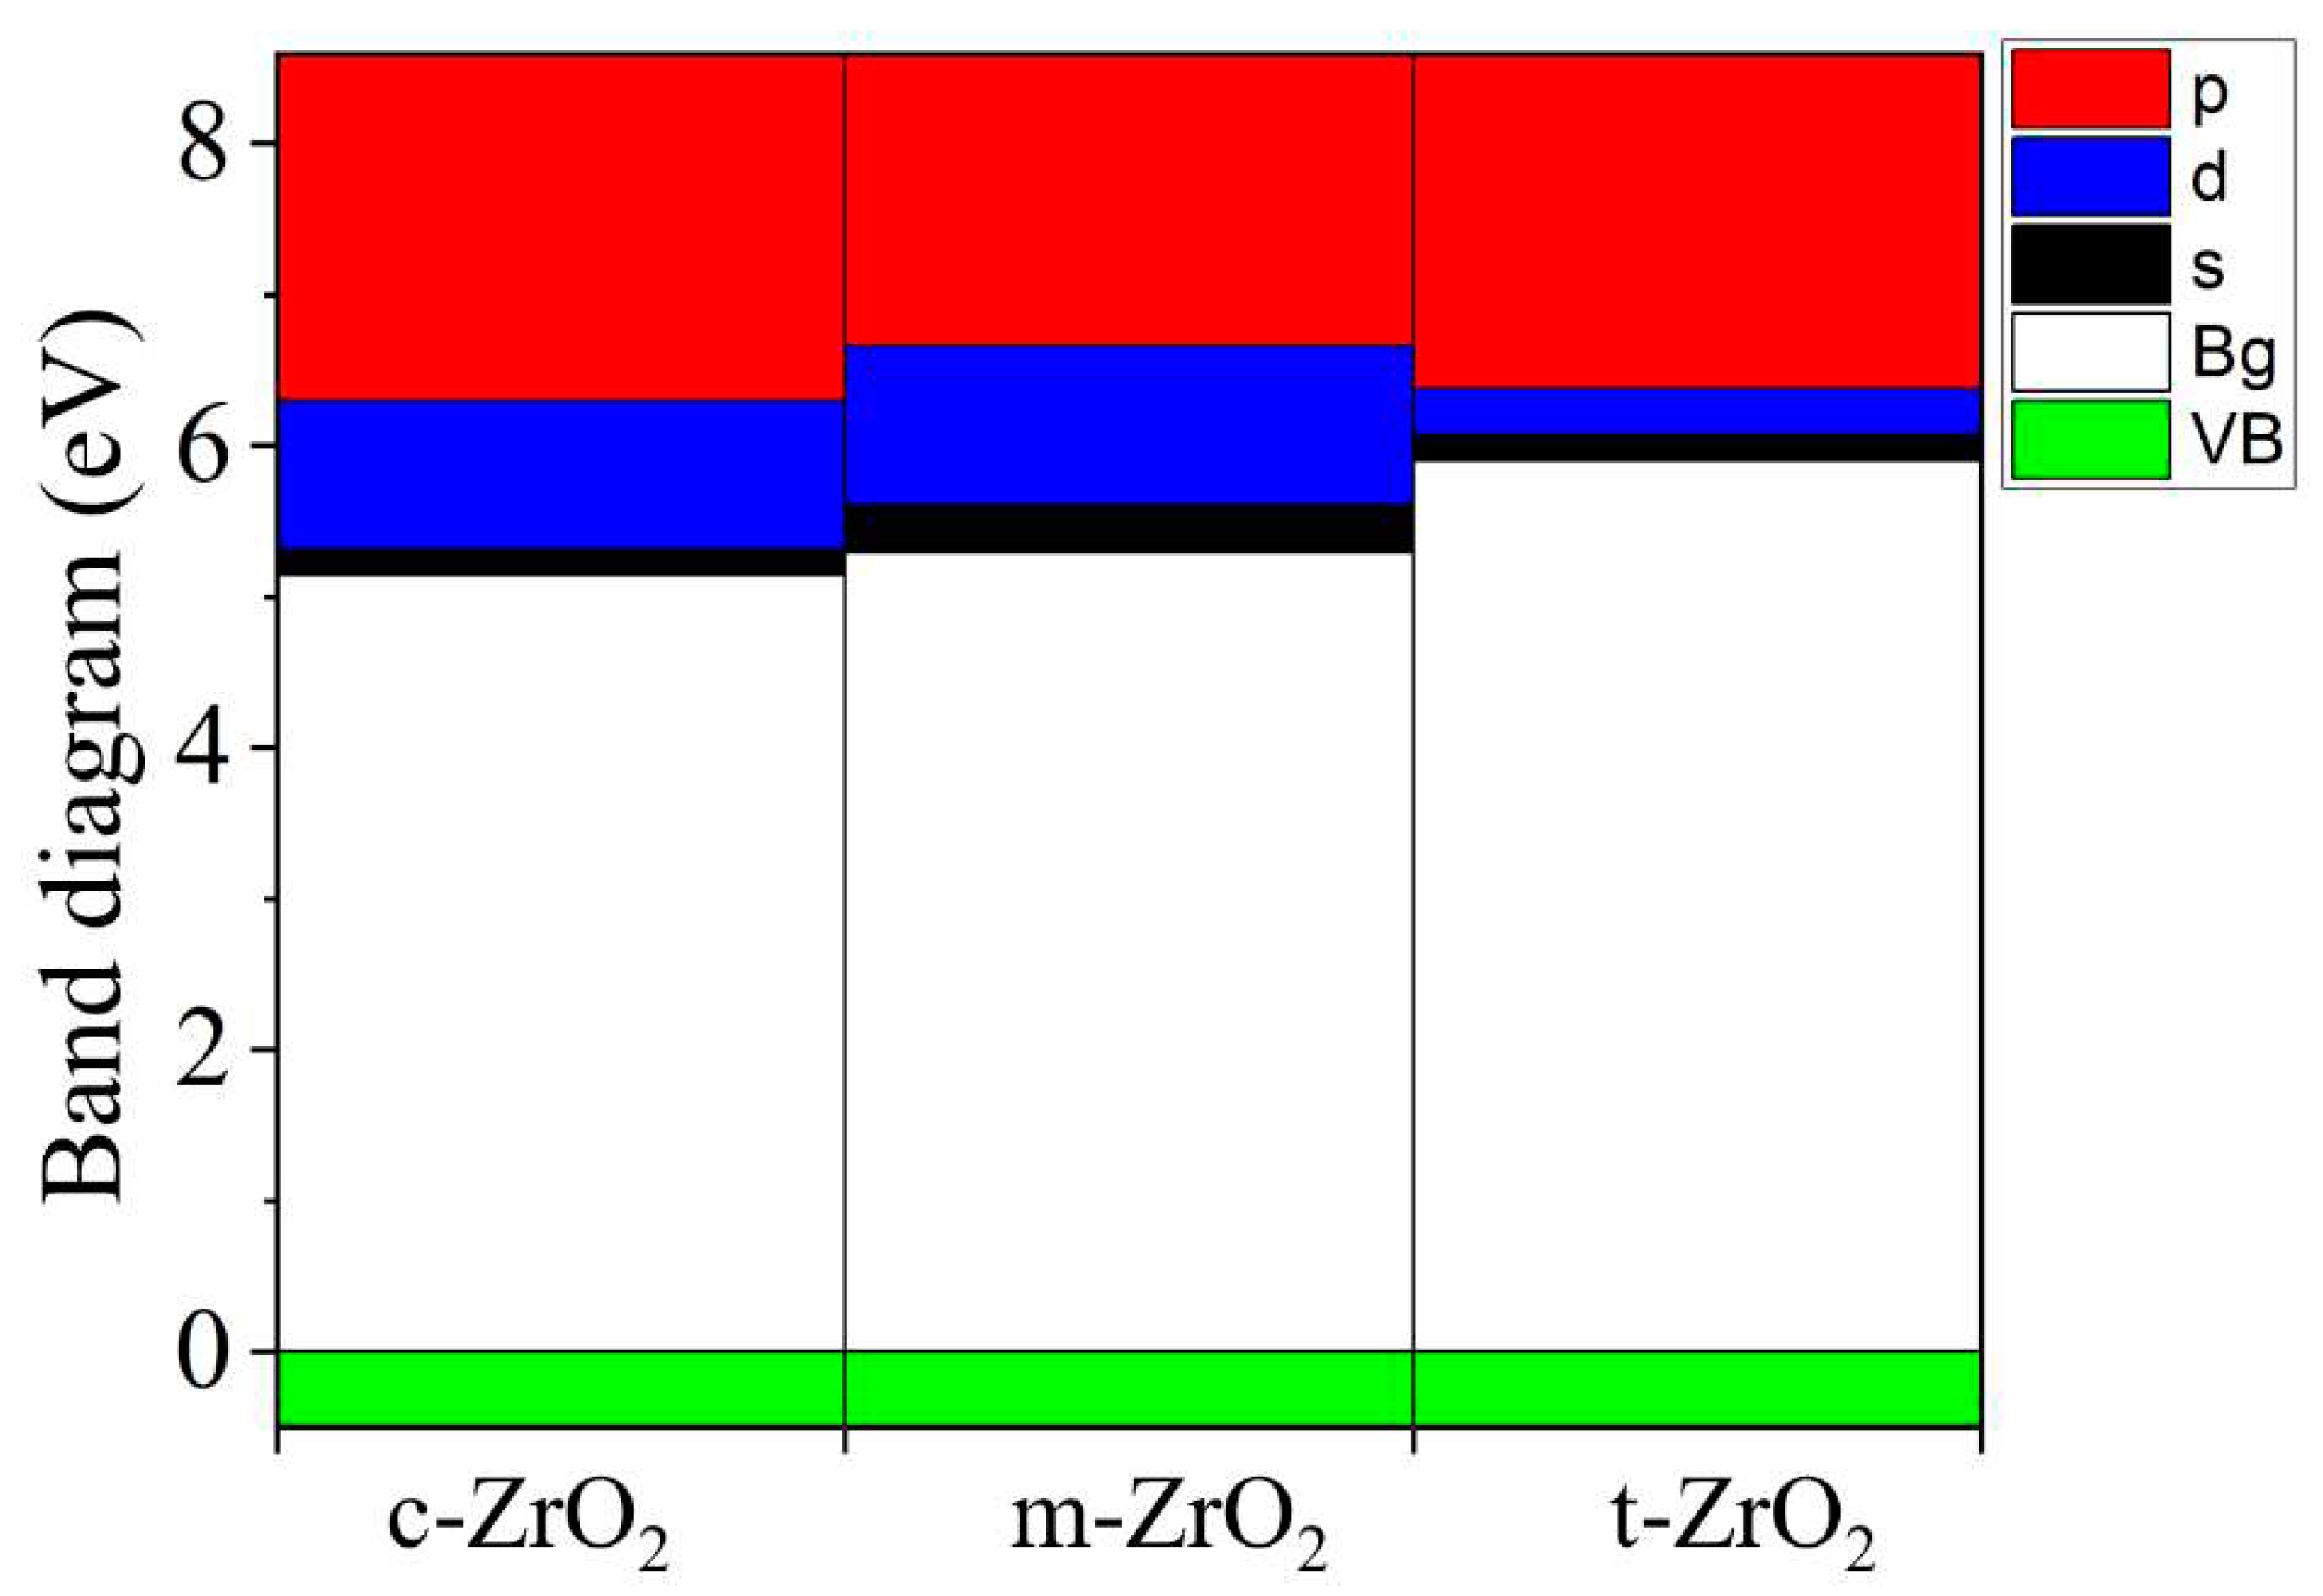
2, this level first shifts by 0.125 eV towards higher energies (towards the valence band), and then , in the t-c section, decrease by 0.08 eV. This is also observed in detail from the band stacking results for the orbital analysis, which are shown in
Figure 11 for the three phases of ZrO
2.
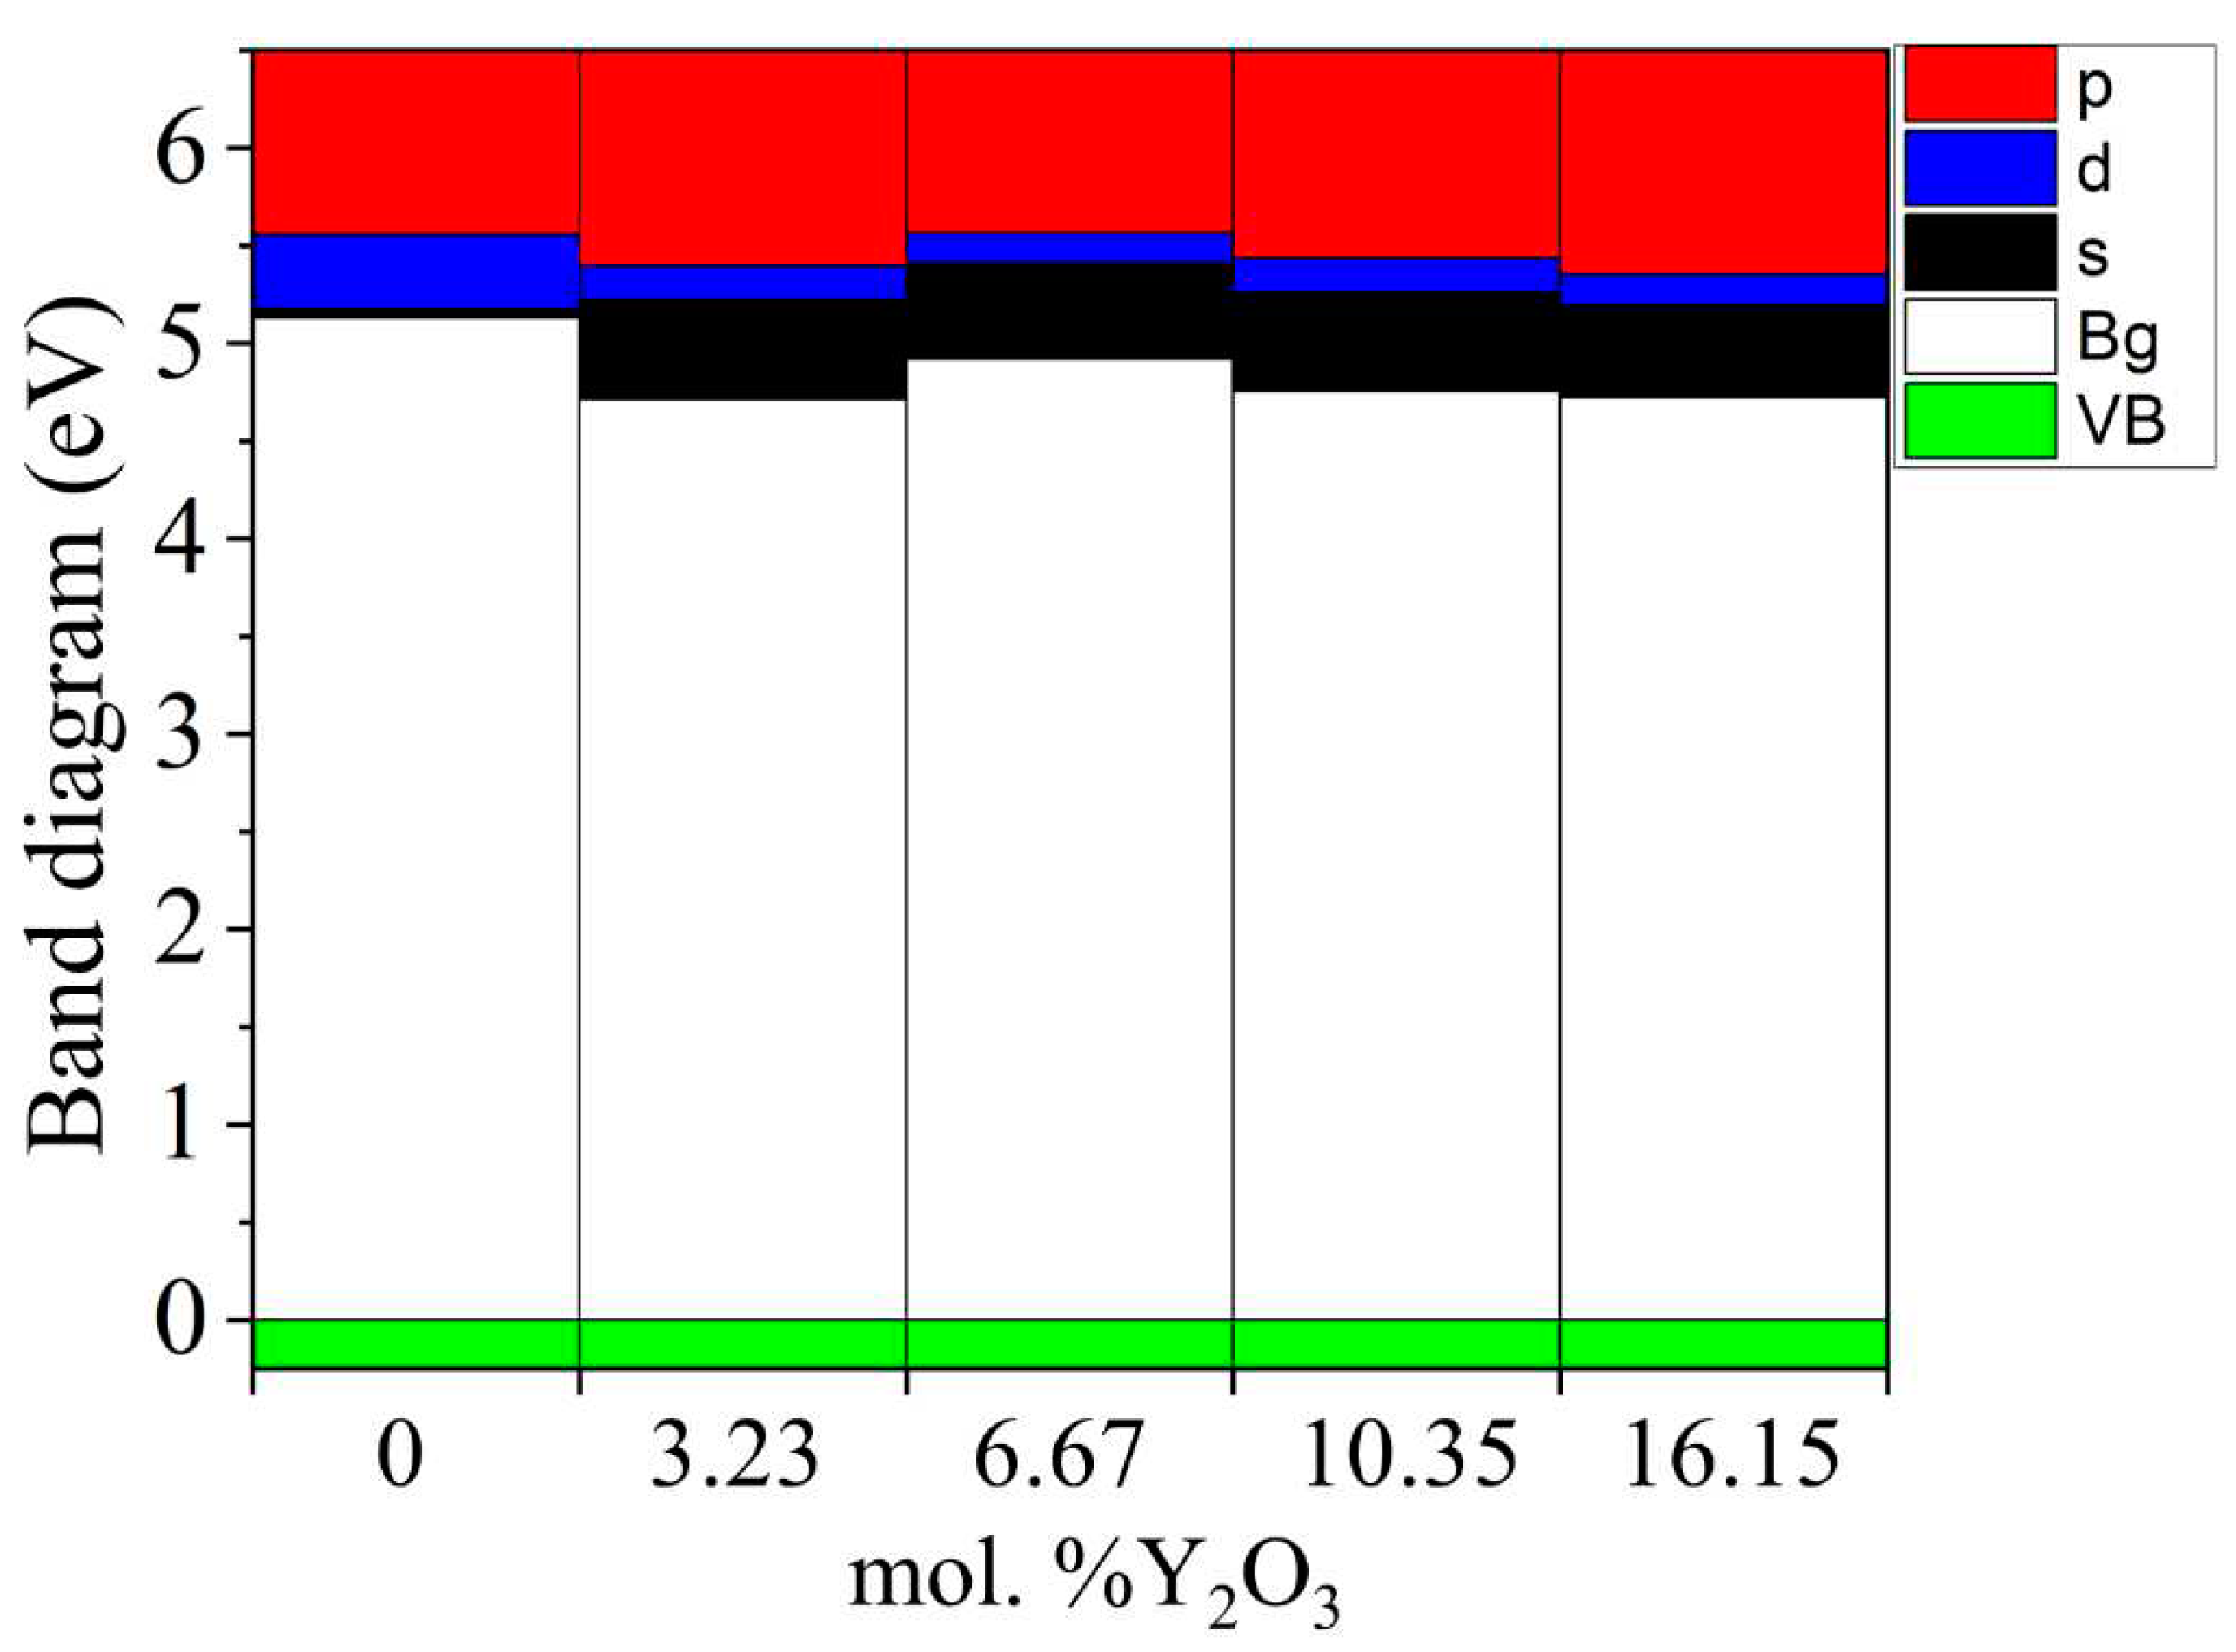
It can be seen that as the transition from the monoclinic to the tetragonal and cubic phases, the contribution of the p orbitals becomes more significant in CB, and the s orbitals make a small contribution, while the d state shows a different trend. It is assumed that this behavior may be associated with a change in the crystal field and covalence of ZrO2 during the phase transformation..
3.2. Structural and energy properties of Y2O3 doped with m-ZrO2. Electronic properties of YSZ.
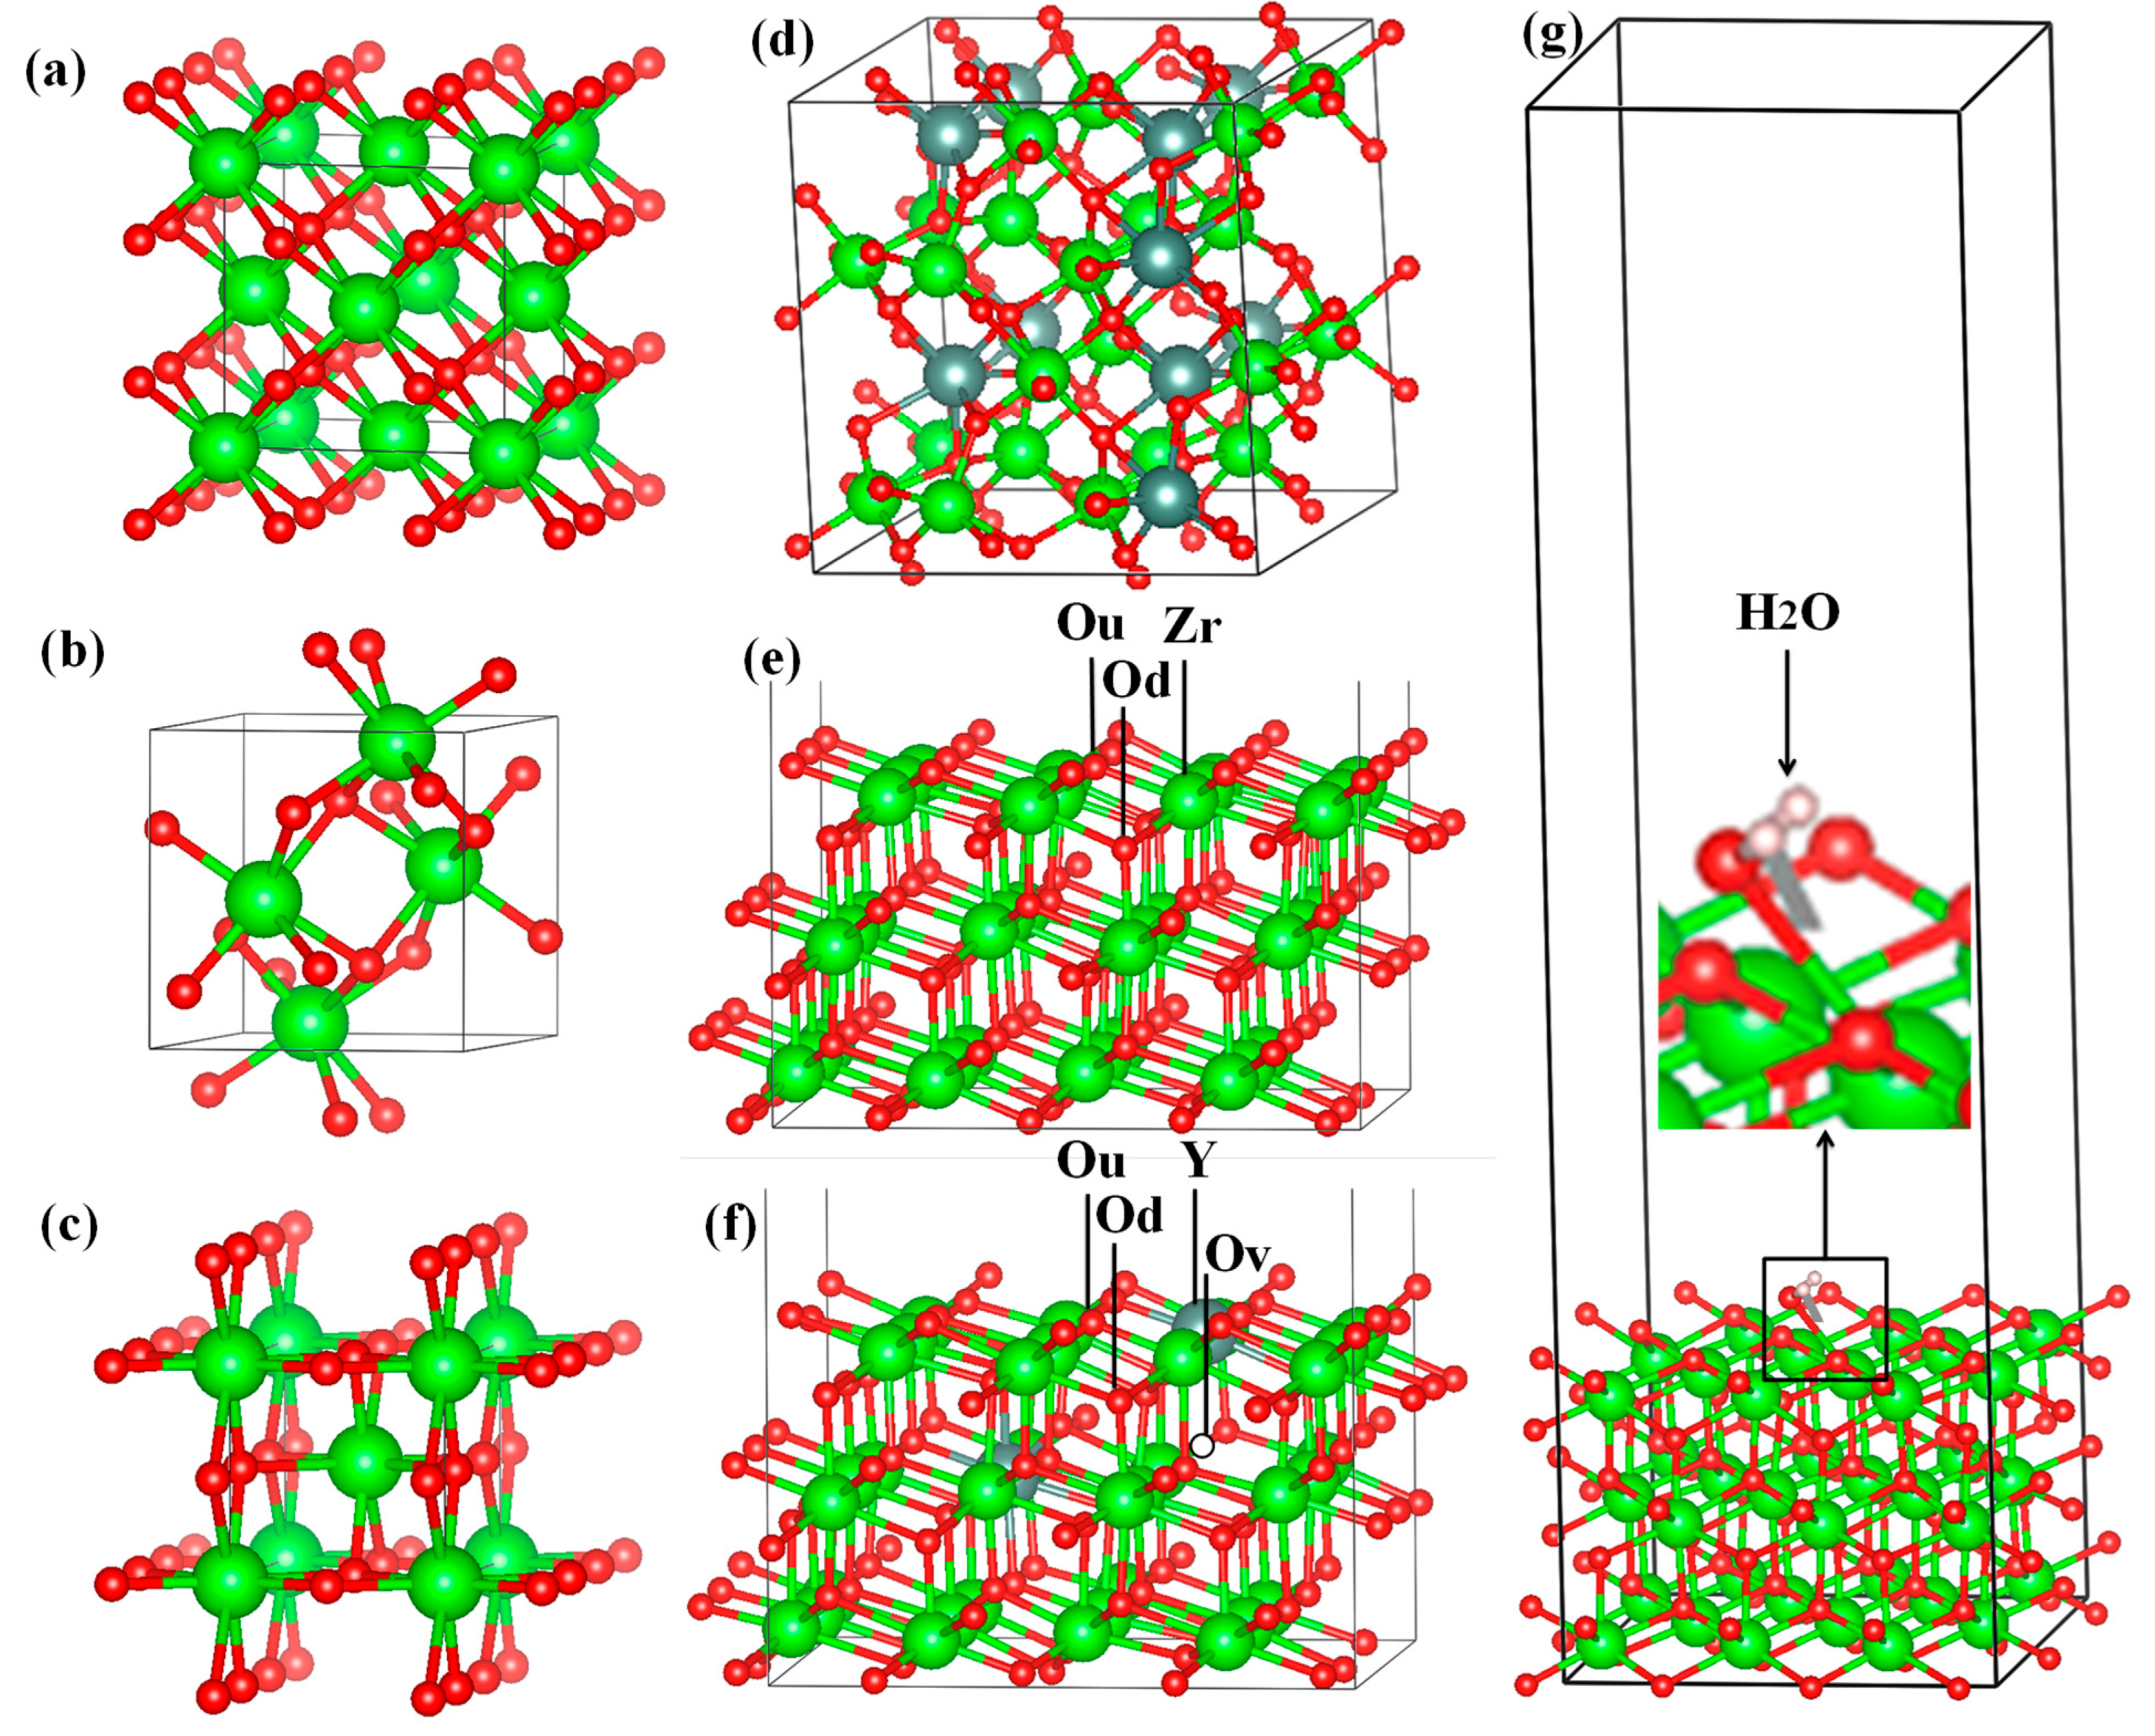
Next, supercells with a size of 2x2x2 of 96 atoms were created to simulate the effect of Y
2O
3 on the stability and electronic properties of the most stable (monoclinic) modification of ZrO
2. To dope yttrium, it was necessary to replace some formula units of Y
2O
3 with ZrO
2 in a 2x2x2 supercell, with each replacement creating one oxygen vacancy. A schematic description of the generation of YSZ structures is given below:
which can be considered as the union of
x ZrO
2 formula units with
k Y
2O
3 formula units located on the initial lattice of
x + k ZrO
2 units, which leads to the formation of m oxygen defects. Based on this, we determine the percentage of vacancies equal to the percentage of yttrium units in the final structure. Thus, starting with a pure 96-atom ZrO
2 supercell, we mainly focused on 4 different concentrations of Y
2O
3 in our calculations (
Table 4).
After the final preparation of the YSZ structures, geometric optimization and doping relaxation of the Y
2O
3 supercell were performed using the GGA and SCAN potentials.
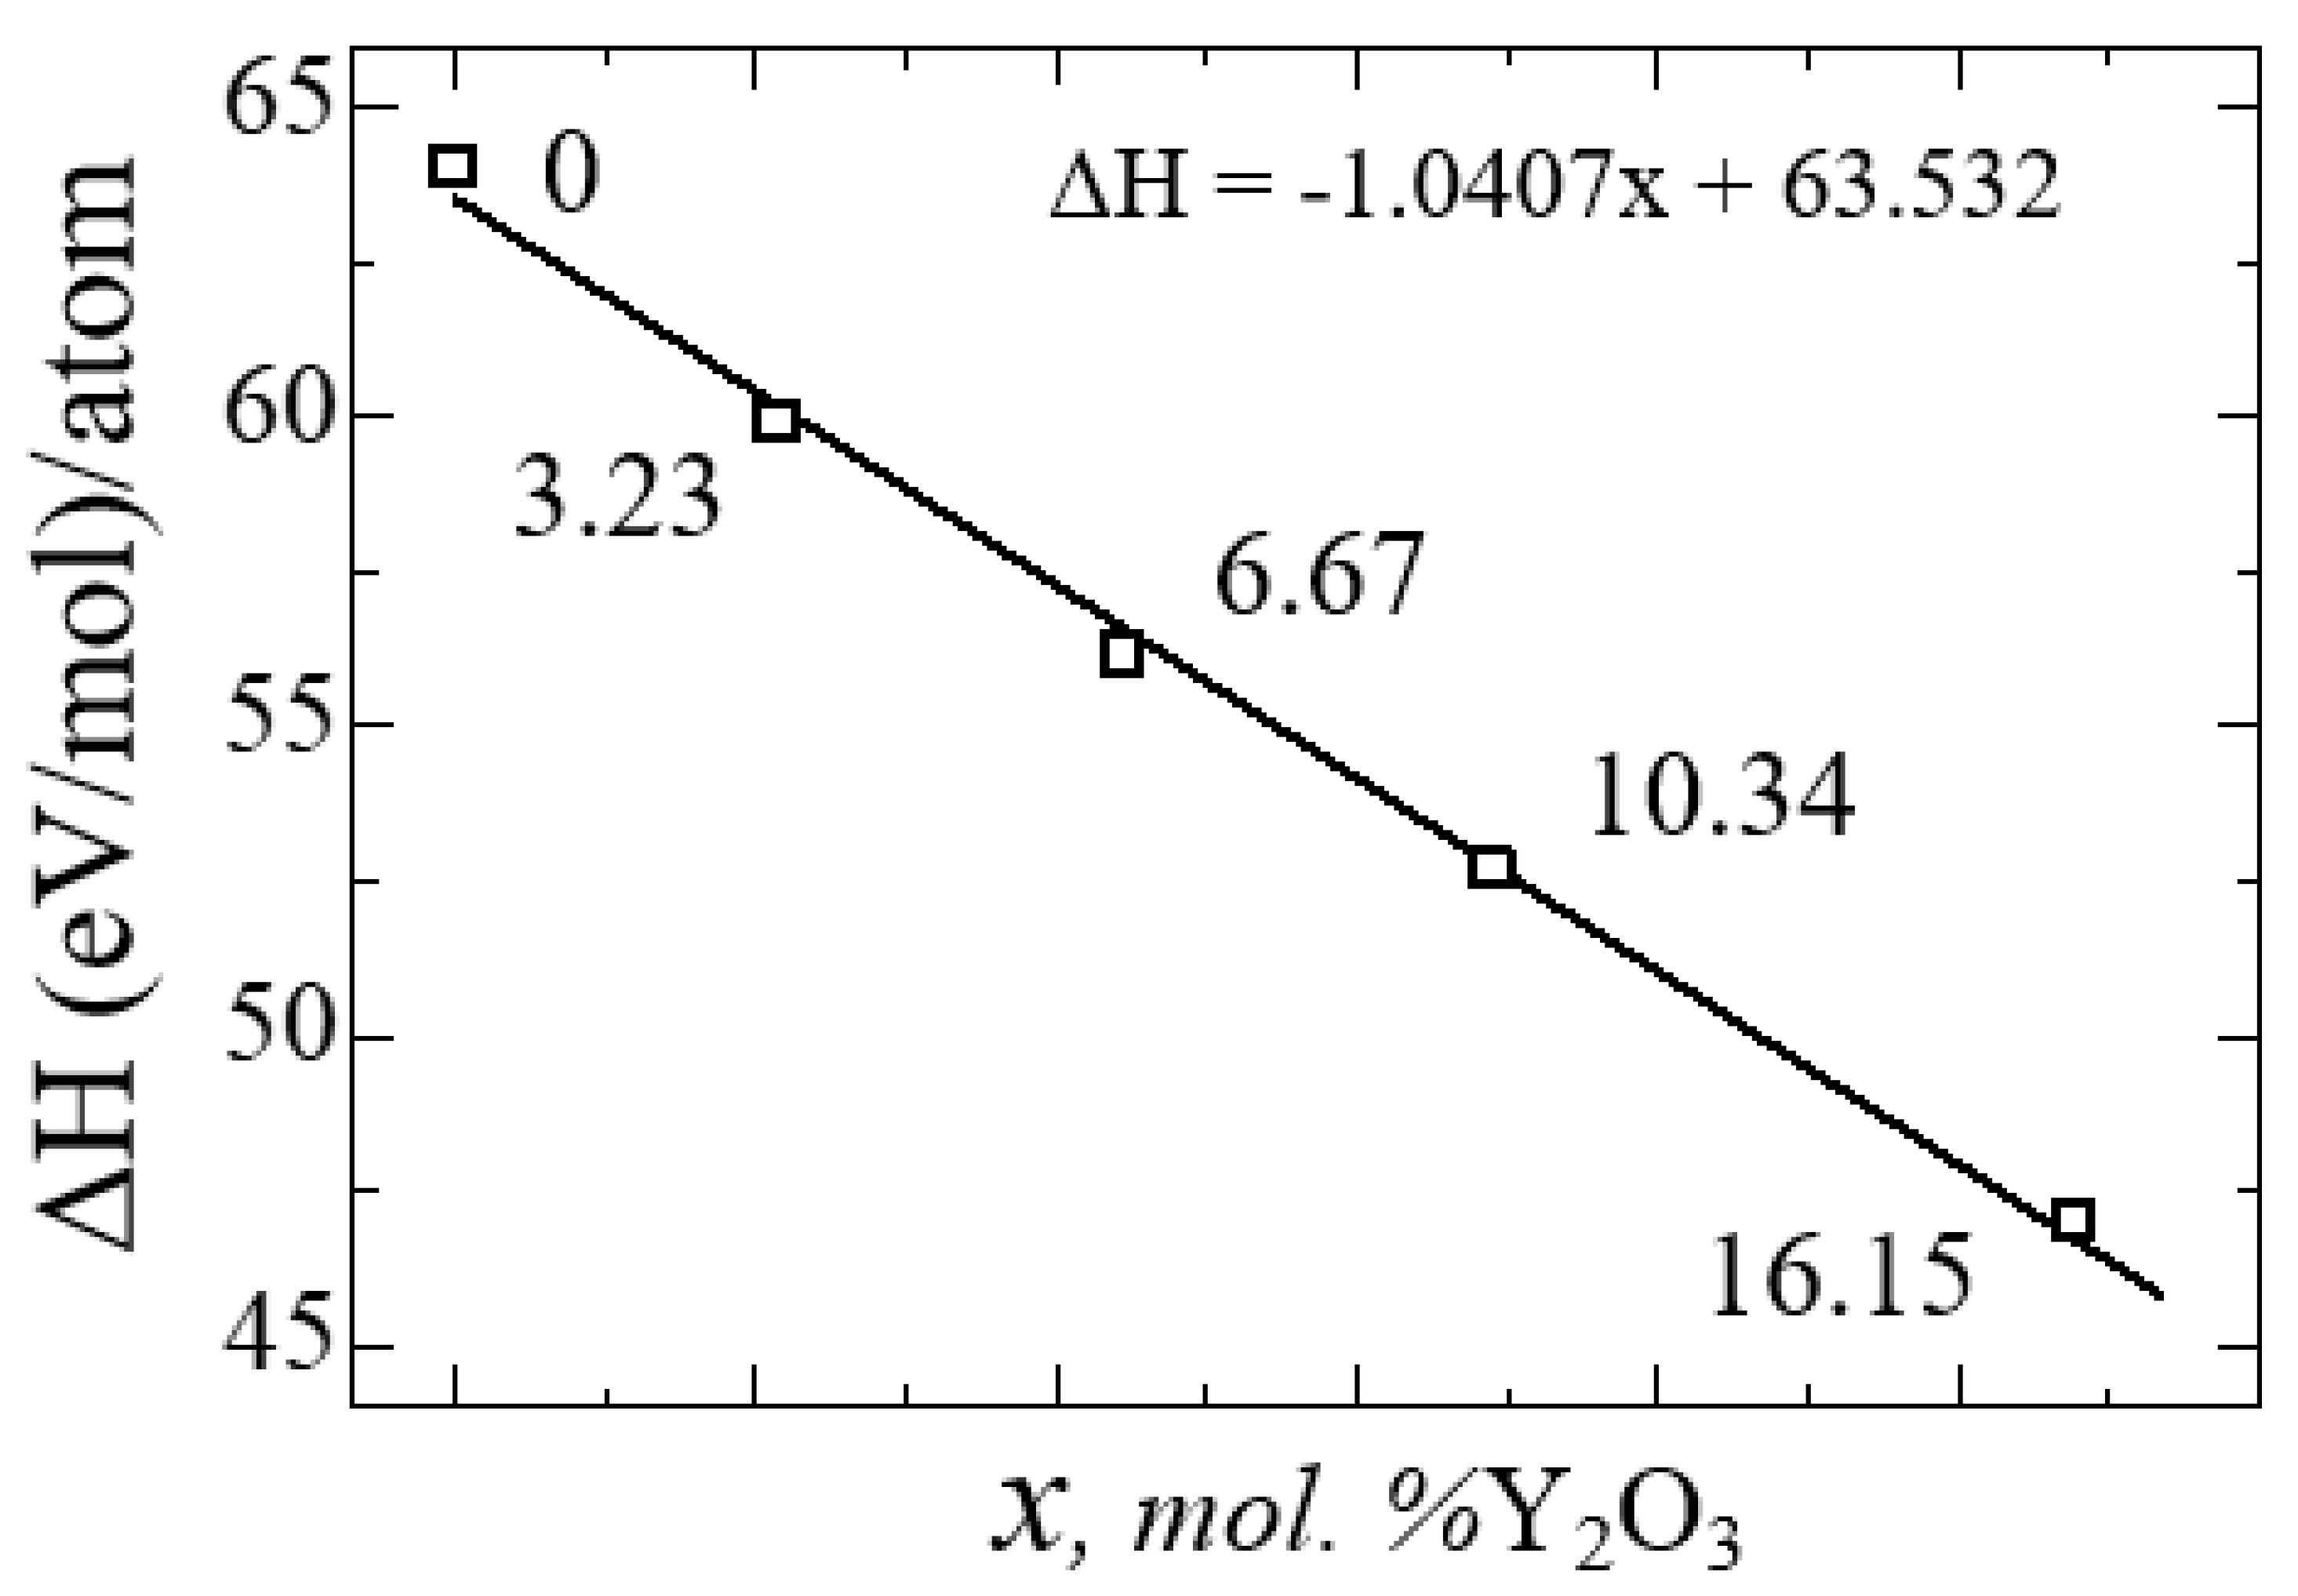
Figure 12 shows a diagram of the dependence of the change in the enthalpy of formation of YSZ on the concentration of Y
2O
3, calculated by Formula 4:
from which it is clearly seen that doping with Y
2O
3 reduces the enthalpy and leads to the stabilization of zirconium dioxide. The empirical formula obtained by the least squares method says that the enthalpy of formation energy decreases linearly according to the law ΔН = -1.0407x + 63.532, where x is the concentration of Y
2O
3 in YSZ.
Thus, with an increase in the Y2O3 concentration, the number of oxygen vacancies in YSZ increases, and the growth of these O vacancies is considered as a stabilizing mechanism of the monoclinic zirconium phase, as evidenced by a decrease in the enthalpy of formation.
Numerical values of the enthalpy formation energy are given in
Table 6.
Table 5 shows the geometric parameters of the ZrO
2 and YSZ supercells at various Y
2O
3 concentrations after thorough relaxation using the SCAN functional.
Table 5.
Lattice parameters of 2x2x2 ZrO2 and YSZ supercells at various Y2O3 concentrations.
Table 5.
Lattice parameters of 2x2x2 ZrO2 and YSZ supercells at various Y2O3 concentrations.
| System |
Lattice parameters |
Structure |
| a (Å) |
b(Å) |
c (Å) |
α(◦) |
β (◦) |
γ(◦) |
| 0 |
10.382 |
10.491 |
10.757 |
90 |
99.64 |
90.00 |
m - YSZ |
| 3.23 mol. %Y2O3
|
10.274 |
10.524 |
10.536 |
90.21 |
98.84 |
89.94 |
m - YSZ |
| 6.67 mol. %Y2O3
|
10.512 |
10.544 |
10.603 |
89.90 |
90.12 |
89.62 |
t - YSZ |
| 10.35 mol. %Y2O3
|
10.529 |
10.541 |
10.546 |
89.98 |
90.09 |
90.08 |
t - YSZ |
| 16.15 mol. %Y2O3
|
10.540 |
10.541 |
10.543 |
90.08 |
90.00 |
90.02 |
c - YSZ |
After obtaining the optimized structures, the energy of formation (Ef) for ZrO
2 and YSZ and the energy of formation of vacancies (Ev) for YSZ were calculated as:
where
- total energy of the system,
– total energy of individual components, δ is the number of vacancies (defects) in the crystal. The calculated values of
and
for each atom are given in
Table 6.
Table 6.
GGA-calculated value of enthalpy (ΔН) and energy of formation () for ZrO2 and YSZ. Oxygen vacancy formation energy () for YSZ.
Table 6.
GGA-calculated value of enthalpy (ΔН) and energy of formation () for ZrO2 and YSZ. Oxygen vacancy formation energy () for YSZ.
| System |
ΔН |
|
|
| 0 |
64.02917222 |
-4.747216667 |
0 |
| 3.23 mol. %Y2O3
|
59.91124404 |
-4.848422632 |
-1.874577368 |
| 6.67 mol. %Y2O3
|
56.13271879 |
-4.967857447 |
-3.739875532 |
| 10.35 mol. %Y2O3
|
52.7041267 |
-5.106527419 |
-5.596013441 |
| 16.15 mol. %Y2O3
|
47.00229139 |
-5.384704945 |
-9.220196154 |
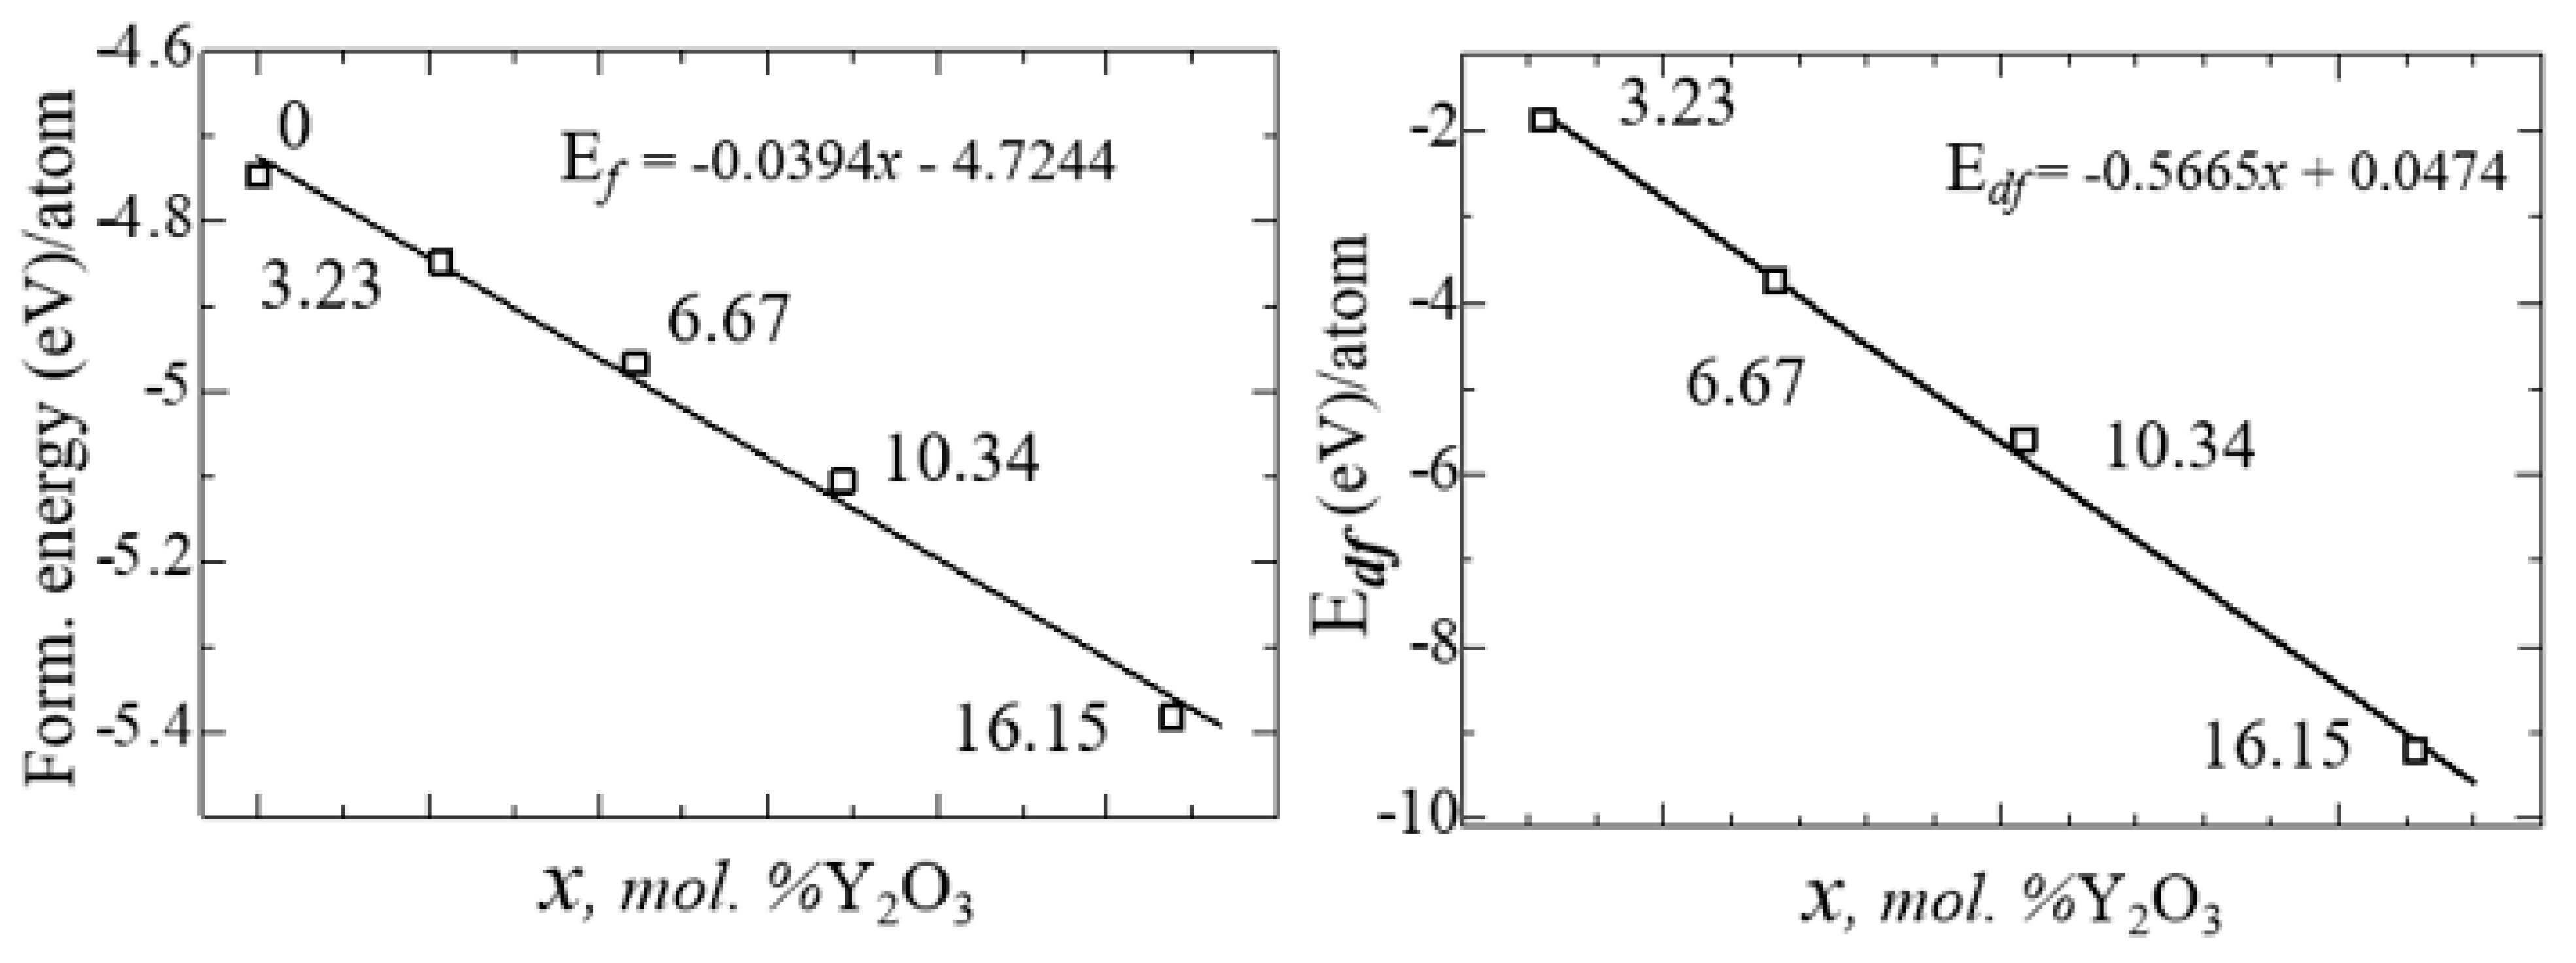
Figure 13 shows the nature of the change in
and
from the concentration of yttrium oxide, from which the regularity of their linear decrease is clearly visible.
Next, calculations were performed to study the electronic structure of Y
2O
3-stabilized ZrO
2 supercells to reveal the effect of doping on the density of states, the behavior of the Fermi energy, and the orbital components.
Figure 14 shows plots of changes in the density of electronic states YSZ for all doping concentrations of Y
2O
3.
According to the results presented in
Figure 14, it can be noted that after doping with Y
2O
3, new energy states do not appear in the TDOS patterns due to the introduction of defects, that is, there are no noticeable changes, except for a decrease in the band gap , which can be understood in detail after orbital analysis (
Figure 16) and Fermi level mixing estimates (
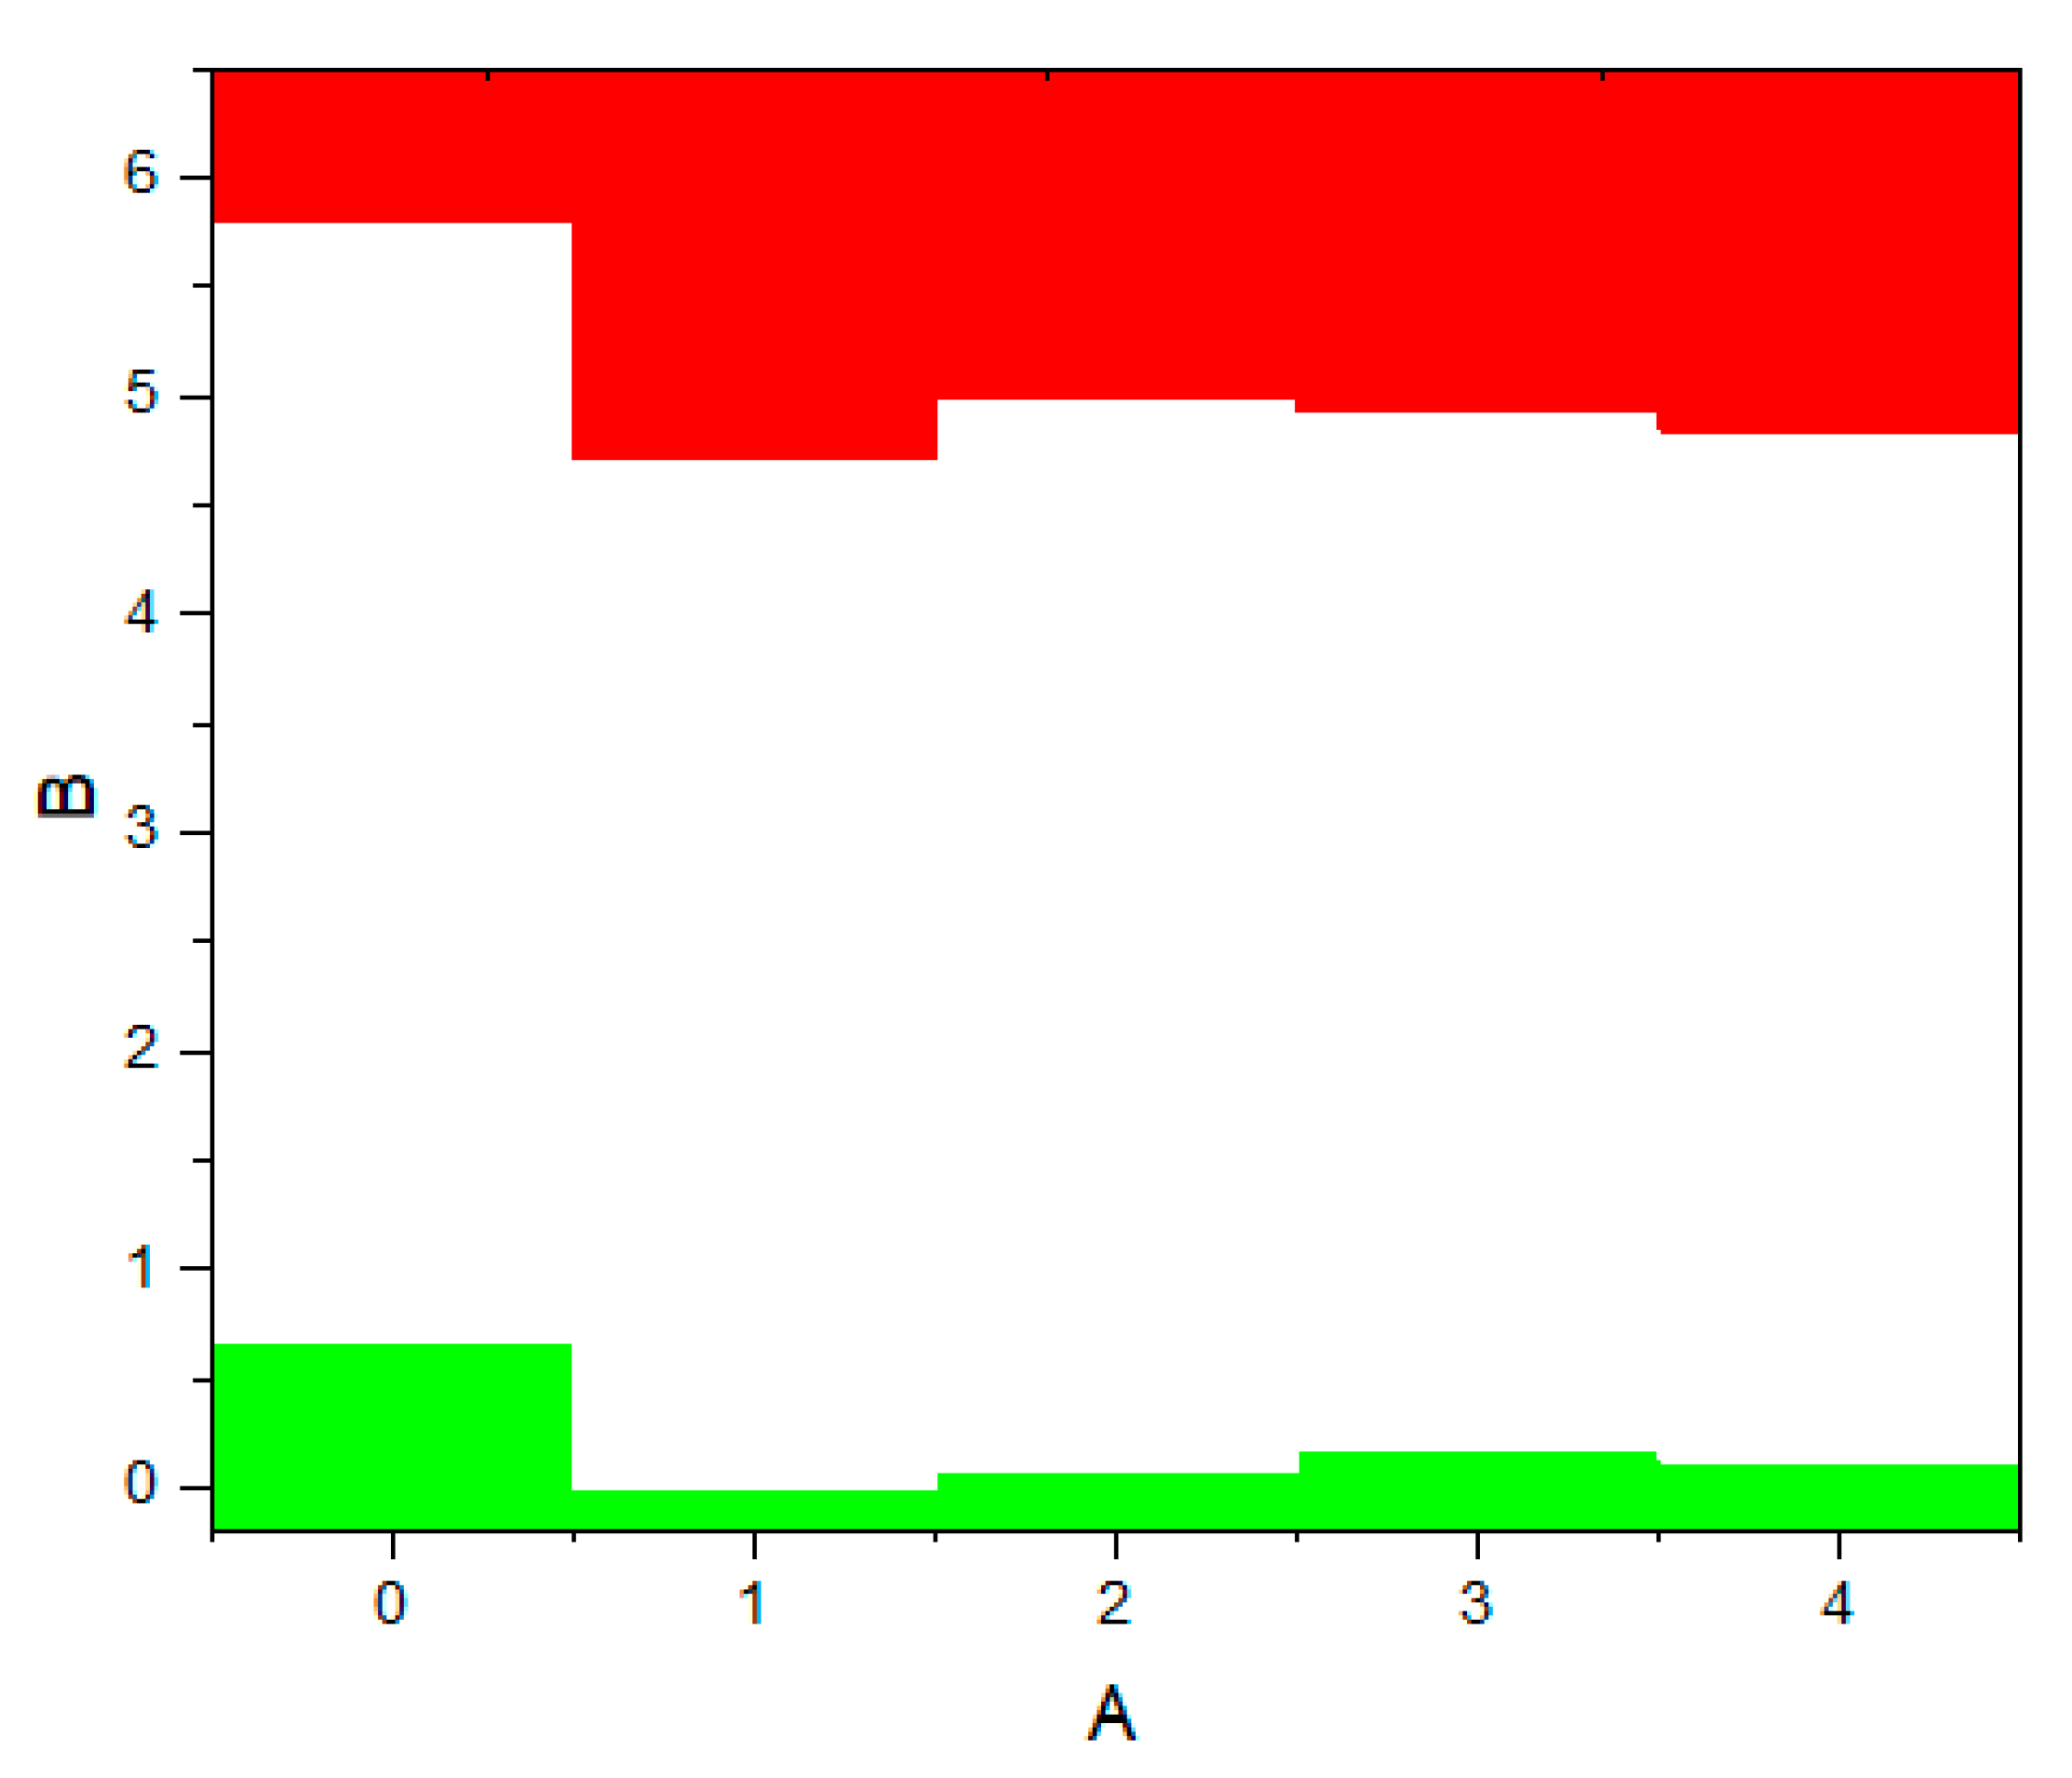
Figure 15). The band gap is 4.71 eV, 4.92 eV, 4.75 eV, and 4.72 eV, respectively, for ZrO
2 doped with 3.23, 6.67, 10.34, and 16.15 mol. %Y
2O
3.
Figure 15.
Conduction (red) - and valence (green)-band change for ZrO2 doped with 3.23, 6.67, 10.34 и 16.15 mol. %Y2O3. The position of the Fermi level corresponds to the maximum of the valence band in each section.
Figure 15.
Conduction (red) - and valence (green)-band change for ZrO2 doped with 3.23, 6.67, 10.34 и 16.15 mol. %Y2O3. The position of the Fermi level corresponds to the maximum of the valence band in each section.
Figure 16.
Composite PDOS diagram showing the main contributions of the s-, p- and d-orbitals to the states forming the CB bottom for ZrO2 doped with 3.23, 6.67, 10.34 and 16.15 mol. %Y2O3. Top VB (green), scaled to zero.
Figure 16.
Composite PDOS diagram showing the main contributions of the s-, p- and d-orbitals to the states forming the CB bottom for ZrO2 doped with 3.23, 6.67, 10.34 and 16.15 mol. %Y2O3. Top VB (green), scaled to zero.
According to
Figure 15, after doping with 3.23 mol. %Y
2O
3 into pure m-ZrO
2, the Fermi level drops by 0.067 eV and then shifts by 0.007 eV towards the conduction band upon doping with 6.67 mol. %Y2O3. Then, at a doping concentration of 10.34 mol. %Y
2O
3, it still increases by 0.01 eV, which is 0.017 eV more than in the case of 3.23 mol. %Y2O3. However, after doping with 16.15 mol. %Y
2O
3, it drops to 0.012 eV. The PDOS diagram also interprets the stepped conduction band pattern in terms of the contribution of the s, p, and d orbitals. Understanding these features makes it possible to tune the Fermi energies in the band structure to solve the most important problems of materials science and instrumentation.
The problems of studying the influence of doping of yttrium oxide on the properties and stability of tetragonal and cubic zirconia remain the subject of our future research.
3.3. Water adsorption on ZrO2 and YSZ surfaces
As already mentioned, the most important point is the choice of the surface with the lowest surface energy in order to correctly model the mechanism of water adsorption on the corresponding surface. To select the optimal adsorbed surface, we calculated the surface energy (σ) for several different surface models according to the equation after their geometric relaxation. The calculated value of the surface energy for ZrO
2 is shown in
Table 7.
According to the results presented in
Table 7, it can be seen that the most stable surfaces can be obtained due to the tetragonal and monoclinic phases, namely, t-ZrO
2 (101) and m-ZrO
2 (111). The results obtained are in qualitative agreement with the work of Maliki et al. [
57], who report that the most stable surface can be obtained from t-ZrO
2 (101). As for the comparison of the results with experimental data, there were no data for comparison in the literature. This is due to the fact that the surface energy of solid metal oxides is difficult to measure experimentally. In total, the measurement of the surface energy of some types of zirconium dioxide surfaces by the method of multiphase balancing at high temperatures was reported [
58]. Based on the results obtained, the t-ZrO
2 (101) surface was chosen for this study as the most stable surface for the adsorption of water molecules.
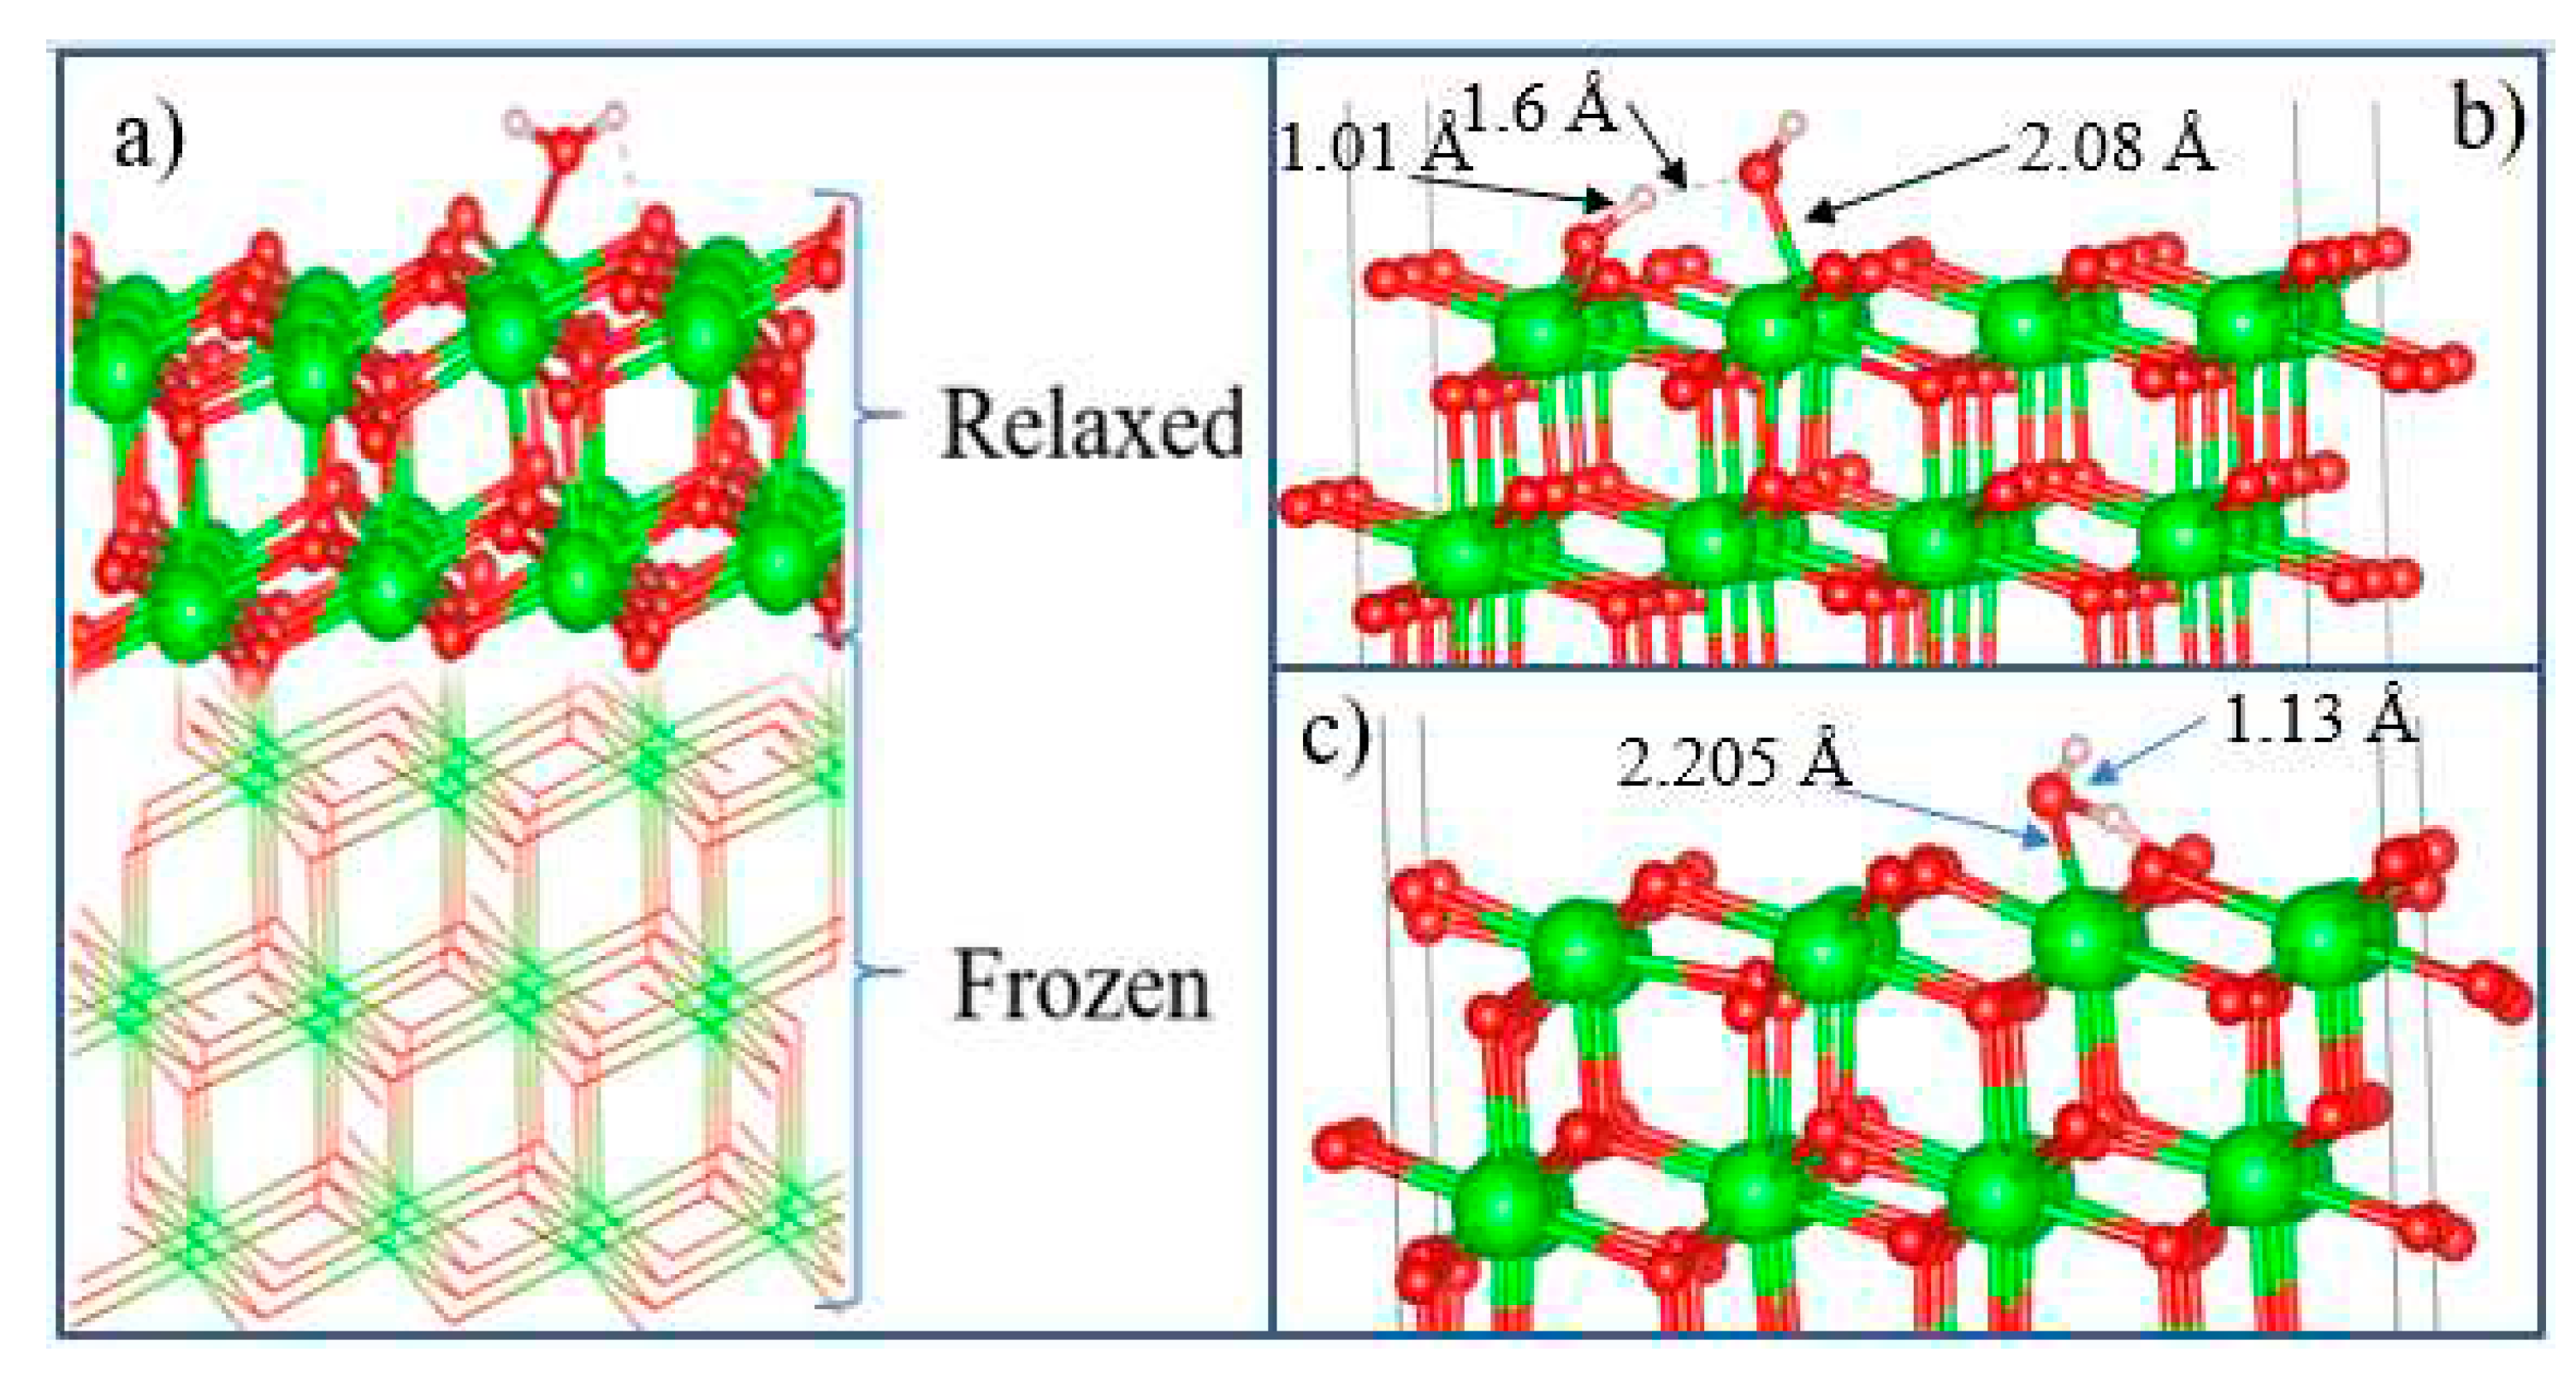
After the final surface preparation, single H
2O molecules were initially located at a height of 2.5 Å above the selected surface with different orientations, which is greater than the bond distance between Zr and O (2.12 Å) in the solid state. The structures were then optimized by freezing the bottom layers of the wafer (
Figure 17(a)).
The optimized structure of the H
2O + t-ZrO
2 (101) system is shown in
Figure 17(b), which shows that the H
2O molecule is dissociatively adsorbed with an energy of -1.221 eV even in the most favorable region (where the system has the minimum energy of the stable configuration). Dissociative adsorption of water on ZrO
2 was also observed by Korhonen et al. [
59], where it was experimentally and theoretically proven that water dissociates on the surface of m-ZrO
2 at low coverage, and the adsorption energy calculated by us on t-ZrO
2 (101) for [H+OH]-ZrO
2 is similar to their results for monoclinic (111) and (101) surfaces with energy -1.20 eV. It was also found that water is adsorbed on this surface by the method of molecular chemisorption, in which water oxygen coordinates the surface cation, and a slight elongation of one O–H water bond (1.13 Å) occurs in the form of hydrogen bonding water with the surface oxygen ion (
Figure 17(c)). In this case, the adsorption energy is 0.69 eV, and the distance between the oxygen of the water molecule and the surface zirconium atom is 2.205 Å. In this case, the proton (H) in the water molecule and oxygen from the surface of the plate form a hydrogen bond with a bond length of 1.01 Å.
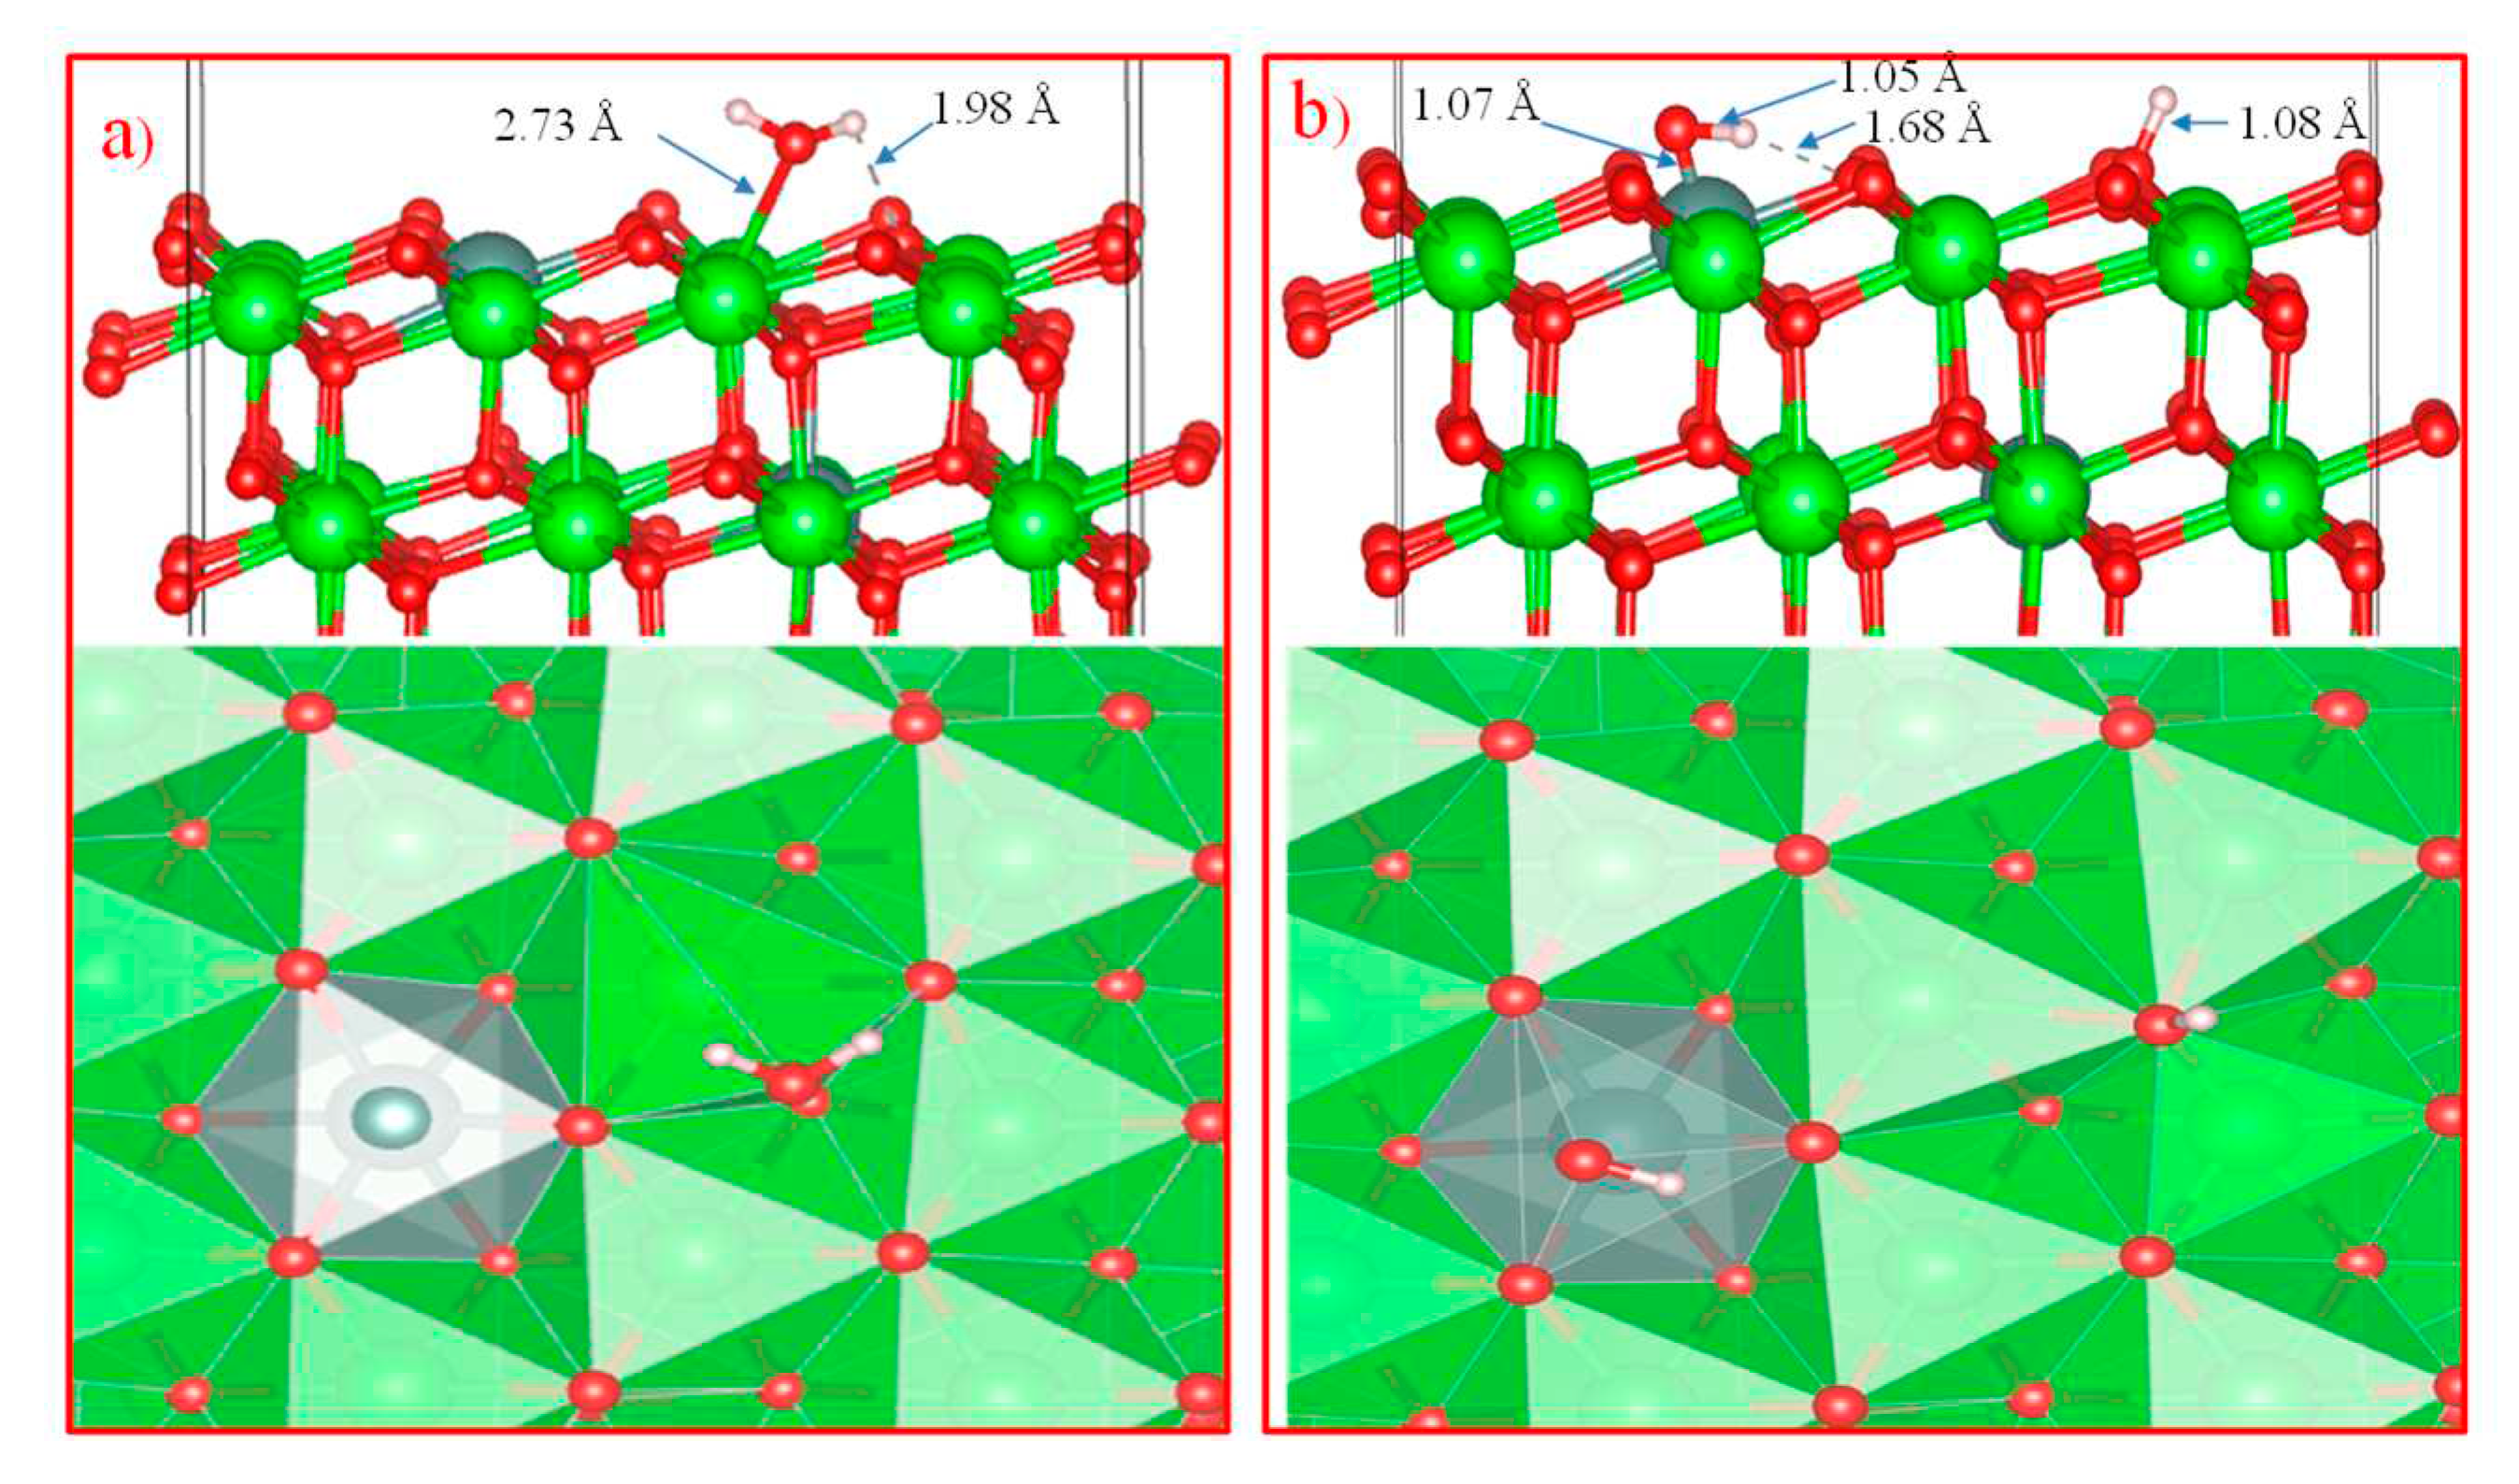
Further, in order to study the mechanism of water adsorption on the surface of t-YSZ, we replaced two Zr (from the uppermost and subsurface O-Zr-O trilayers by Y with the removal of one oxygen from the third atomic layer nearest neighbor of Y atoms) to obtain a surface similar to t-YSZ(101). The results showed that the water molecule is molecularly adsorbed and also dissociated on the t-YSZ(101) surface. Molecular adsorption of water at the most optimal configuration occurs from an energy of -1.84 eV, and the bond length of water with the t-YSZ (101) surface increases to 2.73 Å (
Figure 18a). In this case, the O-H distance in water molecules will remain unchanged.
The dissociative adsorption of water was accompanied by the movement of oxygen in the area of the plate vacancies, which leads to a very strong adsorption of -1.23 eV, blocking surface areas for oxygen activation. In both cases, H
2O is adsorbed near the yttrium atom (
Figure 18b).
Unlike water adsorption on t-ZrO2, H2O is more stably adsorbed on t-YSZ(101), since the adsorption energy of H2O-YSZ(101) is more favorable than that of (H+OH)-YSZ(101).
Doping with Y
2O
3 stabilizes t-ZrO
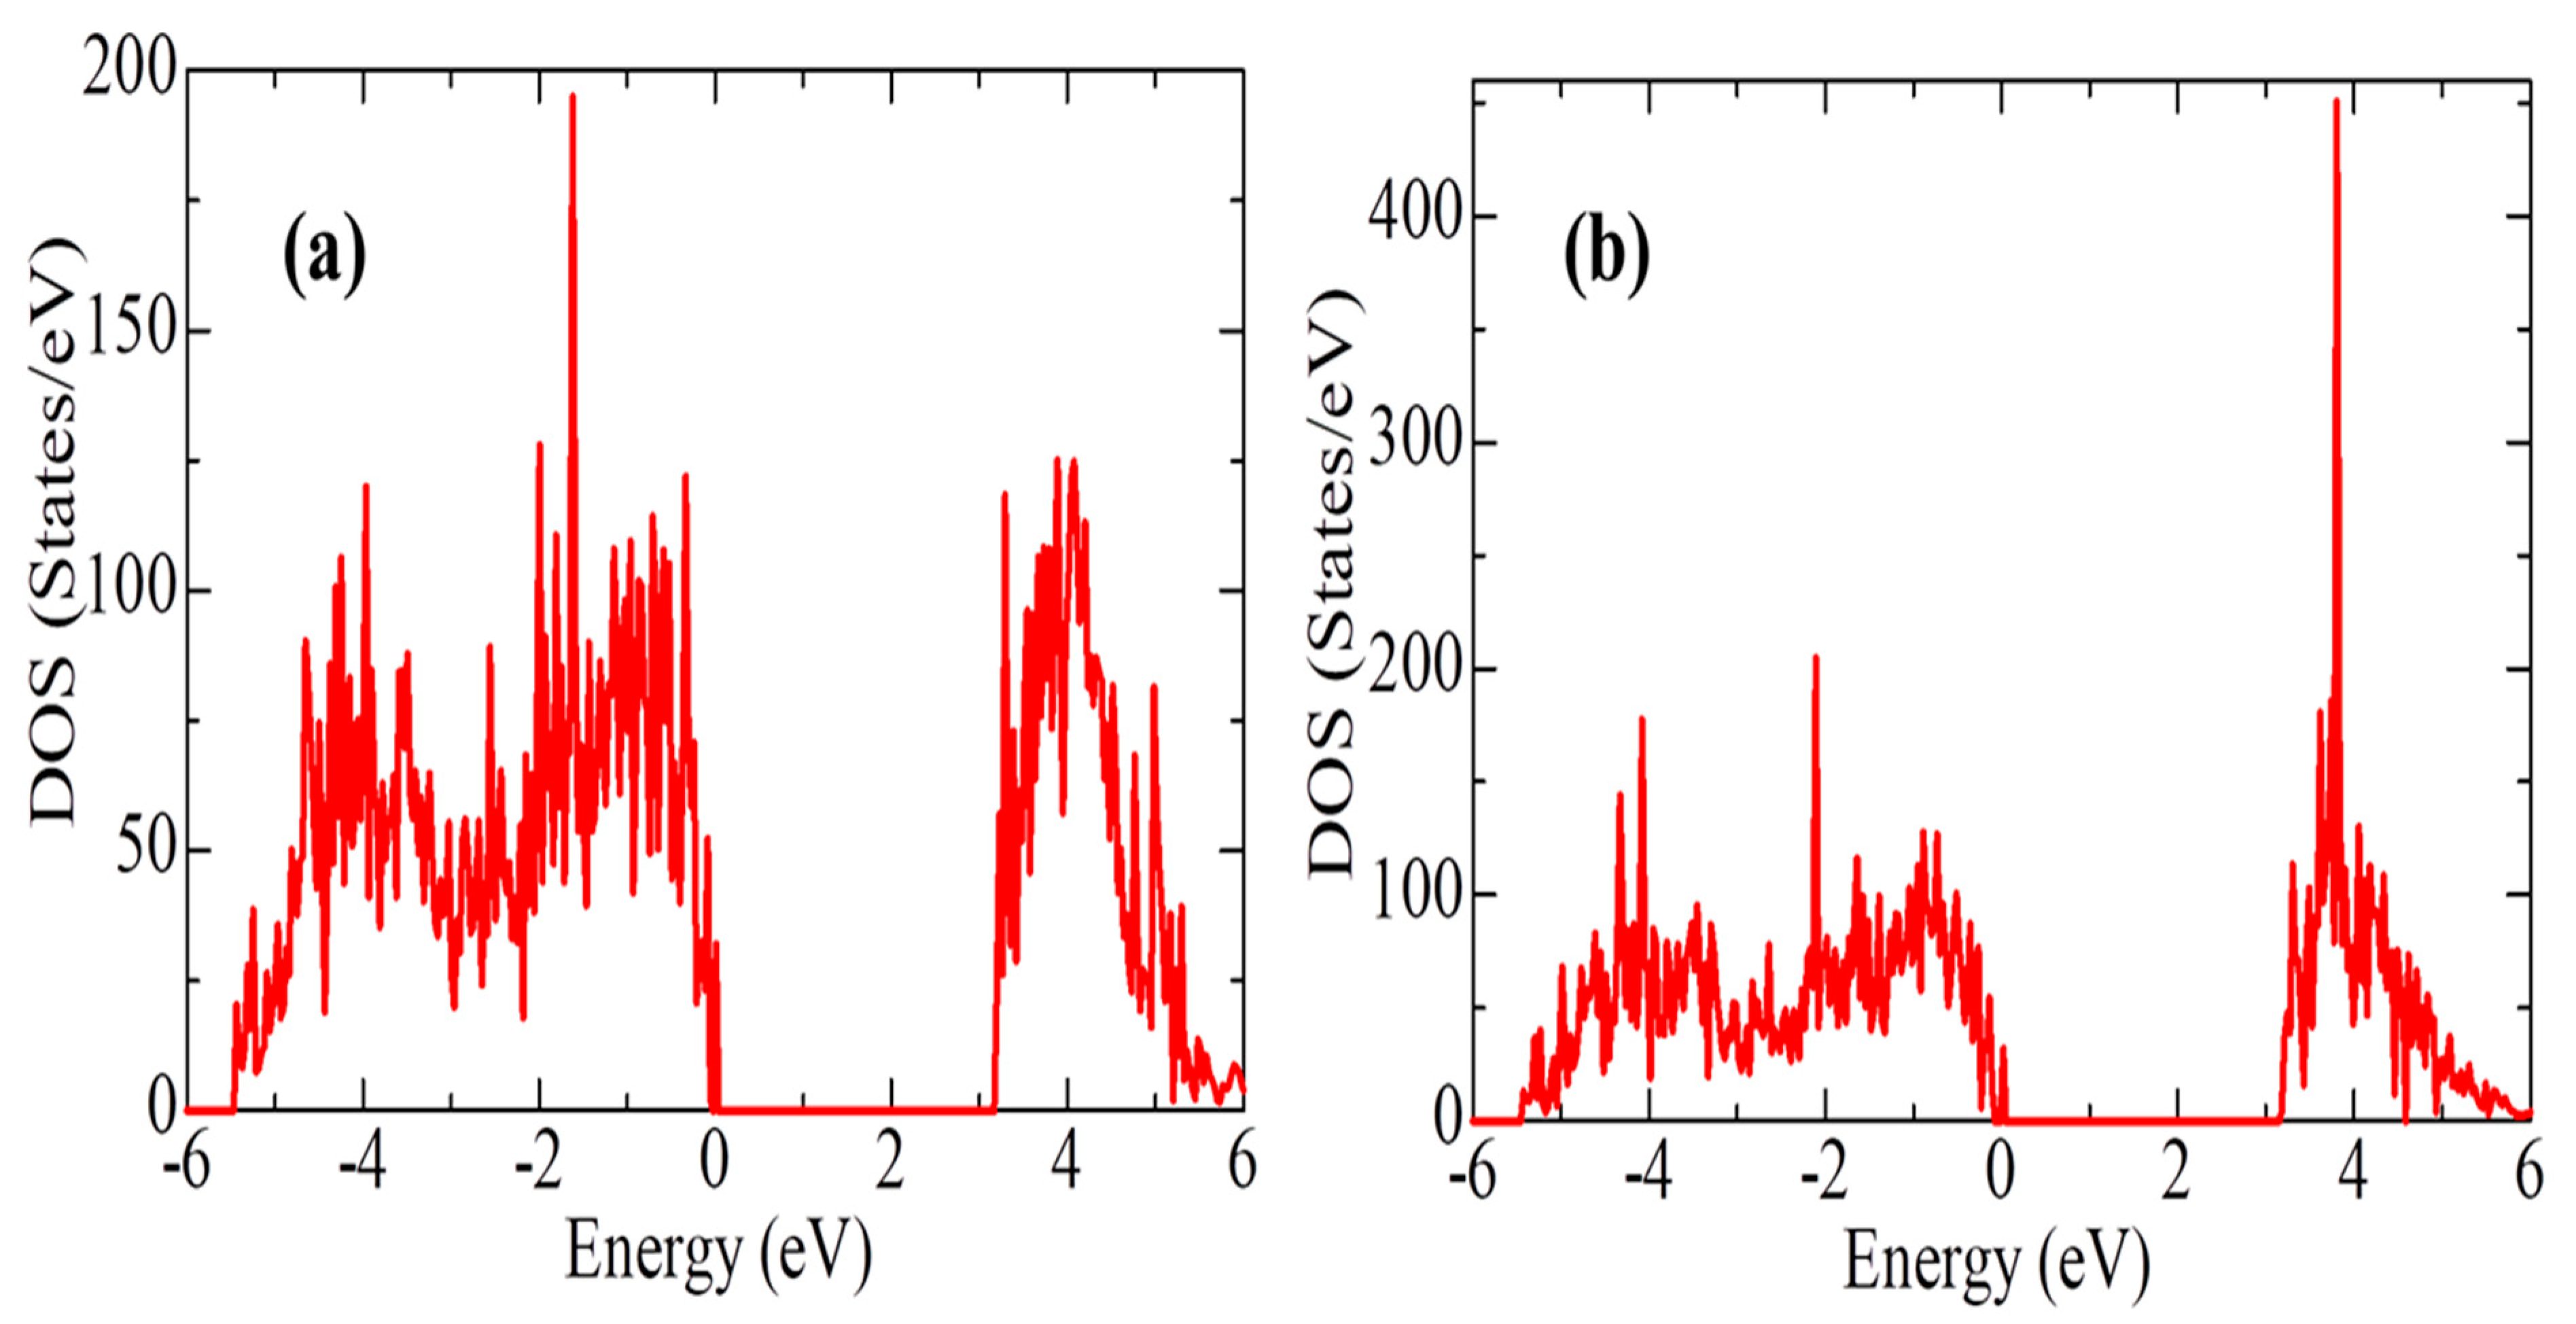
2 and is accompanied by large relaxations of O atoms. Calculations based on the GGA functional greatly underestimate the band gap of the system (3.24 eV for the H
2O-ZrO
2 system and 3.21 eV for H
2O-YSZ (101)), however, despite the presence of the Oth vacancy, the average gap energy states did not appear in the t-YSZ band diagram, as is observed in the systems under study. A comparative analysis of the electronic structure of the H
2O-ZrO
2 and H
2O-YSZ(101) systems indicates that the interaction of H
2O practically does not change the electronic configuration of the system (with the exception of an increase in the density of state) during the transition of the system to being modified by Y impurities (
Figure 19). However, water molecules are predominantly prone to molecular adsorption on the t-YSZ (101) surface, and more often dissociatively on t-ZrO
2.
Table 8 lists some key data obtained by modeling water adsorption on t-ZrO
2 and t-YSZ surfaces.
In such studies, it is also important to take into account the hydrophilic nature of ZrO
2. Studies show that, in addition to physically adsorbed water, the substrate surface contains terminal, bibridging, and triple bridging OH groups, which are actively involved in the surface reaction [
60,
61,
62,
63,
64,
65,
66,
67,
68,
69,
70,
71]. Surface hydroxyl groups and H
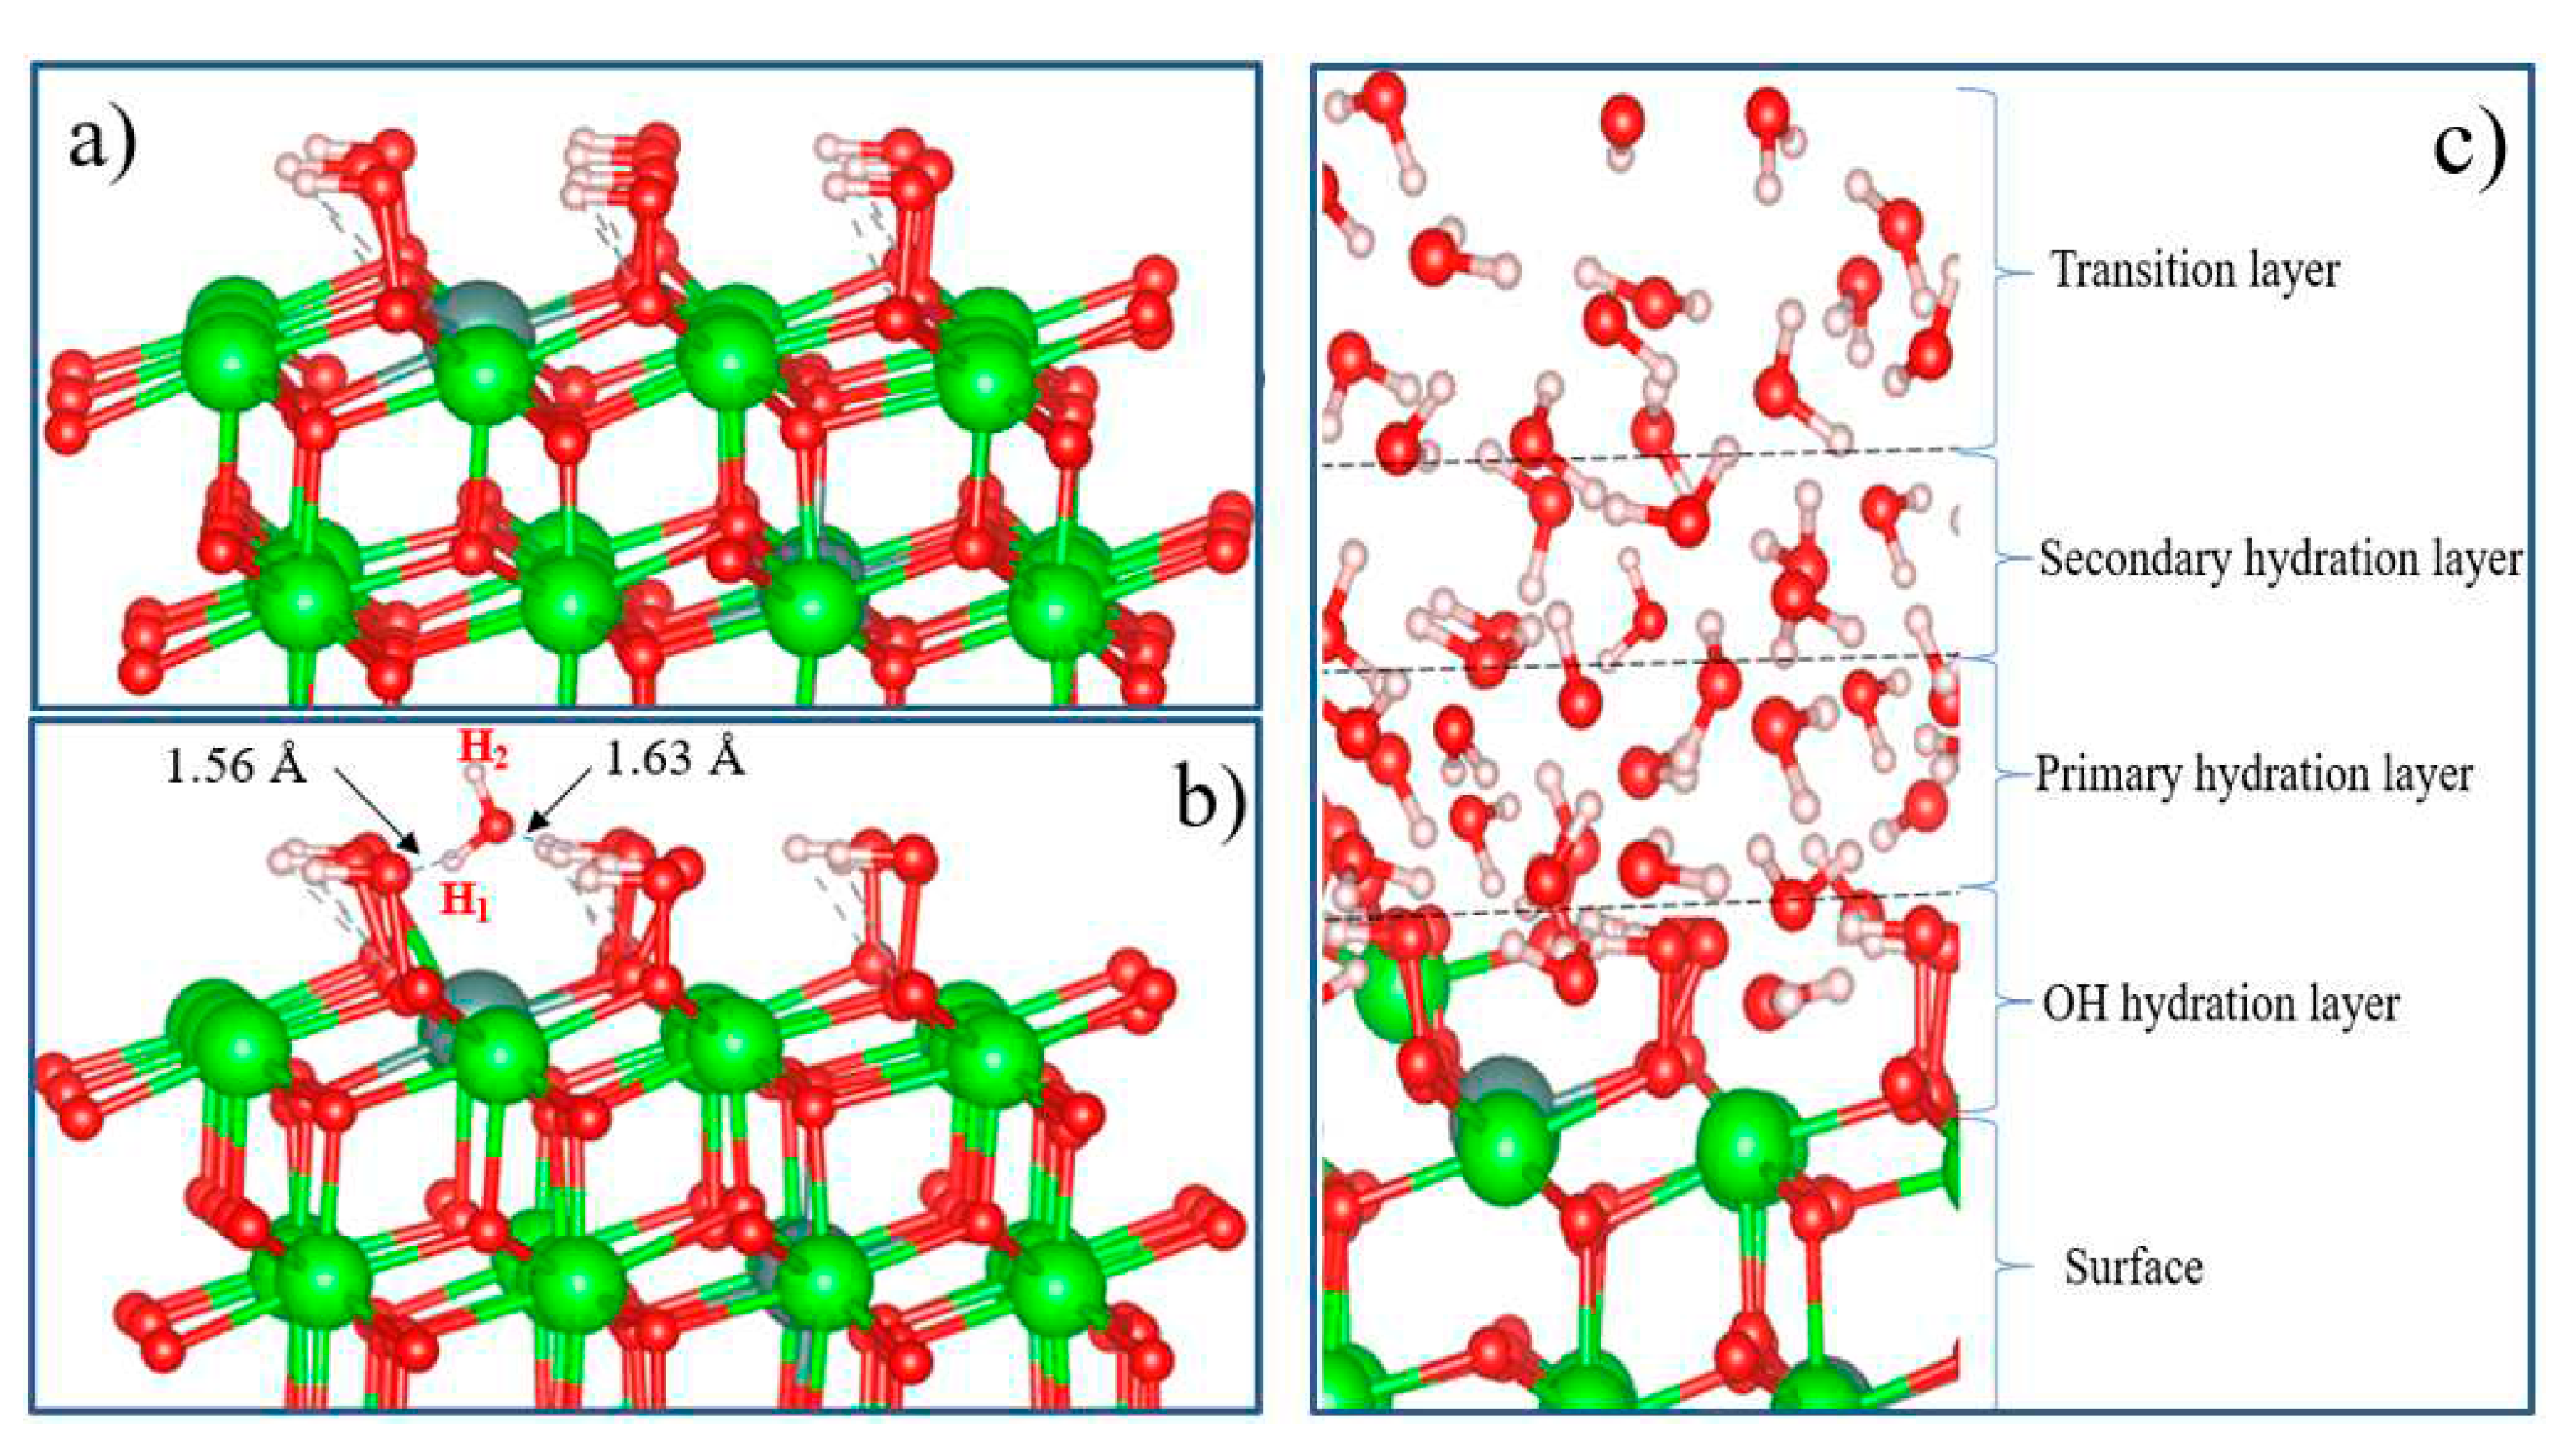
2O adsorbed on the surface can partially block active sites (lattice oxygen ions on the surface) of YSZ oxidation. The surface configuration model for fully hydroxylated t-YSZ(101) is shown in
Figure 20(a). The results show that the OH groups form strong bonds on the surface.
Figure 20(b) shows the adsorption structure of a single water molecule on a fully hydroxylated YSZ surface.
It can be seen that the repulsive forces of oxygen and hydrogen atoms in a water molecule and OH atoms on a completely hydroxylated surface do not prevent the adsorption of an H
2O molecule on t-YSZ (101). When water is adsorbed on a hydroxylated surface, two strong hydrogen bonds are formed at a distance of 1.56 and 1.63 Å from each other. In this case, water is adsorbed with an adsorption energy of 0.34 eV. The adsorption model of a single water molecule and other similar systems will help in the future to study in detail more complex models, including the multilayer hydration structure of the interface (
Figure 20). Although this model requires large computational power for DFT calculations, nevertheless, it can be assumed that in the layer closest to the surface (hydroxyl hydration layer), most of the water molecules can be adsorbed dissociatively. Further, due to hydrogen bonds, H
2O molecules will continue to be adsorbed and regularly located on the hydroxylated surface, forming primary and secondary hydrated layers. The regular arrangement of H
2O molecules in the outer layer can be considered as a transition layer, and the hydration structure of the first three H
2O layers located near the surface can be considered as a group of water molecules capable of being stably adsorbed and existing on the m-NSC surface (101). However, a detailed study of the complete model of t-YSZ(101) surface hydration remains the subject of our future research.
