Preprint
Article

The Norepinephrine Transporter - Gβγ Subunit Interaction Promotes Norepinephrine Efflux through the Transporter: In silico and Functional Studies

Altmetrics

Downloads

139

Views

66

Comments

0

Submitted:

17 July 2023

Posted:

18 July 2023

You are already at the latest version

Alerts
Abstract
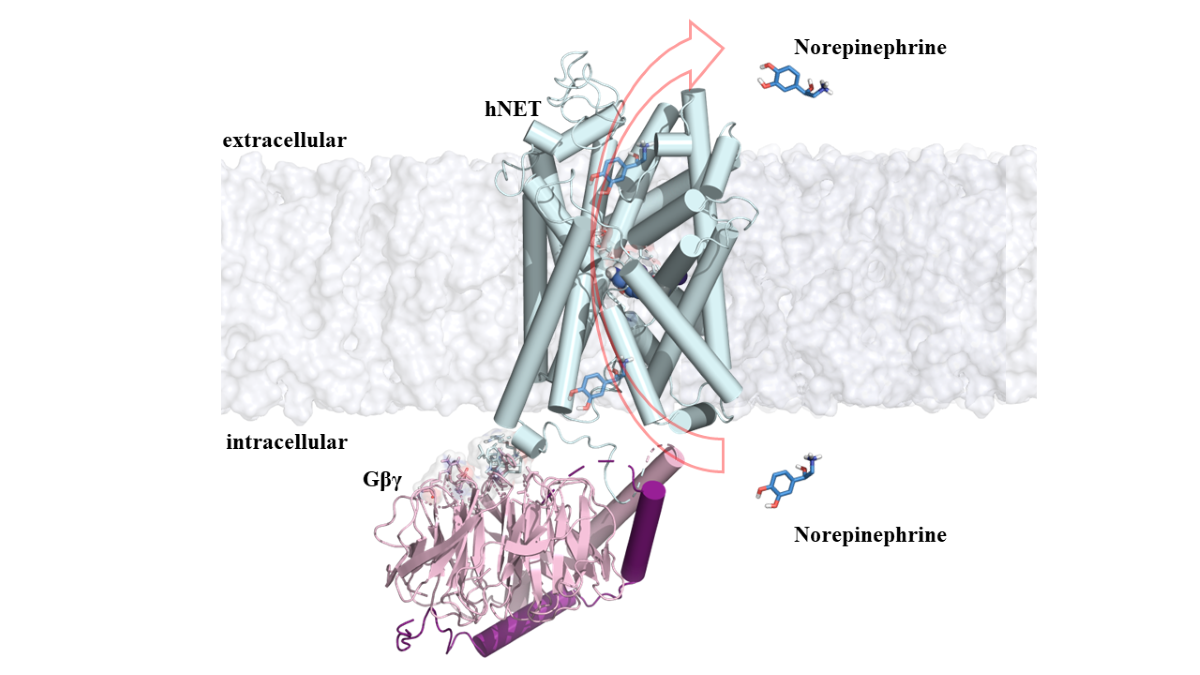
Norepinephrine (NE) uptake through the NE transporter (NET) is the primary mechanism to ter-minate the action of this neurotransmitter. Dysregulation of brain NE levels is associated with various conditions, including attention deficits, depression, and Alzheimer's disease. Recently, we identified an interaction between the related dopamine (DA) transporter (DAT) and G protein βγ subunits. Activation of Gβγ in cells and brain slices leads to DA efflux through DAT. However, the potential interaction between Gβγ and NET has not been reported. Here, we used a combina-tion of molecular modeling approaches to elucidate the structural details of the NET/Gβγ inter-action, supported by experimental evidence. Through 1.5µs of molecular dynamic simulation, we observed a favorable NET/Gβγ interaction mediated by the intracellular carboxy terminus of NET. As a consequence, the binding energy of NE for NET also changes resulting in alterations of the electrostatic profile of NET. We propose that these changes mediate the NE efflux effect. Fi-nally, we provide experimental evidence demonstrating that Gβγ physically interacts with NET and that the Gβγ activator mSIRK induces NE efflux through the transporter. These findings identified a novel interaction between Gβγ and NET and highlighted its potential implications in the regulation of NE neurotransmission and associated disorders.
Keywords: 
Subject: Biology and Life Sciences  -   Neuroscience and Neurology

1. Introduction

Norepinephrine (NE) is a neurotransmitter released by NE neurons that plays a crucial role in regulating various brain functions, including mood, memory, arousal, attention, and sleep [1]. Dysfunctions in the noradrenergic system and dysregulation of brain extracellular NE levels have been implicated in different brain conditions [2]. The NE Transporter (NET) is a protein located on the plasma membrane responsible for terminating the action of NE through reuptake. This process utilizes an ion gradient to transport neurotransmitters across the cell membrane [3]. NET plays a crucial role in regulating the availability of extracellular NE, thereby modulating NE signaling and neurotransmission.
NET is a protein with a structural arrangement comprising 12 transmembrane domains. It belongs to the SCL6 family of monoamine transporters (MATs), which also includes dopamine (DA) and serotonin (5HT) transporters (DAT and SERT, respectively) [4]. MATs are of great interest as they serve as biological targets for psychostimulants and therapeutic agents used to treat brain conditions. Selective DA reuptake inhibitors (SDRI), selective 5HT reuptake inhibitors (SSRI), and 5HT-NE reuptake inhibitors (SNRI), are examples of such compounds [5]. These inhibitors are widely used for the treatment of several brain conditions, including depression, attention deficit hyperactivity disorder (ADHD), smoking addiction, and obsessive-compulsive disorder (OCD) [6,7,8]. They work by blocking the reuptake of monoamines, thereby increasing their extracellular availability and associated effects.
Amphetamines are a pharmacologically distinct group of compounds that interact with DAT, SERT, and NET to induce neurotransmitter efflux [9,10]. In addition to exogenous agents like amphetamines, certain intracellular signaling mechanisms, such as protein kinase C (PKC) and Ca+2/calmodulin-dependent protein kinase II (CAMKII), can also trigger transporter-mediated efflux [11,12]. Recent studies conducted by our group have demonstrated that G protein βγ subunits can bind to DAT and facilitate DA efflux [13,14]. This effect has been observed in transfected cells, brain slices, and in vivo [13,15]. Interestingly, the amino acid sequence involved in the interaction between DAT and Gβγ is generally conserved in other members of the MAT family [3]. However, there is currently no available information regarding the interaction between Gβγ with SERT or NET.
In this study, we conducted a comprehensive computational analysis to examine the potential interaction between NET and Gβγ subunits. This involved employing various in silico techniques to assess the binding affinity and stability of the NET/Gβγ complex over time. Furthermore, to validate our computational predictions, we performed experimental investigations to confirm the existence of the interaction between Gβγ subunits and NET. By integrating computational and experimental data, we aimed to provide a more complete understanding of the NET/Gβγ interaction and its potential functional implications. This combined approach allows us to leverage computational modeling and experimental validation strengths to gain insights into the molecular mechanisms underlying the interaction between Gβγ subunits and NET.

2. Materials and Methods

2.1. Homology Modeling and Docking Studies

To obtain the sequence of human NET, we retrieved the information from the NCBI database (https://www.ncbi.nlm.nih.gov/protein/) in FASTA format. The specific accession number for human NET is GenBank: CAA62566.1. For the template structure, we chose the Drosophila melanogaster DAT (DmDAT) from the Protein Data Bank (PDB: 4XP1) based on its alignment quality, protein conformation, and functional similarities to human NET. To generate the model of human NET, we employed the model single protocol of MODELLER9.19 [16]. This protocol allowed us to build 200 models of NET based on the chosen template structure. To assess the energetic and stereochemical properties of the models, we utilized the PROSA server [17] and the PROCHECK server [18]. These tools provided valuable information regarding the quality and suitability of the generated models. We submitted the selected model to the H++ server to refine the model further. This server is designed to predict and adjust individual residues' protonation states, enhancing the model's accuracy and reliability [19].

2.1.1. Complex NET/NE

To construct the structure of NE, we utilized the Spartan'18 program. This software provides tools for building molecular structures and performing energy optimizations to ensure the stability and accuracy of the NE structure. The complex NET/NE was generated in AutoDock4.2 suite using binding site coordinates. The general procedure was described in Arancibia et al., 2019 [20]. The docked compound complexes were built using the lowest docked-energy binding positions.

2.1.2. Protein-Protein Complex

To generate the NET/Gβγ complex, we employed the High Ambiguity Driven Biomolecular Docking (HADDOCK 2.4) software [21]. HADDOCK is a widely used molecular docking program that utilizes both experimental and computational data to generate models of protein-protein complexes. For the docking process, we selected the carboxy-terminal residues of NET and specific residues of Gβγ that have been previously identified as important for the interaction with other effectors, including DAT [13,14,22]. The final NET/Gβγ complex was selected based on the ranked energies calculated by the internal scoring function of HADDOCK, which evaluates the quality and stability of the complex structures. Additionally, the spatial orientations of the proteins and their compatibility with the bilayer membrane were considered during the selection process.

2.1.3. NET/NE/Gβγ System

To generate the NET/NE/Gβγ complex, we combined the previously obtained structure of the NET/Gβγ complex with the coordinates of norepinephrine (NE) from the NET/NE complex. Once the NET/NE/Gβγ complex was prepared, it was ready for molecular dynamics simulation.

2.2. Molecular Dynamics Simulation

Molecular dynamics simulations were performed using the Amber18 suite [23], which includes the AMBER ff14SB force field for protein [23] and the LIPID14 force field for the lipid bilayer [24]. The parameters for norepinephrine (NE) were obtained using the antechamber tool in the LEaP module of AmberTools. To mimic the physiological environment, each system, including the NET/NE/Gβγ complex, was inserted into a 1-palmitoyl-2-oleoyl-sn-glycero-3-phosphoethanolamine (POPE) bilayer membrane using the Membrane Builder module in Charmm-Gui (www.charmm-gui.org). Subsequently, the systems were solvated in a periodic box using explicit water molecules represented by the TIP3P model [25].
Counter ions (Na+ or Cl-) were added to the systems to ensure charge neutrality. The molecular dynamics simulations were carried out in the NPT ensemble, maintaining a constant number of particles, pressure (1atm), and temperature (310K). Periodic boundary conditions were applied in all three coordinate directions. The simulations were performed for a total time of 1.5µs, allowing for the equilibration of the system. The equilibration was assessed by monitoring the Root Mean Square Deviation (RMSD), which measures the deviation of the system's structure from its initial conformation. A value of RMSD less than 1Å indicates that the system has reached equilibrium.

2.3. Energy of Complexes

The binding affinity between NET/NE, NET/Gβγ, and NET/NE/Gβγ complexes was estimated using the molecular mechanics/Poisson–Boltzmann surface area (MM/PBSA) approach, as described by Miller et al. (2012) [26]. The most stable and representative snapshots from the molecular dynamic simulations were selected for further analysis, with a time step of 10. The total energy contribution of each residue was extracted and plotted to visualize the relative importance of different residues. In order to investigate the formation or breaking of interactions between the NET/Gβγ and NET/NE/Gβγ systems during the simulation and analyze the conformational changes, contact analysis and Principal Component Analysis (PCA) were performed as described in Doshi et al., 2016 and Ouedraogo et al., 2023 [27,28]. Data plots were made using R-studio [29] and Visual Molecular Dynamics (VMD) [30].

2.4. In Vitro Expression of NET and Functional Analysis

The functional analysis of NET was conducted using human embryonic kidney cells (HEK) cultured in EMEM medium supplemented with 10% FBS and 5% penicillin/streptomycin. The human NET cDNA was transfected into the HEK cells using Lipofectamine 3000. After transfection, cells were split into two 24-well plates for uptake and efflux experiments, and coverslips were used for immunostaining. The 24-well plates were coated with poly-d-lysine to facilitate cell adhesion. To assess NET function, [3H]-NE uptake and efflux experiments were performed 48h after transfection. For the uptake experiments, different concentrations of cold NE (0.3-30µM), 1µM of Atomoxetine (ATX: a NET blocker), and 20nM of [3H]-NE were used. The cells were incubated with the respective solutions to allow for the uptake of NE. For efflux experiments, cells were pre-loaded with 40nM of [3H]-NE and treated with different compounds, including 40µM Amphetamine (AMPH); 40µM AMPH + 2µM ATX; 100µM mSIRK (Gβγ activator); 100µM mSIRK + 2µM Gallein; and 100µM scramble mSIRK (scmSIRK). Drugs were prepared as described in Pino et al., 2021 [14]. Control cells were incubated with efflux buffer containing 0.1% DMSO. After loading with [3H]-NE, cells were washed with 1 mL ice-cold efflux buffer and then incubated for 10min at 37°C with 500μL of efflux buffer in the absence or presence of different drug conditions. Released [3H]-NE was collected from the extracellular medium, transferred to scintillation vials filled with 4mL scintillation counting fluid (RPI Bio-safe II™), and cpm were obtained. Efflux is expressed as a percentage relative to baseline levels of extracellular [3H]-NE in the absence of treatment.

2.5. Immunocytochemistry

Cells were washed thrice for 5 minutes each with PBS (Phosphate-Buffered Saline) to remove residual media or reagents. The blocking solution was prepared by mixing PBS, Triton X-100 (1%), and FBS (4%). The cells were then incubated with the blocking solution for 1 hour to block non-specific binding sites. After blocking, the cells were incubated overnight at 4°C with a rabbit polyclonal anti-hNET antibody at a dilution of 1:1000. The next day, the cells were washed three times for 5 minutes each with PBS to remove the unbound primary antibody. A secondary antibody labeled with CY3 (a red fluorescent dye) was used to visualize the bound primary antibody. The cells were incubated with the anti-rabbit CY3 secondary antibody for 1 hour. In addition to the secondary antibody, the cell nuclei marker DAPI (4',6-diamidino-2-phenylindole) was added at a dilution of 1:3000. After the secondary antibody and DAPI incubation, the cells were washed three times for 5 minutes each with PBS to remove unbound antibodies and staining reagents. Finally, the cells were washed twice with water to remove residual salt and imaging artifacts.
The coverslips with stained cells were mounted onto slides and analyzed using a Zeiss LSM 800 microscope.

2.6. Proximity Ligation Assay

Glass slides with PFA-fixed cells were permeabilized by adding 1% Triton X-100 solution to the slides for 5 min at 4°C. After permeabilization, the slides were rinsed twice with PBS to remove the permeabilization solution and once with water to remove any residual salts or buffer. The DuoLink Blocking Solution was prepared and added to the slides, and the slides were placed in a humidity chamber for 60 minutes at 37°C. The NET rat antibody and GB1 rabbit antibody were diluted in DuoLink Antibody Diluent and incubated overnight at 4°C under gentle agitation. The Minus (Rat) and Plus (Rabbit) probes for the DuoLink Proximity Ligation Assay were diluted in the antibody diluent at a 1:5 ratio, respectively. The previous antibody solution was removed, and the samples were washed with wash buffer A, as described by DuoLink, for 2 times 5 minutes each. The wash buffer A was removed, and the samples were incubated with the PLA probes in a humidity chamber for one hour at 37°C. The samples were washed with wash buffer A 2 times, each time for 5 minutes at room temperature. The DuoLink ligation buffer was prepared in highly pure water at a ratio of 1:5. The ligase was prepared by diluting it at a ratio of 1:40 with the ligation buffer. The excess wash buffer A was removed, and the samples were incubated with the ligase solution in a humidity chamber for 30 minutes at 37°C. Samples were washed with wash buffer A 2 times, each time for 5 minutes at room temperature. The amplification buffer was prepared in highly pure water at a ratio of 1:50. The polymerase was prepared by diluting it at a ratio of 1:80 with the amplification buffer. The excess wash buffer A was removed, and the samples were incubated with the polymerase in a humidity chamber for 100min at 37°C. After the incubation with the polymerase, the excess solution was removed in the dark, and the samples were washed with wash buffer B 2 times, each time for 10min at RT. Then, the samples were washed once for 1 minute with 0.01 Wash buffer B. After the completion of the wash steps, the excess wash buffer B is removed from the samples. The samples are then mounted using DuoLink In Situ Mounting Medium with DAPI. Once the samples are mounted, they are stored at -20°C until they are ready to be analyzed under a confocal microscope.

2.7. Data Analysis

The data were analyzed using GraphPad Prism 9.5 with One-Way ANOVA, Brown-Forsythe, and Welch ANOVA tests, with a significance level set at P < 0.05

3. Results and Discussion

Previous studies on the interaction between DAT and Gβγ have demonstrated that Gβγ activation leads to the efflux of DA through DAT. Computational studies have also described specific interactions between the carboxy terminus of DAT and Gβγ [14,22]. However, there is a lack of structural information regarding the potential effects of Gβγ on SERT or NET. To address this gap, we conducted a study to generate structural information on the interaction between Gβγ and NET. First, we generated a 3D NET model computationally, then performed protein/ligand and protein/protein modeling studies in the presence and absence of NE.
  • NE is stabilized into the NET binding site by a rich electron environment.
The docking studies of the NET/NE complex yielded a binding energy of -3.73 kcal/mol. This complex exhibited hydrogen bond interactions with residues D75, Y152, and D473 at distances of 1.9, 1.6, and 1.8 Å, respectively. Additionally, π interactions were observed with residues F72, Y151, and F323 at 6.6, 5.9, and 7.4 Å, respectively (Figure S1A). These interactions are consistent with the findings of Góral et al., 2020; Pidathala et al., 2021; and Schlessinger et al., 2011 [4,31,32], where the same residues and interactions were described.
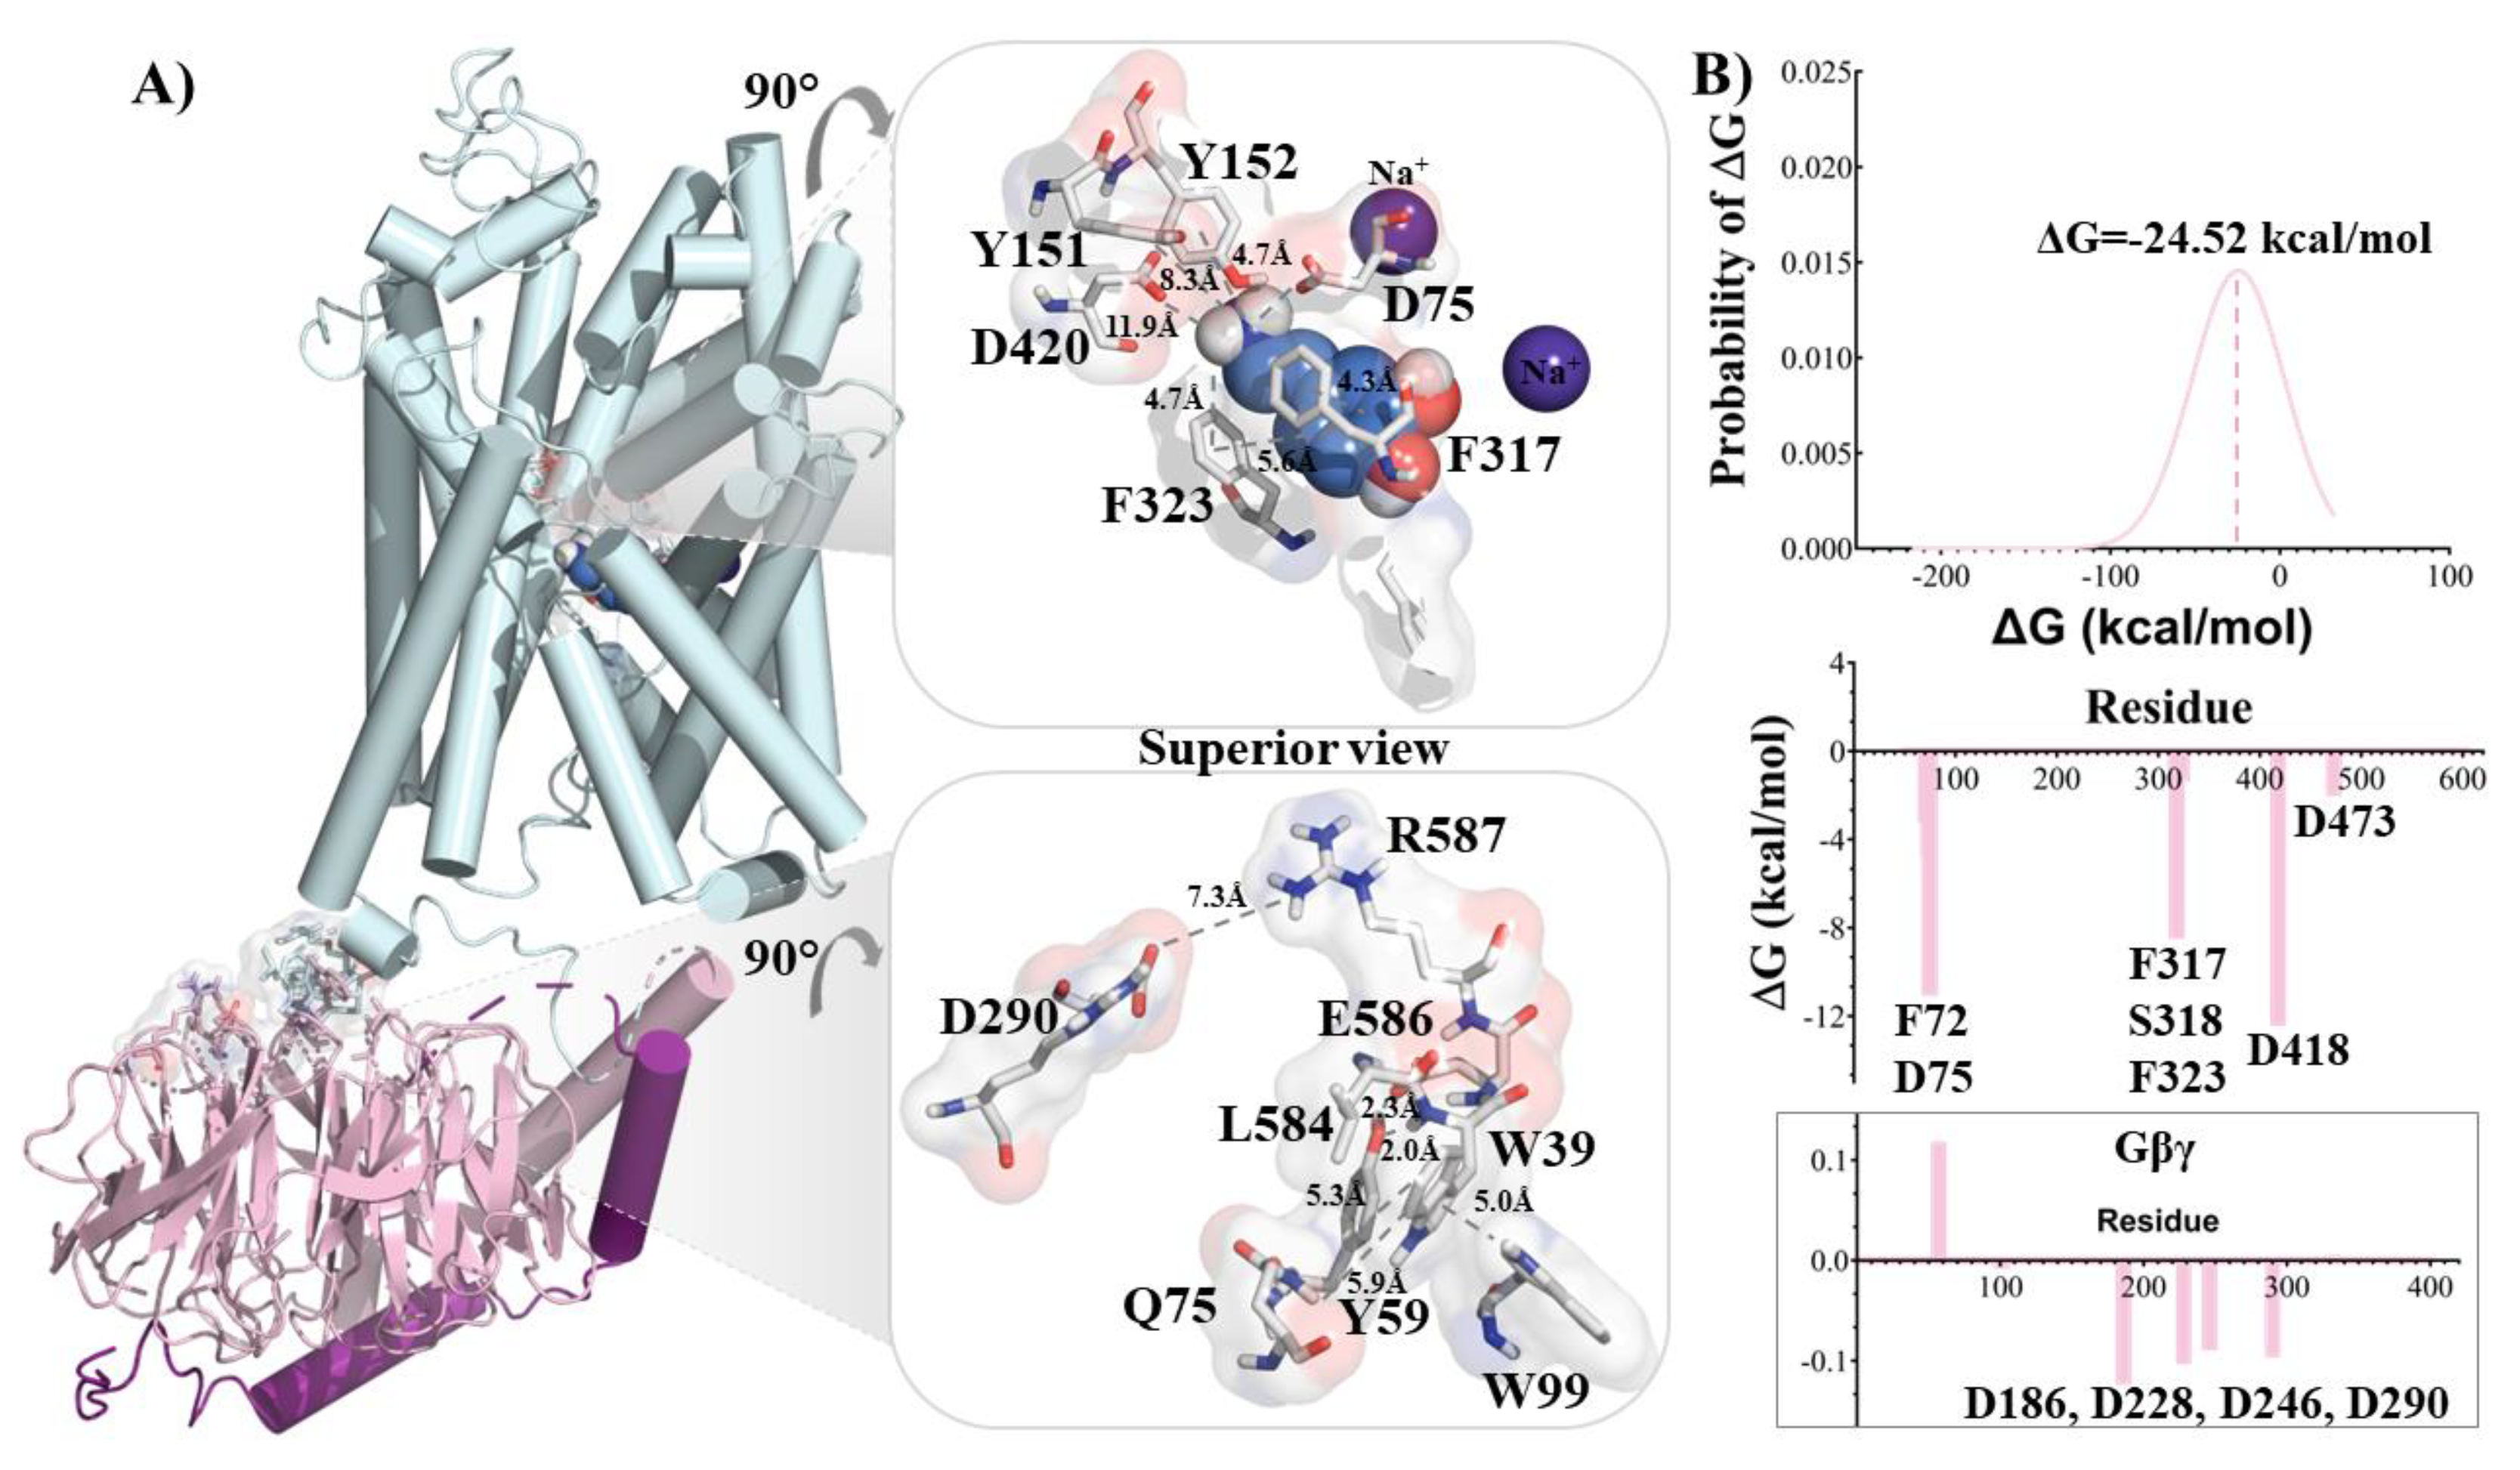
Following the generation of the NET/NE complex, the system was immersed in a lipid bilayer and solvated in a water box for molecular dynamics simulations. During the simulation, NE remained in the binding cavity, interacting with residues D75, F72, Y151, Y152, F317, S318, and D473 of NET (Figure 1A) at similar distances observed in the docking studies (around 2 Å). The internal ions in the system were stabilized throughout the simulation. General analysis of the molecular dynamics trajectory showed a stable system with a root mean square deviation (RMSD) close to 1Å. The extracellular loops (IC) 2 (residues 167-233), 3 (283-306) and 4 (residues 363-402) exhibited higher flexibility. The RMSD and root mean square fluctuation (RMSF) plots supported the stability of NE in the binding site, contributing to the overall stabilization of the system (Figure S2).
Once the simulation reached equilibrium, a Molecular Mechanics Poisson-Boltzmann Surface Area (MM/PBSA) calculation was performed to determine the binding free energy of the NET/NE complex. This analysis provided insights into the main residues contributing to the complex stabilization. The PB Gaussian distribution showed a binding free energy of ΔG = -123.46kcal/mol (Figure 1B), with the negatively charged residues D75 and D418 contributing significantly with energy contributions of -33 and -34 kcal/mol, respectively (Figure 1B). Our findings highlight the role of D418 in stabilizing one of the sodium ions in the protein/ligand complex.
  • Gβγ binding to NET induces conformational changes that decrease the affinity of NE for the transporter.
To investigate the effects of Gβγ, we obtained the NET/NE/Gβγ and NET/Gβγ complexes using the HADDOCK2.4 web server. These complexes were built using the NET/NE complex coordinates obtained from the previous docking studies and the crystal structure of Gβγ (PDB: 1GG2). The best protein/protein complex was selected based on the Z-score, which indicates how closely related the selected configuration is to the cluster regarding standard deviation. The selected complex had a Z-score of -95.5 ± 4.2.
Our docking results revealed a protein/protein interaction between the intracellular space facing the Gβγ protein and the carboxy terminus of NET. Specifically, we observed coulombic interactions between R587 (NET) and a network of negatively charged aspartate residues from Gβγ. A hydrogen bond was also formed between E586 (NET) and Y59 (Gβγ) at a distance of 1.92 Å, and W585 (NET) interacted with W99 (Gβγ) through van der Waals (VDW) interactions (Figure S1B). These findings are consistent with Rojas et al.'s (2020) and Pino et al.'s (2021) [14,22] study of the DAT/Gβγ interaction.
Following the complex formation, molecular dynamics simulations were performed for the NET/Gβγ complex interacting with the endogenous substrate, NE, for a duration of 1.5µs. Throughout the simulation, the system remained stable, with the RMSD values for the protein near 4.5Å, the ligand around 2Å, and the three-component complex close to 10Å (Figure S3). Furthermore, an analysis of residue fluctuation (RMSF) showed higher values for the extracellular loops and the carboxy and amino termini (Figure S3), indicating greater flexibility in these regions. Conversely, interactions between residues and the binding cavity exhibited lower fluctuation values, suggesting more stable interactions.
During the molecular dynamics simulation, the three-component system (NET/NE/Gβγ) exhibited coordinated movements in the transmembrane domains 1, 3, 6, 8, 10, 11, and 12, which were associated with the stabilization of the substrate (NE) within the NET cavity (Figure S4). As a result, a rearrangement of NE occurred, involving a rotation of the catechol moiety, leading to the formation of new interactions (see Figure S4). This switch elucidated two global interaction modes between NE and NET. The first interaction, referred to as the "ionic mode," involved the interaction of the ammonium group of NE with D75 through coulombic interactions, while the aromatic residues F72, Y152, and F317 stabilized the catechol ring near the binding site at distances of 1.7 and 4.13 Å. In the second interaction, the catechol ring moved towards the sodium ions in the binding cavity, resulting in a "chelation mode" where the hydroxyl groups of the catechol ring formed hydrogen bonds with residues L319 and G320. This chelation mode has been previously described by Manepalli et al., 2012 [33], and Xhaard et al., 2008 [34], supporting our findings.
The final conformations of the NET/NE/Gβγ complex and the binding free energy obtained by MM/PBSA analysis are depicted in Figure 2A,B. The presence of Gβγ led to a decrease in the binding energy of NE, with a value of -24.53 kcal/mol. This suggests that the interaction between Gβγ and NET induces electronic and steric changes that result in a lower affinity of NE for NET. In Figure 2B, a close-up of the Gβγ interactions shows that the aspartate residues D228, D246, and D290 contribute favorably to the protein-protein interaction. Similarly, the residue E586 of NET is involved in the stabilization observed in the interaction between Gβγ and the C-terminus of NET.
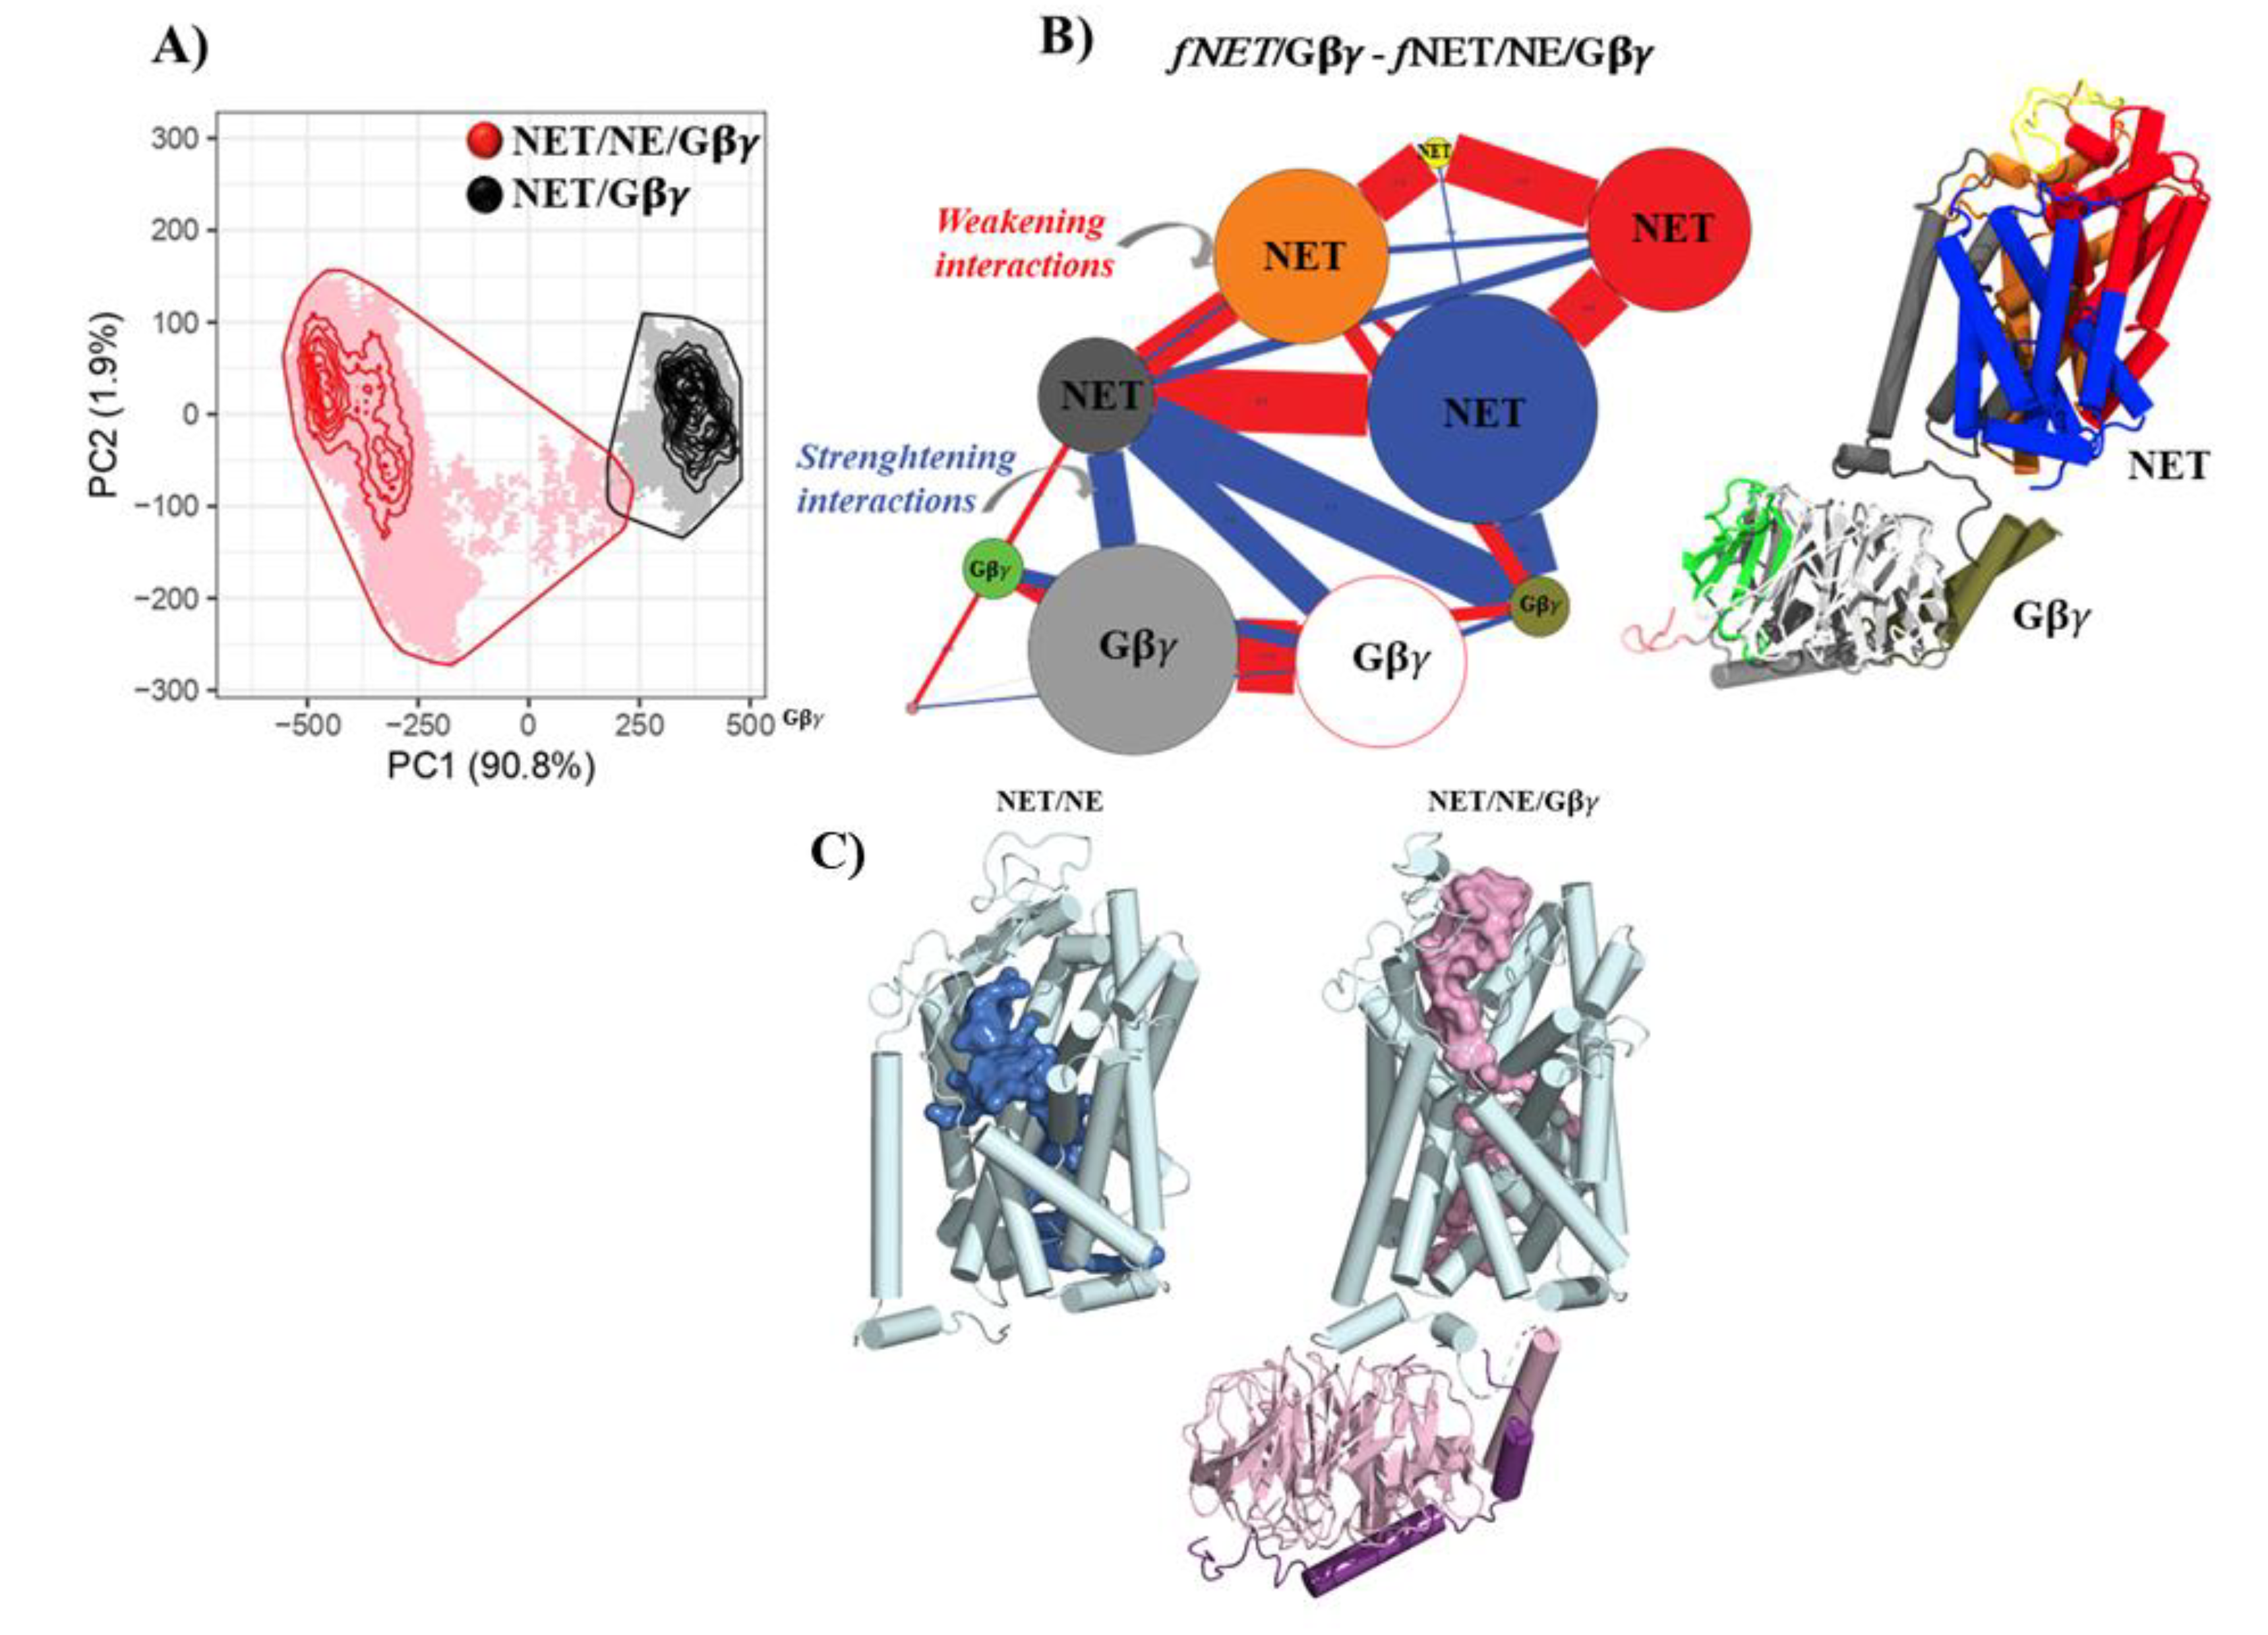
Our molecular dynamics (MD) results revealed distinct conformational behavior between the NET/NE and NET/NE/Gβγ systems, which is supported by the free energy values of NE within the cavity. To further explore the conformational space and understand the dynamics of each system, we performed a principal component analysis (PCA). This analysis allowed us to extract information from the sampled conformations and identify major motions in each system. The PCA results showed that the NET/NE/Gβγ system (red in Figure 3A) exhibited more significant motions compared to the NET/Gβγ system (black in Figure 3A), suggesting the influence of NE in the three-component system. To gain a deeper understanding of the distinct movements observed in both complexes and integrate the results from each simulation with the PCA analysis, a comparative study was conducted to analyze the pattern of contacts between NET/Gβγ and NET/NE/Gβγ. Figure 3B illustrates the contacts analysis, showing probable lost or broken interactions (red lines) between the upper segments of the NET domains (orange, red, blue, and dark-grey spheres) and the extracellular loop (yellow sphere). This led to an opening of the NET cavity towards the extracellular space. At the same time, there was a more probable strengthening of contacts between TM12 of NET (dark-grey sphere) and Gβγ (light-grey, white, and gold spheres), indicated by the blue lines (Figure 3B, bottom left). This analysis suggests that the interaction between NET and Gβγ becomes stronger during the simulation, promoting the opening of NET towards the extracellular space.
In the presence of NE, NET undergoes conformational changes that result in the fusion of cavities, forming a cavity connecting the intra and extracellular spaces through the binding site (Figure 3C and Figure S5). In the system with Gβγ, a wider volume extending to the extracellular space was observed, indicating an even greater opening of NET. Notably, a change in the angle of extracellular loop 2 of NET by 102.7° in the NET/NE/Gβγ complex compared to the NET/NE complex was found to be responsible for generating the opening state (Figure 3C and Figure S5). It is worth mentioning that these results are consistent with recent structural data describing hSERT in an outward conformation (PDB: 7LIA, RMSD between SERT and NET: 2.51 Å).
In summary, our findings indicate that the NET/NE/Gβγ systems exhibit a wider conformational space, facilitating the interaction between NET and Gβγ and promoting the opening of NET towards the extracellular space. These conformational changes are associated with altered interactions, increased flexibility, and expanded volume in NET, all contributing factors to the efflux of NE. The observed changes are supported by an increase in the Solvent Accessible Surface Area (SASA) and Radius of Gyration in the NET/NE/Gβγ system compared to the NET/NE and NET/Gβγ systems. These results further highlight the importance of both NE and Gβγ in inducing conformational changes important for NET function (Figures S2 and S3).
  • Transfected HEK293-hNET cells show [3H]-NE uptake and efflux in the presence of AMPH or mSIRK
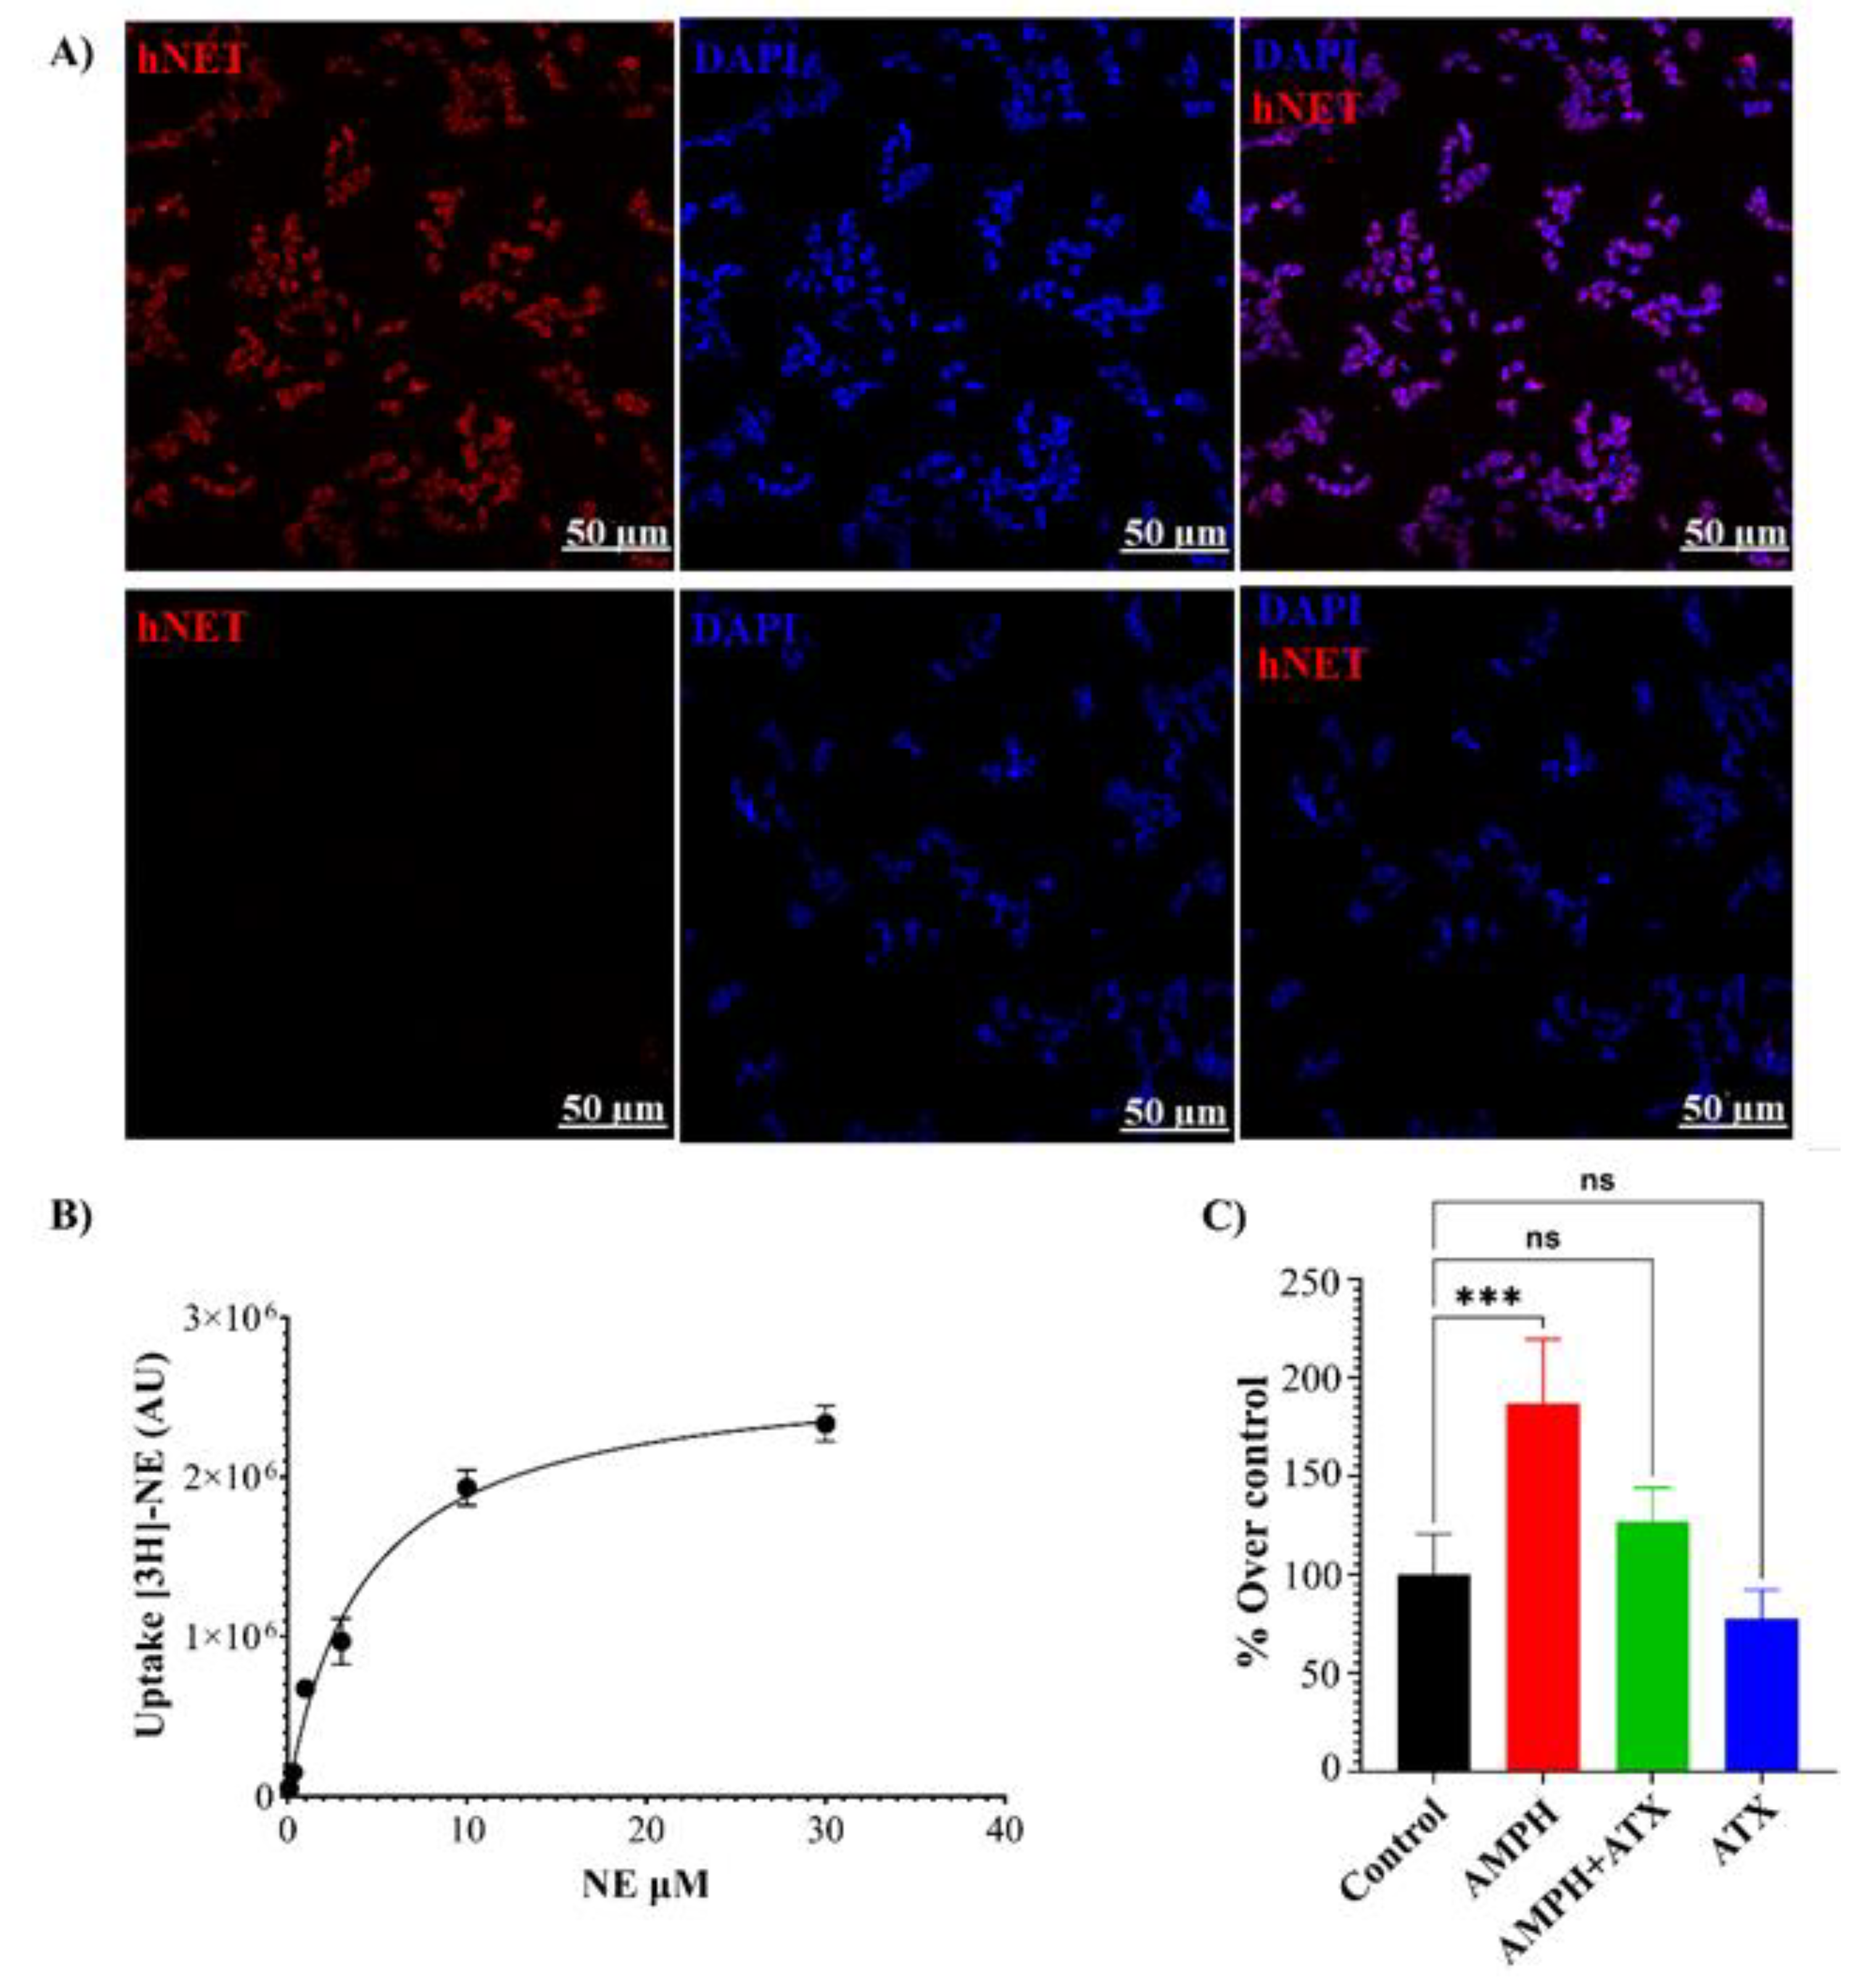
To examine the predictions from the computational approach, we conducted experimental studies using human embryonic kidney clone 293 (HEK293) cells transfected with human NET (hNET) cDNA. First, immunostaining was performed to visualize the expression of hNET in the transfected cells. Figure 4A shows the immunostaining results of HEK293 cells expressing hNET, where the upper panels depict the red fluorescence indicating the presence of hNET. Control cells without the primary antibody showed no staining, and similar results were observed in wild-type (WT) HEK293 cells.
Uptake and efflux assays were performed for the functional characterization of the HEK293-hNET cells. Figure 4B shows the saturation curve of HEK293-hNET cells in the presence of increasing concentrations of NE. The curve displayed a hyperbolic shape, which is characteristic of uptake assays for closely related DA or 5-HT through their respective transporters. Non-specific uptake was determined by conducting the assay in the presence of the selective NET inhibitor Atomoxetine (ATX), and the obtained values were subtracted from each sample. In addition, as shown in Figure 4C, AMPH promoted a two-fold increase in the efflux of [3H]-NE compared to the control condition. The effect of AMPH on efflux was blocked by the selective NET inhibitor ATX at a concentration of 2µM. These findings demonstrate that the HEK-hNET cells exhibit functional activity of the NET transporter and provide a means to study the effect of Gβγ on NET function.
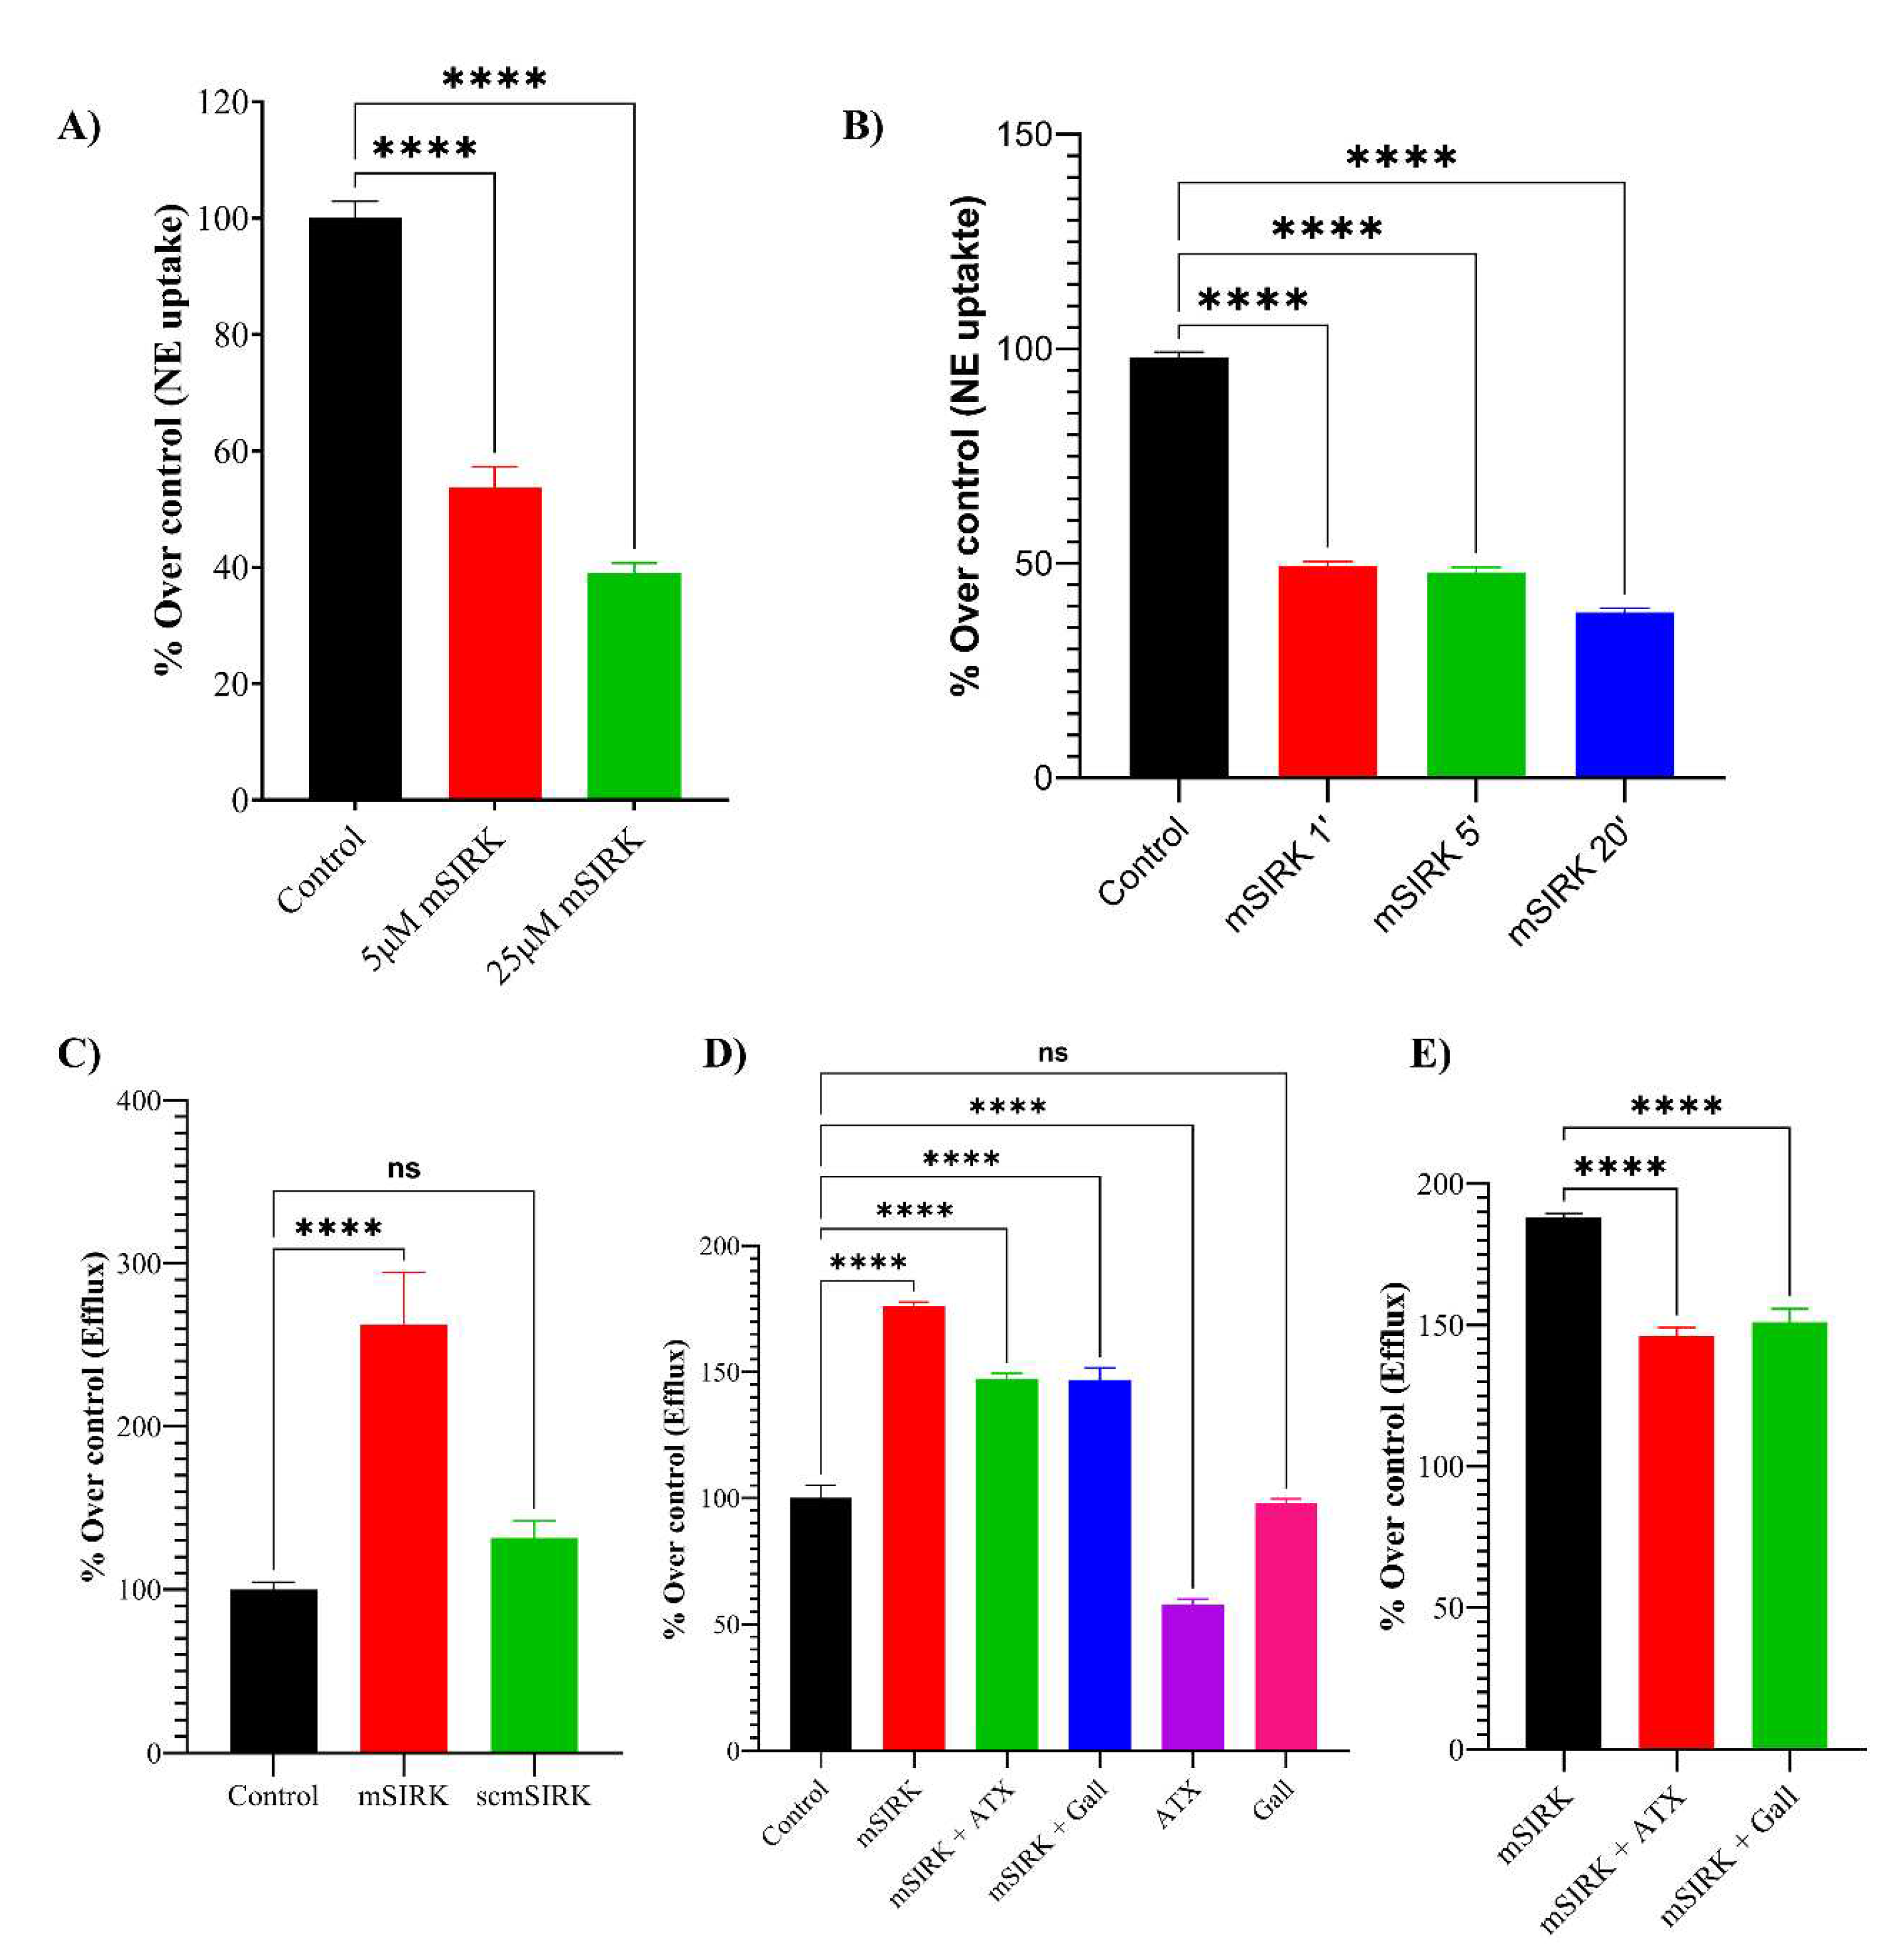
Finally, the effects of Gβγ activation by the specific activator mSIRK were investigated using uptake and efflux assays in HEK293-hNET cells. Both 5µM and 25µM of mSIRK led to a significant reduction (40-60%) in the total uptake of [3H]-NE compared to the control (Figure 5A). The inhibition of [3H]-NE uptake was rapid and consistently reduced by at least 50% compared to the control at all time points (Figure 5B). Importantly, activation of Gβγ with mSIRK significantly increased the efflux or release of [3H]-NE compared to control cells (Figure 5C). The effect of mSIRK on efflux was partially prevented by the selective NET inhibitor ATX or the Gβγ inhibitor Gallein (Gall). ATX alone showed a small but significant reduction in basal efflux compared to control cells, indicating some level of leakiness in the absence of Gβγ activation (Figure 5D). A scramble sequence of the mSIRK peptide (scmSIRK) was used as a control, which did not affect NE efflux compared to control cells (Figure 5E). This confirms that the observed effects with mSIRK are specifically due to the activation of Gβγ and not an intrinsic effect of the peptide sequence. These results demonstrate that the activation of Gβγ by mSIRK leads to a significant reduction in NE uptake and an increase in NE efflux in HEK293-hNET cells. The time course experiment suggests a rapid inhibitory effect of mSIRK on NE uptake. The control experiment using scmSIRK confirms the specificity of the mSIRK peptide in activating Gβγ.
  • Interaction between NET and Gβγ revealed by a proximity ligation assay
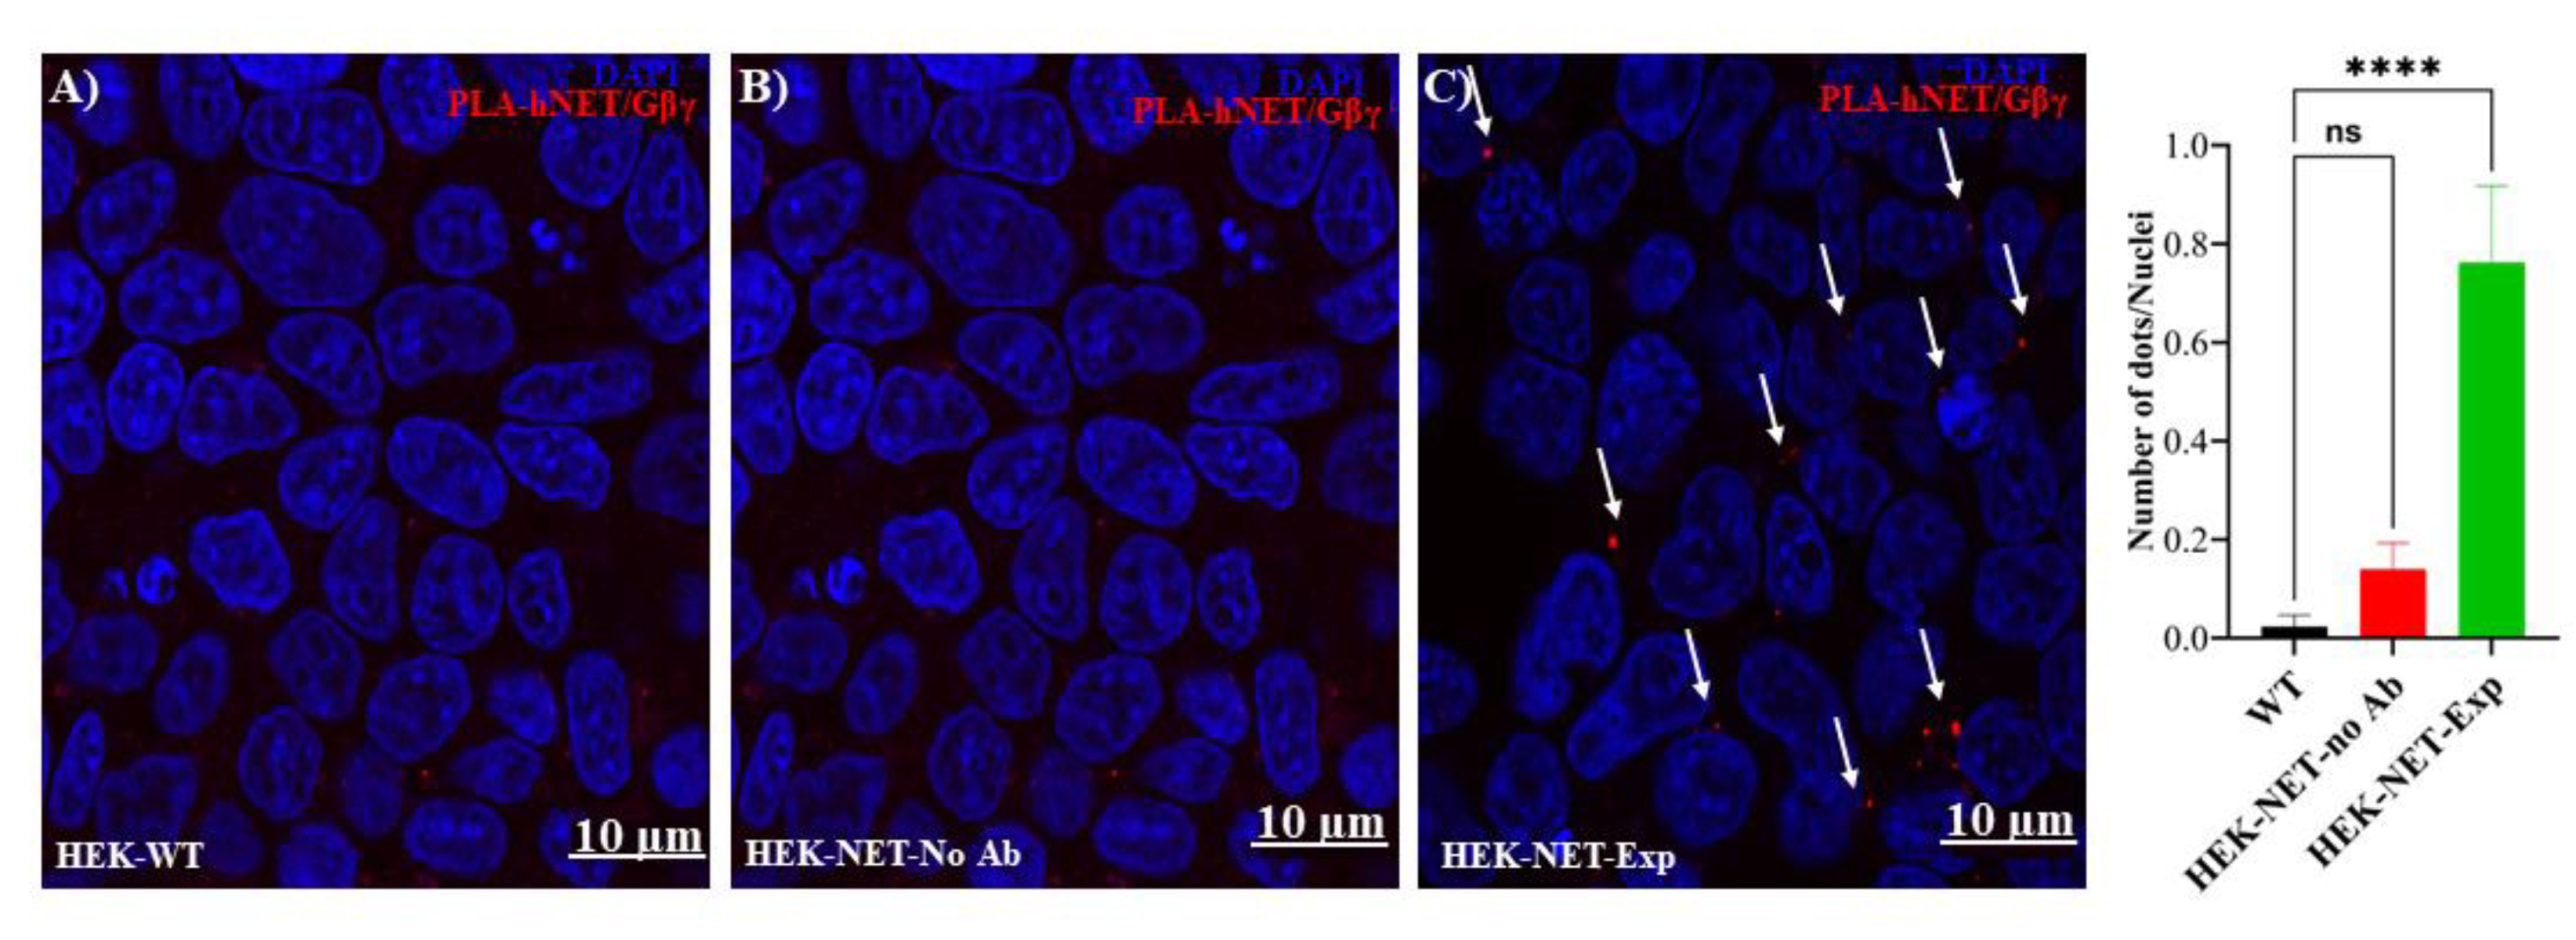
According to our proposal, the efflux of NE is produced by activating the Gβγ subunit producing a close interaction between hNET and Gβγ. To provide direct evidence for a physical interaction between NET and Gβγ, the Proximity Ligation Assay (PLA) was used. This approach allows in situ detection of endogenous protein-protein interactions using oligonucleotide-labeled secondary antibodies (PLA probes) that bind to the primary antibodies to proteins that are in close proximity (< 40nm). In the transfected cells, red dots representing the PLA signal indicate that hNET and Gβγ proteins are in close proximity (< 40nm), supporting an interaction between them (Figure 6). In contrast, no red dots are observed in the wild-type (WT) cells and the no antibody controls, indicating the specificity of the PLA signal. Based on these findings, it can be concluded that the efflux of NE observed in the cells upon the activation of the Gβγ subunit is likely a result of a direct interaction between hNET and Gβγ. The PLA assay provides evidence for the close proximity of these proteins, supporting their functional interaction in the regulation of NE efflux.

4. Conclusions

In conclusion, our structural studies have provided valuable insights into the 3D model of NET and its interactions with NE. We have identified key residues within the NET/NE complex and demonstrated that the binding between NET and Gβγ is energetically favorable and stable throughout the simulation; specifically, the carboxy terminus of NET interacts with a highly charged region in Gβγ. Our findings also revealed notable differences in the movement of several transmembrane (TM) domains when NE is present or absent from the transporter complex. The presence of NE in the binding site influences the free energy of interaction between NET and Gβγ, the distribution of electrostatic potential, and the conformational space of the complex. These effects promote the opening of NET towards the extracellular space. Through in-silico mutations, we have demonstrated the significance of four specific residues in the carboxy terminus of NET for maintaining interactions with Gβγ.
Furthermore, our in vitro studies using HEK293 cells expressing hNET have confirmed the functional nature of the protein, as it effectively uptakes and releases NE in the presence of amphetamine (AMPH). Activation of Gβγ with mSIRK reduces uptake and promotes NE efflux, which can be partially prevented by blocking the transporter with ATX or inhibiting Gβγ with Gallein. Supporting our in silico and in vitro findings, the PLA provides visual evidence of the close proximity between hNET and Gβγ, suggesting direct interaction and subsequent efflux of NE. These conformational changes observed in the molecular dynamics (MD) simulation support the movement of NE from the intracellular to the extracellular space. Our comprehensive approach combining structural, computational, and experimental techniques has shed light on the intricate mechanisms underlying NET function and its interaction with Gβγ. These findings have important implications for understanding neurotransmitter regulation and provide a foundation for the development of novel therapeutic approaches targeting mood disorders and related conditions.

Supplementary Materials

The following supporting information can be downloaded at the website of this paper posted on Preprints.org. Figure S1: Docking of NET with NE using Autodock4 and NET/Gβγ using HADDOCK2.4. Figure S2: NET/NE system RMSD, RMSF, SASA, and Radius of gyration during 1.5 µs of simulation. Figure S3: NET/NE/Gβγ system RMSD, RMSF, SASA, and Radius of gyration during 1.5 µs of simulation. Figure S4: Differential NE mode of interaction in NET (ionic and chelation modes). Figure S5: Superposition of the volumes detected using Hollow program in NET/NE and NET/NE/Gβγ complex after 1.5 µs of simulation.

Author Contributions

LD: AF, and GT designed the research work. LD performed the experiments. LD analyzed the data. LD, AF, and GT drafted the manuscript and revised the paper's content. All authors have read and agreed to the published version of the manuscript.

Funding

We are grateful to the Fierro and Torres laboratories for their insightful discussions. This work was supported by Fondecyt grants 1161375 (AF) and 1221030 (AF) and NIH R01 Grant DA038598 (GT). LDV is supported by an ANID Doctoral fellowship from Chile.

Data Availability Statement

The data presented in this study are available upon request from the corresponding authors.

Acknowledgments

We are grateful to the Fierro and Torres laboratories for their insightful discussions. This work is dedicated to the memory of Dr. Marc Caron, a gifted scientist and inspiring mentor.

Conflicts of Interest

The authors declare no conflict of interest.

References

  1. G. Aston-Jones and B. Waterhouse, “Locus coeruleus: From global projection system to adaptive regulation of behavior,” Brain Res., vol. 1645, no. 12, pp. 75–78, Aug. 2016. [CrossRef]
  2. Borodovitsyna, M. Flamini, and D. Chandler, “Noradrenergic Modulation of Cognition in Health and Disease,” Neural Plast., vol. 2017, no. Lc, pp. 1–14, 2017. [CrossRef]
  3. G. E. Torres, R. R. G. E. Torres, R. R. Gainetdinov, and M. G. Caron, “Plasma membrane monoamine transporters: structure, regulation and function,” Nat. Rev. Neurosci., vol. 4, no. 1, pp. 13–25, Jan. 2003. [CrossRef]
  4. Góral, K. Łątka, and M. Bajda, “Structure Modeling of the Norepinephrine Transporter,” Biomolecules, vol. 10, no. 1, p. 102, Jan. 2020. [CrossRef]
  5. G. Zheng et al., “Exploring the inhibitory mechanism of approved selective norepinephrine reuptake inhibitors and reboxetine enantiomers by molecular dynamics study,” Sci. Rep., vol. 6, no. December 2015, pp. 1–13, 2016. [CrossRef]
  6. E. Bogi et al., “Perinatal exposure to venlafaxine leads to lower anxiety and depression-like behavior in the adult rat offspring,” Behav. Pharmacol., vol. 29, no. 5, pp. 445–452, 2018. [CrossRef]
  7. S. Iyengar, A. A. S. Iyengar, A. A. Webster, S. K. Hemrick-Luecke, J. Y. Xu, and R. M. A. Simmons, “Efficacy of Duloxetine, a Potent and Balanced Serotonin-Norepinephrine Reuptake Inhibitor in Persistent Pain Models in Rats,” J. Pharmacol. Exp. Ther., vol. 311, no. 2, pp. 576–584, Nov. 2004. [CrossRef]
  8. S. S. Somkuwar, K. M. S. S. Somkuwar, K. M. Kantak, and L. P. Dwoskin, “Effect of methylphenidate treatment during adolescence on norepinephrine transporter function in orbitofrontal cortex in a rat model of attention deficit hyperactivity disorder,” J. Neurosci. Methods, vol. 252, no. 1, pp. 55–63, Aug. 2015. [CrossRef]
  9. K. M. Kahlig et al., “Amphetamine induces dopamine efflux through a dopamine transporter channel,” Proc. Natl. Acad. Sci., vol. 102, no. 9, pp. 3495–3500, Mar. 2005. [CrossRef]
  10. G. Rudnick and S. C. Wall, “The molecular mechanism of ‘ecstasy’ [3,4-methylenedioxy-methamphetamine (MDMA)]: serotonin transporters are targets for MDMA-induced serotonin release.,” Proc. Natl. Acad. Sci., vol. 89, no. 5, pp. 1817–1821, Mar. 1992. [CrossRef]
  11. F. Binda et al., “Syntaxin 1A Interaction with the Dopamine Transporter Promotes Amphetamine-Induced Dopamine Efflux,” Mol. Pharmacol., vol. 74, no. 4, pp. 1101–1108, Oct. 2008. [CrossRef]
  12. L. A. Johnson, B. L. A. Johnson, B. Guptaroy, D. Lund, S. Shamban, and M. E. Gnegy, “Regulation of Amphetamine-stimulated Dopamine Efflux by Protein Kinase C β,” J. Biol. Chem., vol. 280, no. 12, pp. 10914–10919, Mar. 2005. [CrossRef]
  13. J. Garcia-Olivares et al., “Gβγ subunit activation promotes dopamine efflux through the dopamine transporter,” Mol. Psychiatry, vol. 22, no. 12, pp. 1673–1679, Dec. 2017. [CrossRef]
  14. J. A. Pino, G. J. A. Pino, G. Nuñez-Vivanco, G. Hidalgo, M. Reyes Parada, H. Khoshbouei, and G. E. Torres, “Identification of Critical Residues in the Carboxy Terminus of the Dopamine Transporter Involved in the G Protein βγ-Induced Dopamine Efflux,” Front. Pharmacol., vol. 12, no. March, pp. 1–10, Mar. 2021. [CrossRef]
  15. J. C. Mauna et al., “G protein βγ subunits play a critical role in the actions of amphetamine,” Transl. Psychiatry, vol. 9, no. 1, p. 81, Dec. 2019. [CrossRef]
  16. N. Eswar et al., “Comparative Protein Structure Modeling Using Modeller,” Curr. Protoc. Bioinforma., vol. 15, no. 1, pp. 27–49, Sep. 2006. [CrossRef]
  17. M. Wiederstein and M. J. Sippl, “ProSA-web: Interactive web service for the recognition of errors in three-dimensional structures of proteins,” Nucleic Acids Res., vol. 35, no. SUPPL.2, pp. 407–410, 2007. [CrossRef]
  18. R. A. Laskowski, M. W. R. A. Laskowski, M. W. MacArthur, D. S. Moss, and J. M. Thornton, “PROCHECK: a program to check the stereochemical quality of protein structures,” J. Appl. Crystallogr., vol. 26, no. 2, pp. 283–291, 1993. [CrossRef]
  19. J. C. Gordon, J. B. J. C. Gordon, J. B. Myers, T. Folta, V. Shoja, L. S. Heath, and A. Onufriev, “H++: A server for estimating pKas and adding missing hydrogens to macromolecules,” Nucleic Acids Res., vol. 33, no. SUPPL. 2, pp. 368–371, 2005. [CrossRef]
  20. S. Arancibia, M. S. Arancibia, M. Marambio, J. M. Campusano, and A. Fierro, “Modeling of the Binding of Octopamine and Dopamine in Insect Monoamine Transporters Reveals Structural and Electrostatic Differences,” ACS Chem. Neurosci., vol. 10, no. 5, pp. 2310–2317, May 2019. [CrossRef]
  21. C. Dominguez, R. C. Dominguez, R. Boelens, and A. M. J. J. Bonvin, “HADDOCK: A Protein−Protein Docking Approach Based on Biochemical or Biophysical Information,” J. Am. Chem. Soc., vol. 125, no. 7, pp. 1731–1737, Feb. 2003. [CrossRef]
  22. G. Rojas, I. G. Rojas, I. Orellana, R. Rosales-Rojas, J. García-Olivares, J. Comer, and A. Vergara-Jaque, “Structural Determinants of the Dopamine Transporter Regulation Mediated by G Proteins,” J. Chem. Inf. Model., vol. 60, no. 7, pp. 3577–3586, Jul. 2020. [CrossRef]
  23. J. R. Biller, H. J. R. Biller, H. Elajaili, V. Meyer, G. M. Rosen, S. S. Eaton, and G. R. Eaton, “The Amber biomolecular simulation programs.,” J. Magn. Reson., vol. 236, no. 16, pp. 47–56, 2013.
  24. C. J. Dickson et al., “Lipid14: The Amber Lipid Force Field - Supplementary Data,” J. Chem. Theory Comput., vol. 10, no. 2, pp. 865–879, 2014, [Online]. Available: http://pubs.acs.org/doi/abs/10.1021/ct4010307.
  25. P. Mark and L. Nilsson, “Structure and dynamics of the TIP3P, SPC, and SPC/E water models at 298 K,” J. Phys. Chem. A, vol. 105, no. 43, pp. 9954–9960, 2001. [CrossRef]
  26. B. R. Miller, T. D. B. R. Miller, T. D. McGee, J. M. Swails, N. Homeyer, H. Gohlke, and A. E. Roitberg, “MMPBSA.py: An efficient program for end-state free energy calculations,” J. Chem. Theory Comput., vol. 8, no. 9, pp. 3314–3321, 2012. [CrossRef]
  27. D. Ouedraogo, M. D. Ouedraogo, M. Souffrant, X.-Q. Yao, D. Hamelberg, and G. Gadda, “Non-active Site Residue in Loop L4 Alters Substrate Capture and Product Release in D-Arginine Dehydrogenase,” Biochemistry, vol. 62, no. 5, pp. 1070–1081, Mar. 2023. [CrossRef]
  28. U. Doshi, M. J. U. Doshi, M. J. Holliday, E. Z. Eisenmesser, and D. Hamelberg, “Dynamical network of residue-residue contacts reveals coupled allosteric effects in recognition, catalysis, and mutation,” Proc. Natl. Acad. Sci. U. S. A., vol. 113, no. 17, pp. 4735–4740, 2016. [CrossRef]
  29. H. Wickham, Elegant Graphics for Data Analysis: ggplot2. 2008.
  30. W. Humphrey, A. W. Humphrey, A. Dalke, and K. Schulten, “VMD: Visual molecular dynamics,” J. Mol. Graph., vol. 14, no. 1, pp. 33–38, Feb. 1996. [CrossRef]
  31. S. Pidathala, A. K. S. Pidathala, A. K. Mallela, D. Joseph, and A. Penmatsa, “Structural basis of norepinephrine recognition and transport inhibition in neurotransmitter transporters,” Nat. Commun., vol. 12, no. 1, pp. 1–12, 2021. [CrossRef]
  32. A. Schlessinger et al., “Structure-based discovery of prescription drugs that interact with the norepinephrine transporter, NET,” Proc. Natl. Acad. Sci. U. S. A., vol. 108, no. 38, pp. 15810–15815, 2011. [CrossRef]
  33. S. Manepalli, C. K. S. Manepalli, C. K. Surratt, J. D. Madura, and T. L. Nolan, “Monoamine Transporter Structure, Function, Dynamics, and Drug Discovery: A Computational Perspective,” AAPS J., vol. 14, no. 4, pp. 820–831, Dec. 2012. [CrossRef]
  34. H. Xhaard, V. H. Xhaard, V. Backström, K. Denessiouk, and M. S. Johnson, “Coordination of Na + by Monoamine Ligands in Dopamine, Norepinephrine, and Serotonin Transporters,” J. Chem. Inf. Model., vol. 48, no. 7, pp. 1423–1437, Jul. 2008. [CrossRef]
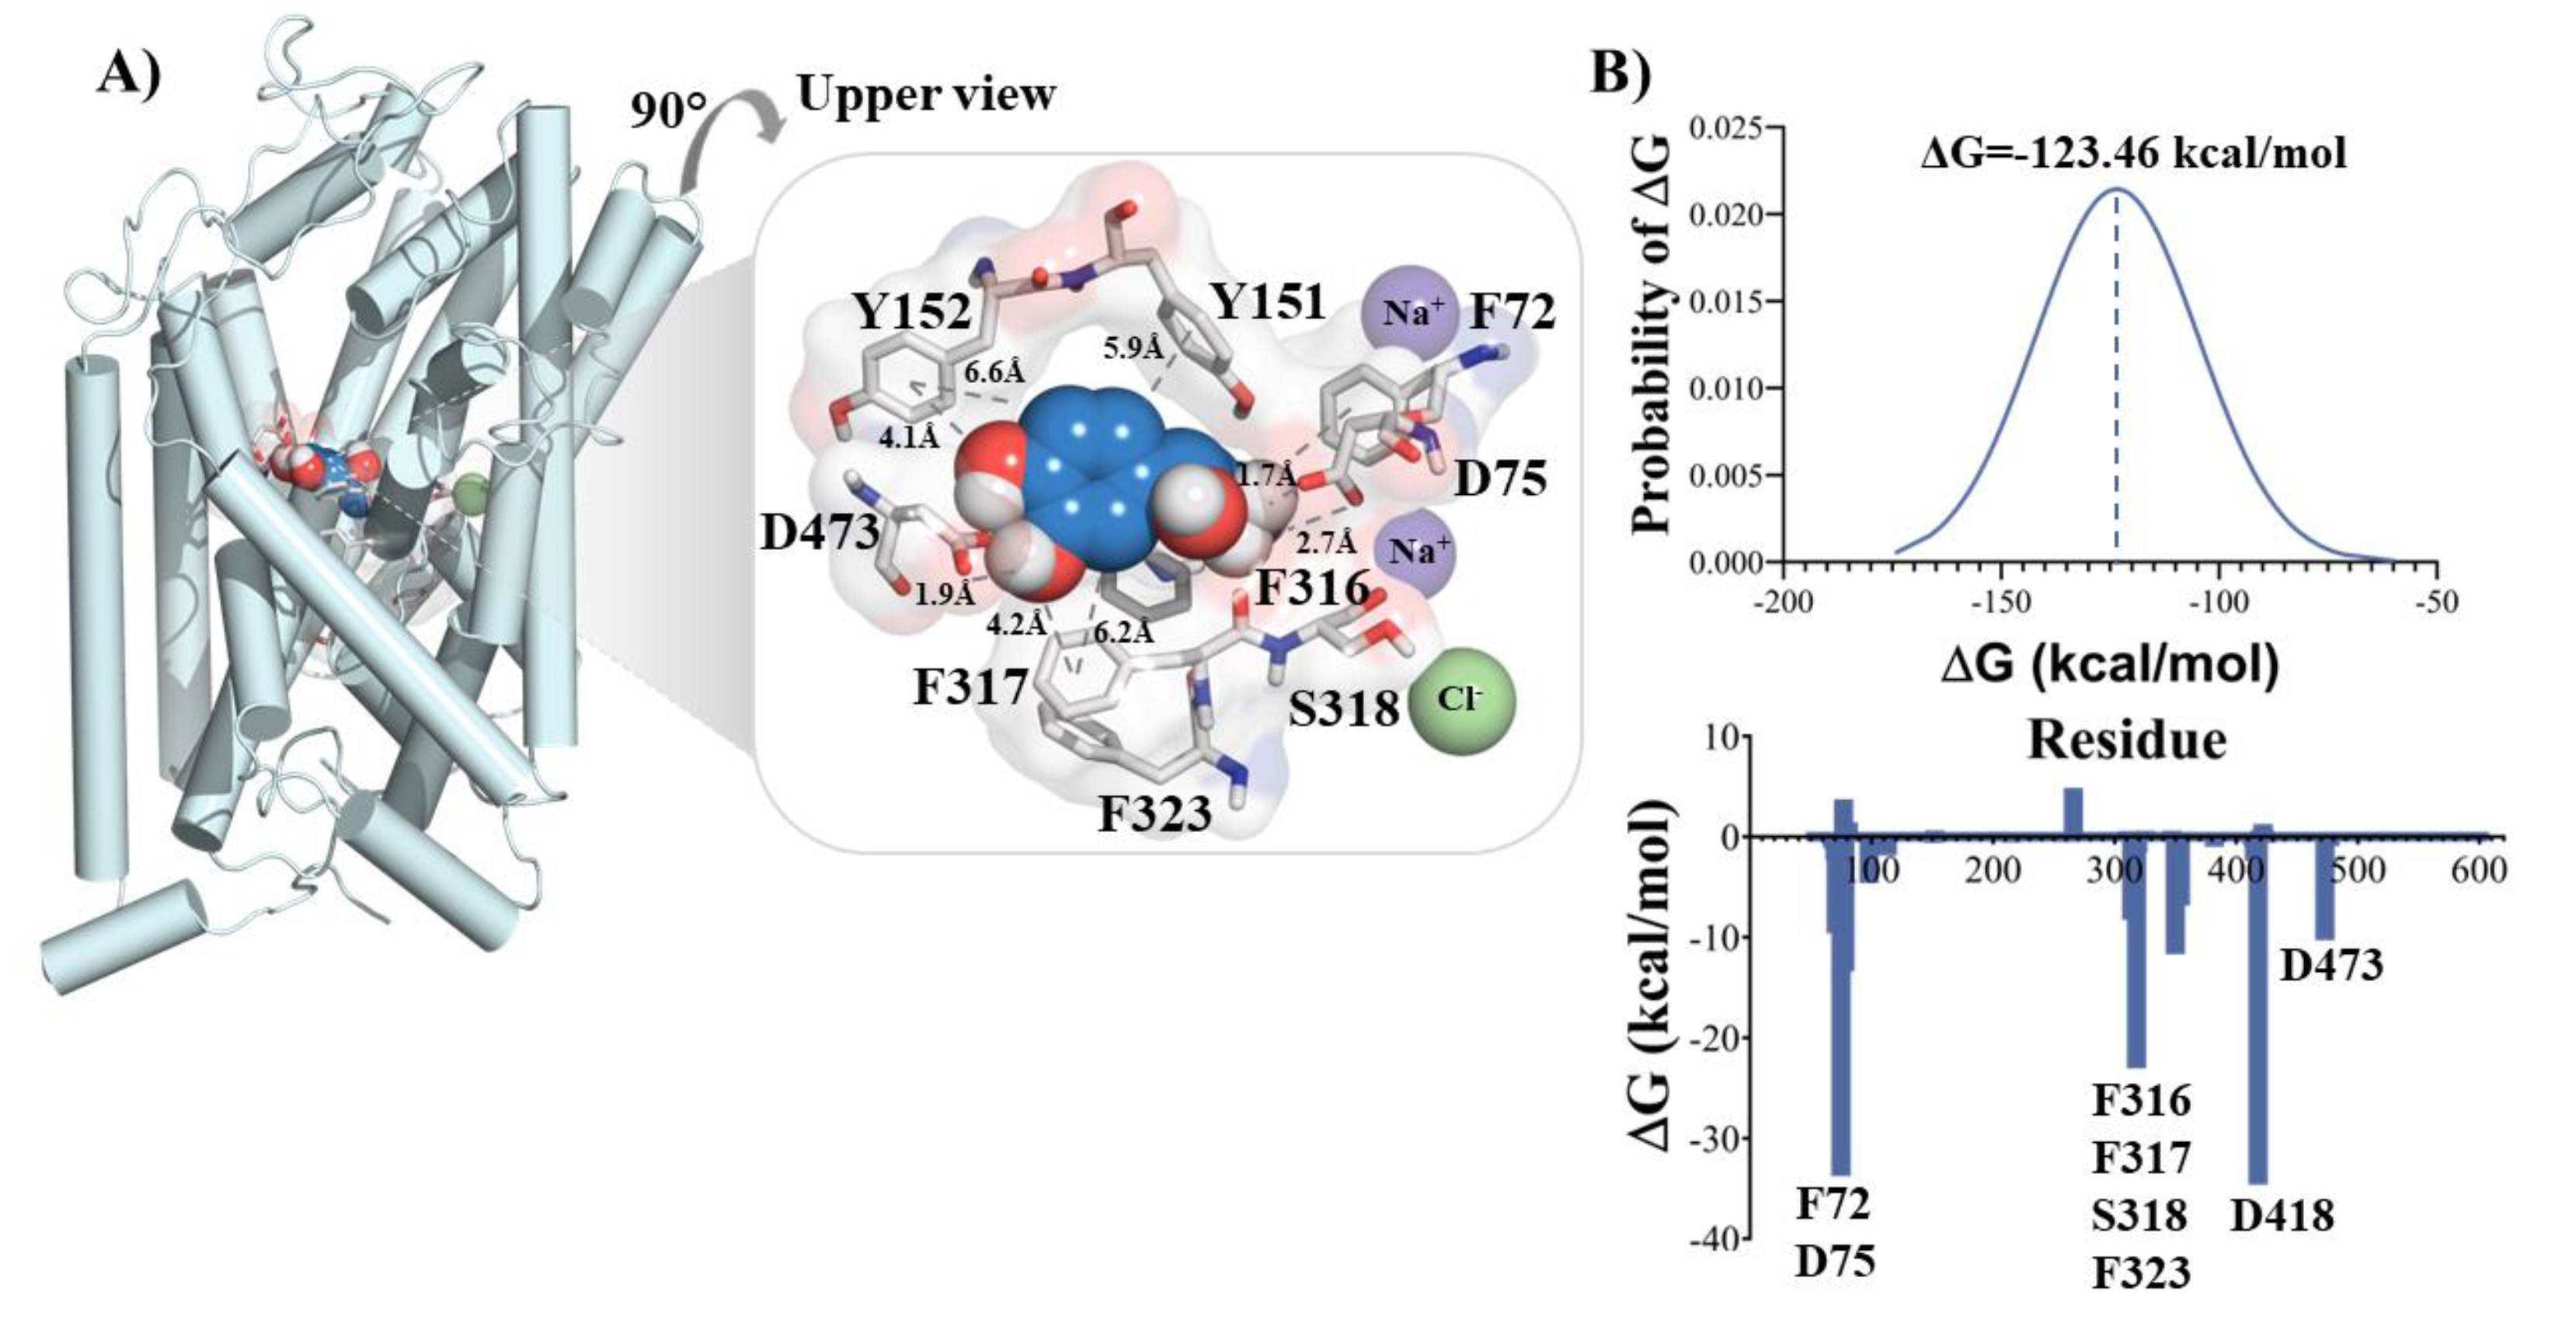
Figure 1. MD simulation of NET/NE complex. (A) Conformational change of the NET/NE complex after 1.5µs of simulation and the principal interactions between NET and NE (residues from NET are shown in white sticks). (B) Binding free energy of NE to NET calculated using MM/PBSA (top); free energy contribution of residues of the binding site of NET (bottom).
Preprints 79725 g001
Figure 2. MD simulation of NET/NE/Gβγ complex. (A) Conformational change of the NET/NE/Gβγ complex after 1.5 µs of simulation (top: NE interacting in the binding site of NET; bottom: Interacting space between NET and Gβγ). (B) Binding free energy of NE to NET in the presence of Gβγ calculated using MM/PBSA (top); free energy contribution of residues of the binding site of NET and the interface with Gβγ (middle); Close up to the residues of the interface NET/Gβγ (bottom).
Preprints 79725 g002
Figure 3. Contact, Principal component analysis (PCA) comparison and volume detected in NET. (A) Principal Component Analysis (PCA) showing in red the NET/NE/Gβγ and in black the NET/Gβγ. (B) 2-D representation of the mean contacts between the different populations associated to the NET/Gβγ systems, red lines show weakening of contacts and blue lines strengthening of contacts. (C) Volume detected in the cavities of NET after simulation with NE and NET/Gβγ complex after simulation with NE.
Preprints 79725 g003
Figure 4. Immunohistochemical detection of hNET in transfected HEK cells, and functional assays of HEK-hNET cells. (A) hNET detection in transfected HEK cells, using a polyclonal anti-hNET antibody (upper panel shows the experiments, lower panels show the control without primary antibody). (B) Uptake of [3H]-NE in HEK-hNET cells, (C) Efflux of [3H]-NE produced by amphetamine 40µM in pre-loaded HEK-hNET cells. (AMPH: Amphetamine 40µM, ATX: Atomoxetine 1µM). P< 0.05.
Preprints 79725 g004
Figure 5. (A) Uptake of [3H]-NE in HEK-NET cells in the presence of 5 and 25 µM of mSIRK. (B) Time course of mSIRK effect on the uptake of [3H]-NE, with incubation times of 1, 5, and 25 minutes. (C) Efflux of [3H]-NE produced by mSIRK 100µM in pre-loaded HEK-hNET cells. (mSIRK: 100µM, ATX: Atomoxetine 2µM, Gall: Gallein 1µM). (D) Reduction of the efflux between mSIRK treatment and mSIRK +ATX or Gall. (E) Efflux of [3H]-NE in the presence of mSIRK and scrmSIRK (scrmSIRK: scramble mSIRK 100µM).P<0.05.
Preprints 79725 g005
Figure 6. Proximity Ligation Assay (PLA) of hNET and Gβγ subunit. PLA of hNET- Gβγ in HEK-WT (top left image), HEK-hNET without antibody (top right), and HEK-hNET with primary antibody (bottom center), images at 63X. Red dots are the signal of PLA indicated with the white arrows. P<0.05.
Preprints 79725 g006
Disclaimer/Publisher’s Note: The statements, opinions and data contained in all publications are solely those of the individual author(s) and contributor(s) and not of MDPI and/or the editor(s). MDPI and/or the editor(s) disclaim responsibility for any injury to people or property resulting from any ideas, methods, instructions or products referred to in the content.
Copyright: This open access article is published under a Creative Commons CC BY 4.0 license, which permit the free download, distribution, and reuse, provided that the author and preprint are cited in any reuse.
Prerpints.org logo

Preprints.org is a free preprint server supported by MDPI in Basel, Switzerland.

Subscribe

© 2024 MDPI (Basel, Switzerland) unless otherwise stated