Preprint
Article

On the Use of Artificial Intelligence in Predicting the Compressive Strength of Various Cardboard Packaging

Altmetrics

Downloads

236

Views

92

Comments

0

A peer-reviewed article of this preprint also exists.

Submitted:

16 July 2023

Posted:

18 July 2023

You are already at the latest version

Alerts
Abstract
Artificial intelligence is increasingly used in various branches of engineering. In this article, artificial neural networks are used to predict the crush resistance of corrugated packaging. Among the analysed packages were boxes with ventilation openings, packages with perforations, and typical flap boxes, which makes the proposed estimation method very universal. Typical shallow feedforward networks were used, which are perfect for regression problems, mainly when the set of input and output parameters is small, so no complicated architecture or advanced learning techniques are required. The input parameters of the neural networks are selected so as to take into account not only the material used for the production of the packaging, but also the dimensions of the box and the impact of ventilation holes and perforations on the load capacity of individual walls of the packaging. In order to maximize the effectiveness of neural network training process, the group of input parameters was changed so as to eliminate those to which the sensitivity of the model was the lowest. This allowed the selection of the optimal configuration of training pairs for which the estimation error was on the acceptable level. Finally, models of neural networks were selected, for which the training and testing error did not exceed 10%. The demonstrated effectiveness allows to conclude that the proposed set of universal input parameters is suitable for efficient training of a single neural network model capable of predicting the compressive strength of various types of corrugated packaging.
Keywords: 
Subject: Engineering  -   Mechanical Engineering

Introduction

Recent trends and increasing demand in corrugated board packaging market require from manufacturers and researchers, the development of innovative solutions to provide ease of shaping and attractive appearance of the packaging, robustly supported by sufficient box strength. Such needs highlight, in the engineering community, specific computational and experimental research challenging subjects, both from a material standpoint[1] and from a packaging point of view[2].
Proper understanding of packaging structural behaviour requires, as a first step, a detailed knowledge of mechanical properties of the employed material, namely of cardboard. Corrugated board is built as a sandwich composite material with individual layers, alternatively structured by flat and corrugated papers, usually ranging from two to seven layers. A practical classification of the corrugated layer, called fluting, based on wave height is usually adopted; it is denoted by capital letters, typical wave heights are from A to F. Due to constitutive material properties and internal composite structure, the layered corrugated board typically displays two characteristic in-plane directions of orthotropy, namely, the machine direction (MD), perpendicular to the main axis of the fluting, and cross direction (CD), parallel to the fluting, directly affecting the mechanical response of the paperboard, both in elasticity range and for strength thresholds. In recent literature, numerous works are available to accurately model the mechanical constitutive behaviour of corrugated board, upon computational developments, accounting for anisotropic behaviour,[3,4] plastic behaviour,[5] creep response,[6] forming process,[7,8] creasing and folding conditions,[9,10,11,12,13] as also effectively supported by experimental testing (see, e.g.,[9,14,15]). Consistently, a crucial role in the design of corrugated board packaging is played also by the evaluation of paperboard strength and buckling resistance, e.g., in [16,17,18].
Toward the goals of structural modelling in packaging research and applications, the above mentioned refined understanding and modelling capability for corrugated board requires to be associated with a detailed knowledge of various packaging solutions, both in boxes and trays, particularly with reference to functionality,[19,20,21] numerical modelling,[22,23,24,25] experimental testing[26,27] and, specifically, to box strength.[28,29,30]
In view of reliable structural applications, over the years, several approaches have been developed, specifically conceived as aiming at estimation of box strength of corrugated board packaging. In particular, various approaches devised analytical formulae, although restricted to typical design, subsequently improved by the adoption of numerical tools, such as finite element modelling, toward broader applications or solution of demanding specific issues, such as consideration of layered structure, possibly tackled by homogenisation methodologies. In order to afford such computational and experimental challenging tasks in suitable unified and standardised procedures, two tests have been widespread, namely the Box Compression Test (BCT) and the Edge Crush Test (ECT), as nowadays widely employed in industry. However, despite their measuring effectiveness, these two testing methods are not sufficient, in current practice, in providing reliable data for strength estimation by computational approaches.
Within such context, several authors, in recent years proposed experimental and computational advancements in box strength estimation of corrugated board packaging. In particular, to the aims of the present paper, it is worth to mention the consideration of material moisture level,[31] the analysis of buckling effects,[32] the estimation of compressive strength accounting for openings,[33] perforations,[34] shifted flaps[35] and open-top configurations,[36] the modification of compression test suitable for trays[37] and the extension to drop tests and gable-top shapes.[38]
Despite research innovative contributions and proposed advanced computational methods, in the field of box strength estimation, the demanding task of parameter identification continuously highlights challenging situations both from problem complexity and from time-computational cost viewpoints. Such difficulties may be overcome, in and efficient and reliable way, by the adoption of Artificial Intelligence (AI) strategies, suitable to mimic neural schemes and to reproduce the behaviour of complex structured systems. In the last decades, AI and, specifically, Artificial Neural Network (ANN) methodology have been successfully applied, with growing interest in various engineering and multidisciplinary research fields, such as structural engineering (see, e.g., [39,40,41,42]), biomedical engineering (see, e.g., [43,44,45]), agricultural engineering (see, e.g.,[46,47,48,49]). In particular, in corrugated paperboard research and related applications, ANNs have been employed limited to calibration of mechanical constitutive parameters,[50] estimation of edge crush resistance,[51] evaluation of effects by hand and ventilation holes on box compressive strength.[52]
The main objectives of the present work are devoted to the estimation of corrugated board box strength, in various material and structural configurations, relying on ANN models. Therefore, tackling the demanding task of box strength evaluation by an AI approach aims at providing beneficial contributions regarding wide applicability of the devised method joined with reliability of the computational approach, toward an innovative methodology, also suitable for practical engineering applications.
Following the current Introduction, the paper is organised in two main sections. Section 2 presents the adopted methods and the selected materials for the numerical analyses, particularly with reference to the overall research investigation methodology (Section 2.1), to the collected data to be employed as input dataset in ANN processing (Section 2.2), to the assessed load capacity of the packaging to be analysed (Section 2.3) and to the used ANN structure (Section 2.4). Consequently, Section 3 gathers and discusses the obtained results toward effective reduction of the number of ANN calibration input parameters. A final section, as Conclusions, highlights the innovative contributions and summarises the main steps of the study.

Method and Materials

Framework of the study

The main goal of the work is to obtain an ANN with a higher possible accuracy and in the same time with a small and universal set of training data to predict the compressive load bearing capacity of the cardboard packaging. Industrial conditions, i.e., current production and/or the need for costly and time-consuming retooling of the machines often make it impossible to obtain a large training set, hence, the key is the appropriate selection of input data so that the obtained ANN is reliable. When the set of available training data is limited, mainly due to the difficulty in obtaining laboratory data, the number of input parameters is small, which may result in difficulties in the correct training of artificial neural networks.
A general diagram of the research work carried out is shown in Figure 1, the symbols are explained in Section 2.2. In this paper, experimental data were obtained from load capacity tests of packaging of various designs, based on previous work of the research group,[32,33,34] see Section 2.2. The raw data were systematically processed, which enabled the definition of 14 key input parameters for potential use in ANNs algorithms to predict the packaging strength, see Section 2.3. Then, additional and reduced, three sets of input parameters for alternative artificial neural networks were selected. In summary, four independent types of neural networks were tested here, with the difference in their architecture being mainly to the number of input data. On the basis of preliminary computations (not included in here), the same network architecture (which showed the best accuracy) was adopted for all four types of networks, for details see Section 2.4. Then, training was performed for each of the four types of network 1000 times each. Next, after calculating the root mean square error (RMSE) for each of the obtained network, the one with the lowest RMSE was selected for further use.

Data collected for use in an artificial neural networks

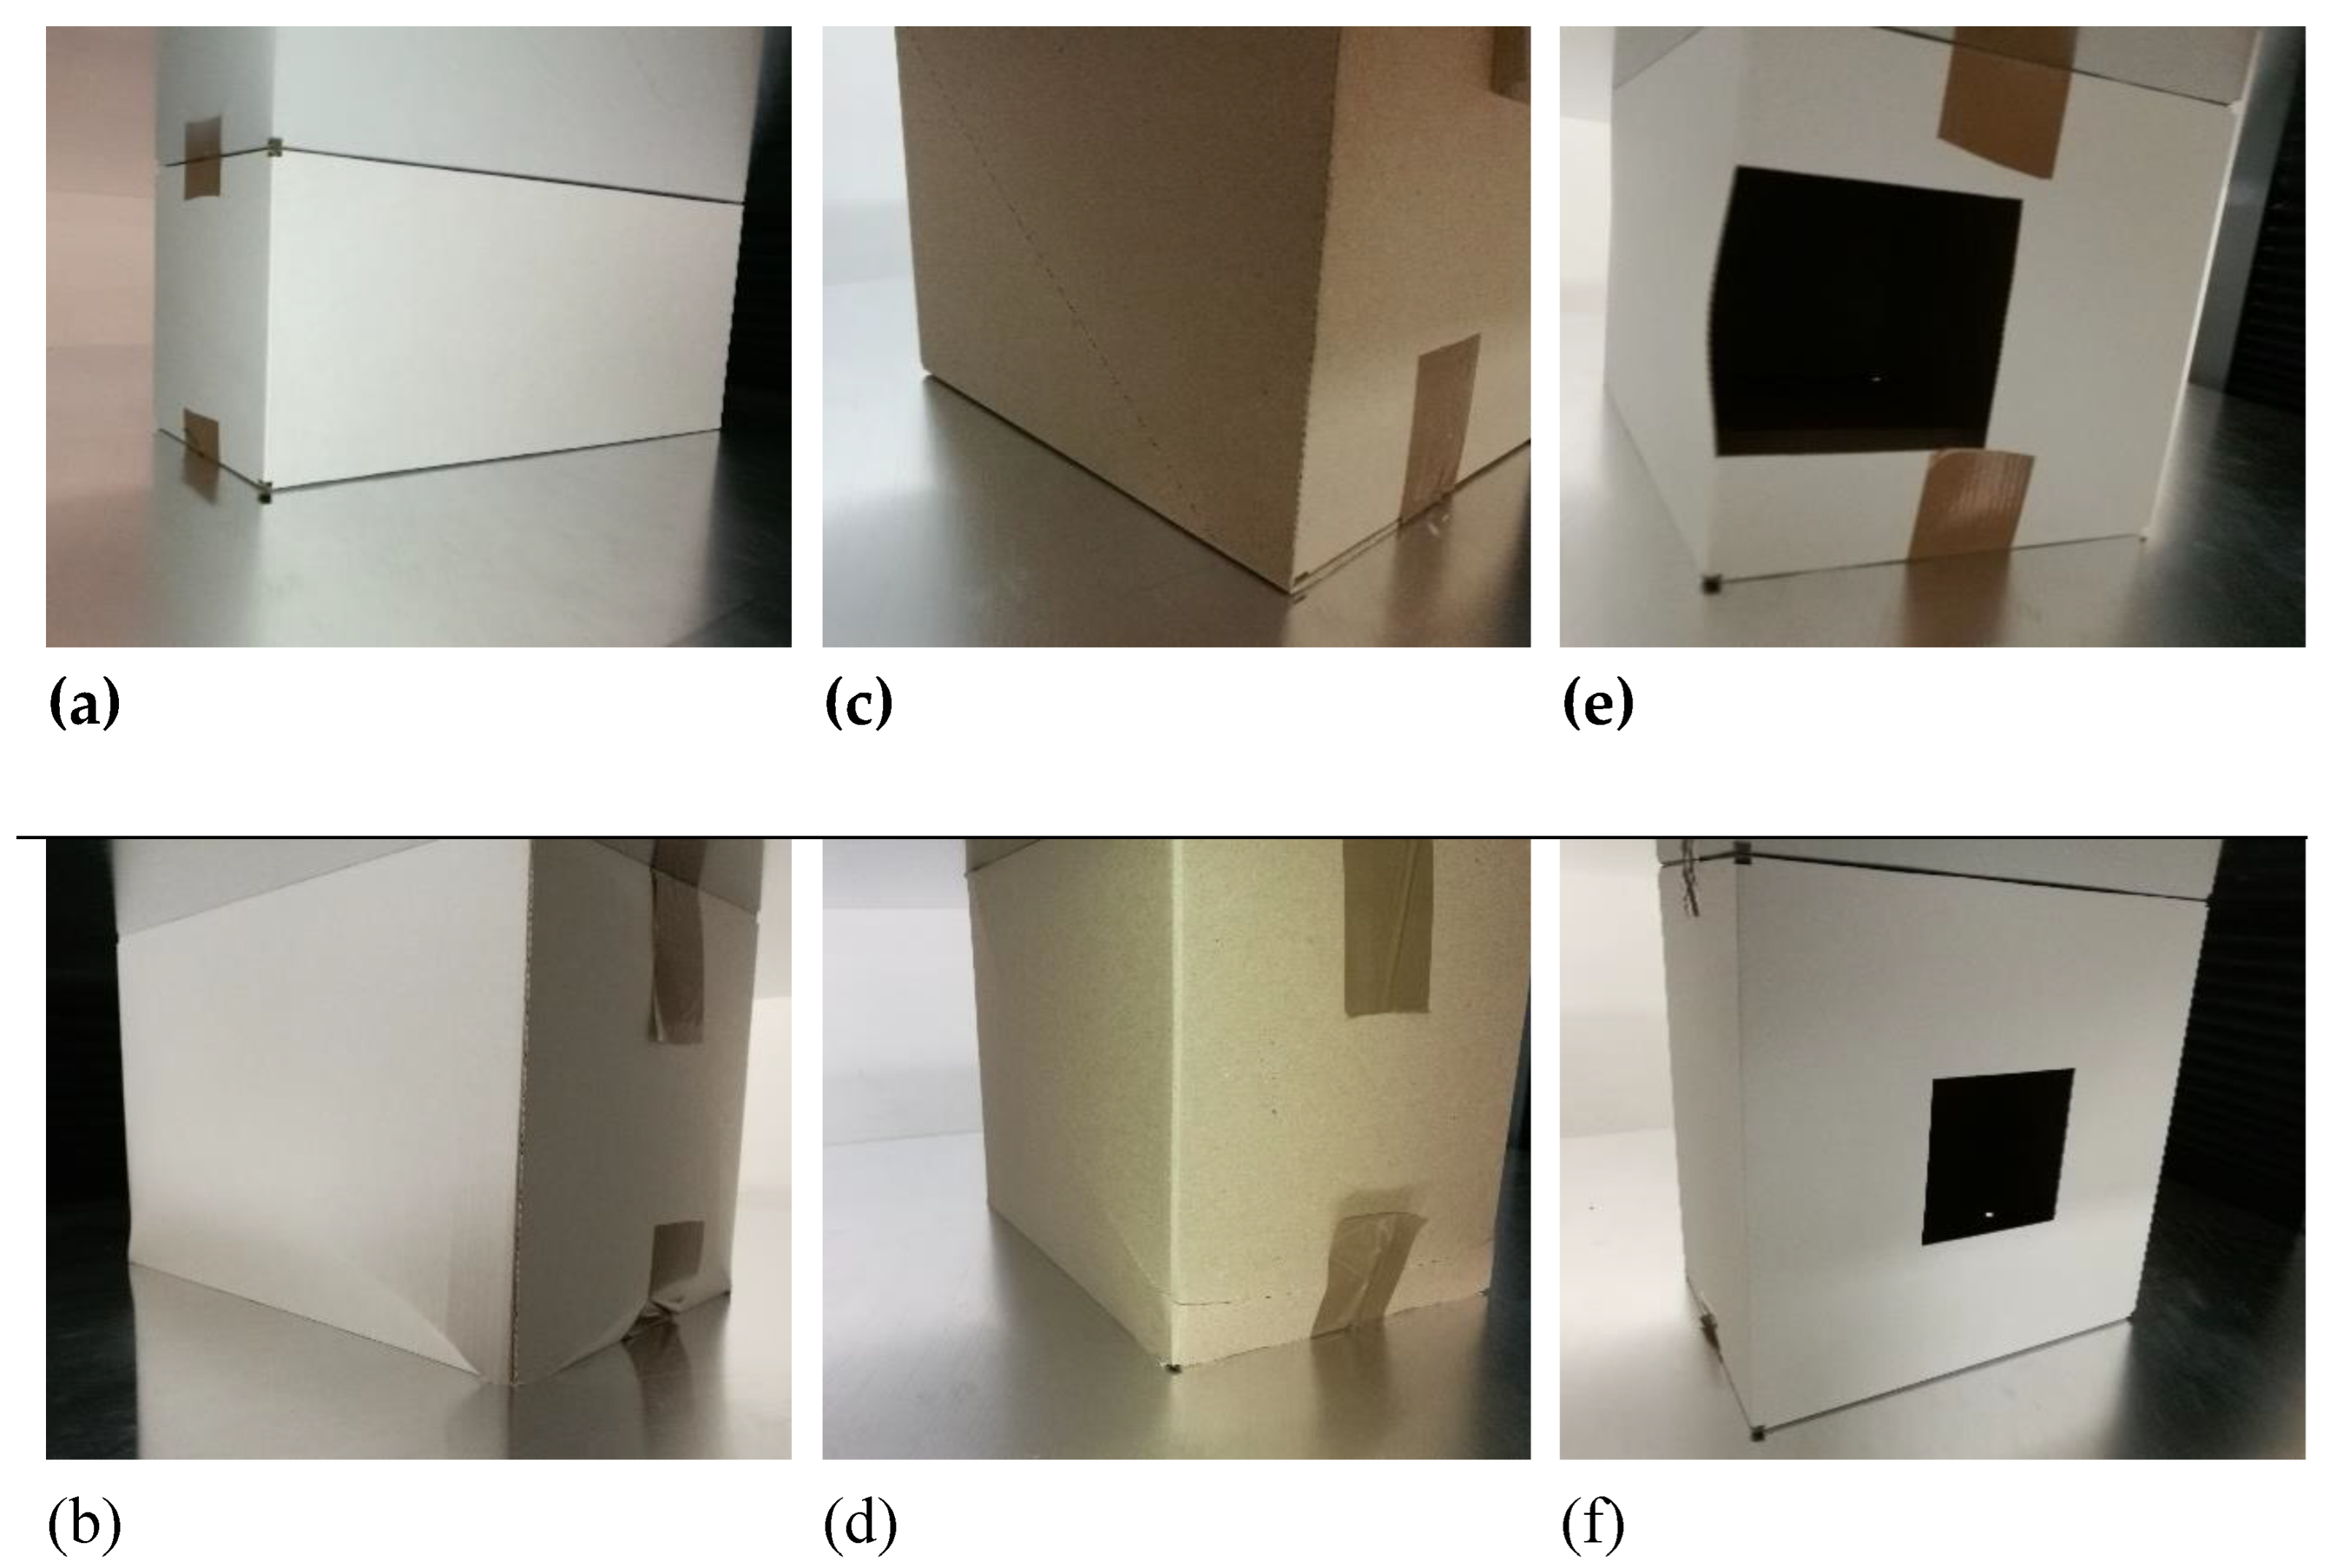
AI for reliable and trust-worthy operation requires significant input/output data for training. In order to use as much data as possible in this paper, the results from several publications were collected.[32,33,34] Data[32] applies to FEFCO F201 type packaging, where no holes, nor perforations were included. In paper,[33] the FEFCO F200 and F201 type packaging were considered with numerous types of holes – cut on longer or shorter walls. In paper,[34] also, FEFCO F201 were used, but with just one box dimensions, because the focus was on various types of perforations and their impact on compressive strength of a box. Figure 2 shows the selected photographs from testing campaigns conducted and resented in our previous research papers[32,33,34].
Due to the co-authorship of the indicated articles, the following input data for ANN training/validation were available:
  • box dimensions (from 100   m m to 450   m m ): width, B , length, L , and height, H
  • specification of the box geometry, i.e., character of the flaps (no flaps, traditional flaps or offset flaps), presence and geometry of holes, and presence and technical details of perforations (type of cutting knife, etc.)
  • effective material properties of the corrugated cardboard expressed as laminate composite constants, i.e., D 11 – bending stiffness in the machine direction, D 22 – bending stiffness in the cross-machine direction, D 33 – twisting bending stiffness, A 44 and A 55 – transverse shear stiffnesses in horizontal and vertical directions, respectively (in regard to box orientation)
  • E C T index and effective thickness of the cardboard as the laminate composite, t e f f
  • critical forces of all four side walls loaded vertically in their plane, P c r i
Moreover, the box compressive strength of the boxes tested were available and considered as an output data for ANN training/testing conducted in this paper. All samples tested were laboratory conditioned according to the standard of TAPPI T402,[53] i.e., the humidity of 50% ±2% and temperature of 23°C ±1°C were maintained in the laboratory. The boxes were folded manually and, if applicable, the flaps were taped (top and bottom). In case of visual damages of the corrugated boards or folded boxes, the samples were skipped. All of the tests were displacement controlled with quasi-static speed of displacement.
For more details regarding input/output data, please see source papers.[32,33,34]

Assessment of the load capacity of the packaging

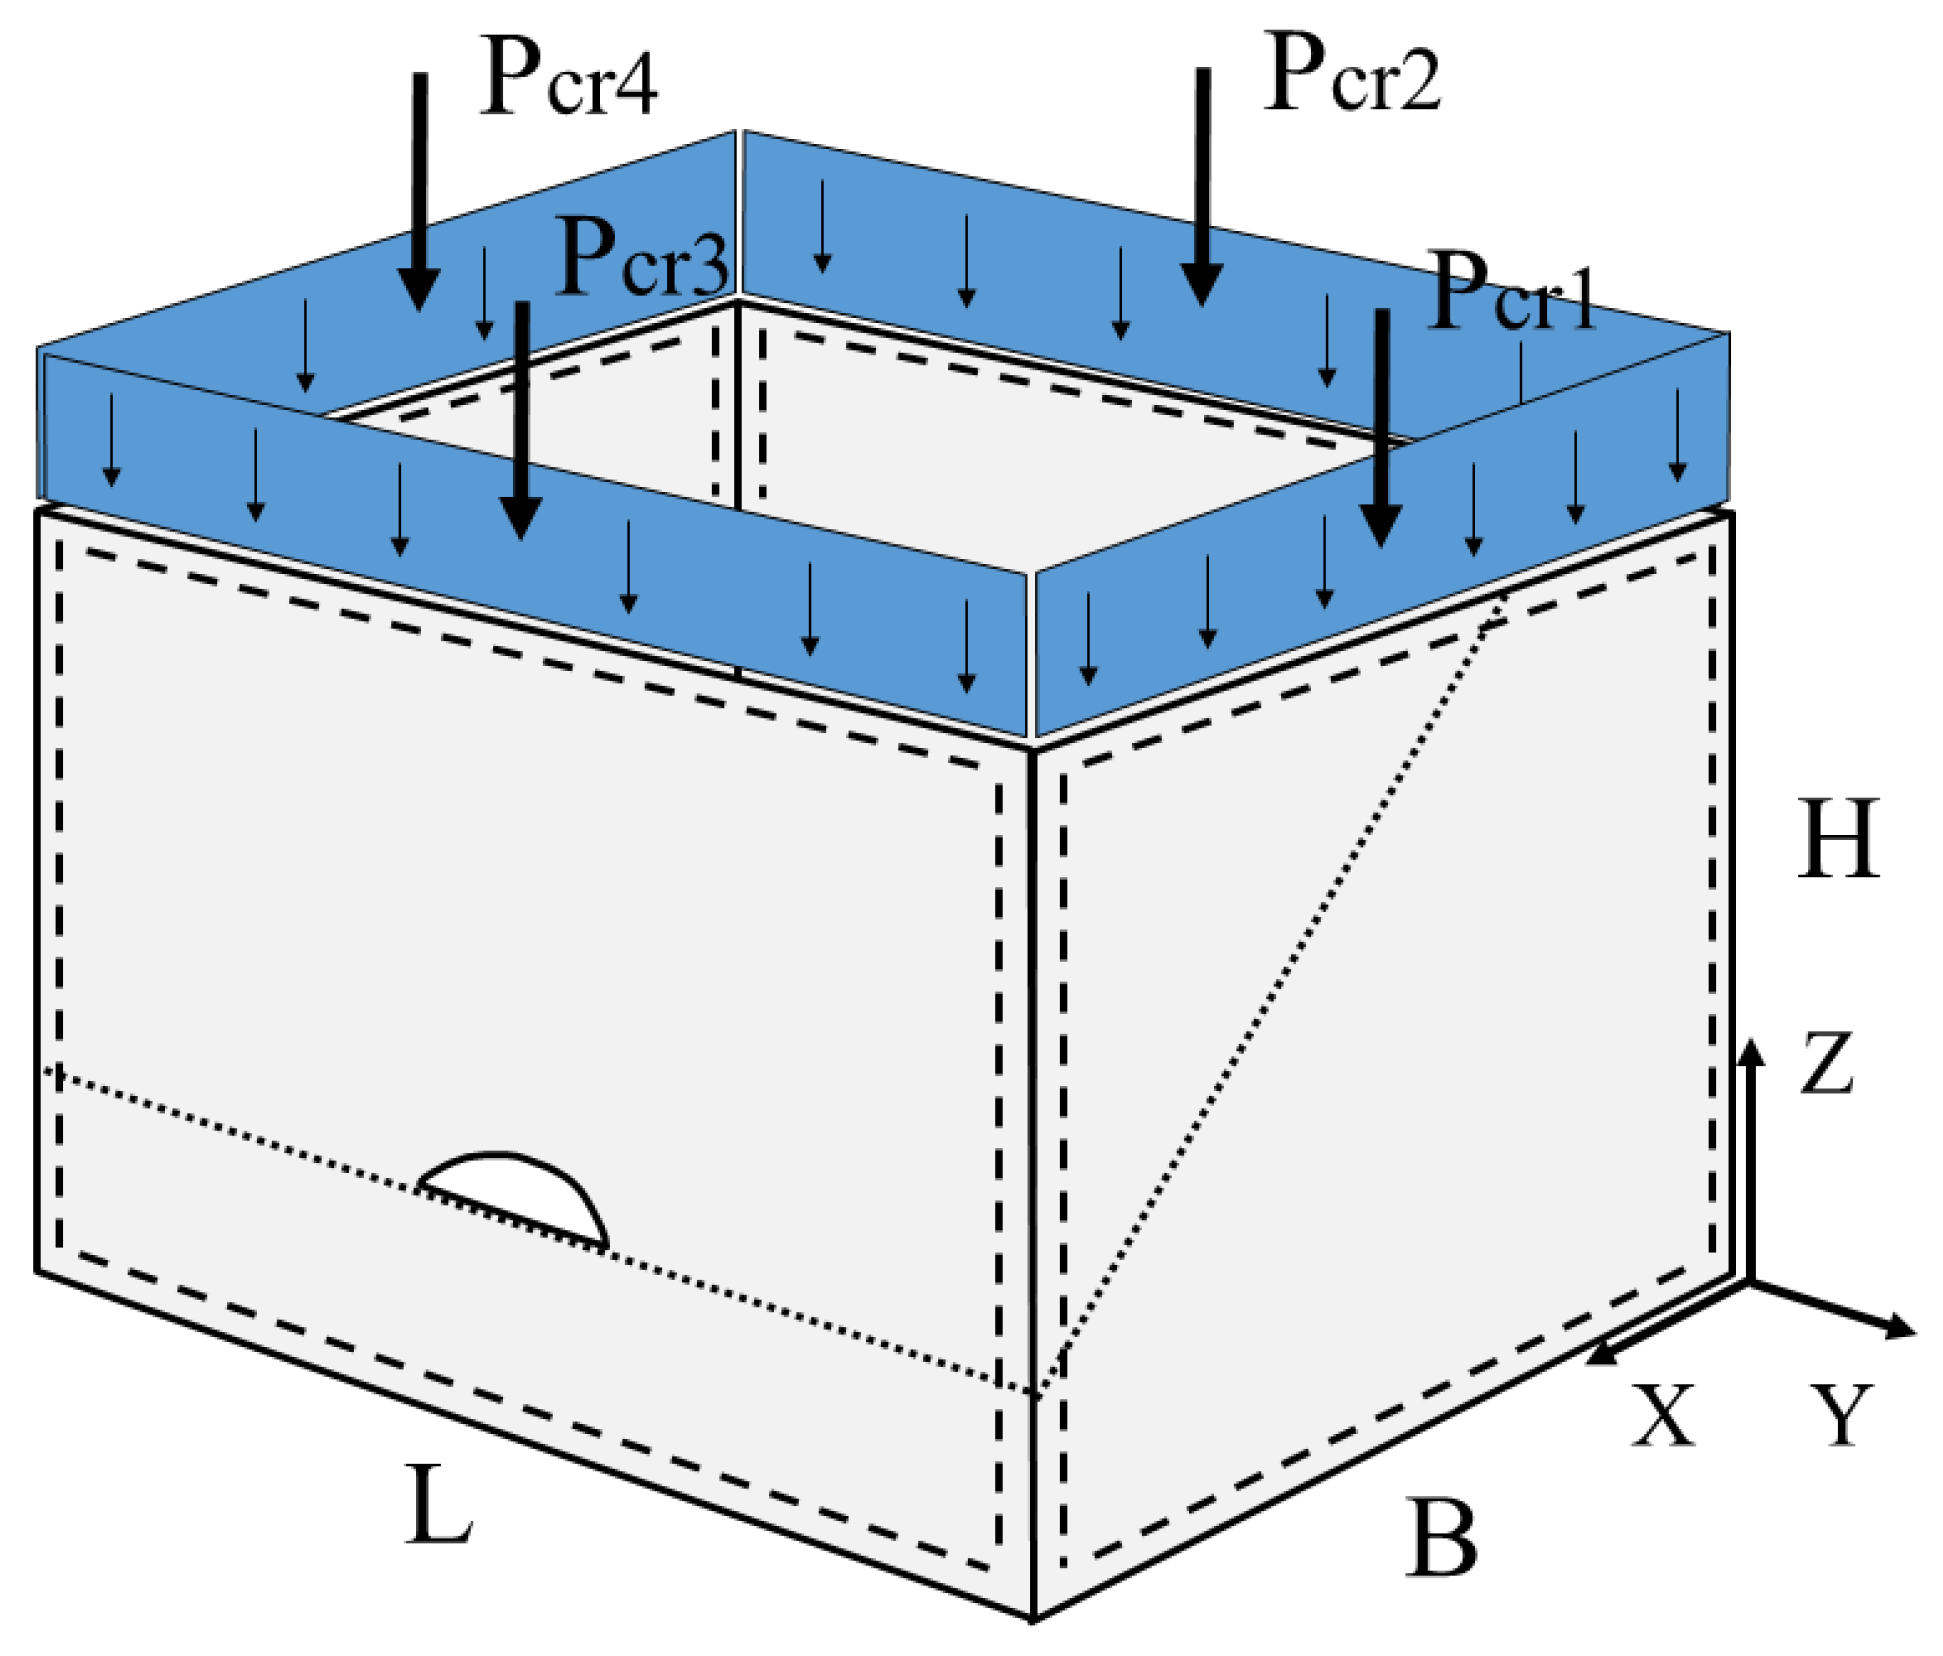
While assessing the compression strength of the packaging it may be considered that it is related to the particular load bearing capacities of packaging walls considered as plates subjected to compression load in its middle plane, see Figure 3. In this manner, the load bearing capacities of packaging plates are determined by the critical loads, for which the buckling phenomena for vertical walls will occur. Such mechanical problems are one of the basic one in theoretical mechanics, and have been considered by many researchers[54,55] – its solutions, depending on the posed problem, are available in textbooks.[56,57,58]
In simplified methods for estimating box compression test (BCT) strength,[59,60] used extensively in corrugated board industry for many years, the idealized buckling forms are utilized. Currently, these forms are not able anymore to ensure satisfactory accuracy especially for complex packaging cases, what was proved in the paper.[32] For example, the so-called McKee formula reads the following equation:
B C T = k ˇ   E C T h 2 1 r Z 2 r 1 ,
in which E C T is the edge crush test result, Z is the box perimeter and r and k ˇ are empirical constants. If some assumptions regarding r and k ˇ will be taken, for explanations see the paper,[32] the straightforward form of the McKee formula takes the following:
B C T M K 2 = 5.874 E C T h 0.508 Z 0.492
As shown in Equation (2), there are no factors in the formula that take into account the effects of holes, perforations, bending stiffness, or crushing, which in practice may significantly reduce the box's compressive strength. Currently, the corrugated board industry expects accurate predictions, therefore, those factors cannot be omitted.
Evan though, one may use more advanced analytical approach for estimating the buckling forces, such as the one presented by Garbowski et al.,[32] in which the orthotropic character of the corrugated board is considered, as well as, the transverse shear stiffness. These factors are still insufficient to get an accurate result if the box has a complicated perforation or hole. Nowadays, where numerical methods are readily available, analytical or empirical forms should be avoided in favour of more modern and reliable solutions, which by physical models take into consideration all factors missing in the analytical approaches.
Therefore, in this paper, the finite element method was used to compute the buckling forces, individually for each of four load bearing panel, see Figure 3, with its full geometric specification of particular walls, orthotropic character of the corrugated board, etc. The panels were considered as a supported plates under compression, the orthotropic material and cross-section data used are available in the source publications. The effectiveness of such an approach has already been proven in selected cases in the papers of Garbowski et al.[32,33,34]

Artificial neural network used

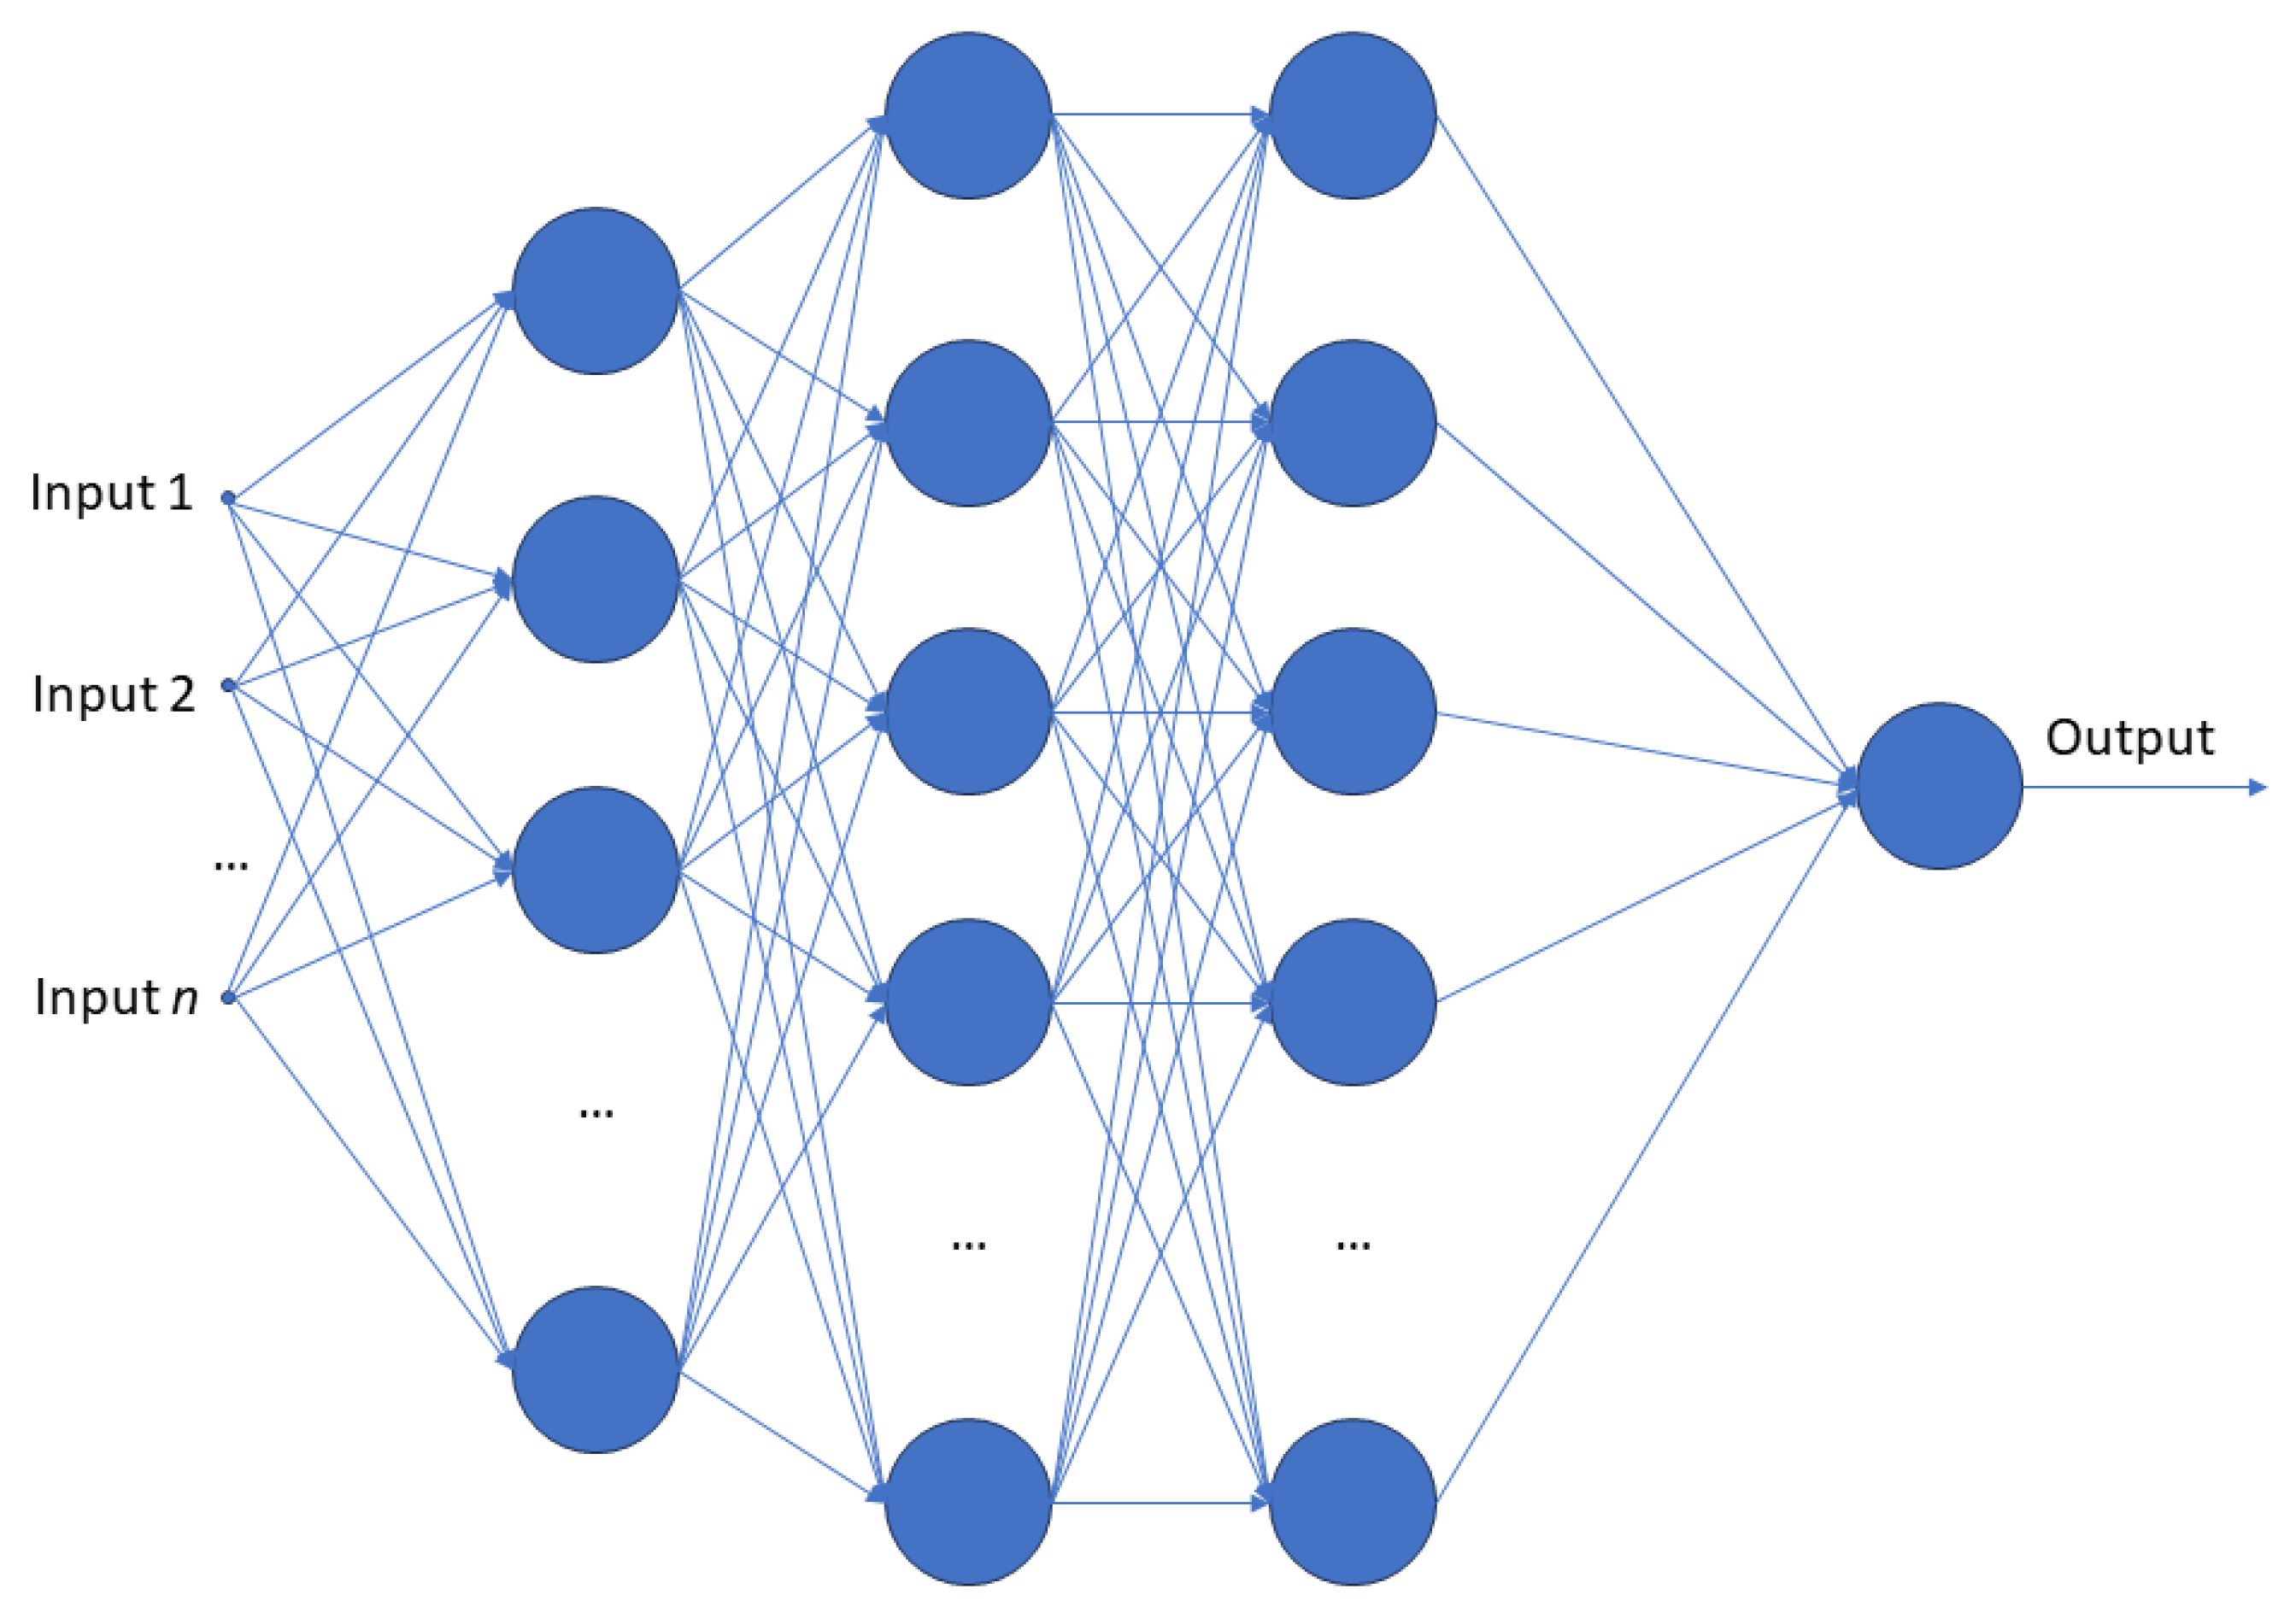
The ANN applied in this study is a feedforward neural network. The structure of the network is depicted in Figure 4. It consists of input layer (with 10 neurons), two hidden layers (with 20 and 10 neurons, respectively) and output layer (with 1 neuron). Each neuron had the hyperbolic tangent sigmoidal transfer function. Only the neuron in the output layer had the linear transfer function. The number of inputs depends of the studied case described in the Results and Discussion section. The maximal number of inputs was equal to 14 inputs. There is one output from the ANN, which is the predicted compressive strength of the packaging. The Levenberg-Marquardt algorithm was applied as the training method.

Results and Discussion

Due to the relatively small set of input data, the selection of input parameters of the ANN plays an important role. Therefore, in the paper, the attention was paid to the analysis of which set of input parameters would ensure the smallest ANN estimation error, in order to not exaggerate the number of input parameters. Several cases have been selected according to the theory of mechanics and subject knowledge.[32,59] Finally, the following four ANN cases with different sets of input parameters were selected:
  • ANN1: Packaging dimensions ( L , B and H ), representative properties of cardboard as an orthotropic composite ( D 11 , D 22 , D 33 , R 44 and R 55 ), E C T , effective thickness t e f f and critical forces of load-bearing panels ( P c r 1 , P c r 2 , P c r 3 and P c r 4 )
  • ANN2: Packaging dimensions ( L , B and H ), E C T and critical forces of load-bearing panels ( P c r 1 , P c r 2 , P c r 3 and P c r 4 )
  • ANN3: Ratios of packaging dimensions ( L / H and B / H ), E C T , and critical forces of load-bearing panels ( P c r 1 , P c r 2 , P c r 3 and P c r 4 )
  • ANN4: Packaging dimensions ( L , B and H ) and critical forces of load-bearing panels in relation to E C T ( P c r 1 / E C T , P c r 2 / E C T , P c r 3 / E C T and P c r 4 / E C T )
For clarity, the summary of the input parameters for all types of ANNs considered is presented in Table 1.
For data explained in Section 2.2 and grouped above, the training of four types of ANNs was executed 1000 times due to different starting point in minimization algorithm, various initial values of weights and different subdivision of training/testing sets. Each time for randomly taken 45 packaging out of total 54 box samples collected from our previous research papers. The rest, i.e., nine packaging out of 54 box samples were left for testing ANNs accuracy. The accuracy was measured by the root mean square error:
R M S E = i = 1 n y i ^ y i n 2 ,
in which y i ^ is the predicted value, while y i is the reference (tested) value of BCT and i is the box sample number, i = 1,2 , 3 ,   ,   45 for training set and i = 1,2 , 3 ,   ,   9 for test set.
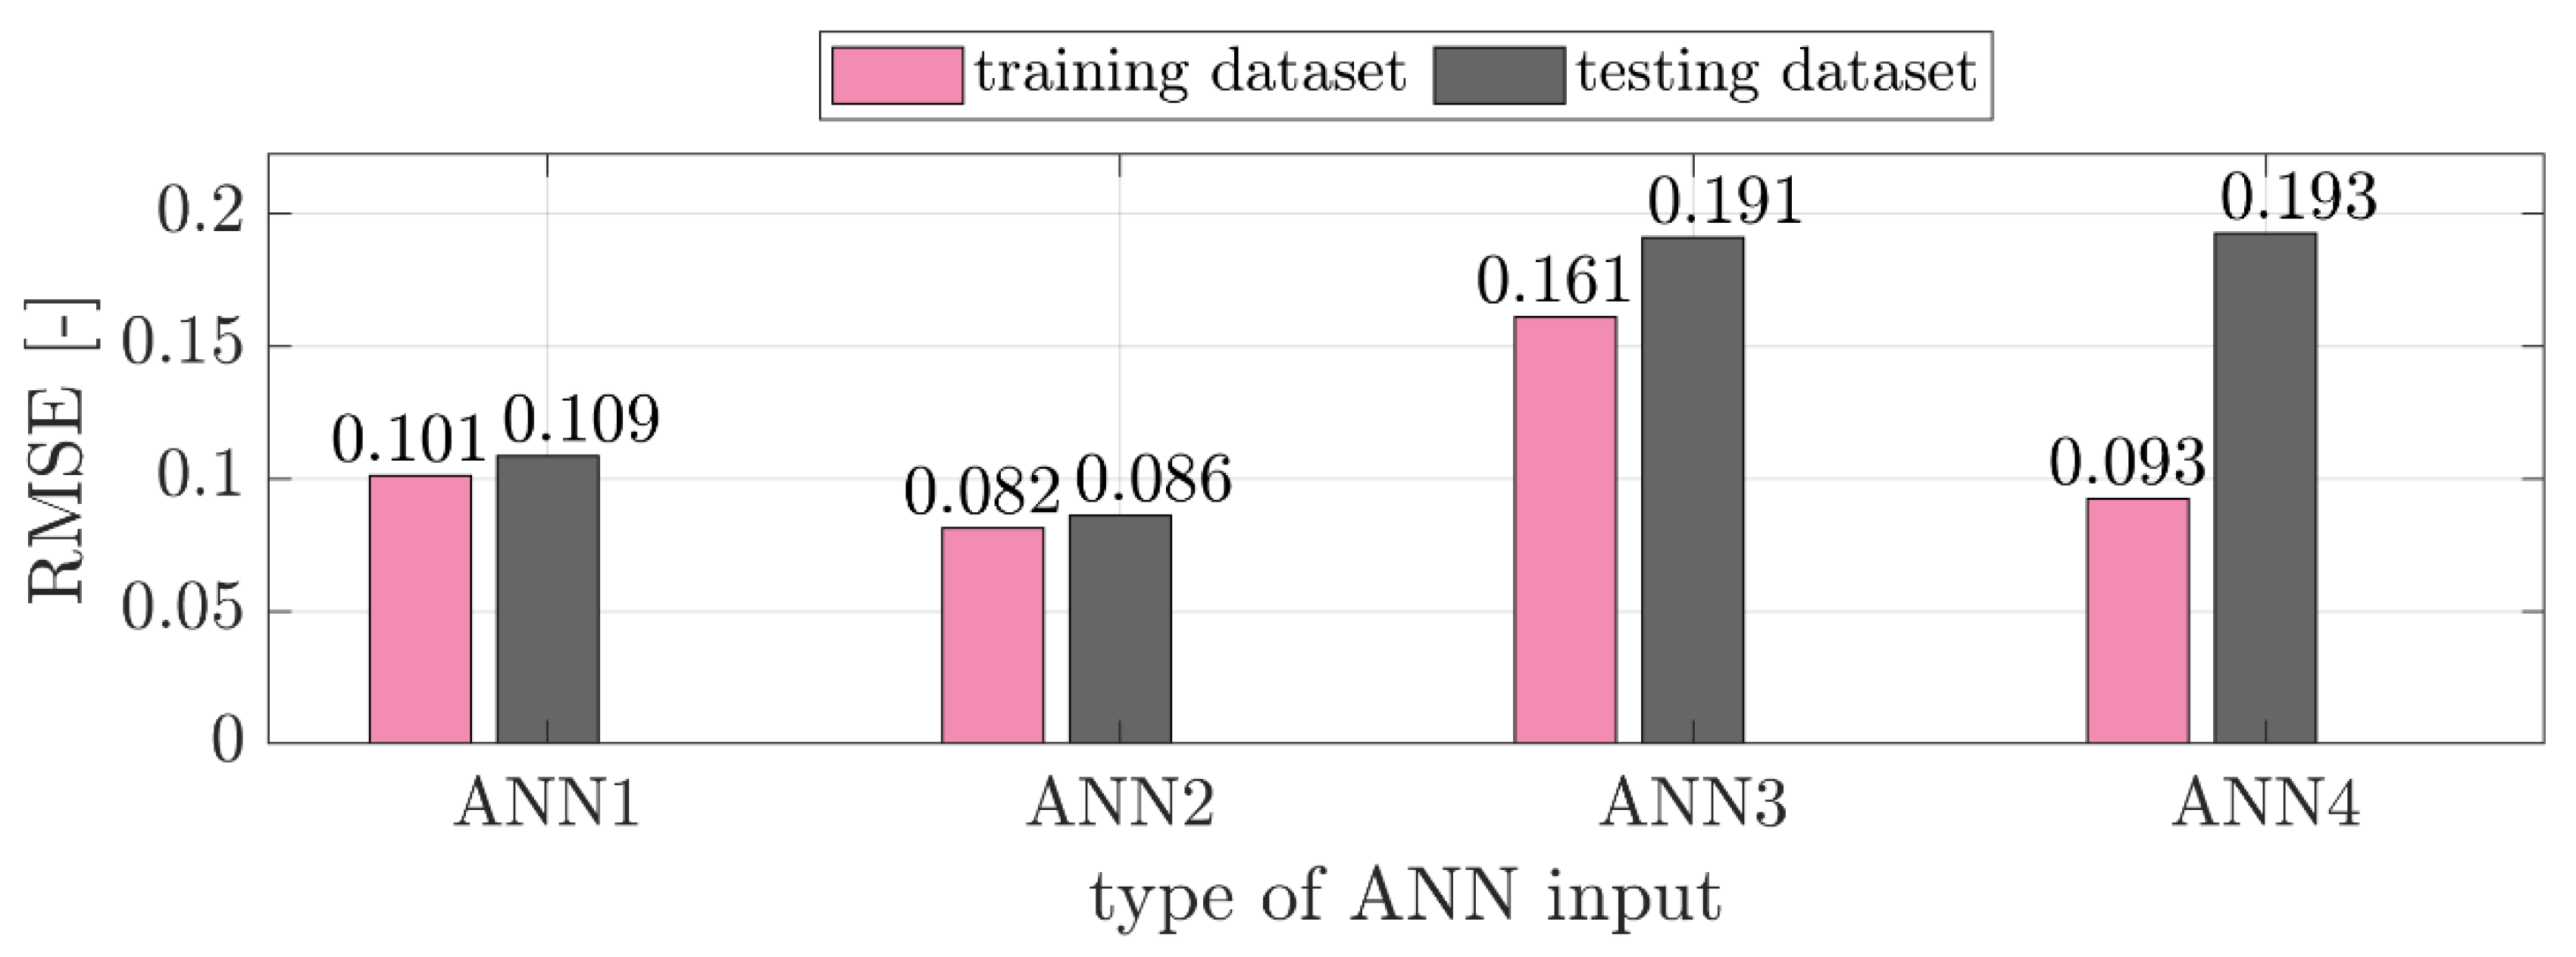
Due to the training based on stochastic selectin of 45 samples and completely random distribution of the initial values of the network parameters, the multiple ANNs were obtained for which the RMSEs were computed. For each of four types of ANN, the best one (with lowest RMSE) was selected, see pink bars in Figure 5. Then, for those four best ANNs, the RMSEs for test set was computed, see grey bars in Figure 5.
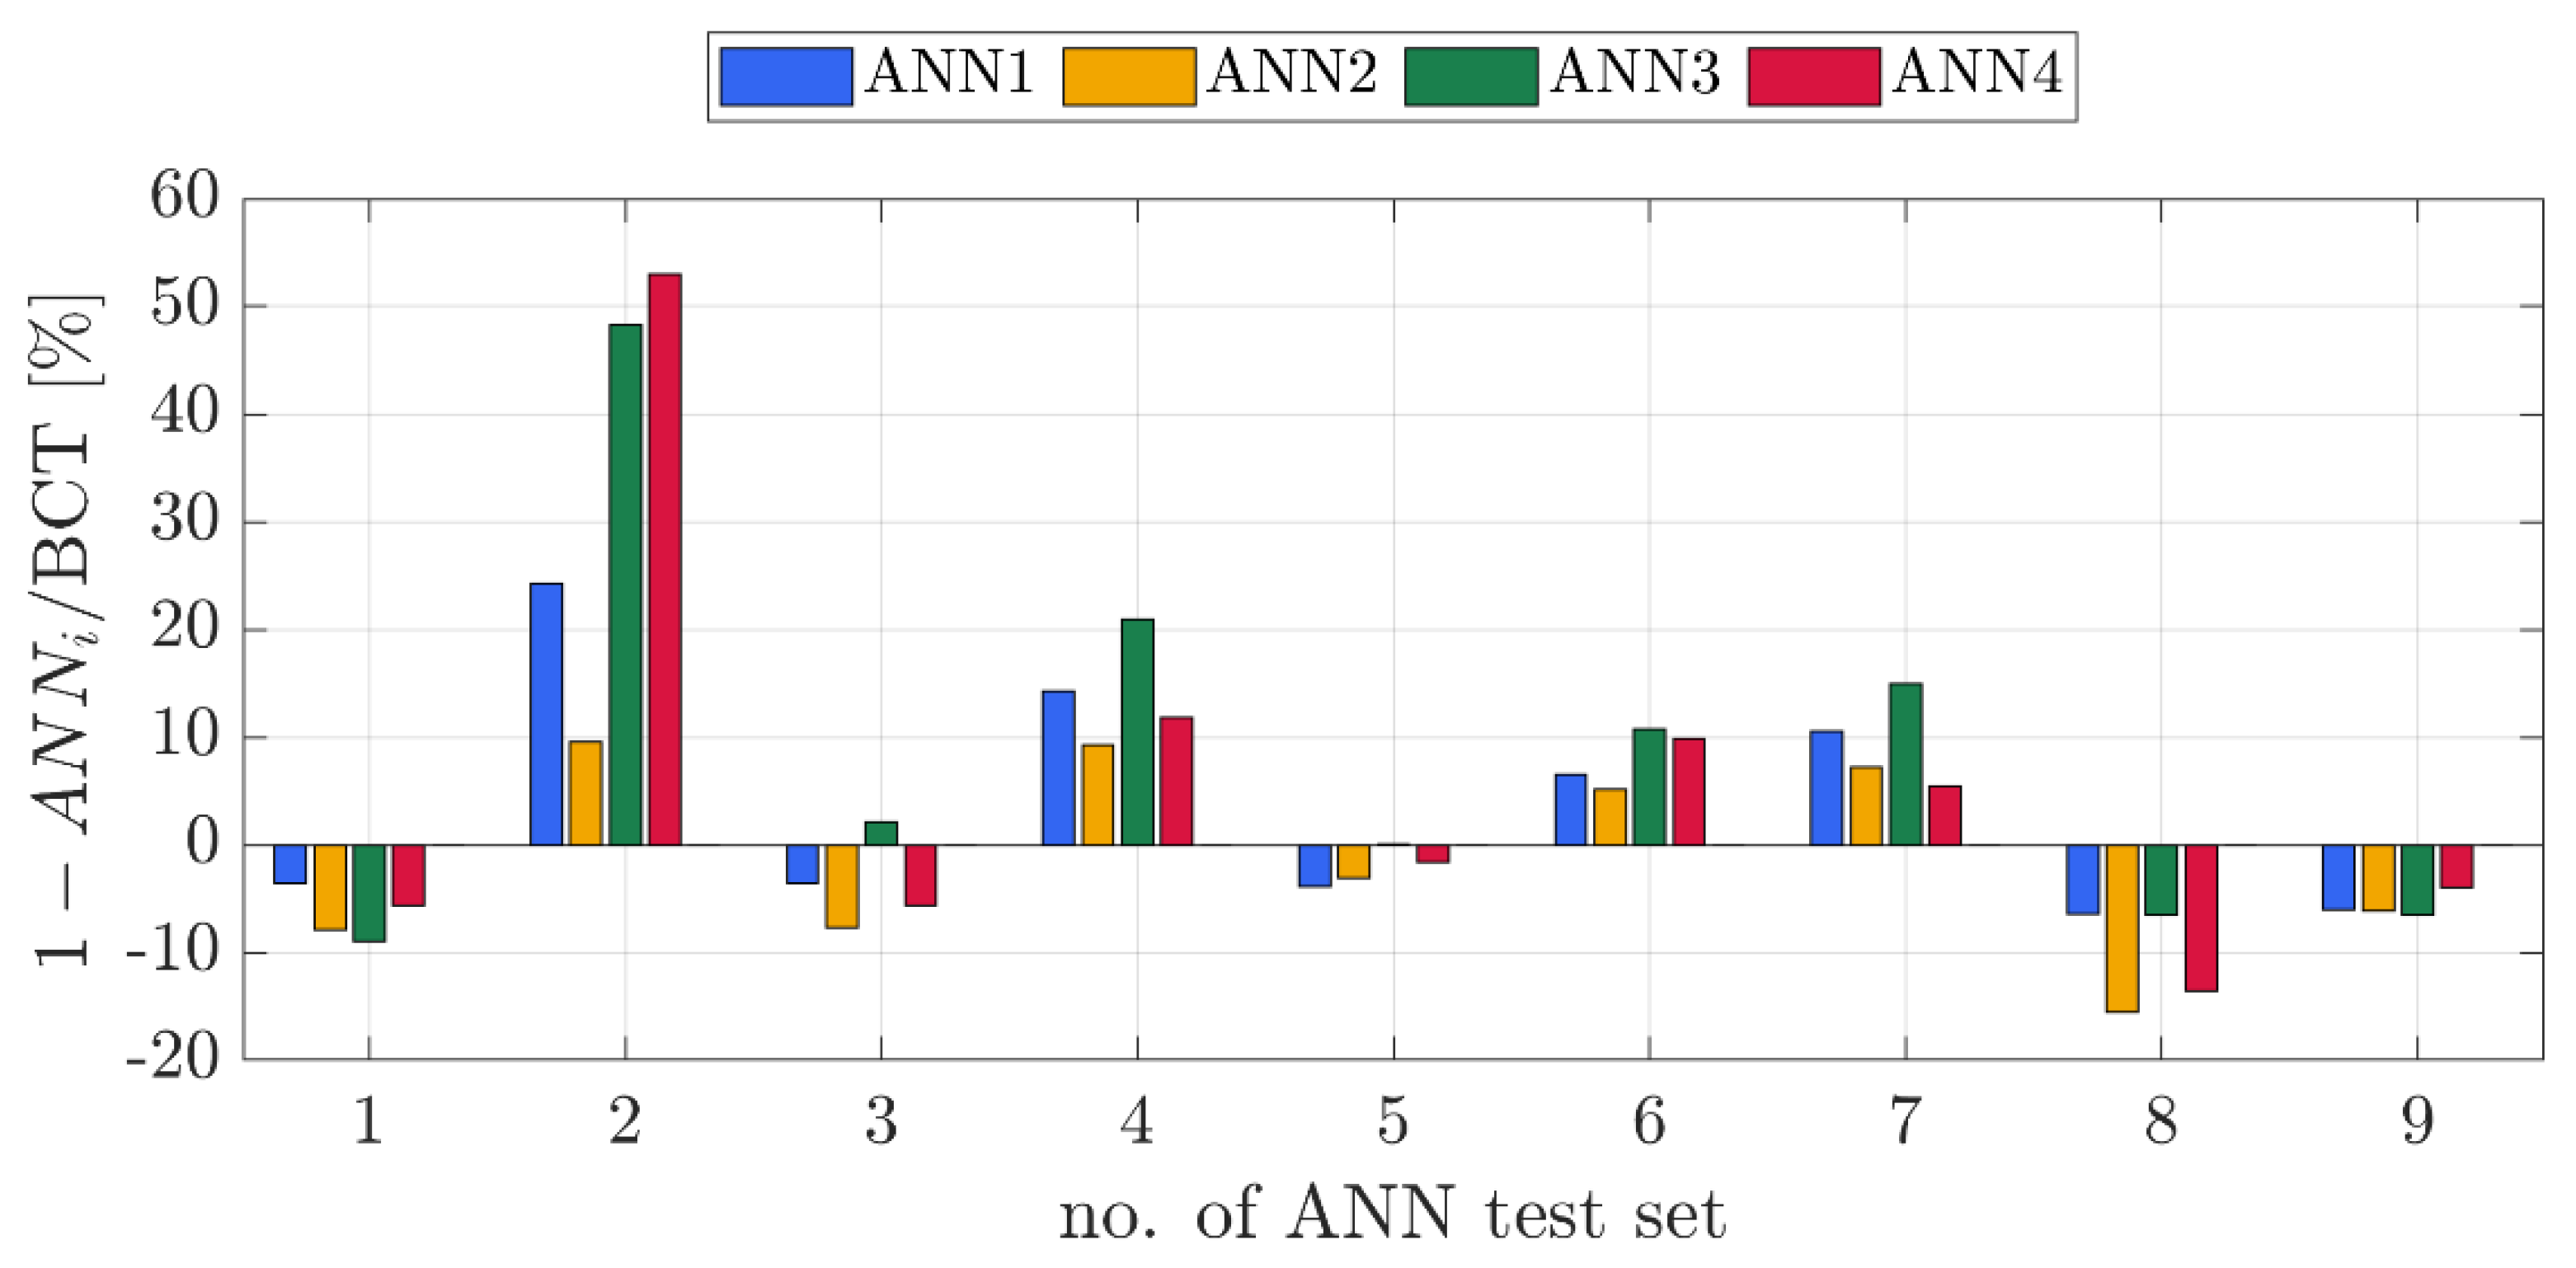
Detailed results for predicting BCT for test set (9 box samples) were presented as box compression strengths (so called BCT indices) in Table 2. In second row, the real values from press machine were shown, while in later rows the ANN estimations were demonstrated. In Figure 6, the same results of best ANNs were divided to the reference strengths values (BCT), therefore, the bars show how far from the real values the best ANN estimations are. Bar equal 0.0 would mean the perfect fit to the reference (BCT) value.
Comparing various possible input parameter sets studied in this research, one can notice that the minimal value of the RMSE was obtained for ANN2, in which eight input parameters were taken into account, see Figure 5. This is also confirmed while comparing the results for single cases in the test set, see Figure 6, it is clearly visible that the value of predicted BCT for the ANN2 was closest to the reference values in most cases. This suggest that the number of inputs of the ANN for predicting the BCT can be limited to eight parameters: packaging dimensions ( L , B and H ), E C T and critical forces of load-bearing panels ( P c r 1 , P c r 2 , P c r 3 and P c r 4 ). The RMSE obtained for this case was equal to 8.2% in the training set and similar value, i.e., 8.6%, in the test set. Moreover, the errors for single test cases from 1 to 9 were 7.9%, 9.6%, 7.7%, 9.3%, 3.0%, 5.1%, 7.2%, 15.5% and 6.0%, respectively, which is a good result when estimating the compressive strength for such different types of packaging by a single ANN model.
The worst results (in the training set) were obtained for the ANN3, in which ratios of the packaging dimensions ( L / H and B / H ) were used as the inputs instead of all packaging dimensions separately ( L , B and H ). Furthermore, for the ANN4 the RMSE obtained in the training set was lower than for ANN1 and ANN3. However, one can notice that in this case the worst results were obtained in the test set. The RMSE in the test set is about two times greater than in the training set. It shows that the ANN4 was overfitted to the training data, the results are satisfactory in the training set, but are not sufficiently general for the other data.
The results presented in this study can be easily compared with the other results presented in the previous papers on estimation of the BCT in various cases (boxes with openings, perforations or without any changes in their construction).[32,33,34] In these previous studies, in which an analytical-numerical approach was proposed for estimation of the BCT, the authors modified also parameters in the well-known McKee formula in order to obtain the optimal values for the specific case (boxes with openings or perforations or without both). For the boxes with openings,[33] the authors obtained the mean error of 6.5% for the optimal parameters. In the case of boxes with perforations,34 the mean error was equal to 3.5%. For the boxes without holes or perforations,[32] the authors obtained the mean error in the range of 5% to 8%. One can notice that the values of optimal parameters obtained in both cases were totally different, e.g., for boxes with openings the optimal parameters achieved were k = 0.755 and r = 435, while for boxes with perforations the optimal parameters obtained were k = 0.4 and r = 0.75. In the current study, the error measure obtained was equal to 8.2% in the training set and 8.6% in the test set, but in this study the ANN approximation is more universal (i.e. is valid for all kind of boxes e.g. with perforations, opening and without them). The formulas with their optimal parameters proposed in the papers[32,33,34] were dedicated to specific cases of box designs, while here the ANN model is much more universal and can be used for any box geometry with possible holes and perforations.
The methodology presented in this study with the application of ANN models for BCT prediction in various cases can be repeated and the results can be improved in the future for bigger number of data, which should greatly generalize the propose methodology.. If the average error of prediction in the new test set will become bigger than in the current test set, then the training process can be repeated with representation of new data both in training and test sets. This approach leads to an obvious asymptote, which is a kind of limit to the possibility of adapting the model for the selected neural network architecture to new data, which can also be improved by rebuilding the network architecture when the amount of training data allows it.

Conclusions

The paper was devoted to the assessment of the load capacity of various types of packaging using artificial neural networks. In the work, the most attention was paid to the selection of input parameters for each ANN model in order to obtain the smallest possible RMSE. The input parameters that were taken into account were the dimensions of the packaging, material properties of the corrugated board and the critical buckling forces of side panels of the packaging.
The obtained results prove that it is possible to estimate the load capacity of packaging of various corrugated box constructions based on artificial neural networks with a relatively small training dataset and still benefit with a high accuracy. It was shown by computed RMSE for a randomly selected test dataset. Depending on the selected set of input parameters, the RMSE ranged from about 8% to 19%. The RMSE for the best ANN prediction equal to 8%, which is very promising result considering such small amount of training dataset available and diversity of the analysed cases of packaging (boxes with perforations, openings and without them). The hybrid experimental-numerical approach for the preparation of the ANN training dataset proven to be effective and has a great potential for use by corrugated board manufacturers and converters as advanced numerical methods are already used by the packaging industry in many professional laboratory devices.

References

  1. Simon, JW. A Review of Recent Trends and Challenges in Computational Modeling of Paper and Paperboard at Different Scales. Archives of Computational Methods in Engineering 2020; 28: 2409-2428. [CrossRef]
  2. Coffin, DW. Historical perspectives of corrugated box testing for 2020. TAPPI Journal 2020; 19(3): 161-73. [CrossRef]
  3. Nagasawa S, Yamashita Y, Abdul~Hamid D, Fukuzawa Y, Hine A. Out-of-plane shearing characteristics of coated paperboard. International Journal of Mechanical Sciences 2010; 52(9): 1101-1106. [CrossRef]
  4. Borgqvist E, Wallin M, Ristinmaa M, Tryding J. An anisotropic in-plane and out-of-plane elasto-plastic continuum model for paperboard. Composite Structures 2015; 126: 184-195. [CrossRef]
  5. Harrysson A, Ristinmaa M. Large strain elasto-plastic model of paper and corrugated board. International Journal of Solids and Structures 2008; 45(11-12): 3334-3352. [CrossRef]
  6. Lindström SB, Karabulut E, Kulachenko A, Sehaqui H, Wågberg L. Mechanosorptive creep in nanocellulose materials. Cellulose 2012; 19: 809-819. [CrossRef]
  7. Östlund M, Borodulina S, Östlund S. Influence of Paperboard Structure and Processing Conditions on Forming of Complex Paperboard Structures. Packaging Technology and Science 2011; 24(6): 331-341. [CrossRef]
  8. Leminen V, Tanninen P, Mäkelä P, Varis J. Combined effect of paperboard thickness and mould clearance in the press forming process. BioResources 2013; 8(4): 5701-5714. [CrossRef]
  9. Nygårds M, Just M, Tryding J. Experimental and numerical studies of creasing of paperboard. International Journal of Solids and Structures 2009; 46(11-12): 2493-2505. [CrossRef]
  10. Nagasawa S, Komiyama Y, Mitsomwang P. Finite Element Analysis of Corrugated Board on Rotary Creasing Process. Journal of Advanced Mechanical Design, Systems, and Manufacturing 2013; 7(2): 103-114. [CrossRef]
  11. Huang H, Hagman A, Nygårds M. Quasi static analysis of creasing and folding for three paperboards. Mechanics of Materials 2014; 69(1): 11-34. [CrossRef]
  12. Borgqvist E, Wallin M, Tryding J, Ristinmaa M, Tudisco E. Localized Deformation in Compression and Folding of Paperboard. Packaging Technology and Science 2016; 29(7): 397-414. [CrossRef]
  13. Suarez B, Muneta MLM, Sanz-Bobi JD, Romero G. Application of homogenization approaches to the numerical analysis of seating made of multi-wall corrugated cardboard. Composite Structures 2021; 262: 113642. [CrossRef]
  14. Johansson S, Engqvist J, Tryding J, Hall SA. 3D Strain Field Evolution and Failure Mechanisms in Anisotropic Paperboard. Experimental Mechanics 2021; 61: 581-608. [CrossRef]
  15. Johansson S, Engqvist J, Tryding J, Hall SA. Microscale deformation mechanisms in paperboard during continuous tensile loading and 4D synchrotron X-ray tomography. Strain 2022; 58: e12414. [CrossRef]
  16. Hahn EK, Ruvo dA, Westerlind BS, Carlsson LA. Compressive strength of edge-loaded corrugated board panels. Experimental Mechanics 1992; 32: 259-265. [CrossRef]
  17. Biancolini ME, Brutti C. Numerical and experimental investigation of the strength of corrugated board packages. Packaging Technology and Science 2003; 16(2): 47-60. [CrossRef]
  18. Åslund PE, Hägglund R, Carlsson LA, Isaksson P. Modeling of global and local buckling of corrugated board panels loaded in edge-to-edge compression. Journal of Sandwich Structures & Materials 2014; 16(3): 272-292. [CrossRef]
  19. Tanninen P, Leminen V, Kainusalmi M, Varis J. Effect of process parameter variation on the dimensions of press-formed paperboard trays. BioResources 2016; 11(1): 140-158. [CrossRef]
  20. Fadiji T, Coetzee CJ, Berry TM, Linus Opara U. Investigating the role of geometrical configurations of ventilated fresh produce packaging to improve the mechanical strength - Experimental and numerical approaches. Food Packaging and Shelf Life 2019; 20: 100312. [CrossRef]
  21. Hägglund R, Carlsson LA. Packaging performance. In: Östlund S, Niskanen K., eds. Mechanics of Paper Products De Gruyter, Berlin. 2nd ed. 2021 (pp. 37-67).
  22. Jamialahmadi A, Trost T, Östlund S. A Proposed Tool to Determine Dynamic Load Distribution between Corrugated Boxes. Packaging Technology and Science 2011; 24(6): 317-329. [CrossRef]
  23. Korin C, Ristinmaa M, Ottosen NS. Analytical prediction of package collapse - consideration of windows in the package. Nordic Pulp & Paper Research Journal 2018; 29(4): 717-724. [CrossRef]
  24. Robertsson K, Borgqvist E, Wallin M, et al. Efficient and accurate simulation of the packaging forming process. Packaging Technology and Science 2018; 31(8): 557-566. [CrossRef]
  25. Lindberg G, Kulachenko A. Tray forming operation of paperboard: A case study using implicit finite element analysis. Packaging Technology and Science 2021; 35(2): 183-198. [CrossRef]
  26. Fadiji T, Coetzee CJ, Linus Opara U. Compression strength of ventilated corrugated paperboard packages: Numerical modelling, experimental validation and effects of vent geometric design. Biosystems Engineering 2016; 151: 231-247. [CrossRef]
  27. Di Russo FM, Desole MM, Gisario A, Barletta M. Evaluation of wave configurations in corrugated boards by experimental analysis (EA) and finite element modeling (FEM): the role of the micro-wave in packaging design. The International Journal of Advanced Manufacturing Technology 2023; 126: 4963-4982. [CrossRef]
  28. Urbanik TJ, Frank B. Box compression analysis of world-wide data spanning 46 years. Wood and Fibre Science 2006; 38(3): 399-416.
  29. Frank, B. Corrugated Box Compression - A Literature Survey. Packaging Technology and Science 2014; 27(2): 105-128. [CrossRef]
  30. Coffin, DW. Some observations towards improved predictive models for box compression strength. TAPPI Journal 2015; 14(5): 537-545.
  31. Marin G, Srinivasa P, Nygårds M, Östlund S. Experimental and finite element simulated box compression tests on paperboard packages at different moisture levels. Packaging Technology and Science 2021; 34(4): 229-243. [CrossRef]
  32. Garbowski T, Gajewski T, Grabski JK. The Role of Buckling in the Estimation of Compressive Strength of Corrugated Cardboard Boxes. Materials 2020; 13(20): 4578. [CrossRef]
  33. Garbowski T, Gajewski T, Grabski JK. Estimation of the Compressive Strength of Corrugated Cardboard Boxes with Various Openings. Energies 2021; 14(1): 155. [CrossRef]
  34. Garbowski T, Gajewski T, Grabski JK. Estimation of the Compressive Strength of Corrugated Cardboard Boxes with Various Perforations. Energies 2021; 14(4): 1095. [CrossRef]
  35. Mrówczyński D, Garbowski T, Knitter-Piątkowska A. Estimation of the Compressive Strength of Corrugated Board Boxes with Shifted Creases on the Flaps. Materials 2021; 14(8): 5181. [CrossRef]
  36. Mrówczyński D, Gajewski T, Garbowski T. Sensitivity Analysis of Open-Top Cartons in Terms of Compressive Strength Capacity. Materials 2023; 16(1): 412. [CrossRef]
  37. Garbowski T, Mrówczyński D, Grabski JK. Modified Compression Test of Corrugated Board Fruit Tray: Numerical Modeling and Global Sensitivity Analysis. Materials 2023; 16(3): 1121. [CrossRef]
  38. Nygårds M, Sjökvist S, Marin G, Sundström J. Simulation and experimental verification of a drop test and compression test of a gable top package. Packaging Technology and Science 2019; 32(7): 325-333. [CrossRef]
  39. Waszczyszyn Z, Ziemiański L. Neural networks in mechanics of structures and materials - new results and prospects of applications. Computers & Structures 2001; 79(22-25): 2261-2276. [CrossRef]
  40. Miller B, Ziemiański L. Optimization of dynamic behavior of thin-walled laminated cylindrical shells by genetic algorithms and deep neural networks supported by modal shape identification. Advances in Engineering Software 2020; 147: 102830. [CrossRef]
  41. Stręk AM, Dudzik M, Kwiecień A, Wańczyk K, Lipowska B. Verification of Application of ANN Modelling in Study of Compressive Behaviour of Aluminium Sponges. Engineering Transactions 2019; 67(2): 271-288. [CrossRef]
  42. Gravett DZ, Mourlas C, Taljaard VL, Bakas N, Markou G, Papadrakakis M. New fundamental period formulae for soil-reinforced concrete structures interaction using machine learning algorithms and ANNs. Soil Dynamics and Earthquake Engineering 2021; 144: 106656. [CrossRef]
  43. Ariza-Garcia MA, Redondo S, Llorens DP, Calvo B, Rodriguez~Matas JF. A predictive tool for determining patient-specific mechanical properties of human corneal tissue. Computer Methods in Applied Mechanics and Engineering 2017; 317: 226-247. [CrossRef]
  44. Zaborowicz K, Biedziak B, Olszewska A, Zaborowicz M. Tooth and Bone Parameters in the Assessment of the Chronological Age of Children and Adolescents Using Neural Modelling Methods. Sensors 2021; 21(18): 6008. [CrossRef]
  45. Cieślińska K, Zaborowicz K, Zaborowicz M, Biedziak B. Evaluation of the Second Premolar’s Bud Position Using Computer Image Analysis and Neural Modelling Methods. International Journal of Environmental Research and Public Health 2022; 19(22): 15240. [CrossRef]
  46. Boniecki P, Koszela K, Piekarska-Boniecka H, et al. Neural identification of selected apple pestsl. Computers and Electronics in Agriculture 2015; 110: 9-16. [CrossRef]
  47. Boniecki P, Raba B, Pilarska AA, et al. Neural Reduction of Image Data in Order to Determine the Quality of Malting Barley. Sensors 2021; 21(17): 5696. [CrossRef]
  48. Araujo G, Andrade FAA. Post-Processing Air Temperature Weather Forecast Using Artificial Neural Networks with Measurements from Meteorological Stations. Applied Sciences 2022; 12(14): 7131. [CrossRef]
  49. Boniecki P, Sujak A, Niedbala G, Piekarska-Boniecka H, Wawrzyniak A, Przybylak A. Neural Modelling from the Perspective of Selected Statistical Methods on Examples of Agricultural Applications. Agriculture 2023; 13(14): 762. [CrossRef]
  50. Adamopoulos S, Karageorgos A, Rapti E, Birbilis D. Predicting the properties of corrugated base papers using multiple linear regression and Artificial Neural Networks. Drewno. Wood. Research papers. Reports. Announcements 2016; 59(198): 61-72. [CrossRef]
  51. Garbowski T, Knitter-Piątkowska A, Grabski JK. Estimation of the Edge Crush Resistance of Corrugated Board Using Artificial Intelligence. Materials 2023; 16(4): 1631. [CrossRef]
  52. Archaviboonyobul T, Chaveesuk R, Singh J, Jinkarn T. An analysis of the influence of hand hole and ventilation hole design on compressive strength of corrugated fiberboard boxes by an artificial neural network model. Packaging Technology and Science 2020; 33(4-5): 171-181. [CrossRef]
  53. Technical Association of the Pulp & Paper Industry, Inc. Peachtree Corners Standard conditioning and testing atmospheres for paper, board, pulp handsheets, and related products, Test Method TAPPI/ANSI T 402 sp-21. 2021.
  54. Wierzbicki T, Abramowicz W. On the Crushing Mechanics of Thin-Walled Structures. Journal of Applied Mechanics 1983; 50(4a): 727-734. [CrossRef]
  55. Setoodeh S, Abdalla MM, Ijsselmuiden ST, Gürdal Z. Design of variable-stiffness composite panels for maximum buckling load. Composite Structures 2009; 87(1): 109-117. [CrossRef]
  56. Timoshenko SP, Gere JM. Theory of Elastic Stability. New York: McGraw-Hill. 2nd ed. 1961.
  57. Wang CM, Wang CY, Reddy JN. Exact solutions for buckling of structural members. Boca Raton: CRC Press. 2005.
  58. Bažant Z, Cedolin L. Stability of Structures. Singapore: World Scientific. 2nd ed. 2010.
  59. McKee RC, Gander JW, Wachuta JR. Compression strength formula for corrugated boxes. Paperboard Packaging 1963; 48(8): 149-159.
  60. Buchanan JS, J D, W TG. Combined board characteristics that determine box performance. Paperboard Packaging 1964; 49(9): 74-85.
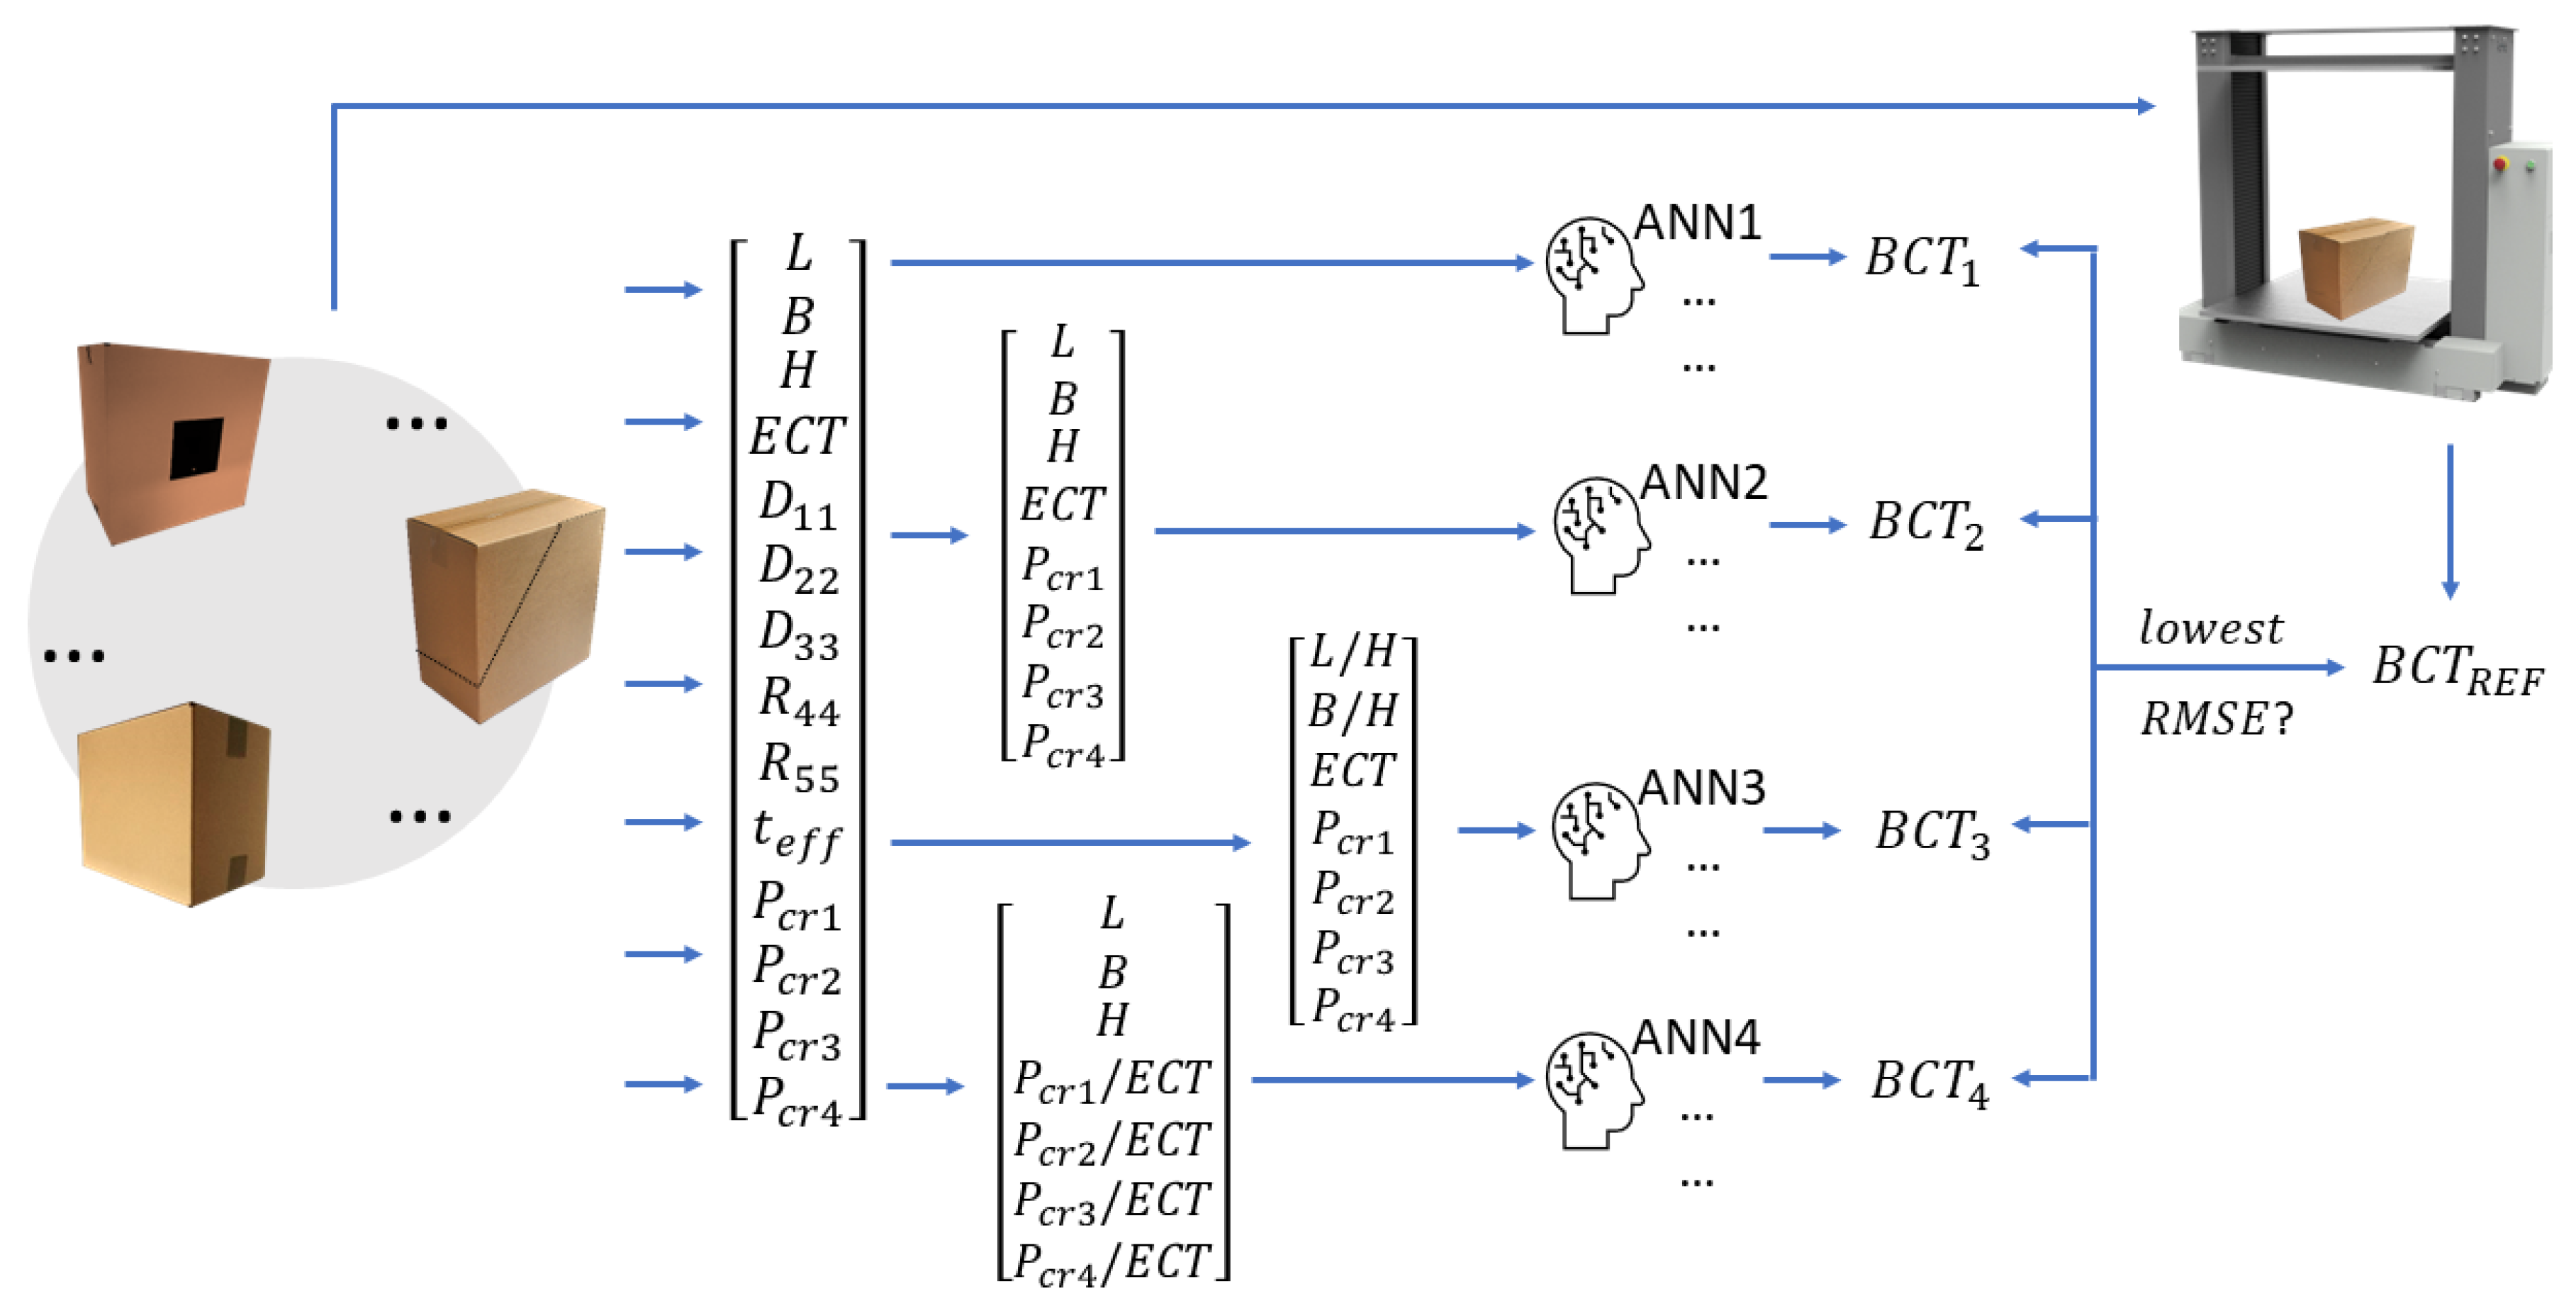
Figure 1. The scheme showing the workflow of the study.
Preprints 79628 g001
Figure 2. Photographic documentation of the compressive strength tests from our previous studies[32,33,34], used in this article: flap boxes (a,b), packaging with holes (c,d) and boxes with perforations (e,f).
Preprints 79628 g002
Figure 3. Separated walls of the packaging with the widths of L and B and height of H , considered as a supported plates under compression.
Preprints 79628 g003
Figure 4. Feedforward artificial neural network structure.
Preprints 79628 g004
Figure 5. Root mean square error (RMSE) for the training and test data sets from four different ANNs.
Preprints 79628 g005
Figure 6. Bar plot of box compression strength ratios of different packaging for the test data set from different ANNs due to the choice of input parameters.
Preprints 79628 g006
Table 1. Selected sets of input parameters for training of the artificial neural networks considered in the paper.
Type/No. of input 1 2 3 4 5 6 7 8 9 10 11 12 13 14
ANN1 L B H D 11 D 22 D 33 R 44 R 55 E C T t e f f P c r 1 P c r 2 P c r 3 P c r 4
ANN2 L B H E C T P c r 1 P c r 2 P c r 3 P c r 4
ANN3 L H B H E C T P c r 1 P c r 2 P c r 3 P c r 4
ANN4 L B H P c r 1 E C T P c r 2 E C T P c r 3 E C T P c r 4 E C T
Table 2. Box compression strengths of different packaging for real (test) values and the outcome from different ANNs due to the choice of input parameters for test data set.
1 2 3 4 5 6 7 8 9
BCT [N] 1903 697 1902 1606 1033 933 899 2078 1869
ANN1 [N] 1834 866 1834 1834 993 9935 993 1944 1757
ANN2 [N] 1752 763 1755 1755 1001 980 963 1755 1755
ANN3 [N] 1733 1033 1942 1942 1033 1033 1033 1942 1747
ANN4 [N] 1795 1066 1795 1795 1016 1024 947 1795 1795
Disclaimer/Publisher’s Note: The statements, opinions and data contained in all publications are solely those of the individual author(s) and contributor(s) and not of MDPI and/or the editor(s). MDPI and/or the editor(s) disclaim responsibility for any injury to people or property resulting from any ideas, methods, instructions or products referred to in the content.
Copyright: This open access article is published under a Creative Commons CC BY 4.0 license, which permit the free download, distribution, and reuse, provided that the author and preprint are cited in any reuse.
Prerpints.org logo

Preprints.org is a free preprint server supported by MDPI in Basel, Switzerland.

Subscribe

© 2024 MDPI (Basel, Switzerland) unless otherwise stated