1. Introduction
The arid and semi-arid region of Central Asia is specifically sensitive to climate change. Central Asia is experiencing a warming trend at around three times the global average of 0.13°C (10 yr)
−1 [
1]. Such warming not only increases the capacity of the atmosphere to hold water vapor, but also exacerbates evaporation from the dry surface [
2]. The arid ecosystems are highly vulnerable to the destabilizing effects of climate change. Hence, this significant warming trend has led to the change in precipitation over Central Asia being a subject of intense debate within the scientific community.
Numerous studies have reported climate warming and humidification in the arid and semi-arid region over Central Asia [
3,
4,
5,
6]. By contrast, worsening aridity and drying trends have been demonstrated over Central Asia owing to mounting evaporation, greenhouse gases and anthropogenic aerosols [
7,
8]. Dilinuer et al. [
9] noted regional drying and wetting trends over Central Asia. Yao et al. [
10,
11] suggested that the total precipitation over Central Asia will increase under a warming climate and is mainly contributed by extreme precipitation. Extreme precipitation tends to increase the vulnerability of arid and semi-arid regions, and accounts for nearly half of the annual precipitation over Central Asia [
12]. Although studies have successfully recognized an upward trend in extreme precipitation over Central Asia [
13,
14,
15], little attention has been paid to its interannual and decadal variabilities.
The interannual and decadal variabilities of precipitation over Central Asia are modulated by different planetary-scale climate modes. For instance, Chen et al. [
16] and Huang et al. [
17] defined Central Asia as having a “westerlies-dominated climatic regime” in terms of a decadal variability of precipitation, and considered it a manifestation of the circumglobal teleconnection pattern along the westerly jets over Eurasia. Specifically, a weakened and southward displacement of the westerly jet is unfavorable for precipitation over Central Asia [
18,
19]. Besides, Hu et al. [
20] and Yang et al. [
5] speculated that the negative phase of the North Atlantic Oscillation (NAO) impacts precipitation over northwestern China on the interannual time scale via the westerly jet. However, by contrast, the negative phase of the East Atlantic/West Russia (EAWR) pattern increases the total precipitation or extreme precipitation over Central Asia on both decadal and long-term time scales [
14,
21].
In spite of these efforts by prior studies on the temporal variability of extreme precipitation over Central Asia, they primarily focused on a particular time scale, meaning the contributions of different scales to the temporal variability have yet to be fully clarified. There is considerable merit to exploring and determining the major scales of temporal variability of extreme precipitation over Central Asia and the nature of their corresponding planetary-scale climate modes. Accordingly, in the present study, we applied a Morlet wavelet analysis to the annual occurrence number of extreme precipitation events to derive its major time scales and their contributions. Regressed 500-hPa geopotential height (Z500) anomaly maps against the major scales were compared to conventional teleconnection patterns to obtain their modulating planetary-scale climate modes. Based on the result, we attempted to illustrate the potential roles of planetary-scale climate modes in the occurrence of extreme precipitation, and the dominant mode among them.
The remainder of this paper is structured as follows:
Section 2 describes the data and methods;
Section 3 examines the spatial and temporal variabilities of extreme precipitation over Central Asia;
Section 4 discusses the linkages between the major scales and planetary-scale climate modes; and Section 5 provides some further discussion and a summary of the study’s key findings.
2. Data and Methods
2.1. Data
A suite of gridded data from APHRODITE over Russia/Northern Eurasia (APHRO_RU_V1101) [
22] were used. The APHRODITE precipitation data are derived from Global Telecommunications System–based data from gauge observations, precompiled data by other projects or organizations, and data from individual collections. APHRO_RU_V1101 is on a 0.25° × 0.25° latitude–longitude grid. The APHRODITE gridded data are interpolated from the ratio of daily precipitation to the daily climatology using a Spheremap-type scheme based on the rainfall distribution, and cover the period of 1951–2007.
Also employed in this study were the ERA5 global reanalysis datasets provided by the European Center for Medium-Range Weather Forecasts [
23]. The hourly and monthly 500- and 1000-hPa geopotential height data used here are available on a 2.5° × 2.5° longitude–latitude grid. The daily mean field was derived by averaging the hourly data. The study period is the warm season (1 May to 30 September) during the period of 1951–2007.
2.2. Extreme precipitation identification
Similar to Lai et al. [
24], the present study used the percentile-based value to define the extreme precipitation threshold value for each grid point. The percentile-based extreme precipitation threshold value was derived as the 95th percentile of the daily precipitation data (above 1.0 mm d
−1) in ascending order over the 30 base years of 1961–1990, during which period APHODITE incorporated the largest number of gauge-observation data. Follow the extreme definition of Zhao et al. [
25], extreme precipitation was identified if at least 3% of all grid points exceeded their extreme precipitation threshold values on the same day. We also conducted the sensitivity experiments by changing this areal coverage value from 5% to 7.5%, the results from these are all qualitatively similar to those presented in this study.
2.3. Morlet wavelet analysis
The Morlet wavelet is generally used in time–frequency analyses to detect localized variations of power within a time series. The wavelet transform is given by [
26]:
where the term
is the wavelet function, s is the scale, n is the localized time index, and
is a time series. The wavelet power spectrum is defined as
, and the significance is evaluated based on the sum of the power spectrum over a longitude using white and red noise processes. The time series can be reconstructed simply as the sum of the real part of the wavelet transform over all scales:
The factor removes the energy scaling, while the converts the wavelet transform to an energy density. The factor is a constant for each wavelet function whose value is 0.776.
2.4. Teleconnection patterns and indices
Since daily indices of the Polar/Eurasia (POL) and EAWR patterns are not available from the CPC, we constructed teleconnection patterns and indices similar to the CPC procedure (
http://www.cpc.noaa.gov/data/teledoc/telecontents.shtml). The (rotated) principal component analysis is applied to the monthly mean standardized 1000 (500) hPa geopotential height anomaly during the entire study period. The time series of the NAO, POL, EAWR and Arctic Oscillation (AO) monthly indices derived and employed in the present study are statistically significantly correlated with CPC’s counterparts, with coefficients of 0.94, 0.83, 0.87 and 0.95 respectively. An 8-day low-pass filter was applied to the daily 500- and 1000-hPa geopotential height fields to obtain the low-frequency nature of the teleconnection patterns [
27]. The filtered daily geopotential height fields were then projected onto eigenvectors of the teleconnection patterns to construct their daily indices.
2.5. Rossby wave activity flux
The horizontal Rossby energy propagation is described using wave activity flux defined by Takaya and Nakamura [
28]:
where
U=(U,V) is the climatological mean flow velocity;
is the quasi-geostrophic stream function perturbations relative to the climatological mean;
a,
and
are the Earth’s radius and the latitude and longitude, respectively; and
p is the air pressure normalized by 1000 hPa.
3. Results
3.1. Spatial and temporal features of extreme precipitation
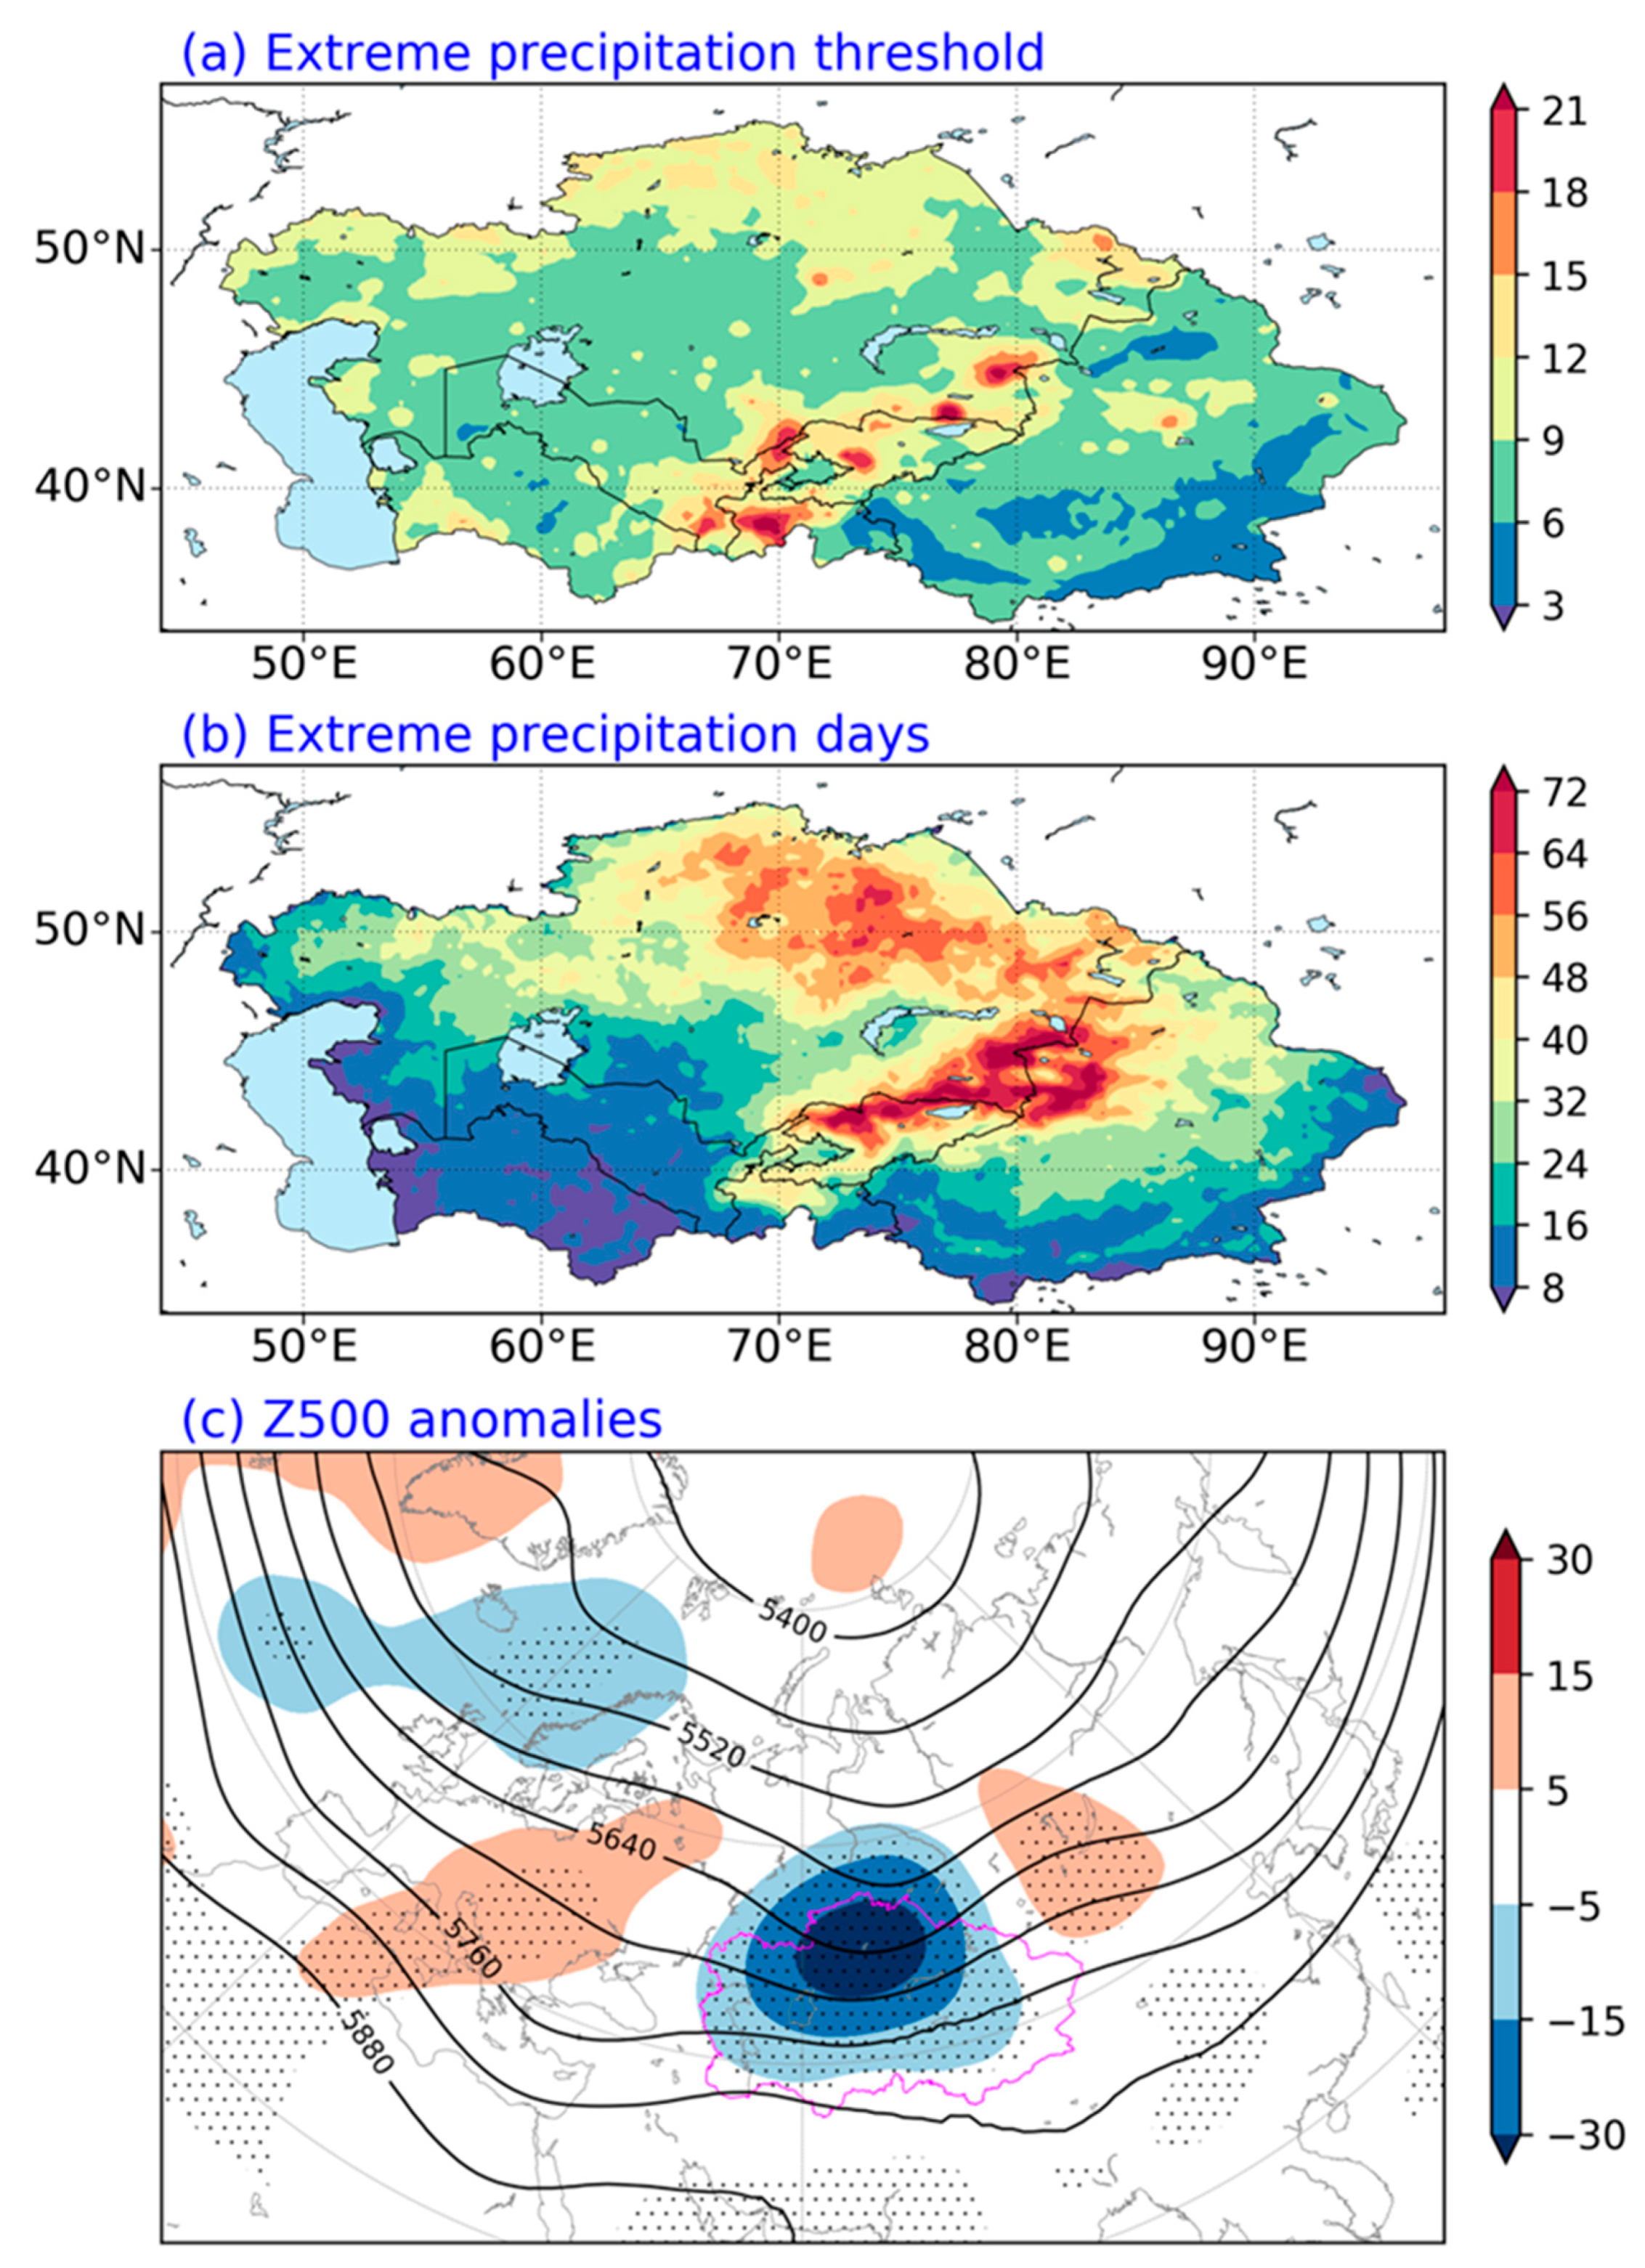
To begin with, we introduce the spatial distributions of the extreme precipitation threshold value, occurrence number, and corresponding circulation in
Figure 1. Consistent with Lai et al. [
24], the large values of the extreme precipitation threshold and occurrence number are primarily located over the mountains in central and northern Central Asia. The maxima are distributed over the Hindu Kush Mountains, Pamir, the Tianshan Mountains, and Kazakhskiy Melosopochinik (
Figure 1a and 1b). However, there are higher numbers of extreme precipitation days over Kazakhskiy Melosopochinik compared with in Lai et al. [
24], which could be attributable to the longer study period. The extreme precipitation over Central Asia is directly associated with a trough (i.e., a negative Z500) anomaly embedded in a Rossby wave train from the North Atlantic to Lake Baikal (
Figure 1c).
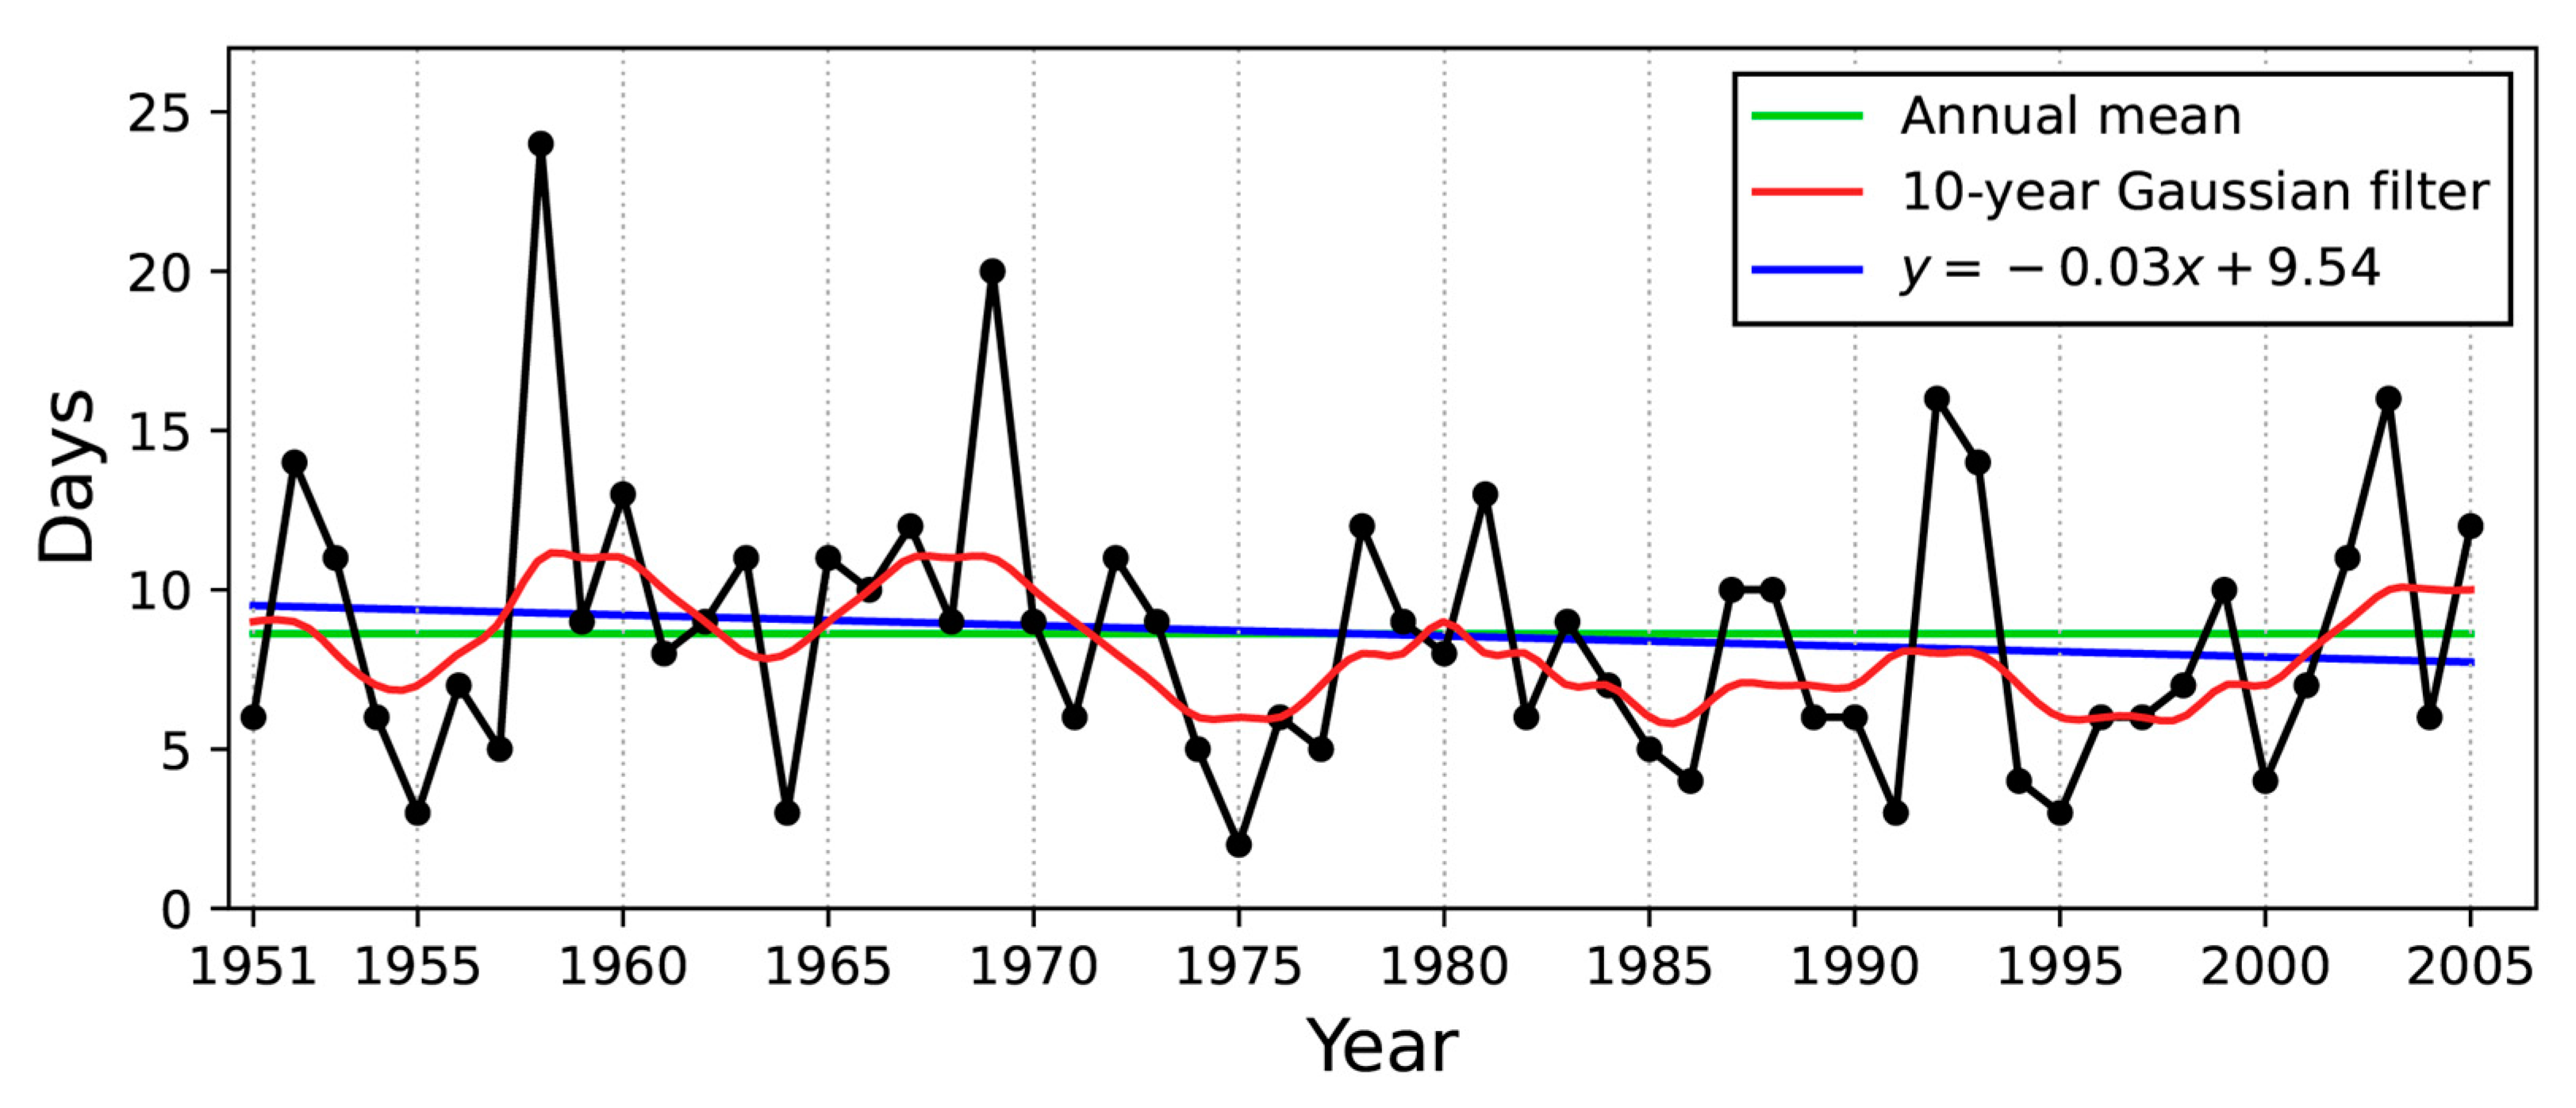
Figure 2 displays the time series of the annual occurrence number of extreme precipitation days in Central Asia. The annual mean occurrence number is 8.6 days. The annual occurrence number exhibits a slight upward trend at the 78.4% confidence level as determined by a nonparametric Mann–Kendall test [
29]. On the decadal time scale, the 10-year Gaussian-filtered annual occurrence number shows values above the annual mean during the late 1950s, late 1960s and 2000s, but below the annual mean during the early 1950s, early 1960s and the period from 1970 to 2001. The annual occurrence number of extreme precipitation days has pronounced interannual and decadal variabilities.
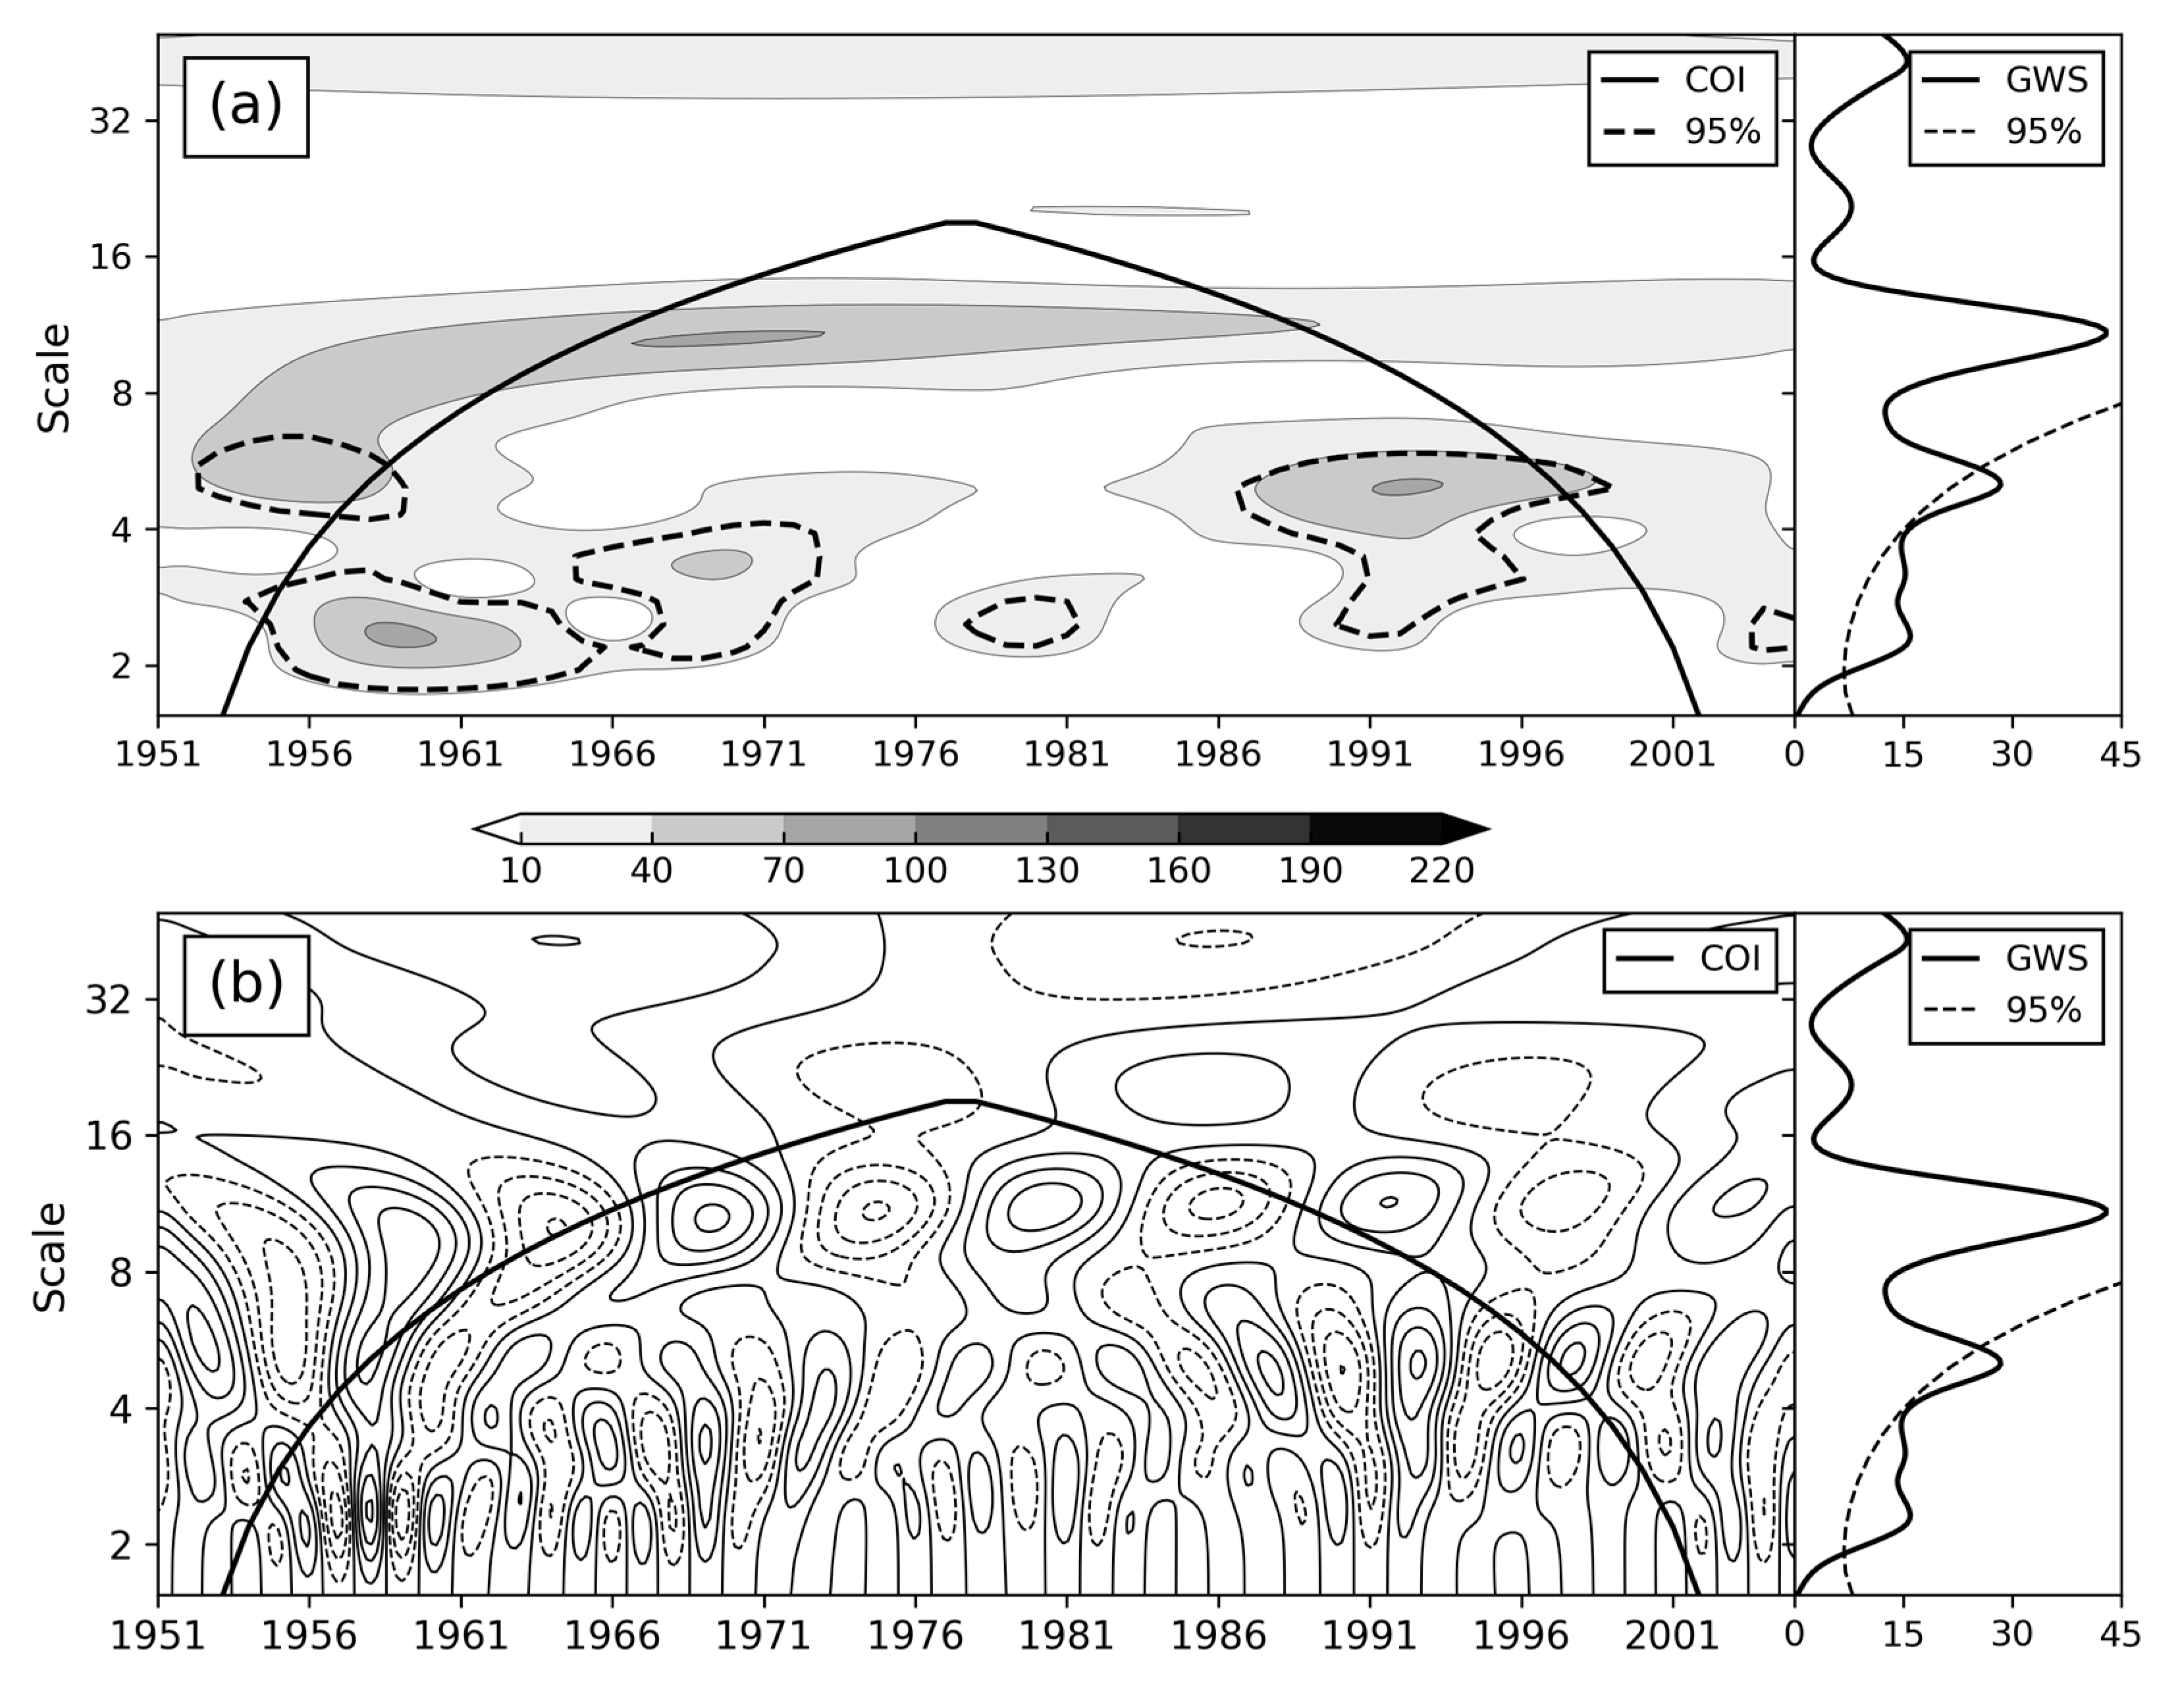
To derive major temporal variations, a Morlet wavelet was applied to the annual occurrence number of extreme precipitation days.
Figure 3 displays the real coefficient and power spectrum of the wavelet analysis of the occurrence number of extreme precipitation days. Inspection of
Figure 3 shows three pronounced scale bands, which are 2–3.9 yr, 4–6 yr and 9–12 yr, respectively. The global wavelet power spectra of the 2–3.9- and 4–6-yr bands are statistically significant at the 95% confidence level. The regionally significant scales are apparent over 1954–1973, 1978–1982 and 1989–1996 for the 2–3.9-yr scale, while 1957–1959 and 1987–1998 for the 4–6-yr scale. The amplitude of the 9–12-yr scale is consistently observed throughout the entire period. However, this scale dose not exhibit significant power in both the global and regional wavelet power spectra.
3.2. Modulation of planetary-scale climate modes
3.2.1. Association with planetary-scale climate modes
The analysis in the preceding section revealed four pronounced scales in the variability of the annual number of extreme precipitation days. A natural question arises from this result: what planetary-scale climate modes modulate these variabilities? To answer this question, time series of each scale were constructed according to Eq. (2) and regressed against the Z500 field. Then, these regressed Z500 maps were compared with the major Northern Hemisphere teleconnection patterns. We also calculated the percentage of the variance of the annual number of extreme precipitation days (T) explained by each reconstructed time series (R) using V = variance(R) / variance(T) × 100% given by Von Storch [
30]. The explained variances of the time series reconstructed from the 2–3.9-, 4–6- and 9–12- scales are 46.8%, 7.5% and 4.9%, respectively. The sum of the explained variances of these four series reaches 59.2%.
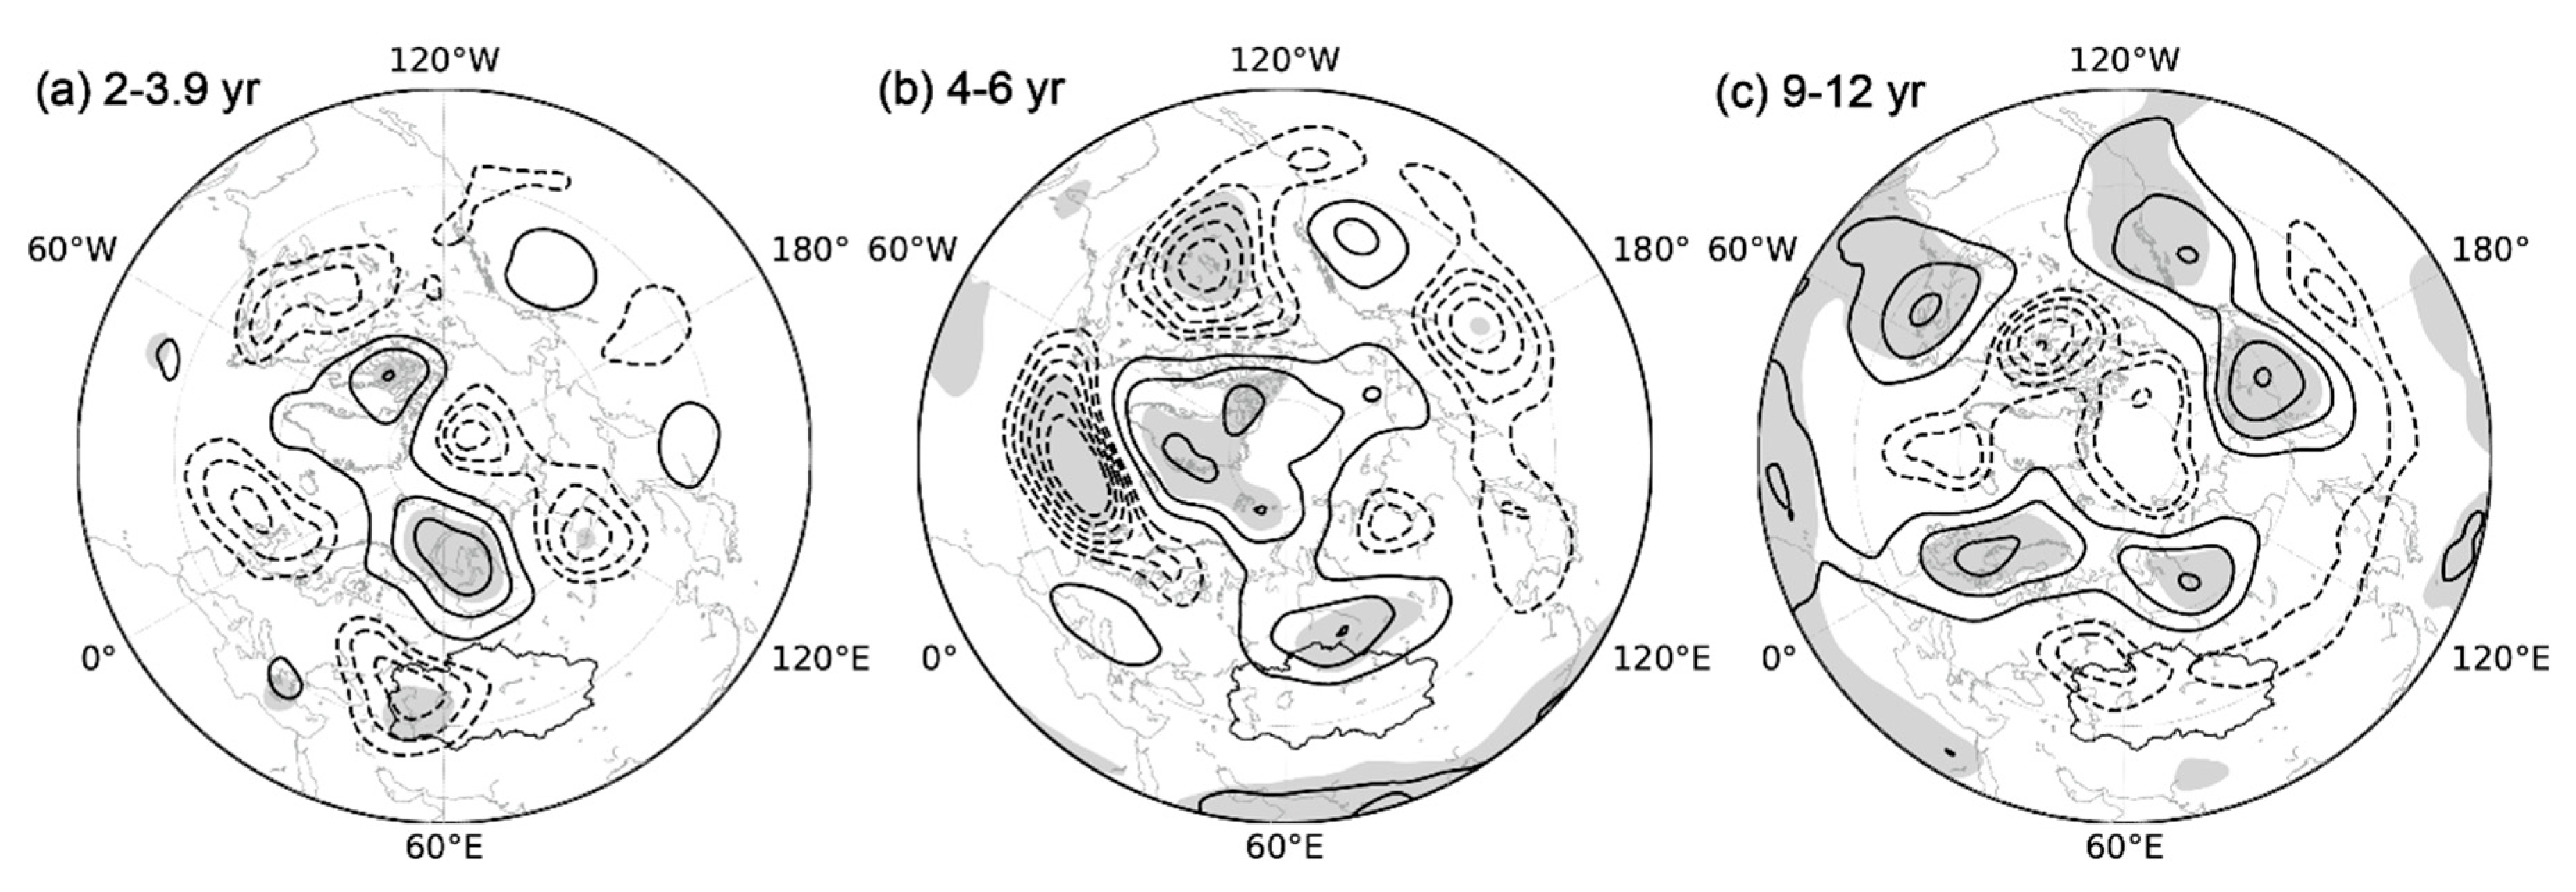
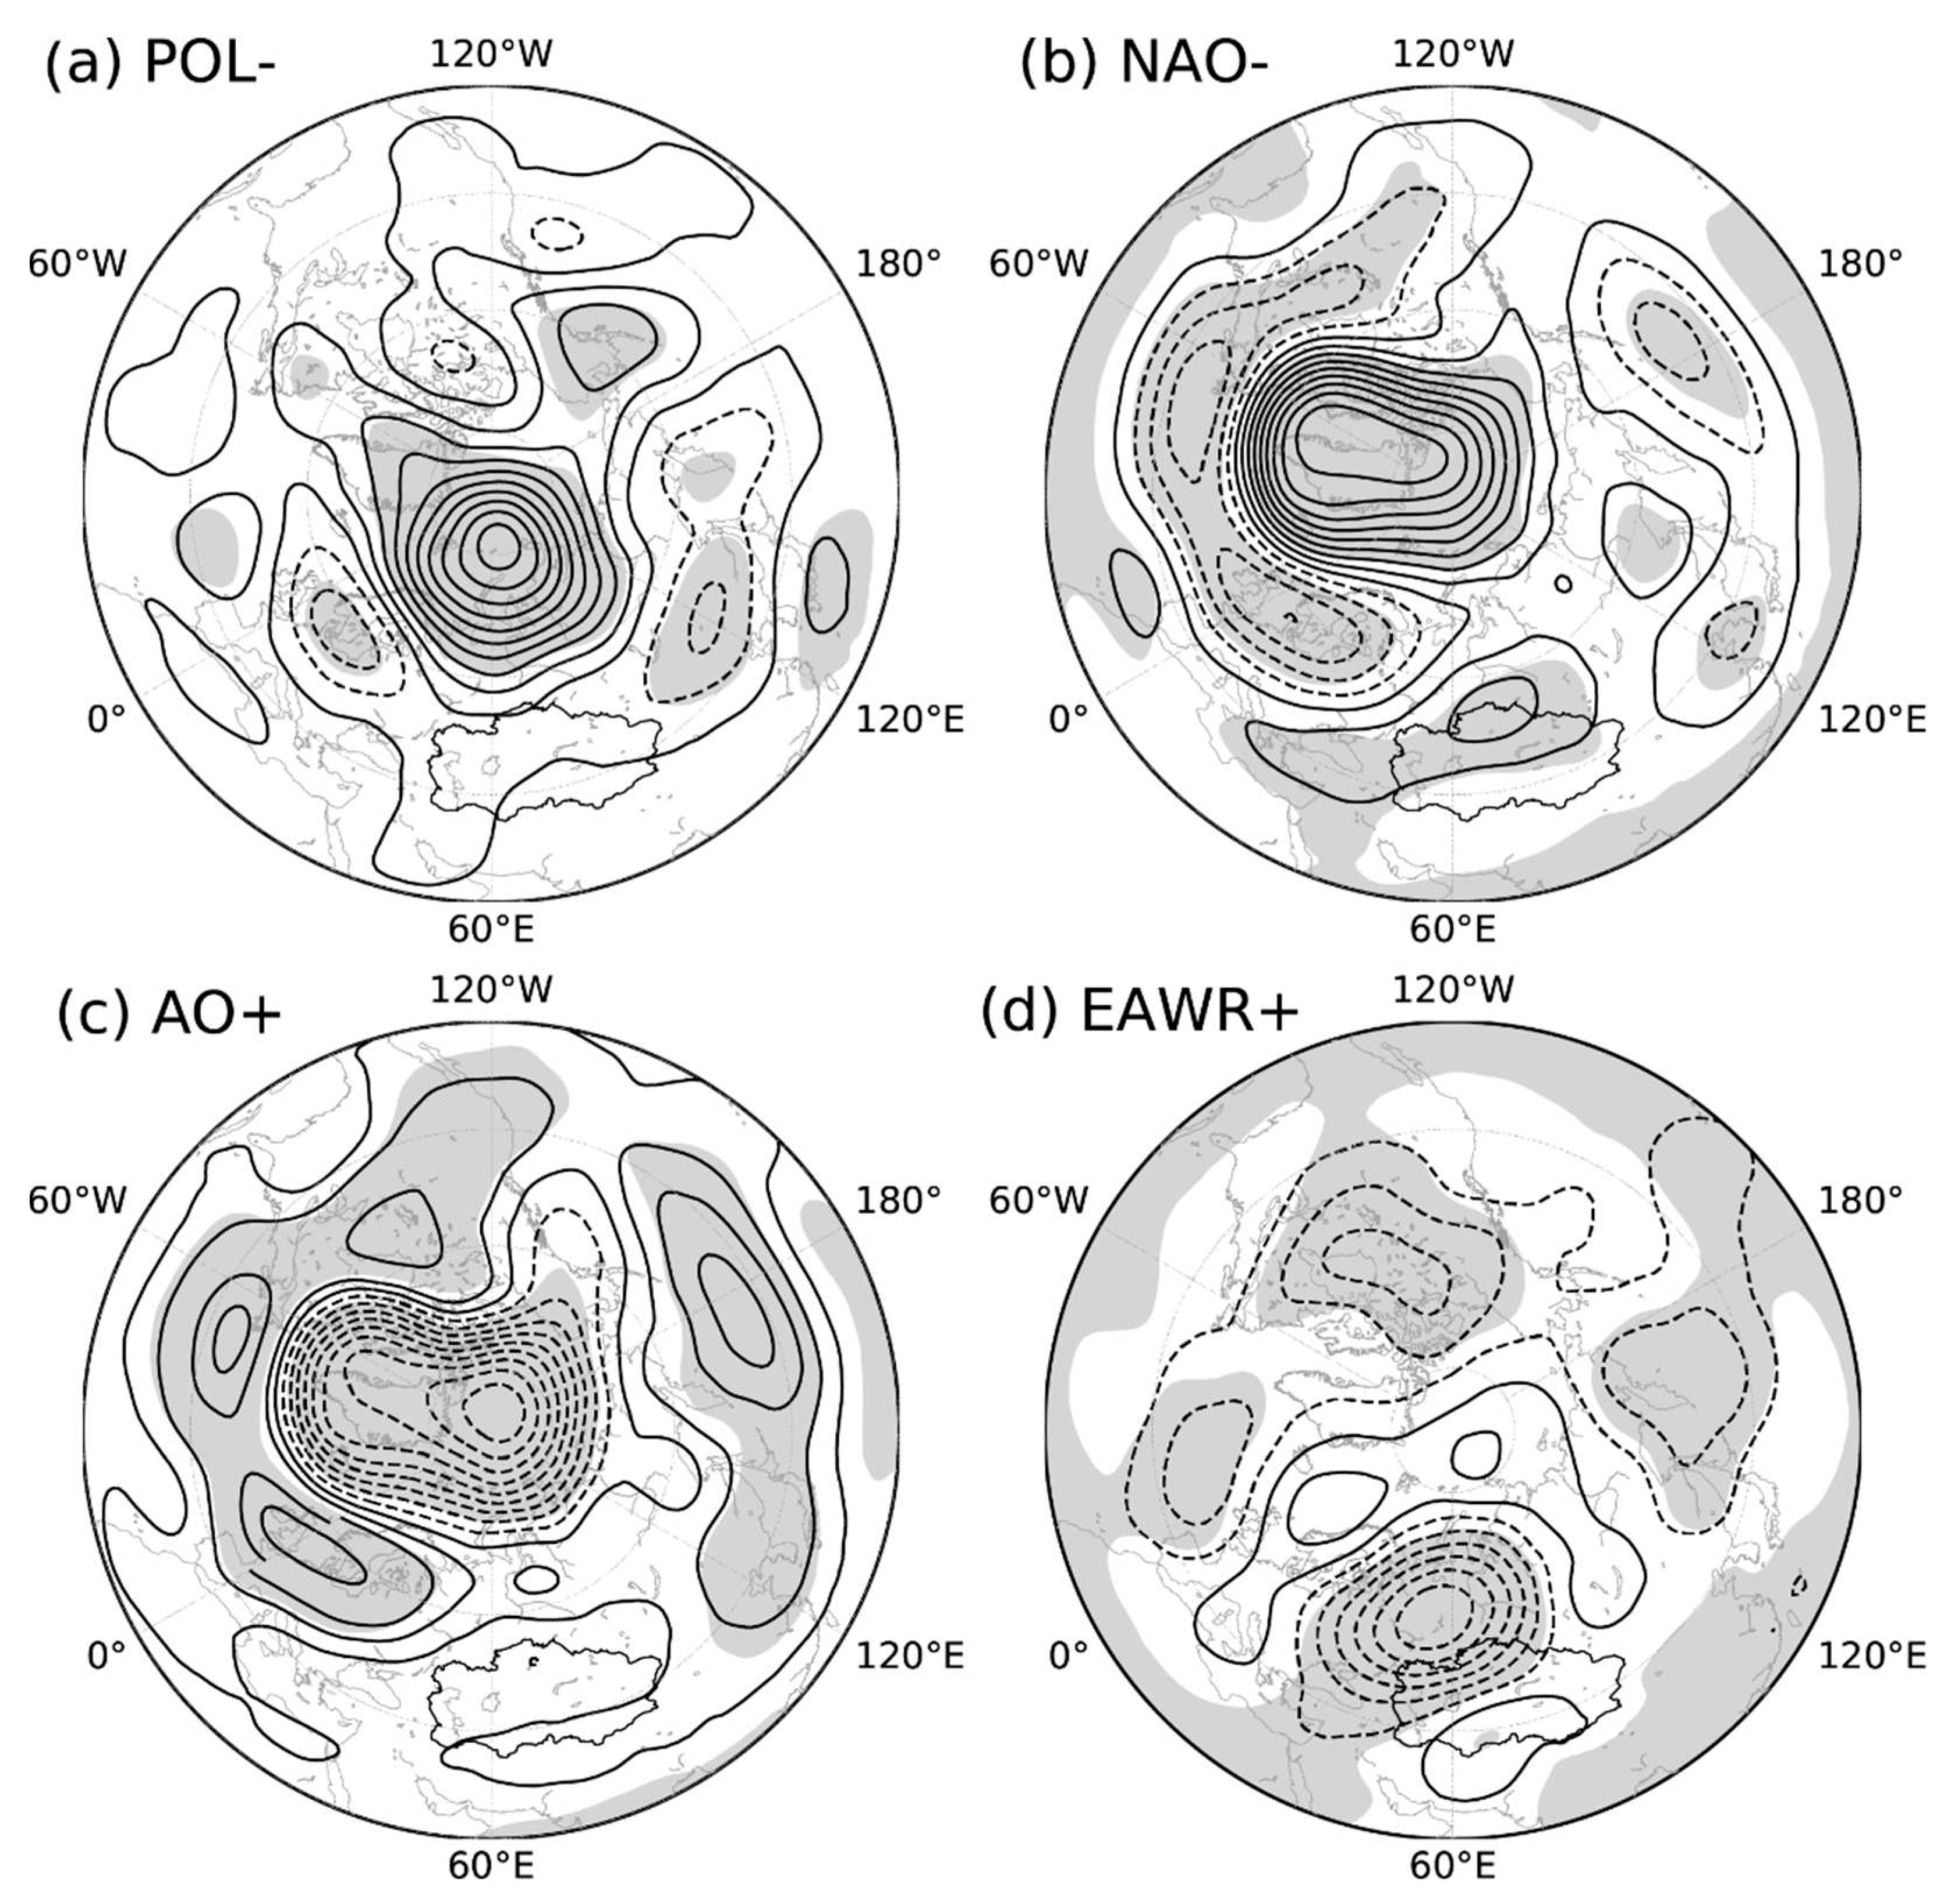
Figure 4 displays the regressed Z500 anomalies against the standardized reconstructed time series of the four scale bands. To compare these patterns with conventional teleconnection patterns, parallel regression maps against teleconnection indices and linear trends of Z500 are shown in
Figure 5. The regressed Z500 anomalies against the time series of the four scale bands exhibit four distinct patterns. The first pattern of the 2–3.9-yr scale is characterized by a positive anomaly over the Kara Sea and three negative anomalies over Great Britain, Central Asia and Northeast Asia, respectively, which is reminiscent of the negative phase of POL (
Figure 4a and
Figure 5a). The pattern correlation coefficient between these two patterns is 0.32, which is significant at the 99% confidence level. The positive Z500 anomaly over the Kara Sea is likely to advect a high potential vorticity from the Arctic southward to Central Asia to deepen a trough or negative Z500 anomaly in situ, which is intimately related to the extreme precipitation (
Figure 2c).
Considering the 4–6-yr scale (
Figure 4b), the regressed Z500 pattern is characterized by a positive anomaly dominating over Greenland with an evident negative anomaly elongating zonally over the North Atlantic, which agrees well with the negative phase of the NAO (
Figure 5b). The spatial pattern correlation coefficient between them reaches 0.78, which is also significant at the 99% confidence level. However, there is a positive Z500 anomaly over northern Central Asia for both the regressed Z500 pattern against the 4–6-yr scale and the negative phase of the NAO. We speculate that the negative phase of the NAO may act as a precursor for the Rossby wave train favoring extreme precipitation over Central Asia (
Figure 2). Although the 4–6-yr scale of annual precipitation has been noted in Hu et al. [
20] and Chen et al. [
31], we identify the modulation planetary-scale modes of the 2–3.9-yr and 4–6-yr scales of occurrence number of extreme precipitation.
In terms of the 9–12-yr scale (
Figure 4c), the regressed Z500 map, to some extent, is anti-symmetric to that of the 4–6-yr scale. The structure features a negative anomaly over the Arctic enclosed by five significant positive anomaly centers over the high latitudes, which bears some resemblance to the positive phase of the AO/NAM (
Figure 5c). Thompson and Wallace [
32] illustrated that the AO/NAM encompasses the NAO but with a broader horizontal scale and higher degree of zonal symmetry. Indeed, the negative height anomaly center is situated over the pole and enclosed by positive anomalies in the mid–high latitudes (
Figure 5c). The spatial pattern correlation coefficient between the regressed Z500 maps of the 9–12-yr scale and the AO reaches 0.52 and is significant at the 99% confidence level.
A parallel Morlet analysis applied to the time series of these three patterns shows the 2–4-yr scale of the POL pattern, 4–7-yr scale of the NAO and 9–12-yr scale of the AO/NAM (not shown). The result confirms that these planetary-scale climate modes modulate the extreme precipitation over Central Asia on different time scales.
3.2.2. Reconstruction of the three major scales
Since each regression coefficient is associated with a different time series, the three Z500 regression maps in
Figure 4 are nonadditive. Instead, we add the four Z500 regression maps with the weight of each relative contribution of their time series. We reconstructed a time series (
Ns) from the four scale bands and calculated the contribution of each scale band (
Ni) to the Ns using an amplitude projection [
33] that projected
Ni to
Ns and normalized it by
Ns:
Ni ×
Ns / (
Ns ×
Ns). The sum of the amplitude projection indices of the three scale bands is 1. The contributions of the time series reconstructed from each of the three scale bands to the
Ns are 0.69, 0.19 and 0.12, respectively. In addition, we also constructed a time series from the residual scales.
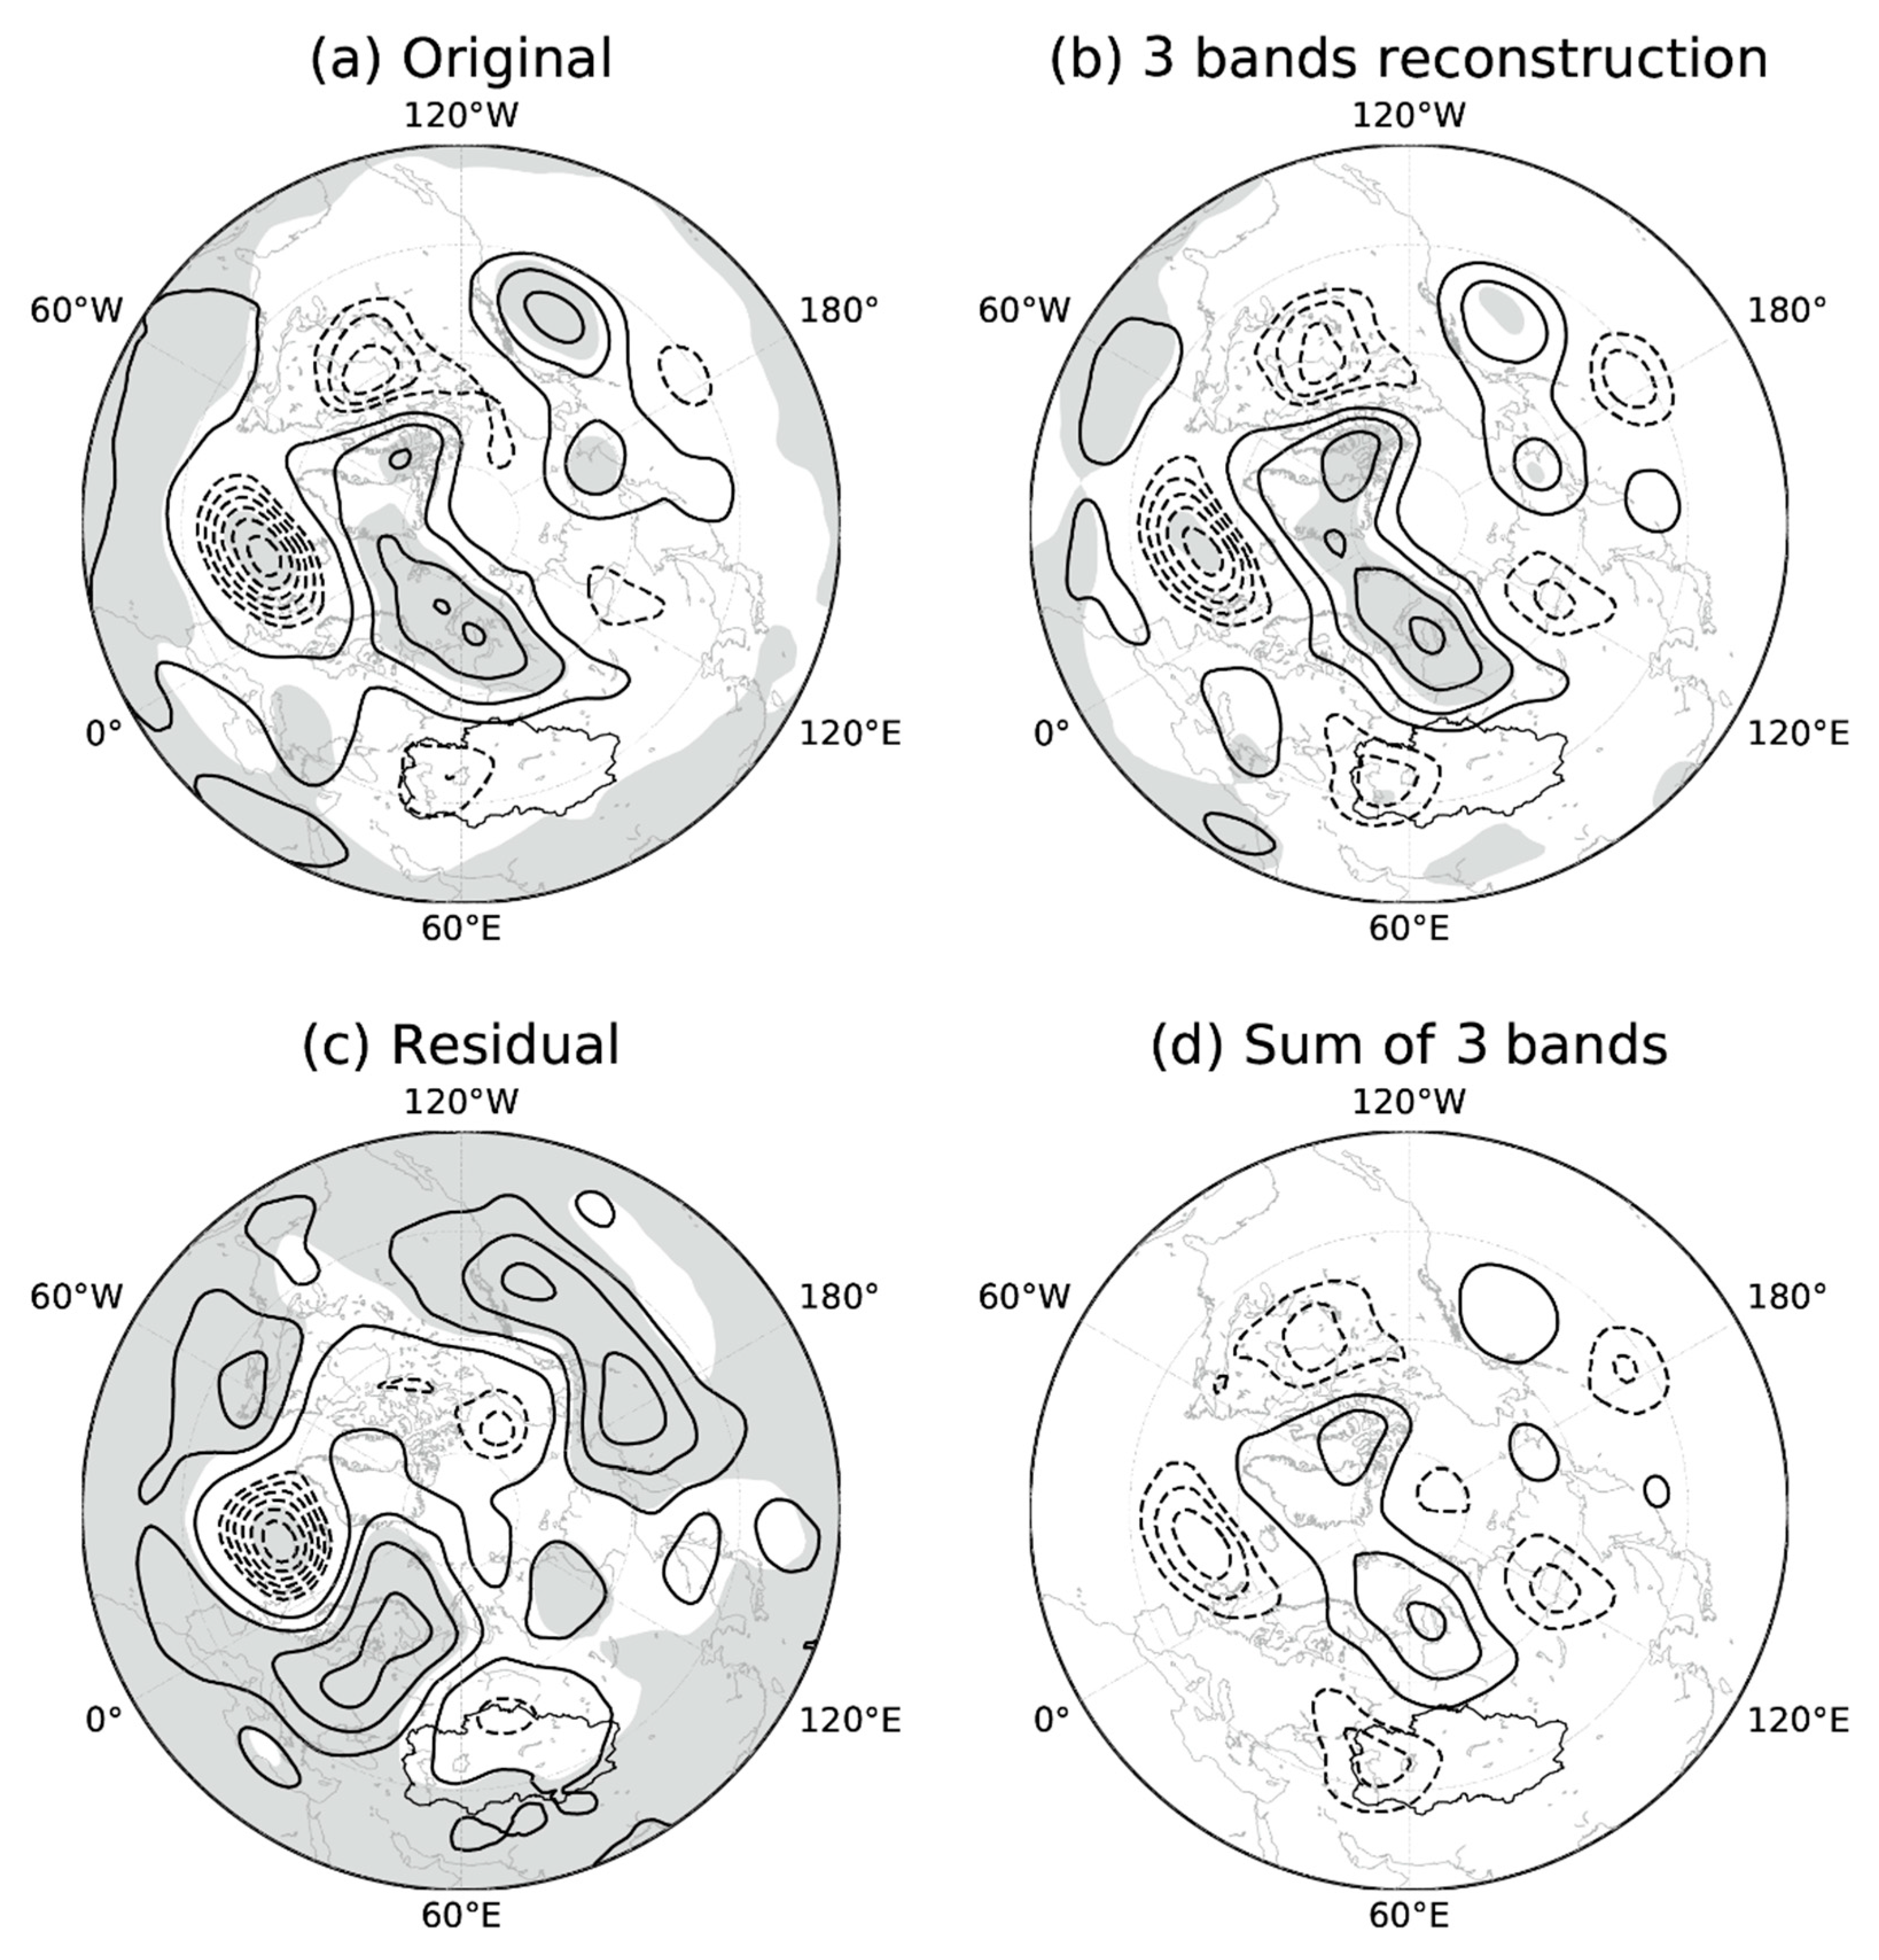
Figure 6 displays the regressed Z500 anomalies against the time series of the original, reconstructed from the three scale bands, reconstructed from the residual scales, and the sum of the regression maps in
Figure 4 weighted by their respective contributions.
The regressed Z500 anomaly against the original time series features a combination of the negative phases of the POL pattern and the NAO pattern (
Figure 6a), suggesting major contributions from these patterns. The regressed Z500 anomaly against the time series reconstructed from the three major scale bands (
Ns) is generally consistent with that of the original time series (
Figure 6b). The weighted sum of the regressed Z500 anomalies against each of the three scale bands is also in good agreement with the regressed Z500 anomaly structure against
Ns (
Figure 6d). The result confirms the dominant role of the negative phase of POL, with a secondary contribution from the negative phase of the NAO, in modulating the occurrence number of extreme precipitation events over Central Asia. Therefore, the combination of the POL, NAO, and AO on different time scales is conducive to more occurrences of extreme precipitation over Central Asia.
The regressed Z500 anomaly against the time series reconstructed from the residual scales features a positive–negative–positive–negative Rossby wave train from the eastern coast of North America via the North Atlantic to Central Asia (
Figure 6c). This pattern agrees well with the positive phase of the EAWR (
Figure 5d), with a spatial pattern correlation coefficient of 0.21. There is a prominent negative Z500 anomaly associated with the positive phase of the EAWR to the north of Central Asia, indicative of a precursor for the circulation of extreme precipitation (
Figure 2). This is in contrast with the findings of Ma et al. [
14], who discovered that the negative EAWR pattern increases precipitation and extreme precipitation over Central Asia during summer.
3.3. The roles of planetary-scale climate modes
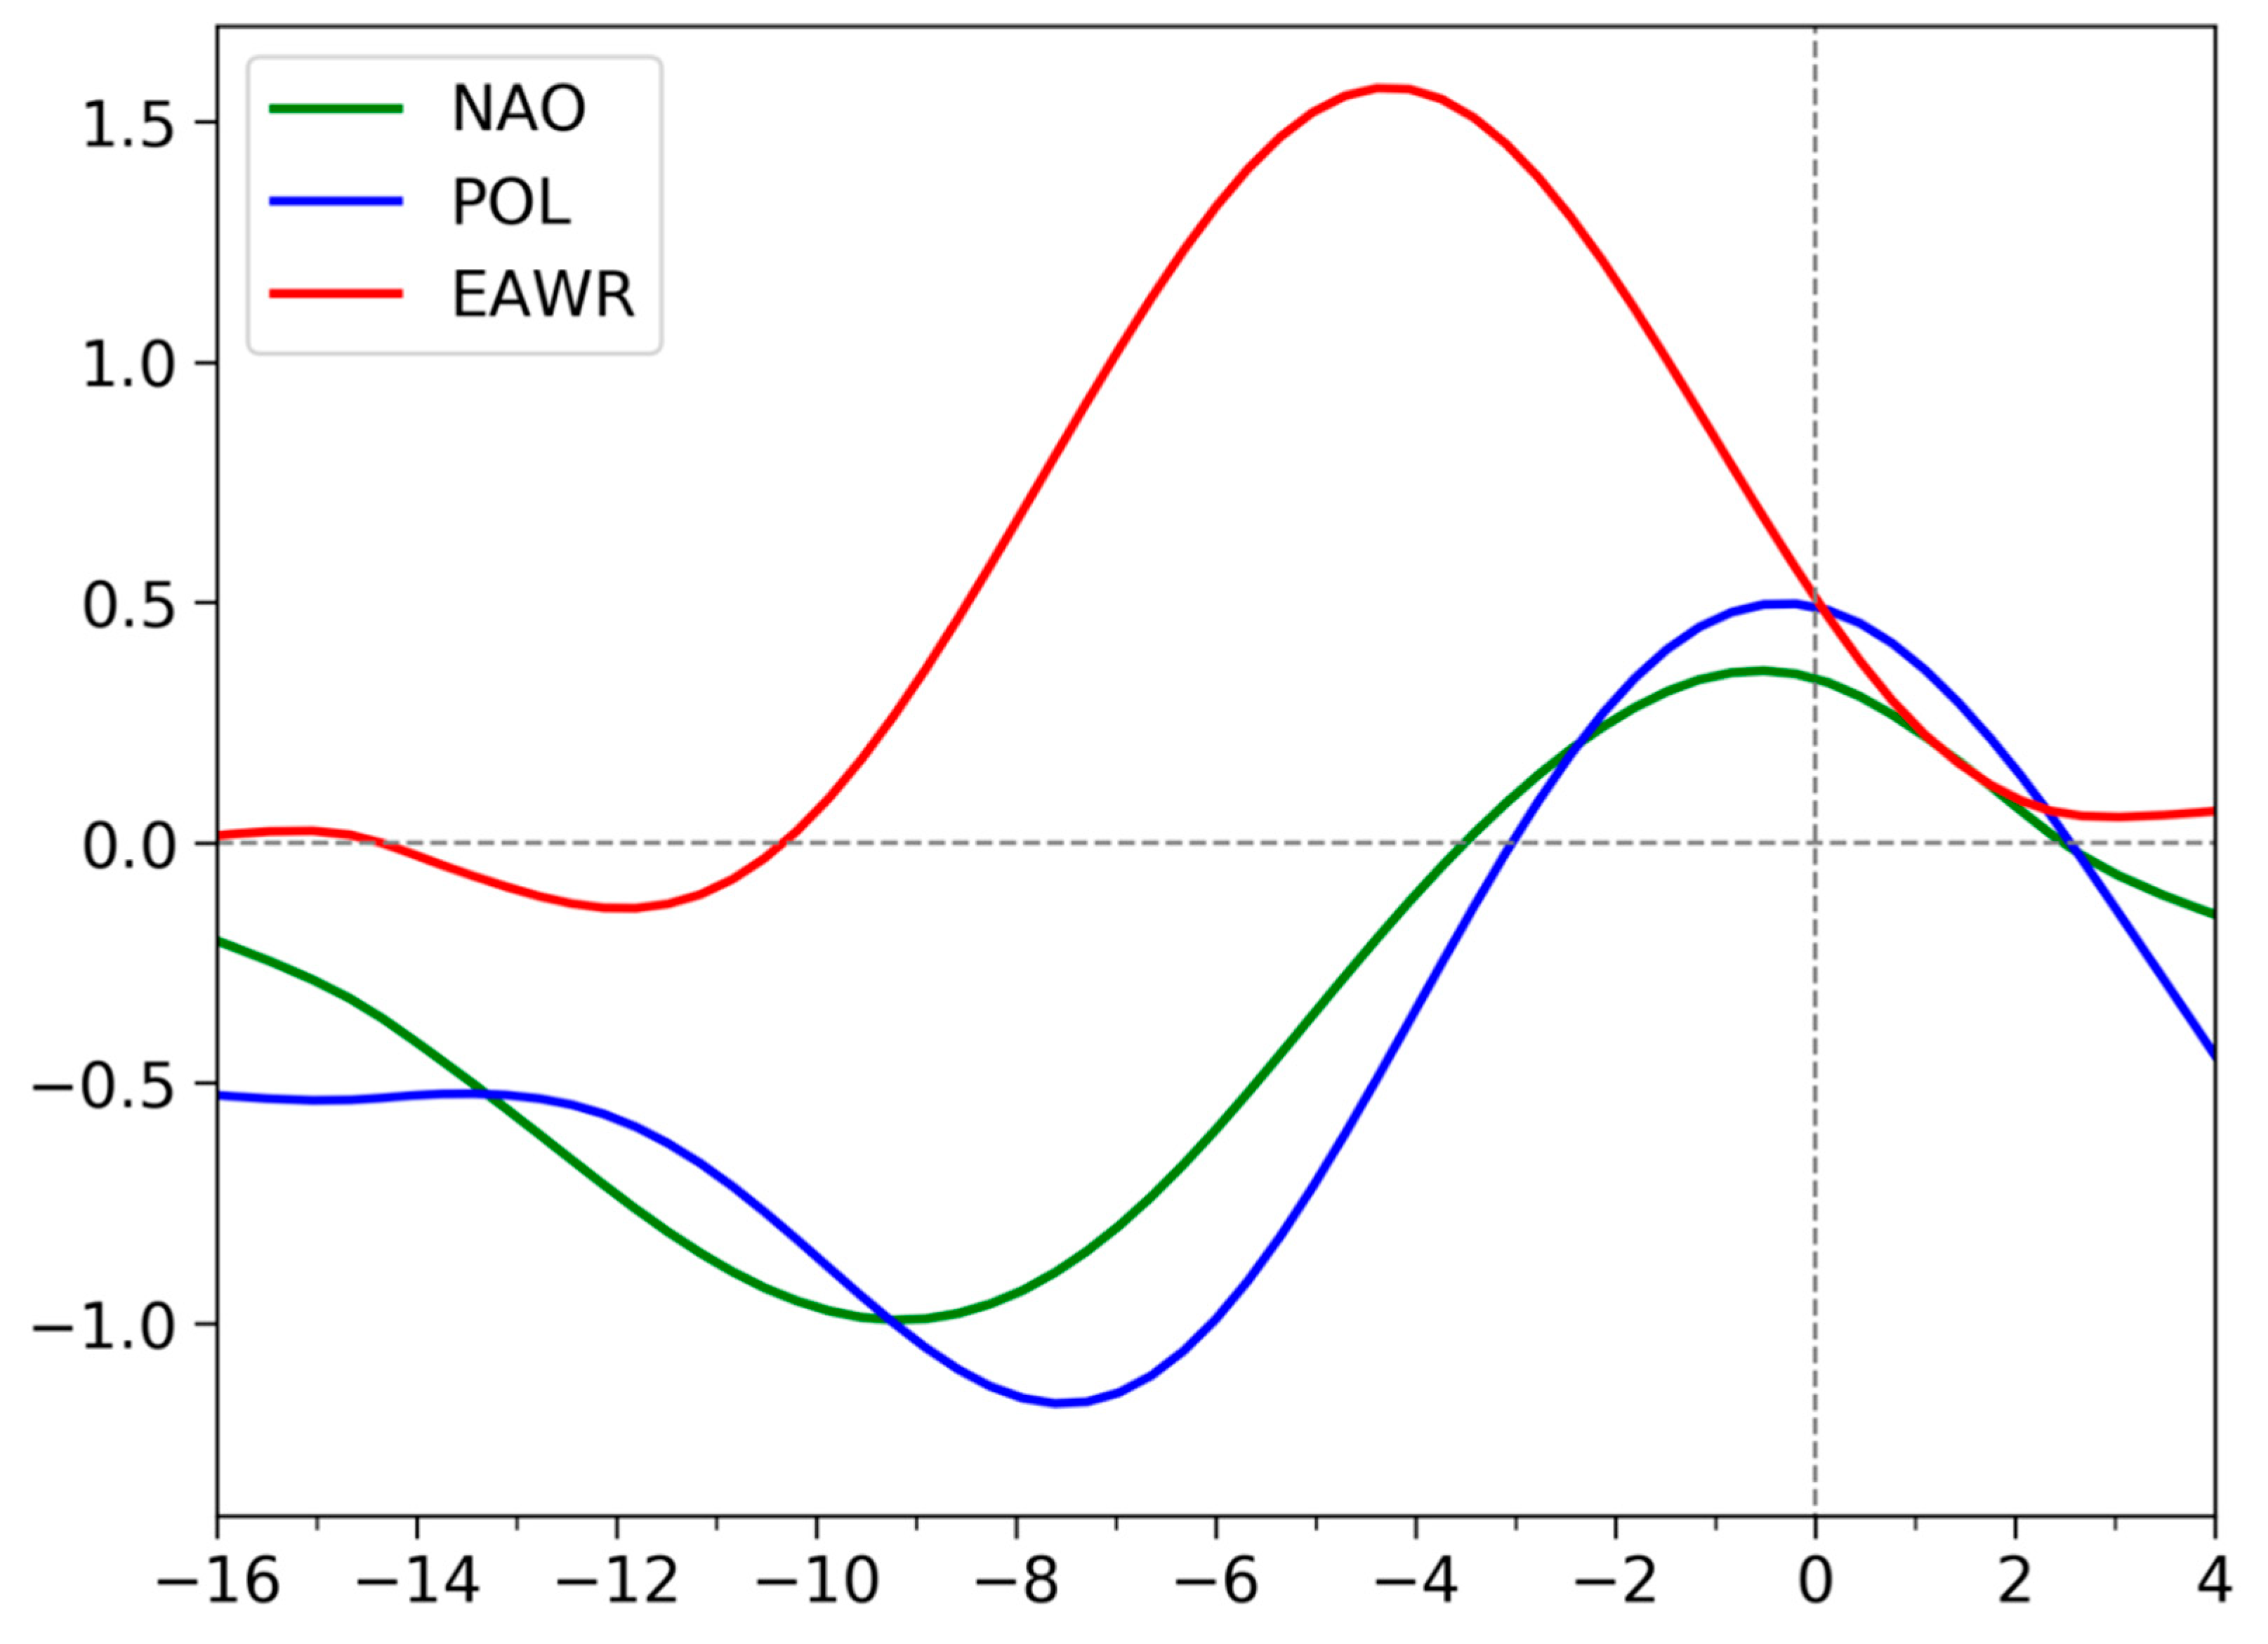
The above analysis regarding the relationship between planetary-scale climate modes and extreme precipitation is based on the seasonal mean, and we speculate that the favorable teleconnection patterns serve as precursors of extreme precipitation over Central Asia. To verify this speculation, we pick up and average the daily teleconnection pattern indices from days −16 to 4 relative to the extreme precipitation day.
Figure 7 displays the time series of the mean daily indices of the NAO, POL and EAWR for extreme precipitation.
As can be seen from
Figure 7, and as anticipated, these three teleconnection patterns play a precursor role in triggering the anomalous circulation of extreme precipitation and their indices peak in sequence. The amplitudes of the negative NAO pattern, the negative POL pattern and positive EAWR pattern reach their maxima on days −9, −7 and −4, respectively. The result suggests that the negative NAO and POL patterns constitute a parallel precursor, and the positive EAWR pattern acts as an intermediate circulation for the anomalous circulation inducing extreme precipitation. More specifically, the negative NAO pattern intensifies from day −16 to −9 and then turns to be in a positive phase after day −4. Although the amplitude of the negative POL phase is relatively stronger around day −16, it magnifies from day −12 to −7 and then reduces to zero at around day −3. In contrast, the positive EAWR pattern amplifies from day −10 to −4 and its strongest amplitude is considerably larger than that of the negative NAO and POL patterns. Despites the EAWR weakening afterward, the amplitude remains at 0.5 on the extreme precipitation day.
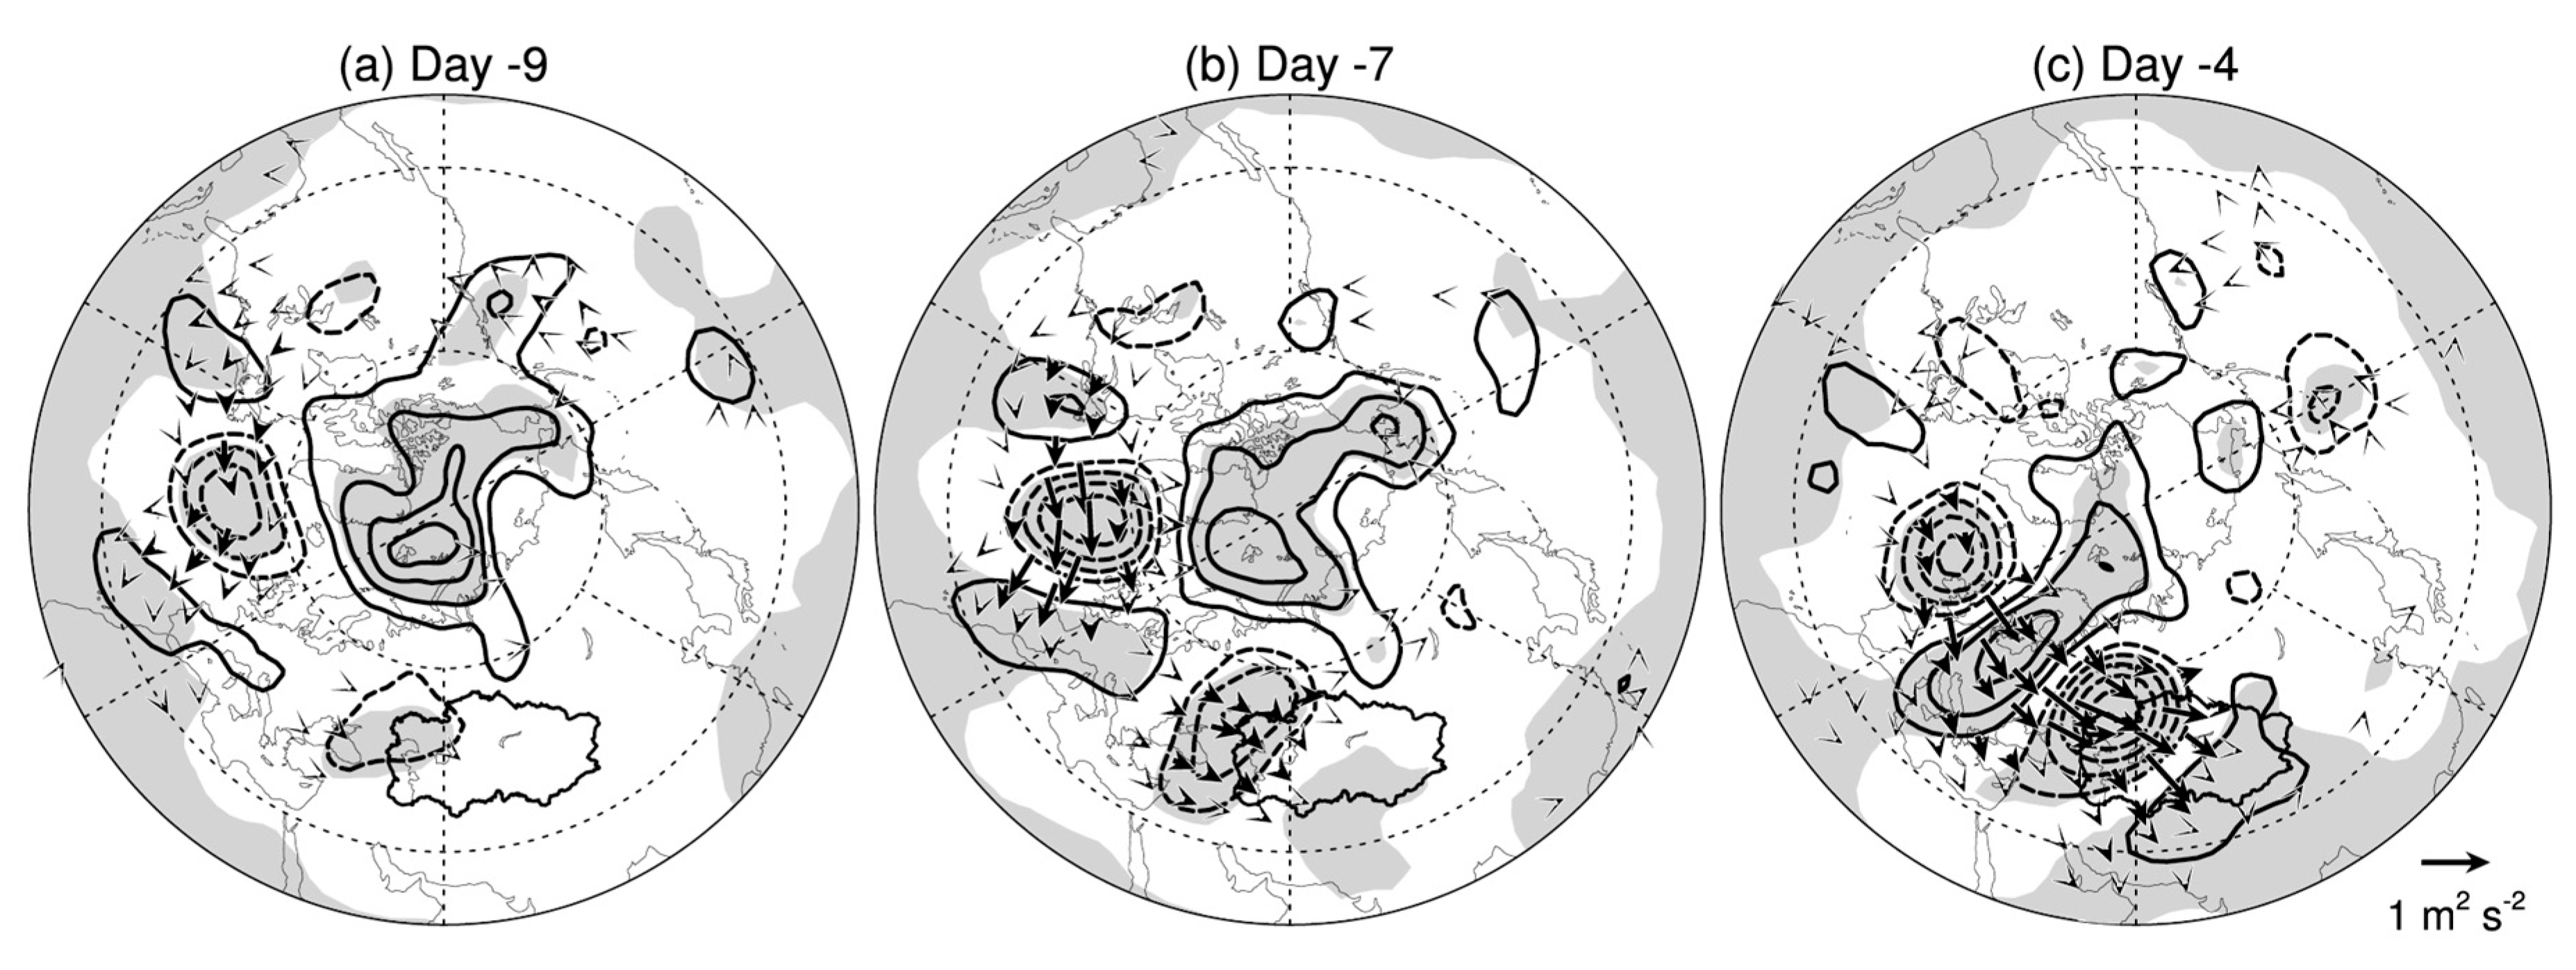
Figure 8 shows the composite Z500 anomaly and Rossby wave activity flux on days −9, −7 and −4 relative to the extreme precipitation day. On day −9 (
Figure 8a), the anomaly pattern features a pronounce positive anomaly in the Arctic and two negative anomalies over the North Atlantic and northwestern Central Asia, which has a combination of the negative NAO and POL patterns. On day −7 (
Figure 8b), the Rossby wave energy is exported downward to the positive anomaly over Europe. In spite of no evident incoming Rossby wave energy, the negative anomaly over northwestern Central Asia intensifies. This is possibly due to the positive potential vorticity advection by the positive anomaly over the Arctic, which has a pronounced projection onto the negative POL pattern. On day −4 (
Figure 8c), there is an evident negative–positive–negative–positive pattern from the North Atlantic via Europe to Central Asia, which bears a strong resemblance to the positive EAWR pattern. Therefore, the negative NAO pattern likely provides a Rossby wave source, particularly the negative anomaly over the North Atlantic, and the Rossby wave energy is exported downward to the negative anomaly over Central Asia via the wave train of the positive EAWR pattern. In contrast, the positive anomaly of the negative POL pattern conveys the positive potential vorticity to Central Asia to help the intensification of the negative height anomaly.
4. Conclusions and Discussion
This study investigated extreme precipitation over Central Asia using APHRDOTIE gridded precipitation data during warm season over the period of 1951–2005. The major temporal variations were derived using a Morlet wavelet analysis, and their corresponding planetary-scale climate modes using linear regression analysis.
The extreme precipitation of the region primarily lies along the mountains over central and northern Central Asia and is intimately associated with a trough embedded in a Rossby wave train from the North Atlantic to Lake Baikal. The annual occurrence number of extreme precipitation days is characterized by two significant scale bands: 2–3.9 yr and 4–6 yr. The 2–3.9-yr scale is the dominant variability, with an explained variance of 46.8%, and is associated with the negative phase of POL. The 4–6-yr scale provides a secondary contribution, and the corresponding pattern mimics the negative phase of the NAO. In contrast, the 9–12 scales provide minor contributions to the total variability and is associated with the positive phase of the AO. The circulation associated with residual scales resembles the positive EAWR phase.
The planetary-scale climate modes serve as precursors of extreme precipitation over Central Asia. However, the POL, NAO and EAWR patterns play different roles in triggering extreme precipitation. The negative phase of POL likely provides a direct contribution to the negative height anomaly over Central Asia, which is deepened by a high potential vorticity advection associated with the positive height anomaly over the Kara Sea. In contrast, the negative phase of the NAO and the positive phase of EAWR serve as precursors for extreme precipitation during different episodes. The negative phase of the NAO is possibly maintained by transient eddy feedback forcing and thus manifests as a Rossby wave source—particularly the negative height anomaly over the North Atlantic. The negative–positive–negative Rossby wave train associated with the positive EAWR phase helps export the Rossby wave energy from the negative NAO pattern to the negative Z500 anomaly over Central Asia.
The spatial structure of the climate trend over the Northern Hemisphere overlaps anomalies of the negative POL and NAO patterns and thus provides a favorable climate background. It can be concluded that these three patterns jointly modulate the temporal variability of extreme precipitation over Central Asia. Although the positive phase of the AO is antisymmetric with the negative phases of the NAO and POL, its contribution to the variability is relatively small, and thus the major contributors are primarily the negative phases of POL and the NAO. In comparison with prior studies mentioned in the introduction, we not only isolated the major time scales of variabilities of extreme precipitation occurrence number, but also tie each major scale to these planetary-scale climate modes. Moreover, we also present the precursor roles of the negative POL and NAO patterns.
The present study was primarily based on the total occurrence number of extreme precipitation days and statistical analysis. Our future work will attempt to explore more dynamical aspect regarding these planetary-scale climate patterns and extreme precipitation in Central Asia.
Author Contributions
Conceptualization and formal analysis, W.T., F.X. and S.L.; data curation and visualization, L.S; writing—original draft preparation, W.T.; writing—review and editing, W.T. and F.X.. All authors have read and agreed to the published version of the manuscript.
Funding
This research was funded by the National Natural Science Foundation of China (Grant No., 42275063).
Data Availability Statement
Acknowledgments
We convey our gratitude to the contributors of the SciPy ecosystem (Virtanen et al., 2020), which was used for data analysis and visualization.
Conflicts of Interest
The authors declare no conflict of interest.
References
- Hu, Z.; Zhang, C.; Hu, Q.; Tian, H. Temperature changes in Central Asia from 1979 to 2011 based on multiple datasets. J. Climate 2014, 27, 1143–1167. [Google Scholar] [CrossRef]
- Zhang, Q.; Wang, W.; Wang, S.; Zhang, L. Increasing trend of pan evaporation over the semiarid Loess Plateau under a warming climate. Journal of Applied Meteorology and Climatology 2016, 55, 2007–2020. [Google Scholar] [CrossRef]
- Shi, Y.; Shen, Y.; Li, D.; Zhang, G.; Ding, Y.; Hu, R.; Kang, E. Discussion on the present climate change from warm-dry to warm-wet in Northwest China. Quaternary Sciences 2003, 23, 152–164. [Google Scholar]
- Peng, D.; Zhou, T.; Zhang, L.; Wu, B. Human contribution to the increasing summer precipitation in Central Asia from 1961 to 2013. J. Climate 2018, 31, 8005–8021. Available online: https://journals.ametsoc.org/doi/abs/10.1175/JCLI-D-17-0843.1. [CrossRef]
- Yang, L.-M.; Guan, X.-F.; Zhang, Y.-X. Atmospheric circulation characteristics of precipitation anomaly in arid regions in Central Asia (in Chinese). Arid Zone Research 2018, 35, 249–259. [Google Scholar]
- Zhang, Q.; Yang, J.; Wang, W.; Ma, P.; Lu, G.; Liu, X.; et al. Climatic warming and humidification in the arid region of Northwest China: multi-scale characteristics and impacts on ecological vegetation. Journal of Meteorological Research 2021, 35, 113–127. [Google Scholar] [CrossRef]
- Wei, K.; Wang, L. Reexamination of the aridity conditions in arid northwestern China for the last decade. J. Climate 2013, 26, 9594–9602. [Google Scholar] [CrossRef]
- Jiang, J.; Zhou, T. Humaninduced rainfall reduction in drought-prone northern Central Asia. Geophysical Research Letters 2021, 48, e2020GL092156. [Google Scholar] [CrossRef]
- Dilinuer, T.; Yao, J.-Q.; Chen, J.; Mao, W.-Y.; Yang, L.-M.; Yeernaer, H.; Chen, Y.-H. Regional drying and wetting trends over Central Asia based on Köppen climate classification in 1961–2015. Advances in Climate Change Research 2021, 12, 363–372. [Google Scholar] [CrossRef]
- Yao, J. Q.; Chen, J.; Zhang, T. W.; Tuoliewubieke, D.; Mao, W. Y. Stationarity in the variability of arid precipitation: a case study of arid central Asia. Advances in Climate Change Research 2021, 12, 172–186. [Google Scholar] [CrossRef]
- Yao, J.; Chen, Y.; Chen, J.; Zhao, Y.; Dilinuer, T.; Li, J.; et al. Intensification of extreme precipitation in arid Central Asia. Journal of Hydrology 2020, 125760. [Google Scholar] [CrossRef]
- Yang, L.-M. Climate change of extreme precipitation in Xinjiang (in Chinese). Acta Geographica Sinica 2003, 58, 577–583. [Google Scholar]
- Zhang, M.; Chen, Y.; Shen, Y.; Li, Y. Changes of precipitation extremes in arid Central Asia. Quaternary International 2017, 436, 16–27. [Google Scholar] [CrossRef]
- Ma, Q.; Zhang, J.; Game, A. T.; Chang, Y.; Li, S. Spatiotemporal variability of summer precipitation and precipitation extremes and associated large-scale mechanisms in Central Asia during 1979-2018. Journal of Hydrology 2020, 10, 1–14. [Google Scholar] [CrossRef]
- Ma, Q.; Zhang, J.; Ma, Y.; Game, A. T.; Chen, Z.; Chang, Y.; Liu, M. How Do Multiscale Interactions Affect Extreme Precipitation in Eastern Central Asia? J. Climate 2021, 34, 7475–7491. [Google Scholar] [CrossRef]
- Chen, F. H.; Chen, J. W.; Huang, W. A discussion on the westerly-dominated climate model in mid-latitude Asia during the modern interglacial period (in Chinese). Earth Science Frontiers 2009, 16, 23–32. [Google Scholar]
- Huang, W.; Chen, J. H.; Zhang, X. J.; Song, F.; Chen, F. H. Definition of the core zone of the “westerlies-dominated climatic regime”, and its controlling factors during the instrumental period. Science China: Earth Sciences 2015, 58, 676–684. [Google Scholar] [CrossRef]
- Jiang, J.; Zhou, T. Human induced rainfall reduction in drought-prone northern Central Asia. Geophysical Research Letters 2021, 48, e2020GL092156. [Google Scholar] [CrossRef]
- Xu, Y.; Lin, Z.; Wu, C. Spatiotemporal variation of the burned area and its relationship with climatic factors in central Kazakhstan. Remote Sensing 2021, 13, 313. [Google Scholar] [CrossRef]
- Hu, Z.; Zhou, Q.; Chen, X.; Qiang, C.; Wang, S.; Li, J. Variations and changes of annual precipitation in Central Asia over the last century. International Journal of Climatology 2017, 37, 157–170. [Google Scholar] [CrossRef]
- Ao, J.; Sun, J. Difference of water vapour transportation in the interannual and decadal variations of winter precipitation over western China (in Chinese). Climatic and Environmental Research 2014, 19, 497–506. [Google Scholar]
- Yatagai, A.; Kamiguchi, K.; Arakawa, O.; Hamada, A.; Yasutomi, N.; Kitoh, A. APHRODITE: constructing a long-term daily gridded precipitation dataset for Asia based on a dense network of rain gauges. Bulletin of the American Meteorological Society 2012, 93, 1401–1415. [Google Scholar] [CrossRef]
- Hersbach, H.; Bell, B.; Berrisford, P.; Hirahara, S.; Horányi, A.; Muñoz-Sabater, J.; et al. The ERA5 global reanalysis. Quart. J. Roy. Meteor. Soc. 2020, 146, 1999–2049. [Google Scholar] [CrossRef]
- Lai, S.; Xie, Z.; Bueh, C.; Gong, Y. Fidelity of the APHRODITE dataset in representing extreme precipitation over Central Asia. Adv. Atmos. Sci. 2020, 37, 1405–1416. [Google Scholar] [CrossRef]
- Zhao, S.; Deng, Y.; Black, R. X. A dynamical and statistical characterization of U.S. extreme precipitation events and their associated large-scale meteorological patterns. J. Climate 2017, 30, 1307–1326. [Google Scholar] [CrossRef]
- Torrence, C.; Compo, G. P. A practical guide to wavelet analysis. Bulletin of the American Meteorological Society 1998, 79, 61–78. [Google Scholar] [CrossRef]
- Xie, Z.; Bueh, C. Cold vortex events over Northeast China associated with the Yakutsk-Okhotsk blocking. International Journal of Climatology 2017, 37, 381–398. [Google Scholar] [CrossRef]
- Takaya, K.; Nakaruma, H. A formulation of a phase-independent wave-activity flux of stationary and migratory quasi-geostrophic eddies on a zonally varying basic flow. Journal of the Atmospheric Sciences 2001, 58, 608–627. [Google Scholar] [CrossRef]
- Yue, S.; Wang, C. The Mann-Kendall test modified by effective sample size to detect trend in serially correlated hydrological series. Water Resources Management 2004, 18, 201–218. [Google Scholar] [CrossRef]
- Von Storch, H. Misuses of Statistical Analysis in Climate Research. In: Analysis of Climate Variability: Applications of Statistical Techniques, Springer-Verlag, Berlin, 1995, 11−26. [CrossRef]
- Chen, X.; Wang, S.; Hu, Z.; Zhou, Q.; Hu, Q. Spatiotemporal characteristics of seasonal precipitation and their relationships with ENSO in Central Asia during 1901-2013. Journal of Geographical Sciences 2018, 28, 1341–1368. [Google Scholar] [CrossRef]
- Thompson, D. W. J.; Wallace, J. M. The Arctic oscillation signature in the wintertime geopotential height and temperature fields. Geophysical Research Letters 1998, 25, 1297–1300. [Google Scholar] [CrossRef]
- Xie, Z.; Bueh, C.; Deng, Y.; He, B.; Lai, S. Intraseasonal transition of Northern Hemisphere planetary waves and the underlying mechanism during the abrupt-change period of early summer. Climate Dynamics 2022, 59, 1435–1449. [Google Scholar] [CrossRef]
|
Disclaimer/Publisher’s Note: The statements, opinions and data contained in all publications are solely those of the individual author(s) and contributor(s) and not of MDPI and/or the editor(s). MDPI and/or the editor(s) disclaim responsibility for any injury to people or property resulting from any ideas, methods, instructions or products referred to in the content. |
© 2023 by the authors. Licensee MDPI, Basel, Switzerland. This article is an open access article distributed under the terms and conditions of the Creative Commons Attribution (CC BY) license (http://creativecommons.org/licenses/by/4.0/).
