1. Introduction
The concept of big data (BD), introduced in the 1990s [
1], typically refers to a huge information silo consisting of a vast number of datasets distributed in horizontally networked databases. This concept enriches many sectors, including healthcare [
2], banking [
3], media and entertainment [
4], education [
5], and transportation [
6]. The same argument is valid for the manufacturing sector, as described in
Section 2. Approximately 3 Exabytes (EB) of data existed globally in 1986. By 2011, over 300 EB data were stored in a financial econometric context. Remarkably, it reached more than 1000 EB annually in 2015, and it is expected that the world will produce and consume 94 zettabytes (94000 EB) of data in 2022 [
7,
8,
9]. Besides its volume, BD is often characterized by a set of Vs, e.g., velocity, variety, volatility, veracity, validity, value, and alike. The rapid speed by which datasets are accumulated in BD determines its velocity. The multiplicity in the contents (text, video, and graphics) and structures (structured, unstructured, and semi-structured) means the variety of BD. As far as variety is concerned, traditional BD-relevant database systems effectively manage only the structured datasets. Handling unstructured datasets is still somewhat challenging since those (unstructured datasets) do not fit inside a rigid data model [
10]. The tendency of the data structure to change over time means the volatility of BD. The accuracy of the datasets determines the veracity of BD. The appropriateness of the datasets for their intended use means the validity of BD. Finally, the economic or social wealth generated from BD is referred to as its value. Regarding its economic wealth, it is expected that up to the end of 2022, the big data market will grow to
$274.3 billion [
11]. The remarkable thing is that the value of BD can be ensured by developing BD analytics (BDA). It (BDA) formally computes the relevant datasets available in BD using statistical or logical approaches [
12]. The concerned organizations (e.g., International Organizations for Standardization (ISO) and the National Institute of Standards and Technology (NIST)) have been developing vendor-neutral conceptual definitions, taxonomies, requirements and usages, security and privacy, reference architectures, standardization roadmaps, and adoption and modernization schemes for BD [
13,
14,
15,
16,
17,
18,
19,
20,
21,
22]. One of the remarkable things is how to mitigate the BD inequality problem [
12], [
23], ensuring the value (of BD) for all organizations irrespective of their size and information technology enabling resources capacity. The aspect of BD inequality is conceptualized in three dimensions: data access, data representation, and data control inequalities [
24,
25,
26]. Here, data access-relevant inequality means inaccessibility of the data stored in any data storage infrastructures (e.g., data storage infrastructures of any national or private body) and unavailability of accurate statistics. On the other hand, data representation and control-relevant inequalities mean the lack of infrastructure, human capital, economic resources, and institutional frameworks in developing countries and small firms and organizations, compared to developed countries and big firms and organizations. This generates new dimensions of the digital divide in BDA, knowledge underlying the data, and consequent decision-making abilities. Nevertheless, BDA, by nature, is highly resource-dependent and opaque (acts like a black-box) [
27]. Thus, making BDA less resource-dependent and transparent is a challenge. By overcoming this challenge, big data inequality can be resolved.
The remarkable thing is that BD and BDA are valuable constituents of cyber-physical systems of smart manufacturing [
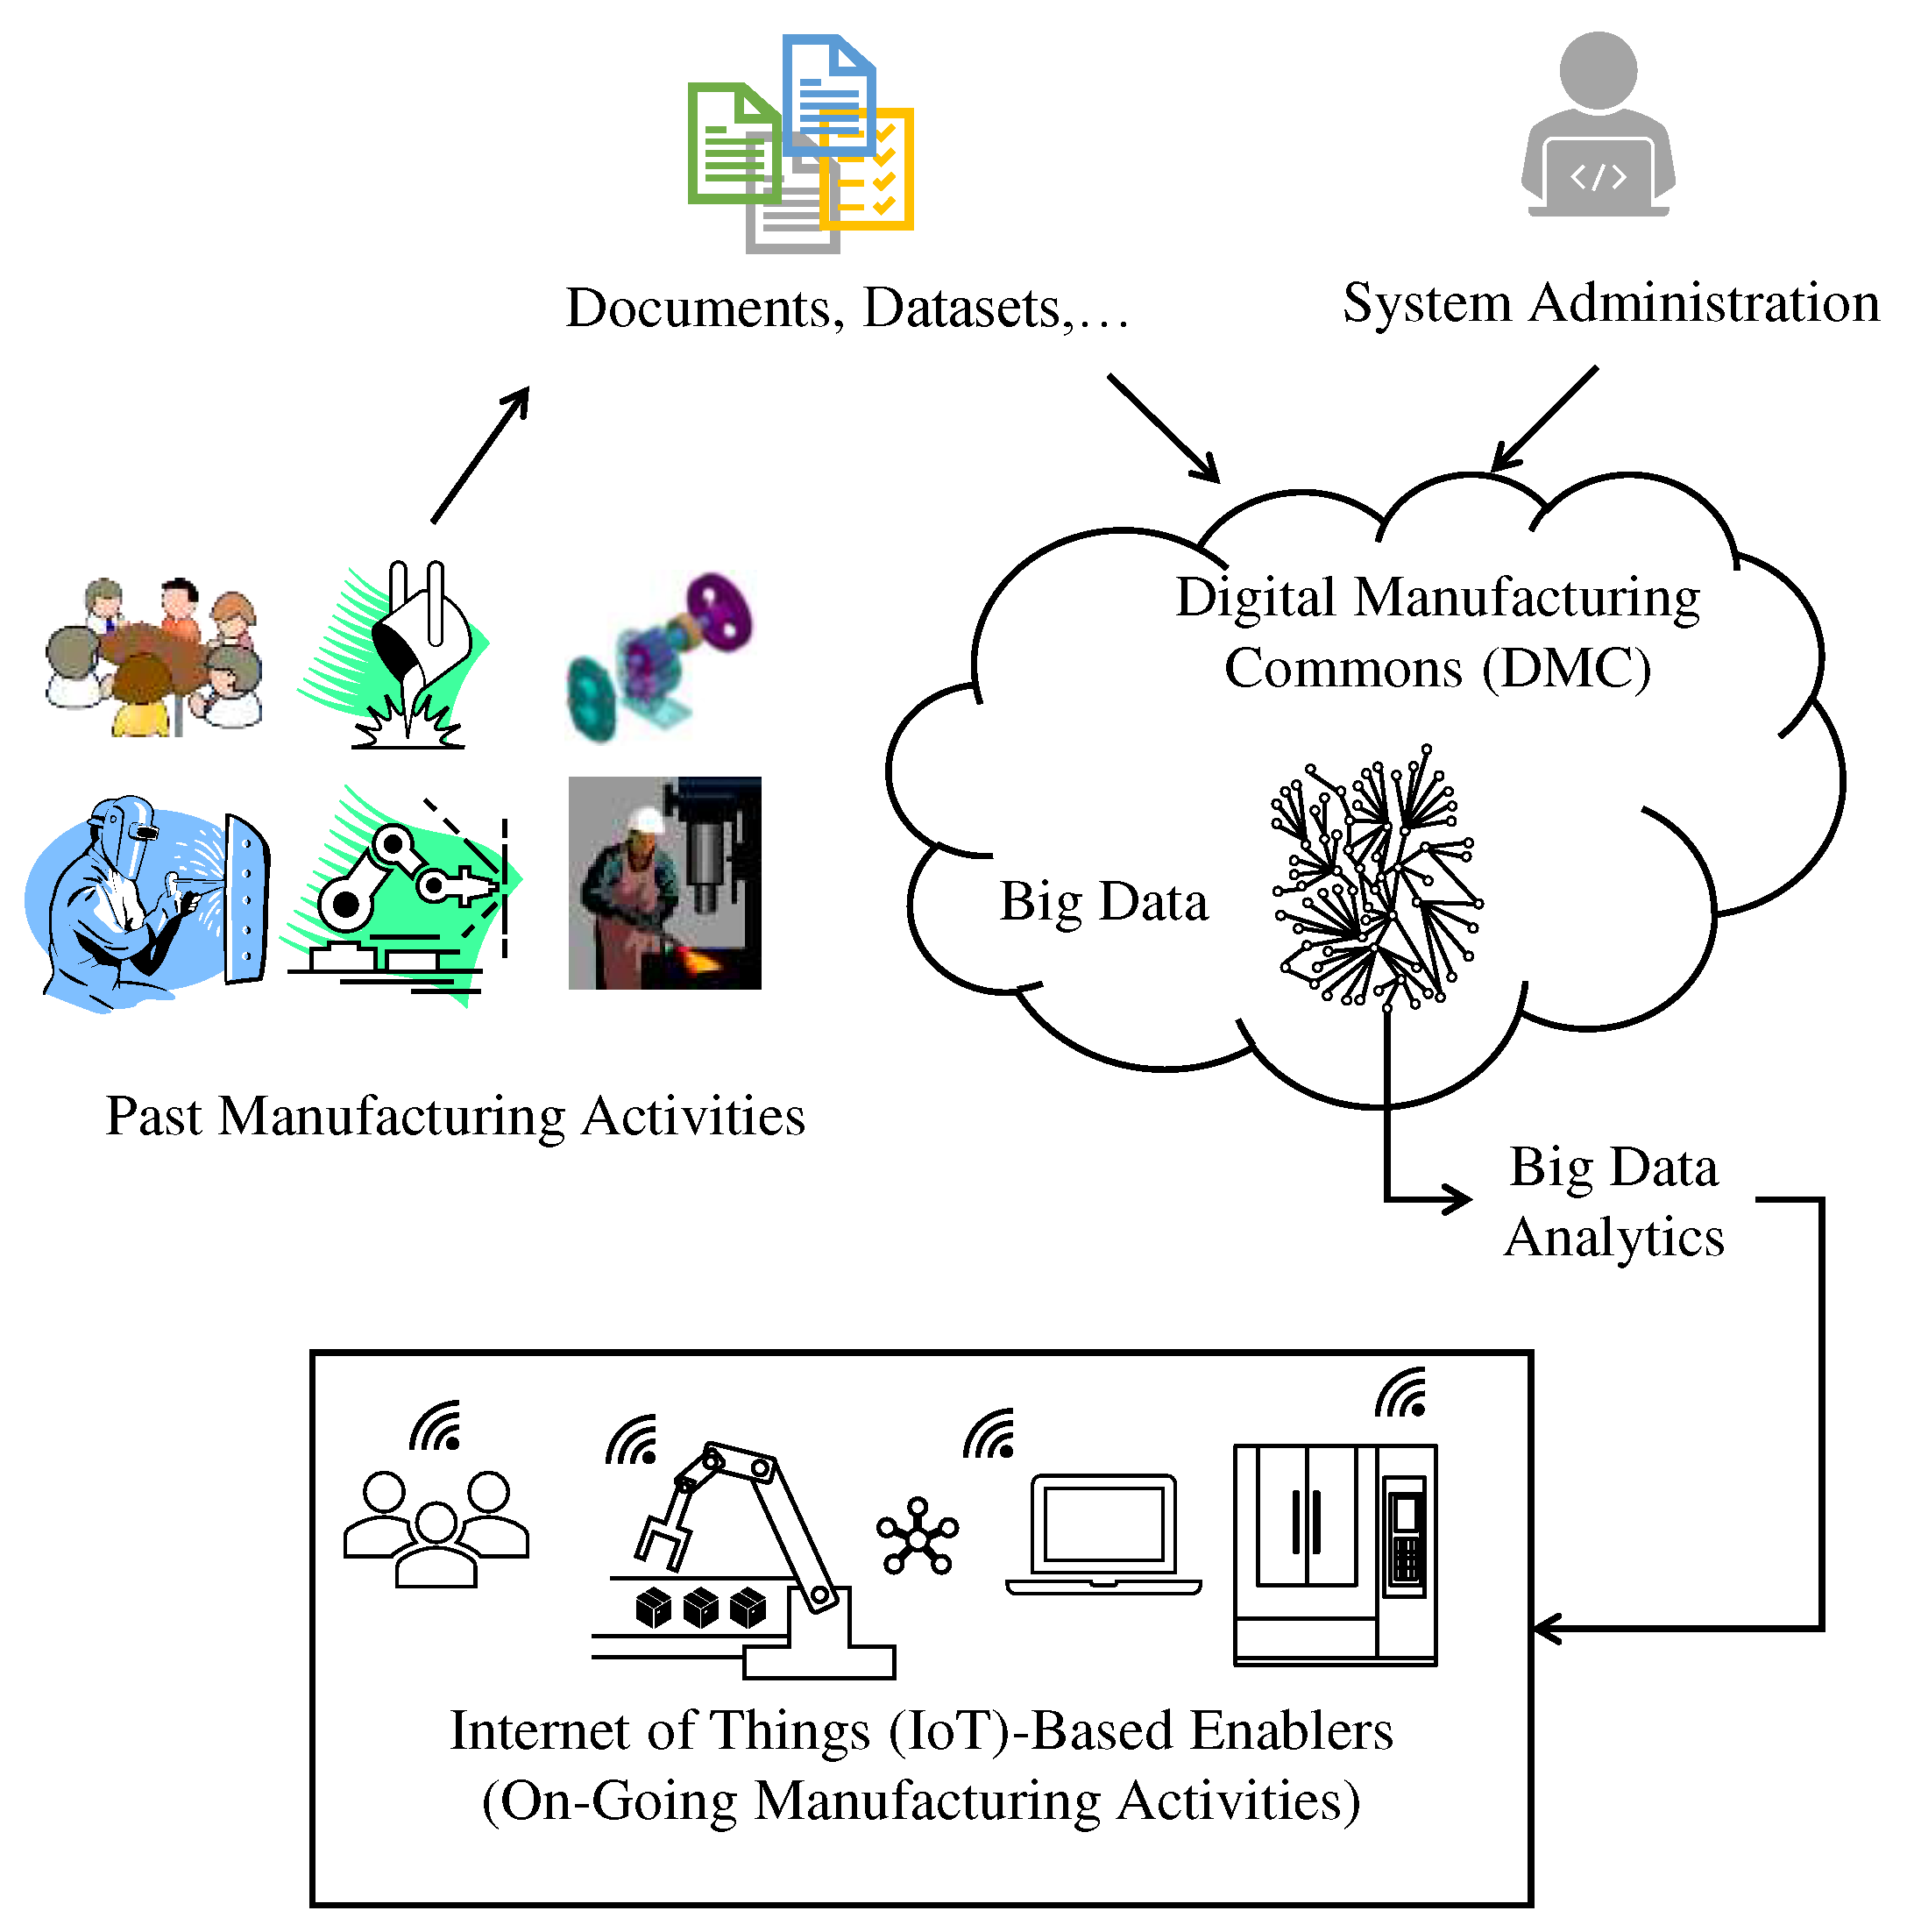
28]. This issue is elaborated below using two schematic diagrams (
Figure 1 and
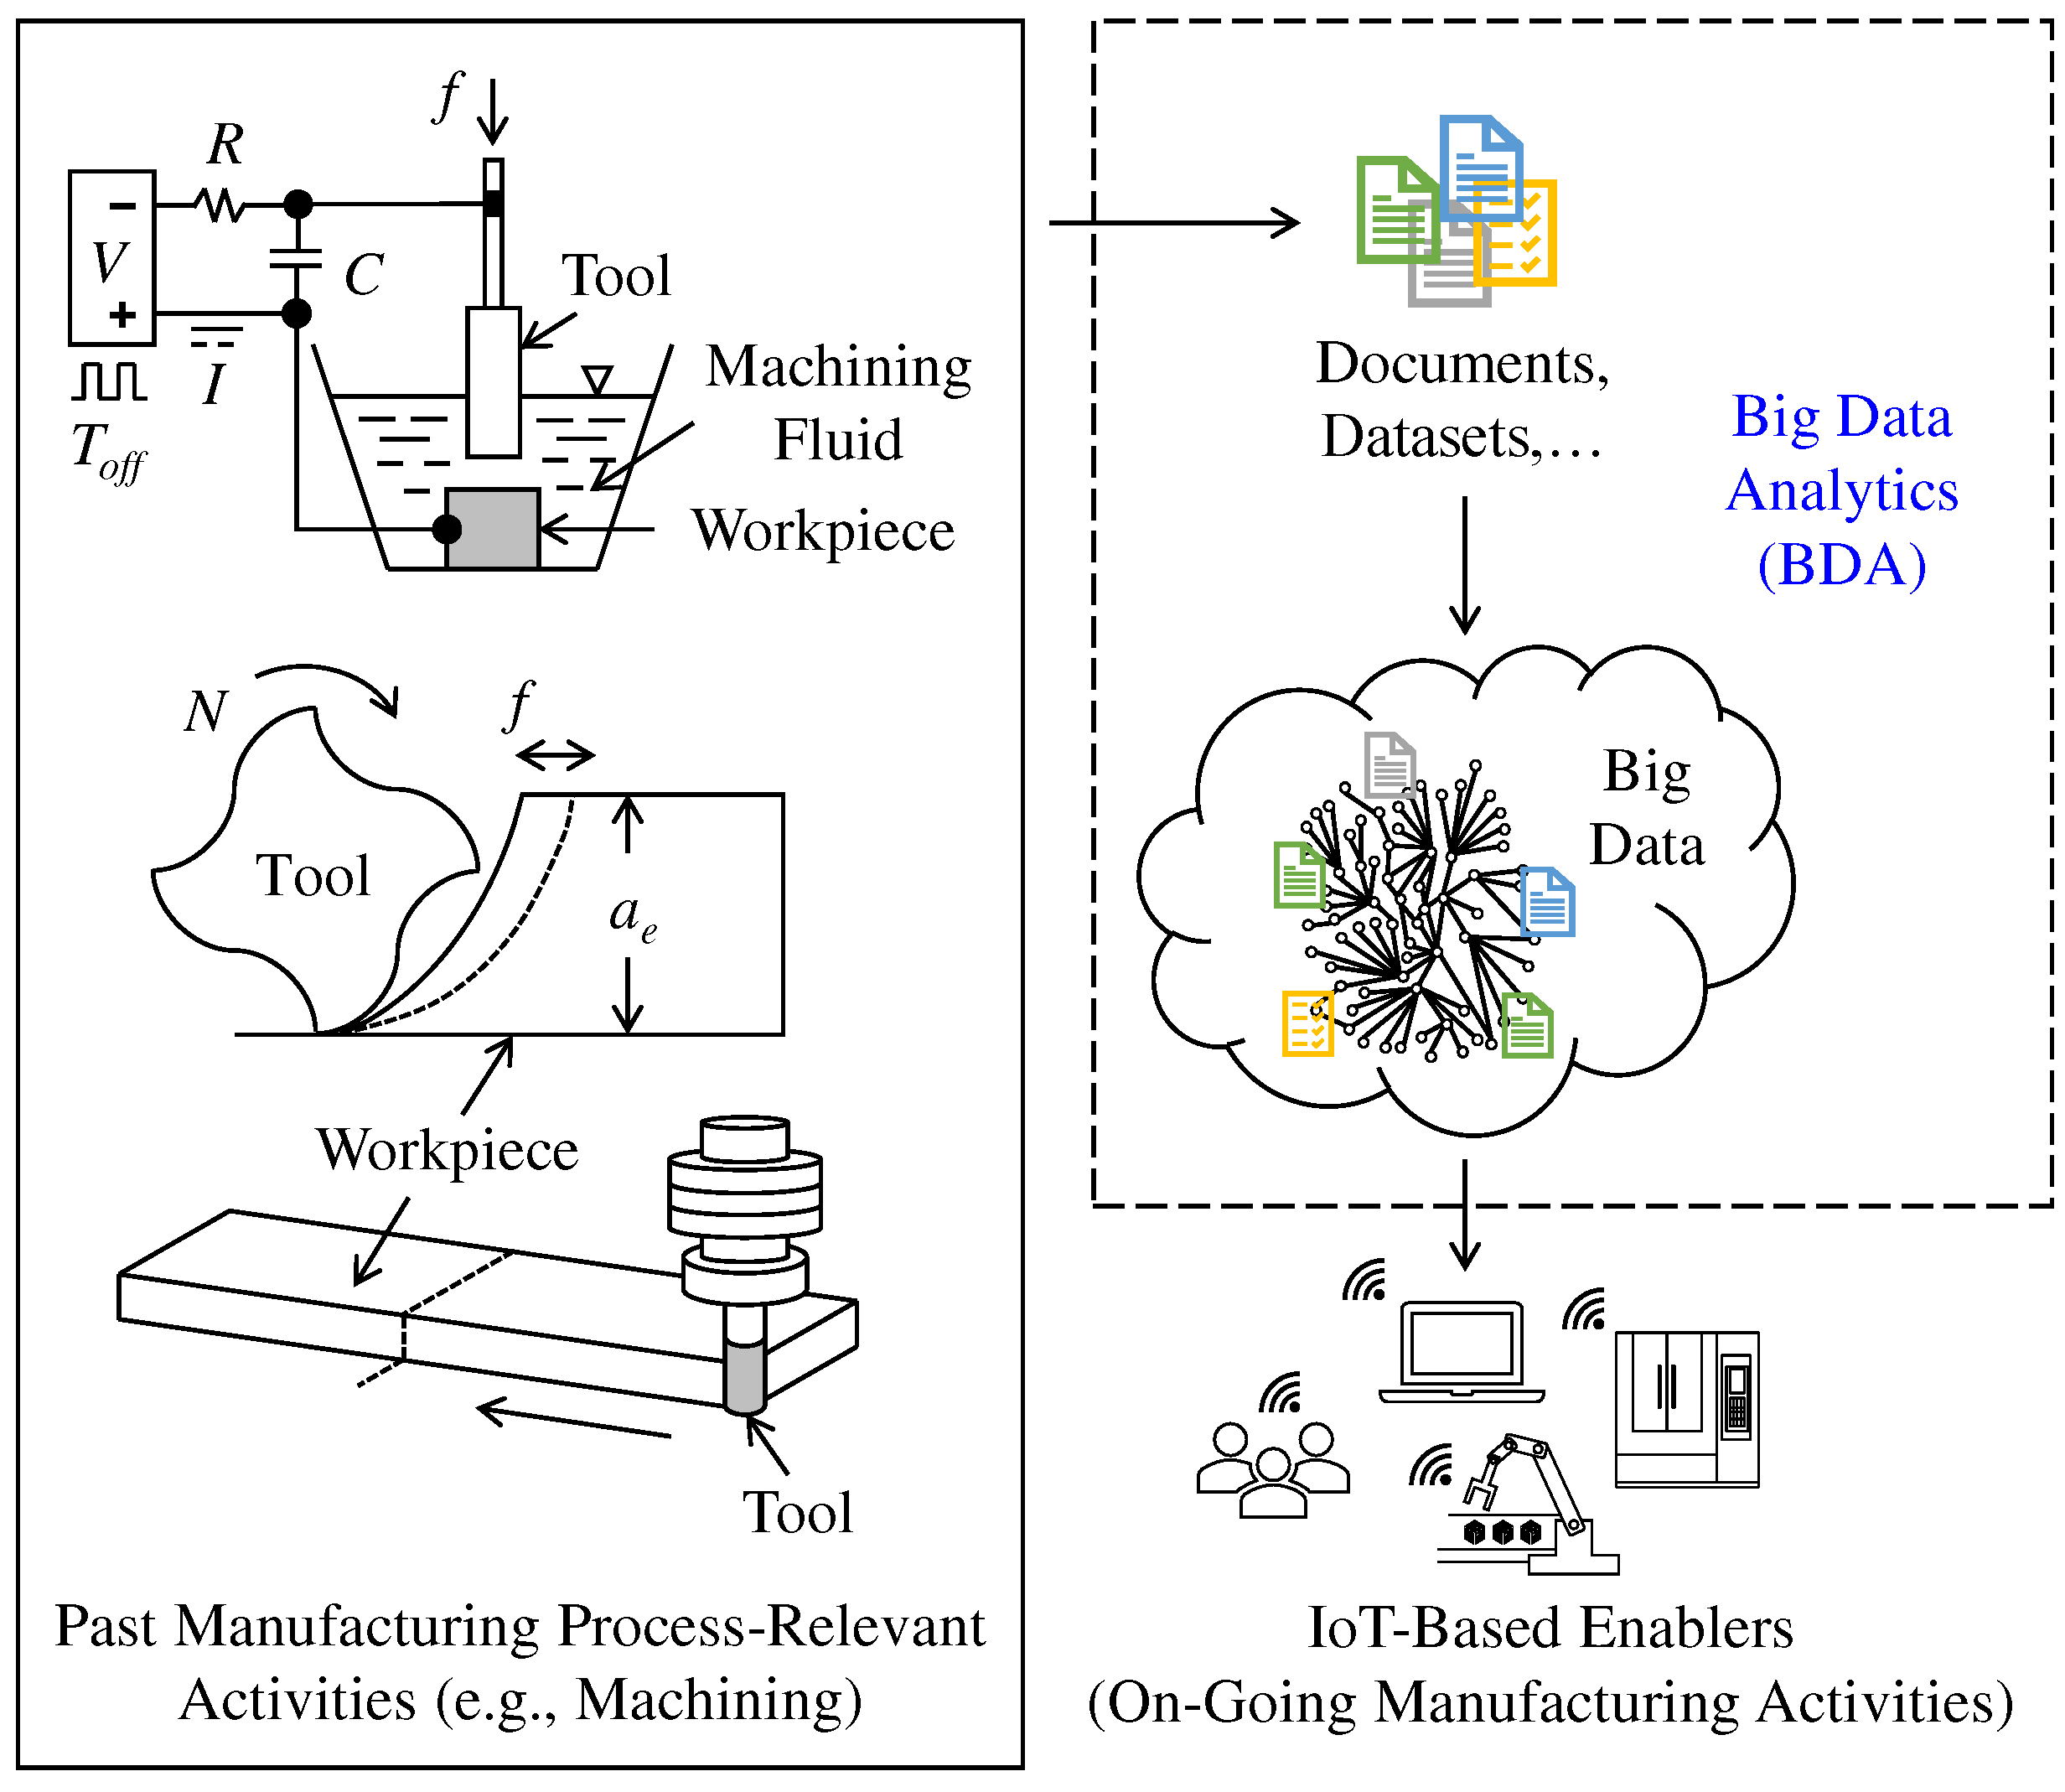
Figure 2). First, consider the smart manufacturing scenario as schematically illustrated in
Figure 1. In this scenario, digital manufacturing commons [
29,
30,
31,
32,
33] integrate the cyber and physical spaces. As seen in
Figure 1, different stakeholders (producers, designers, planners, and customers) ubiquitously participated in past manufacturing activities to produce numerous contents such as numerical datasets, digital artifacts (e.g., CAD data), metadata, executable/scripted codes, machine performance statistics, models, algorithms, and so forth. These contents are converted into widely accessible digital format, resulting in digital manufacturing commons. These commons are then stored in a repository called the digital marketplace. The remarkable thing is that the digital marketplace exhibits the Vs of BD described above and acts as BD. Thus, BDA must be installed in the digital marketplace. As such, it (BDA) can operate on digital manufacturing commons and extract the required knowledge. The extracted knowledge helps run the IoT-embedded manufacturing enablers (robots, machine tools, processes, and different planning systems).
Consider the other scenario, as shown in
Figure 2. This scenario is similar to the previous one, but this time the aspect of the manufacturing process is focused. As schematically illustrated in
Figure 2, a manufacturing process (turning, milling, or electric discharge machining) is controlled by controlling the right set of process variables (e.g., a manufacturing process called turning can be controlled by controlling the cutting conditions (feed rate, cutting speed, depth of cut, cutting tool geometry, coolant, and so on)). Furthermore, this type of control must ensure the desired performance levels in terms of some evaluation variables (e.g., high productivity, low tool wear, low environmental impact, and alike). Thus, two types of parameters entail a manufacturing process. The first type is the parameters that can be set as preferred during a manufacturing process (e.g., cutting conditions in turning). These parameters are denoted as control variables (
CVs). The other type of parameters is denoted as evaluation variables (
EVs). Thus,
CV-
EV-centric past experimental and analytical results must be transformed into digital manufacturing commons.
Now, the question is how to develop
CV-
EV-centric BDA. This study answers this question. The rest of this article is organized as follows.
Section 2 presents a comprehensive literature review on BDA focusing on smart manufacturing.
Section 3 presents the proposed framework of
CV-
EV BDA. This section also elucidates the main modules of the BDA and their functional requirements.
Section 4 presents a prototyping BDA developed using JAVA™ platform.
Section 5 presents a case study showing the efficacy of the BDA in making decision in a manufacturing process called electrical discharge machining. Finally,
Section 6 concludes this article.
2. Literature Review
The following section provides a literature review elucidating the facets of BD and BDA studied by others from the smart manufacturing viewpoint.
Bi et al. [
34] proposed an enterprise architecture that combines IoT, BDA, and digital manufacturing to improve a company's ability to respond to challenges. However, they did not provide a detailed outline of the suggested BDA structure.
Wang et al. [
35] found that manufacturing cyber-physical systems generate big data from various sources (RFID, sensor, AGV, and alike). They recommend using a BDA approach to analyze the data (data collection, storage, cleaning, integration, analysis, mining, and visualization) but did not provide details on the modules involved.
Kahveci et al. [
36] introduced a comprehensive IoT-based BDA platform with five interconnected layers: control and sensing, data collection, integration, storage/analysis, and presentation. In addition, the authors emphasize data retention policies and down-sampling methods to optimize BDA.
Fattahi et al. [
37] developed a BDA capable of computing graphs instead of numerical data that helped make the right decisions ensuring Sustainable Development Goal 12 (responsible consumption and production).
Chen and Wang [
38] developed a BDA that forecasts cycle time range using data from multiple sources (experts and collaborators). It uses a fuzzy-based deep learning framework to provide predictions learned from relevant datasets. Experts build the computational arrangements, while collaborators interpret the results of the analytics.
Woo et al. [
39] developed a BDA platform based on holonic manufacturing systems focusing on object virtualization, data control, and model control. The proposed BDA consists of eight modules: process data attribute identification, data acquisition, data pre-processing, context synchronization, training dataset preparation, component model computation, model validation, uncertainty quantification, and model composition and use. The analytics can use the Bayesian network, artificial neural network, or statistical analysis, whatever is appropriate.
Bonnard et al. [
40] presented a cloud computing-oriented BDA architecture based on three steps (data collection, data storing, and data processing). The BDA gathers data from various levels using technologies such as IoT and ERP, storing it in a distributed database called Cassandra. Finally, machine learning algorithms analyze data, reveal hidden patterns, and predict consequences.
Kozjec et al. [
41] introduced a conceptual BDA framework consisting of three levels (implementational level, reference model, and knowledge and skills). The implementation level consists of data and systems (CAD models, CNC programs, quality-control results, test measurements, and alike), hardware and software tools for data management and analysis (NoSQL databases, Scikit-learn, Python, R, Java, and alike), knowledge management, project team, and reference data-analytics solutions.
Jun et al. [
42] created a cloud-based BDA framework for manufacturing. It uses a user-defined algorithm template in XML to analyze data related to issues like failure symptoms, RUL prediction, and anomaly detection. The framework selects the appropriate algorithm and visualization technique, such as similarity-based prognostics and time series analysis.
Dubey et al. [
43] found that entrepreneurial orientation (EO) traits - proactiveness, risk-taking, and innovativeness - are helpful for decision-making with artificial intelligence-based big data analytics (BDA-AI). Their study used PLS-SEM to integrate entrepreneurship, operations management, and information systems management. As a result, EO can enhance operational performance (OP) in dynamic environments with BDA-AI.
Zhang et al. [
44] developed an energy-efficient cyber-physical system to analyze big data and detect production issues in manufacturing workshops. It has three layers: physical energy, cyber energy, and knowledge-driven management. The physical-energy layer includes tools equipped with data acquisition devices. The cyber-energy layer processes data using data cleansing and correlation analysis techniques. Finally, the knowledge-driven management layer uses machine learning algorithms to extract knowledge and make decisions.
Zhong et al. [
45] found that incorporating advanced technologies such as DNA-based encryption and self-learning models through deep machine learning can enhance big data analytics in industries like healthcare, finance, economics, supply chain management, and manufacturing. Other technologies include synchronized networks, parallel processing, automatic parallelization, CPL, and cloud computation.
Zhong et al. [
46] developed a Big Data Analytics framework using RFID technology in a physical internet-based shop floor setting. The shop floor uses IoT-based tools to turn logistic resources into smart manufacturing objects. A framework has been created to handle the overwhelming amount of data generated by SMOs. It follows five steps: defining data structure, presenting and interpreting data, storing and managing data, processing data with methods like cleansing and classification, and using resulting information for decision-making and predicting.
Zhang et al. [
47] proposed the architecture of BDA for product lifecycle (BDA-PL) consisting of four layers: application services of product lifecycle management (PLM), BD acquisition and integration, BD processing and storage, and BD mining and knowledge discovery in database (KDD). It uses RFID and sensors to collect data from multiple sources and process and store using frameworks like Hadoop and SQL. Finally, it analyzes the data using various models to gain knowledge and have a feedback mechanism for sharing.
Lu and Xu [
48] introduced a cloud-based manufacturing equipment architecture powered by BDA. It includes sensors, a control module, a monitoring module, and a data processing module. The components interact with a digital twin stored in the cloud, generating data stored in a repository and analyzed through analytics tools. This enables on-demand manufacturing services.
Ji and Wang [
49] proposed a framework that uses big data analytics to predict faults. It collects real-time and historical data from the shop floor and performs data cleansing. The framework then uses an analysis algorithm to interpret the data.
Liang et al. [
50] found that Big Data (BD) is essential for energy-efficient machining optimization. They developed a system that collects energy consumption data from the shop floor using a wireless system, handles it with a system called Hadoop Hive, and processes it using machine learning algorithms.
Ji et al. [
51] presented a machining optimization technique using BDA for distributed process planning. The method uses data attributes to represent machining resources and a hybrid algorithm of Deep Belief Network and Genetic Algorithm for optimization. However, the data analytics structure is not fully explained.
Chen et al. [
52] used Hadoop Distributed File System (HDFS) and Spark to extract key characteristics from electric discharge machining (EDM) data. They should have explained how they can be used to predict machining quality. This is an area for potential future research.
To ensure a digital twin function well, Fattahi et al. [
53] suggest having a human-cyber-physical system-friendly big data that is easily accessible and understandable for both humans and machines. They also propose a method for preparing the BD dataset, divided into four segments for easy integration with the digital twin's input, modeling, simulation, and validation modules.
Li et al. [
54] reviewed industrial Big Data (BD) usage in intelligent manufacturing and found that current Big Data Analytics (BDA) processes face high costs, complex arrangements, and a need for universal frameworks and data-sharing techniques between organizations. The authors presented a conceptual framework for intelligent decision-making based on BD, which includes cyber-physical systems (CPS), digital twins, and BDA. However, further research is needed to determine the feasibility of this framework.
To summarize, no comprehensive guide is available that outlines all the necessary principles, methods, and tools for efficiently constructing and managing BDA for manufacturing decision-making. In order to fill this gap, the following sections present a detailed architecture that can serve as a reference model of BDA for any manufacturing process. In addition, the necessary system components to implement this architecture in real-life scenarios are also developed.
3. Framework of the Proposed BDA
This section presents the proposed big data analytics (BDA). It can be used to making the right manufacturing decisions, and, thereby, to optimize a manufacturing process. In particular, this section first articulates its (BDA) context, basic functionalities, and computational challenges. Afterward, this section presents its (BDA) framework and system architecture.
As mentioned in
Section 1, a manufacturing process entails Control Variables (
CVs) and Evaluation Variables (
EVs). Here, the
CVs are some pre-defined variables (e.g., feed rate, depth of cut, cutting speed, and alike) for ensuring the desired performance of the process in terms of some other variables called
EVs (e.g., low tool wear, high material removal rate, and alike). The knowledge extracted from
CV-
EV-centric datasets often drives the relevant process optimization tasks [
12]. For example, say a manufacturing process entails a set of
CVs denoted as
CVi |
i = 1,2,… and a set of
EVs denoted as
EVj |
j = 1,2,…. The datasets associated with
CVi and
EVj unfold that “if
CV3 increases, then
EV1 also increases”, meaning that
CV3 is more influential than the other
CVs as long as
EV1 is concerned. Based on this, one can ensure the desired performance of
EV1 (e.g., maximization, minimization, and alike) by controlling only the
CV3 whenever needed. Therefore, a systematic arrangement (e.g., data analytics) is needed to unfold the knowledge underlying the
CV-
EV-centric documents and datasets. As far as smart manufacturing is concerned,
CV-
EV-centric past experimental and analytical documents from different sources populate the digital manufacturing commons and generate process-relevant big data, as described in
Section 1 (can also be seen in
Figure 2). For this, big data analytics (BDA) are a must to extract knowledge from these commons and functionalize optimization of the relevant manufacturing processes. However, in the literature (described in
Section 2), no unified framework is found elucidating the systems architecture for developing such BDA. The presented BDA architectures mostly adapt AI-based machine learning/deep learning algorithms (e.g., CANN, GA, DBNN, and alike) and result in black-box systems [
27], [
55], [
56]. Here, black-box systems refer to non-transparent systems where the input and output of the algorithms are known, but internal analysis procedures remain unknown because AI only aims at ultimate goals by its philosophy rather than answering inherent processes [
57]. This lack of transparency makes it near impossible to assess the rationality of the algorithm or the BDA system. As a result, such black-box-type BDA frameworks become human-incomprehensible for relevant decision-making [
27], [
58,
59,
60]. One way to solve the above-mentioned issues is to propose a transparent framework elucidating the underlying systems, system-relevant processes, systems integration, and human comprehensibility via human interventions with the systems. In similar context, Ullah and Harib [
61] emphasized that a futuristic computer integrated manufacturing system must engage human intelligence (judgment and preference) as straightforwardly as possible for dealing with real-life manufacturing problems. The authors also introduced a human-assisted knowledge extraction system for machining operations. The system utilizes probabilistic reasoning and fuzzy logical reasoning to benefit from the machining data and from the judgment and preference of a user. This contemplation remains valid for BDA as well. Based on this, this study proposes a transparent and human-friendly BDA framework for manufacturing process optimization, as follows.
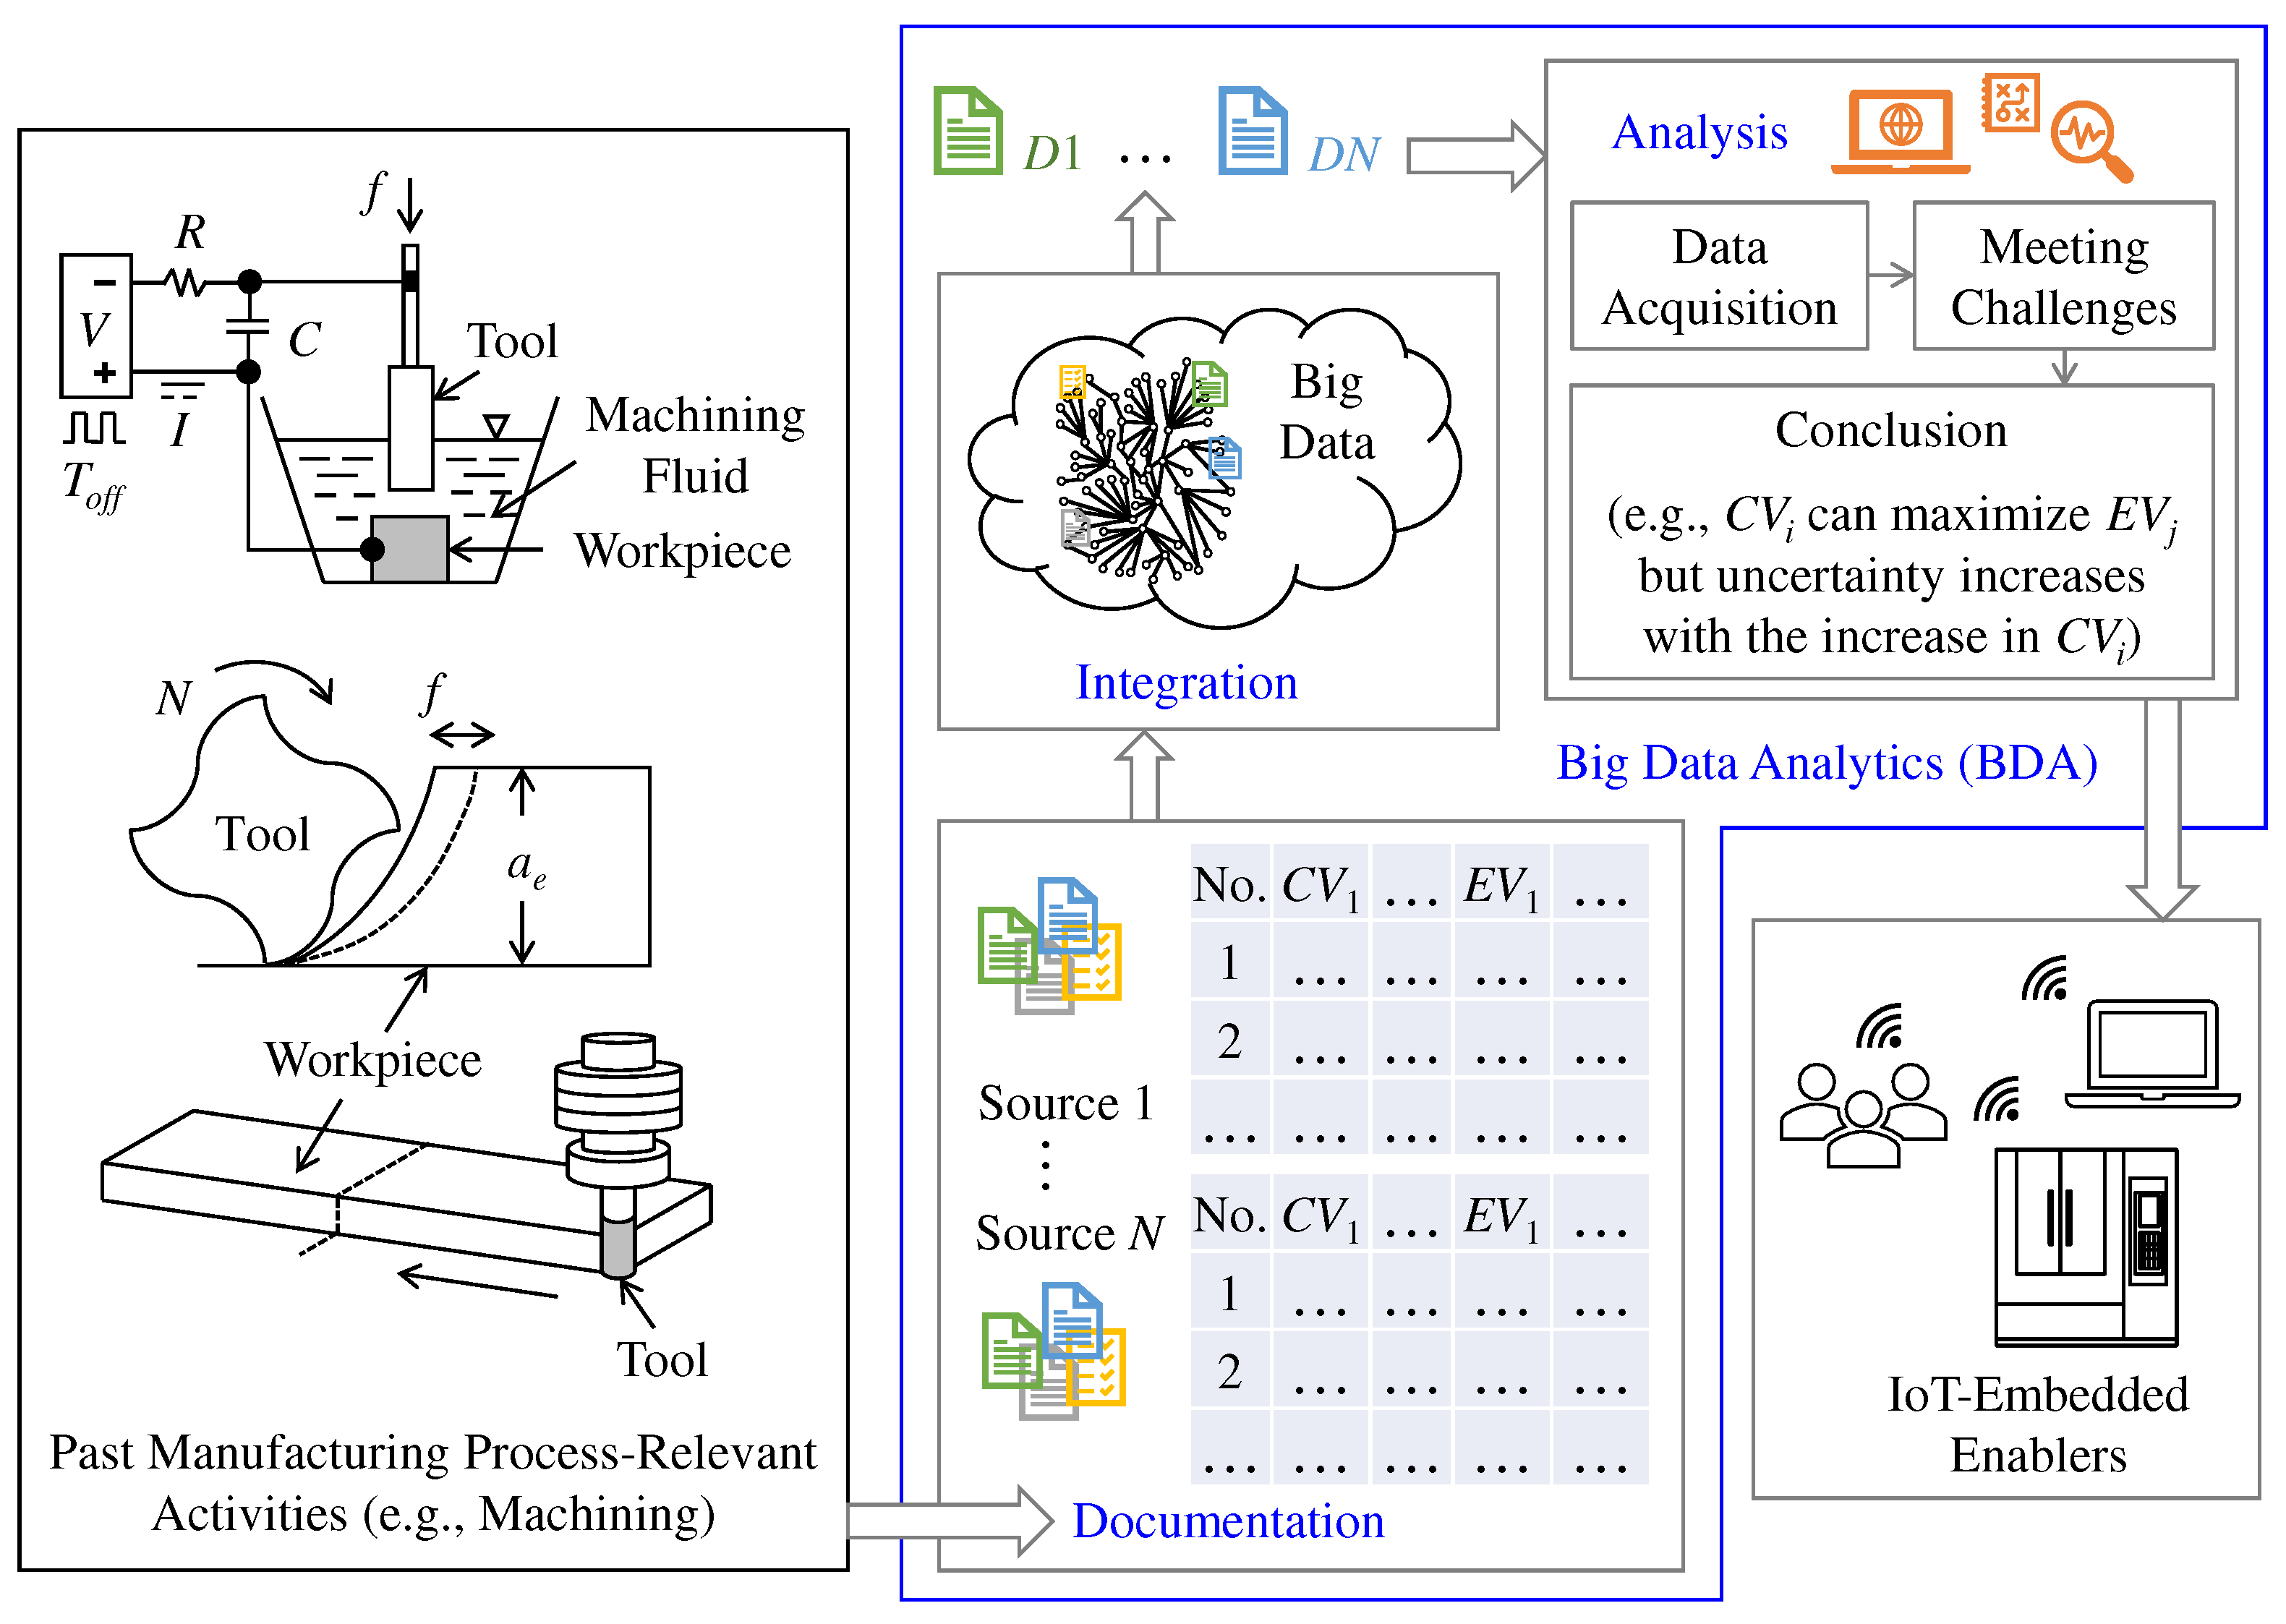
Figure 4 shows the basic functionalities of the proposed BDA. As seen in
Figure 4, the BDA entails three basic functionalities: Documentation, Integration, and Analysis. Here, documentation means documenting a manufacturing process (information related to the process, e.g., machine tool, workpiece, machining conditions, experimental results,
CV-
EV-centric datasets, and alike) based on a user-friendly and flexible ontology. It facilitates the structuring of process-relevant documents, eliminating the heterogeneous characteristic due to the involvement of different sources or manufacturing workspaces. Integration means converting the documentation into a machine/human-readable format and integrating it into the process-relevant big data. Finally, analysis means acquiring the desired
CV-
EV-centric datasets from big data, meeting computational challenges underlying the datasets, and concluding a set of rules, respectfully. IoT-embedded enablers (machine tools, processes, planning systems, robots, human resources, and alike) residing in a real-life manufacturing environment access the extracted rules and make process optimization-relevant decisions whenever needed. In this regard, one immediate question arises: what sort of computational challenges must be met by the BDA?
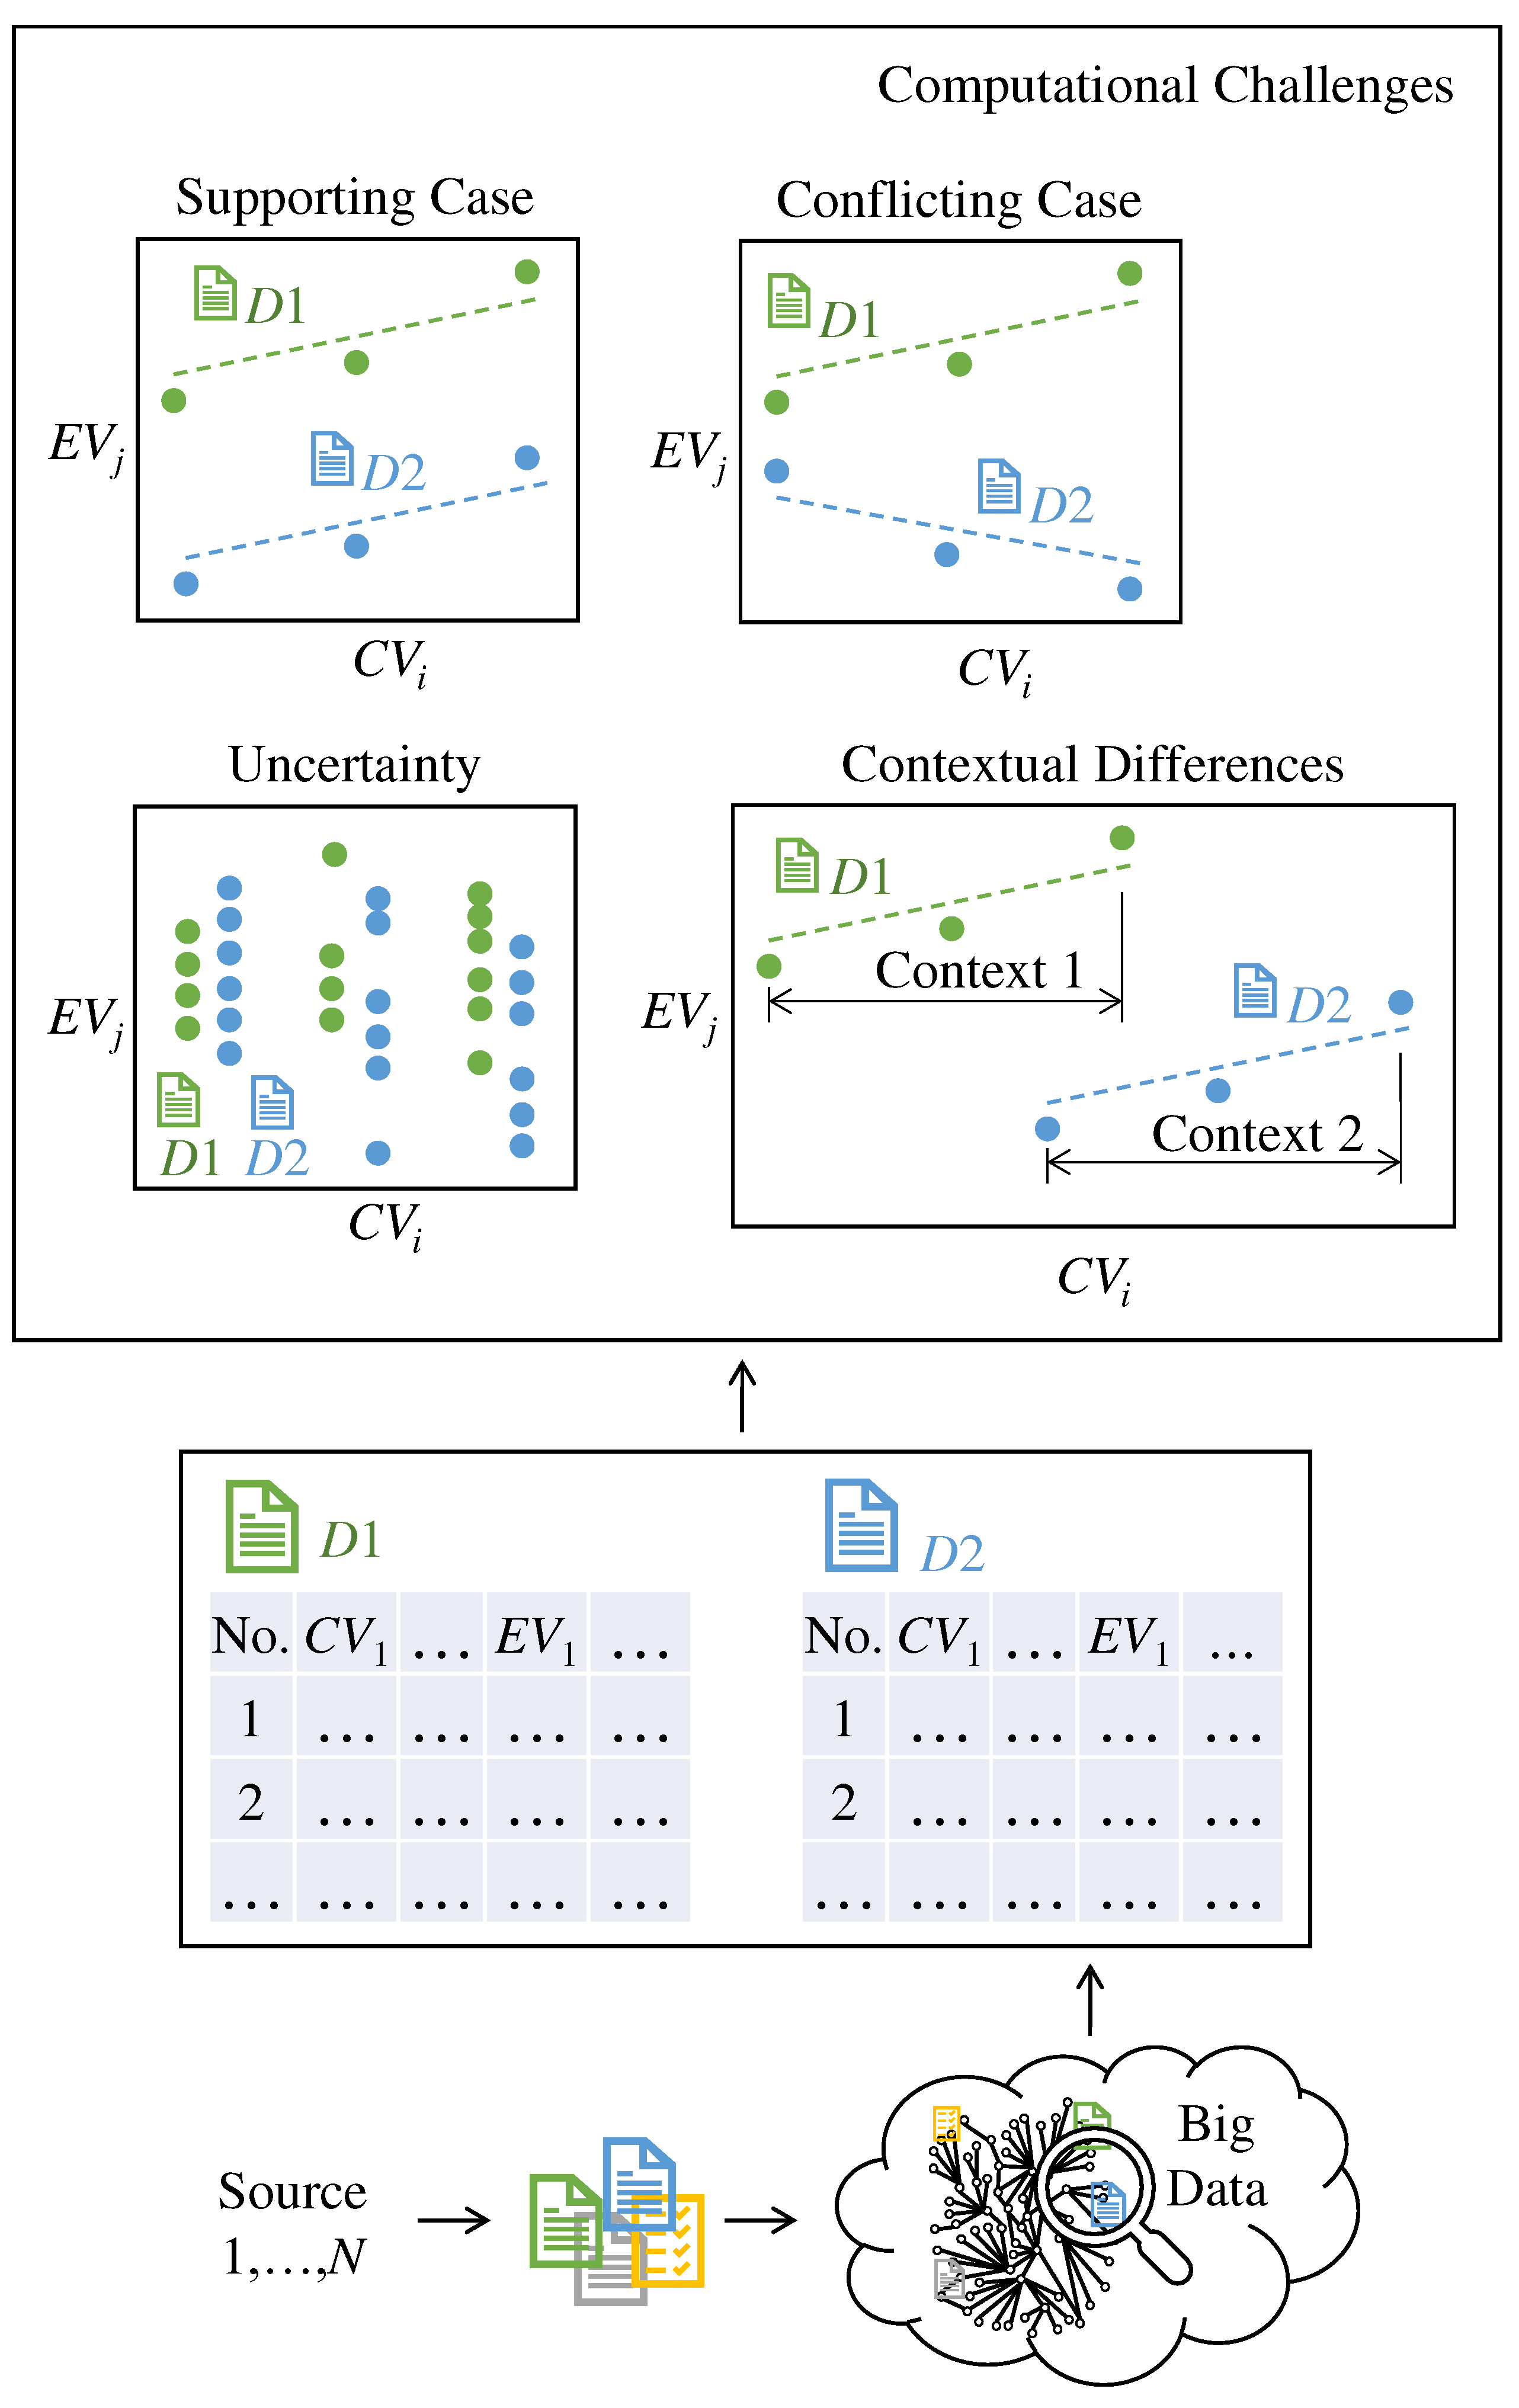
Figure 5 answers this question schematically.
Say, as seen in
Figure 5, the
CV-
EV-centric past experimental and analytical documents from different sources generate manufacturing process-relevant big data. The BDA searches the big data for a user-defined keyword (e.g., process type, workpiece material, and alike) and acquires two relevant documents, denoted as D1 and D2 in
Figure 5, that originated from two different sources. As a result, some computational challenges appear for the BDA. In particular, the D1 and D2 may provide supporting or conflicting cases related to
CV-
EV relationships. Here, the supporting case means that D1 and D2 reflect the same or similar
CV-
EV correlation. For example, as seen in
Figure 5, D1 reflects a direct
CV-
EV correlation, and D2 does the same. On the other hand, the conflicting case means that D1 and D2 reflect the opposite or dissimilar
CV-
EV correlation. For example, as seen in
Figure 5, D1 reflects a direct correlation, but D2 reflects an indirect one for the same
CV-
EV.
Apart from the above-mentioned (supporting and conflicting cases), challenges associated with uncertainty and contextual differences might appear, as shown in
Figure 5 schematically. Here, uncertainty means the variability in the acquired
CV-
EV-centric datasets. It reflects how far apart the datasets are. Its quantification helps more accurate predictions in terms of consistency. For example, less uncertainty means the
CV-
EV correlation is consistent, and the correlation might be generalized for other cases. High uncertainty means the
CV-
EV correlation is inconsistent, and the correlation might not be generalized. The remarkable thing is that even though
CV-
EV datasets exhibit a strong direct/indirect correlation, the associated uncertainty can reflect that the correlation is not good enough to be generalized, given that the uncertainty is high. Therefore, identifying only the
CV-
EV correlation is not adequate for effective decision-making. Uncertainty quantification is also needed to get complete knowledge underlying the datasets and make the right decisions. On the other hand, contextual differences appear when
CV-
EV-centric datasets entail different discourses without following a standard one because of the heterogeneity of sources associated with the different
CV levels and experimental design of the manufacturing process. As such, the BDA must meet the above-mentioned challenges for concluding a set of rules among
CV-
EV-centric datasets from big data. Based on the consideration described above, the following questions arise:
How should the documentation process for manufacturing be carried out? (Q1)
What should be the process for integrating the prepared documents with process-relevant big data? (Q2)
What is the proper procedure for utilizing the relevant dataset (specifically, CV-EV-related datasets) found in the shared documents? (Q3)
What should be the method for meeting the computational challenges? (Q4)
What is the recommended method for extracting rules and drawing conclusions? (Q5)
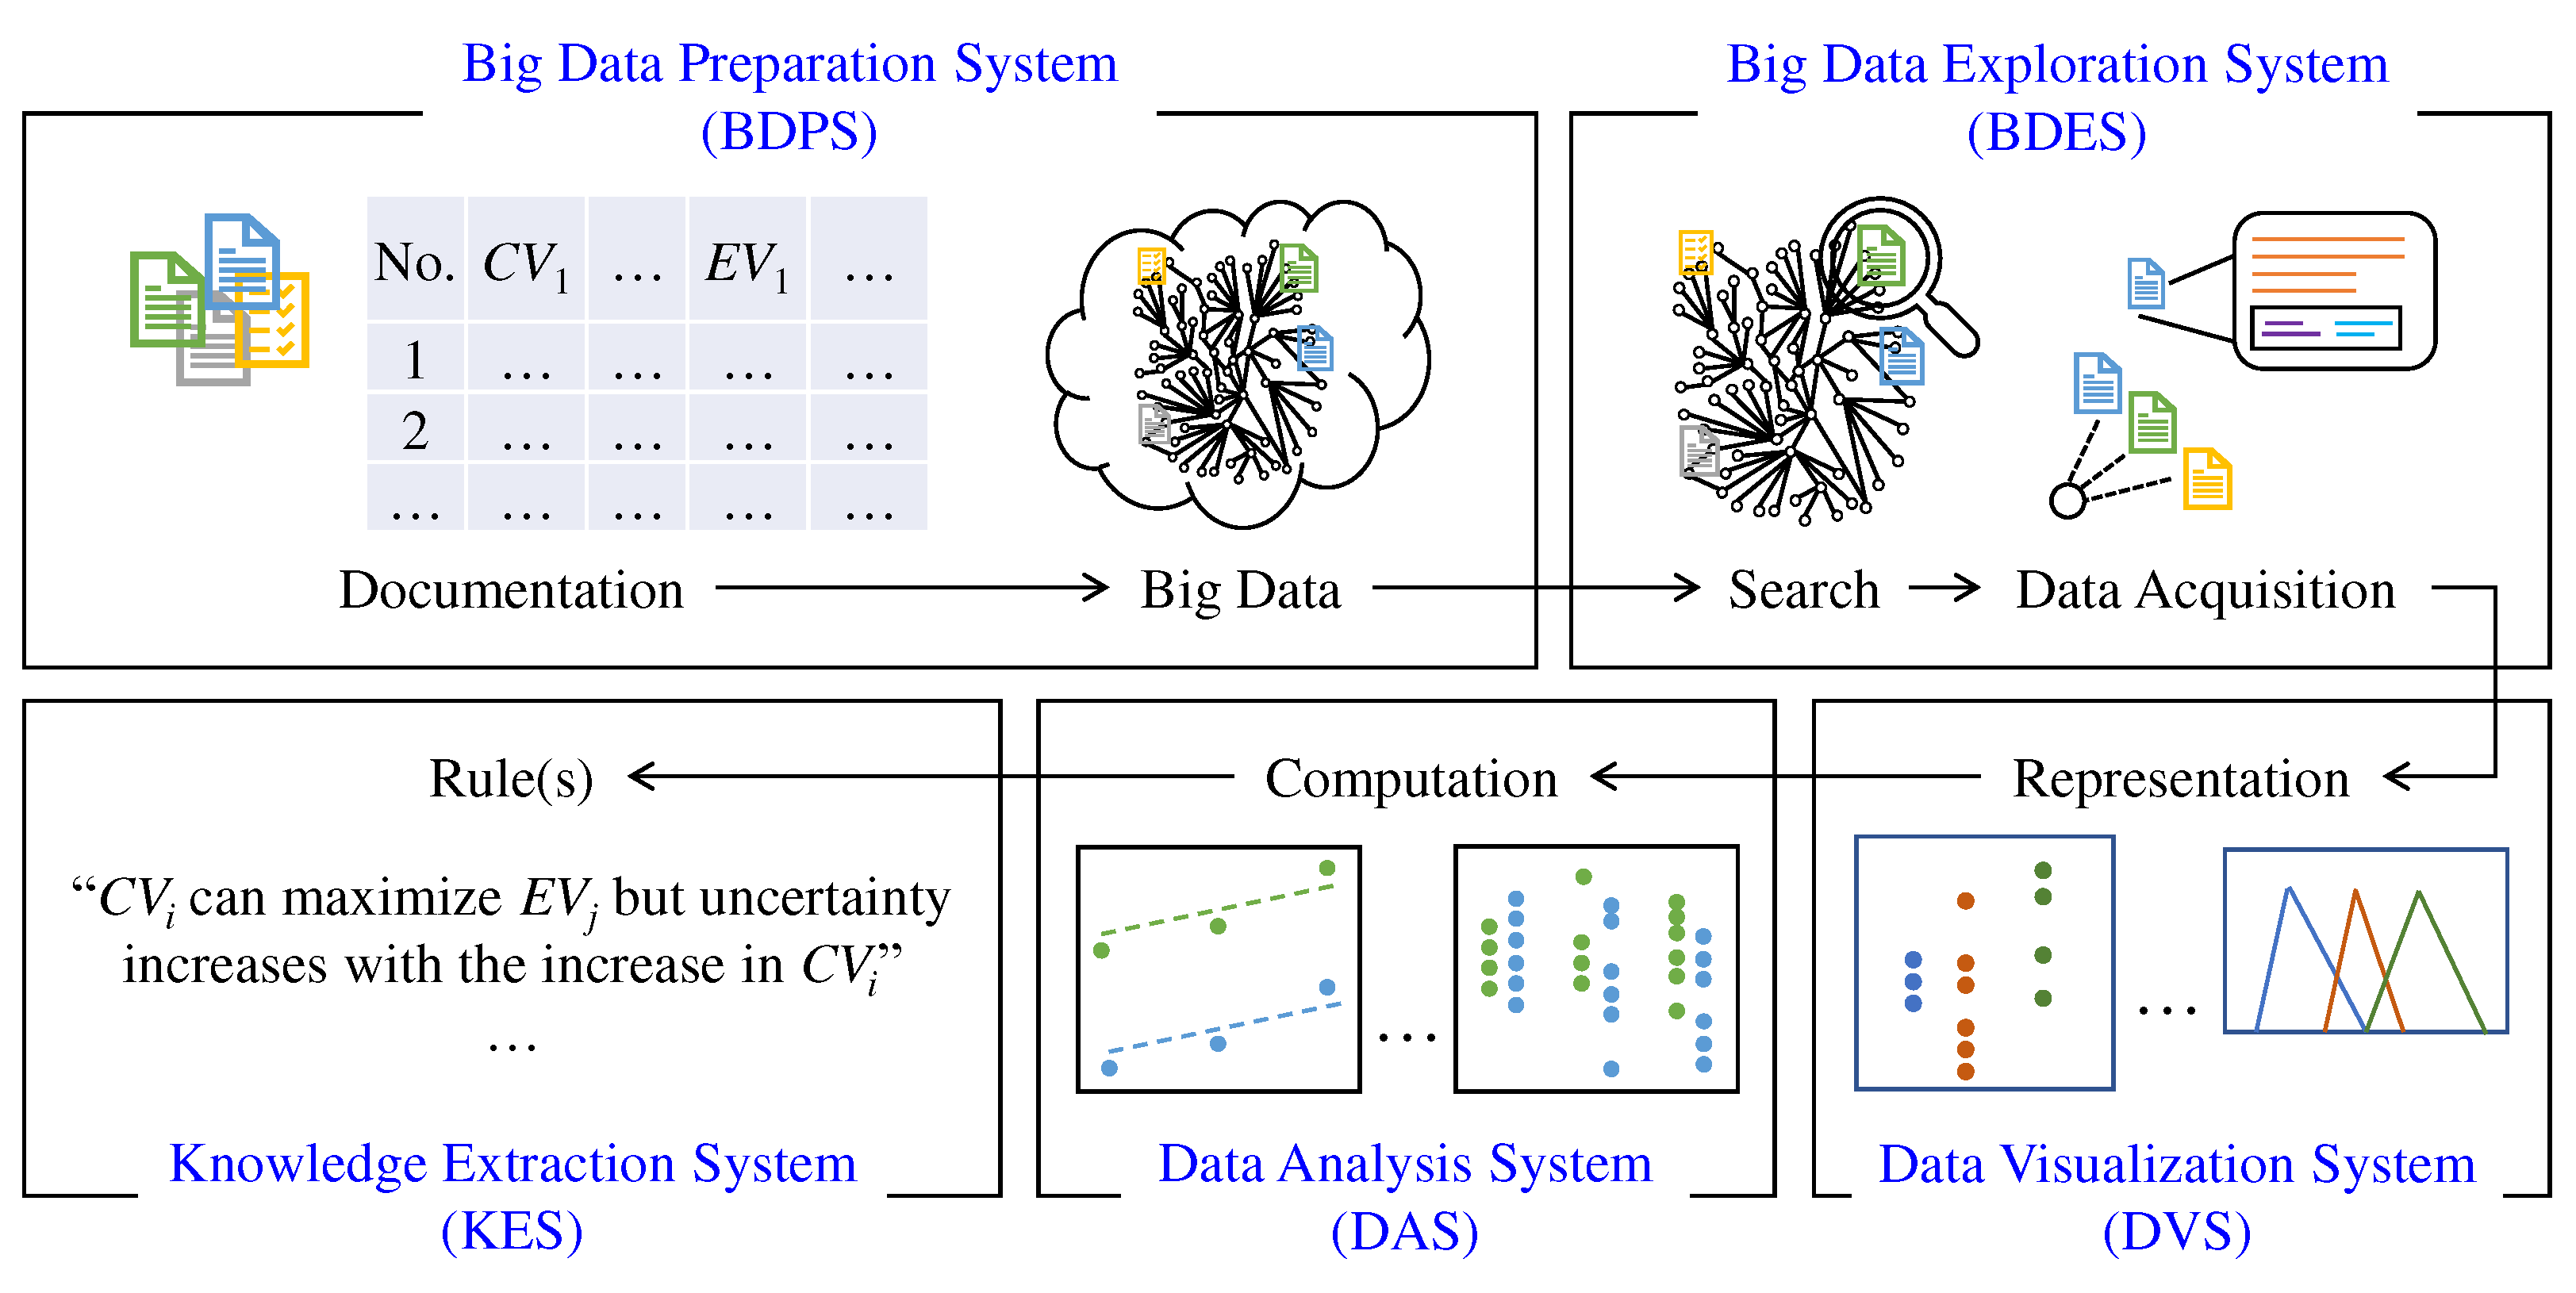
The answers to the above-mentioned questions lead to a transparent BDA framework, as shown in
Figure 6 schematically. As seen in
Figure 6, the framework consists of five systems: (1) Big Data Preparation System (BDPS), (2) Big Data Exploration System (BDES), (3) Data Visualization System (DVS), (4) Data Analysis System (DAS), and (5) Knowledge Extraction System (KES).
The systems collectively answer the above-mentioned questions (Q1,...,Q5) and functionalize the basic functionalities (Documentation, Integration, and Analysis) of the BDA (can also be seen in
Figure 4). In particular, BDPS answers Q1 and Q2. For this, it (BDPS) functionalizes the documentation of the process-relevant information using a flexible ontology, followed by document integration into the process-relevant big data. BDES answers Q3. For this, it (BDES) functionalizes searching for
CV-
EV-centric datasets from the big data using a user-defined keyword (e.g., process type, workpiece material, and alike) and acquiring the appropriate
CV-
EV-centric datasets from the searched outcomes. DVS and DAS collectively answer Q4. For this, DVS functionalizes the representation of the acquired
CV-
EV-centric datasets graphically. DAS functionalizes intelligent computations on the
CV-
EV-centric datasets for meeting the computational challenges. Finally, KES answers Q5. For this, it (KES) functionalizes rule extraction based on the outcomes of DAS.
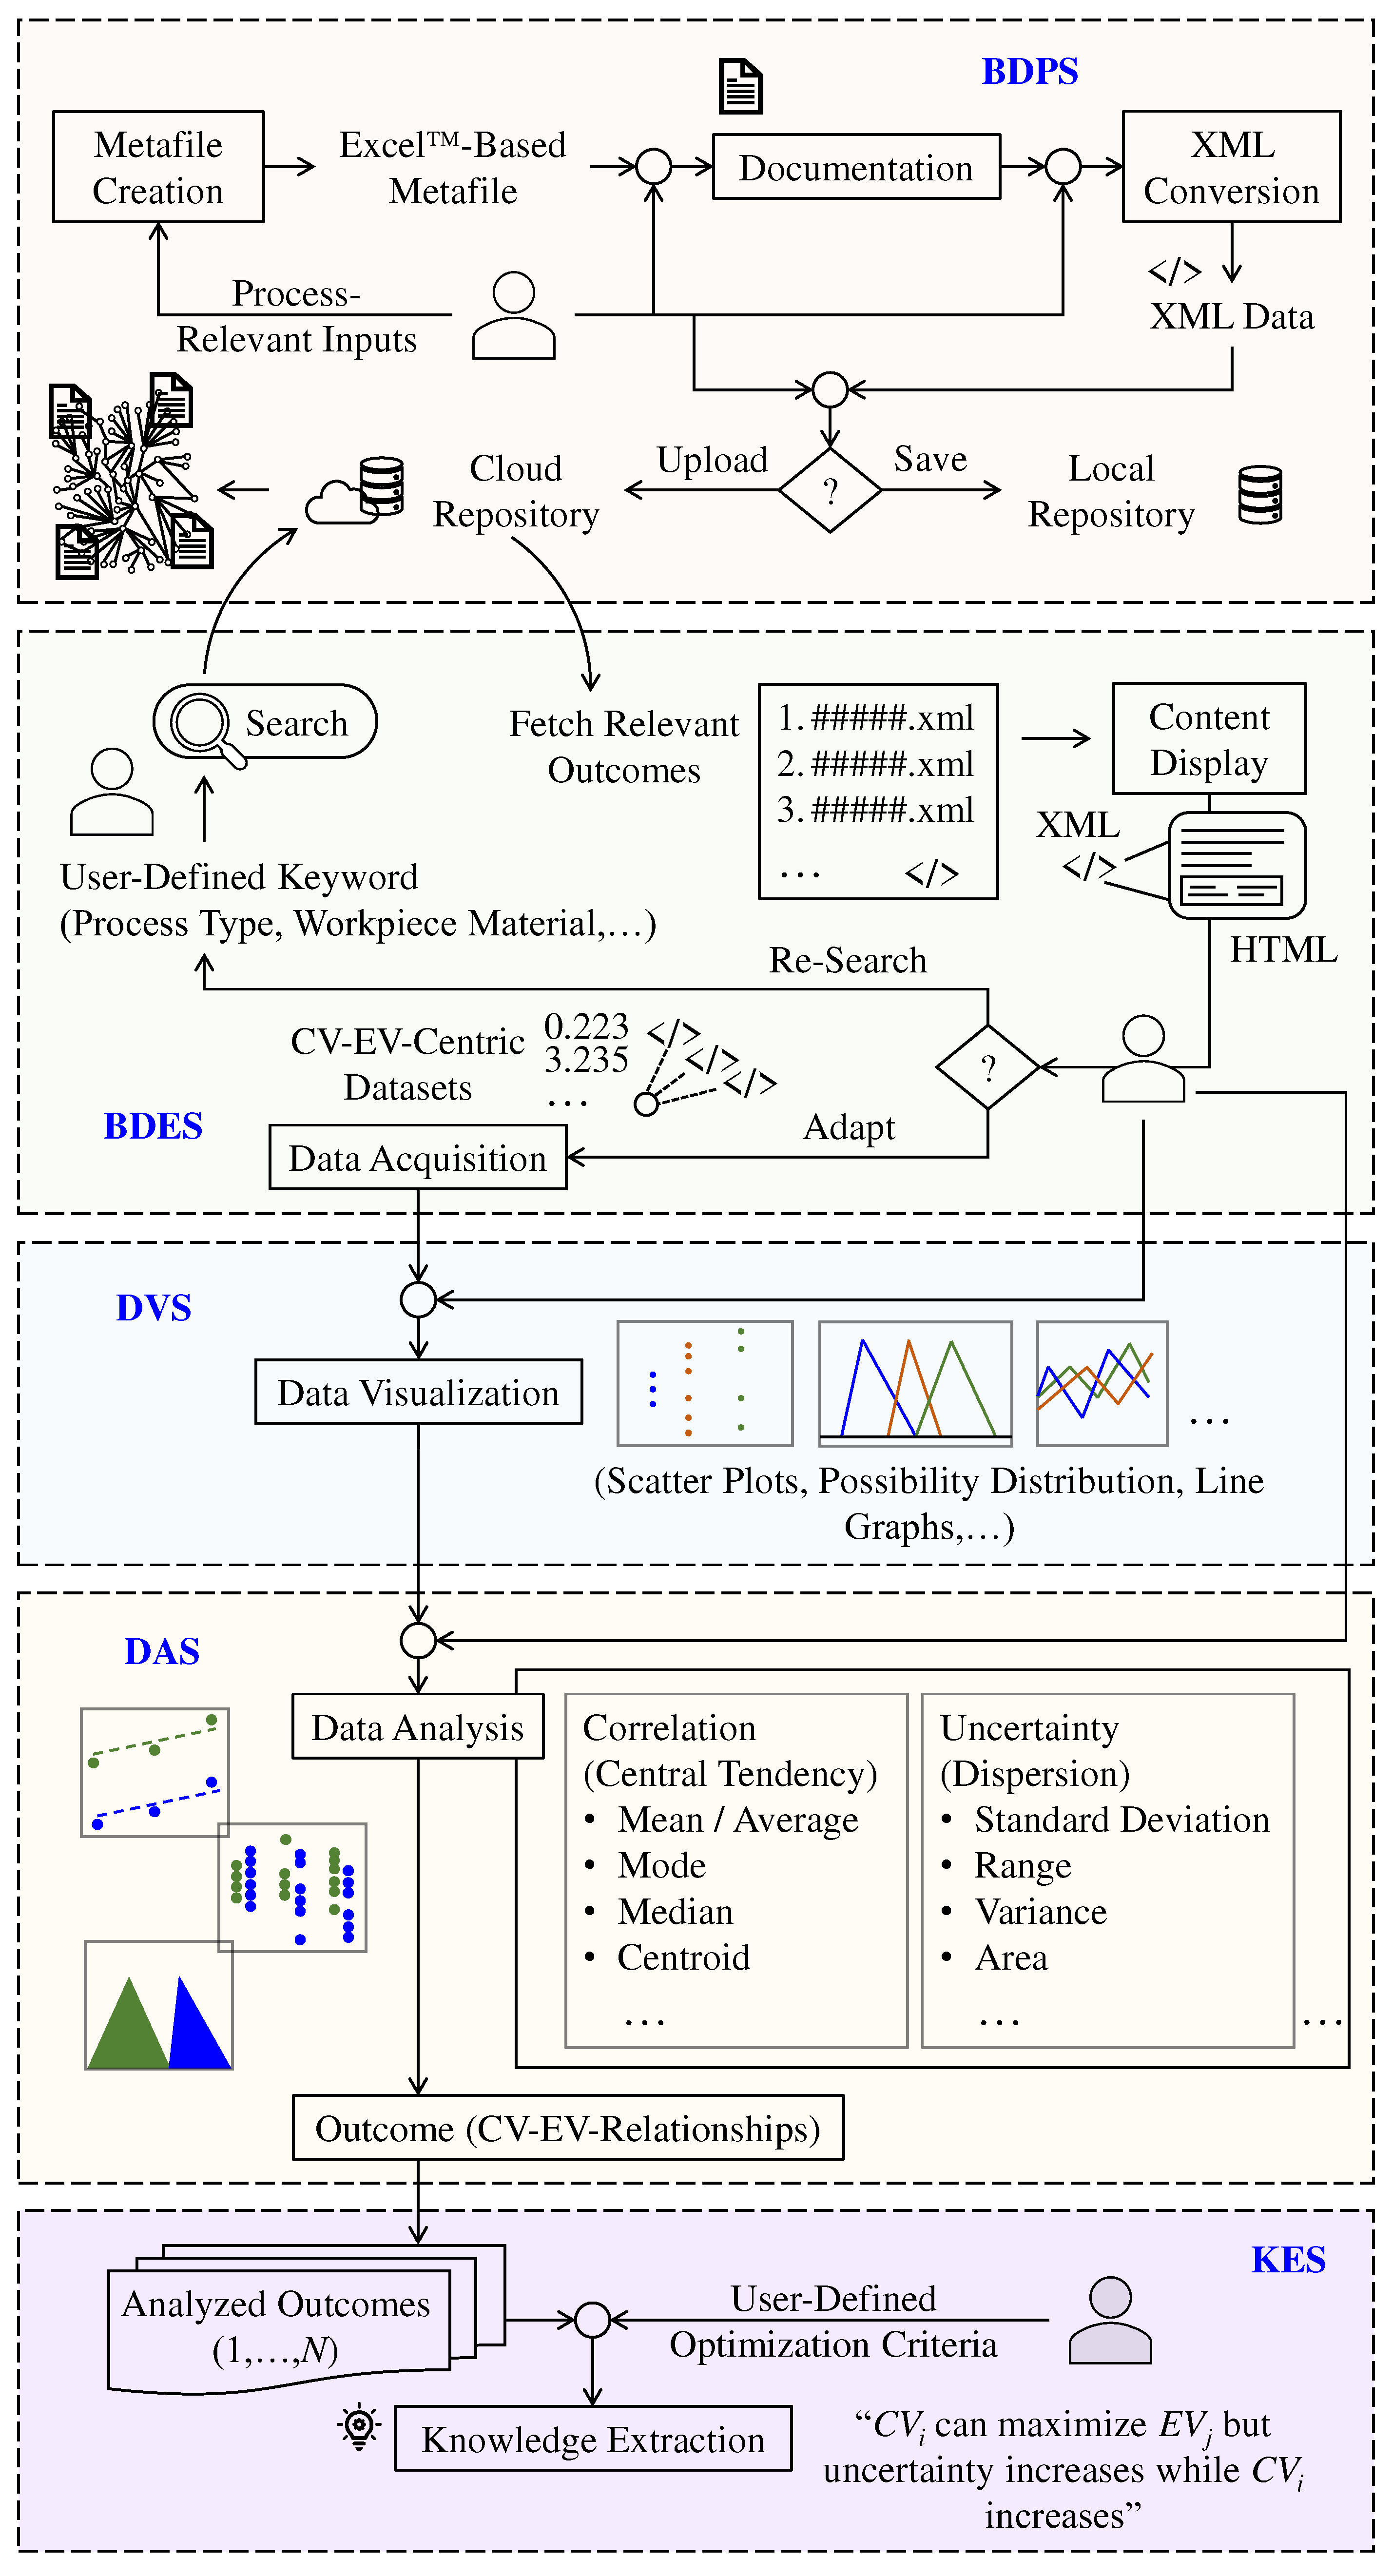
Figure 7 schematically shows the relationships among the above-mentioned systems and their activities. As seen in
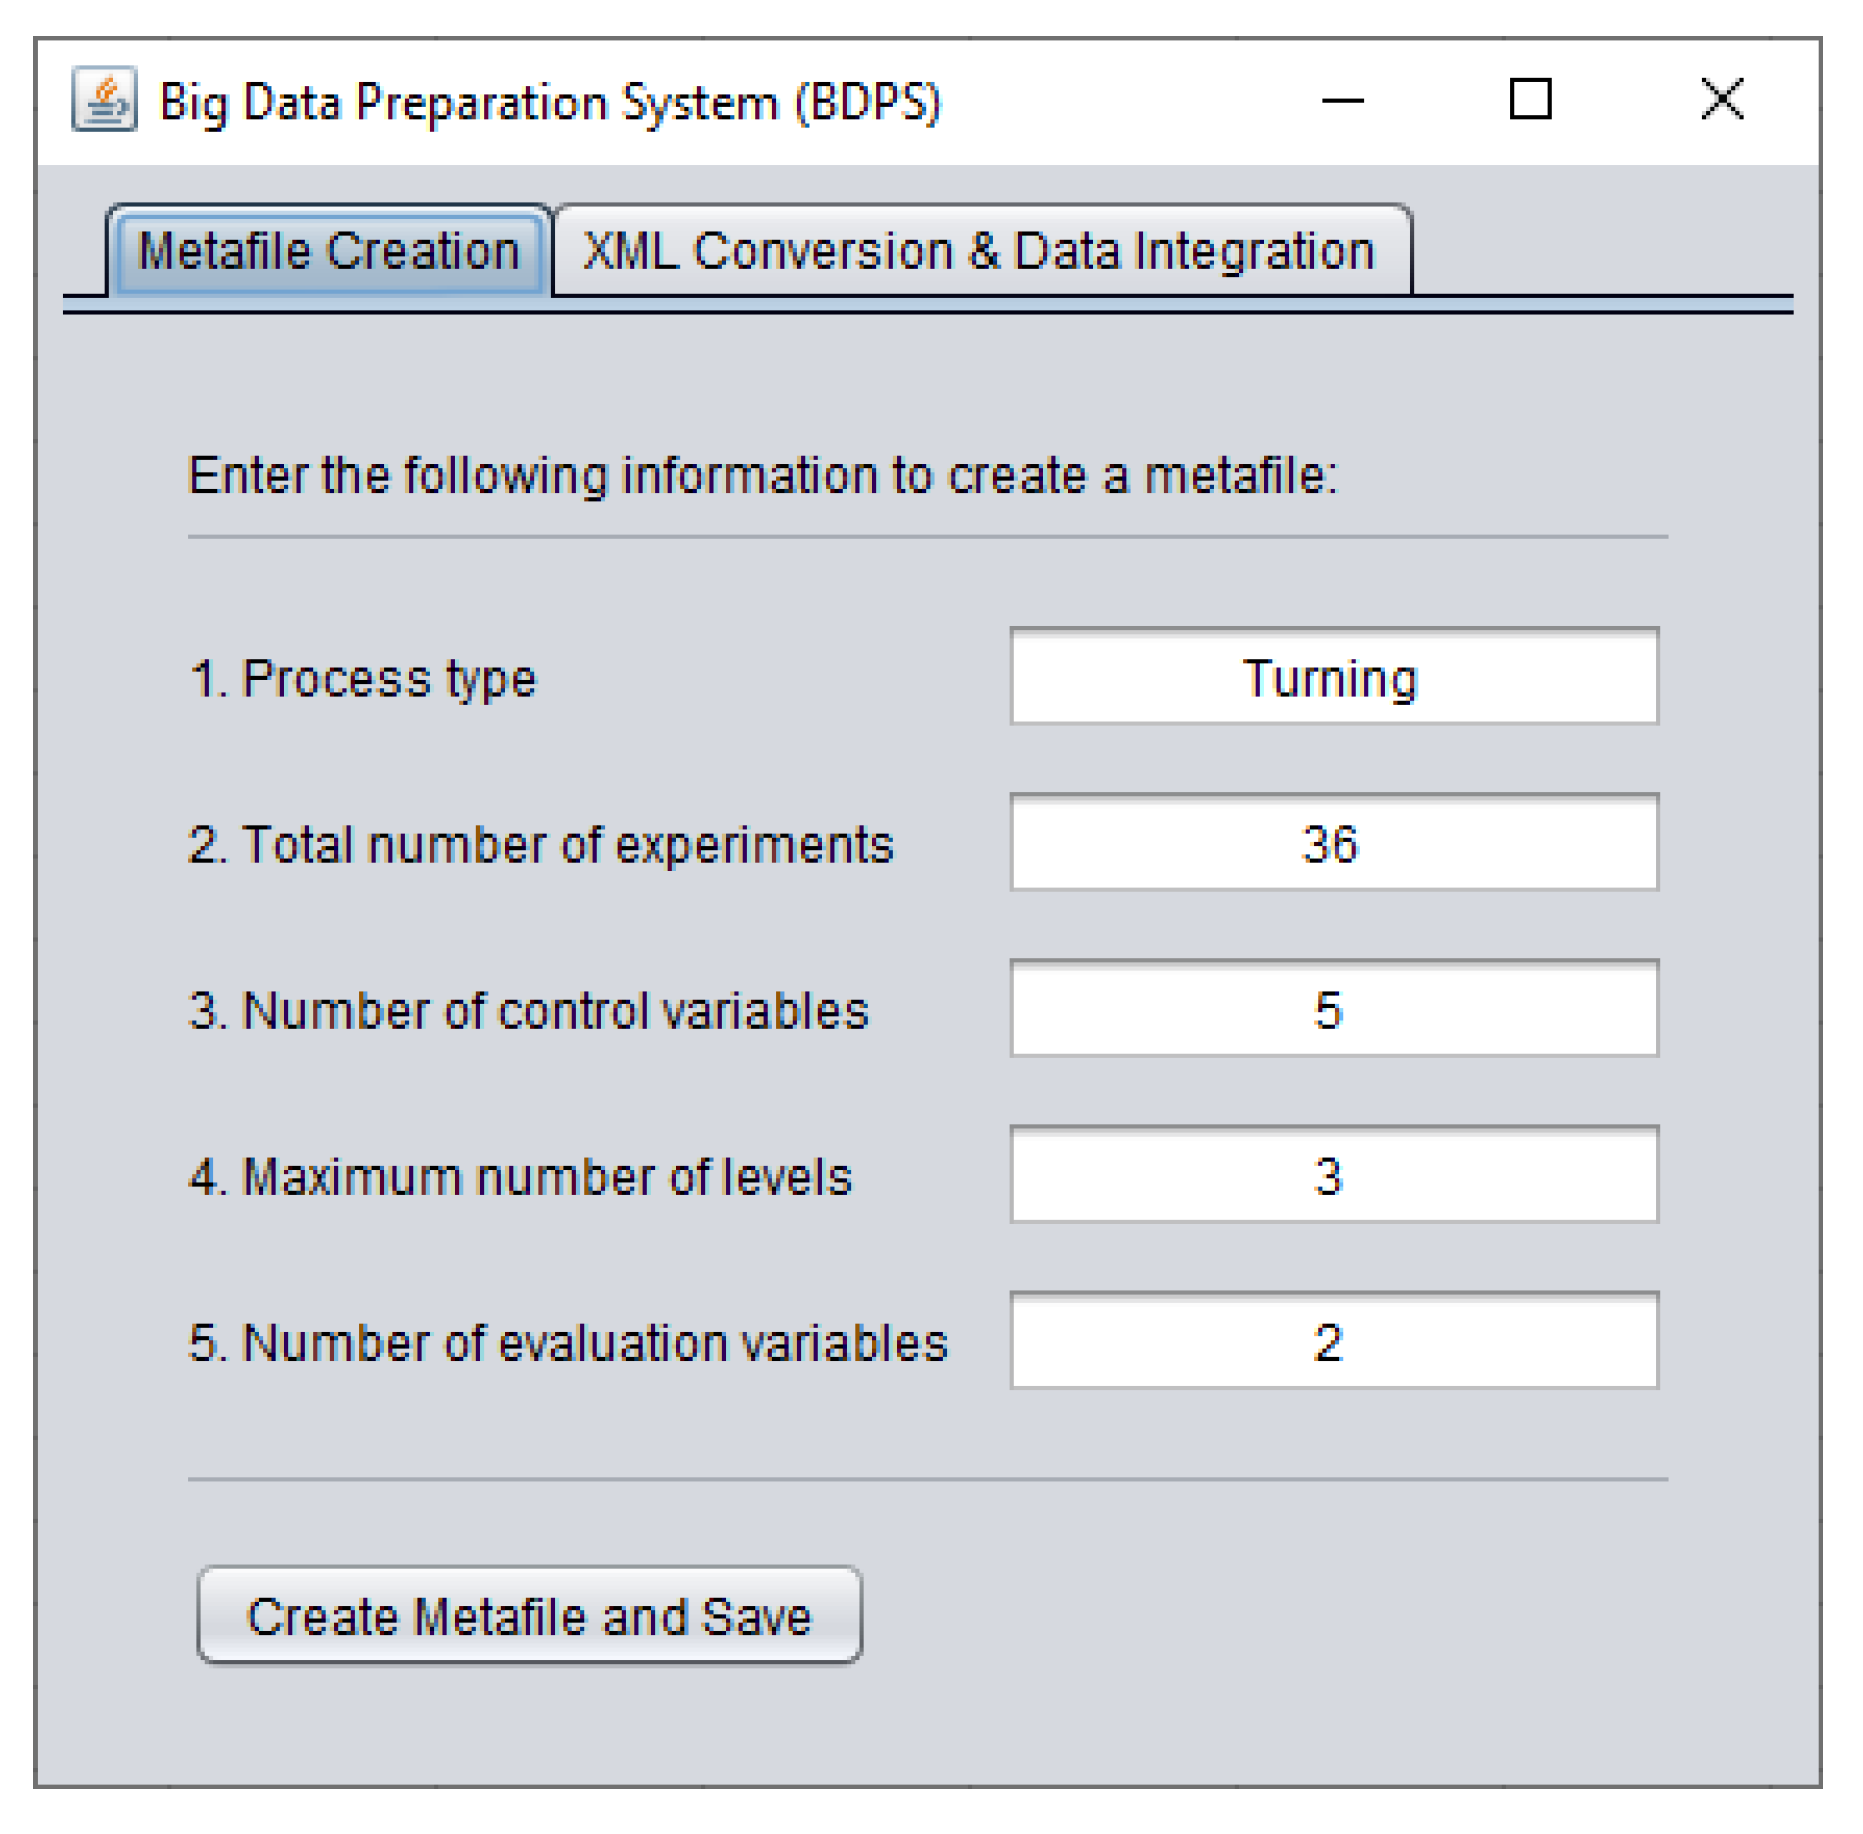
Figure 7, BDPS provides a facility to create a metafile based on user-defined process-relevant inputs (process type, number of experiments, number of
CVs/
EVs, and maximum number of
CV levels). The metafile can follow any file format. However, this study considers Excel™-based metafile for comprehensibility and availability. It (Excel™-based metafile) provides a user-comprehensible and flexible ontology for documenting a manufacturing process, incorporating process-relevant information such as source, summary, process, machine, tool, workpiece, machining conditions,
CVs,
EVs, and results or
CV-
EV-centric datasets. After documentation, BDPS provides another facility to convert the document into a machine/human-readable format (e.g., Extensible Markup Language (XML)) and share the XML data through a cloud-based data repository or store it in a local data repository for future use. As a result, the cloud-based data repository contains XML data from different sources and generates process-relevant big data. BDES provides a facility to search the repository using a user-defined keyword (e.g., process type, workpiece material, and alike) and fetch the relevant outcomes (files containing XML data). The outcomes are also presented in a meaningful way by the system. For this, BDES provides a facility to display the contents of the fetched XML data using an appropriate data presentation technique (here, HTML-based presentation). This presentation benefits the user to decide whether or not to adapt the contents for subsequent analysis. If not, the user may re-search the repository. Otherwise,
CV-
EV-centric datasets from the XML data are acquired. DVS provides a facility to visualize/represent the acquired
CV-
EV-centric datasets using different data visualization techniques (e.g., scatter plots, line graphs, histograms, area charts, heat maps, possibility distribution, and so forth). The user can choose an appropriate technique within the system and visualize the datasets whenever needed. DAS provides a facility to analyze the
CV-
EV-centric datasets and identify the
CV-
EV relationships using different computational methods (e.g., correlation analysis, uncertainty analysis, and alike). The user can choose appropriate methods whenever needed. As a result, DAS generates a set of analyzed outcomes corresponding to different sources. Finally, KES utilizes the analyzed outcomes to extract underlying knowledge based on user-defined optimization criteria (e.g., maximization/minimization of an
EV) and concludes optimization rule(s).
The remarkable things about the above BDA framework are its transparency and human intervention associated with the underlying systems, functionalities, and methods. It provides the users with a more feasible way of understanding the internal processes, assessing the fairness of the outcomes, and making relevant decisions. Nevertheless, computerized systems are also developed based on the proposed framework and implemented in a case study, as described in the following section.
5. Case Study
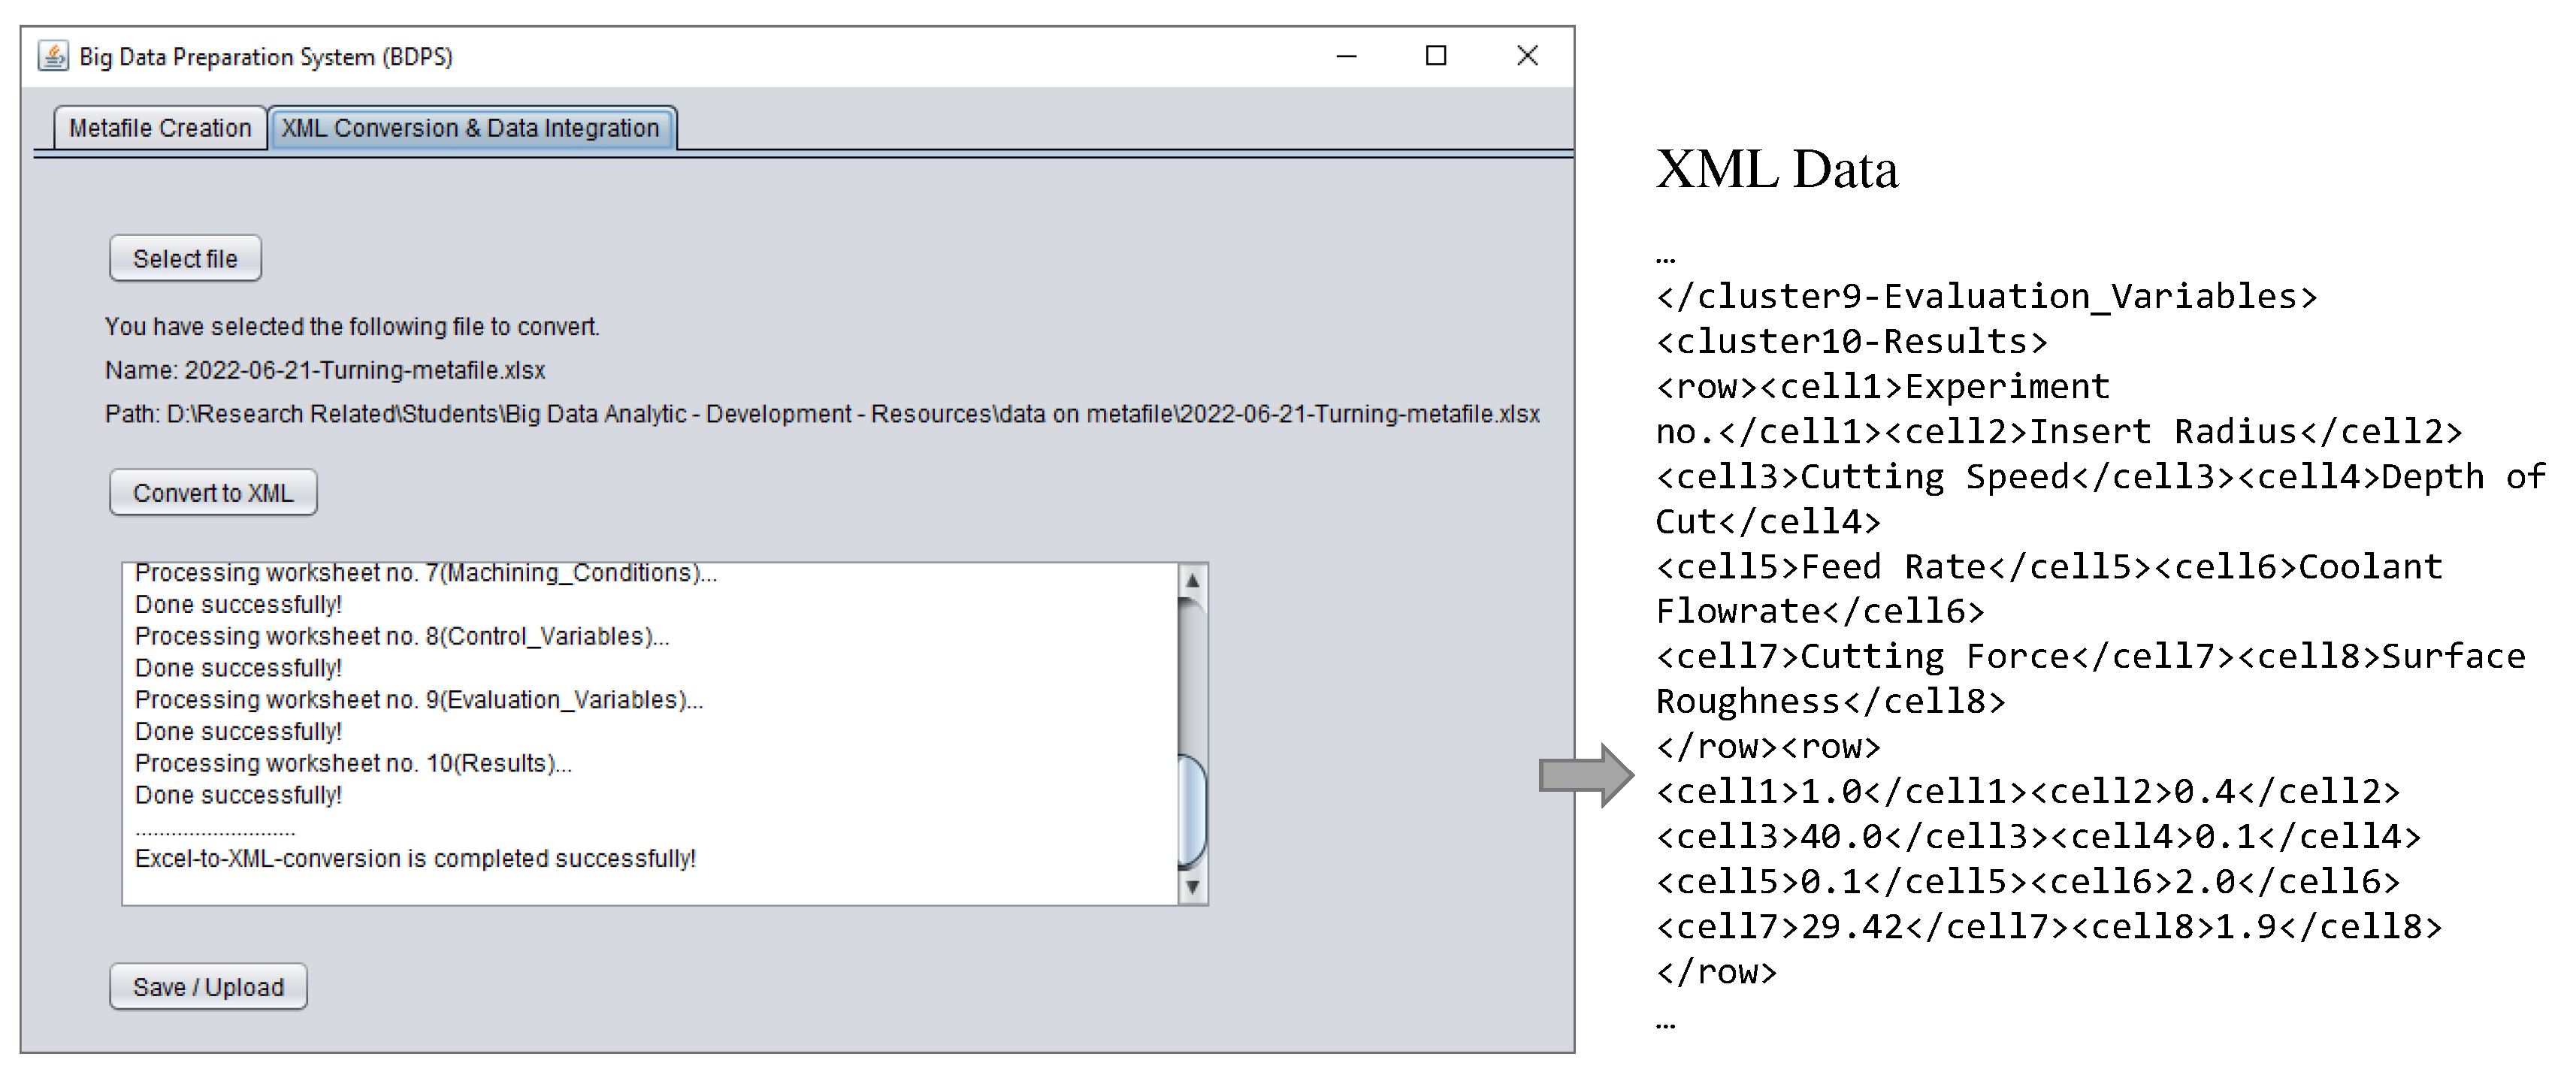
This case study deals with a manufacturing process called Electrical Discharge Machining (EDM). In order to optimize EDM operations, knowledge is needed, which comes from experimental studies. There are many experimental studies regarding EDM. For example, when Google Scholar was searched using the keyword “EDM,” it produced 52900 hits. All these studies constitute big data of EDM. However, datasets specific to a workpiece material are more informative because a process is optimized for a specific workpiece material. Therefore, it would have been advantageous if all the necessary datasets were stored in a machine-readable format. Unfortunately, it is not the case now. However, the authors selected six studies [63-68] on dry EDM where the workpiece materials are high-speed or stainless steels. The datasets are digitized using the systems described previously (see
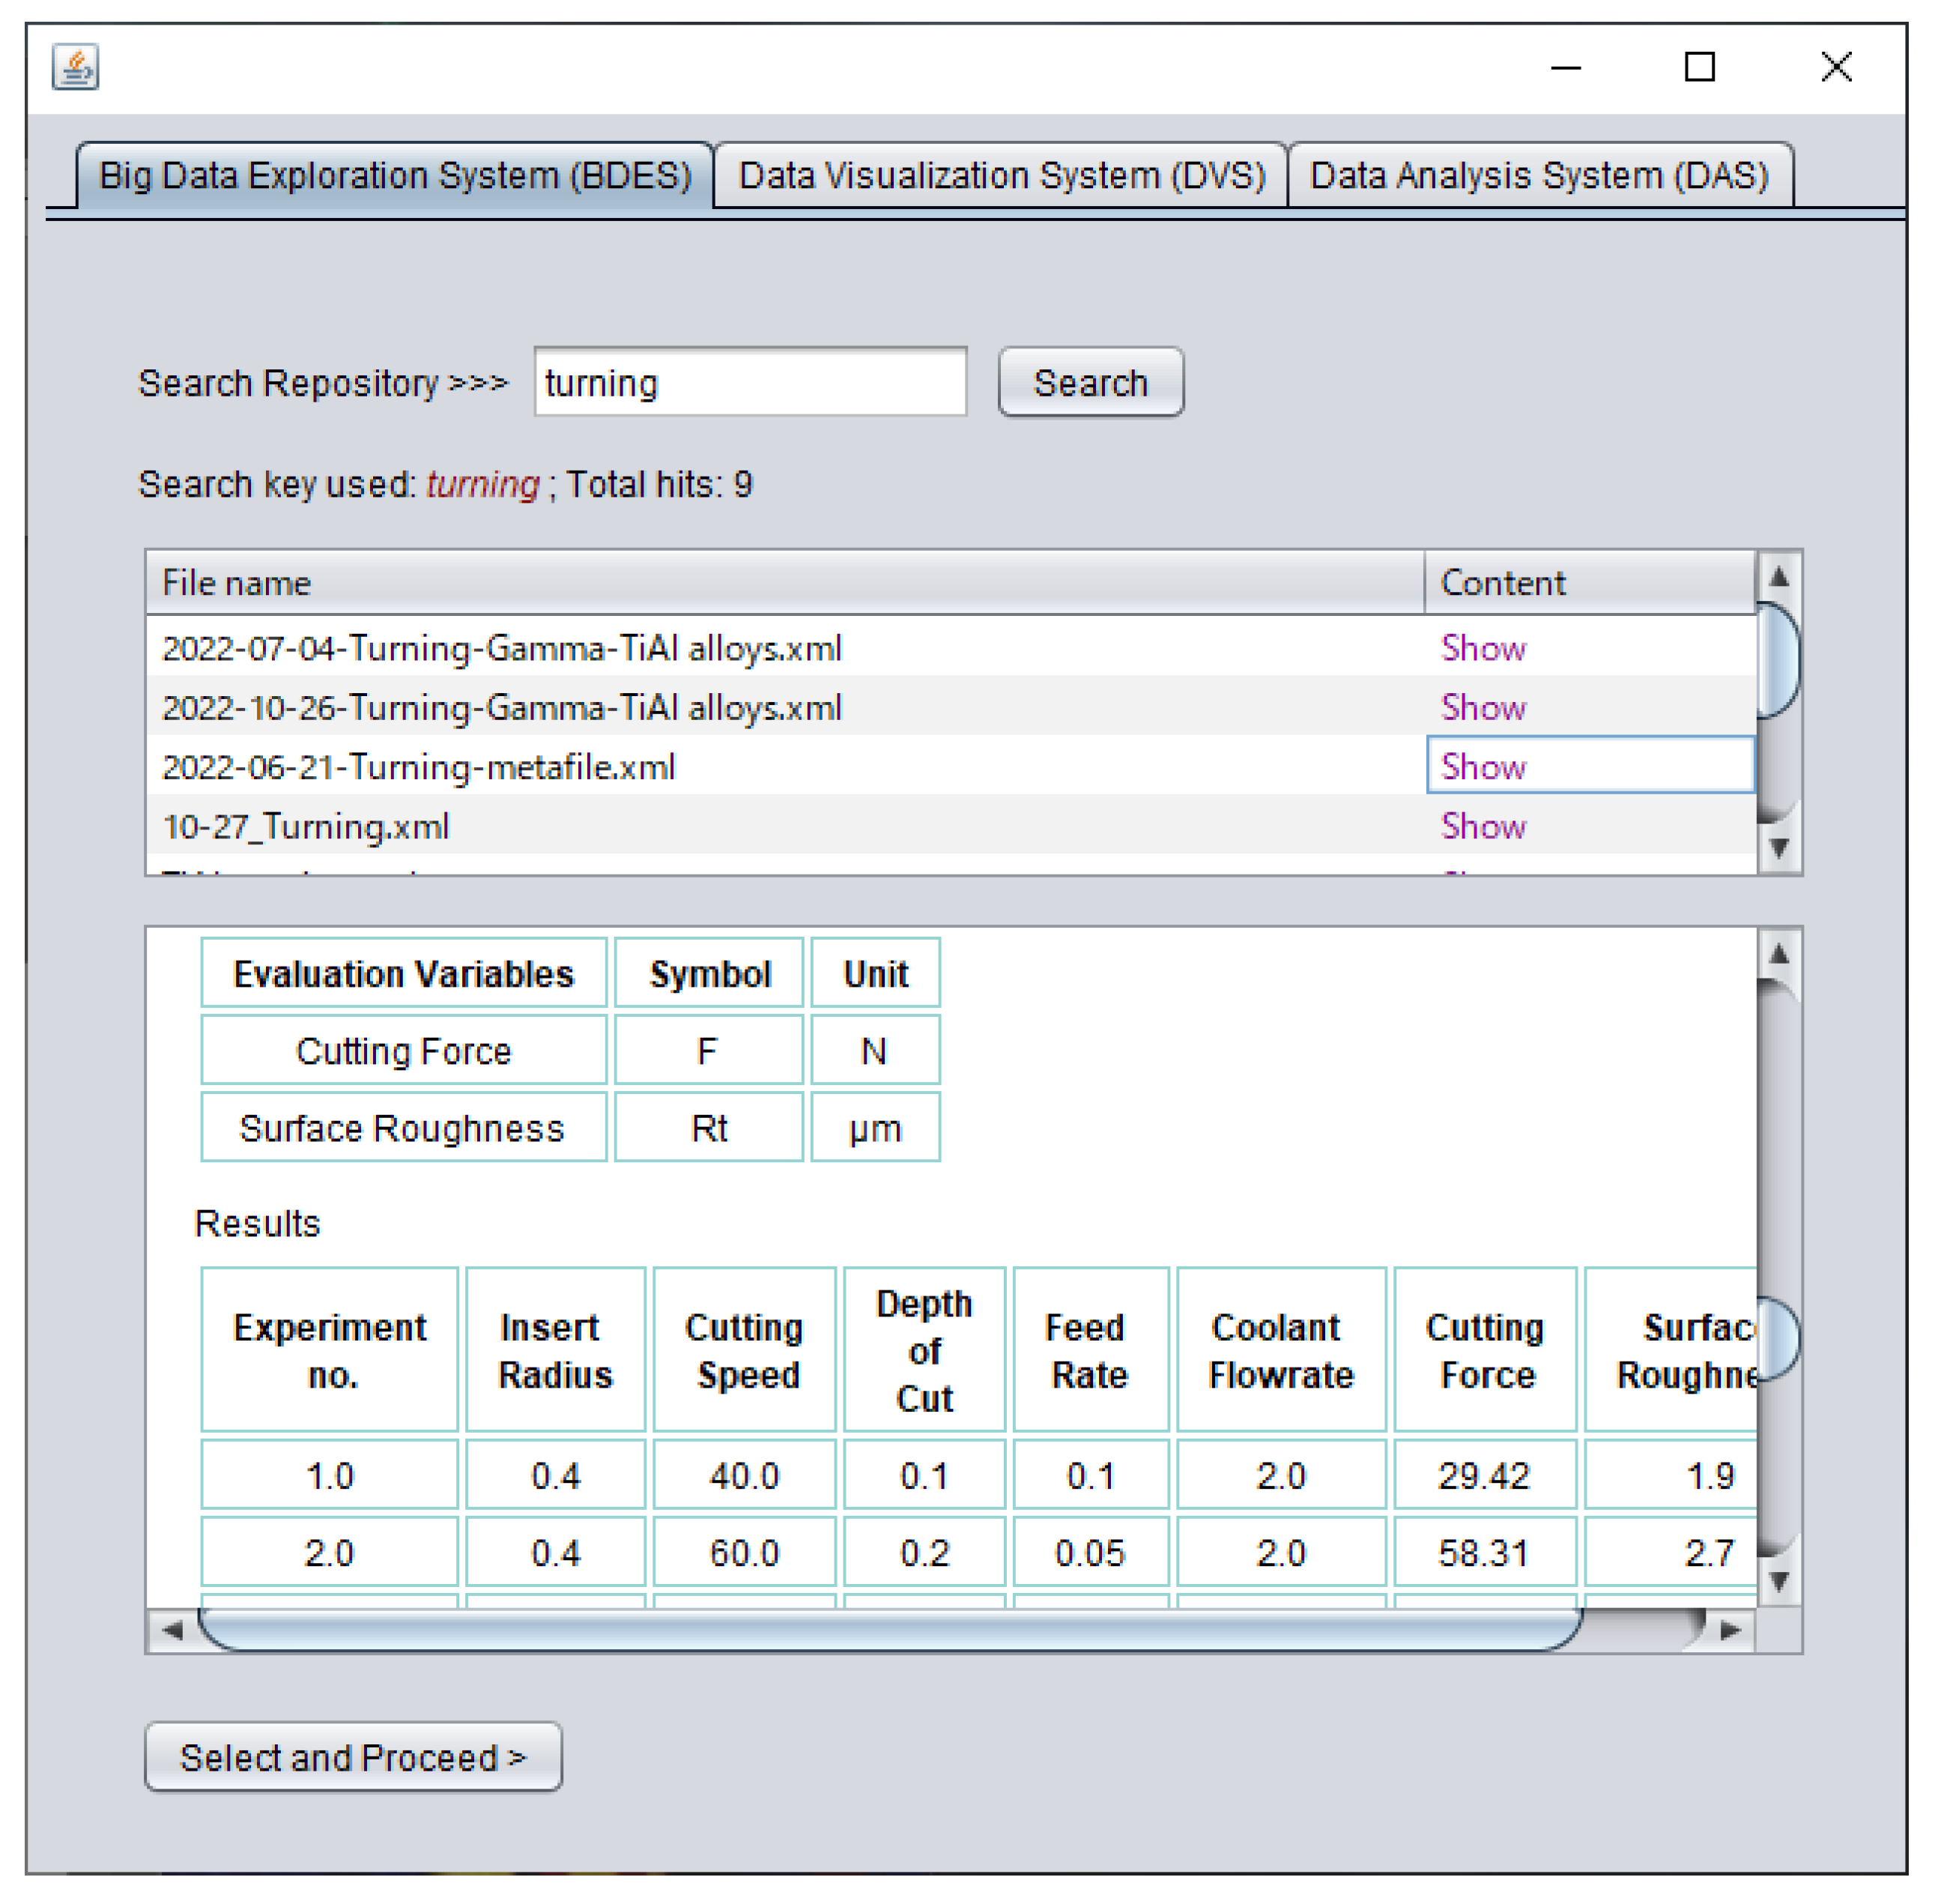
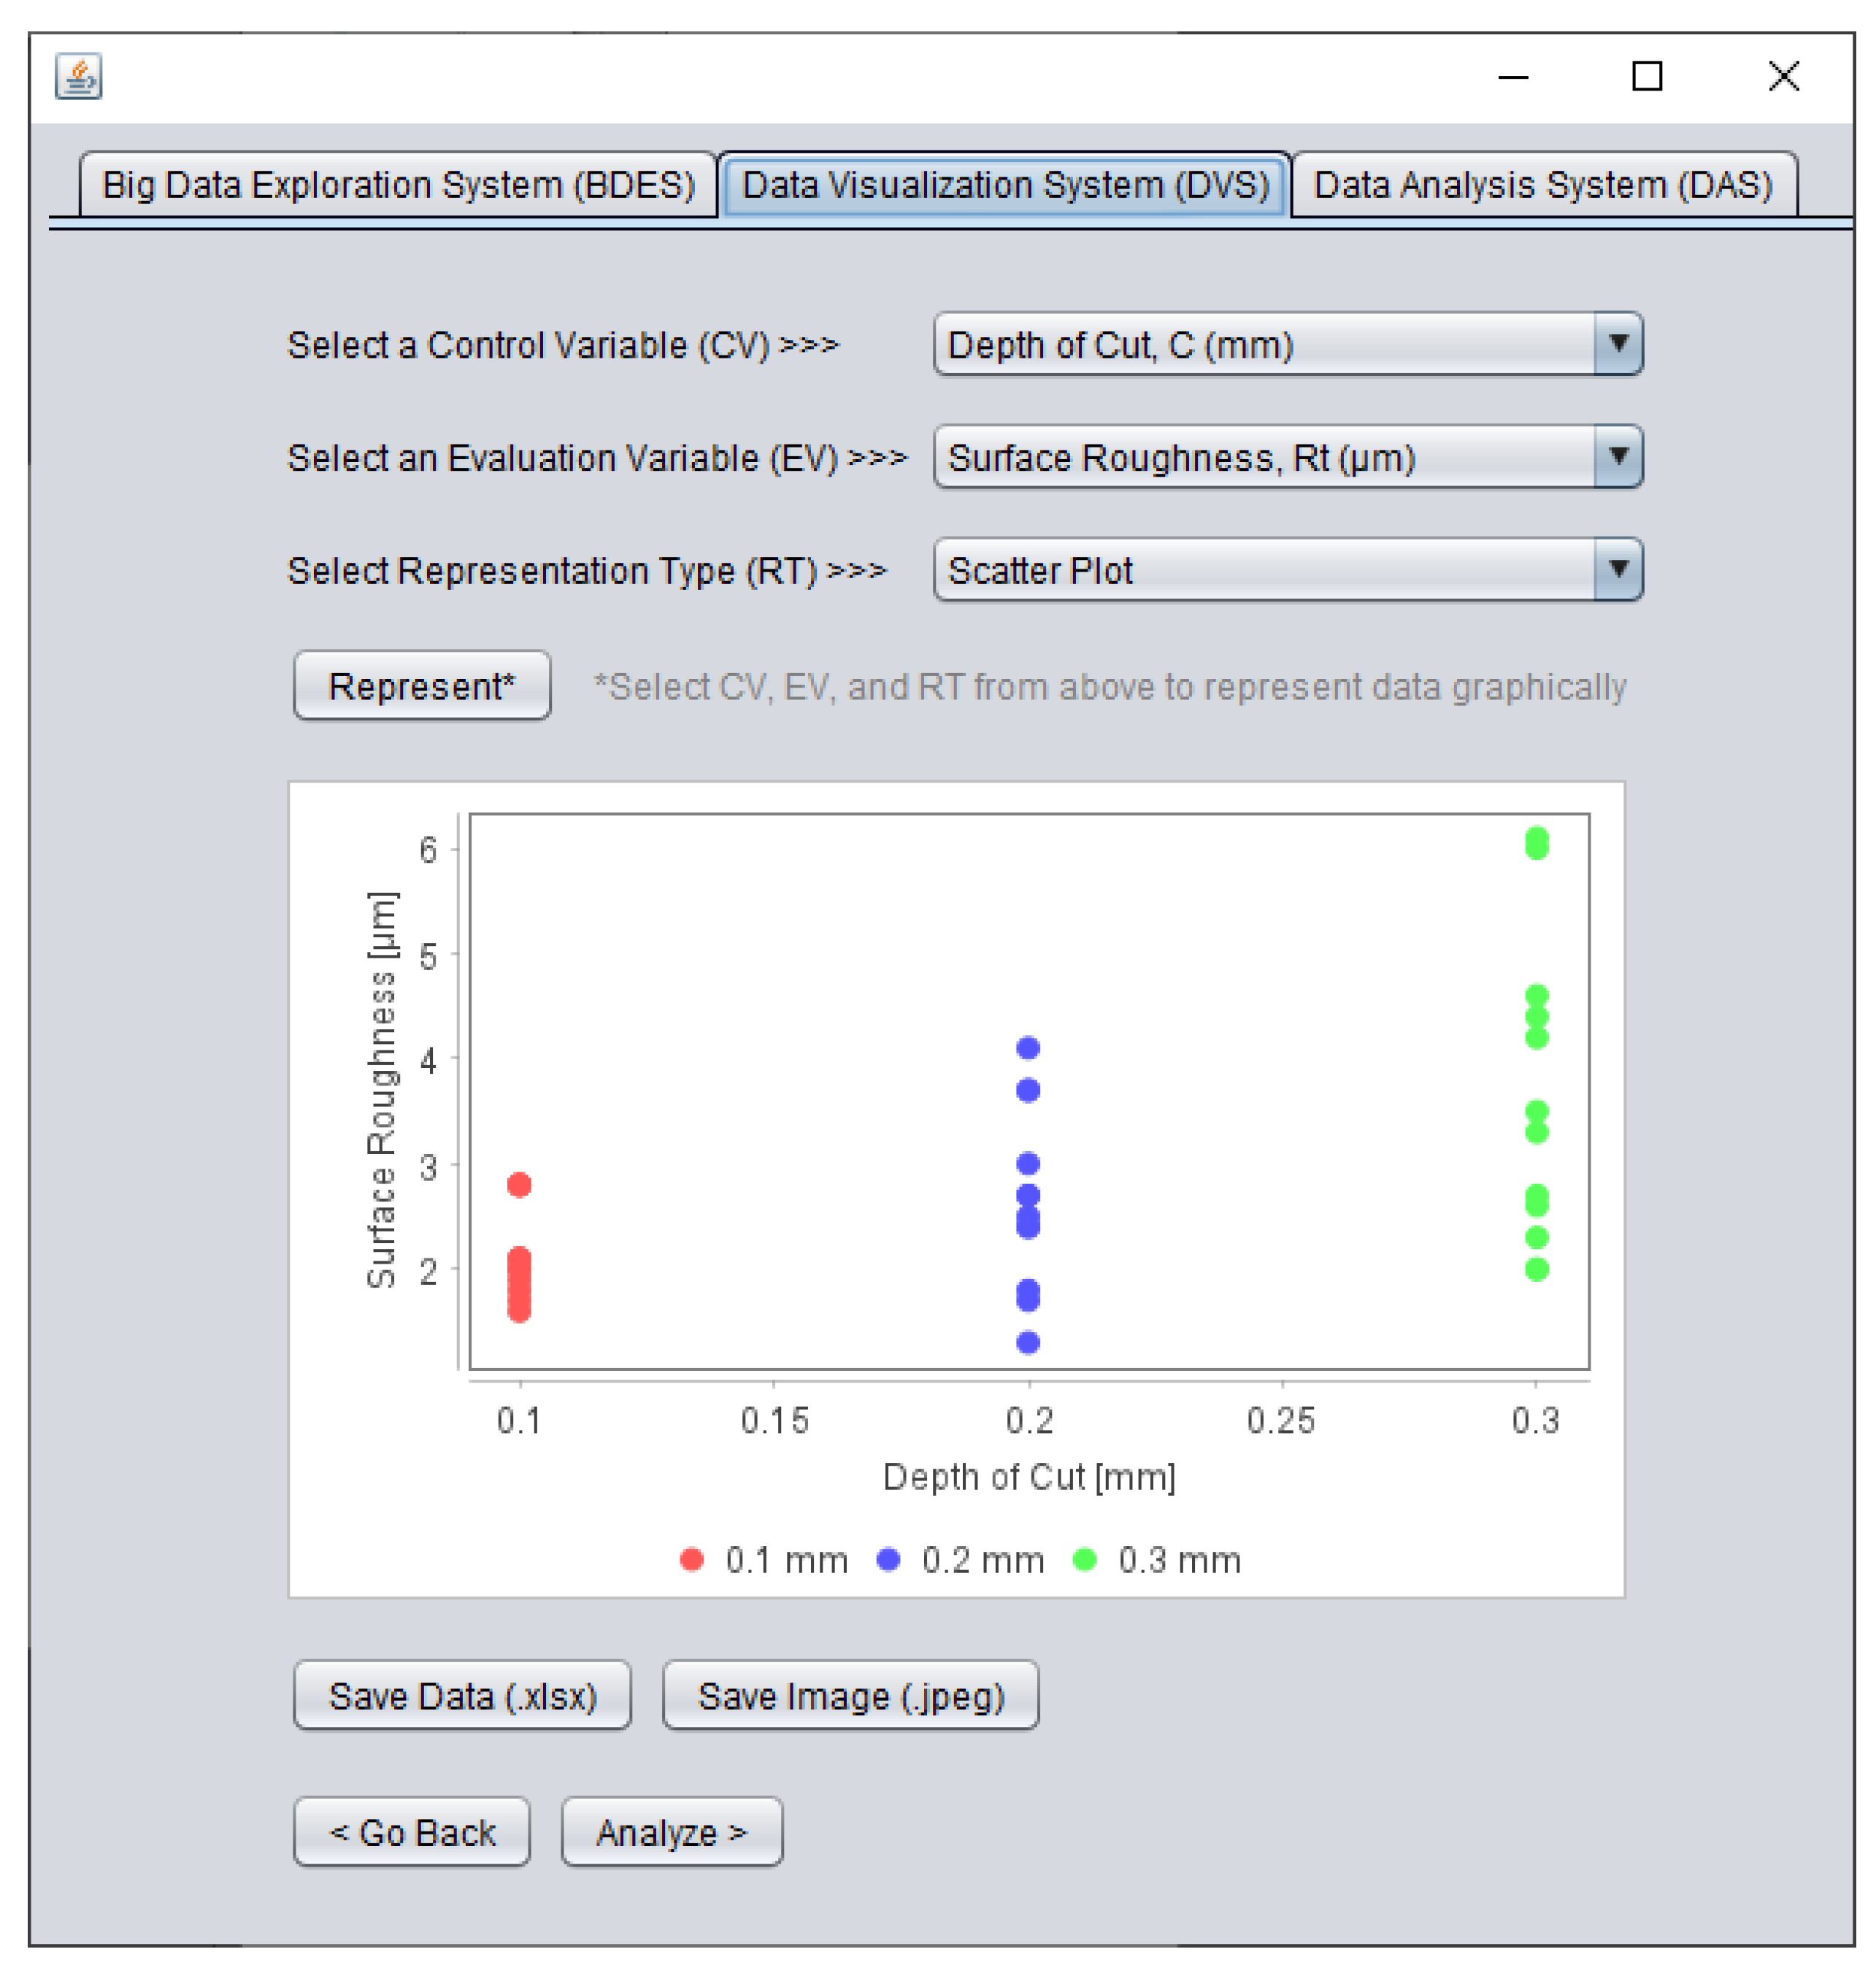
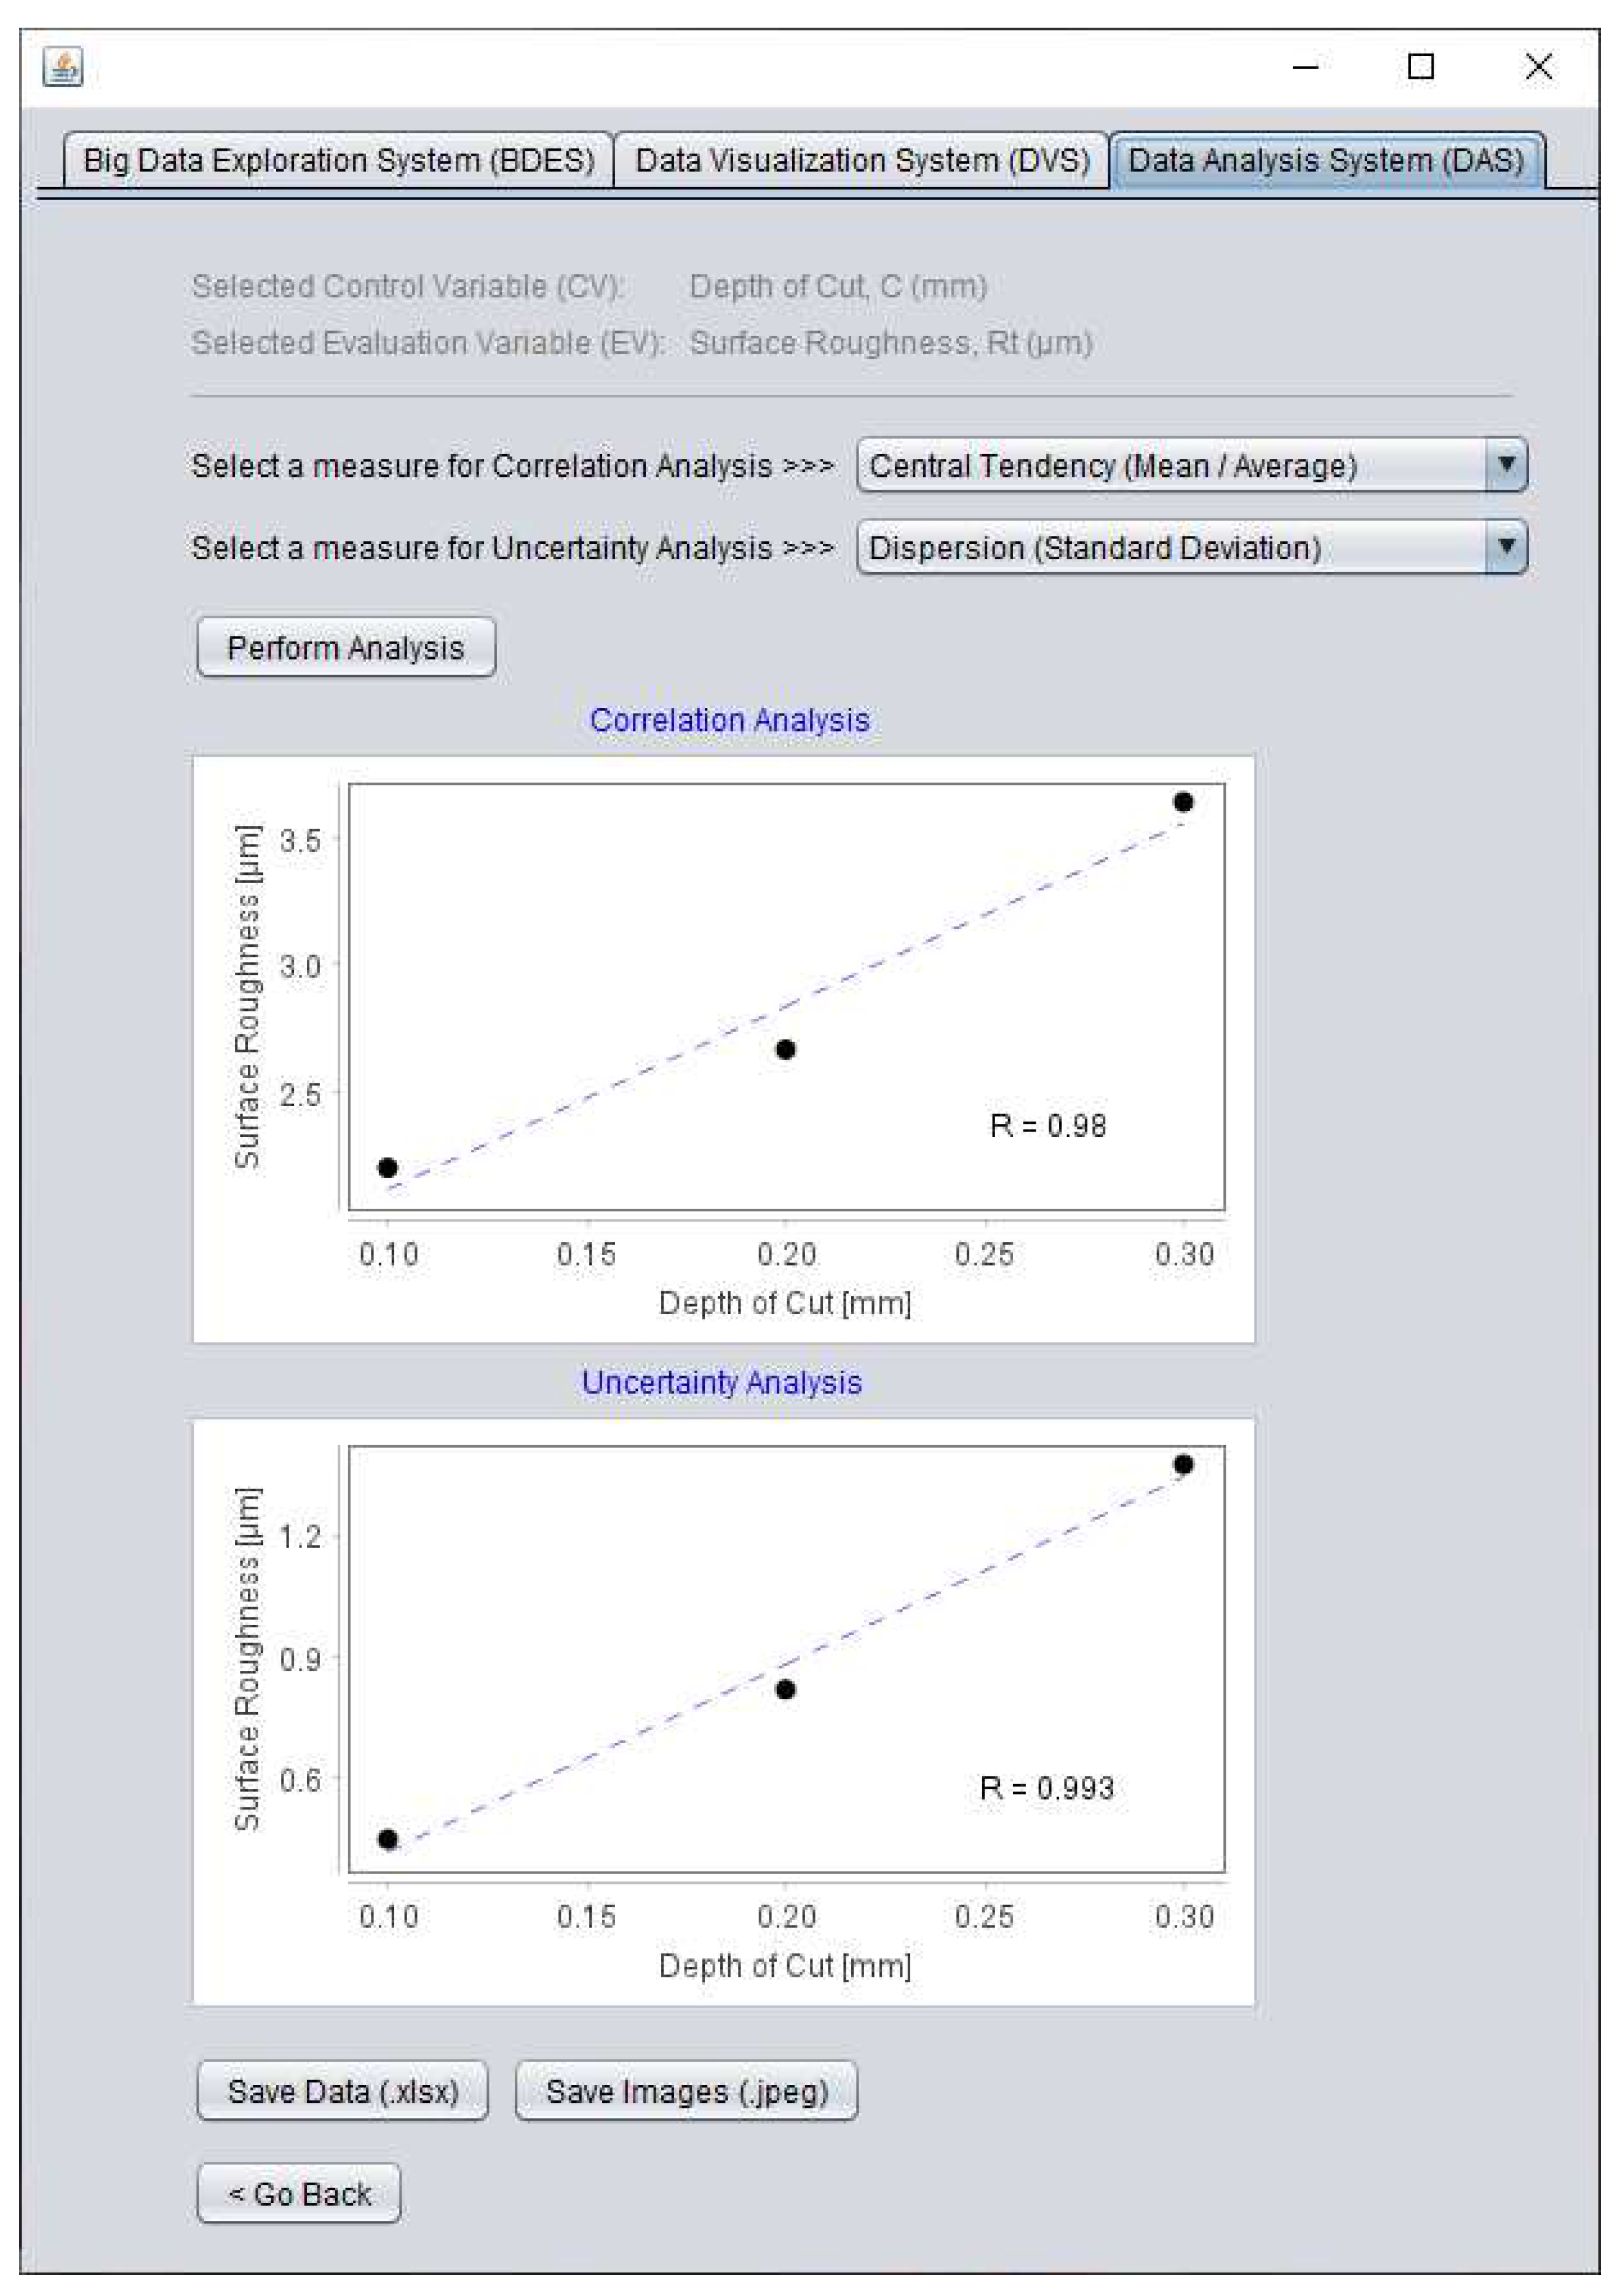
Figure 9). They are also explored and analyzed using the systems described in
Figure 10,
Figure 11 and
Figure 12. Before describing the results, it is important to see whether or not the issues described in
Section 3 and
Section 4 are relevant here. The description is as follows.
The
CVs and
EVs of the studies [63-68] are listed in
Table 1. These studies provide a total of 115 datasets. Even though the datasets are limited to 115, they exhibit some of the Vs (see
Section 1) of big data. The following visualizations are made to elucidate these.
The following CVs are used in the said studies: Current (I), Gas Type, Duty Factor (η), Gap Voltage (V), Gas Pressure (P), Pulse Off Time (Toff), Pulse On Time (Ton), Rotational Speed (S), and Shielding Clearance (Cb). The following EVs are used in the said studies: Depth Achieved, Material Removal Rate (MRR), Oversize, Oversize (50% of hole depth), Oversize (90% of hole depth), Oversize (entry of hole), Radial Over Cut, Surface Roughness (Ra), and Tool Wear Rate.
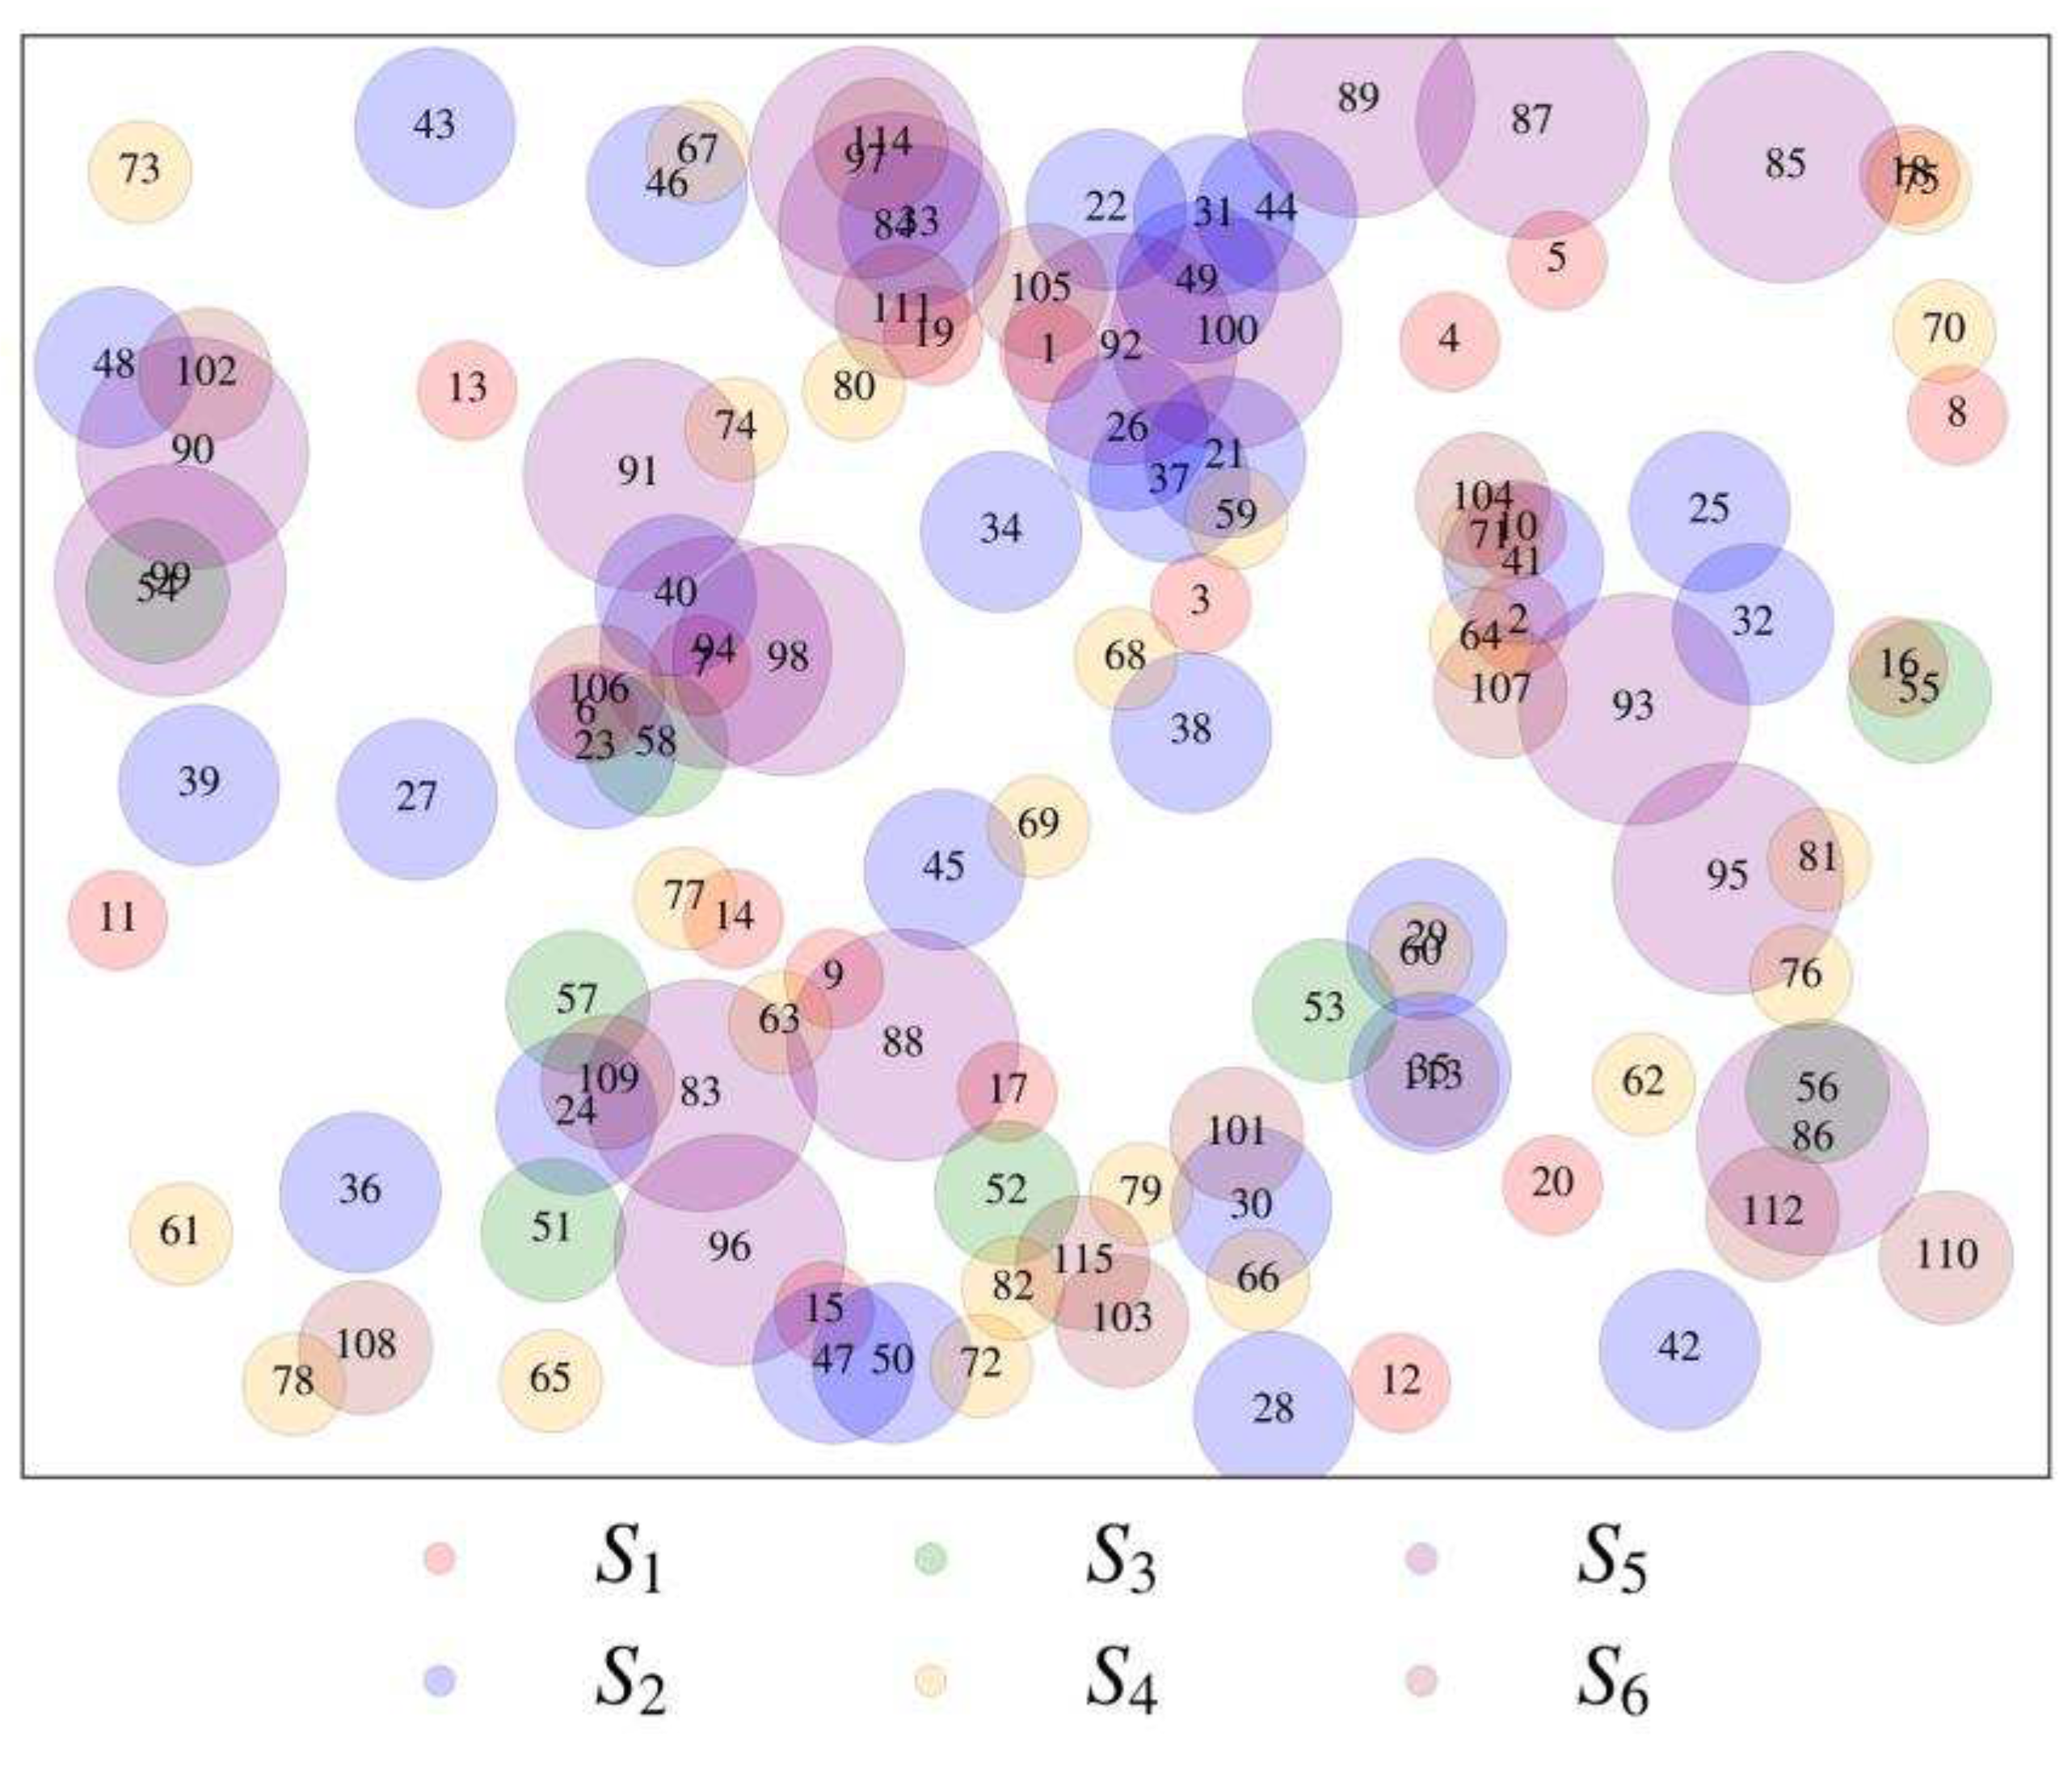
First, consider whether the datasets exhibit some of the Vs of BD. A series of plots shown in the following diagrams are considered. Consider the bubble plot shown in
Figure 13. The plot displays datasets from six different sources in distinct colors. The size of each bubble corresponds to the number of data sets for each possible
CV-
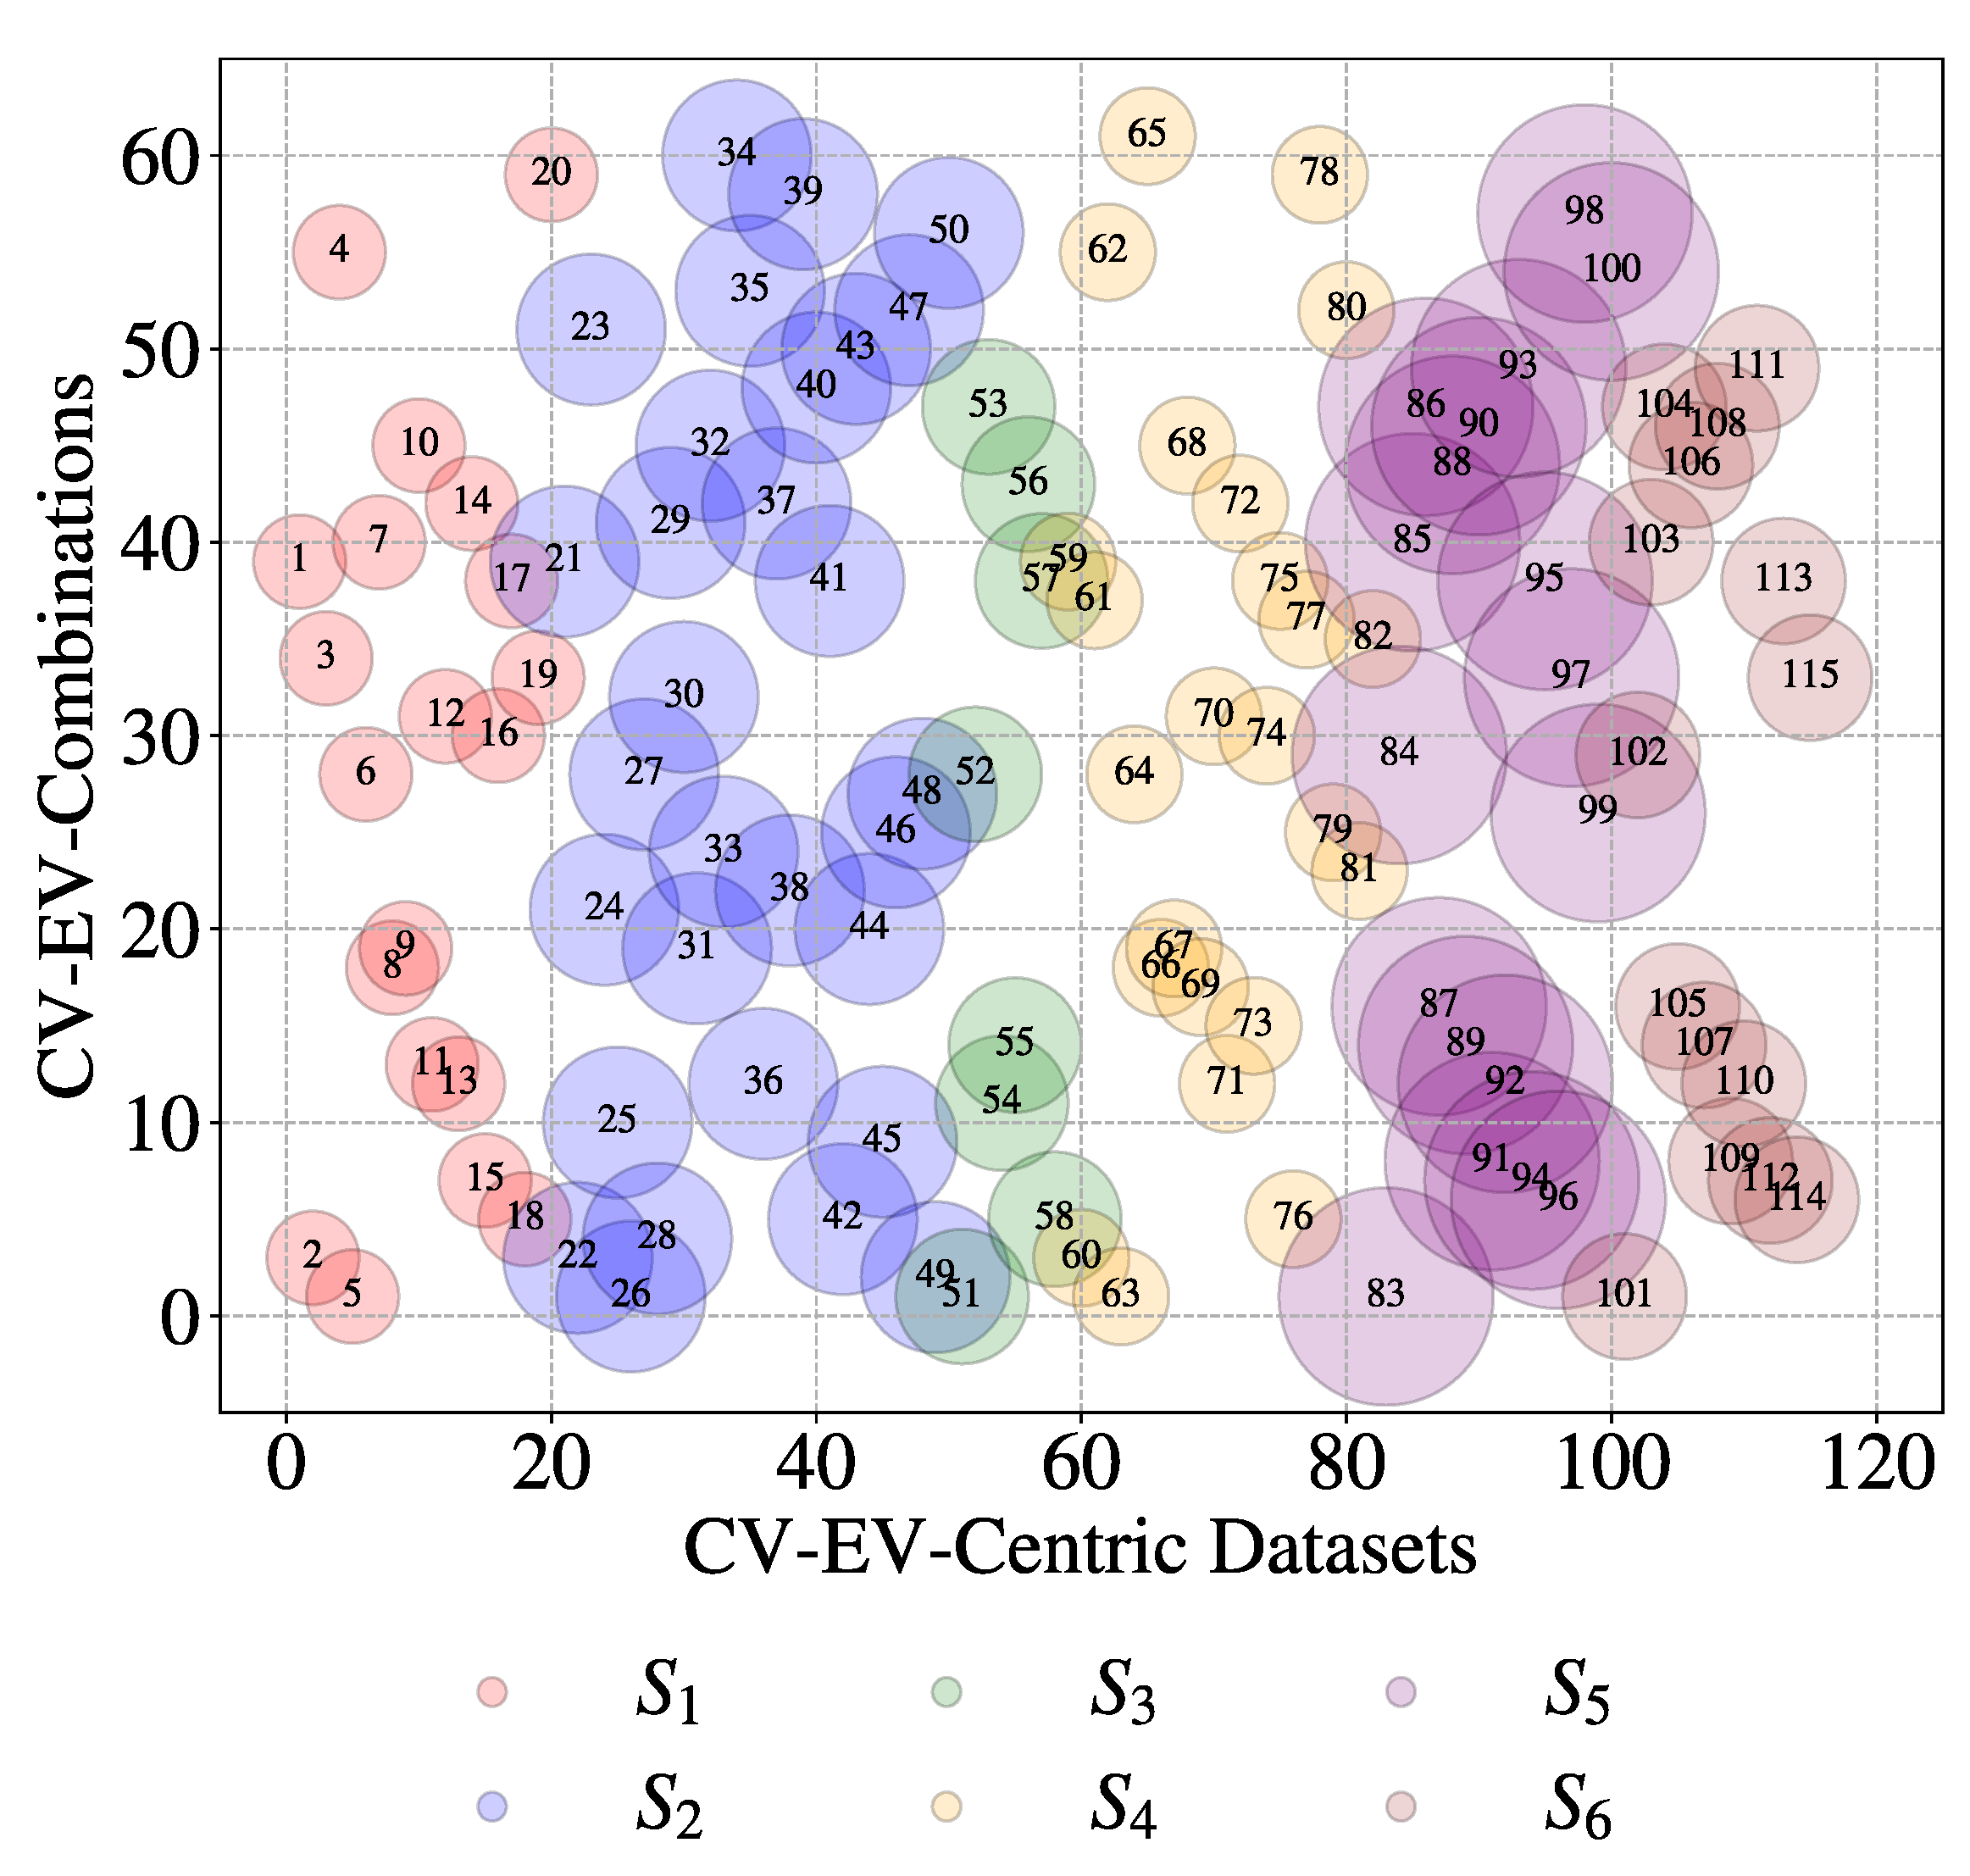
EV combination. However, 61 unique
CV-
EV combinations are exhibited by these 115 datasets, as shown by the plot in
Figure 14. This time the bubbles are organized according to their sources.
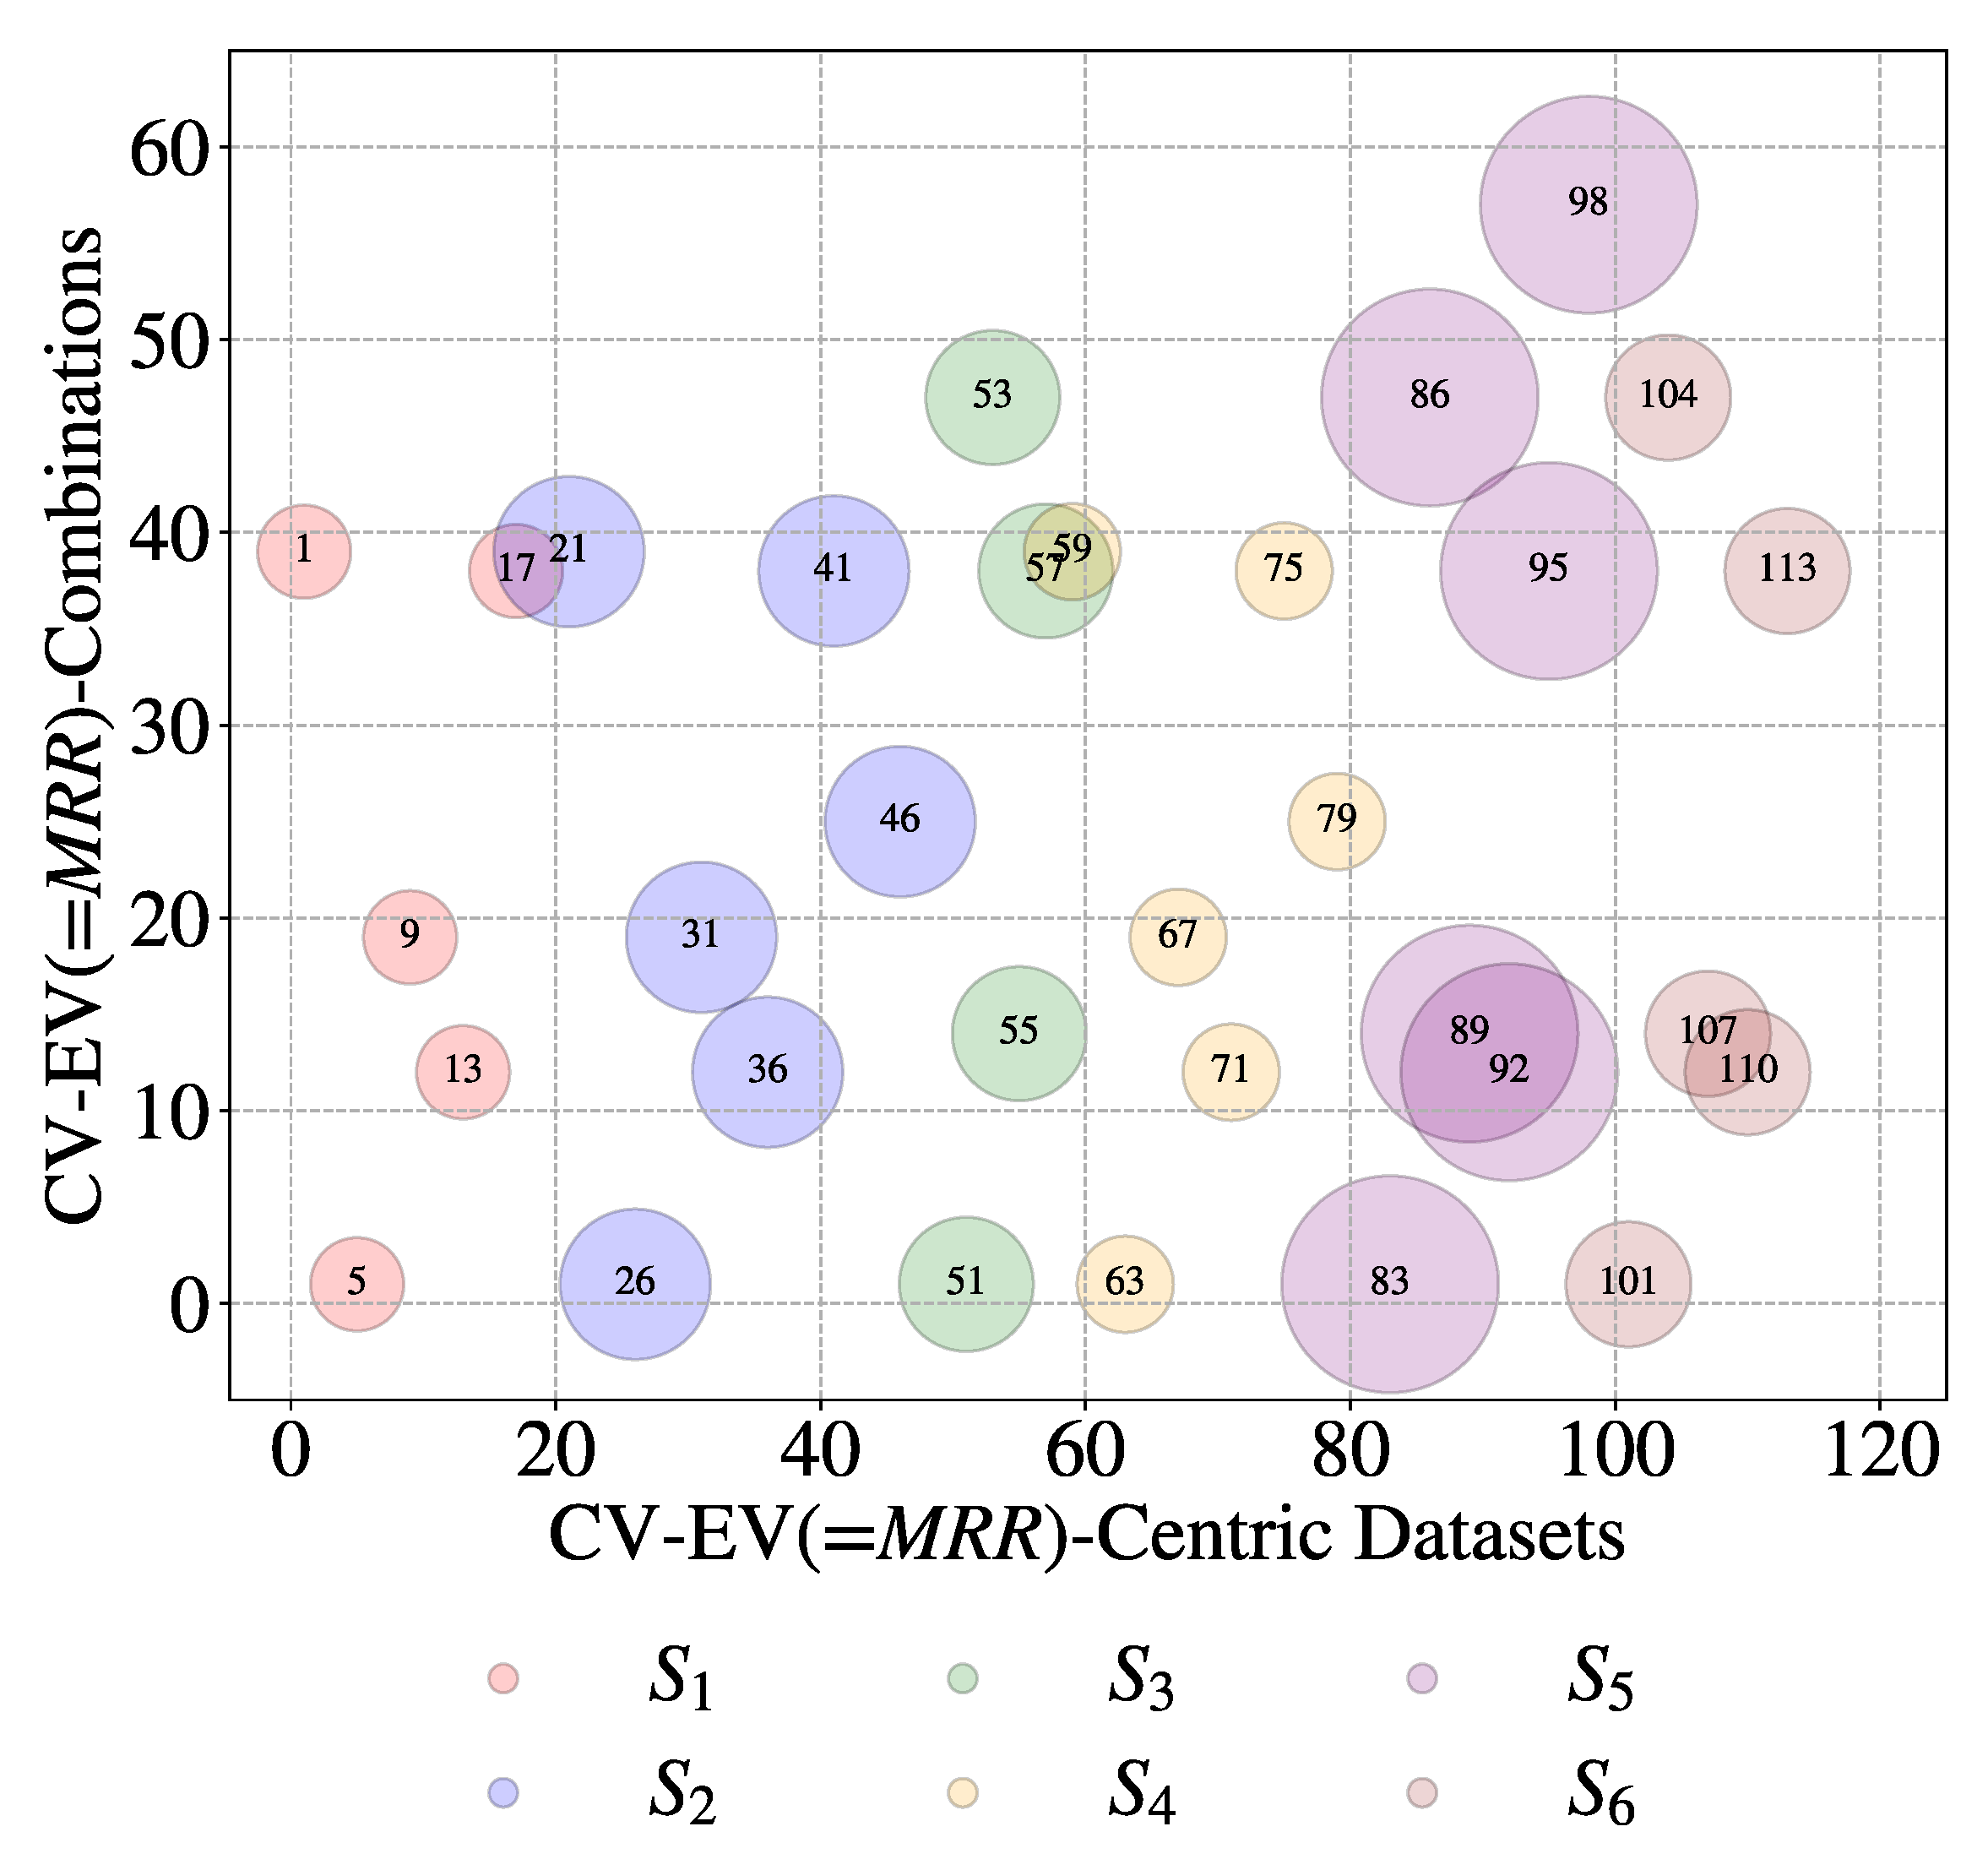
Let us be more specific. Consider an
EV called Material Removal Rate (
MRR). It refers to 32 datasets among115 and 9 unique combinations of
CV-
EV, as shown in
Figure 15. As seen in
Figure 15, all six sources deal with
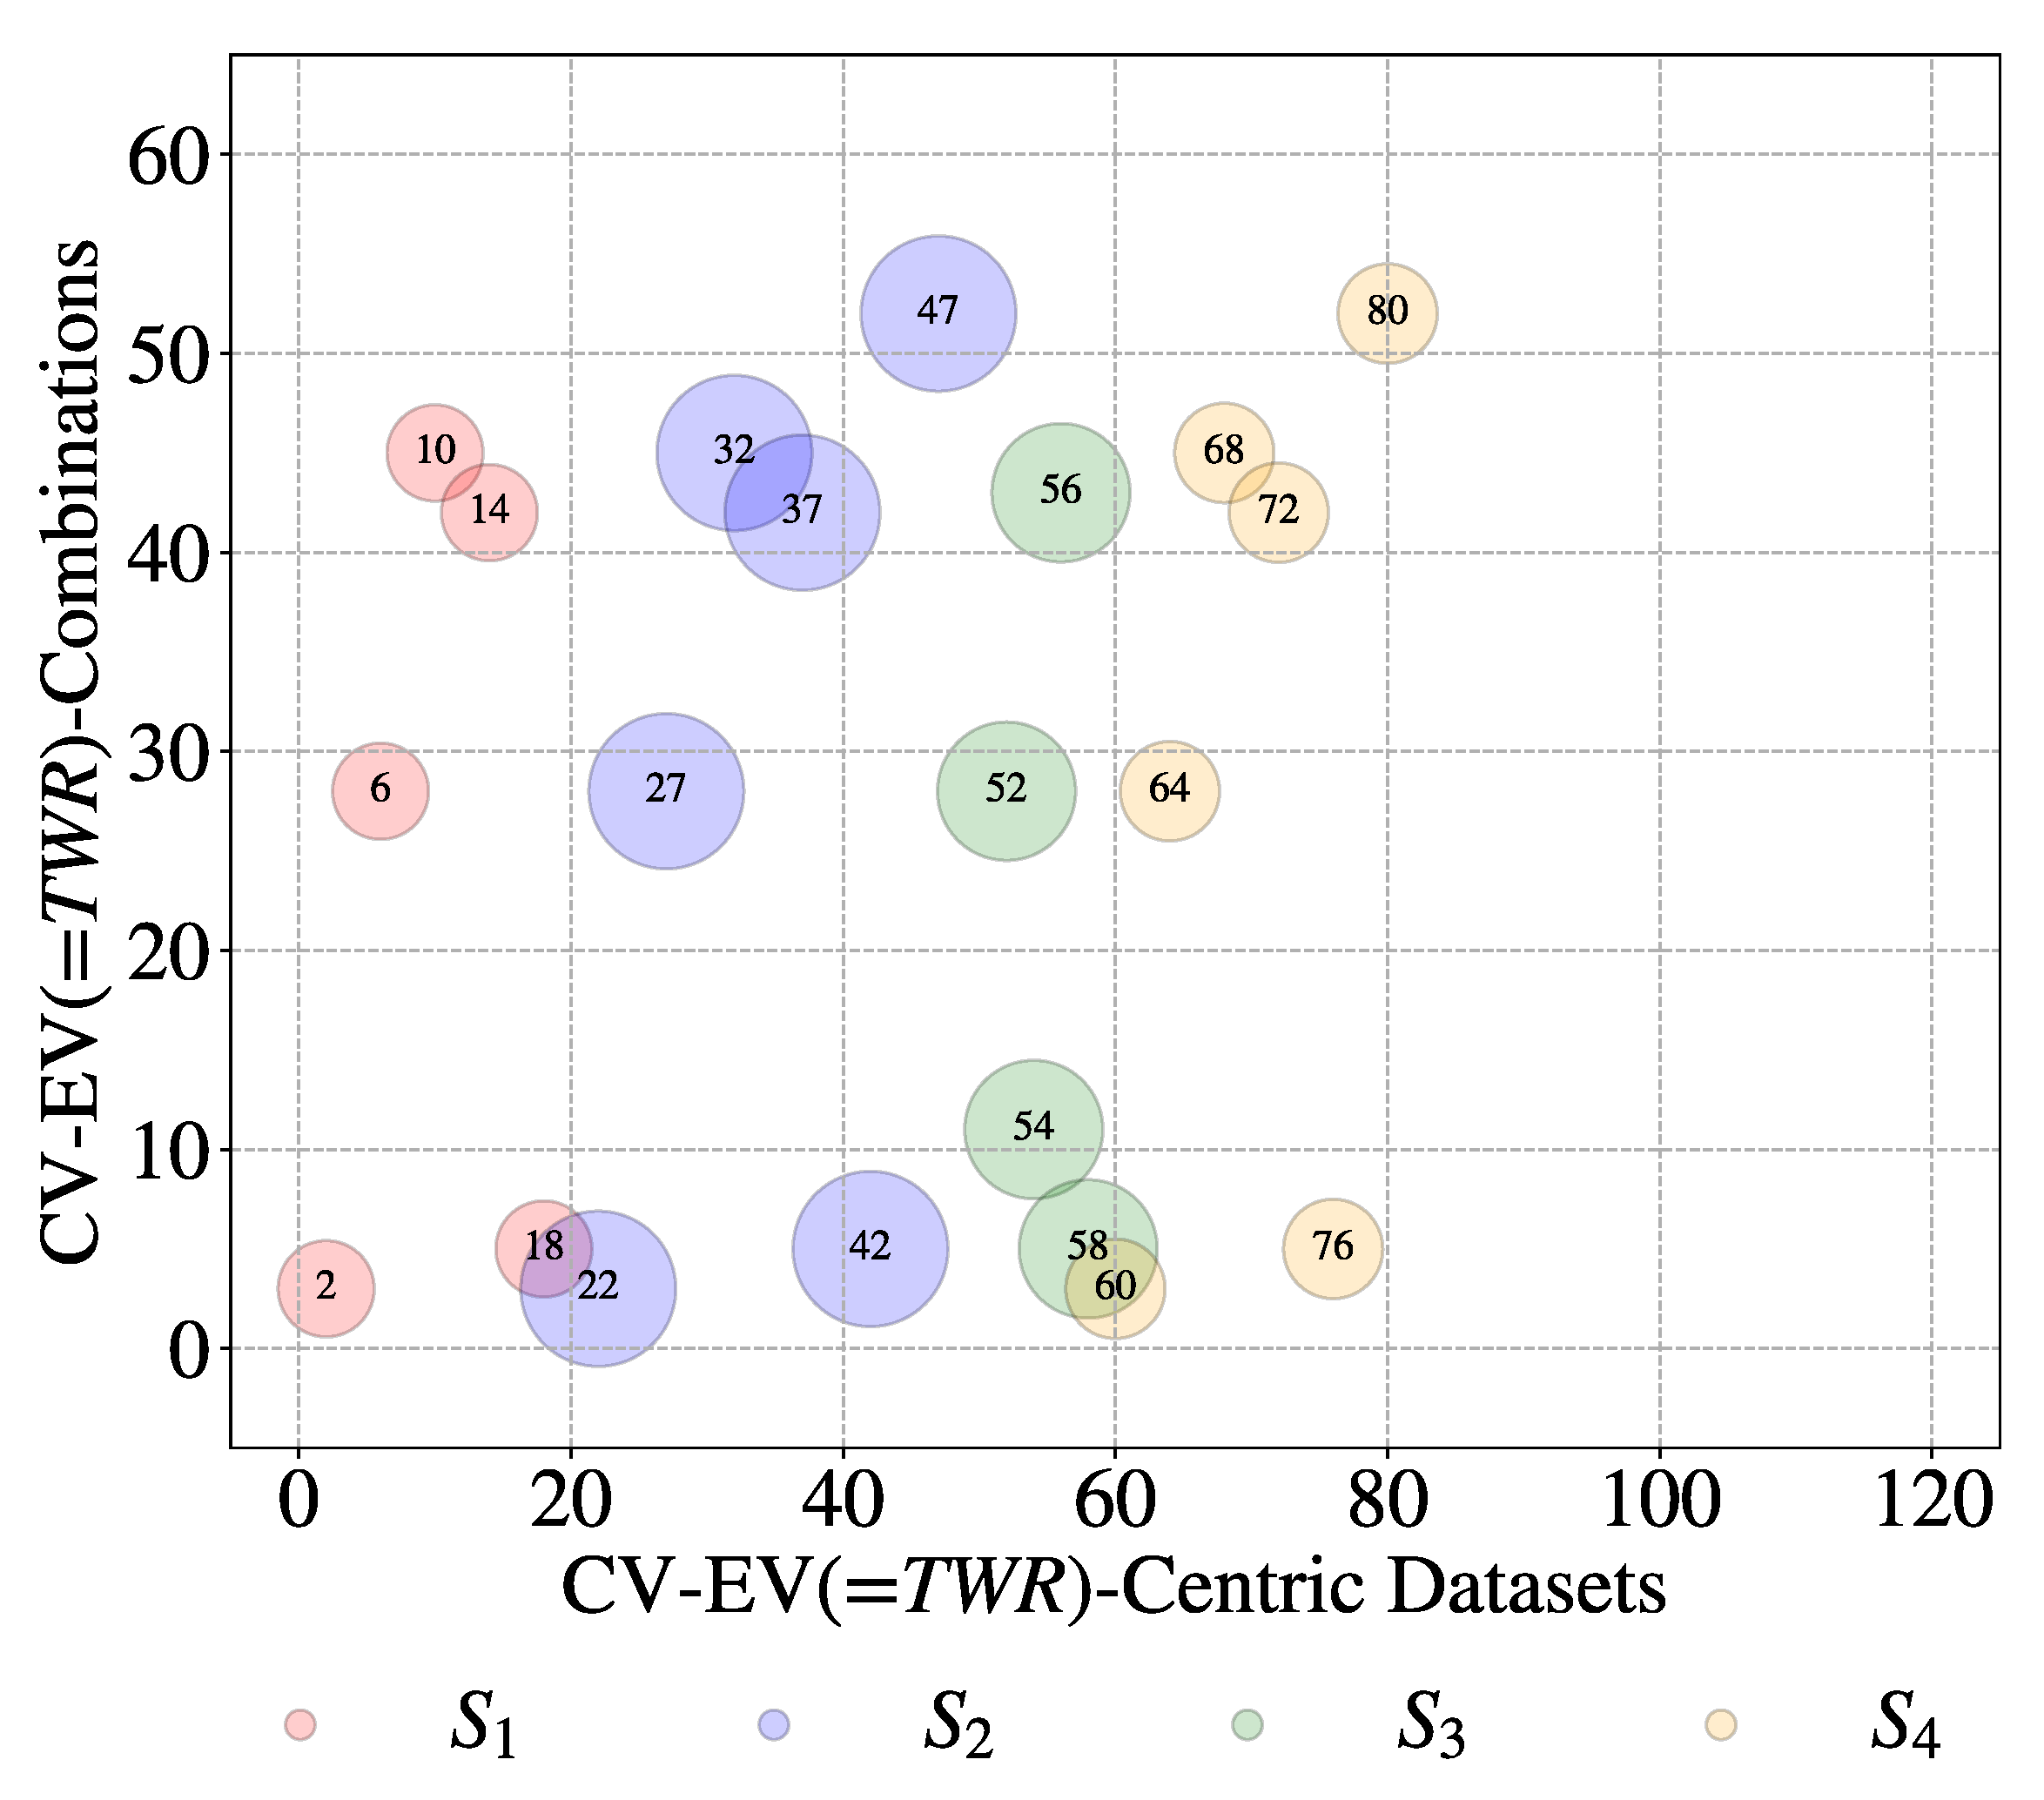
MRR. Consider another
EV called Tool Wear Rate (
TWR). It refers to 21 datasets among 115 and 8 unique combinations of
CV-
EV, as shown in
Figure 16. Four sources among six provide datasets for this
EV (i.e.,
TWR), unlike the case shown in
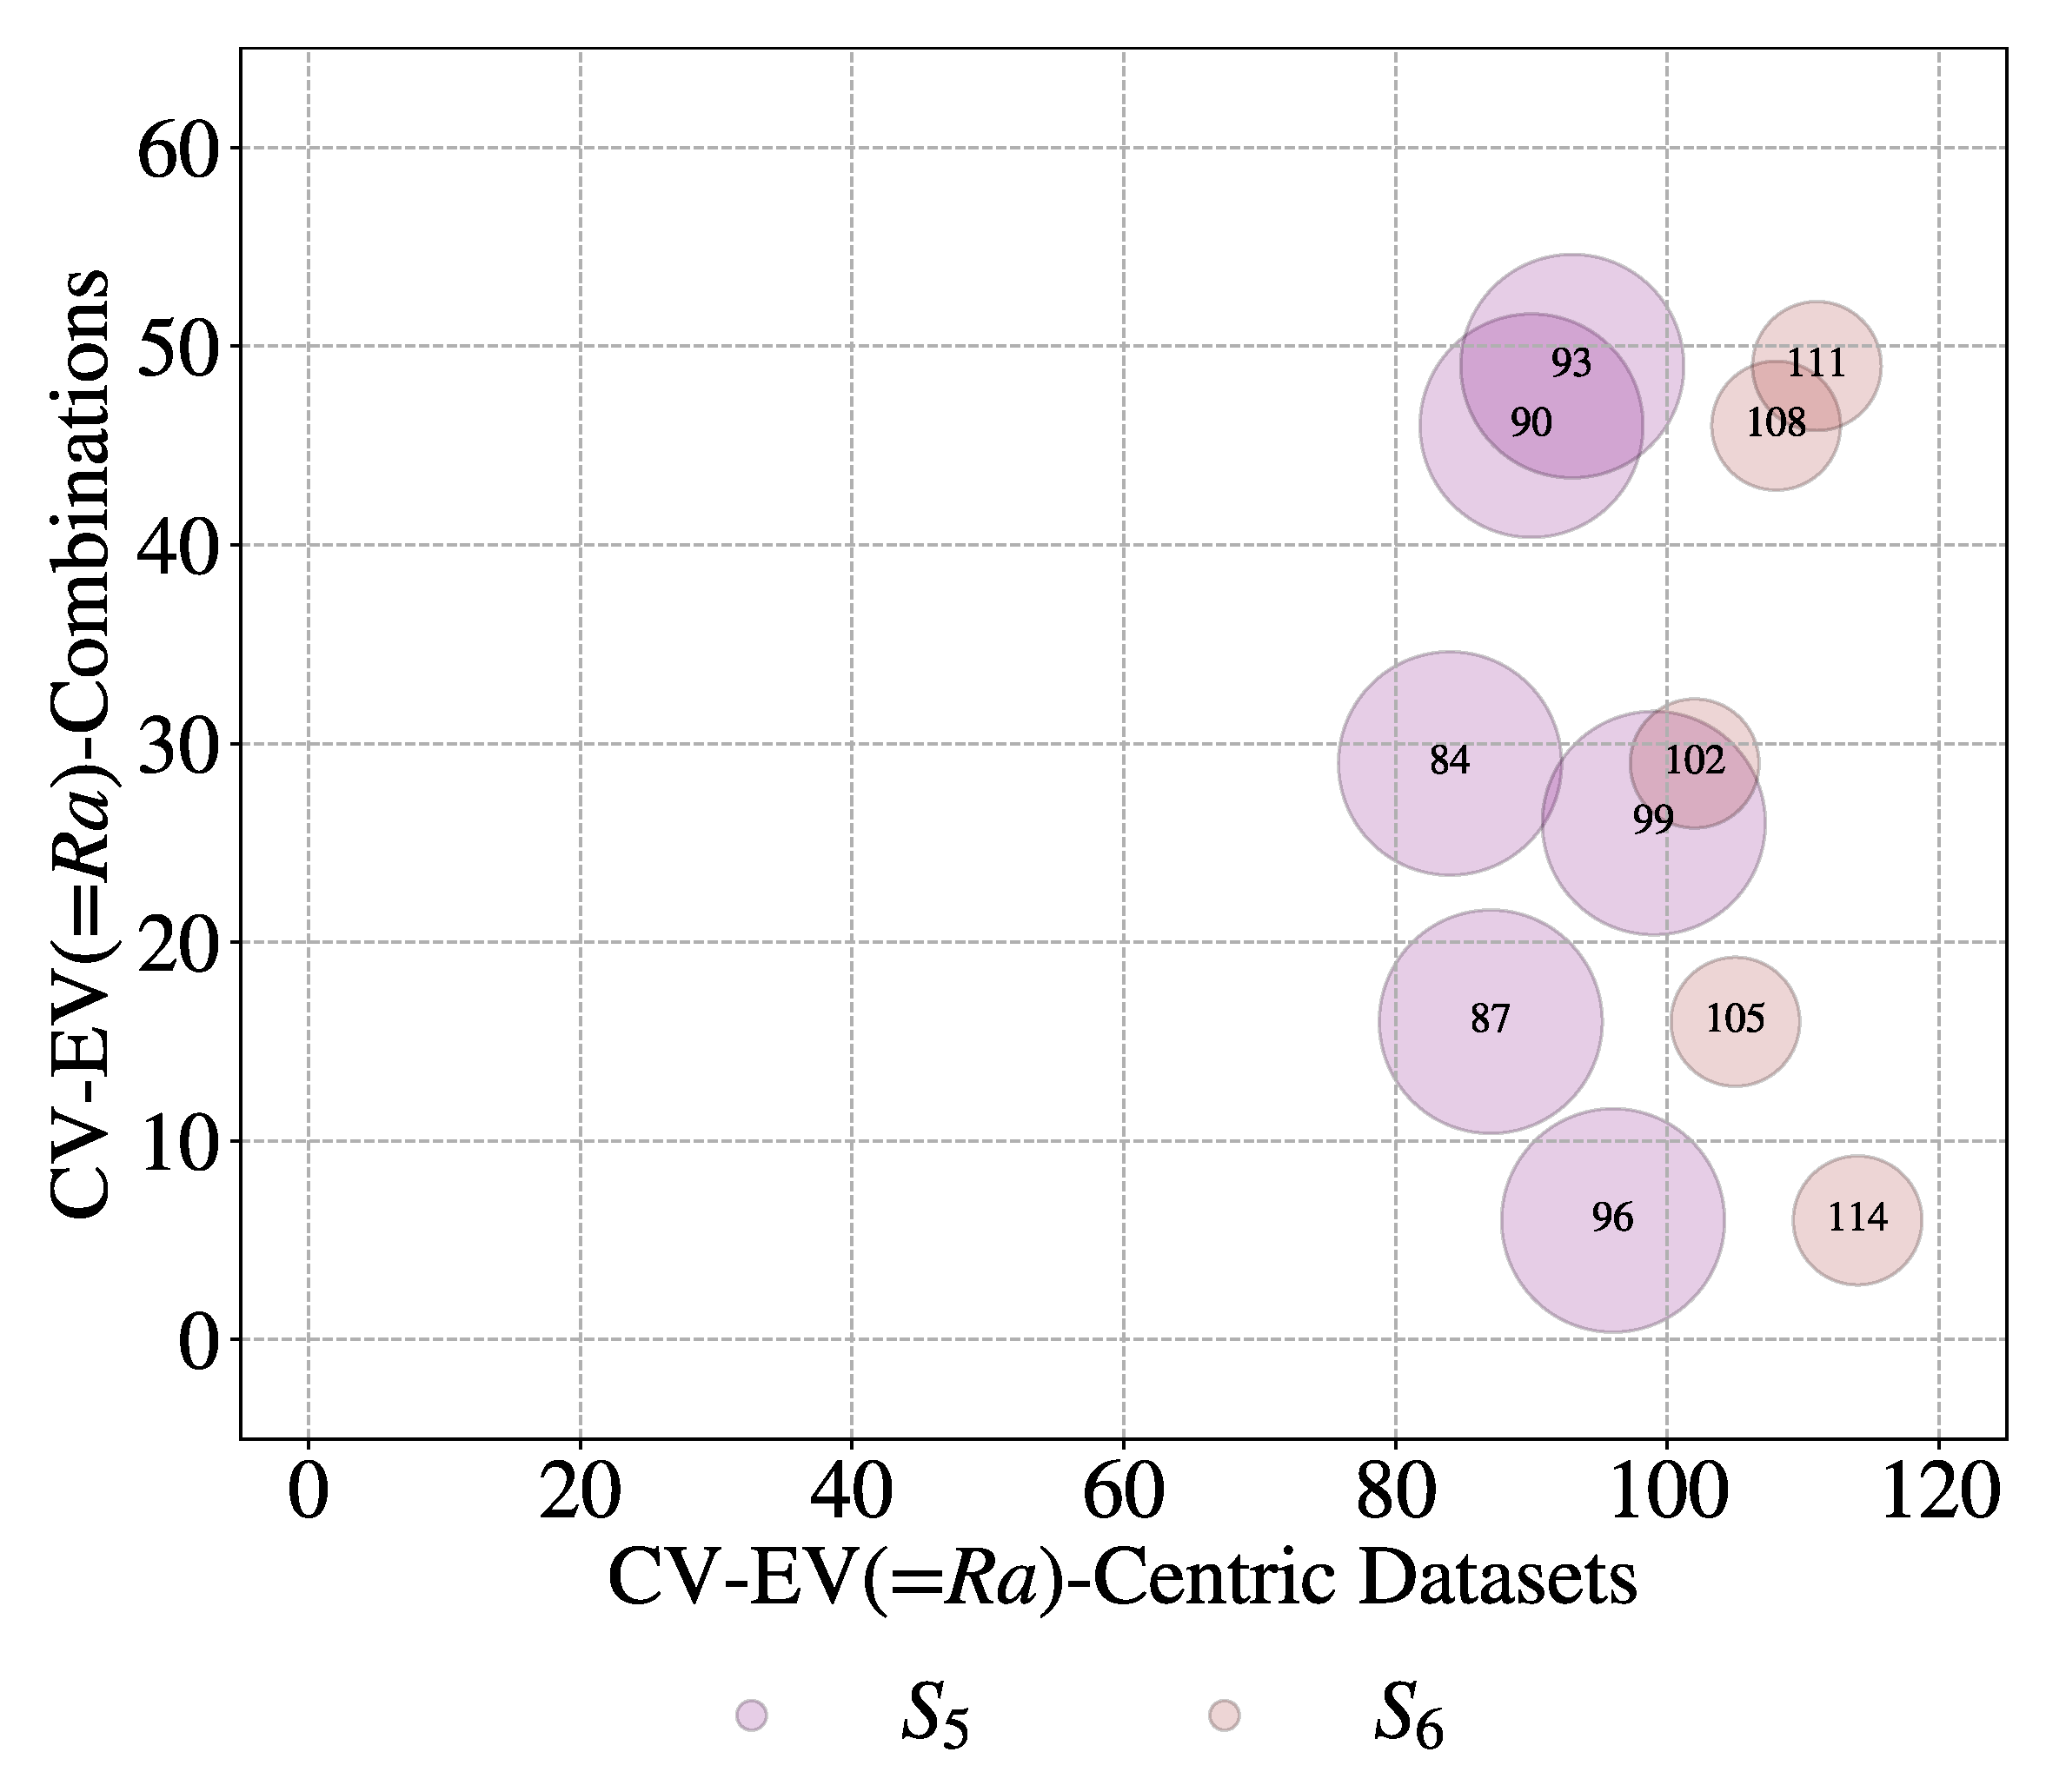
Figure 15. Lastly, consider the
EV called surface roughness measured by the arithmetic average of roughness profile height deviations from the mean line (
Ra). In this case, only two sources (
S5 and
S6) provide 11 datasets from six unique combinations of
CV-
EV, as shown in
Figure 17. This means that a great deal of heterogeneity persists among the datasets, exhibiting some of the characteristics of BD. The author assumes that the heterogeneity level may remain unchanged even though more sources are considered.
However, when the utility of BD is considered, the characteristics of the validity and value become critical, i.e., whether or not trustworthy knowledge can be extracted to solve problems using the relevant segment of BD. In this particular case, the relationships among
CVs and
EVs serves as the primary knowledge. must be quantified. The relationships are established by using the tools available in the system called the Data Analysis System (
Figure 12). The tools must be used keeping in mind that there are some computational complexities, as schematically illustrated in
Figure 5. Since datasets are collected from multiple sources, source-by-source analysis is a good idea. Otherwise, uncertainty, inconsistency, and other computational complexities cannot be handled with the required transparency and accuracy.
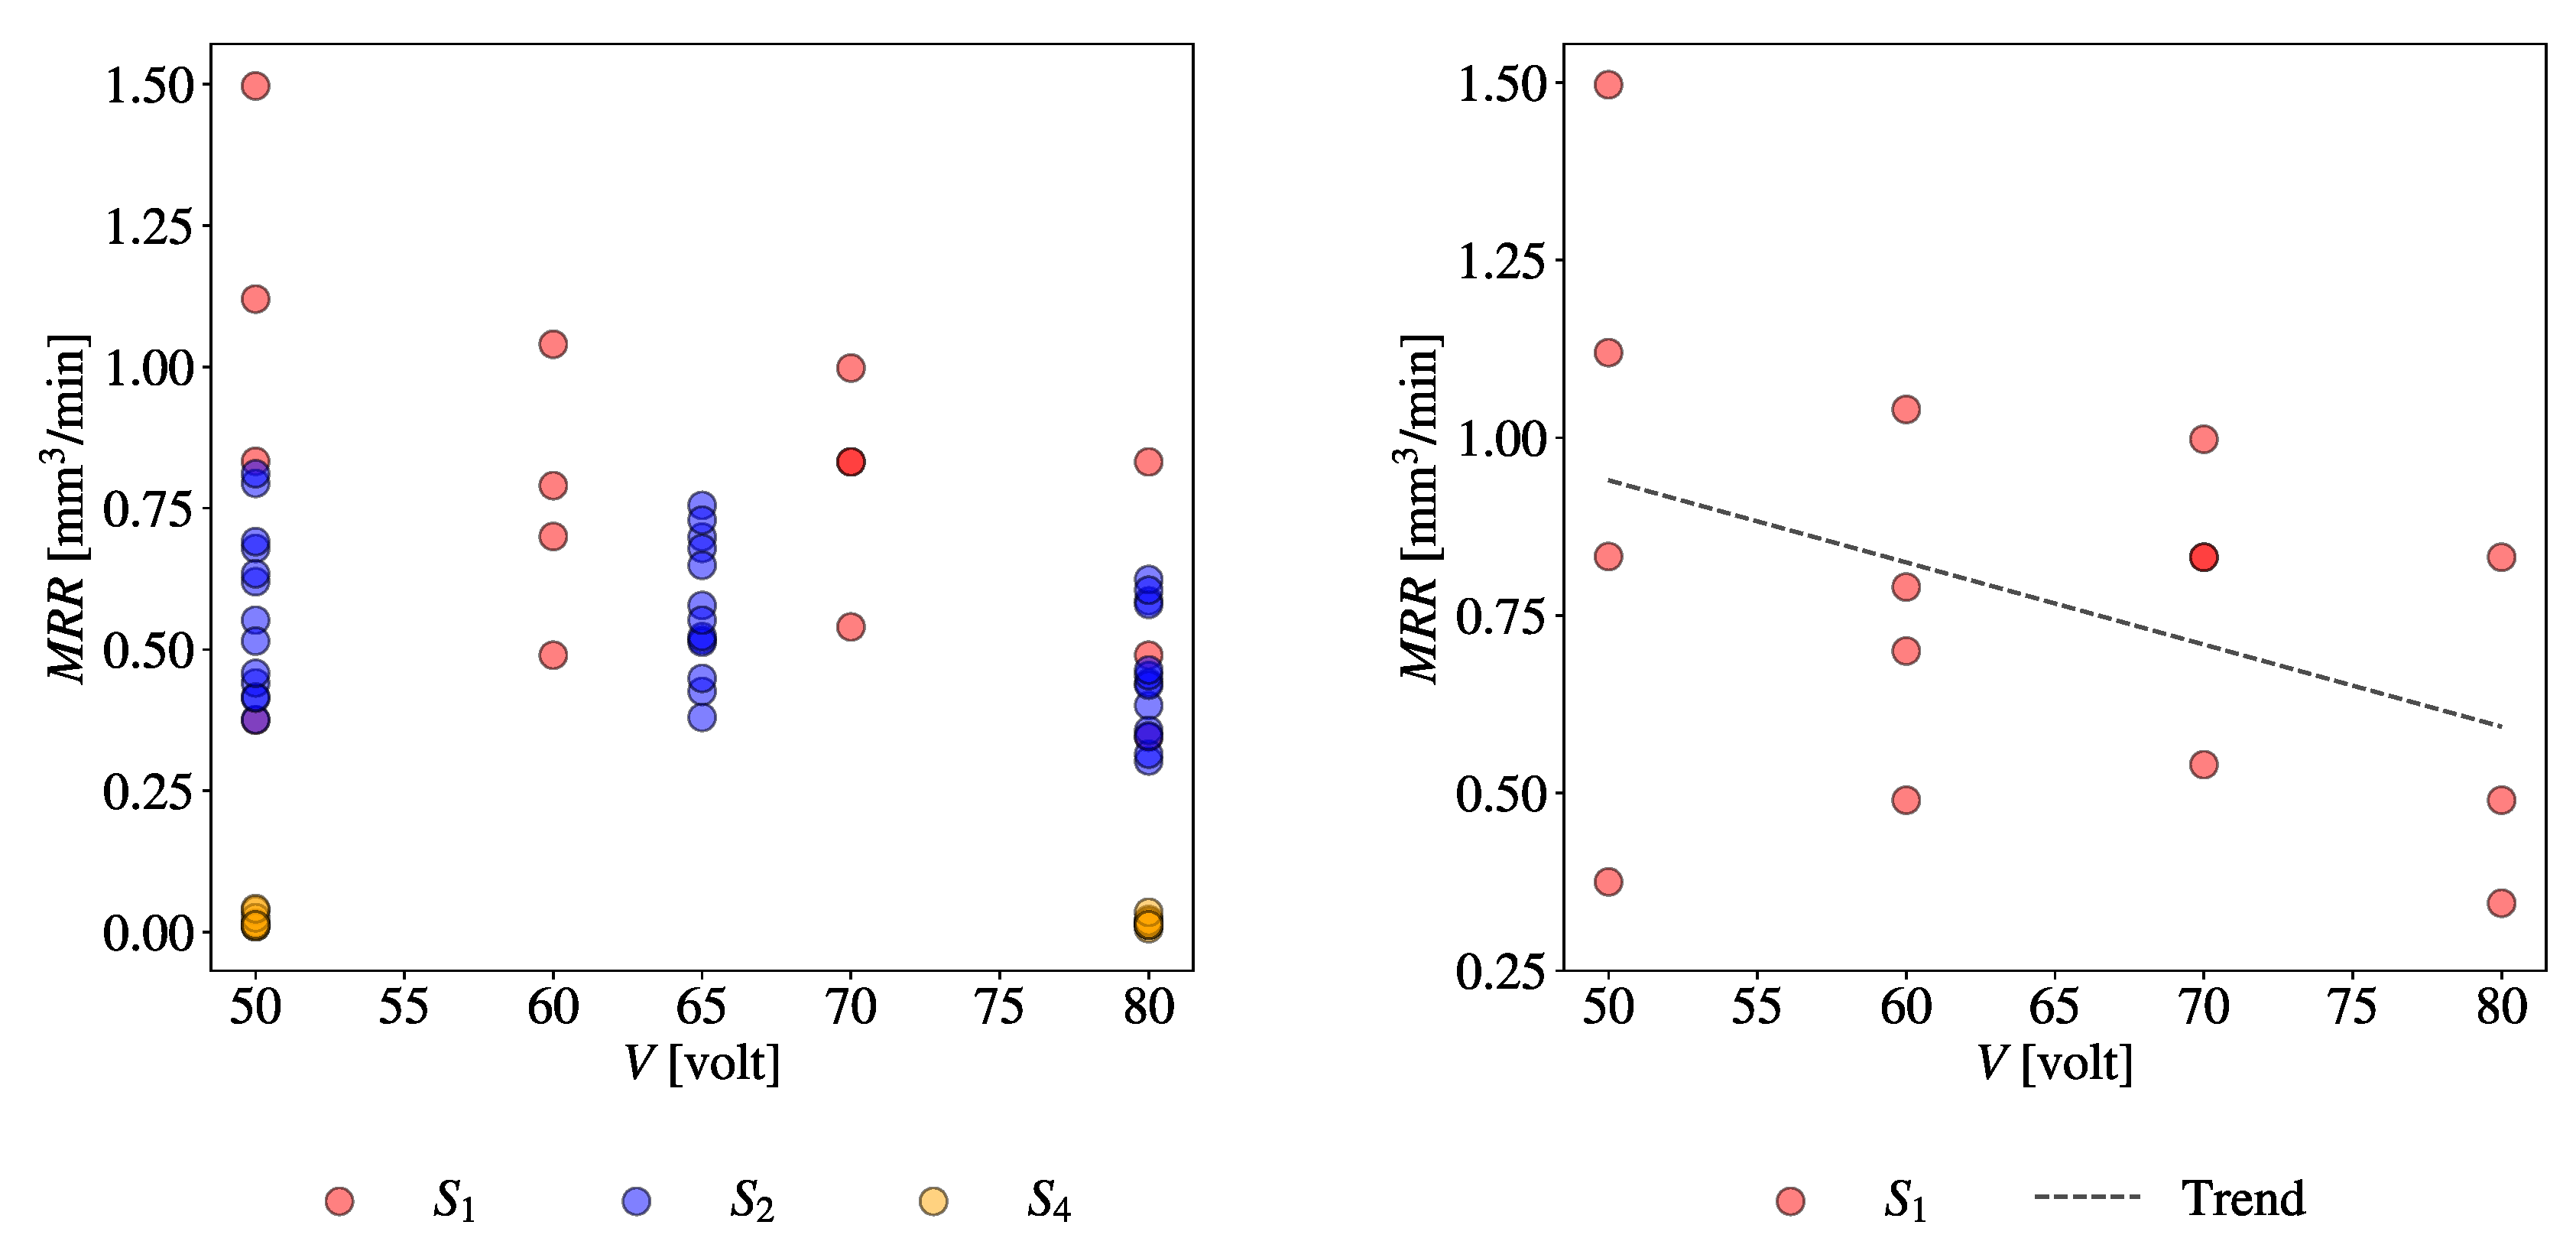
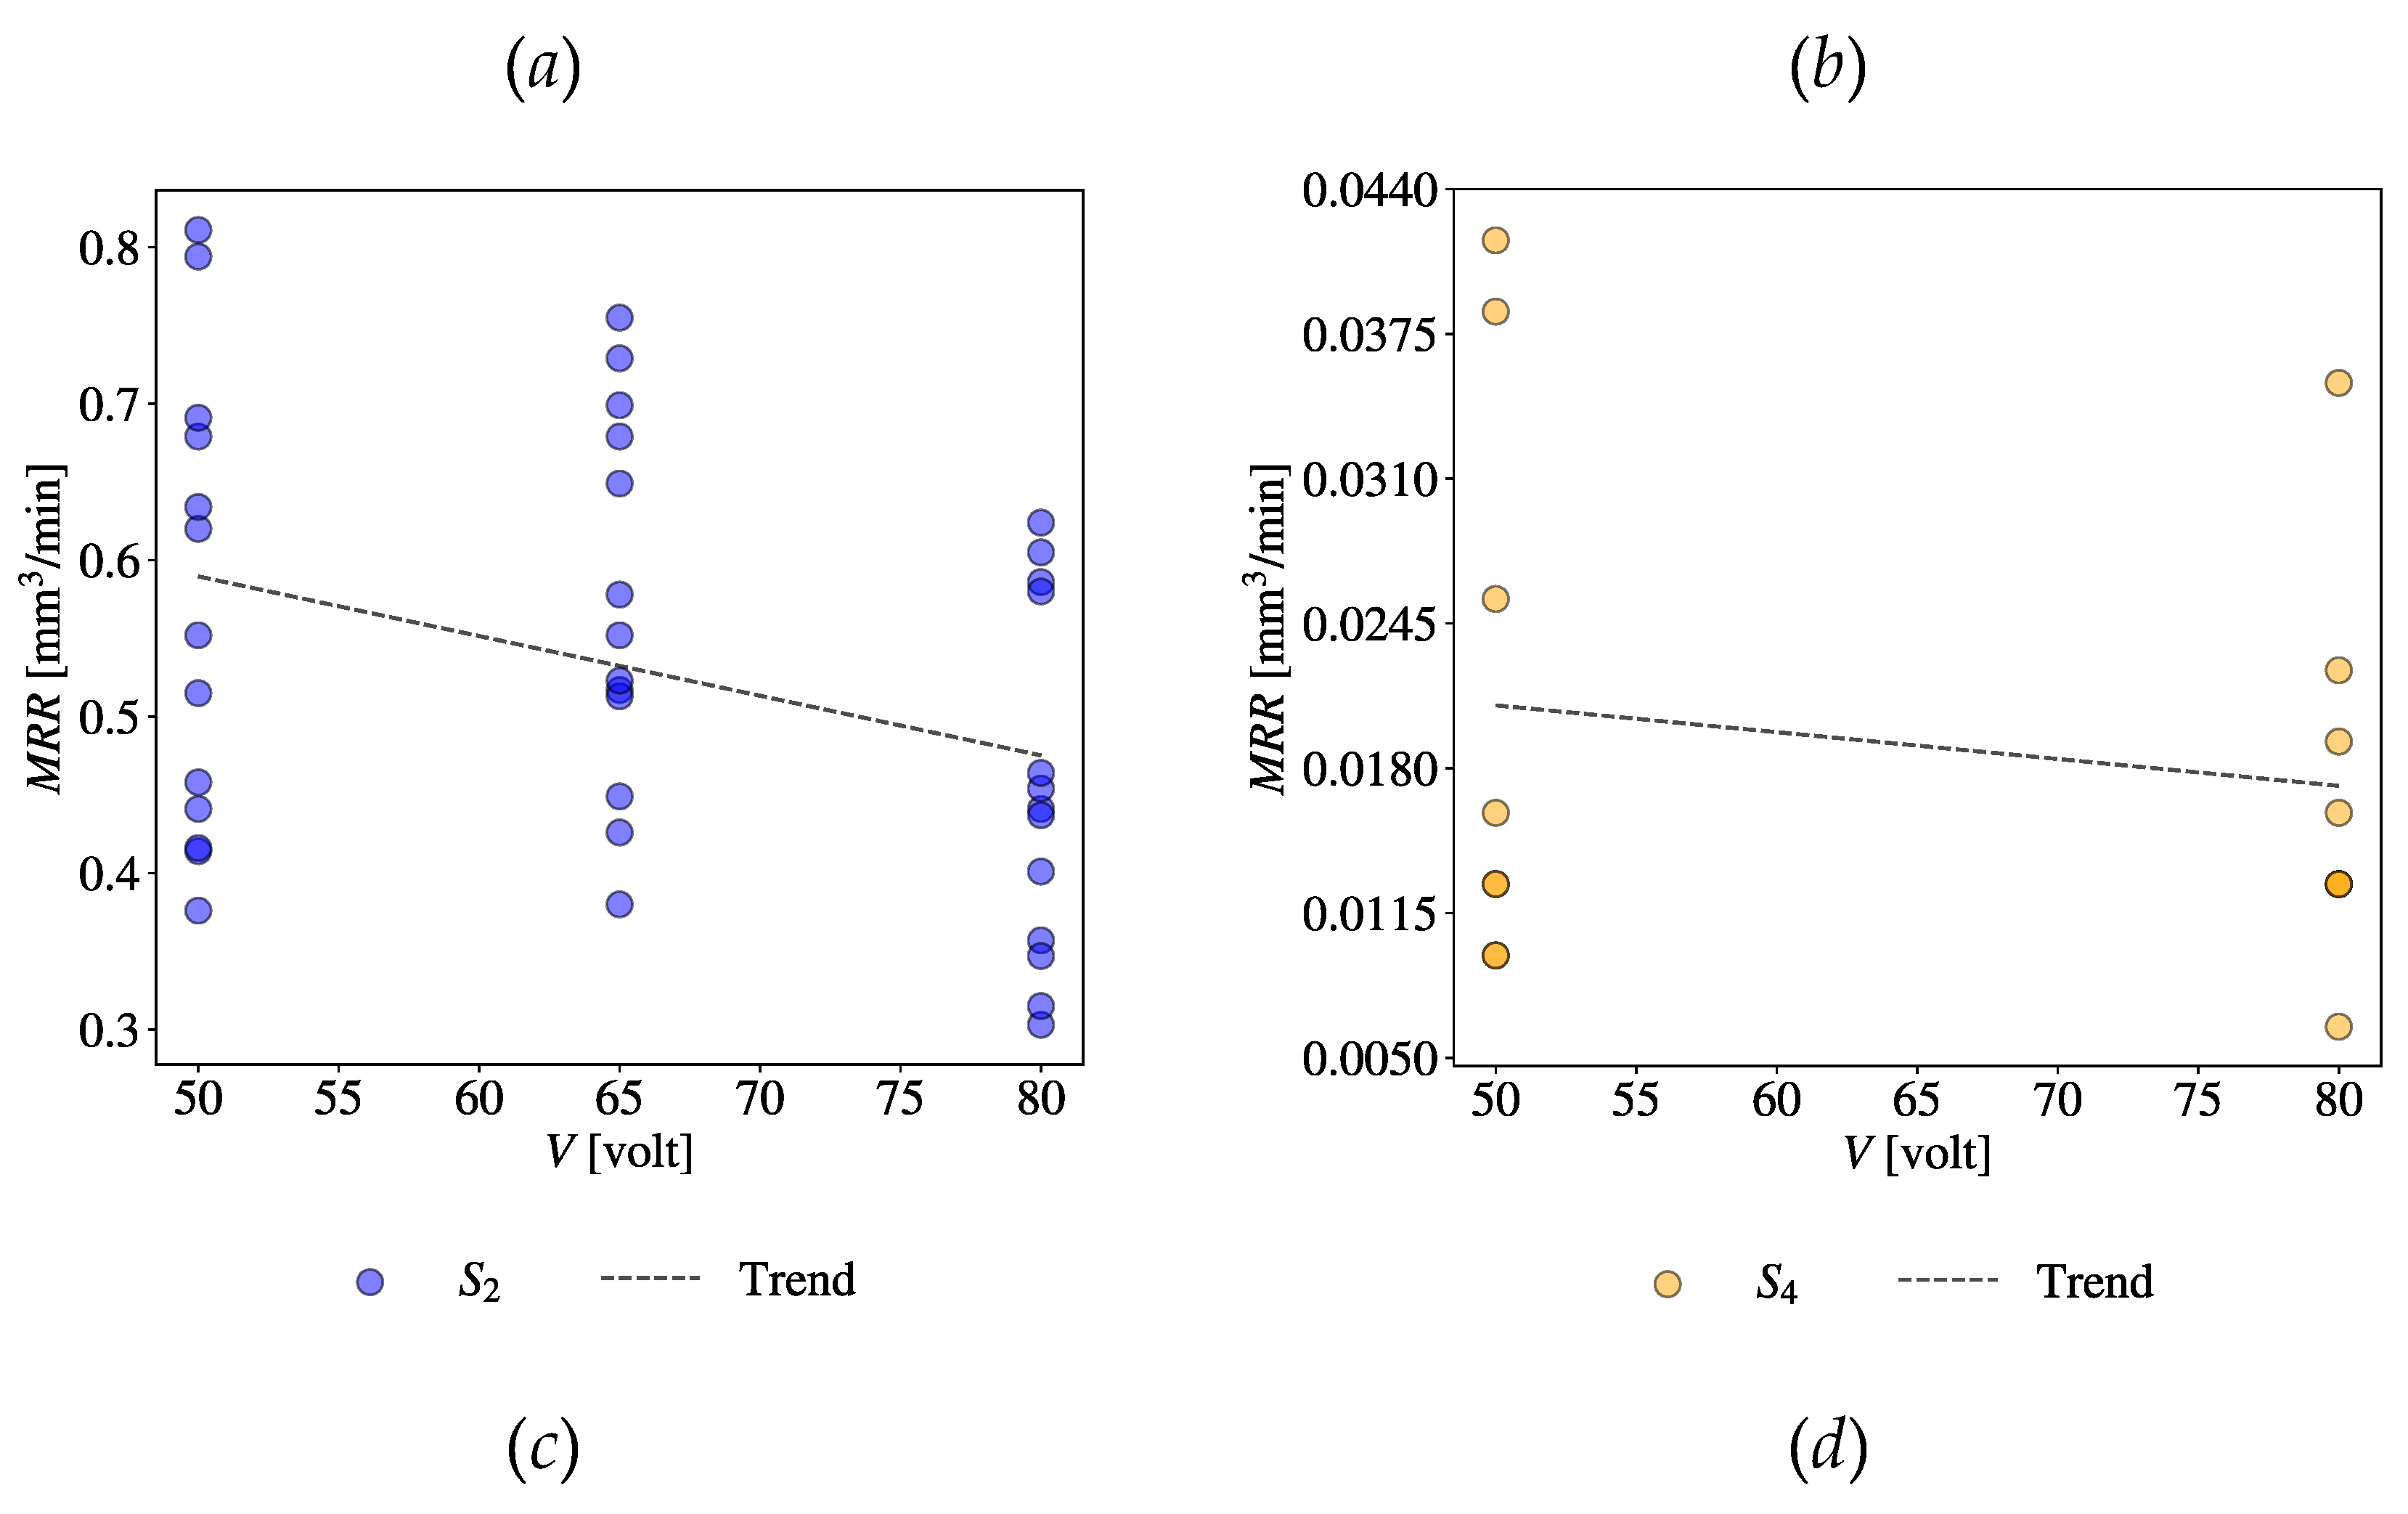
For example, consider the combination (
CV = Gap Voltage (
V),
EV =
MRR).
Figure 18(
a) shows a scatter plot of all relevant datasets taken from
S1,
S2, and
S4.
Figure 18(
b)-(
d) show the scatter plots of relevant datasets taken from individual sources,
S1,
S2, and
S4, respectively. The trend lines are also shown in the respective plots. As seen in
Figure 18(
b)-(
d), even though a consistent trend exists across the sources, a huge amount of uncertainty persists, as well. It is worth mentioning that the values of
MRR are not consistent across the sources (compare the plots in
Figure 18(
b)-(
d)).
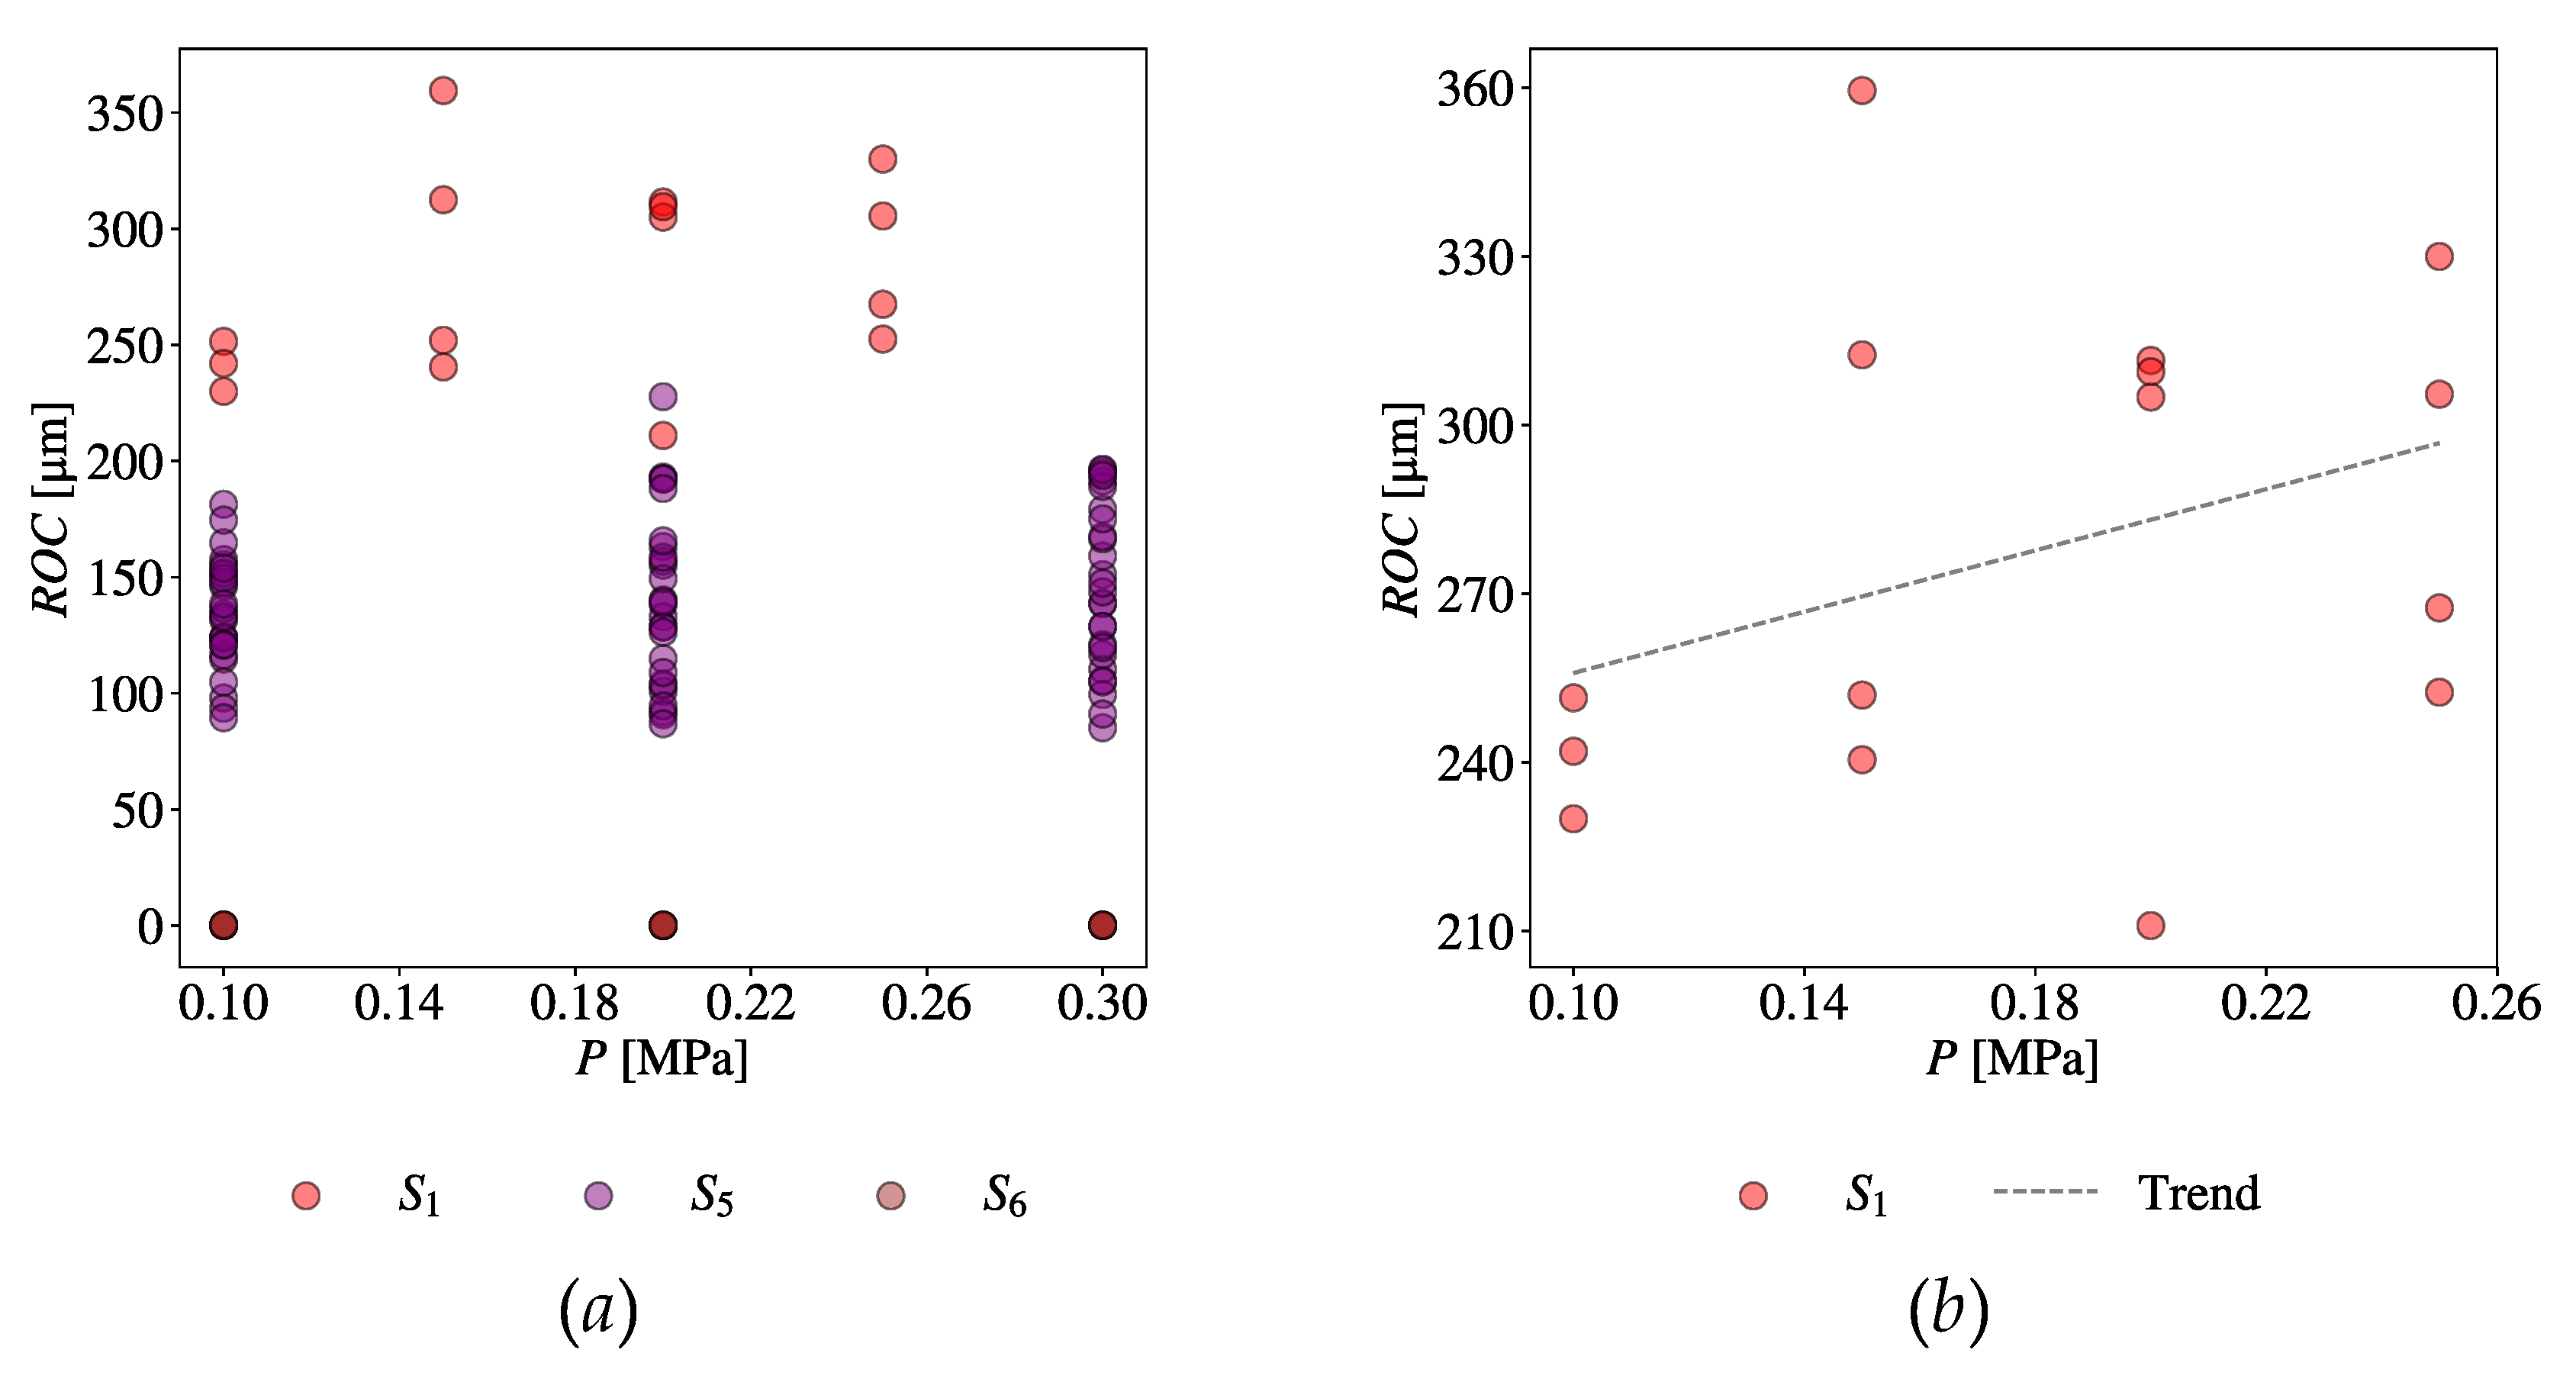
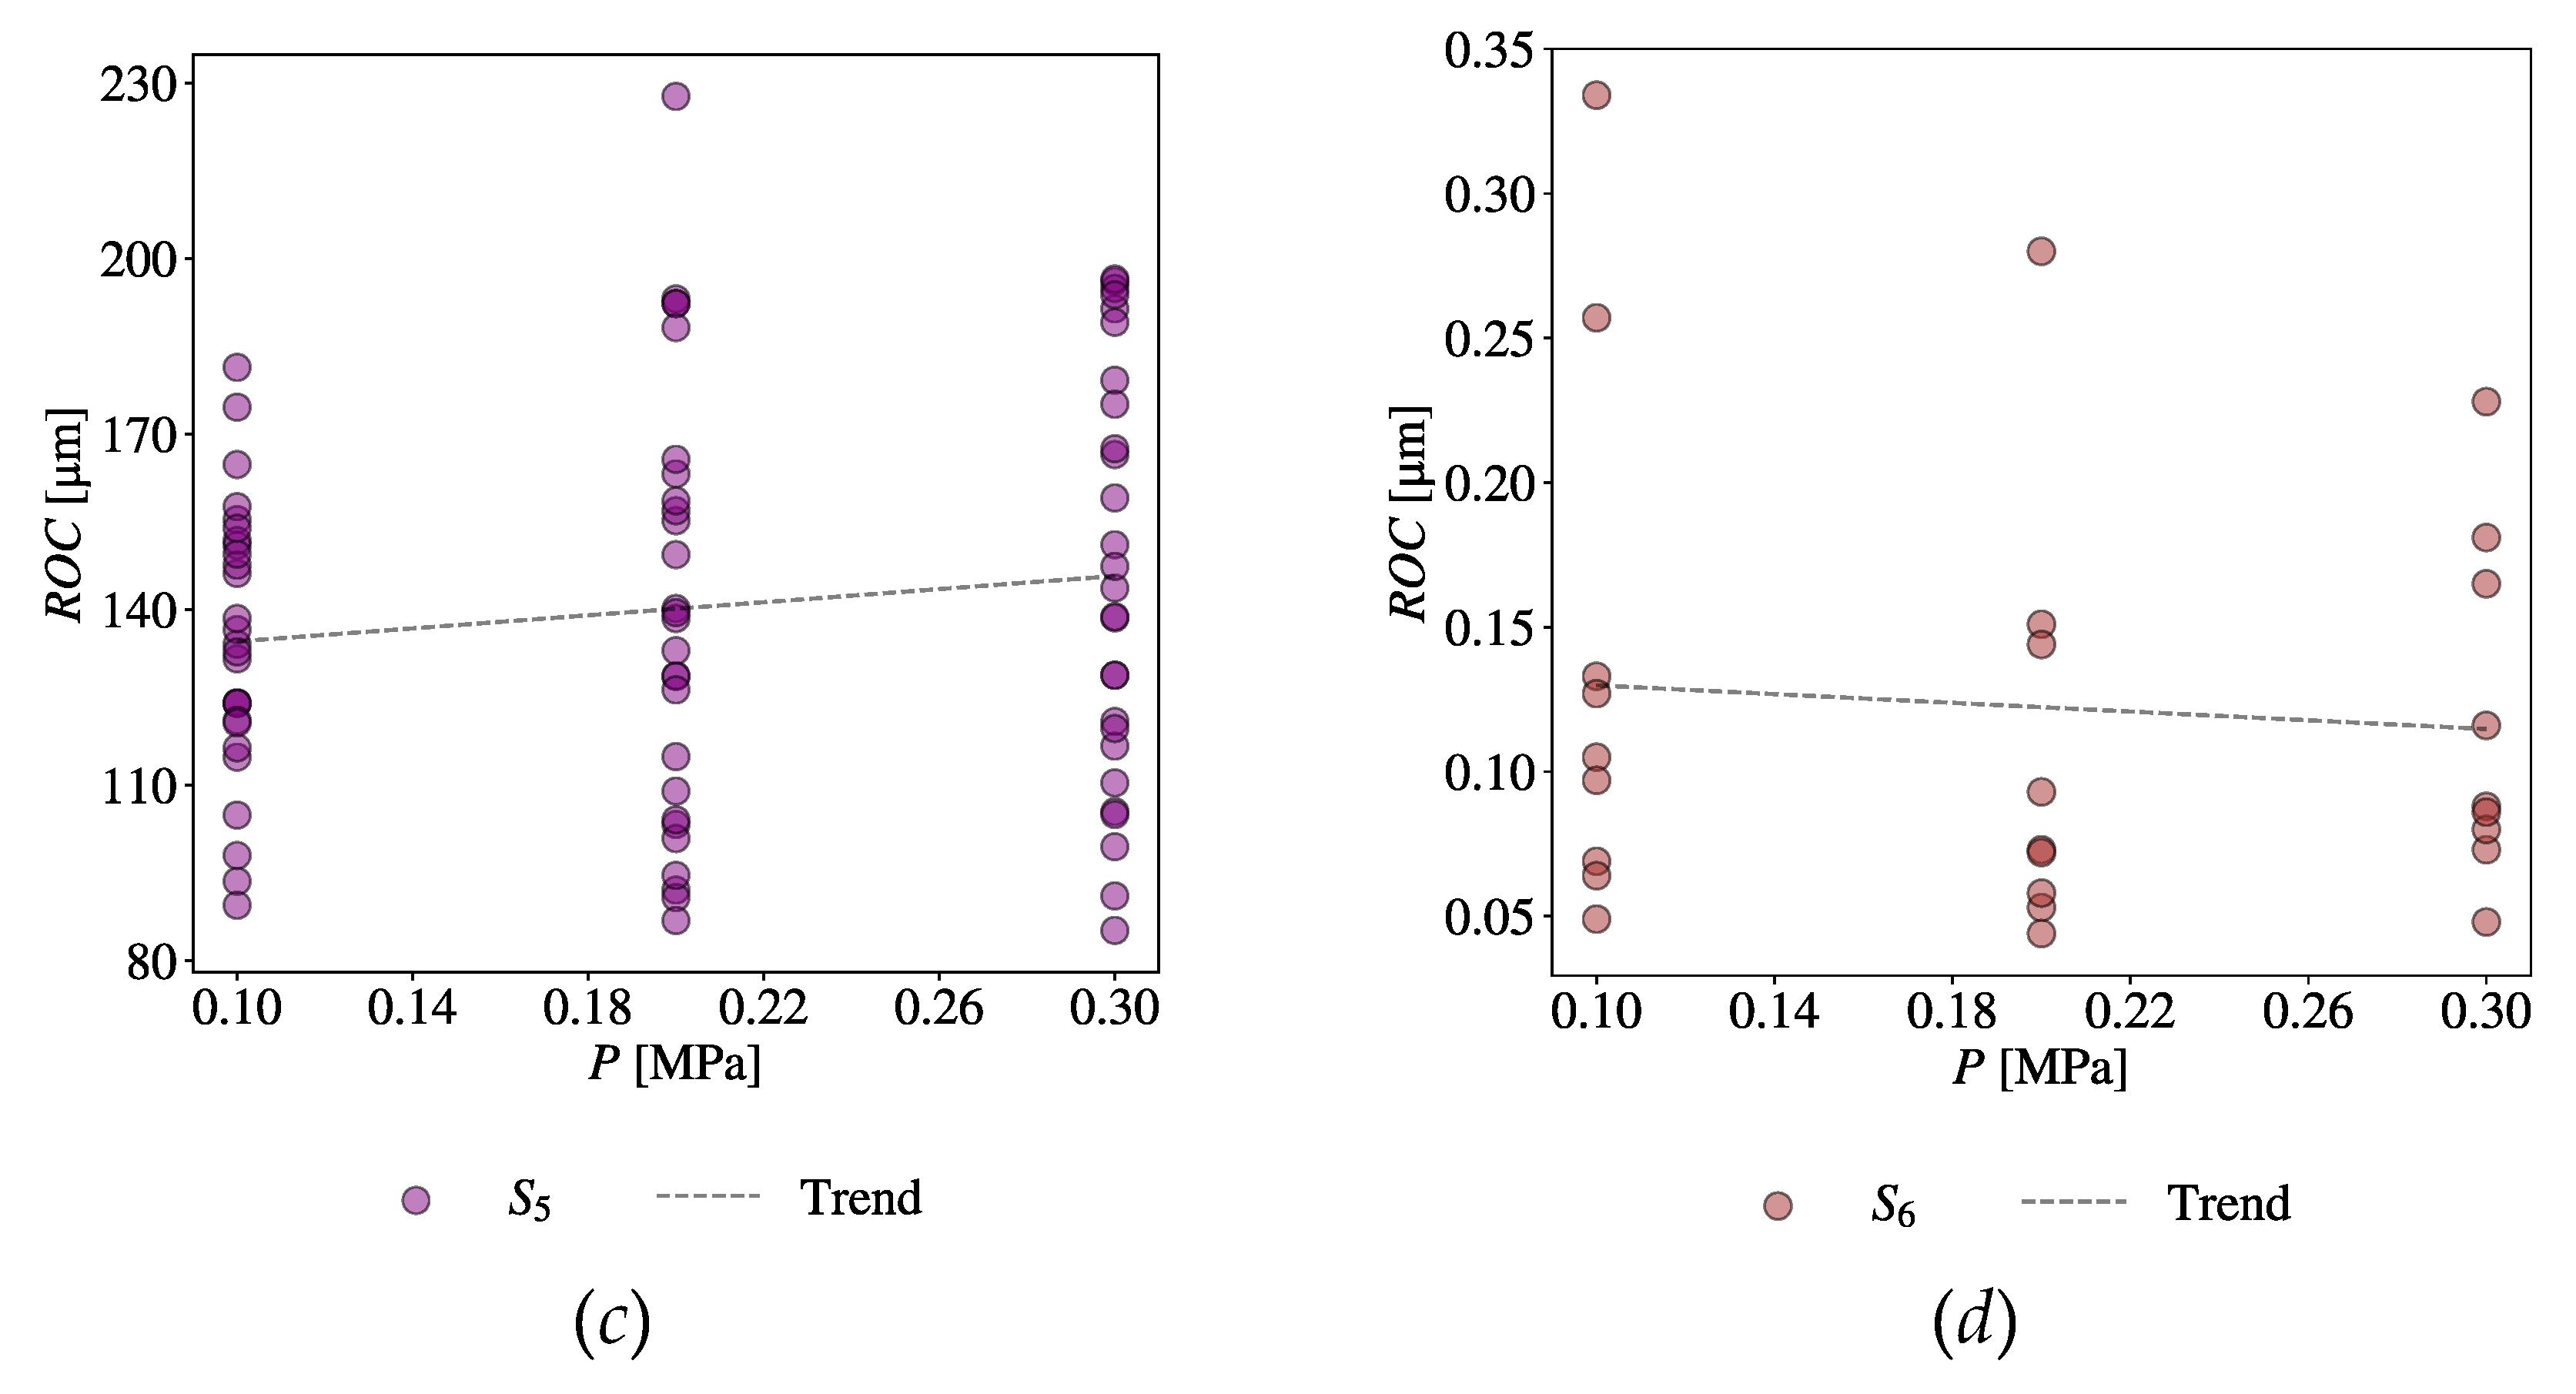
Lastly, consider the
CV-
EV combination of Gas Pressure (
P) and Radial Over Cut (
ROC).
Figure 19(
a) shows a scatter plot of all relevant datasets taken from
S1,
S5, and
S6.
Figure 19(
b), (
c), and (
d) show the scatter plots of relevant datasets taken from individual sources,
S1,
S5, and
S6, respectively. The trend lines are also shown in the respective plots. As seen in
Figure 19(
b)-(
d), there is an inconsistency in the trend;
S6 exhibits a different trend than the others. Moreover, the values of
ROC of
S6 are significantly different than those of others. Similar to the previous case, a huge amount of uncertainty persists here, too.
A personalized Knowledge Extraction System (KES) is developed using spreadsheet applications, keeping the computational complexity described above in mind. The system uses the relationships among
CVs and
EVs found in the previous system and determines the right set of
CVs to achieve a given objective (e.g., maximizing
MRR). The results regarding the optimization of
MRR are reported below.
Table 2 reports the values of correlation coefficient (
R) (denoted as
R) in the interval [-1,1]. The values of
R are calculated for both options, Correlation Analysis (CA) and Uncertainty Analysis (UA), for all possible
CV-
EV combinations (
Table 1). The remarkable thing is that
S4 is kept aside because
CVs have only two states. As a result, Correlation Analysis (CA) and Uncertainty Analysis (UA) produce only two points for each
CV-
EV combination, and, thereby,
R = -1 or 1. Thus, including these kinds of datasets may produce a misleading conclusion.
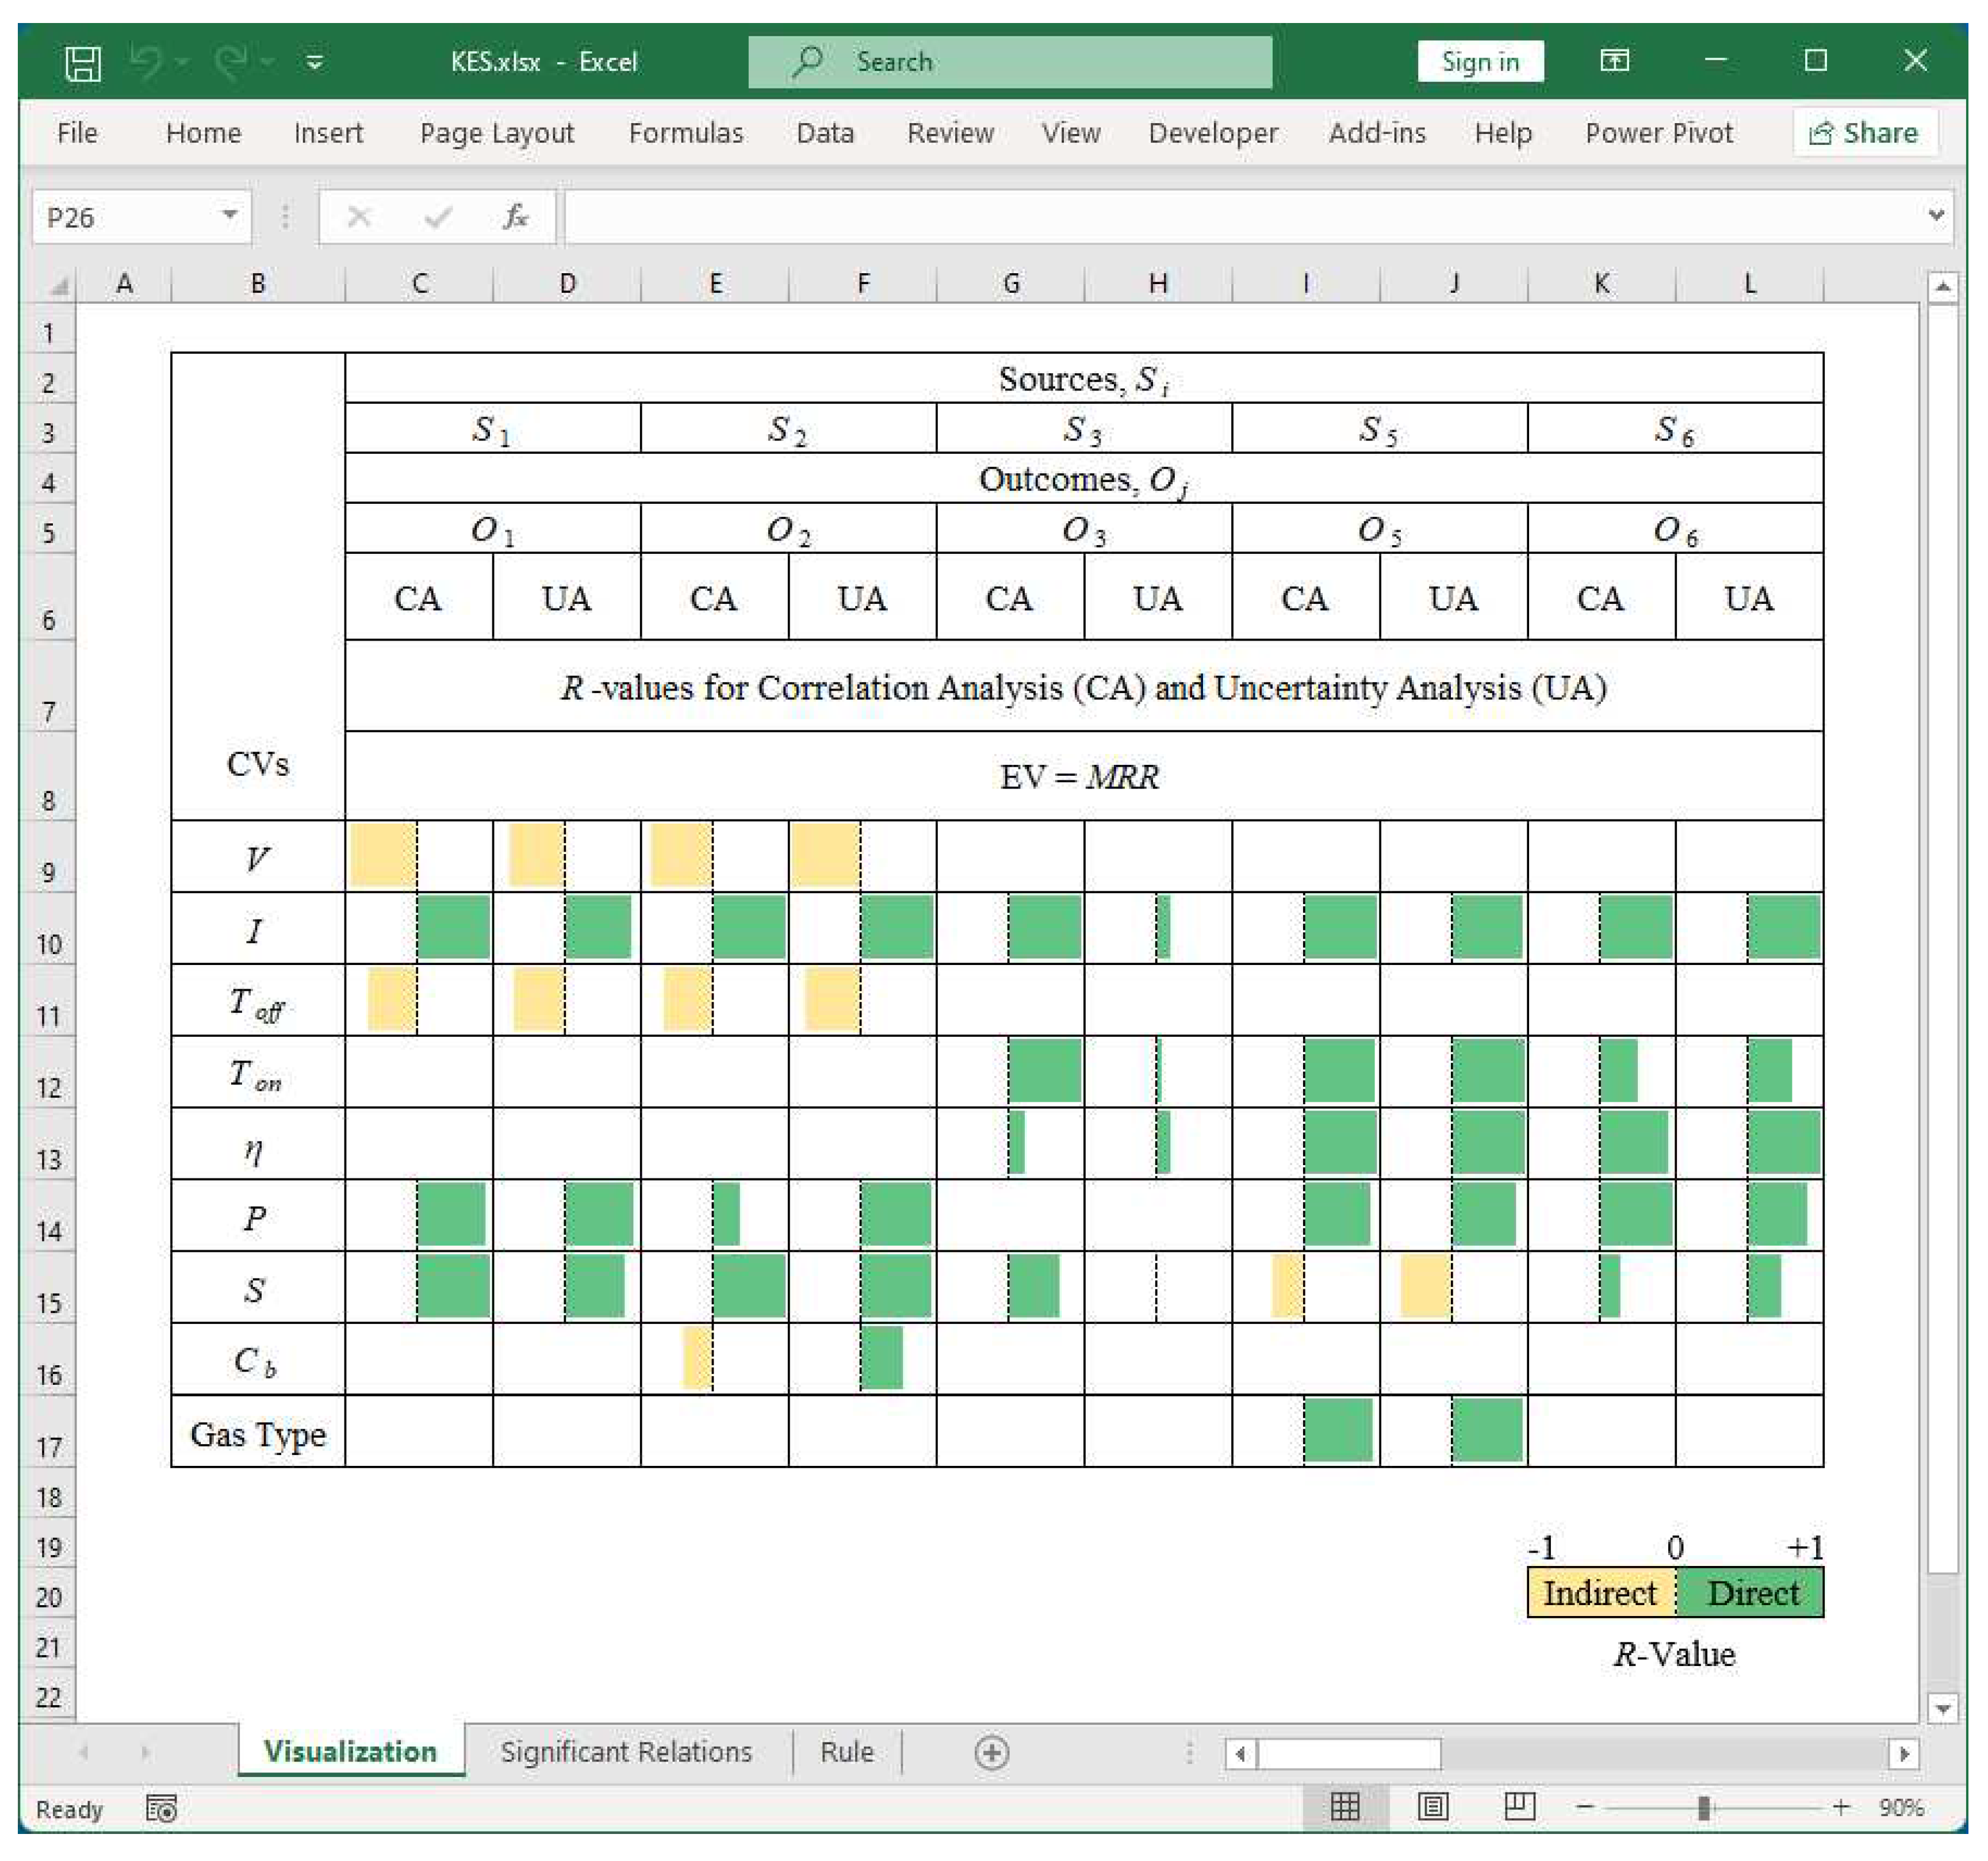
The degree of correlation (given by
R values) is visualized using an Excel™-based system, as shown in
Figure 20. Here, a green-colored box means the corresponding
CV-
EV pair maintains a direct or positive relationship, and a yellow-colored box means the corresponding
CV-
EV pair maintains an indirect or negative relationship. The length of the colored bar indicates the strength of
CV-
EV relationships. The longer the length, the stronger the relationship.
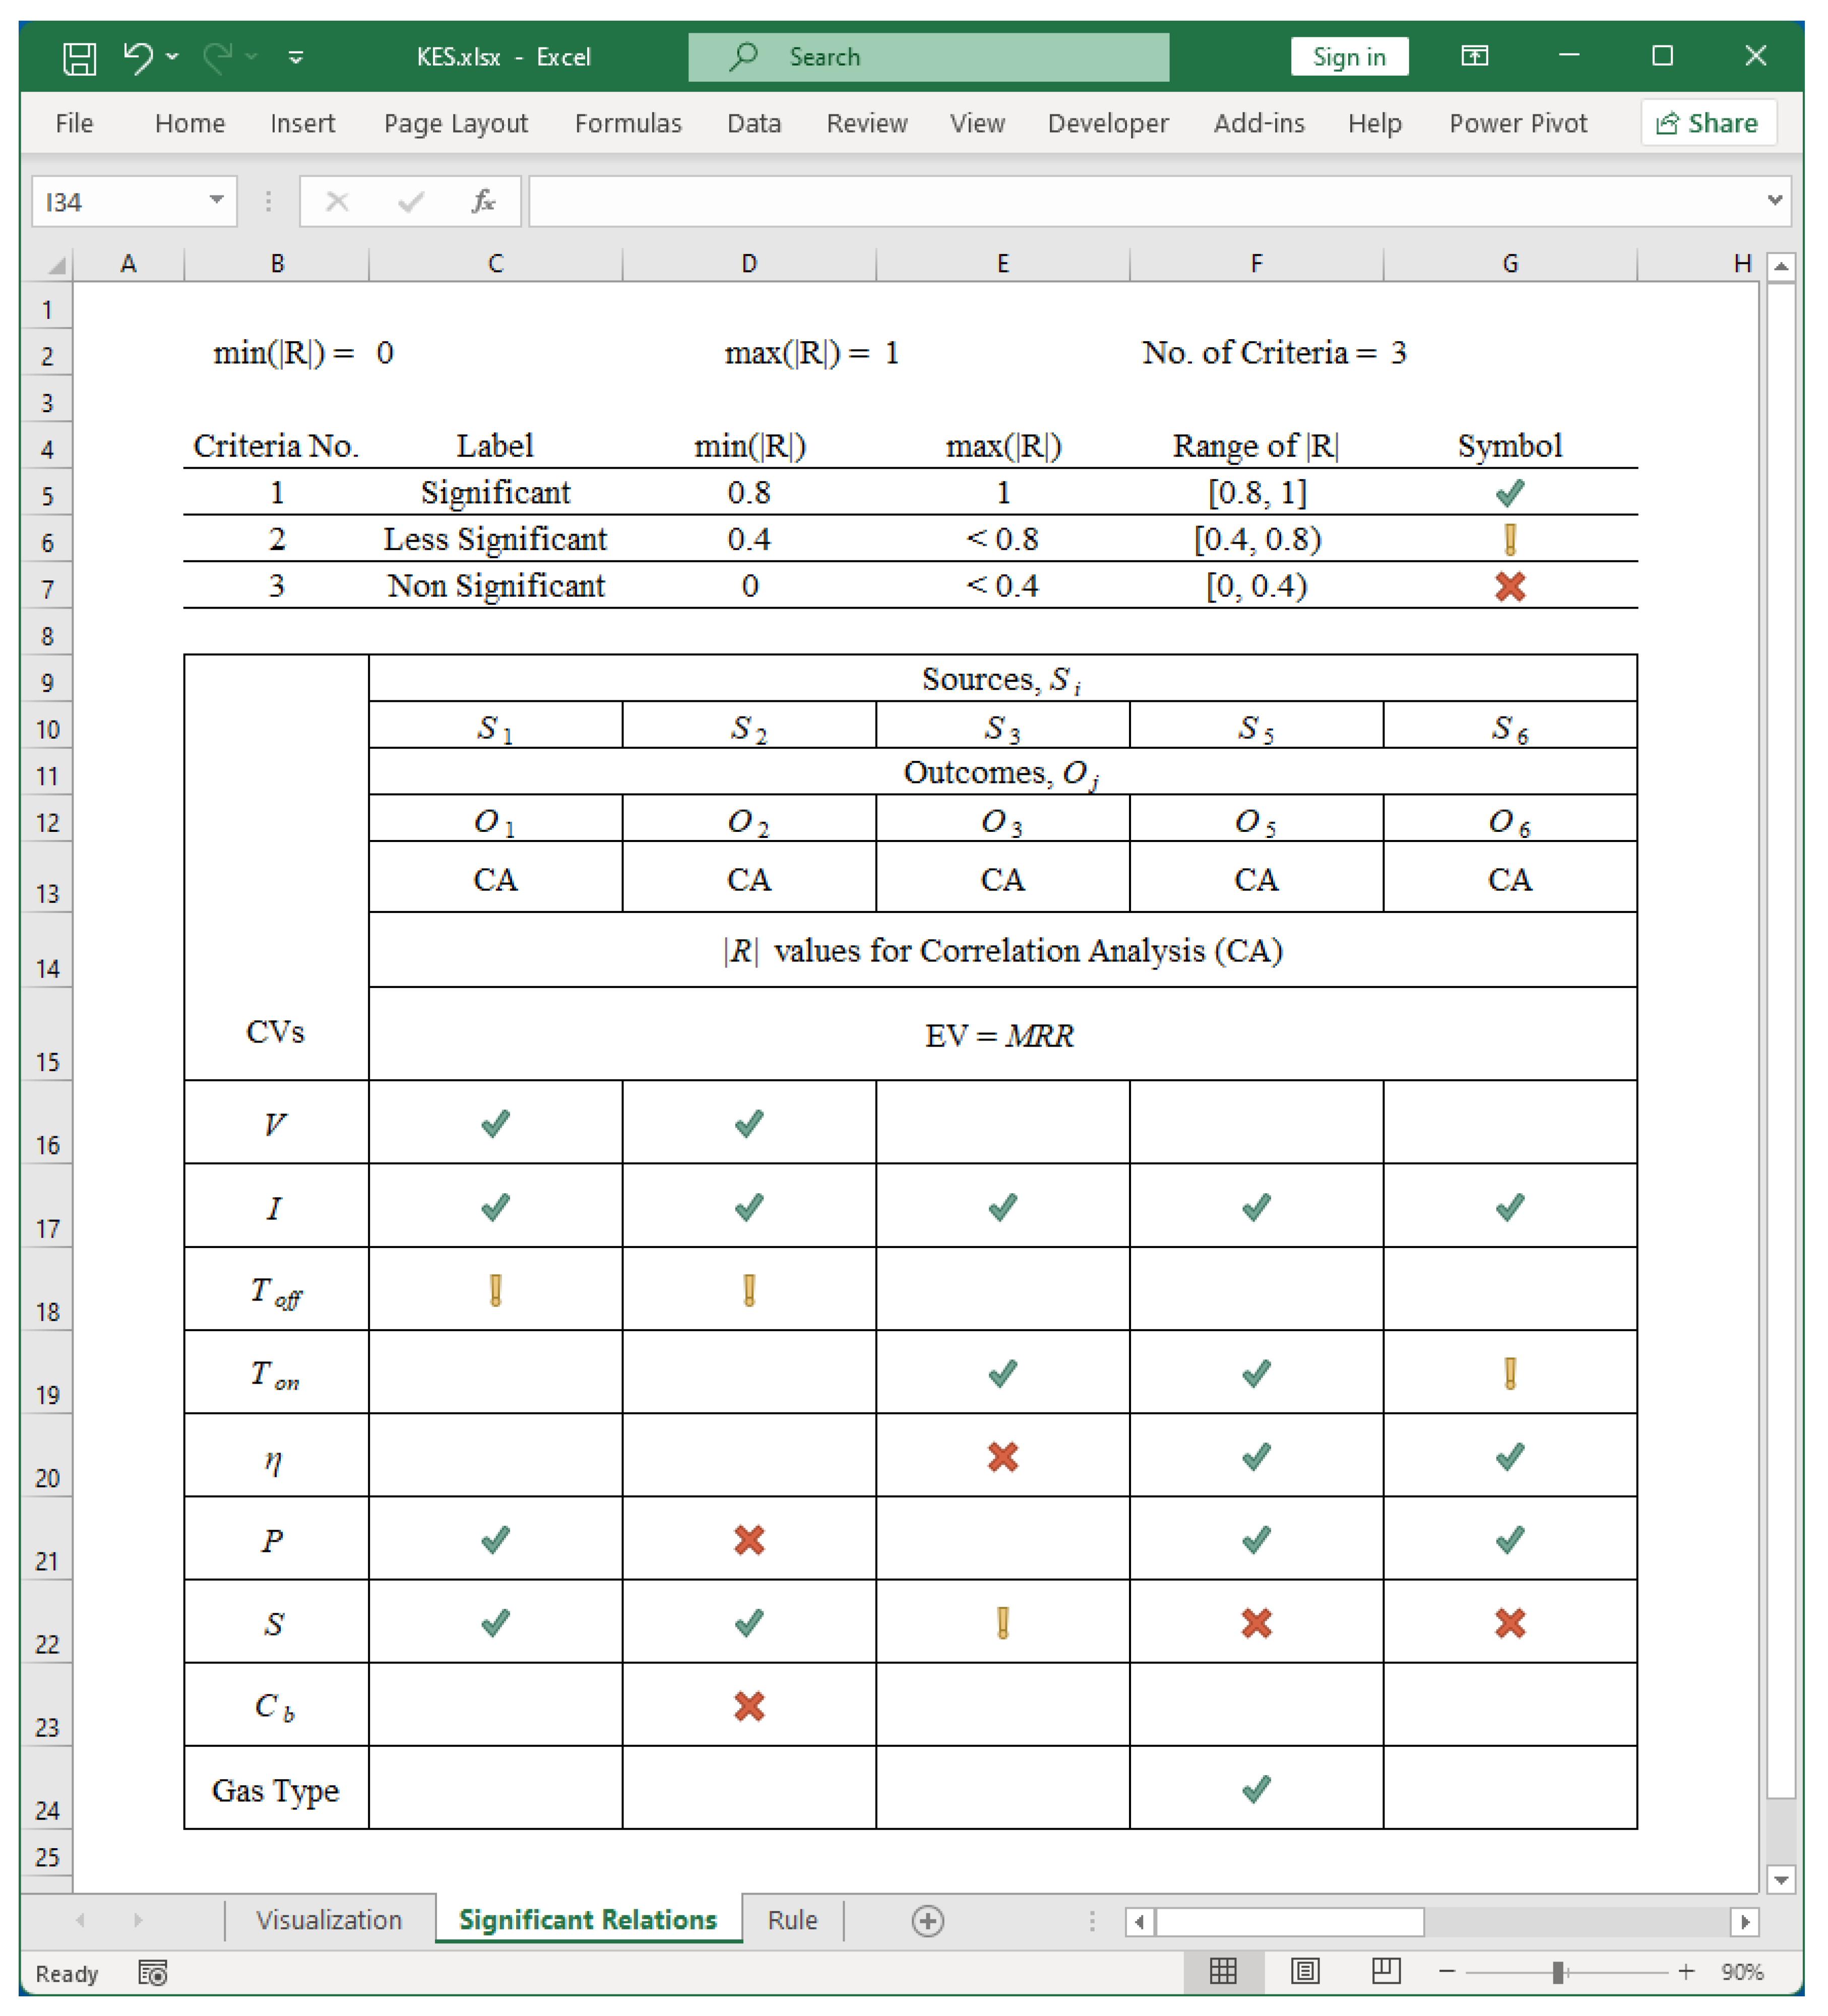
The absolute value of
R, i.e., |
R|, can be divided into few states to visualize more clearly the impact of the
CVs on the given
EV (this time
MRR). The results shown in
Figure 21 refer to three states, as follows: 1) |
R| ∈ [0.8, 1] means “significant,”2) |
R| ∈ [0.4, 0.8) means “less significant,” and 3) |
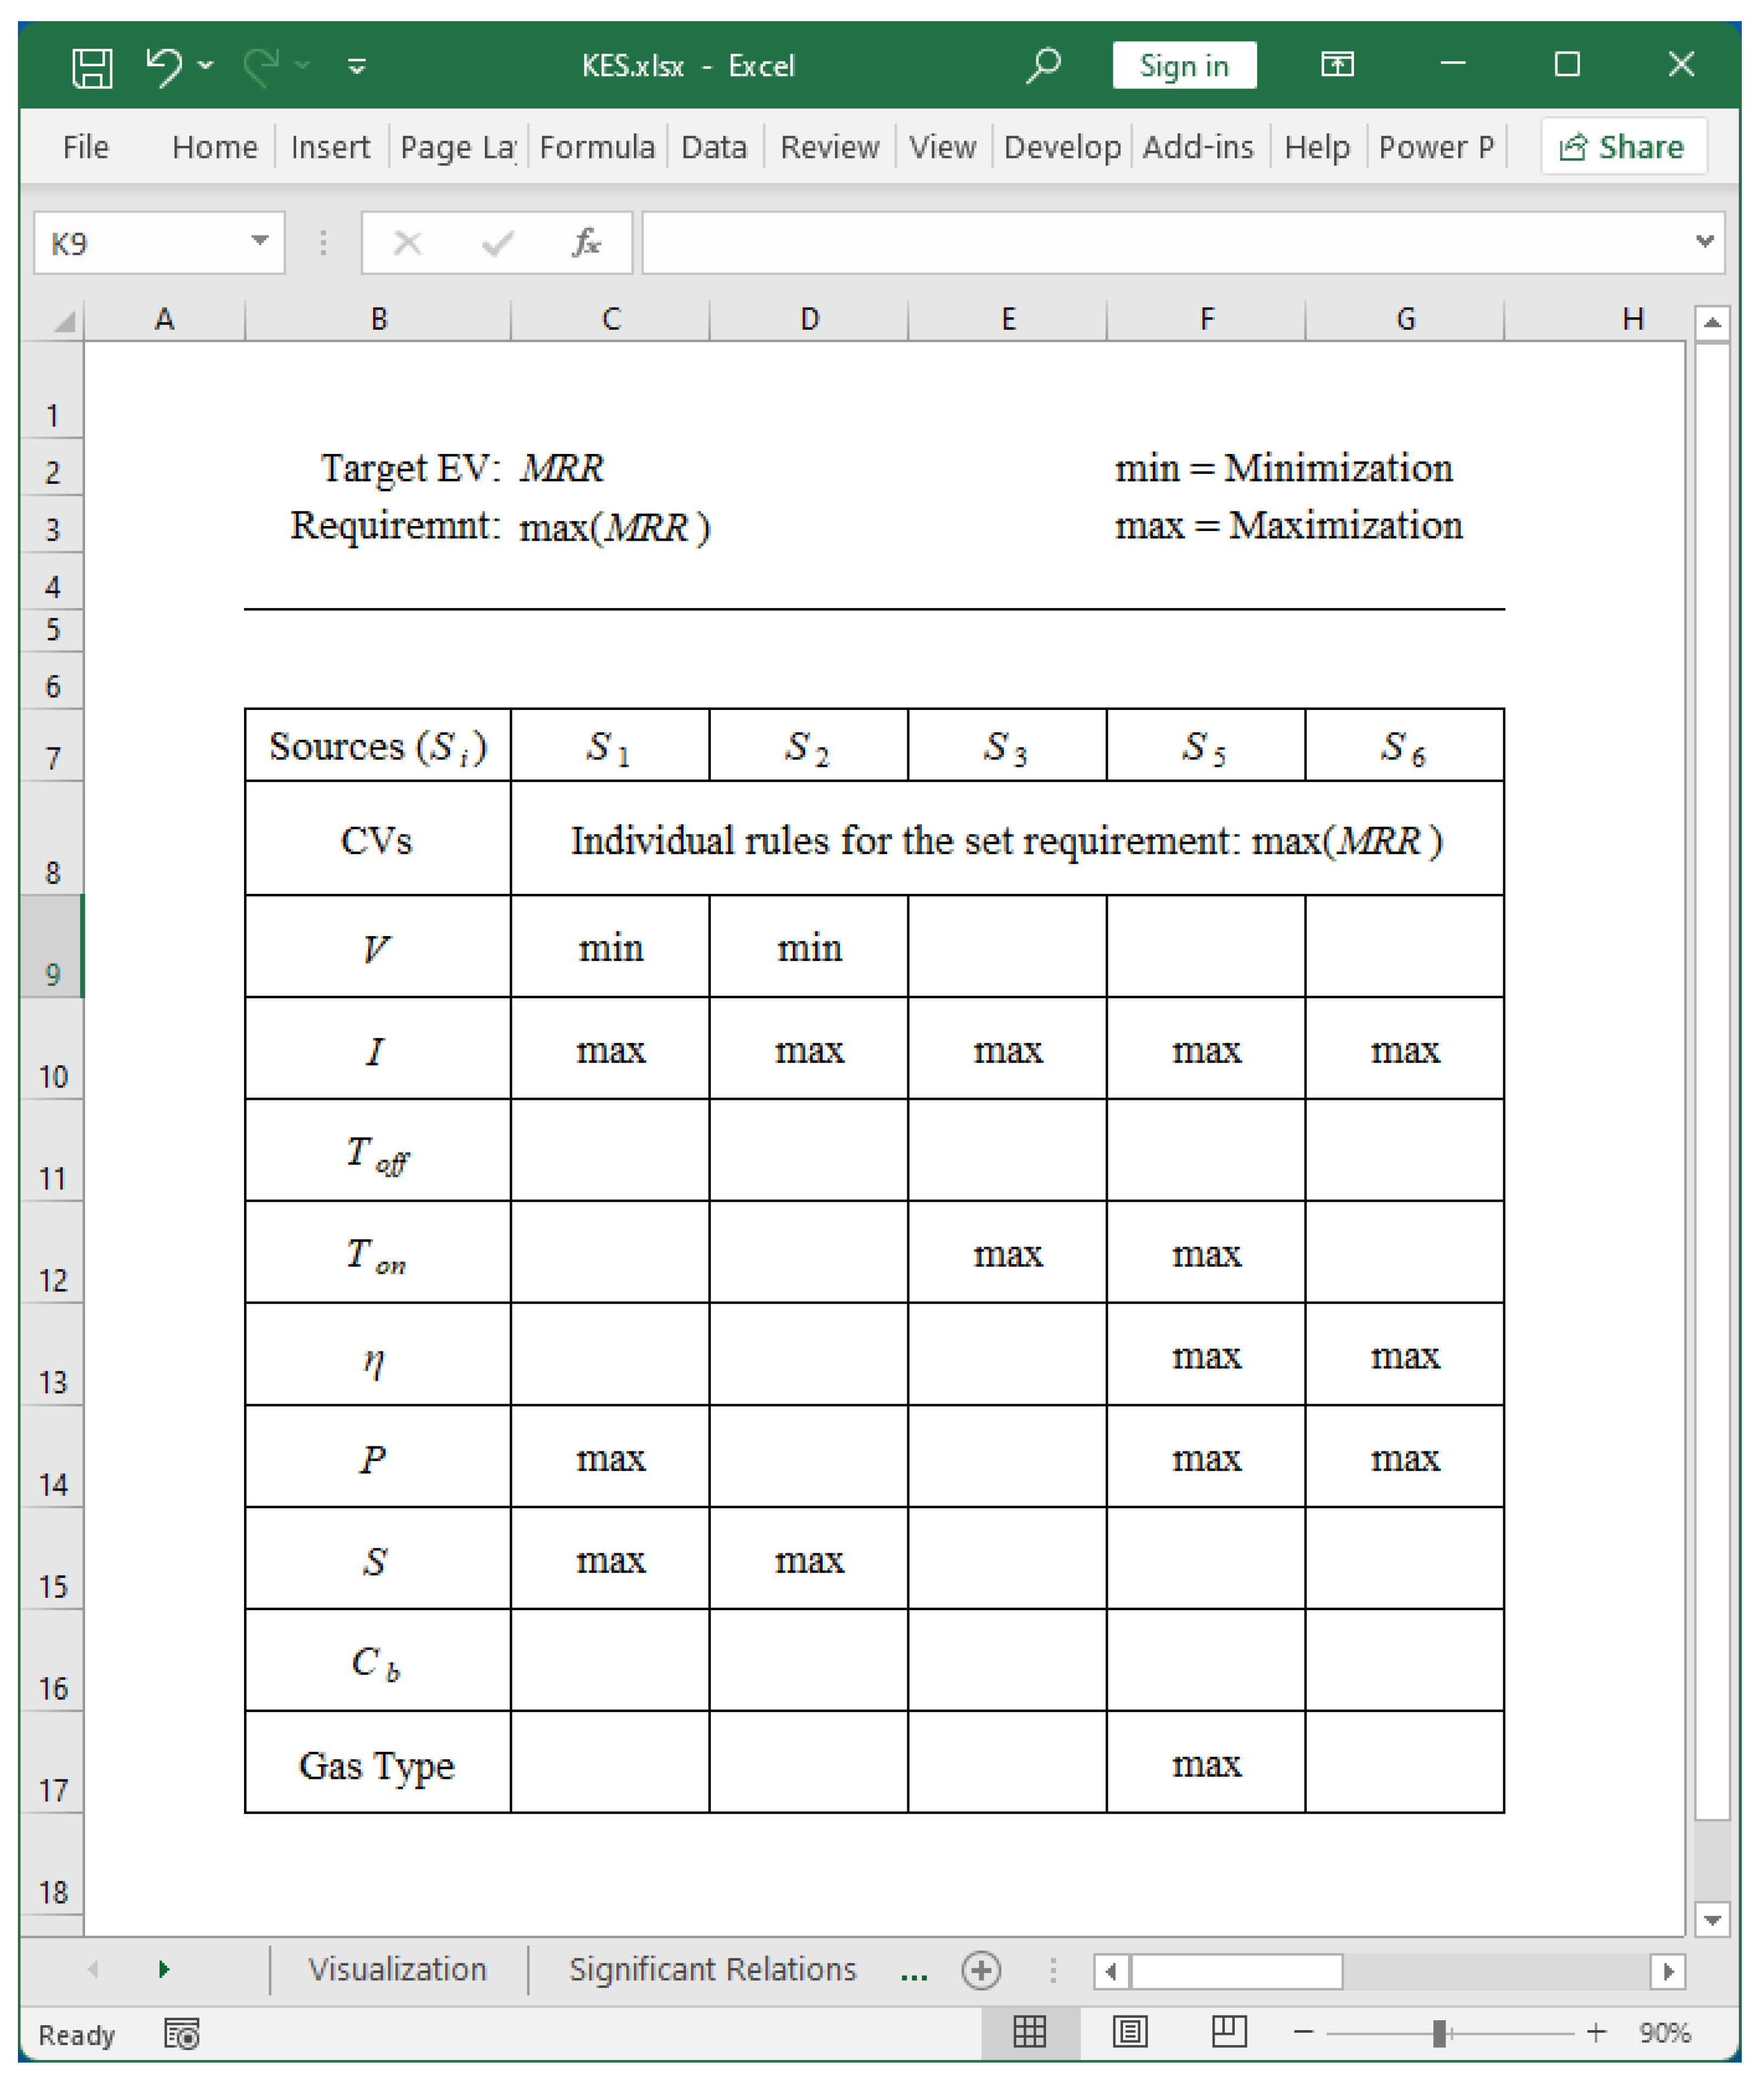
R| ∈ [0, 0.4) means “non-significant.” These states are shown by a green-colored-tick-mark (√), gold-colored-exclamatory-mark (!), and red-colored-cross-mark (X), respectively. Observing the green-colored tick-mark symbols (√) makes it possible to identify a set of rules for maximizing
MRR. The results are shown in
Figure 22 and summarized in
Table 3.
Whether or not the rules produce meaningful results is tested by applying the rules to datasets of
S1,…,
S6. Let
MRR' be the
MRR corresponding to a rule and let
MRR'' be the maximum possible
MRR, for a particular source. The results are summarized in
Table 4. As seen in
Table 4, for
S1,
S2, and
S6,
MRR' and
MRR'' are the same. In particular, for
S1,
MRR'2 =
MRR'' = 1.497 mm3/min. For
S2,
MRR' =
MRR'' = 0.811 mm3/min. For
S6,
MRR' = MRR
'' = 5.31 mm3/min. This suggests that the extracted rules are effective for maximizing the
MRR. On the other hand, for
S3 and
S5, the rules do not refer to any available datasets. This is perhaps because the rules use many or very few conditions, i.e., a moderate number of
CVs can be used to achieve the goal (here, maximizing
MRR).
It is worth mentioning that the proposed BDA and digital twin of a manufacturing process has close connections. Since a digital twin consists of input, modeling, simulation, validation, and output modules (see [
69]), the outcomes of BDA, e.g., the rules listed in
Table 3, (e.g.,
)) can be injected into an appropriate module of digital twin. This way BD and digital twin, two vital constituents of smart manufacturing can work in a synergetic manner.
6. Conclusions
Big data analytics is one of the essential constituents of smart manufacturing. Unfortunately, there is no systematic approach to developing it. This paper sheds some light on this issue. This paper first presents a comprehensive literature review on smart manufacturing-relevant big data analytics. Afterward, this paper presents a systematic approach to developing big data analytics for manufacturing process-relevant decision-making activities.
The proposed analytics consists of five integrated system components:
Big data preparation system
Big data exploration system
Data visualization system
Data analysis system
Knowledge extraction system
The functional requirements of the systems are as follows.
First, the big data preparation system must prepare contents to be included in big data. The contents may exhibit the characteristics of the so-called Digital Manufacturing Commons (DMC). Thus, it is desirable that the system supports user-defined ontologies and produces widely acceptable digital datasets using Extensible Markup Language (XML). The big data exploration system can extract relevant datasets prepared by the first system. The system uses keywords derived from the names of manufacturing processes, materials, and analyses- or experiments-relevant phrases (e.g., design of experiment). The third system can help visualize relevant datasets extracted by the second system using suitable methods (e.g., scatter plots and possibility distributions). The fourth system must establish relationships among the relevant control variables (variables that can be adjusted as needed) and evaluation variables (variables that measure the performance) combinations for a given situation. In addition, it must quantify the uncertainty in the relationships. Finally, the last system can extract knowledge from the outcomes of the fourth system using user-defined criteria (e.g., minimize surface roughness, maximize material removal rate, and alike). In addition, JAVA™
- and spreadsheet-based systems are developed to realize the proposed integrated systems.
The efficacy of proposed analytics is demonstrated using a case study where the goal is to determine the right states of control variables of dry electrical discharge machining for maximizing the material removal rate. The contents are created from published scientific articles on dry electrical discharge machining that deals with stainless and high-speed steels. In addition, the articles that presented datasets based on the design of experiments are considered. The datasets collectively underlie the following control variables: voltage, current, pulse-off time, pulse-on time, gas pressure, rotational speed, shielding clearance, duty factor, and gas type. The set of control variables differs from article to article.
Consequently, the values of the control variables differ from article to article. In addition, the degree of uncertainty in the datasets differs from article to article. This heterogeneous situation was successfully analyzed using the proposed analytics. The analytics successfully determined which variables among voltage, current, pulse-off time, gas pressure, and rotational speed effectively maximize material removal rate. In addition, the underlying uncertainty is also quantified.
In some cases, scatter plots are effective for the analysis, and in others, possibility distribution is effective. The analytics helps identify the redundant, less effective, and most effective variables by which one can maximize the material removal rate. The knowledge extracted can be used to optimize a dry electrical discharge machining operation and elucidate the research gap in dry electrical discharge machining.
Although the system is implemented for EDM, it can easily be implemented in other manufacturing processes. The reason is that all manufacturing processes are operated by fixing some control variables against some evolution variables. For example, the turning control variable can be feed rate, depth of cut, cutting velocity, and tool nose radius. Likewise, the possible list of evaluation variables is surface roughness, tool wear, and material removal rate. This means the same BDA can be used for turning effortlessly. The user consults the datasets relevant to the control and evaluation variables.
The remarkable thing is that the intervention and settings of a user and underlying computational aspects are transparent. At the same time, it does not require any sophisticated or expensive resources. Thus, the proposed analytics exhibits desirable characteristics regarding big data inequality and transparency issues. This experience can be extended to developing big data analytics and digital twins for smart manufacturing.
Nevertheless, other relevant technical issues can be delved into in the next phase of research. One of them is the issue of security. Consequently, as reviewed in [
70], blockchain-based technology can be considered. Particularly, blockchain technology can be integrated with the Big Data Preparation System (BDPS) to make the machine-readable datasets trusted and secured from the very beginning.
Figure 1.
Context of digital manufacturing commons and big data in smart manufacturing.
Figure 1.
Context of digital manufacturing commons and big data in smart manufacturing.
Figure 2.
Context of big data analytics for manufacturing processes.
Figure 2.
Context of big data analytics for manufacturing processes.
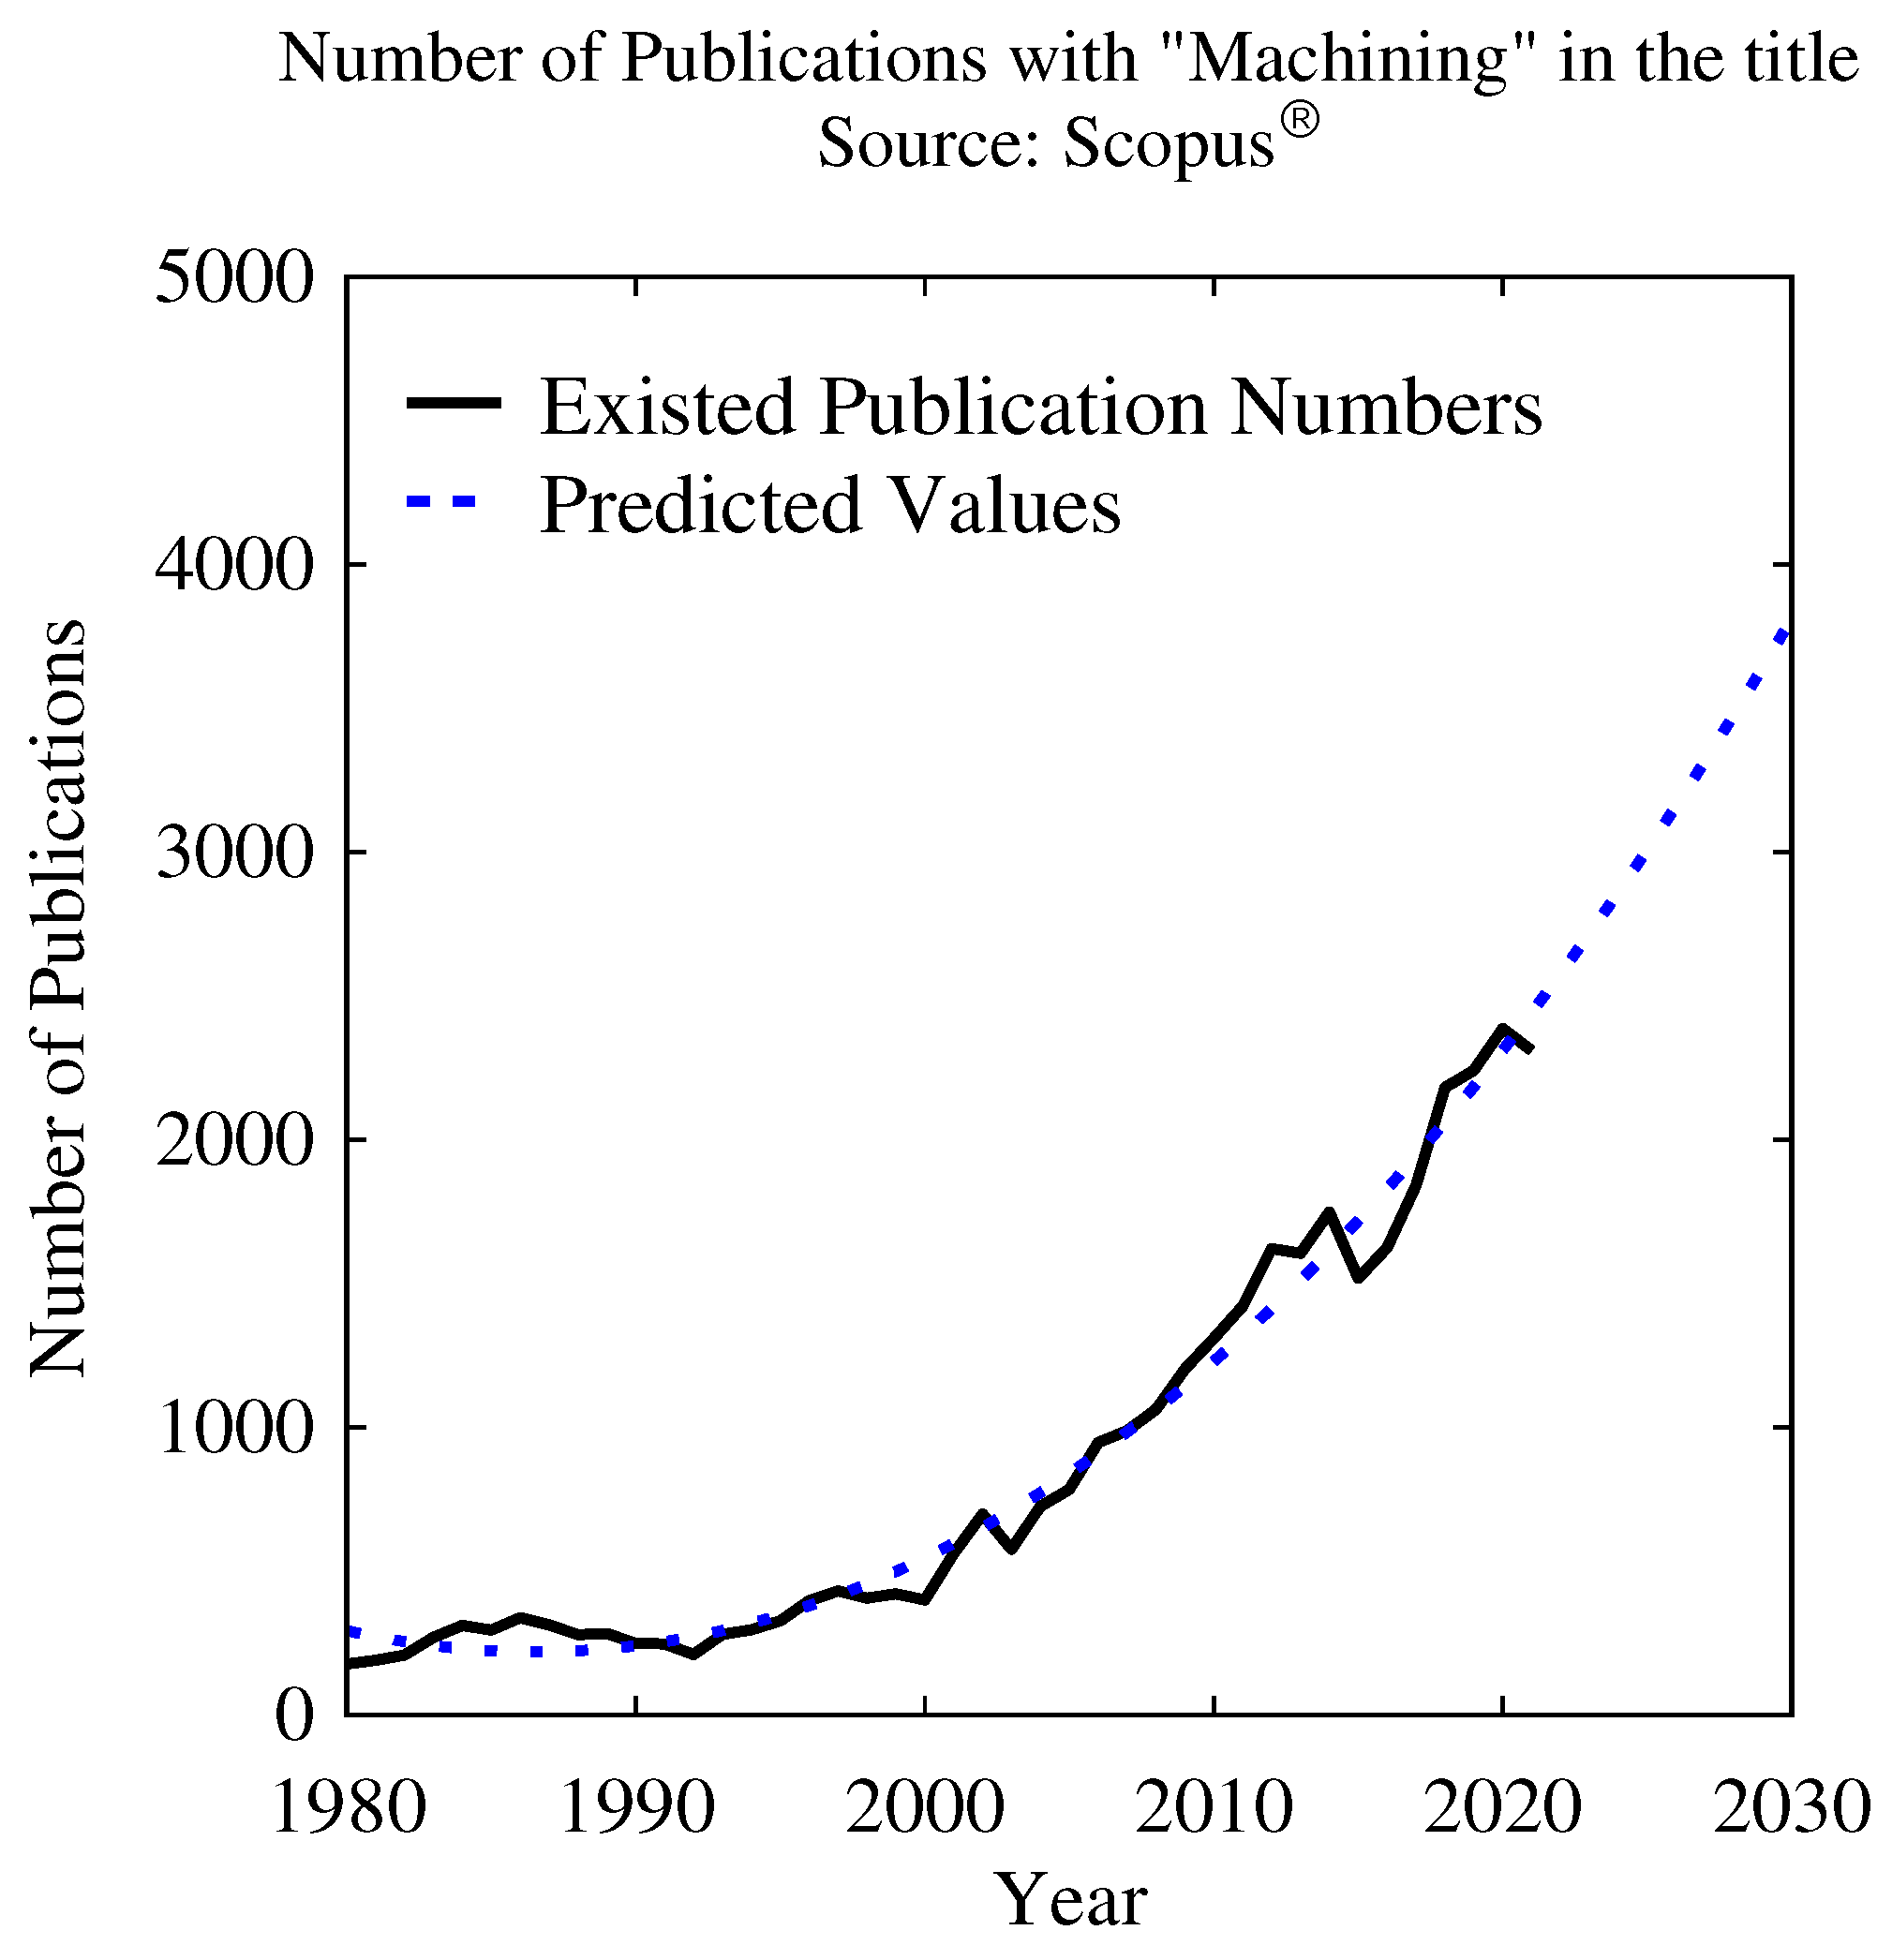
Figure 3.
Growth of manufacturing process-relevant documents.
Figure 3.
Growth of manufacturing process-relevant documents.
Figure 4.
Basic functionalities of the proposed big data analytics.
Figure 4.
Basic functionalities of the proposed big data analytics.
Figure 5.
Computational challenges underlying big data analytics.
Figure 5.
Computational challenges underlying big data analytics.
Figure 6.
Framework of the proposed big data analytics.
Figure 6.
Framework of the proposed big data analytics.
Figure 7.
System architecture of the proposed big data analytics.
Figure 7.
System architecture of the proposed big data analytics.
Figure 8.
Screen-print of Metafile Creation module.
Figure 8.
Screen-print of Metafile Creation module.
Figure 9.
Screen-print of XML Conversion and Data Integration module.
Figure 9.
Screen-print of XML Conversion and Data Integration module.
Figure 10.
Screen-print of Big Data Exploration System.
Figure 10.
Screen-print of Big Data Exploration System.
Figure 11.
Screen-print of Data Visualization System.
Figure 11.
Screen-print of Data Visualization System.
Figure 12.
Screen-print of Data Analysis System.
Figure 12.
Screen-print of Data Analysis System.
Figure 13.
CV-
EV-centric datasets across relevant to
Table 1.
Figure 13.
CV-
EV-centric datasets across relevant to
Table 1.
Figure 14.
Available combination-centric visualization CV-EV datasets.
Figure 14.
Available combination-centric visualization CV-EV datasets.
Figure 15.
MRR-relevant datasets from different sources.
Figure 15.
MRR-relevant datasets from different sources.
Figure 16.
TWR-relevant datasets from different sources.
Figure 16.
TWR-relevant datasets from different sources.
Figure 17.
Ra-relevant datasets from different sources.
Figure 17.
Ra-relevant datasets from different sources.
Figure 18.
Gap Voltage (V) and MRR-relevant datasets.
Figure 18.
Gap Voltage (V) and MRR-relevant datasets.
Figure 19.
Gas Pressure (P) and Radial Over Cut (ROC)-relevant datasets.
Figure 19.
Gas Pressure (P) and Radial Over Cut (ROC)-relevant datasets.
Figure 20.
Screen-print of the KES for visualizing the analyzed outcomes.
Figure 20.
Screen-print of the KES for visualizing the analyzed outcomes.
Figure 21.
Screen-print of the KES for identifying the significant relationships.
Figure 21.
Screen-print of the KES for identifying the significant relationships.
Figure 22.
Screen-print of the KES for rule extraction.
Figure 22.
Screen-print of the KES for rule extraction.
Table 1.
List of CVs and EVs across different sources for EDM.
Table 1.
List of CVs and EVs across different sources for EDM.
| Source(Si) |
Control Variable (CVj=1,...,m) |
Evaluation Variable (EVk=1,...,n) |
Datasets ) |
| j |
CVj
|
k |
EVk
|
|
S1 [63] |
1
2
3
4
5 |
Gap Voltage
Current
Pulse Off Time
Gas Pressure
Rotational Speed |
1
2
3
4 |
Material Removal Rate
Tool Wear Rate
Radial Over Cut
Depth Achieved |
20 |
|
S2 [64] |
1
2
3
4
5
6 |
Gap Voltage
Current
Pulse Off Time
Gas Pressure
Rotational Speed
Shielding Clearance |
1
2
3
4
5 |
Material Removal Rate
Tool Wear Rate
Oversize (entry of hole)
Oversize (50% of hole depth)
Oversize (90% of hole depth) |
30 |
|
S3 [65] |
1
2
3
4 |
Current
Pulse On Time
Duty Factor
Rotational Speed |
1
2 |
Material Removal Rate
Tool Wear Rate |
8 |
|
S4 [66] |
1
2
3
4
5
6 |
Gap Voltage
Current
Pulse Off Time
Gas Pressure
Rotational Speed
Shielding Clearance |
1
2
3
4 |
Material Removal Rate
Tool Wear Rate
Oversize
Depth Achieved |
24 |
|
S5 [67] |
1
2
3
4
5
6 |
Current
Pulse On Time
Duty Factor
Gas Pressure
Rotational Speed
Gas Type |
1
2
3 |
Material Removal Rate
Surface Roughness
Radial Over Cut |
18 |
|
S6 [68] |
1
2
3
4
5 |
Current
Pulse On Time
Duty Factor
Gas Pressure
Rotational Speed |
1
2
3 |
Material Removal Rate
Surface Roughness
Radial Over Cut |
15 |
| Total number of CV-EV-centric datasets |
115 |
Table 2.
Exported outcomes from DAS for knowledge extraction.
Table 2.
Exported outcomes from DAS for knowledge extraction.
| CVs |
Sources, Si
|
| S1
|
S2
|
S3
|
S5
|
S6
|
| Outcomes, Oj
|
|---|
| O1
|
O2
|
O3
|
O5
|
O6
|
| CA |
UA |
CA |
UA |
CA |
UA |
CA |
UA |
CA |
UA |
| R-values for Correlation Analysis (CA) and Uncertainty Analysis (UA) |
|---|
| EV = MRR |
|---|
| V |
-0.904 |
-0.75 |
-0.852 |
-0.957 |
|
|
|
|
|
|
| I |
0.996 |
0.917 |
0.997 |
0.993 |
0.989 |
0.195 |
0.999 |
0.972 |
0.995 |
0.998 |
| Toff |
-0.653 |
-0.69 |
-0.661 |
-0.754 |
|
|
|
|
|
|
| Ton |
|
|
|
|
0.989 |
0.071 |
0.978 |
0.993 |
0.523 |
0.593 |
| η |
|
|
|
|
0.222 |
0.181 |
0.986 |
0.99 |
0.944 |
0.987 |
| P |
0.93 |
0.926 |
0.369 |
0.965 |
|
|
0.902 |
0.863 |
0.996 |
0.798 |
| S |
0.993 |
0.826 |
1 |
0.957 |
0.707 |
-0.009 |
-0.419 |
-0.691 |
0.265 |
0.452 |
| Cb |
|
|
-0.397 |
0.585 |
|
|
|
|
|
|
| Gas Type |
|
|
|
|
|
|
0.934 |
0.967 |
|
|
|
V: Voltage, I: Current, Toff: Pulse off time, Ton: Pulse on time, P: Gas Pressure, N: Spindle Rotational Speed, Cb: Shielding Clearance |
Table 3.
Extracted rules.
Table 3.
Extracted rules.
| Si
|
Rk
|
Rules |
| S1
|
R1
|
|
| S2
|
R2
|
|
| S3
|
R3
|
|
| S5
|
R5
|
|
| S6
|
R6
|
|
Table 4.
Validation of Rk.
Table 4.
Validation of Rk.
| Si
|
Rk
|
MRR' (mm3/min) |
MRR'' (mm3/min) |
| S1
|
R1
|
1.497 |
1.497 |
| S2
|
R2
|
0.811 |
0.811 |
| S3
|
R3
|
No conclusion |
9.9425 |
| S5
|
R5
|
No conclusion |
3.77 |
| S6
|
R6
|
5.31 |
5.31 |
