Submitted:
17 July 2023
Posted:
18 July 2023
You are already at the latest version
Abstract
Keywords:
1. Introduction
2. Materials and Methods
2.1. Recombinant Viruses
2.2. Canine Cell Cultures
2.2.1. Cell isolation and Validation
2.2.2. Cell Permissivity to MYXV
2.2.3. Cytotoxicity of MYXV
2.3. Evaluation of Cytokine Effects on Viral Infection of Canine Cells
2.3.1. Measurement of mRNAs
2.3.1.1. Canine Immuno-Oncology Panel
2.3.1.2. Quantitative PCR
2.3.2. Addition of Cytokines to Canine Cell Cultures
2.3.3. Inhibition of Cytokines during MYXV-Red Infection
2.4. MYXVΔSERP2 Oncolytic Therapy in Dogs with Sarcomas
2.4.1. Treatment Protocols for Dogs with Sarcoma
2.4.2. Sample Analysis for Study Dogs
3. Results
3.1. Characteristics of Canine Cell Lines
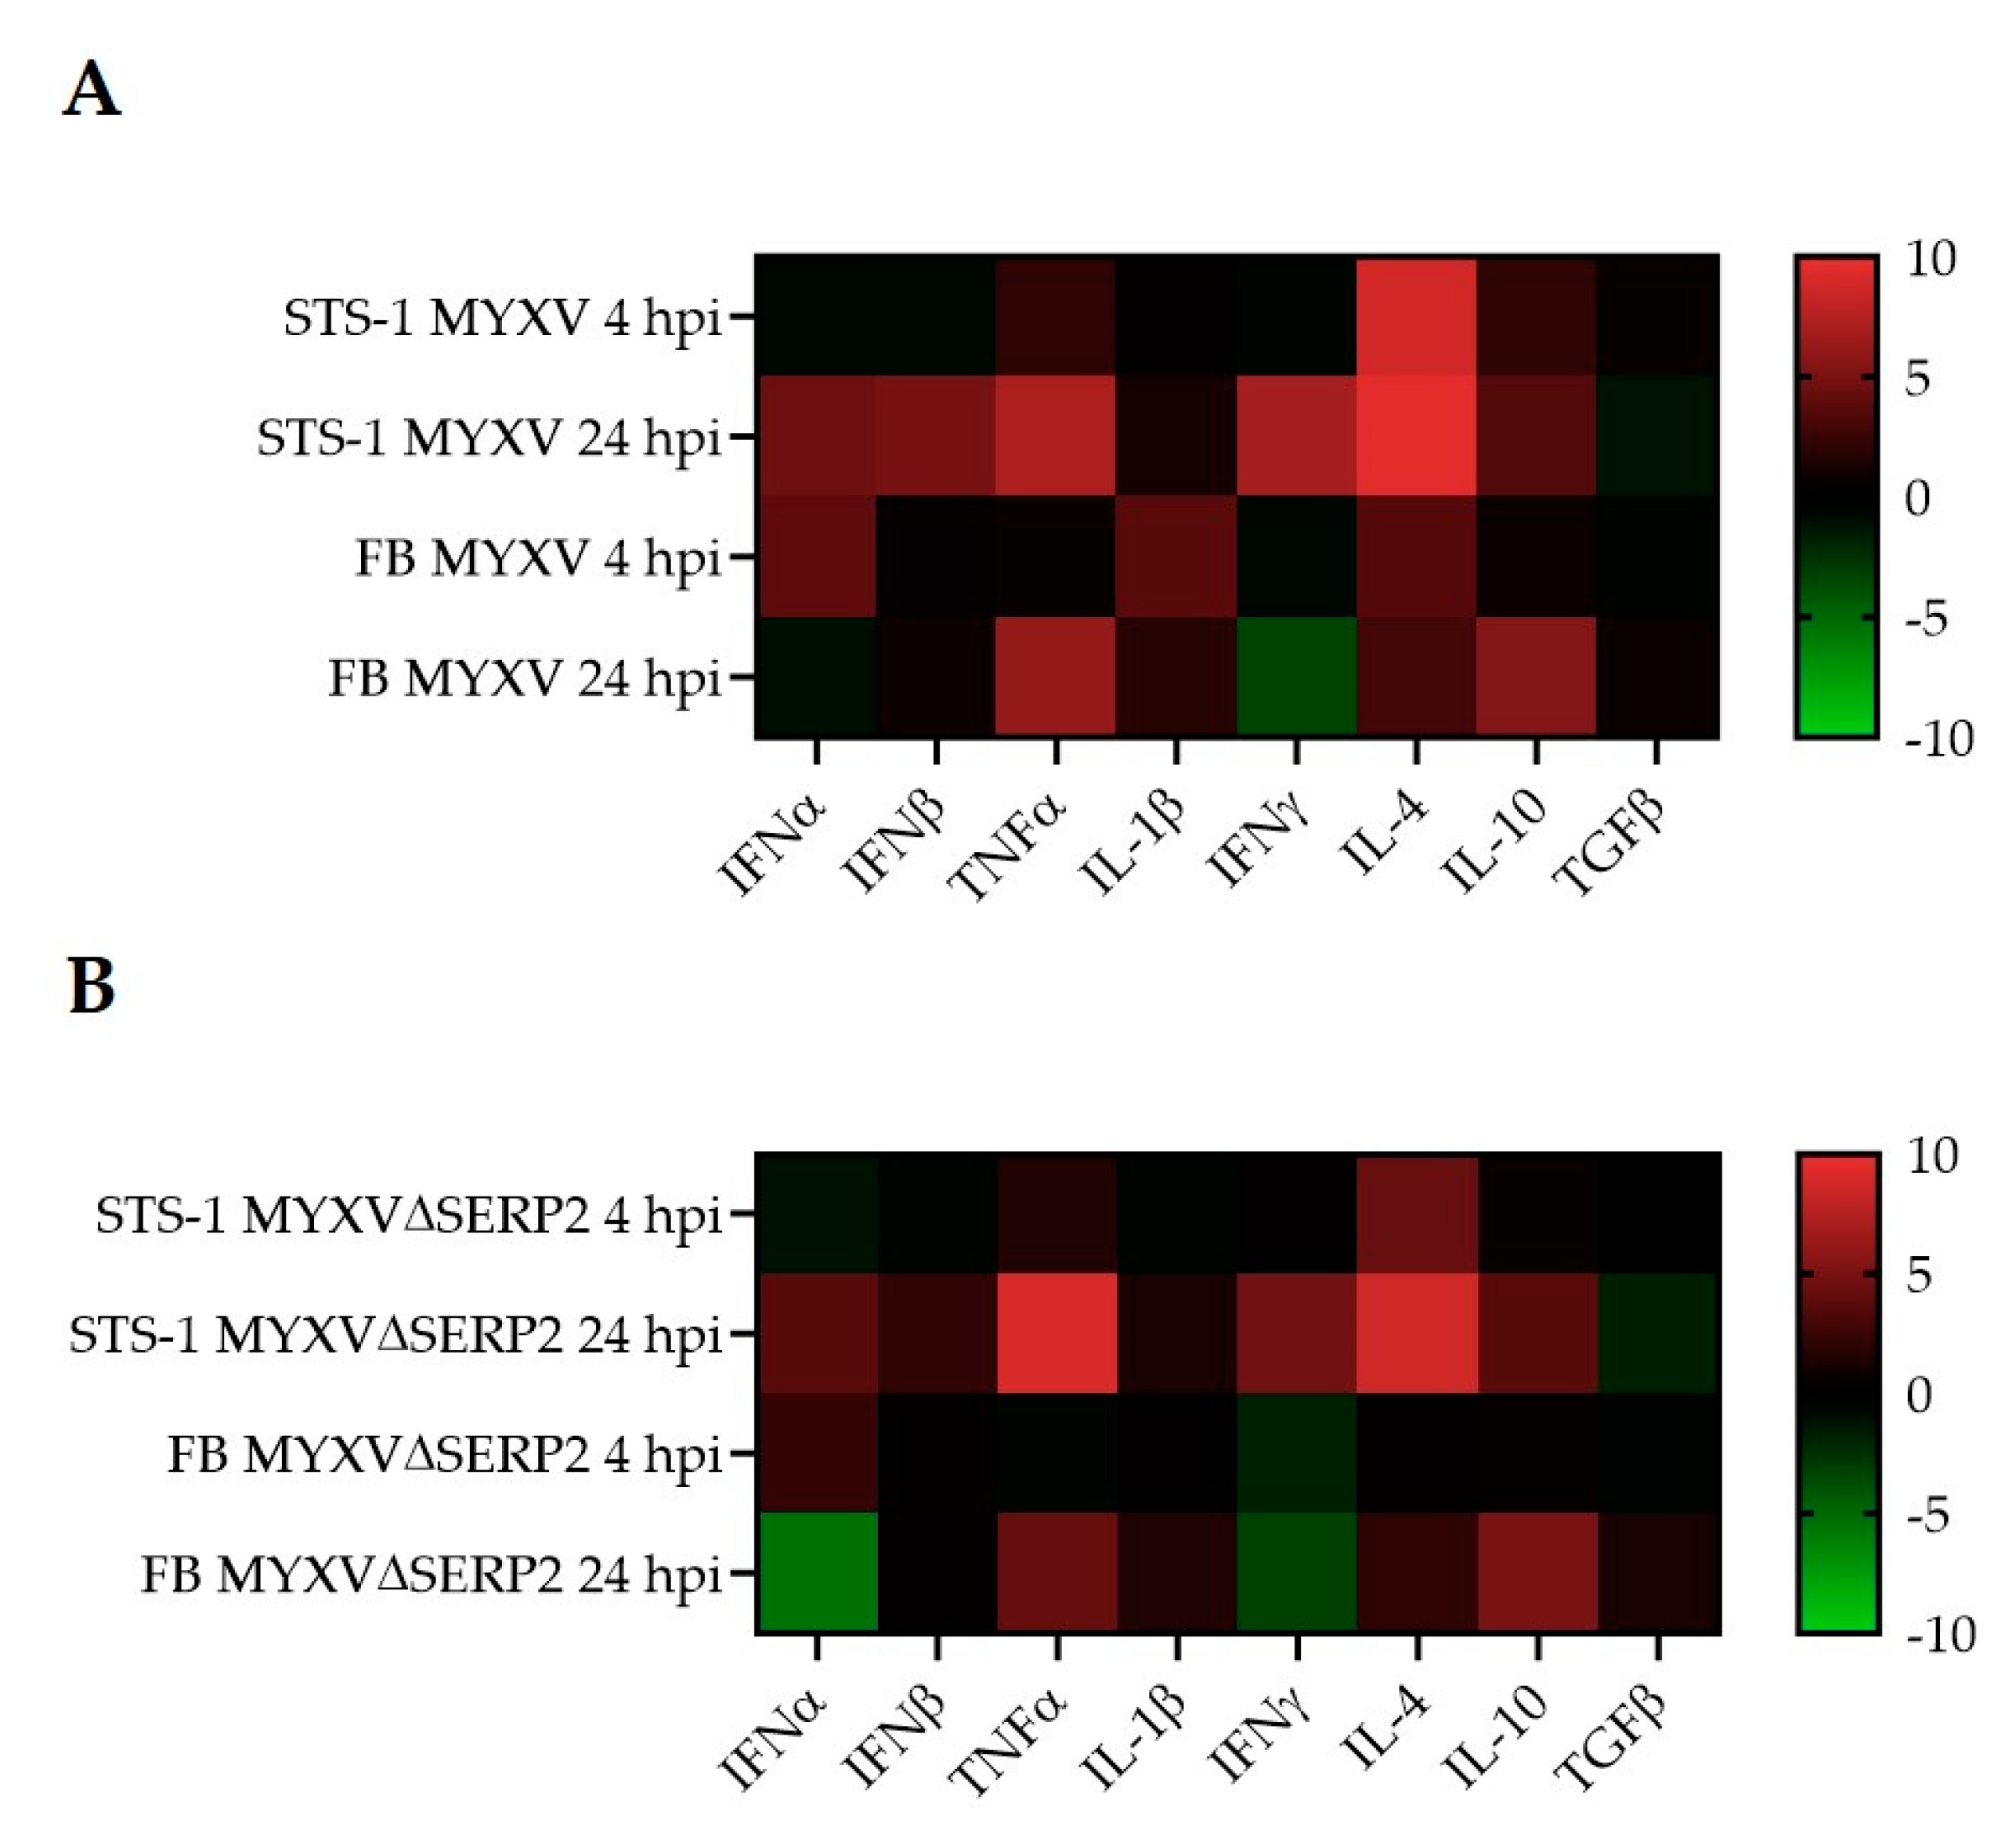
3.2. Cytokine mRNA Expression Following MYXV Inoculation
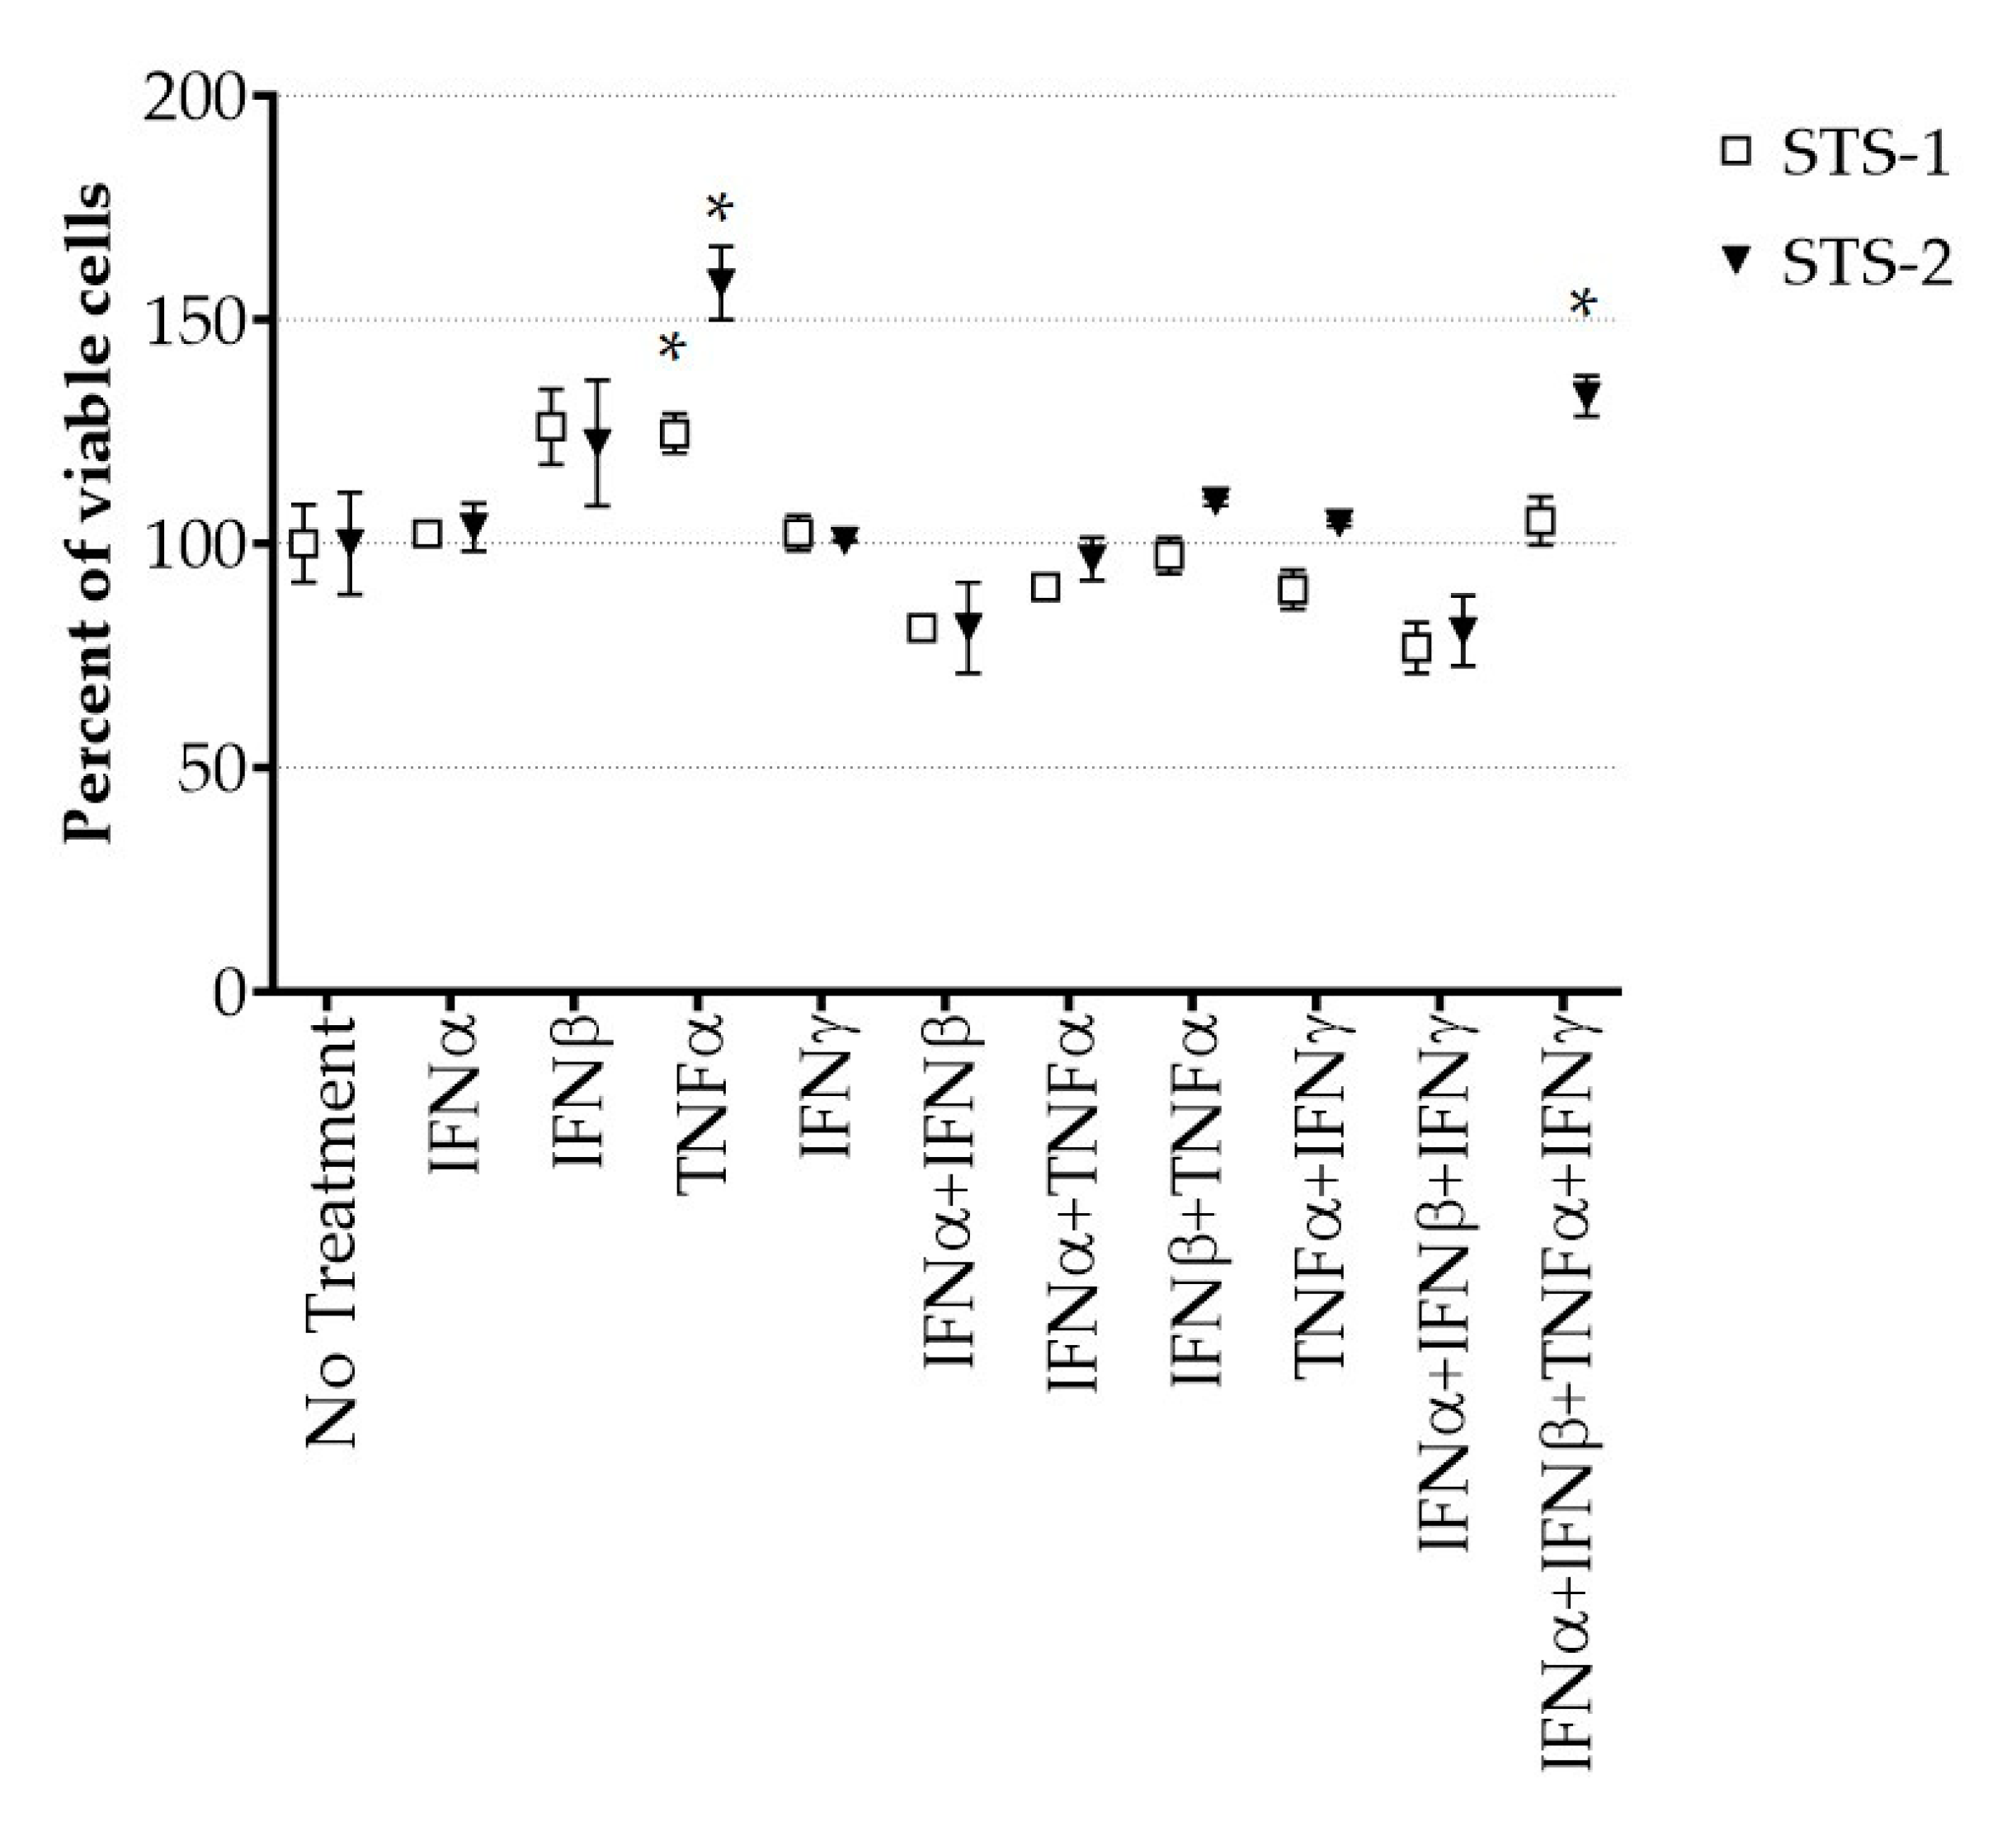
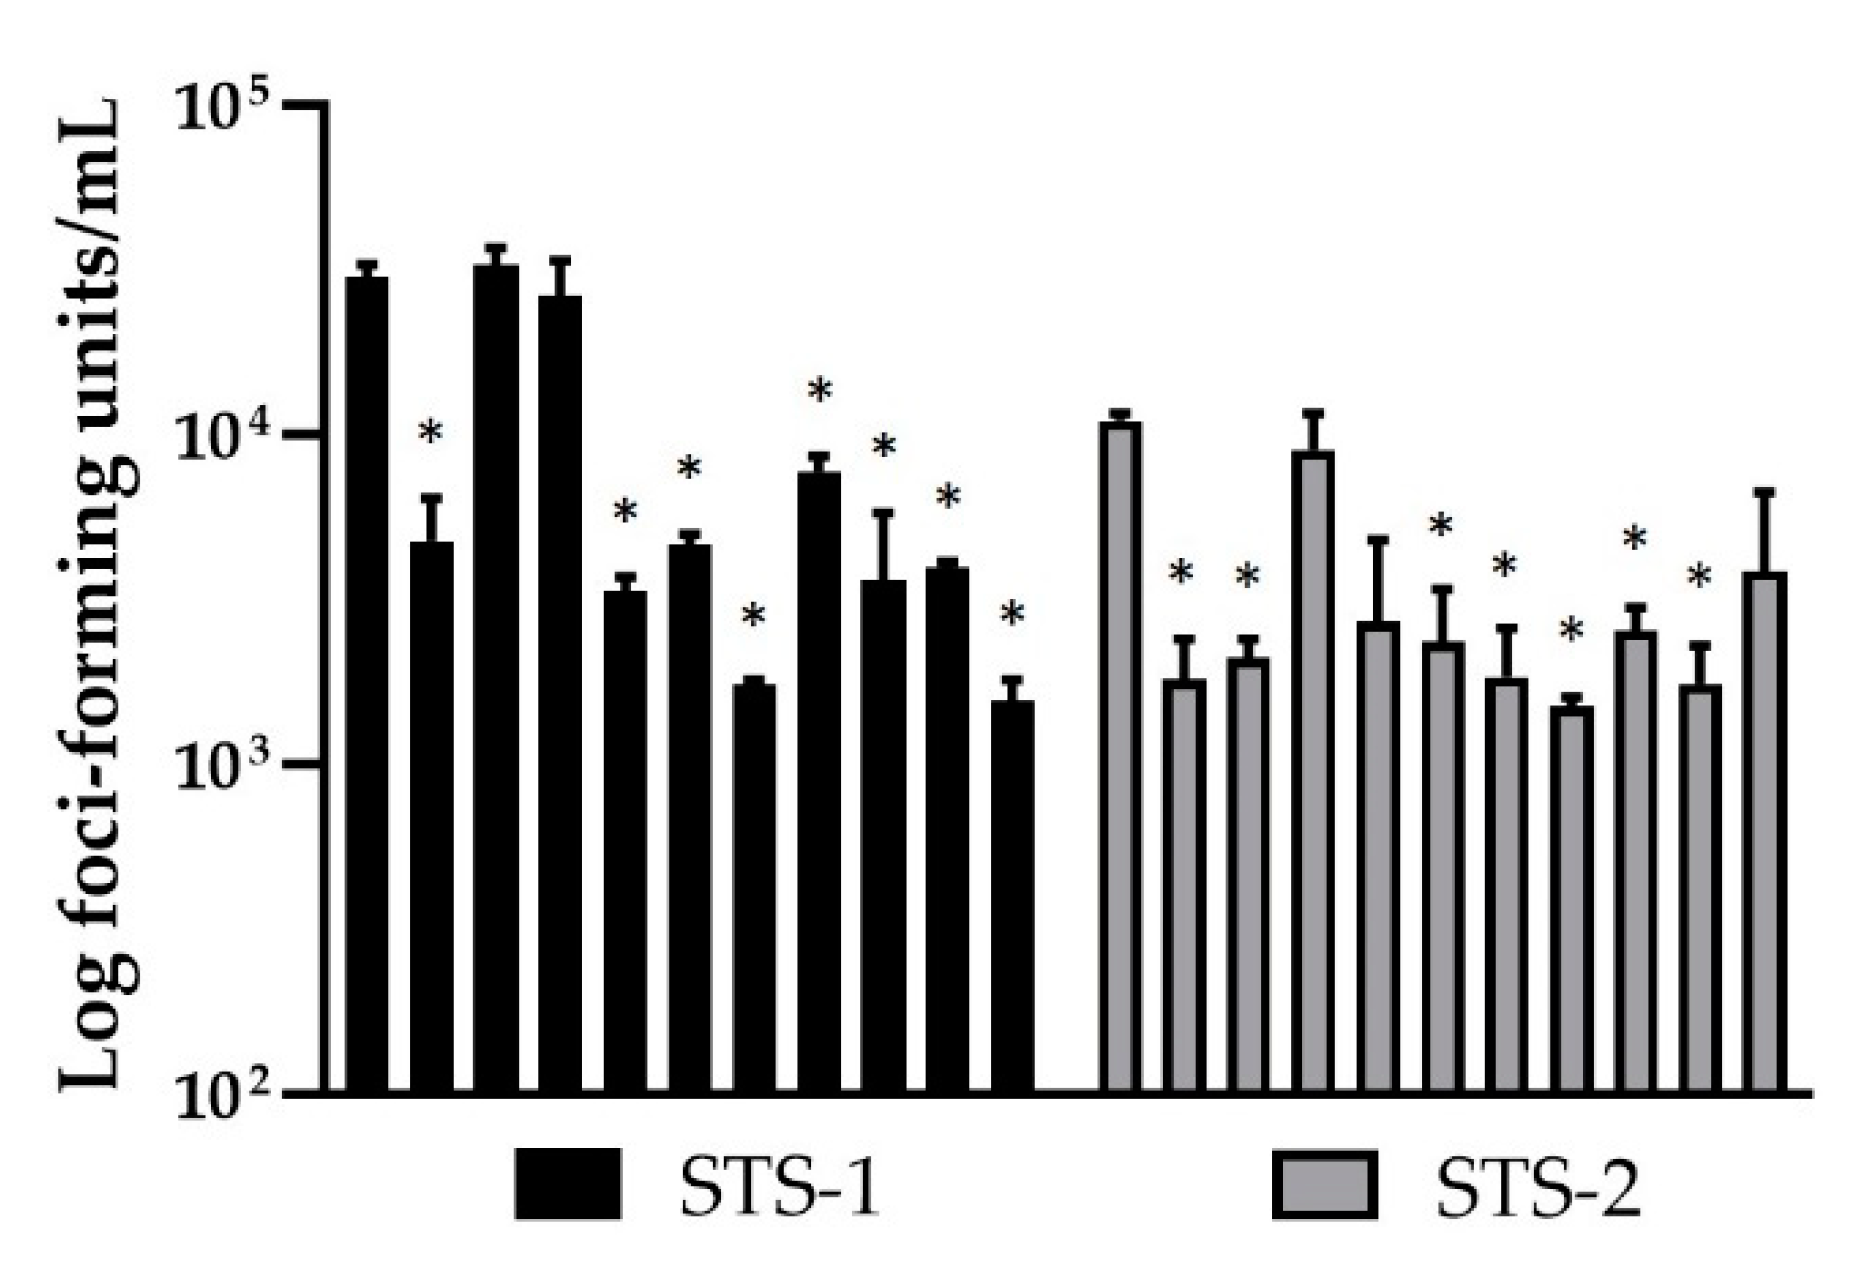
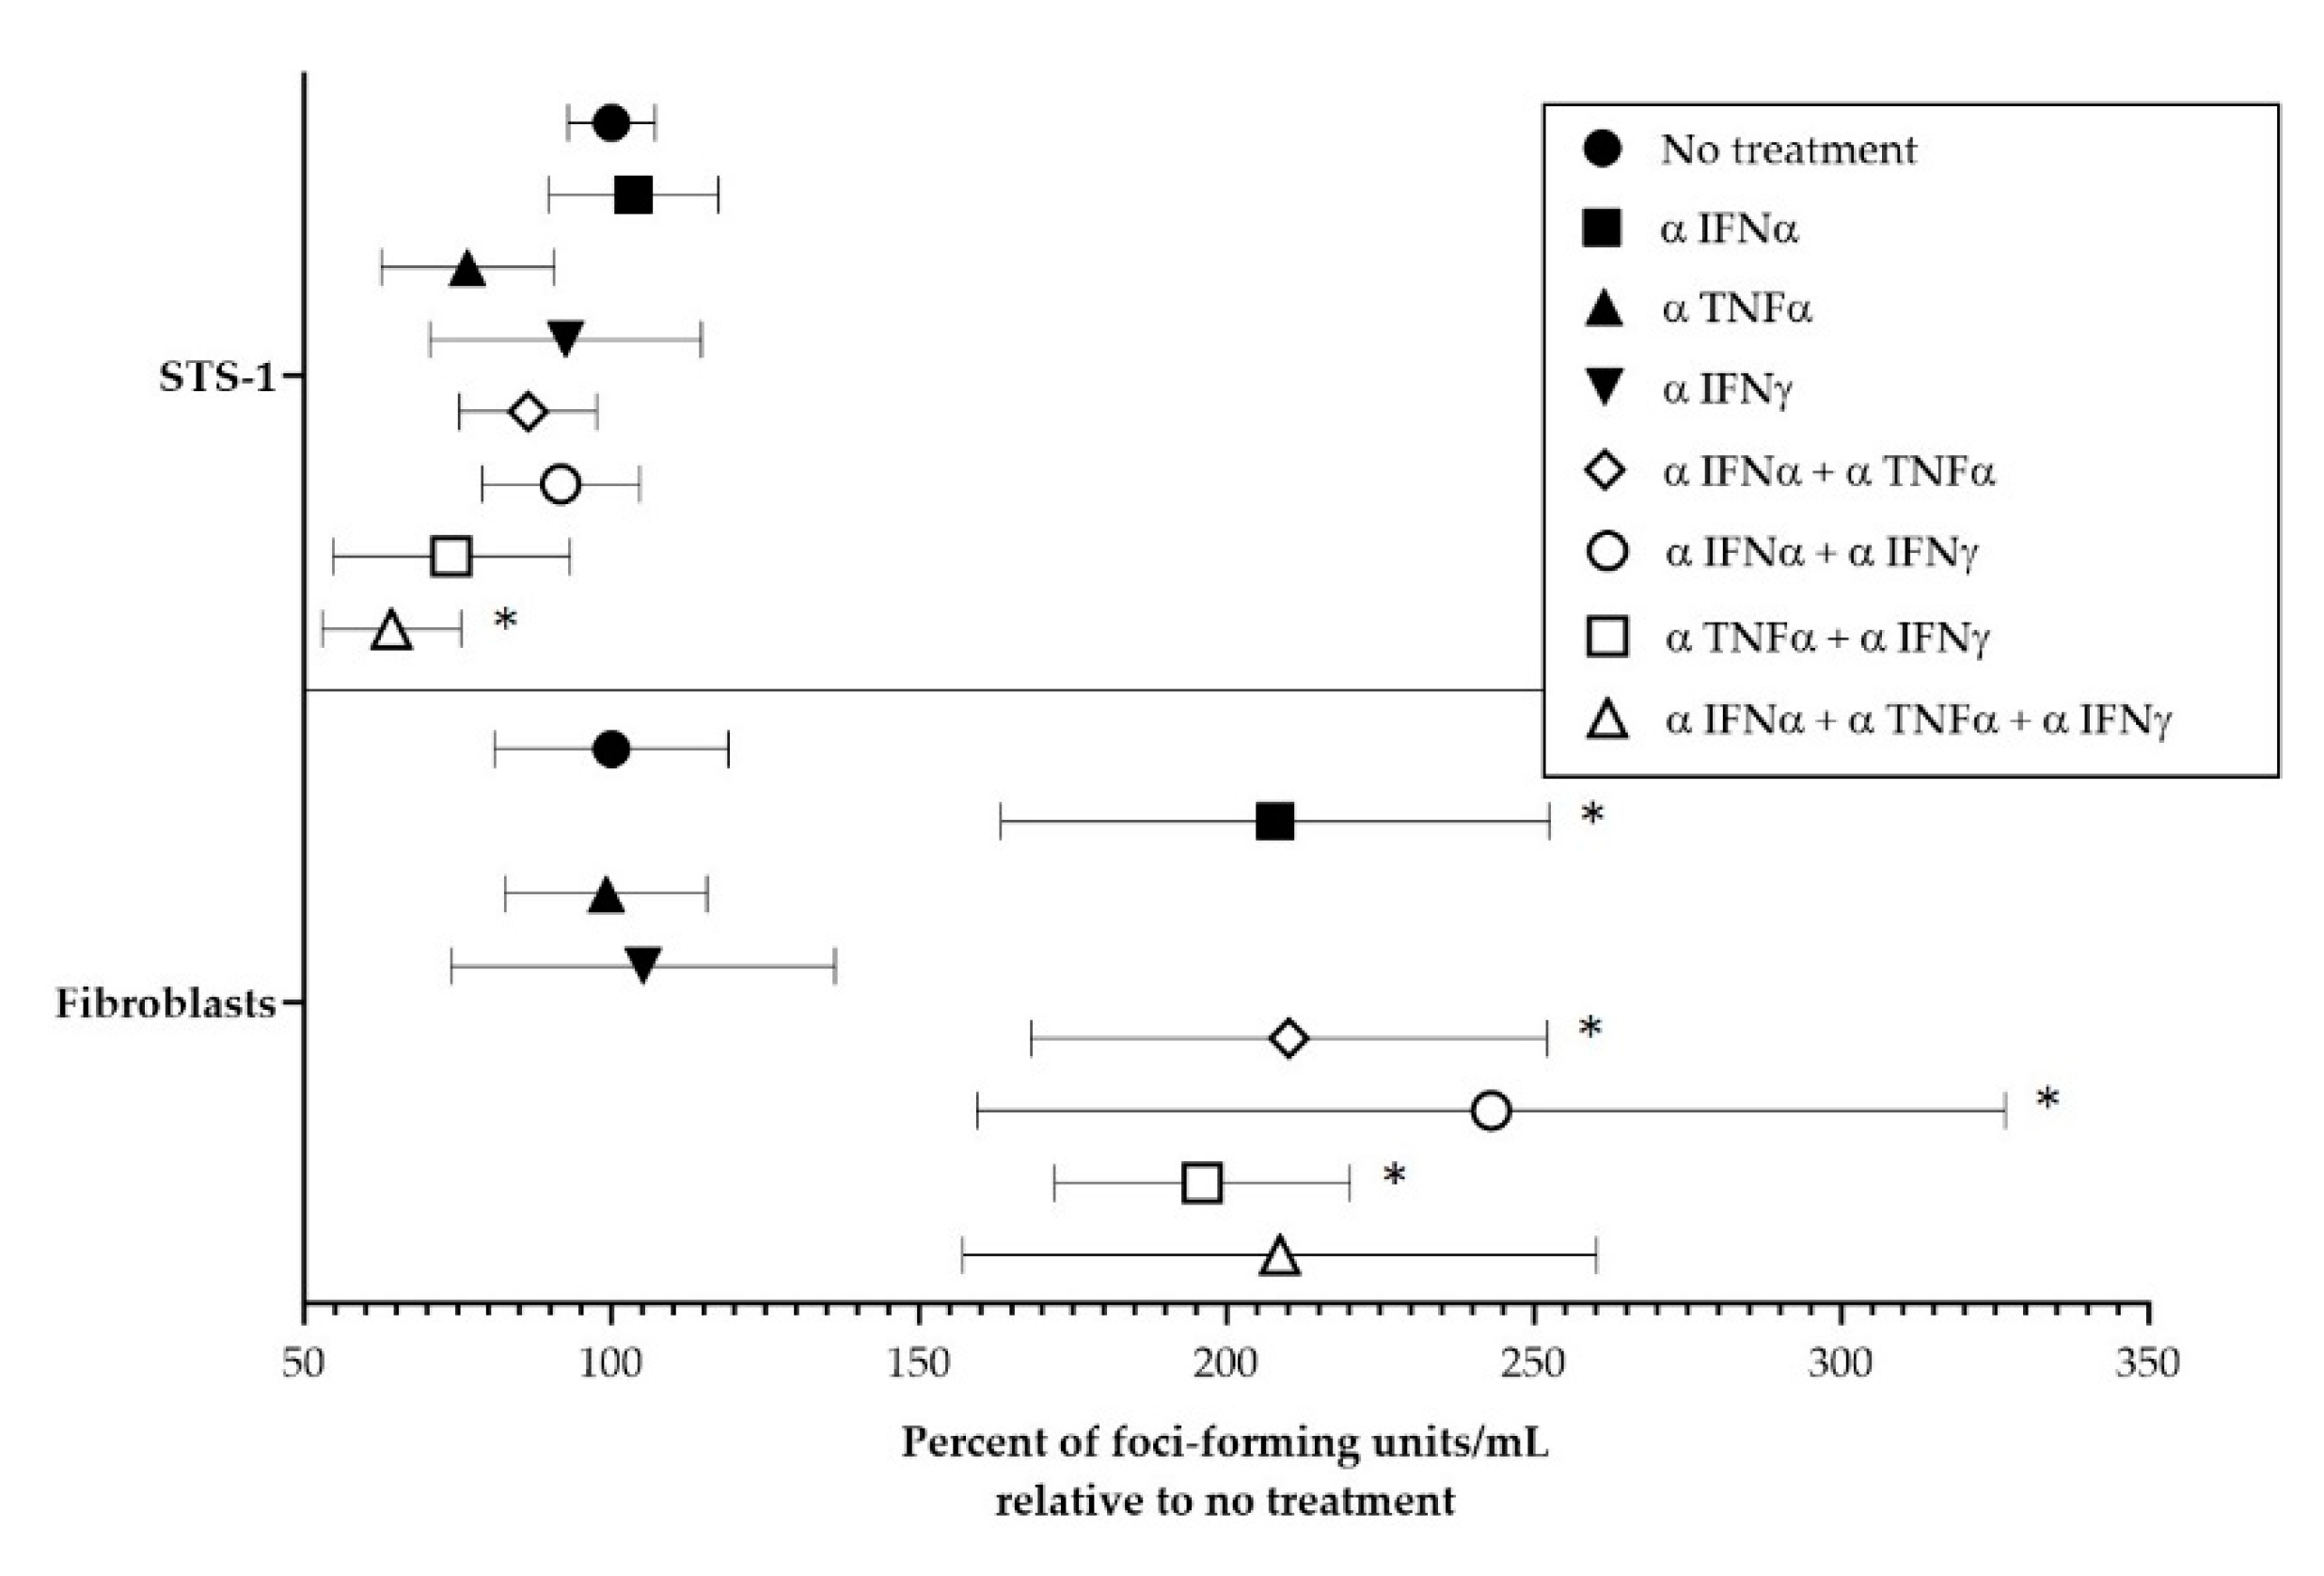
3.3. Effect of Cytokines on MYXV Infection
3.4. Post-Operative MYXVΔSERP2 Treatement in Dogs with Soft Tissue Sarcoma
3.4.1. Safety of Combination Oclacitinib and MYXVΔSERP2 Treatment in Dogs
3.4.2. Immune Response to Combination Oclacitinib and MYXVΔSERP2 Treatment in Dogs
3.4.3. Clinical Response to Combination Oclacitinib and MYXVΔSERP2 Treatment in Dogs
4. Discussion
5. Conclusions
Supplementary Materials
Author Contributions
Funding
Institutional Review Board Statement
Informed Consent Statement
Acknowledgments
Conflicts of Interest
References
- Porrello, A.; Cardelli, P.; Spugnini, E.P. Oncology of companion animals as a model for humans. an overview of tumor histotypes. J. Exp. Clin. Cancer Res. 2006, 25, 97–105. [Google Scholar] [PubMed]
- Ehrhart, N. Soft-tissue sarcomas in dogs: A review. J. Am. Anim. Hosp. Assoc. 2005, 41, 241–246. [Google Scholar] [CrossRef] [PubMed]
- Dernell, W.S.; Withrow, S.J.; Kuntz, C.A.; Powers, B.E. Principles of treatment for soft tissue sarcoma. Clin Tech Small Anim Pr. 1998, 13, 59–64. [Google Scholar] [CrossRef] [PubMed]
- Hohenhaus, A.E.; Kelsey, J.L.; Haddad, J.; Barber, L. Canine Cutaneous and Subcutaneous Soft Tissue Sarcoma: An Evidence-Based Review of Case Management. J. Am. Anim. Hosp. Assoc. 2016, 52, 77–89. [Google Scholar] [CrossRef] [PubMed]
- Liang, M. Oncorine, the World First Oncolytic Virus Medicine and its Update in China. Curr. Cancer Drug Targets 2018, 18, 171–176. [Google Scholar] [CrossRef]
- Pol, J.; Kroemer, G.; Galluzzi, L. First oncolytic virus approved for melanoma immunotherapy. Oncoimmunology 2015, 5, e1115641. [Google Scholar] [CrossRef] [PubMed]
- Cinatl Jr, J.; Cinatl, J.; Michaelis, M.; Kabickova, H.; Kotchetkov, R.; Vogel, J.U.; Doerr, H.W.; Klingebiel, T.; Driever, P.H. Potent oncolytic activity of multimutated herpes simplex virus G207 in combination with vincristine against human rhabdomyosarcoma. Cancer Res. 2003, 63, 1508–1514. [Google Scholar]
- Gentschev, I.; Adelfinger, M.; Josupeit, R.; Rudolph, S.; Ehrig, K.; Donat, U.; Weibel, S.; Chen, N.G.; Yu, Y.A.; Zhang, Q.; et al. Preclinical evaluation of oncolytic vaccinia virus for therapy of canine soft tissue sarcoma. PLoS One 2012, 7, e37239. [Google Scholar] [CrossRef]
- Kinn, V.G.; Hilgenberg, V.A.; MacNeill, A.L. Myxoma virus therapy for human embryonal rhabdomyosarcoma in a nude mouse model. Oncolytic Virotherapy 2016, 5, 59–71. [Google Scholar]
- Barton, K.N.; Paielli, D.; Zhang, Y.; Koul, S.; Brown, S.L.; Lu, M.; Seely, J.; Kim, J.H.; Freytag, S.O. Second-generation replication-competent oncolytic adenovirus armed with improved suicide genes and ADP gene demonstrates greater efficacy without increased toxicity. Mol. Ther. 2006, 13, 347–56. [Google Scholar] [CrossRef]
- Laborda, E.; Puig-Saus, C.; Rodriguez-García, A.; Moreno, R.; Cascalló, M.; Pastor, J.; Alemany, R. A pRb-responsive, RGD-modified, and hyaluronidase-armed canine oncolytic adenovirus for application in veterinary oncology. Mol. Ther. 2014, 22, 986–98. [Google Scholar] [CrossRef]
- Cejalvo, T.; Perise-Barrios, A.J.; del Portillo, I.; Laborda, E.; Rodriguez-Milla, M.A.; Cubillo, I.; Vazquez, F.; Sardon, D.; Ramirez, M.; Alemany, R.; et al. Remission of spontaneous canine tumors after systemic cellular viroimmunotherapy. Cancer Res. 2018, 78, 4891–4901. [Google Scholar] [CrossRef]
- Hwang, C.C.; Igase, M.; Sakurai, M.; Haraguchi, T.; Tani, K.; Itamoto, K.; Shimokawa, T.; Nakaichi, M.; Nemoto, Y.; Noguchi, S.; et al. Oncolytic reovirus therapy: Pilot study in dogs with spontaneously occurring tumours. Vet. Comp. Oncol. 2017, 16, 1–10. [Google Scholar] [CrossRef] [PubMed]
- Béguin, J.; Nourtier, V.; Gantzer, M.; Cochin, S.; Foloppe, J.; Balloul, J.M.; Laloy, E.; Tierny, D.; Klonjkowski, B.; Quemeneur, E.; et al. Safety studies and viral shedding of intramuscular administration of oncolytic vaccinia virus TG6002 in healthy beagle dogs. BMC Vet. Res. 2020, 16. [Google Scholar] [CrossRef]
- Béguin, J.; Gantzer, M.; Farine, I.; Foloppe, J.; Klonjkowski, B.; Maurey, C.; Quéméneur, É.; Erbs, P. Safety, biodistribution and viral shedding of oncolytic vaccinia virus TG6002 administered intravenously in healthy beagle dogs. Sci. Rep. 2021, 11, 1–13. [Google Scholar] [CrossRef] [PubMed]
- Ilyinskaya, G. V.; Mukhina, E. V.; Soboleva, A. V.; Matveeva, O. V.; Chumakov, P.M. Oncolytic sendai virus therapy of canine mast cell tumors (A pilot study). Front. Vet. Sci. 2018, 5, 1–12. [Google Scholar] [CrossRef] [PubMed]
- Omar, N.B.; Bentley, R.T.; Crossman, D.K.; Foote, J.B.; Koehler, J.W.; Markert, J.M.; Platt, S.R.; Rissi, D.R.; Shores, A.; Sorjonen, D.; et al. Safety and interim survival data after intracranial administration of M032, a genetically engineered oncolytic HSV-1 expressing IL-12, in pet dogs with sporadic gliomas. Neurosurg. Focus 2021, 50, 1–11. [Google Scholar] [CrossRef]
- MacNeill, A.L.; Weishaar, K.M.; Séguin, B.; Powers, B.E. Safety of an oncolytic myxoma virus in dogs with soft tissue sarcoma. Viruses 2018, 10, 10–23. [Google Scholar] [CrossRef] [PubMed]
- LeBlanc, A.K.; Naik, S.; Galyon, G.D.; Jenks, N.; Steele, M.; Peng, K.-W.; Federspiel, M.J.; Donnell, R.; Russell, S.J. Safety studies on intravenous administration of oncolytic recombinant vesicular stomatitis virus in purpose-bred beagle dogs. Hum. Gene Ther. Clin. Dev. 2013, 24, 174–81. [Google Scholar] [CrossRef] [PubMed]
- Mcnab, F.; Mayer-barber, K.; Sher, A.; Wack, A.; Garra, A.O.; Europe PMC Funders Group. Type I interferons in infectious disease. Nat. Rev. Immunol. 2020, 15, 87–103. [Google Scholar] [CrossRef] [PubMed]
- Li, S.F.; Gong, M.J.; Zhao, F.R.; Shao, J.J.; Xie, Y.L.; Zhang, Y.G.; Chang, H.Y. Type I interferons: Distinct biological activities and current applications for viral infection. Cell. Physiol. Biochem. 2018, 51, 2377–2396. [Google Scholar] [CrossRef] [PubMed]
- Klotz, D.; Baumgärtner, W.; Gerhauser, I. Type I interferons in the pathogenesis and treatment of canine diseases. Vet. Immunol. Immunopathol. 2017, 191, 80–93. [Google Scholar] [CrossRef] [PubMed]
- Wang, F.; Ma, Y.; Barrett, J.W.; Gao, X.; Loh, J.; Barton, E.; Virgin, H.W.; McFadden, G. Disruption of Erk-dependent type I interferon induction breaks the myxoma virus species barrier. Nat. Immunol. 2004, 5, 1266–1274. [Google Scholar] [CrossRef] [PubMed]
- Bartee, E.; McFadden, G. Human cancer cells have specifically lost the ability to induce the synergistic state caused by tumor necrosis factor plus interferon-beta. Cytokine 2009, 47, 199–205. [Google Scholar] [CrossRef] [PubMed]
- Stanifer, M.L.; Pervolaraki, K.; Boulant, S. Differential regulation of type I and type III interferon signaling. Int. J. Mol. Sci. 2019, 20, 1–22. [Google Scholar] [CrossRef]
- Budhwani, M.; Mazzieri, R.; Dolcetti, R. Plasticity of Type I Interferon-Mediated Responses in Cancer Therapy: From Anti-tumor Immunity to Resistance. Front. Oncol. 2018, 8. [Google Scholar] [CrossRef]
- Yang, R.; Wang, L.; Sheng, J.; Huang, Q.; Pan, D.; Xu, Y.; Yan, J.; Wang, X.; Dong, Z.; Yang, M. Combinatory effects of vaccinia virus VG9 and the STAT3 inhibitor Stattic on cancer therapy. Arch. Virol. 2019, 164, 1805–1814. [Google Scholar] [CrossRef]
- Zoetis. Available online: https://www.zoetisus.com/products/dogs/apoquel/pdf/apoqueltechnicalmonograph.pdf.
- Gonzales, A.J.; Bowman, J.W.; Fici, G.J.; Zhang, M.; Mann, D.W.; Mitton-Fry, M. Oclacitinib (APOQUEL®) is a novel Janus kinase inhibitor with activity against cytokines involved in allergy. J. Vet. Pharmacol. Ther. 2014, 37, 317–324. [Google Scholar] [CrossRef]
- O’Shea, J.J. Targeting the Jak/STAT pathway for immunosuppression. Ann. Rheum. Dis. 2004, 63, 67–71. [Google Scholar] [CrossRef]
- Andrewes, C.H.; Harisijades, S. Propagation of myxoma virus in one-day old mice. Br. J. Exp. Pathol. 1955, 36, 18–21. [Google Scholar]
- Fenner, F.; Woodroffe, G.M. The pathogenesis of infectious myxomatosis: the mechanism of infection and the immunological response in the European rabbit (Oryctolagus cuniculus). Br. J. Exp. Pathol. 1953, 34, 400–411. [Google Scholar]
- Gorski, J.; Mizak, B.; Chrobocinska, M. Control of rabbit myxomatosis in Poland. Rev. Sci. Tech. 1994, 13, 869–879. [Google Scholar] [CrossRef] [PubMed]
- Jackson, E.W.; Dorn, C.R.; Saito, J.K.; McKercher, D.G. Absence of serological evidence of myxoma virus infection in humans exposed during an outbreak of myxomatosis. Nature 1966, 211, 313–314. [Google Scholar] [CrossRef] [PubMed]
- McCabe, V.J.; Tarpey, I.; Spibey, N. Vaccination of cats with an attenuated recombinant myxoma virus expressing feline calicivirus capsid protein. Vaccine 2002, 20, 2454–2462. [Google Scholar] [CrossRef] [PubMed]
- McCabe, V.J.; Spibey, N. Potential for broad-spectrum protection against feline calicivirus using an attenuated myxoma virus expressing a chimeric FCV capsid protein. Vaccine 2005, 23, 5380–5388. [Google Scholar] [CrossRef] [PubMed]
- Pignolet, B.; Boullier, S.; Gelfi, J.; Bozzetti, M.; Russo, P.; Foulon, E.; Meyer, G.; Delverdier, M.; Foucras, G.; Bertagnoli, S. Safety and immunogenicity of myxoma virus as a new viral vector for small ruminants. J. Gen. Virol. 2008, 89, 1371–1379. [Google Scholar] [CrossRef] [PubMed]
- Fenner, F. Adventures with poxviruses of vertebrates. FEMS Microbiol. Rev. 2000, 24, 123–133. [Google Scholar] [CrossRef] [PubMed]
- MacNeill, A.L.; Turner, P.C.; Moyer, R.W. Mutation of the Myxoma virus SERP2 P1-site to prevent proteinase inhibition causes apoptosis in cultured RK-13 cells and attenuates disease in rabbits, but mutation to alter specificity causes apoptosis without reducing virulence. Virology 2006, 356, 12–22. [Google Scholar] [CrossRef]
- MacNeill, A.L.; Moldenhauer, T.; Doty, R.; Mann, T. Myxoma virus induces apoptosis in cultured feline carcinoma cells. Res. Vet. Sci. 2012, 93, 1036–1038. [Google Scholar] [CrossRef]
- Urbasic, A.S.; Hynes, S.; Somrak, A.; Contakos, S.; Rahman, M.M.; Liu, J.; MacNeill, A.L. Oncolysis of canine tumor cells by myxoma virus lacking the serp2 gene. Am. J. Vet. Res. 2012, 73, 1252–1261. [Google Scholar] [CrossRef]
- Doty, R.A.; McFadden, G.; Roy, E.J.; MacNeill, A.L. Histological evaluation of intratumoral myxoma virus treatment in an immunocompetent mouse model of melanoma. Oncolytic Virotherapy 2013, 2, 1–17. [Google Scholar]
- Liu, J.; Wennier, S.; Reinhard, M.; Roy, E.; MacNeill, A.; McFadden, G. Myxoma virus expressing interleukin-15 fails to cause lethal myxomatosis in European rabbits. J. Virol. 2009, 83, 5933–5938. [Google Scholar] [CrossRef] [PubMed]
- Das, S.; Idate, R.; Lana, S.E.; Regan, D.P.; Duval, D.L. Integrated analysis of canine soft tissue sarcomas identifies recurrent mutations in TP53, KMT genes and PDGFB fusions. bioRxiv Prepr. Serv. Biol. 2023. [CrossRef] [PubMed]
- Tosic, V.; Thomas, D.L.; Kranz, D.M.; Liu, J.; McFadden, G.; Shisler, J.L.; MacNeill, A.L.; Roy, E.J. Myxoma virus expressing a fusion protein of interleukin-15 (IL15) and IL15 receptor alpha has enhanced antitumor activity. PLoS One 2014, 9, e109801. [Google Scholar] [CrossRef] [PubMed]
- Livak, K.J.; Schmittgen, T.D. Analysis of relative gene expression data using real-time quantitative PCR and the 2-ΔΔCT method. Methods 2001, 25, 402–408. [Google Scholar] [CrossRef]
- Park, W.J.; Park, B.J.; Song, Y.J.; Lee, D.H.; Yuk, S.S.; Lee, J.B.; Park, S.Y.; Song, C.S.; Lee, S.W.; Choi, I.S. Analysis of cytokine production in a newly developed canine tracheal epithelial cell line infected with H3N2 canine influenza virus. Arch. Virol. 2015, 160, 1397–1405. [Google Scholar] [CrossRef] [PubMed]
- Jassies-van der Lee, A.; Rutten, V.; Spiering, R.; van Kooten, P.; Willemse, T.; Broere, F. The immunostimulatory effect of CpG oligodeoxynucleotides on peripheral blood mononuclear cells of healthy dogs and dogs with atopic dermatitis. Vet. J. 2014, 200, 103–108. [Google Scholar] [CrossRef] [PubMed]
- Belloni, L.; Allweiss, L.; Guerrieri, F.; Pediconi, N.; Volz, T.; Pollicino, T.; Petersen, J.; Raimondo, G.; Dandri, M.; Levrero, M. IFN-α inhibits HBV transcription and replication in cell culture and in humanized mice by targeting the epigenetic regulation of the nuclear cccDNA minichromosome. J. Clin. Invest. 2012, 122, 529–537. [Google Scholar] [CrossRef] [PubMed]
- Kim, K.S.; Choi, K.J.; Bae, S. Interferon-gamma enhances radiation-induced cell death via downregulation of Chk1. Cancer Biol. Ther. 2012, 13, 1018–1025. [Google Scholar] [CrossRef]
- O’Brien, W.J.; Heimann, T.; Tsao, L.S.; Seet, B.T.; McFadden, G.; Taylor, J.L. Regulation of nitric oxide synthase 2 in rabbit corneal cells. Invest. Ophthalmol. Vis. Sci. 2001, 42, 713–719. [Google Scholar]
- Greifenberg, V.; Ribechini, E.; Rößner, S.; Lutz, M.B. Myeloid-derived suppressor cell activation by combined LPS and IFN-γ treatment impairs DC development. Eur. J. Immunol. 2009, 39, 2865–2876. [Google Scholar] [CrossRef] [PubMed]
- Lun, X.; Alain, T.; Zemp, F.J.; Zhou, H.; Rahman, M.M.; Hamilton, M.G.; McFadden, G.; Bell, J.; Senger, D.L.; Forsyth, P.A. Myxoma virus virotherapy for glioma in immunocompetent animal models: optimizing administration routes and synergy with rapamycin. Cancer Res. 2010, 70, 598–608. [Google Scholar] [CrossRef] [PubMed]
- Bartee, E.; Mohamed, M.R.; Lopez, M.C.; Baker, H. V.; McFadden, G. The Addition of Tumor Necrosis Factor plus Beta Interferon Induces a Novel Synergistic Antiviral State against Poxviruses in Primary Human Fibroblasts. J. Virol. 2009, 83, 498–511. [Google Scholar] [CrossRef]
- Arnold, K.A.; Peterson, L.F.; Beck, L.A.; Brewer, M.G. JAK Signaling Is Critically Important in Cytokine-Induced Viral Susceptibility of Keratinocytes. Int. J. Mol. Sci. 2023, 24. [Google Scholar] [CrossRef] [PubMed]
- Ashton, L. V; Graham, B.; Afzali, M.F.; Gustafson, D.; MacNeill, A.L. <p>Treatment of an Alveolar Rhabdomyosarcoma Allograft with Recombinant Myxoma Virus and Oclacitinib</p>. Oncolytic Virotherapy 2020, Volume 9, 17–29. [Google Scholar] [CrossRef]
- Lun, X.Q.; Zhou, H.; Alain, T.; Sun, B.; Wang, L.; Barrett, J.W.; Stanford, M.M.; McFadden, G.; Bell, J.; Senger, D.L.; et al. Targeting human medulloblastoma: oncolytic virotherapy with myxoma virus is enhanced by rapamycin. Cancer Res. 2007, 67, 8818–8827. [Google Scholar] [CrossRef] [PubMed]
- Weng, M.; Gong, W.; Ma, M.; Chu, B.; Qin, Y.; Zhang, M.; Lun, X.; McFadden, G.; Forsyth, P.; Yang, Y.; et al. Targeting gallbladder cancer: oncolytic virotherapy with myxoma virus is enhanced by rapamycin in vitro and further improved by hyaluronan in vivo. Mol. Cancer 2014, 13, 82. [Google Scholar] [CrossRef]
- France, M.R.; Thomas, D.L.; Liu, J.; McFadden, G.; MacNeill, A.L.; Roy, E.J. Intraventricular injection of myxoma virus results in transient expression of viral protein in mouse brain ependymal and subventricular cells. J. Gen. Virol. 2011, 92, 195–199. [Google Scholar] [CrossRef]
- Zemp, F.J.; McKenzie, B.A.; Lun, X.; Reilly, K.M.; Mcfadden, G.; Yong, V.W.; Forsyth, P.A. Cellular factors promoting resistance to effective treatment of glioma with oncolytic Myxoma virus. Cancer Res. 2014, 74, 7260–73. [Google Scholar] [CrossRef]
- Stanford, M.M.; Shaban, M.; Barrett, J.W.; Werden, S.J.; Gilbert, P.A.; Bondy-Denomy, J.; Mackenzie, L.; Graham, K.C.; Chambers, A.F.; McFadden, G. Myxoma virus oncolysis of primary and metastatic B16F10 mouse tumors in vivo. Mol. Ther. 2008, 16, 52–59. [Google Scholar] [CrossRef] [PubMed]
- Stanford, M.M.; Barrett, J.W.; Nazarian, S.H.; Werden, S.; McFadden, G. Oncolytic virotherapy synergism with signaling inhibitors: Rapamycin increases myxoma virus tropism for human tumor cells. J. Virol. 2007, 81, 1251–1260. [Google Scholar] [CrossRef] [PubMed]
- Thomas, D.L.; Doty, R.; Tosic, V.; Liu, J.; Kranz, D.M.; McFadden, G.; Macneill, A.L.; Roy, E.J. Myxoma virus combined with rapamycin treatment enhances adoptive T cell therapy for murine melanoma brain tumors. Cancer Immunol. Immunother. 2011, 60, 1461–1472. [Google Scholar] [CrossRef] [PubMed]
- Moerdyk-Schauwecker, M.; Shah, N.R.; Murphy, A.M.; Hastie, E.; Mukherjee, P.; Grdzelishvili, V.Z. Resistance of pancreatic cancer cells to oncolytic vesicular stomatitis virus: Role of type I interferon signaling. Virology 2013, 436, 221–234. [Google Scholar] [CrossRef]
- Dold, C.; Rodriguez Urbiola, C.; Wollmann, G.; Egerer, L.; Muik, A.; Bellmann, L.; Fiegl, H.; Marth, C.; Kimpel, J.; Von Laer, D. Application of interferon modulators to overcome partial resistance of human ovarian cancers to VSV-GP oncolytic viral therapy. Mol. Ther. - Oncolytics 2016, 3, 16021. [Google Scholar] [CrossRef] [PubMed]
- Adelfinger, M.; Gentschev, I.; Grimm de Guibert, J.; Weibel, S.; Langbein-Laugwitz, J.; Härtl, B.; Murua Escobar, H.; Nolte, I.; Chen, N.G.; Aguilar, R.J.; et al. Evaluation of a New Recombinant Oncolytic Vaccinia Virus Strain GLV-5b451 for Feline Mammary Carcinoma Therapy. PLoS One 2014, 9, e104337. [Google Scholar] [CrossRef] [PubMed]
- Escobar-Zarate, D.; Liu, Y.-P.; Suksanpaisan, L.; Russell, S.; Peng, K.-W. Overcoming cancer cell resistance to VSV oncolysis with JAK1/2 inhibitors. Cancer Gene Ther. 2013, 20, 582–589. [Google Scholar] [CrossRef] [PubMed]
- Cataldi, M.; Shah, N.R.; Felt, S.A.; Grdzelishvili, V.Z. Breaking resistance of pancreatic cancer cells to an attenuated vesicular stomatitis virus through a novel activity of IKK inhibitor TPCA-1. Virology 2015, 485, 340–354. [Google Scholar] [CrossRef] [PubMed]
- Ghonime, M.G.; Cassady, K.A. Combination Therapy Using Ruxolitinib and Oncolytic HSV Renders Resistant MPNSTs Susceptible to Virotherapy. Cancer Immunol. Res. 2018, 6, 1499–1510. [Google Scholar] [CrossRef] [PubMed]
- Kurokawa, C.; Iankov, I.D.; Anderson, S.K.; Aderca, I.; Leontovich, A.A.; Maurer, M.J.; Oberg, A.L.; Schroeder, M.A.; Giannini, C.; Greiner, S.M.; et al. Constitutive interferon pathway activation in tumors as an efficacy determinant following oncolytic virotherapy. J. Natl. Cancer Inst. 2018, 110, 1123–1132. [Google Scholar] [CrossRef]
- Keller, A.; Wingelhofer, B.; Peter, B.; Bauer, K.; Berger, D.; Gamperl, S.; Reifinger, M.; Cerny-Reiterer, S.; Moriggl, R.; Willmann, M.; et al. The JAK2/STAT5 signaling pathway as a potential therapeutic target in canine mastocytoma. Vet. Comp. Oncol. 2018, 16, 55–68. [Google Scholar] [CrossRef]
- Sebio, A.; Wilky, B.A.; Keedy, V.L.; Jones, R.L. The current landscape of early drug development for patients with sarcoma in the immunotherapy era. Future Oncol. 2018, 14, 1197. [Google Scholar] [CrossRef] [PubMed]
| Target cDNA | Forward primer 5’…3’ | Reverse primer 5’…3’ | Reference | GenBank accession number | Product size (base pairs) |
|---|---|---|---|---|---|
| β-actin | CCG CGA GAA GAT GAC CCA GA | GTG AGG ATC TTC ATG AGG TAG TCG G | [47] | Z70044 | 81 |
| IFNα | TGG GAC AGA TGA GGA GAC TCT C | GAA GAC CTT CTG GGT CAT CAC G | [48] | AB125936* | 143 |
| IFNβ | CCA GTT CCA GAA GGA GGA CA | TGT CCC AGG TGA AGT TTT CC | [47] | NM_001135787 | 200 |
| TNFα | GAG CCG ACG TGC CAA TG | CAA CCC ATC TGA CGG CAC TA | [47] | Z70046 | 79 |
| IL-1β | TCT CCC ACC AGC TCT GTA ACA A | GCA GGG CTT CAG CTT CTC | [47] | Z70047 | 80 |
| IFNγ | AGC GCA AGG CGA TAA ATG | GCG GCC TCG AAA CAG ATT | [48] | NM_001003174 | 121 |
| IL-4 | CAT CCT CAC AGC GAG AAA CG | CCT TAT CGC TTG TGT TCT TTG GA | [47] | AF054833 | 83 |
| IL-10 | CGC TGT CAC CGA TTT CTT CC | CTG GAG CTT ACT AAA TGC GCT CT | [47] | U33843 | 78 |
| TGFβ | CAA GGA TCT GGG CTG GAA GTG GA | CCA GGA CCT TGC TGT ACT GCG TGT | [48] | NM_001003309 | 113 |
| Canine Cells | Target | Description | Fold Change |
|---|---|---|---|
| Fibroblasts | PIK3CD | phosphatidylinositol-4,5-bisphosphate 3-kinase, catalytic subunit delta | -67.5 |
| BRCA1 | breast cancer 1, early onset | 14.8 | |
| EGR1* | early growth response 1 | 31.4 | |
| SERPINB2* | serpin peptidase inhibitor, clade B (ovalbumin), member 2 | 69.4 | |
| FOS* | FBJ murine osteosarcoma viral oncogene homolog | 82.7 | |
| STS-1 | SOX10 | SRY (sex determining region Y)-box 10 | -68.5 |
| SELE* | selectin E | 10.2 | |
| MCAM | melanoma cell adhesion molecule | 10.2 | |
| IL10RA* | interleukin 10 receptor, alpha | 12.3 | |
| CTSS | cathepsin S | 14.9 | |
| FOS* | FBJ murine osteosarcoma viral oncogene homolog | 25.8 | |
| KLRA1 | killer cell lectin-like receptor subfamily A, member 1 | 46.0 | |
| CCL20* | chemokine (C-C motif) ligand 20 | 103.5 | |
| STS-2 | PIK3CD | phosphatidylinositol-4,5-bisphosphate 3-kinase, catalytic subunit delta | -118.5 |
| CD97 | CD97 molecule | -68.0 | |
| CTSS* | cathepsin S | 32.5 |
| Treatment | STS-1 | STS-2 | FB |
|---|---|---|---|
| No Treatment | 100.00 (1.63) | 100.00 (1.26) | 100.00 (10.28) |
| IFNα | 30.88* (7.66) | 30.10* (7.97) | 40.86* (5.11) |
| IFNβ | 50.24* (5.53) | 32.44* (8.67) | 17.97* (5.62) |
| TNFα | 30.02* (5.06) | 134.50 (15.97) | 107.05 (14.19) |
| IFNγ | 70.65 (18.42) | 97.02 (27.41) | 125.57 (6.14) |
| IFNα + IFNβ | 31.12* (8.57) | 22.18* (5.87) | 47.91* (3.40) |
| IFNα + TNFα | 19.32* (3.30) | 53.54* (9.08) | 55.72* (5.27) |
| IFNβ + TNFα | 17.69* (1.58) | 36.92* (7.86) | 46.03* (6.21) |
| TNFα + IFNγ | 23.10* (5.47) | 82.28 (21.85) | 113.67 (9.87) |
| IFNα + IFNβ + IFNγ | 24.57* (5.91) | 42.33* (8.01) | 43.71* (3.86) |
| IFNα + IFNβ + TNFα + IFNγ | 11.59* (2.13) | 27.12* (6.00) | 36.78* (12.86) |
| Patient | Post-operative treatment | Excised tumor histopathology | Outcome | Post-operative day |
|---|---|---|---|---|
| 1 | MXYVΔSERP2 | Grade III STS, incompletely excised | Recurrence | 42 |
| 2 | MXYVΔSERP2 | Grade III STS, incompletely excised | Recurrence | 159 |
| 3 | MXYVΔSERP2 | Grade II STS, incompletely excised | Lost to follow-up | 32 |
| 4 | MXYVΔSERP2 | Grade II STS, fibrous capsule <1 mm thick | No regrowth | 916 |
| 5 | MXYVΔSERP2 | Grade II STS, incompletely excised | No regrowth, euthanized due to unrelated causes | 231 |
| 6 | O+MXYVΔSERP2 | Grade III STS, incompletely excised | Recurrence | 188 |
| 7 | O+MXYVΔSERP2 | Grade II STS, incompletely excised | No regrowth, pyogranulomatous inflammation at incision site (Day 31) | 378 |
| 8 | O+MXYVΔSERP2 | Grade II STS, incompletely excised | Recurrence | 40 |
| 9 | O+MXYVΔSERP2 | Grade III STS, completely excised with 2 mm margins | Recurrence | 372 |
Disclaimer/Publisher’s Note: The statements, opinions and data contained in all publications are solely those of the individual author(s) and contributor(s) and not of MDPI and/or the editor(s). MDPI and/or the editor(s) disclaim responsibility for any injury to people or property resulting from any ideas, methods, instructions or products referred to in the content. |
© 2023 by the authors. Licensee MDPI, Basel, Switzerland. This article is an open access article distributed under the terms and conditions of the Creative Commons Attribution (CC BY) license (http://creativecommons.org/licenses/by/4.0/).


