1. Introduction
Crewed long lasting space flights, toward Moon and Mars, represent one of the most ambitious challenges of nowadays and near future, that are supposed to have a huge strategic impact on the development of advanced technologies [
1]. However, the space biomedicine research from the beginning of space exploration era [
2], has revealed that Space environment is hostile for the health of the human beings, and in general for all living systems [
3,
4]. Recent reviews [
2,
4] have clearly indicated the five threats for human health related to the long-lasting spaceflights and one of these is microgravity exposure. A full knowledge of the effects of microgravity is necessary to develop the proper countermeasures that will limit the physiology alterations of spaceflight crew. It is fair to highlight that the data on the effects of real spaceflight are limited and most of our knowledge on the influence of microgravity on living systems has been obtained thanks to ground-based microgravity simulators that allow the total control of the applied gravitational conditions, the simulation of different level of gravitational force, as well as relative low-cost replication of the experiments [
5]. To date, several ground-based microgravity simulators have been developed [
6] and one of them is the Random Positioning Machine (RPM) that has been chosen in the present study to mimic microgravity condition.
Published data revealed that real or simulated microgravity affect the physiology of the cells interfering with different cell mechanic “sensors” that differ depending on the features of phenotype and of differentiation status of the cells [
7]. However, it seems that a common signature of microgravity effect on mammalian cells is represented by the alteration of oxidative metabolism with the increase of ROS levels [
8,
9]. Among the sources of ROS in eukaryotic cells, the main systems are the mitochondrial electron transport chain and the NADPH oxidases (NOXs). These enzymatic systems control the balance among oxidative eustress and oxidative distress, and a complex crosstalk and substantial interplay between mitochondria and NOXs activity, has been demonstrated in different cellular models [
10]. It is worth mentioning, that ROS formation is necessary, under physiological conditions, being active as second messengers and signal transduction molecules (oxidative eustress) that regulate cellular processes such as survival, growth, proliferation, and apoptosis [
11]. On the other hand, it is well known that the excessive production of ROS results in oxidative stress (or oxidative distress) that in turn causes cellular dysfunctions or damage to cell biomolecules, including proteins, lipids, and nucleic acids.
To maintain the oxidative balance and avoid the harmful effects of ROS accumulation, mammalian cells are provided by sophisticated antioxidant systems. These systems include antioxidant enzymes such as superoxide dismutase (SOD), catalase (CAT), and glutathione peroxidase (GPX1), as well as non-enzymatic antioxidants such as vitamin C and E, and glutathione [
12]. The mitochondria themselves, that are considered the main endogenous producers of ROS, possess their own antioxidant defense systems. Furtherer mitochondria have the ability to modulate cellular H
2O
2 levels, thus functioning as key regulators of ROS-mediated signaling pathways [
13].
The balance between ROS generation and antioxidant-mediated ROS detoxification ensures that ROS levels were tightly controlled and finely tuned to act as second messengers and cell signaling molecules: the lack of this coordination results in ROS accumulation and cell damage.
Long lasting spaceflights make necessary answering to the open question on the effect of space environment on male germ cells [
14,
15], since their deregulation can be inherited by astronaut’s offspring [
16]. Published data on the effects of microgravity on human male germ cells is scarce and mainly limited to male gametes (spermatozoa) with variable results [
17,
18,
19]. Animal models indicate that mitotic and post-mitotic germ cells are sensitive to gravitational force [
20]. In particular, in mouse spermatogonia in vitro cell cultures, microgravity exposure stimulates differentiation and meiotic entry [
20,
21]. It is fair to highlight that in vivo studies or ex vivo organ cultures in microgravity condition provided evidence of microgravity-triggered germ cell altered behavior, even if these studies do not report necessarily the direct effect of microgravity on germ cells, because the alterations of germ cells can be ascribed to the well-known detrimental effect of microgravity on steroidogenic Leydig cells [
22,
23,
24]. Finally, it should be mentioned that germ cells are also known to be very sensitive to oxidative stress, and therefore it is of particular interest to evaluate the effect of microgravity on these cell types monitoring the key points of their oxidative system [
25].
In the present manuscript we studied the possible microgravity-triggered alterations in a human model of male Primordial Germ Cells: the TCam-2 cells [
26]. In previous papers we studied the effects of microgravity on these cells cultured as monolayer (2D cell culture) [
27,
28] observing microgravity-dependent transient activation of autophagy, intracellular calcium increase, and ROS accumulation. To evaluate the role of adhesive behavior in the cell response to microgravity, in this manuscript we cultured TCam-2 cells in low adhesion condition: in this way the cells do not adhere to a substrate but are forced to keep the contact to each other forming cell to cell junctions and giving rise to TCam-2 cell 3D spheroids. The results obtained indicate that some of the responses to microgravity are influenced by the culture conditions, even if there are several aspects of microgravity-triggered cell responses that are common in both culture conditions. Moreover, our results highlight the capability of TCam-2 cells to trigger compensatory mechanism to counteract microgravity-induced cell alterations.
2. Materials and Methods
2.1. Cell Culture and microgravity parameters
TCam-2 seminoma cells were cultured in RPMI 1640 (Sigma-Aldrich, cat. R8758) supplemented with 10% Foetal Bovine Serum (FBS, Gibco, cat. 10270), penicillin/streptomycin (Sigma-Aldrich, cat. P0781), L-Glutamine (Sigma Aldrich, cat. G7513), Gentamicin (Sigma Aldrich, cat. G1272) and MEM NEAA (Gibco, cat. 11140-035) (see Ferranti et al 2014 for details [
28]). Mycoplasma testing was routinely done with the N-GARDE Mycoplasma PCR Reagent set (Euro-Clone, cat. EMK090020, Milano, Italy).
To obtain the TCam-2 spheroids, 60,000 cells/cm2 were seeded in low attachment Petri dishes with coating agar 1% in RPMI, 10% FBS. TCam-2 cells were seeded for 24 h at 37°C in a humidified atmosphere with 5% CO2. When the spheroids were completely formed, medium was added up to the lid to avoid air bubbles formation.
Then, experiments were performed on spheroids cultured for 24 h s-microgravity in the RPM or at 1 g, outside the Ctr in the same incubator.
The RPM is a 3D clinostat. It is consisting in two rotating frames. This tool does not eliminate the gravity, but it is based on the principle of “gravity vector averaging”: it allows to apply a 1g stimulus in all directions and the sum of gravitational force vectors tends to zero. All experiments were planned also described in [
27].
2.2. Cell viability assay
To reveal spheroids viability, we performed adhesion test on plastic.
After 24 h unitary gravity or RPM exposure, TCam-2 spheroids were placed at 1g in a petri dish and cultured for 24 h at 37°C in a humidified atmosphere with 5% CO2. Then, in order to analyze spheroid adhesion, the samples were observed with an optical microscope and images were recovered using a 10x obj. (Leica microscope DM IRB). To confirm spheroids viability, we used apoptosis/ necrosis assay kit (Abcam, cat. ab176749). Live TCam-2 spheroids after 24 h Ctr and RPM were stained with Apopxin green indicator (apoptotic cells), 7-AAD (necrotic cells), CytoCalcein violet 450 (healthy cells) according to the manufacturer’s instructions and incubated at room temperature for 45 min. After staining, spheroids were analyzed using Confocal Microscope (Zeiss LM900 confocal microscope). Optical spatial series with a step size of 1µm were recovered. The intensity of CytoCalcein violet, Apopxin green 7-AAD red fluorescences were determined with the use of Zen Blue software, using the Sum of Intensity (Sum(I)), which represent the total fluorescent intensity recovered within the z-axis of each series. The quantitative data, for each spheroid stack profile, were normalized for total area. The means ± S.E.M. for green (apoptotic cells) and red fluorescence (necrotic cells) was graphed as ratio between Sum(I)/µm2.
2.3. Measurements of glucose and lactate levels
The measurements of glucose and lactate levels in the growth media were performed according to the protocol described in Morabito et al. [
27]. To normalize the results, glucose levels were expressed as g glucose in the medium and mg proteins from the spheroids; lactate levels were expressed as mmol lactate in the medium and mg protein mg proteins from the spheroids.
2.4. Western Blot Analysis
Proteins were extracted from TCam-2 spheroids recovered after 24 h Ctr or RPM, quantified and separated using a protocol previously described Morabito et al. [
27]. Equal amounts of proteins (20 µg) were loaded for Western blotting analysis. The membranes were blocked with EveryBlot Blocking Buffer (Biorad, Segrate, Italy) for 15 min at room temperature before incubation with primary antibodies overnight at 4°C. After washing, the membranes were incubated with horseradish peroxidase-conjugated appropriate secondary antibodies (1:10,000 in blocking buffer) for 1 hour at room temperature. The signals were detected using an ECL kit (GE Healthcare, Cologno Monzese, Italy) and analyzed with an image acquisition system (Uvitec mod Alliance 9.7, Uvitec, Cambridge, UK). Primary antibodies used in this study included: a mouse monoclonal anti calmodulin (Merck Life Science S.r.l., Milan Italy, cod 05-173 1:1000 dilution), a rabbit monoclonal anti- phospho-CaMKII (Thr286) (Cell Signaling Technology, Pero, Italy, cod. 12716 1:1000 dilution), a rabbit monoclonal anti-CaMKII (Cell Signaling Technology, cod. 4436 1:1000 dilution), a rabbit polyclonal anti ATP2A2/SERCA2 (Cell Signaling Technology, cod. 4388 1:1000 dilution), a rabbit polyclonal anti-TOMM 20 (Thermo Fisher Scientific, Monza, Italy, cod. PA5-52843, 1:1000 dilution); a rabbit polyclonal anti-SOD1 (Thermo Fisher Scientific, cod. PA527240, 1:5000 dilution,); a mouse monoclonal anti-SOD2 (Thermo Fisher Scientific, cod. MA5-31514, 1:5000 dilution); a rabbit monoclonal anti-catalase (Cell Signaling Technology, Pero, Italy, cod. 14097, 1:1000 dilution); a rabbit polyclonal anti-GPX1 (Thermo Fisher Scientific, cod. PA526323, 1:1000 dilution); a mouse monoclonal anti-NOX2 (Santa Cruz Biotechnology Inc., SantaCruz, CA, USA, cod. sc-130543, 1:500 dilution); rabbit monoclonal antibody anti- NOX4 (Thermo Fisher Scientific, cod. MA5-32090, 1:1000 dilution); a mouse monoclonal anti-4HNE (Merck Life Science S.r.l., Milan Italy, cod. SAB5202472, 1:1000 dilution); a polyclonal rabbit anti-3-nitrotyrosine (Merck Life Science S.r.l., cod. 4511, 1:1000 dilution); and a polyclonal rabbit anti-LC3B (Merck Life Science S.r.l., cod. L7543, 1:1000 dilution). A mouse monoclonal anti-GAPDH antibody (Merck Life Science S.r.l, 1:10,000 dilution) was used as a loading control.
2.5. Transmission Electron Microscopy analysis
To evaluate cell fine sub-cellular ultrastructural features, samples were fixed in glutaraldehyde 2,5%, and embedded in resin for Transmission Electron Microscopy purposes. Briefly, fixed samples were rinsed with cacodylate buffer for at least 1 h, post-fixed with 1% OsO4 in a cacodylate buffer, dehydrated in ethanol, and embedded in epoxy resin. Ultrathin sections (60 nm) were treated with uranyl-acetate and then contrasted with lead hydroxide. Samples were studied by Transmission Electron Microscope EM208S PHILIPS (FEI - ThermoFisher).
2.6. Confocal live cell imaging analysis for mitochondria function
2.6.1. JC1 assay
To reveal mitochondrial membrane potential, we used a kit based on the JC1 indicator (Invitrogen, cat. T3168) on live TCam-2 spheroids after 24 h Ctr and RPM according to the manufacturer’s instructions. JC1 dye exhibits potential-dependent distribution on the sides of the mitochondrial membrane, indicated by a green fluorescence emission (at 530 nm) for the monomeric form, which shifts to red one (at 590 nm) with a concentration-dependent formation of J-aggregates. Indeed, mitochondria depolarization is indicated by a decrease in the red/green fluorescence ratio.
The analyses were performed by Confocal Microscope (Zeiss LM900 confocal microscope). Optical spatial series with a step size of 1µm were recovered. The intensity of the red and green fluorescence was determined with the use of Zen Blue software, using the Sum of Intensity (Sum(I)). The quantitative data, for each spheroid stack profile, were normalized for total area and means ± S.E.M. was graphed as ratio between red fluorescence and green fluorescence.
2.6.2. MitoSOX Assay
To reveal mitochondrial superoxide anion, we used MitoSOXTM Red reagent (Invitrogen.cat. M36008) on live TCam.2 spheroids after 24 h Ctr and RPM. Cell staining was prepared according to the manufacturer’s instructions. This reagent is specifically oxidized by mitochondrial superoxide anion, and not by other ROS or RNS, becoming highly fluorescent (Em 580 nm). The analyses were performed by Confocal Microscope (Zeiss LM900 confocal microscope). Optical spatial series with a step size of 1µm were recovered. The intensity of the red fluorescence was determined with the use of Zen Blue software, using the Sum of Intensity of red fluorescence (Sum(I)). The quantitative data, for each spheroid stack profile, were normalized for total area and means ± S.E.M. was graphed as ratio between Sum(I)/µm2.
2.6.3. Reactive Oxygen Species Detection
To detect global levels of ROS we used a detection kit on live cells (Immunological Sciences, cat. ROS-100). TCam-2 spheroids were recovered after 24 h Ctr and RPM. Spheroids were washed using Hank’s balanced salt solution. H2DCFDA was used as ROS marker and a “Reactive Oxygen Control” was used as positive inducer of ROS according to the manufacturer’s instructions. After staining, fluorescent products (Em 530) relative to intracellular ROS level, were detected using Confocal microscope (Zeiss LM900). Optical spatial series with a step size of 1µm were recovered. The intensity of the green fluorescence was determined with the use of Zen Blue software, using the Sum of Intensity of green fluorescence (Sum(I)). The quantitative data, for each spheroid stack profile, were normalized for total area and the means ± S.E.M. was graphed as ratio between Sum(I)/µm2.
2.7. RNA isolation, RT-PCR and qRT-PCR analyses
To evaluate gene expression analysis of the antioxidant barrier enzymes, frozen TCam-2 spheroids (approximately 106 cells) were thawed on ice and processed for RNA extraction by using the RNeasy Mini Kit (Qiagen, Hilden, Germany) according to the instructions of the manufacturer. DNA contamination was eliminated by RNase-free DNase (Qiagen) treatment. Concentration, purity, and integrity of RNA samples were assessed by UV absorbance measurements with a NanoDrop spectrophotometer (Thermo Scientific, Waltham, MA, USA) and agarose gel electrophoresis. Reverse transcription of 2 µg RNA was carried out with the FastGene Scriptase Basic cDNA Synthesis kit (Nippon Genetics Europe, Düren, Germany) using random and oligo(dT) primers.
The mRNA levels were determined by quantitative PCR performed by using the qPCRBIO SybGreen mix (PCR Biosystems, UK). Reactions were carried out on cDNA corresponding to 30 ng of total RNA in the presence of transcript-specific primers (4 µM) in a final volume of 20 µl. The thermal protocol consisted of a 2 min step at 95°C, 40 cycles of 5 s at 95°C and 30 s at 60°C, followed by melting curve analysis. Amplifications were run in triplicate on the iCycler IQ detection system (BIO-RAD, CA, USA).
Gene expression was quantified by the comparative CT method using the expression level of the β-glucuronidase gene (GUSB) as reference. An inter-run calibration sample was used in each plate to correct for technical variance between runs and to compare results from different plates. The calibrator consisted of cDNA prepared from HEK293T cells. In each experimental PCR plate, samples were measured in triplicate. The primers used in in the assay were described in
Supplementary Table S1.
2.8. Statistical Analyses
Statistical analysis was performed using the Prism 8 software for Windows (GraphPad Software Inc., San Diego, CA, USA). All data were expressed as means ± S.E.M. Statistical comparisons between groups were performed by Student’s t-tests or by One-way ANOVA test followed by Bonferroni post-hoc test. A P value of <0.05 was considered statistically significant. (* p < 0.05; ** p < 0.01; *** p < 0.001).
4. Discussion
Long-lasting crewed space missions are considered one of the challenges of the near future for human beings. However, our knowledge on the impact of the permanence in the space environment on human health still has gaps to be filled for the setting up of proper countermeasures counteracting space-related threats. Among them microgravity represents one of the well-known threats for human health, associated to human space exploration [
2], and the protection of human reproductive health in space environment is fundamental in sight of astronaut’s offspring and, possibly, for the colonization of Mars. Mitotically active male germ cells have been demonstrated to be responsive to changes of gravitational force [
14,
15,
20]. Previous studies by our group demonstrated the microgravity-triggered responses of TCam-2 cells, a seminoma-derived cell line that maintains several features of Primordial Germ Cells. In those studies cells were seeded on plastic or glass dishes as monolayers [
27,
28], and therefore we wondered whether the
in vitro culture in three-dimensional condition, mimicking cell-cell contacts in organ tissue, could modify cell response to s-microgravity.
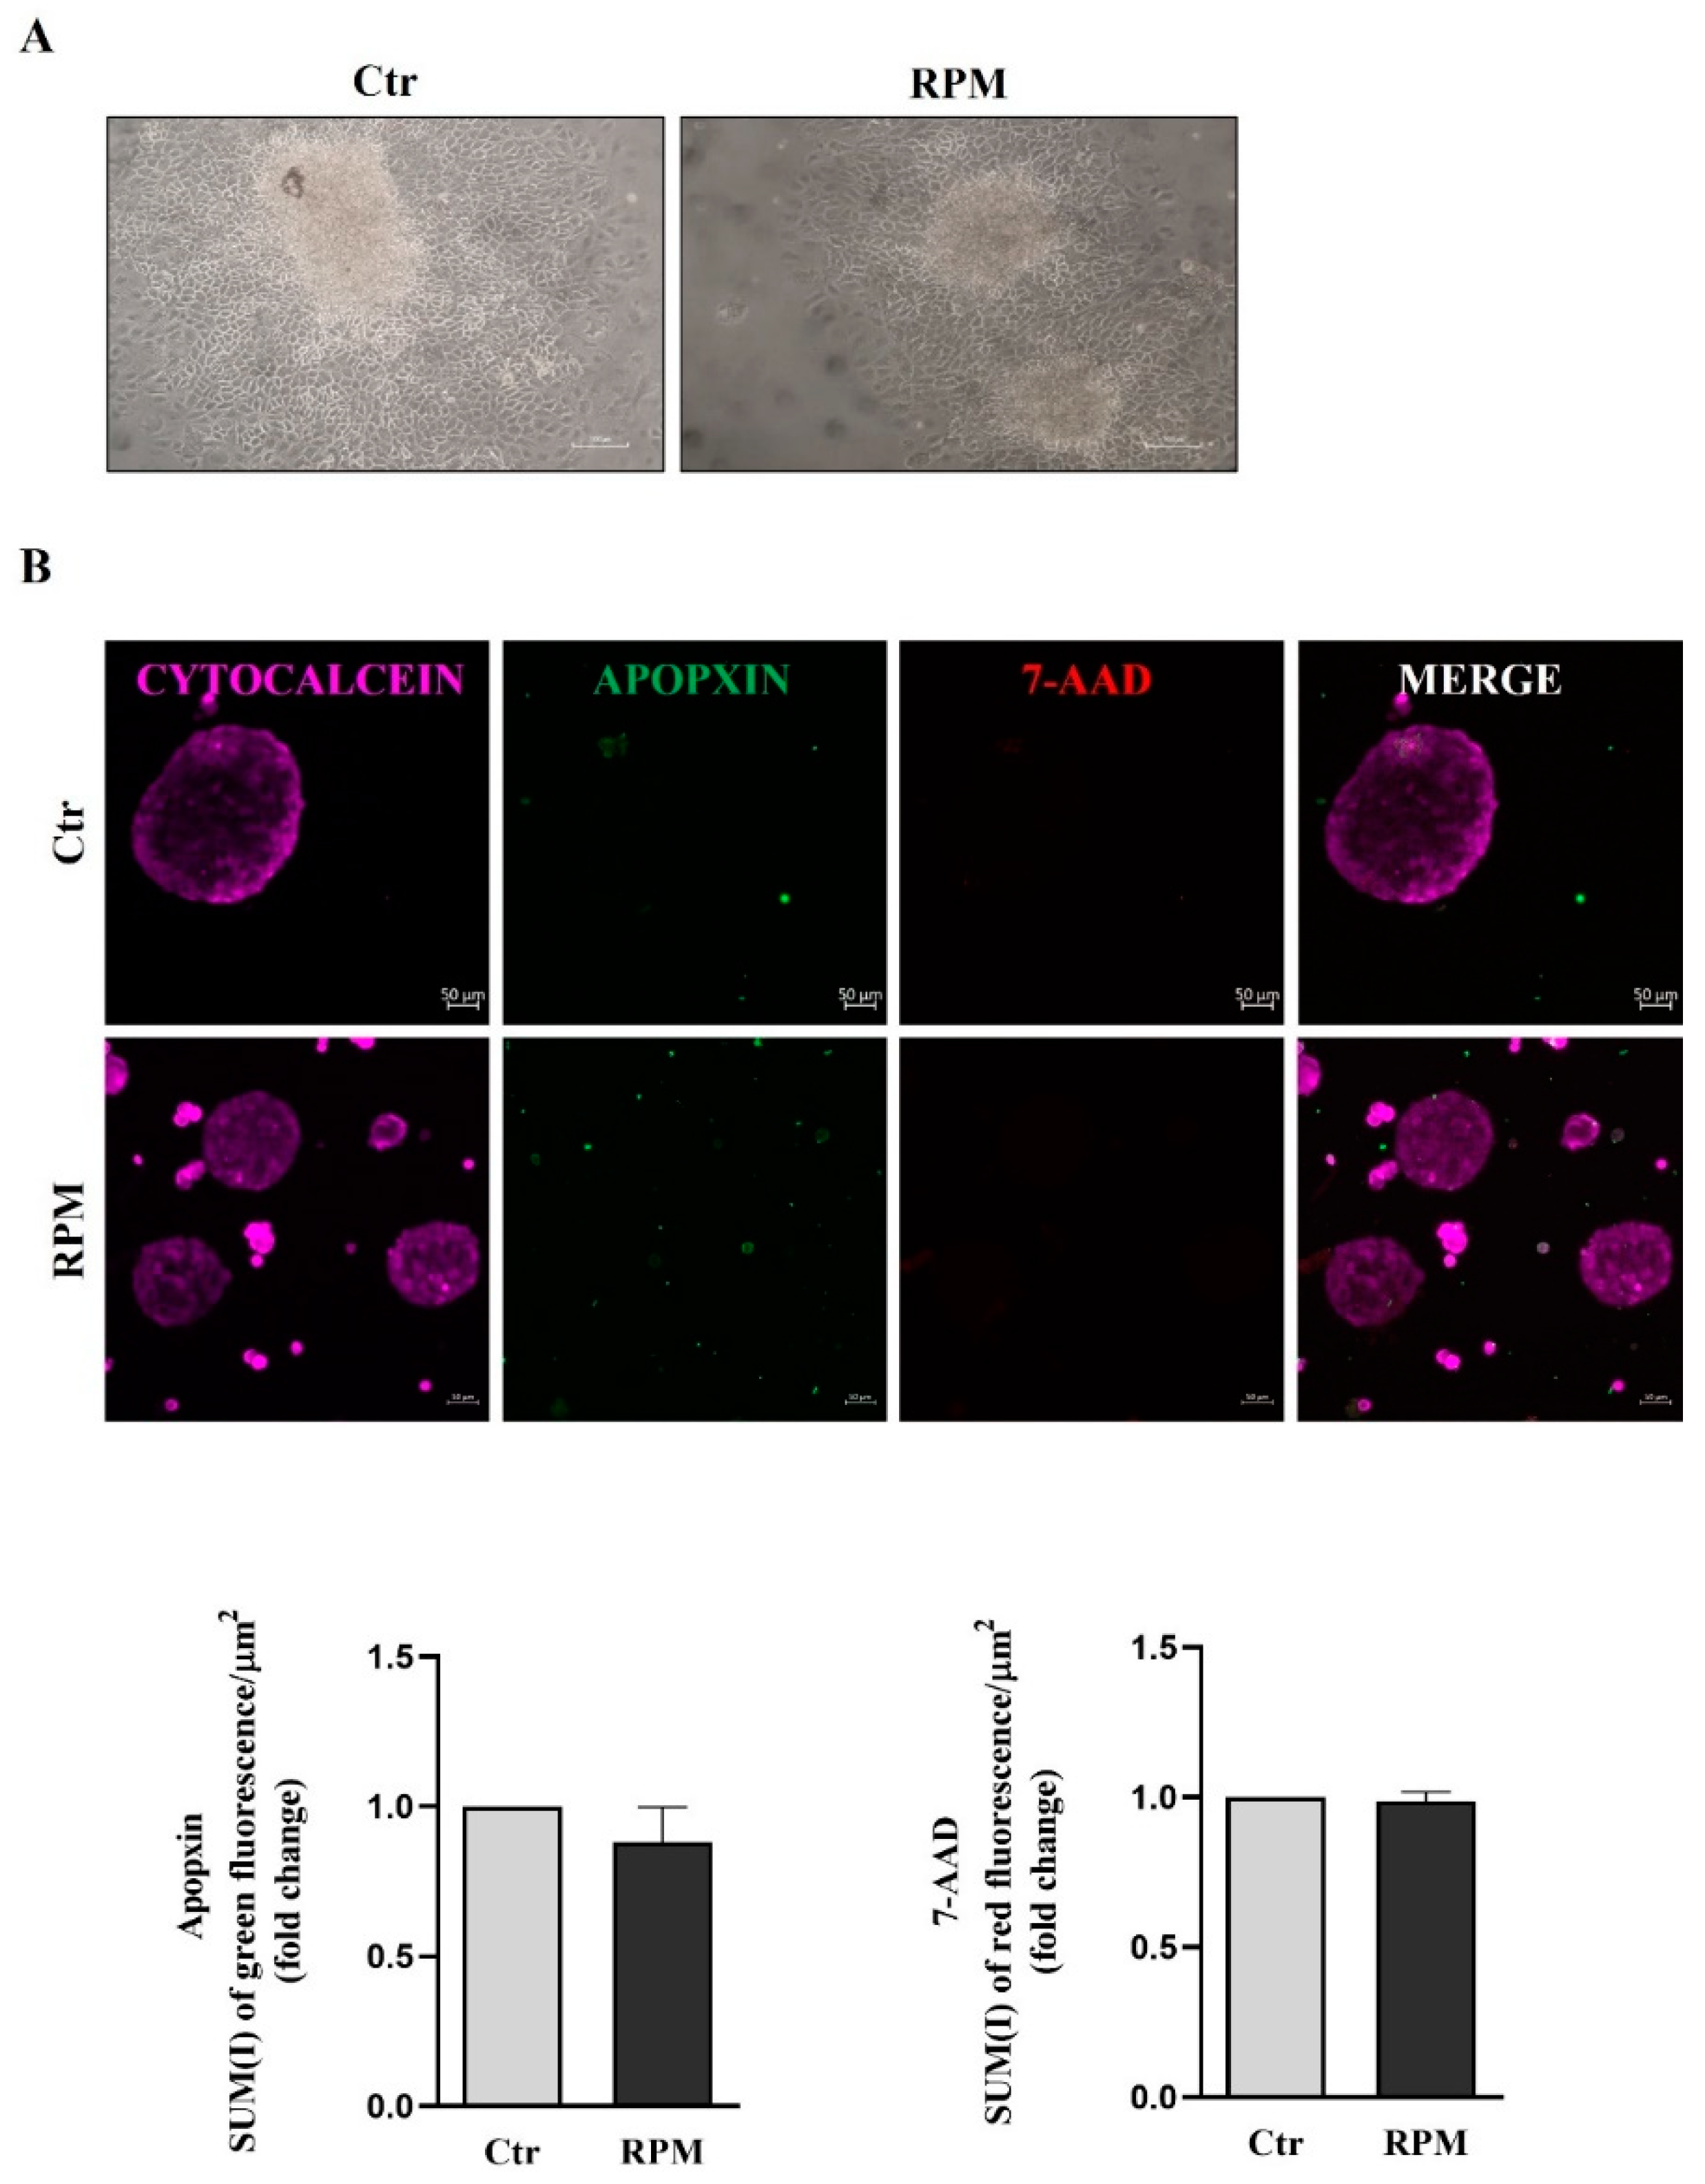
Herein, we report that TCam-2 cell spheroids respond to s-microgravity, as their bi-dimensionally cultured counterparts in some features, even if significant differences of cell response can be ascribed to the different culture condition. Cell death analysis revealed that RPM exposure for 24 h does not influence cell survival irrespectively to the bi- or three-dimensional culture condition, confirming the capability of TCam-2 to resist to acute exposure to microgravity (
Figure 1) [
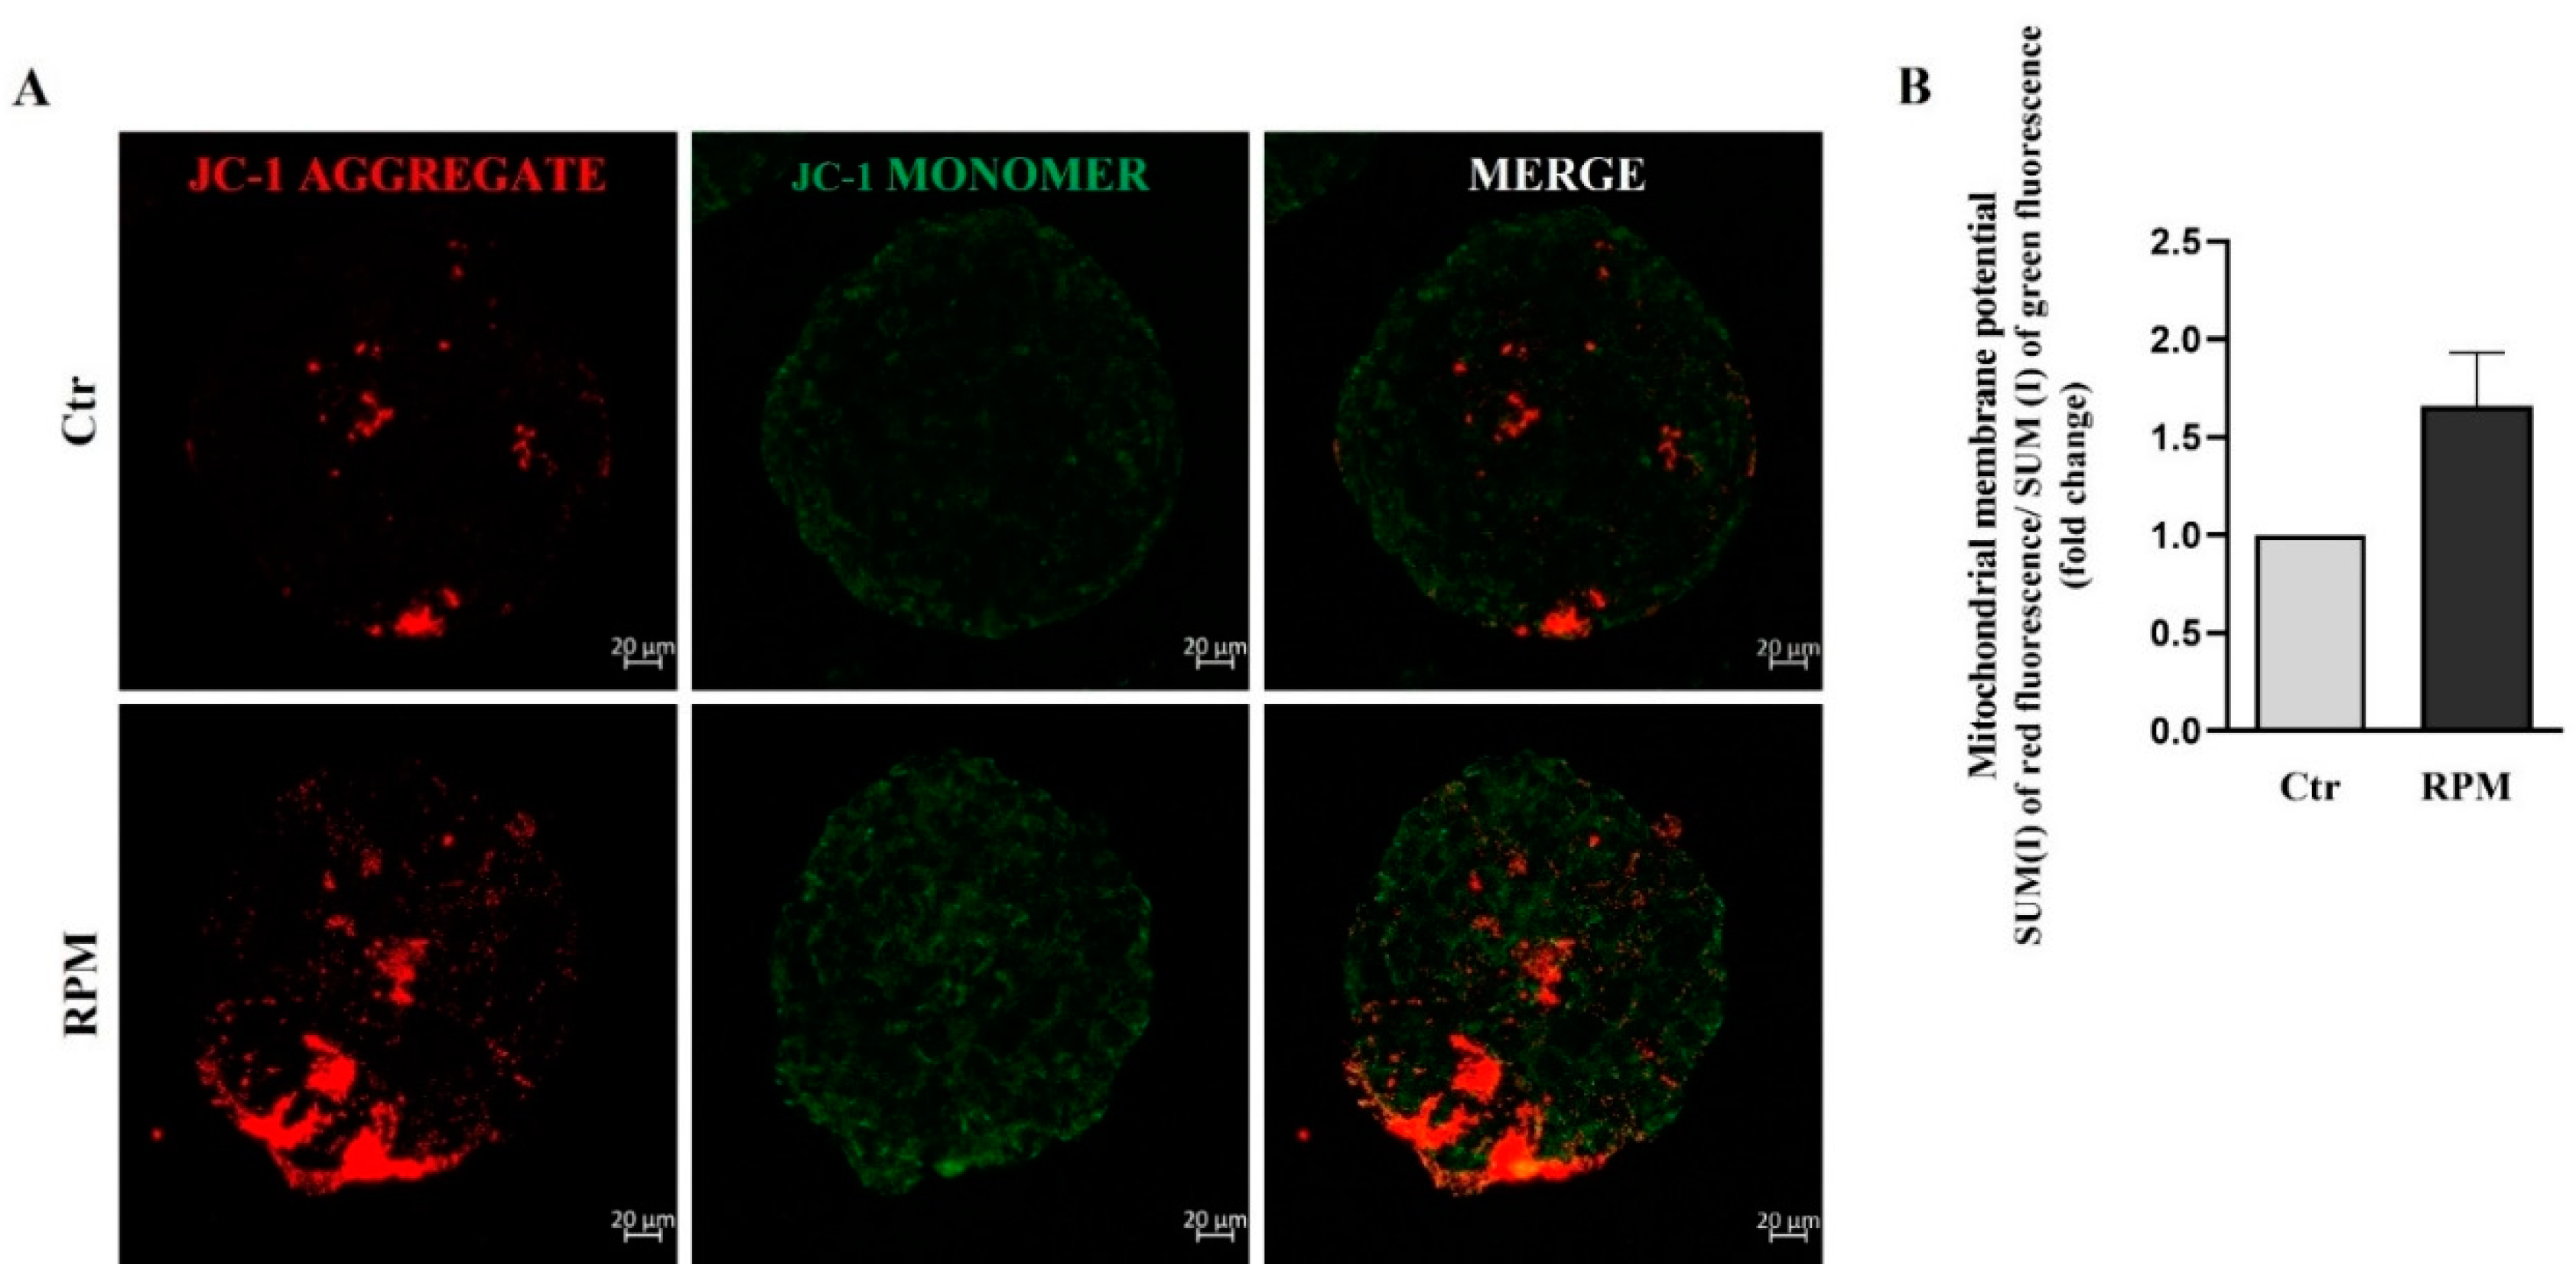
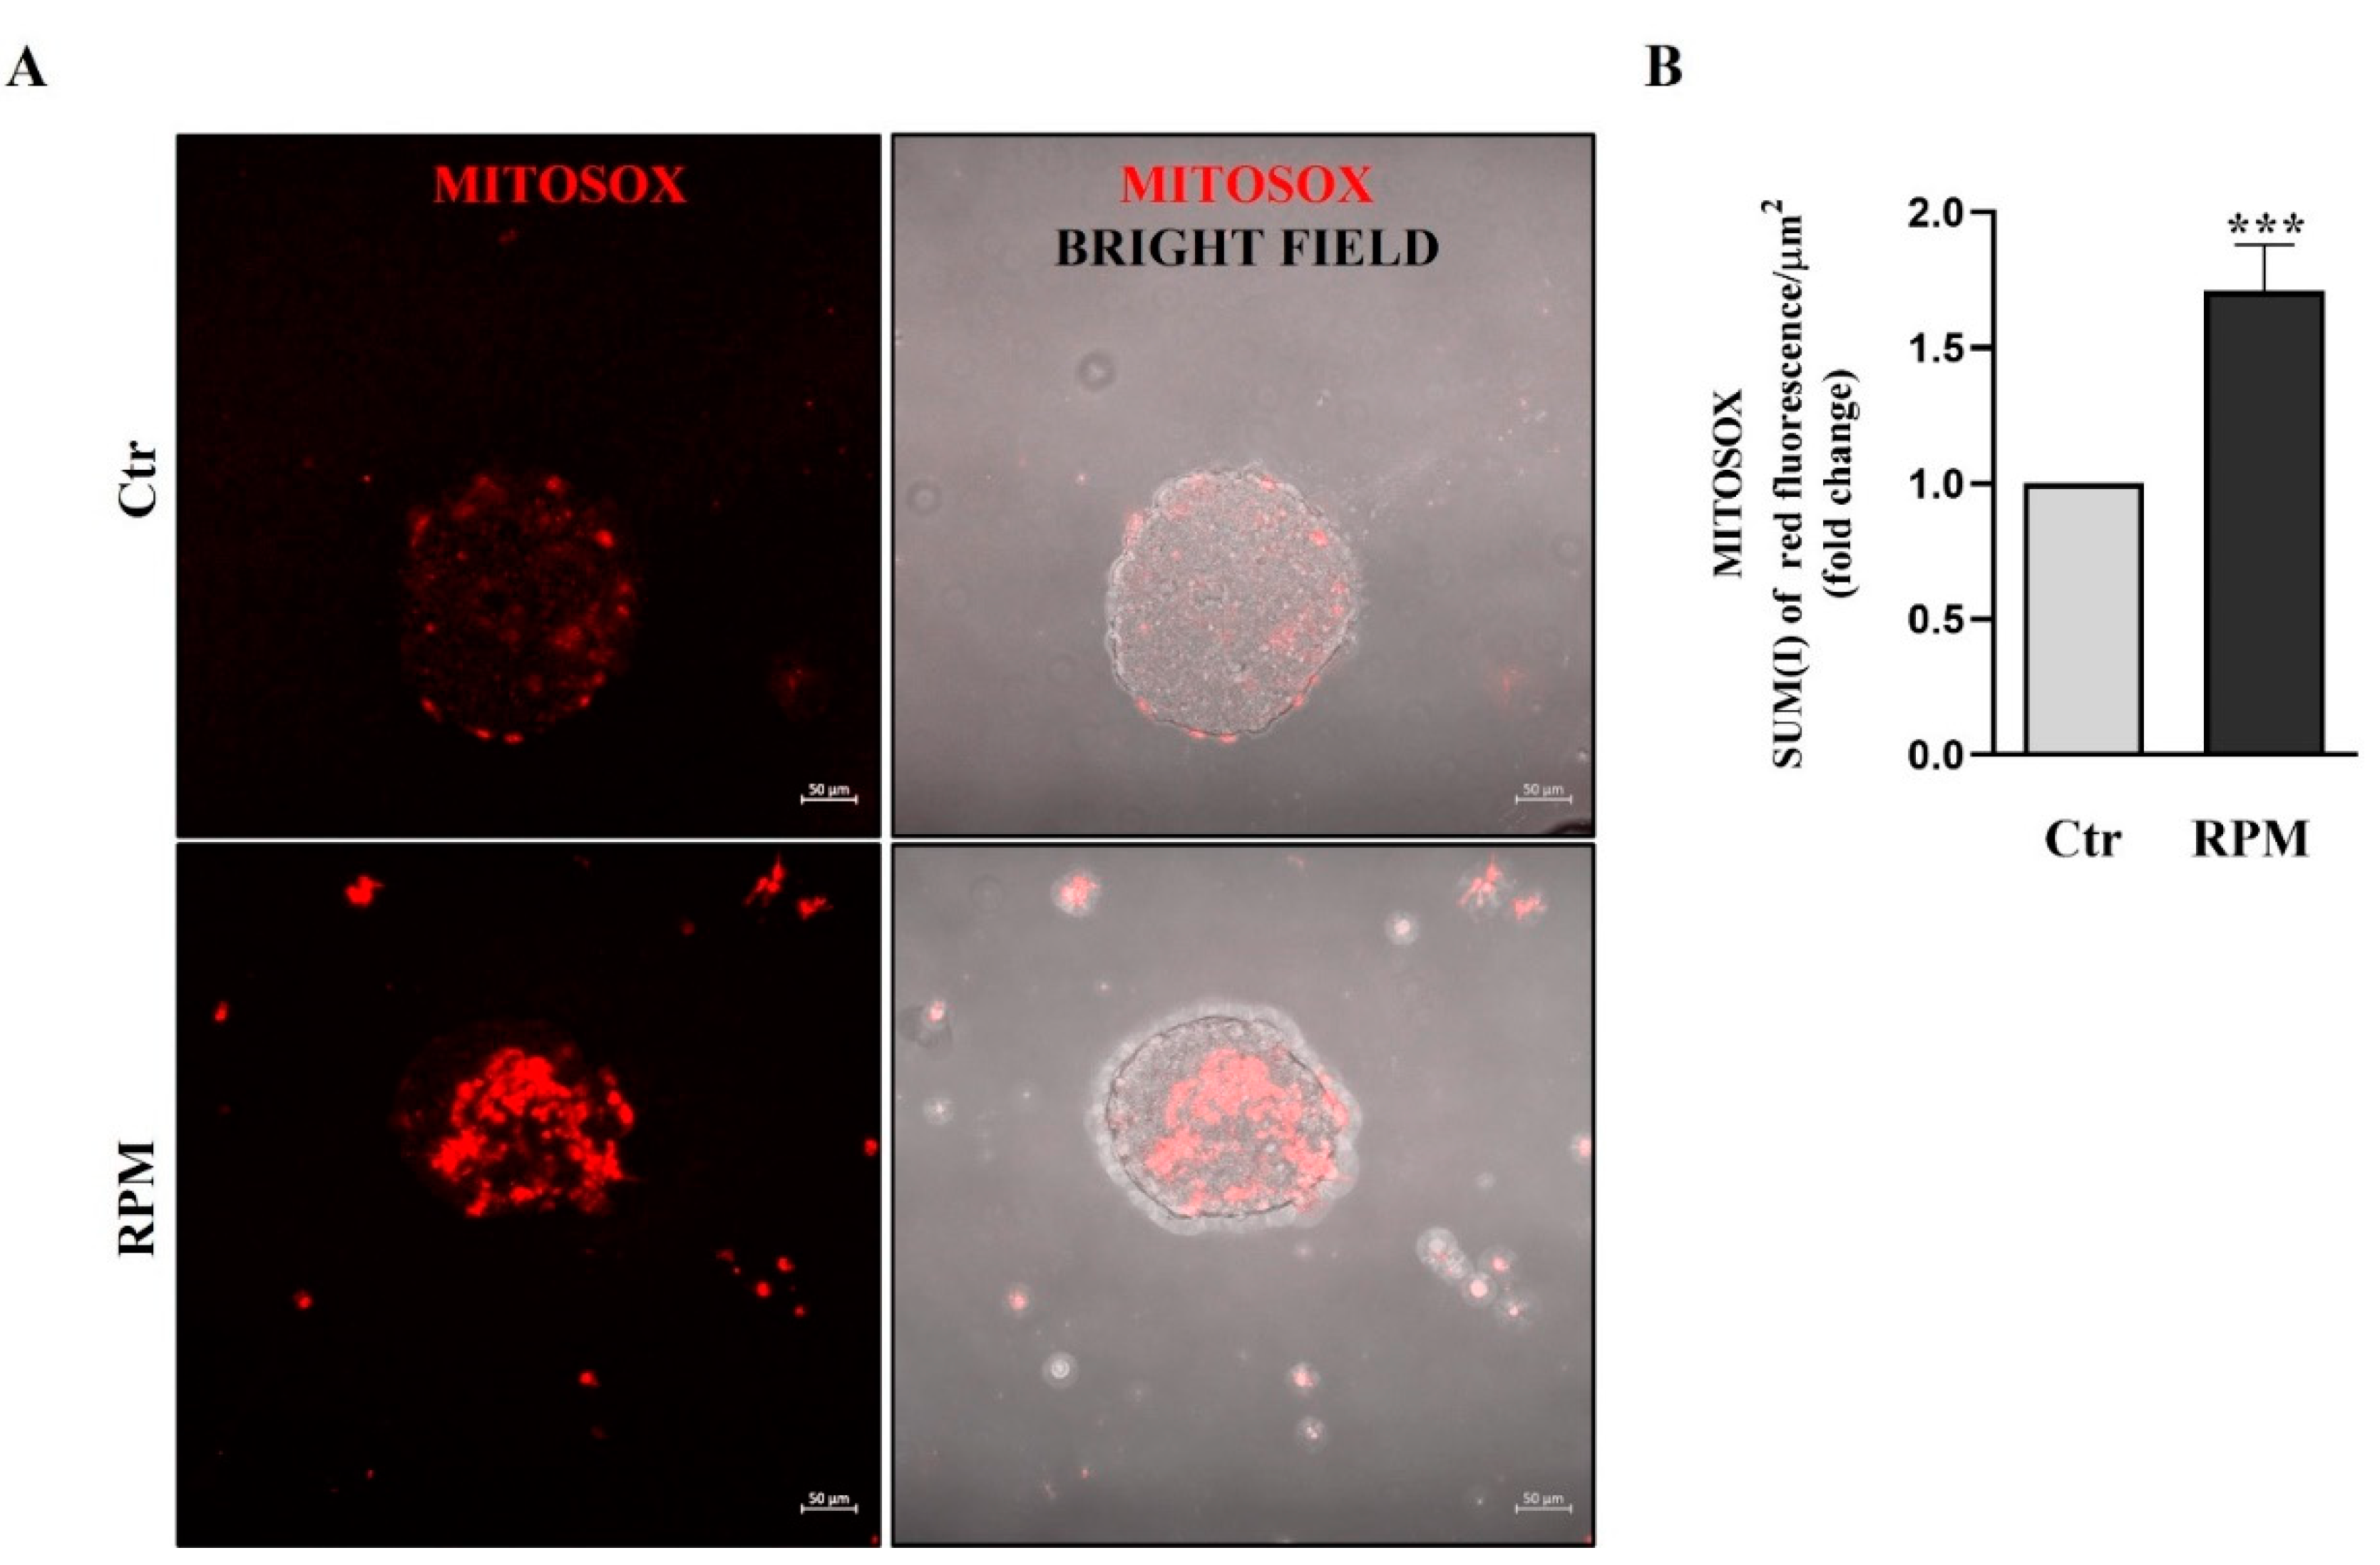
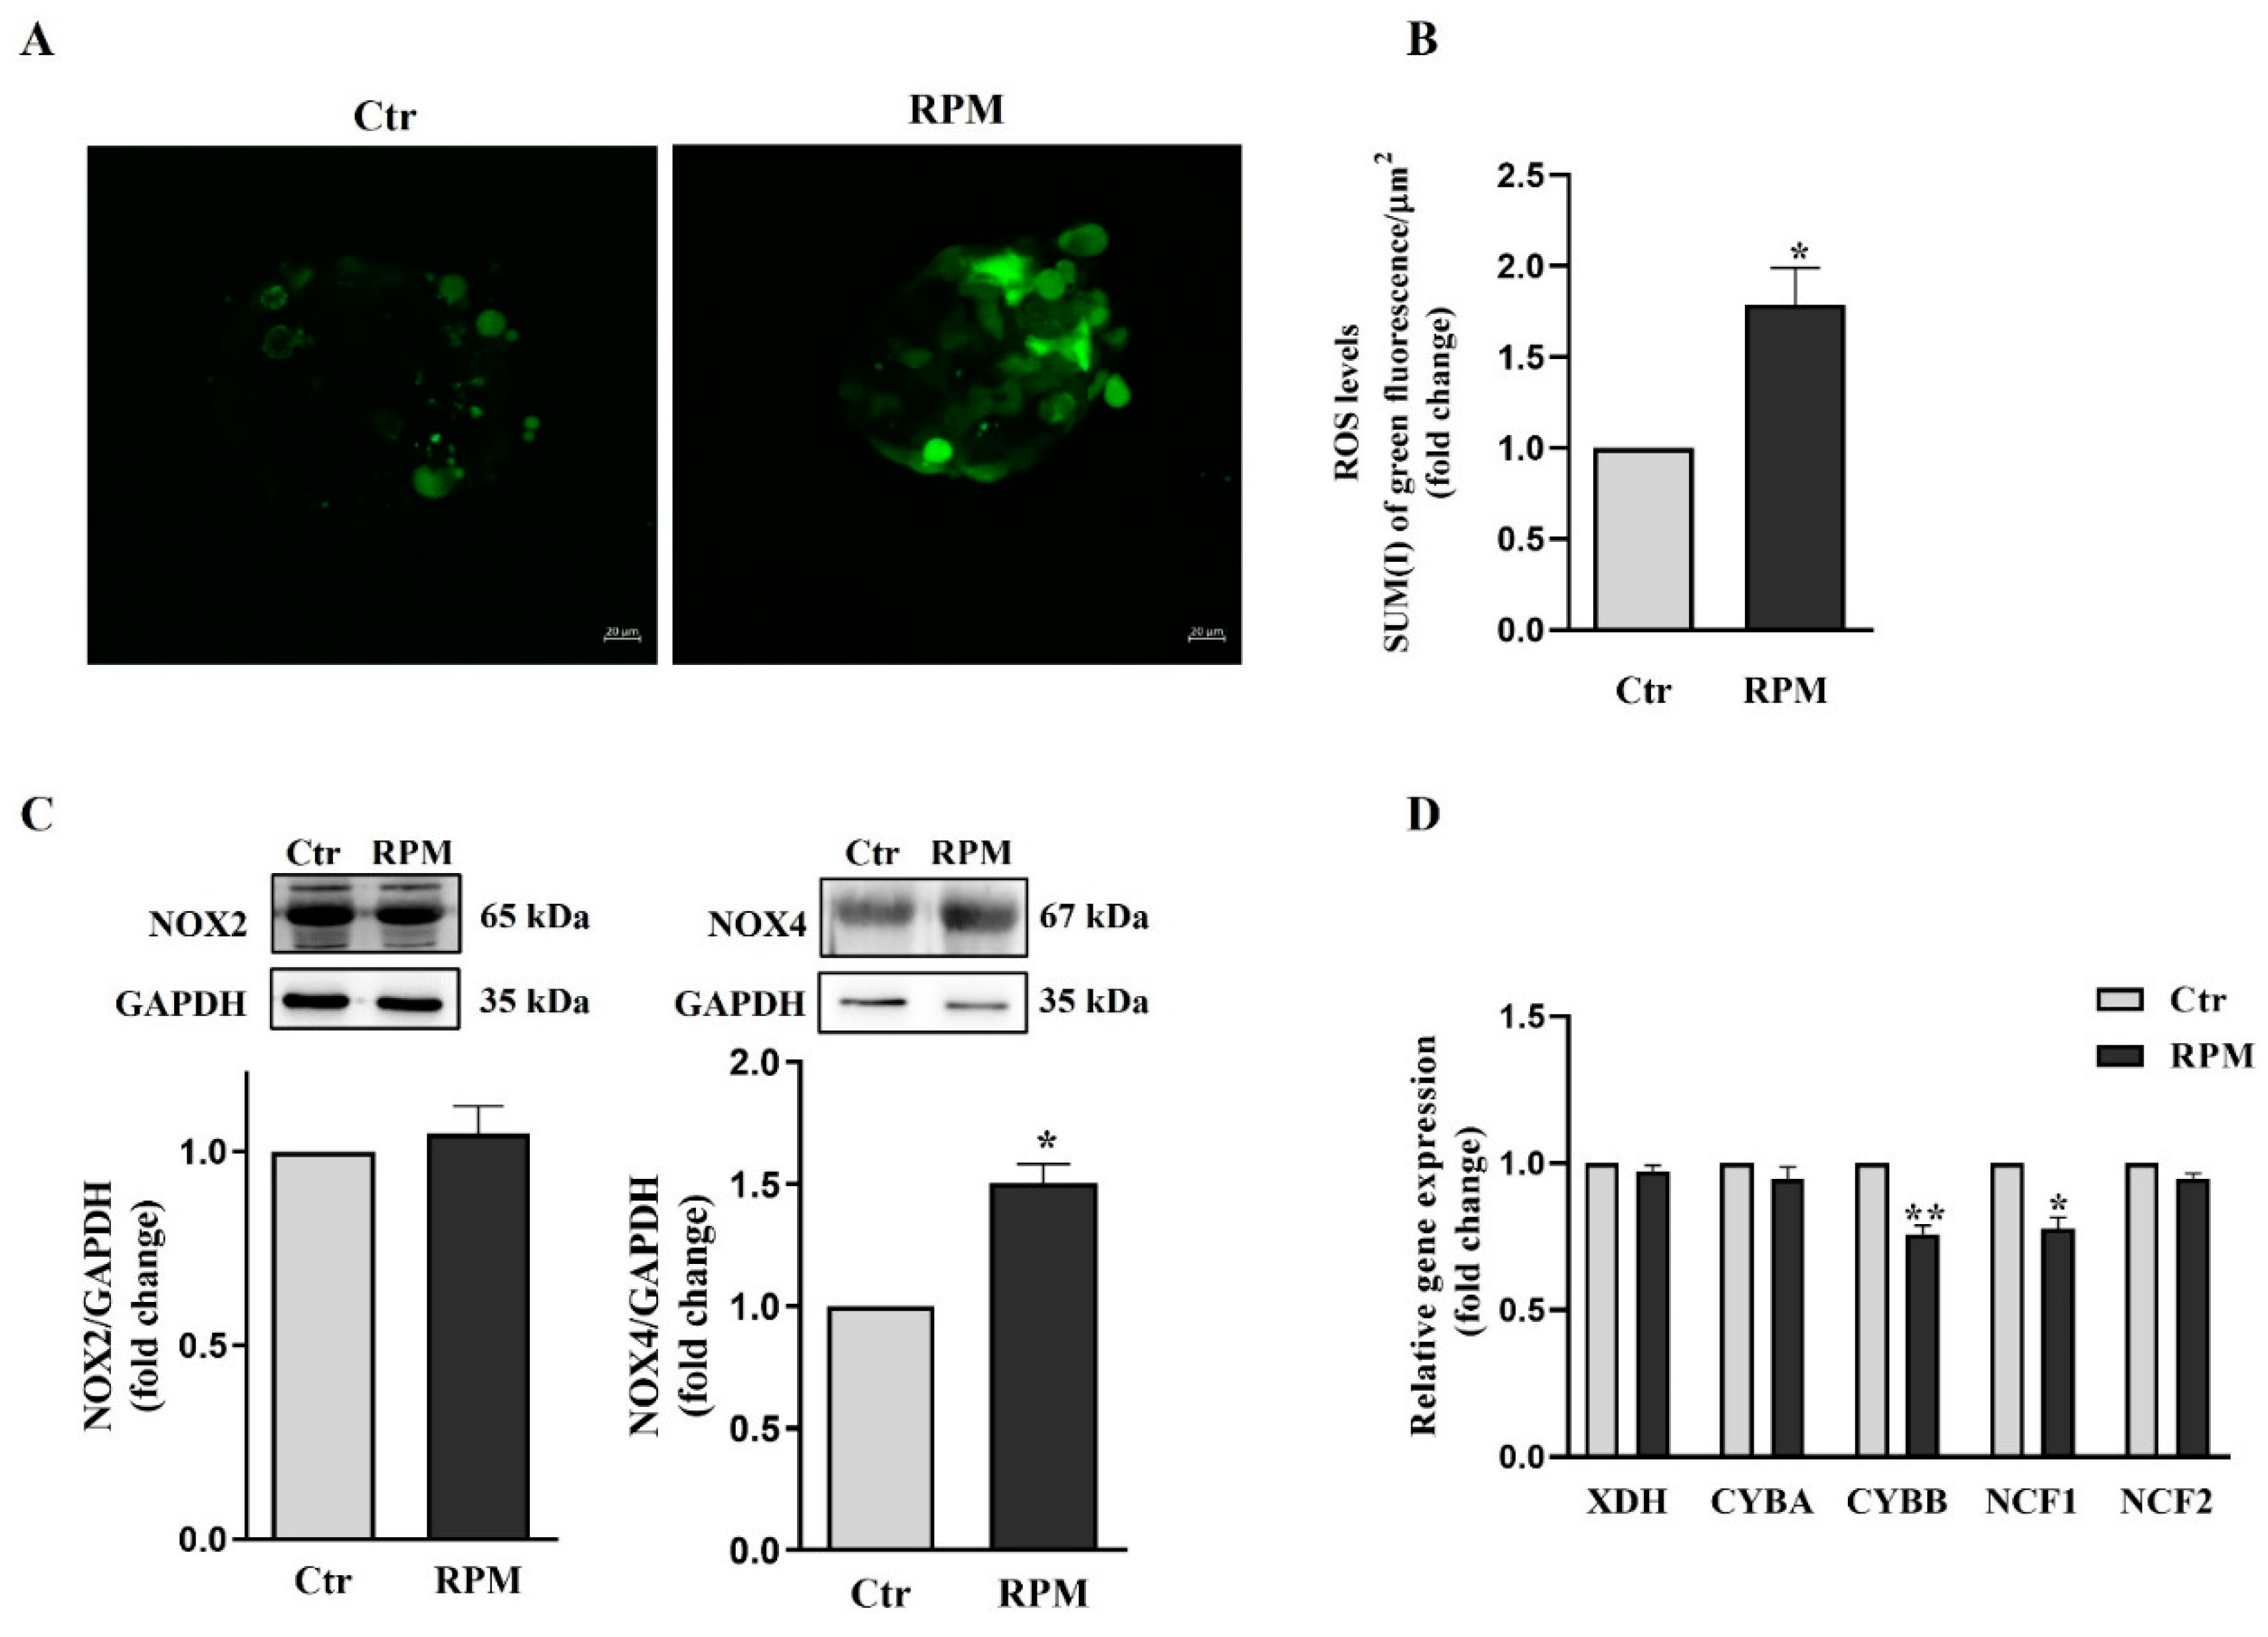
28]. Moreover, s-microgravity exposed TCam-2 cell spheroids increase ROS levels, and mitochondria superoxide anion production apparently without perturbing mitochondria membrane potential as well as the TCam-2 samples cultured as monolayers (
Figure 5,
Figure 6 and
Figure 7) [
27]. However, it should be highlighted that JC1 analysis in 3D culture system revealed high variability in the results that was not observed in bidimensional cultures. The mean values of the JC1 ratio analyzed in TCam-2 cell spheroids tend to increase in s-microgravity condition, but, due to the high variability, the values are not statistically significant, indicating that 3D cultures are more heterogenous than bidimensional ones (
Figure 5).
In both bi-dimensional and three-dimensional cultures mitochondria appeared swollen and increased in size. However, mitochondria of TCam-2 cells cultured as monolayers showed electron-clear swollen areas in their matrix after 24 h exposure to s-microgravity [
27], whereas in three-dimensional cultures mitochondria matrix appears homogeneously electron-dense (
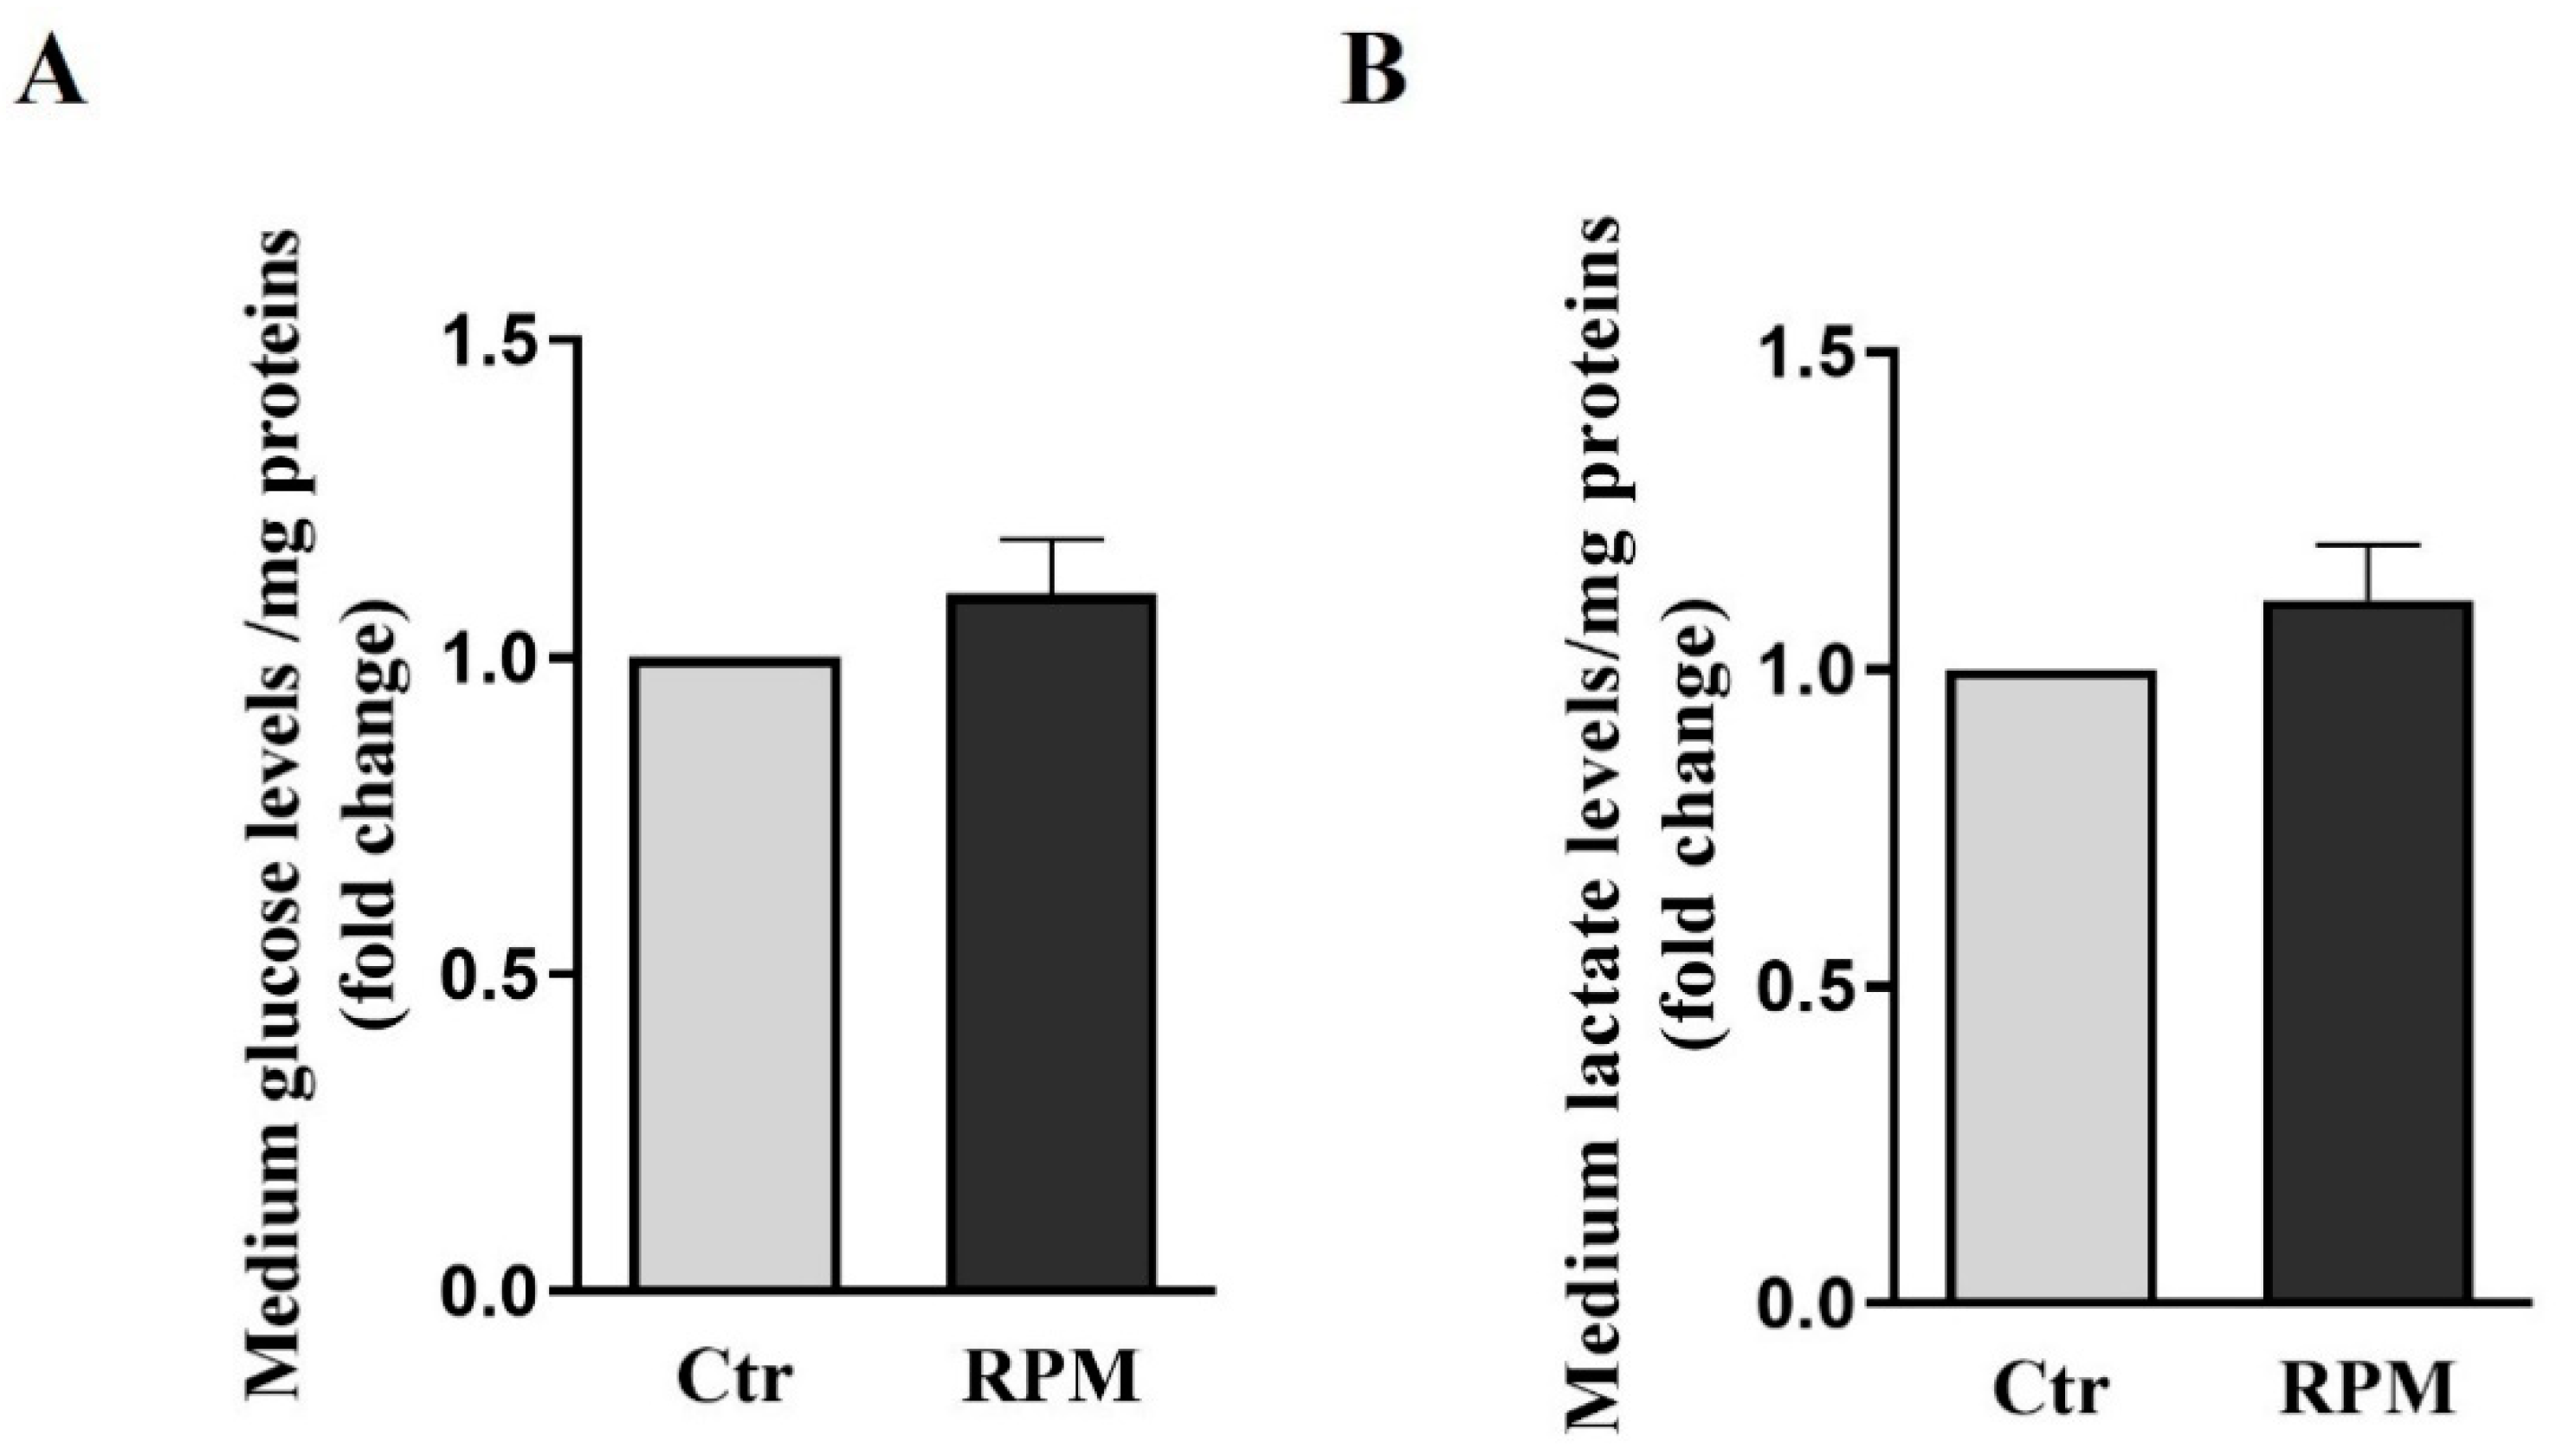
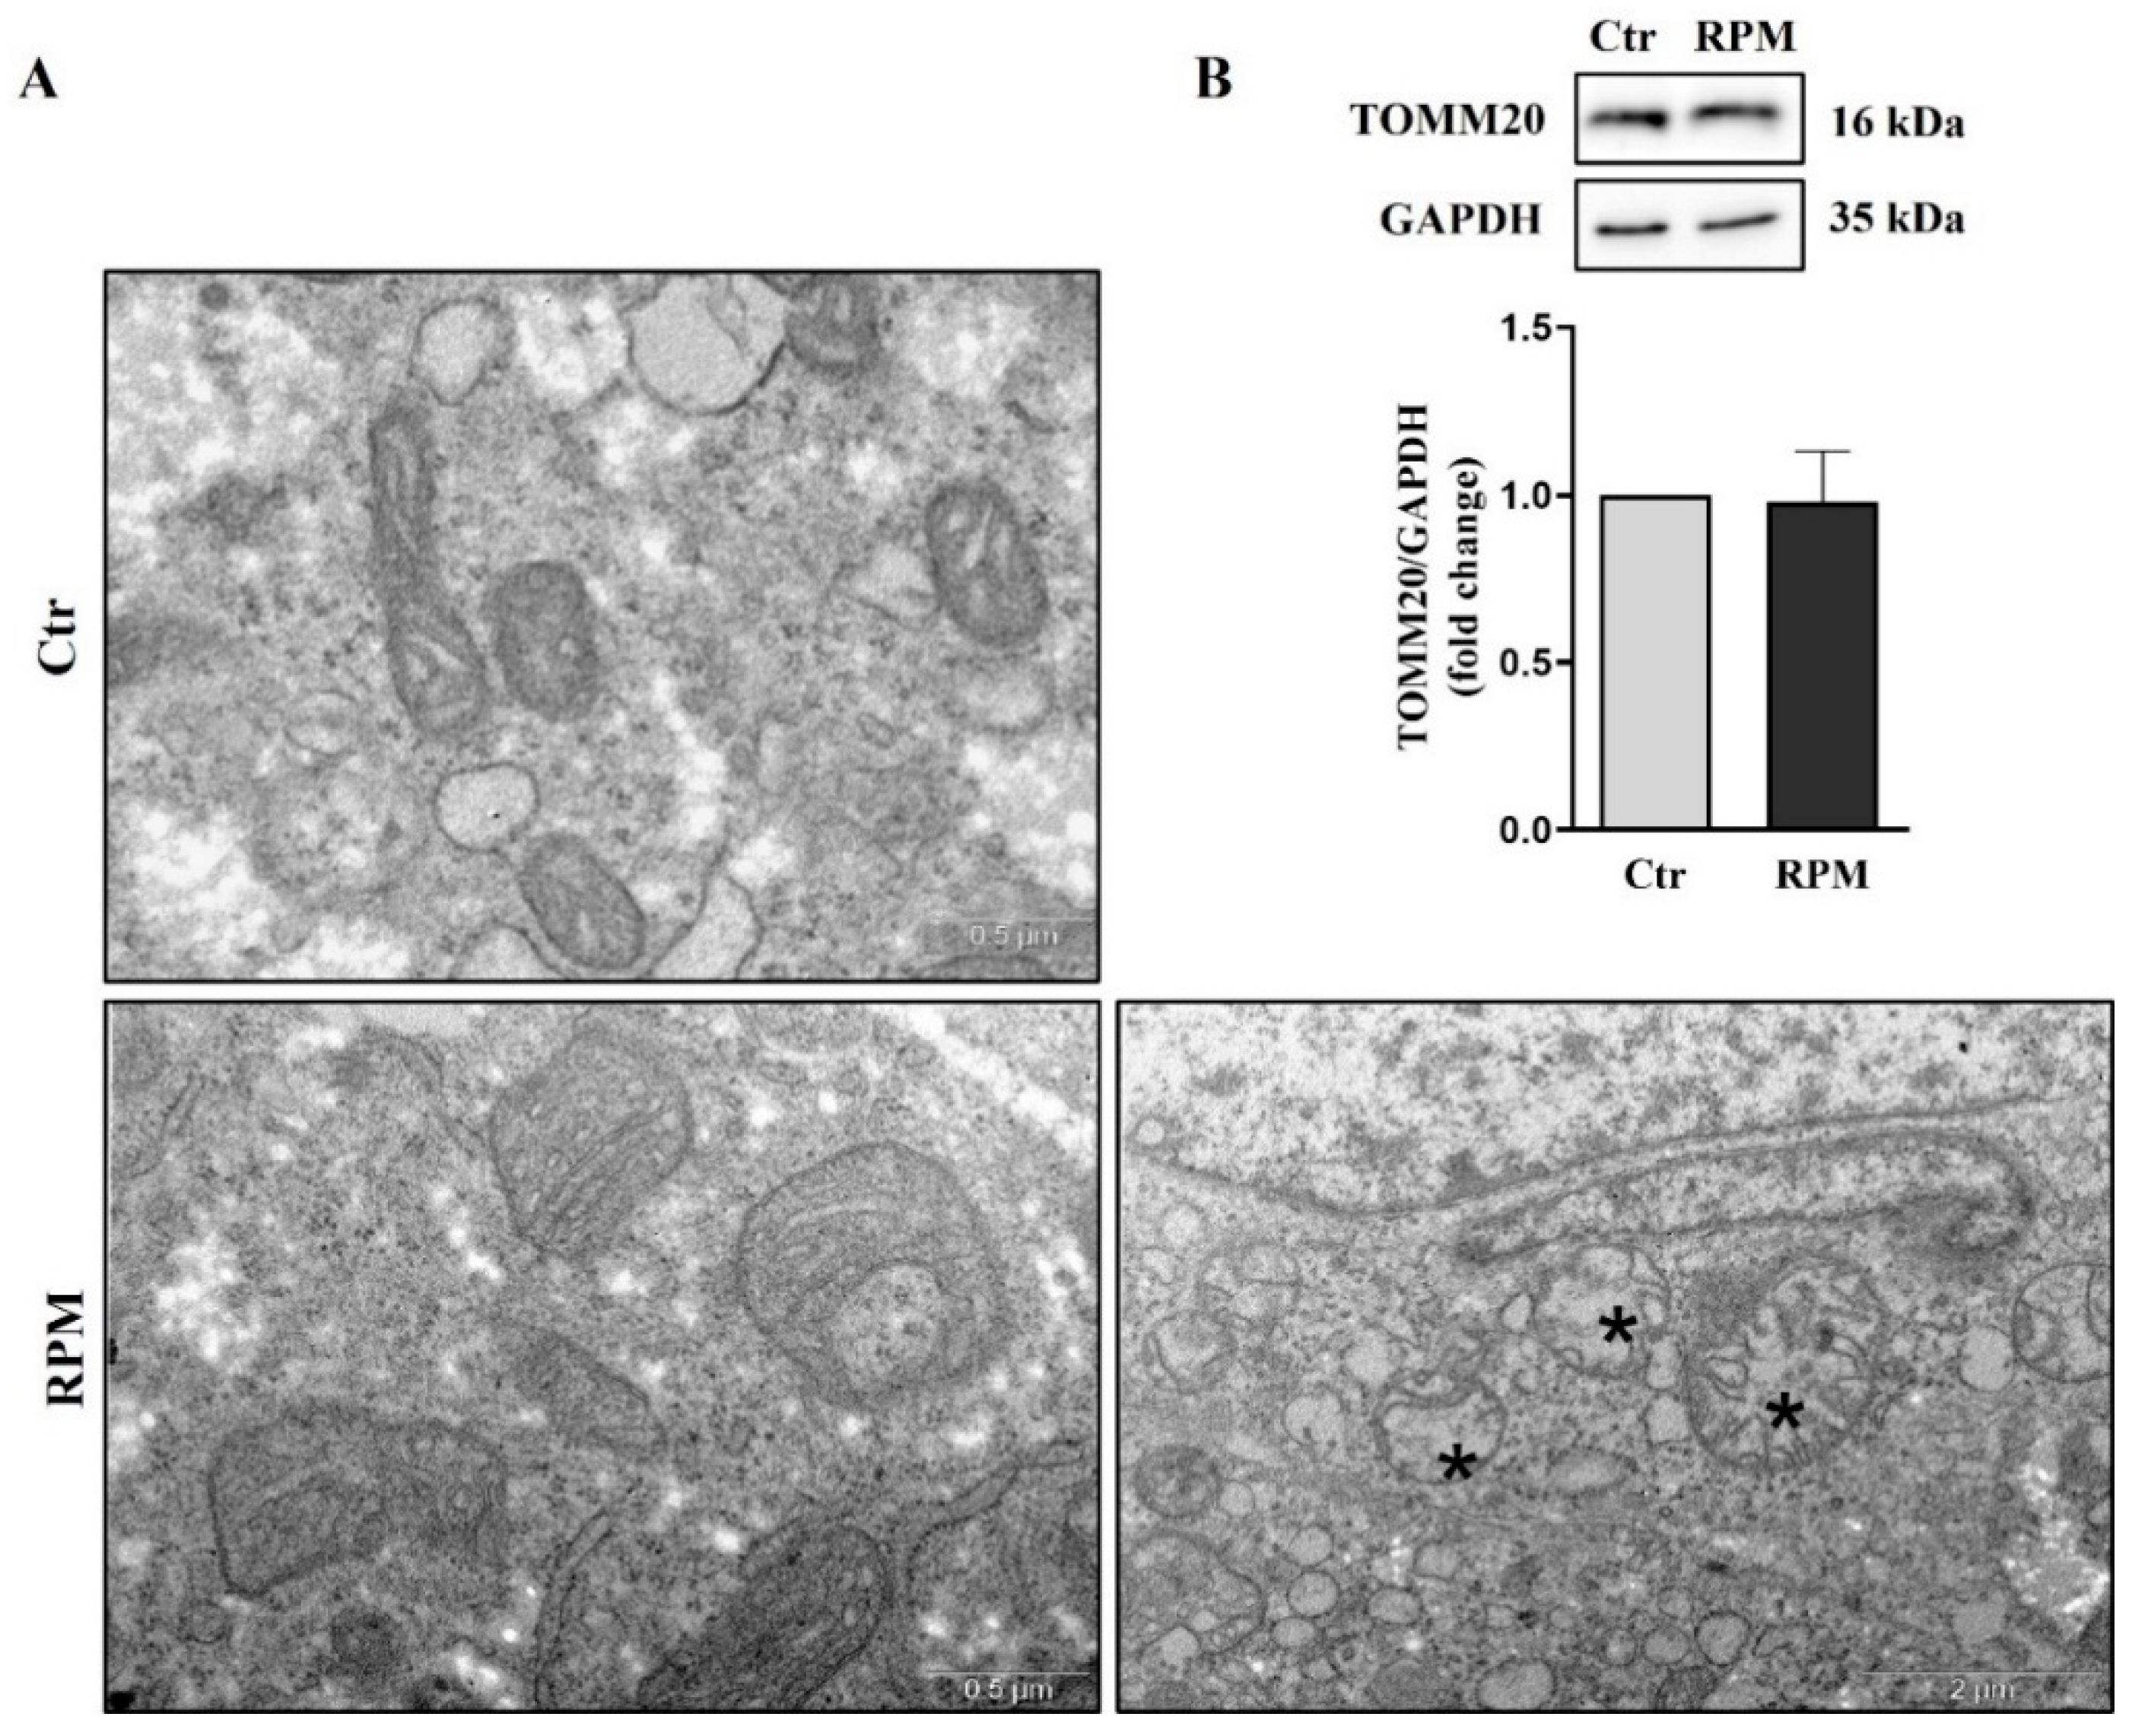
Figure 4). These results indicated an apparent milder impact of s-microgravity on mitochondria in cells cultured as three-dimensional structures. According to this hypothesis the amount of glucose and lactate in the medium does not significantly change in TCam-2 spheroids after 24 h of s-microgravity exposure (
Figure 2). Conversely, they appeared both at higher levels in the medium of TCam-2 cells exposed to s-microgravity and cultured as monolayer [
27], indicating s-microgravity-induced increasing of anaerobic metabolism in TCam-2 monolayers after RPM exposure that, therefore, does not occur in 3D cultured samples. In line with what observed in 2D cultures [
27], and, even if mitochondria appeared enlarged, no significant differences in the amount of the mitochondria marker TOMM20 have been observed in s-microgravity exposed samples, indicating a not significant change in the mitochondrial mass (
Figure 4) [
27].
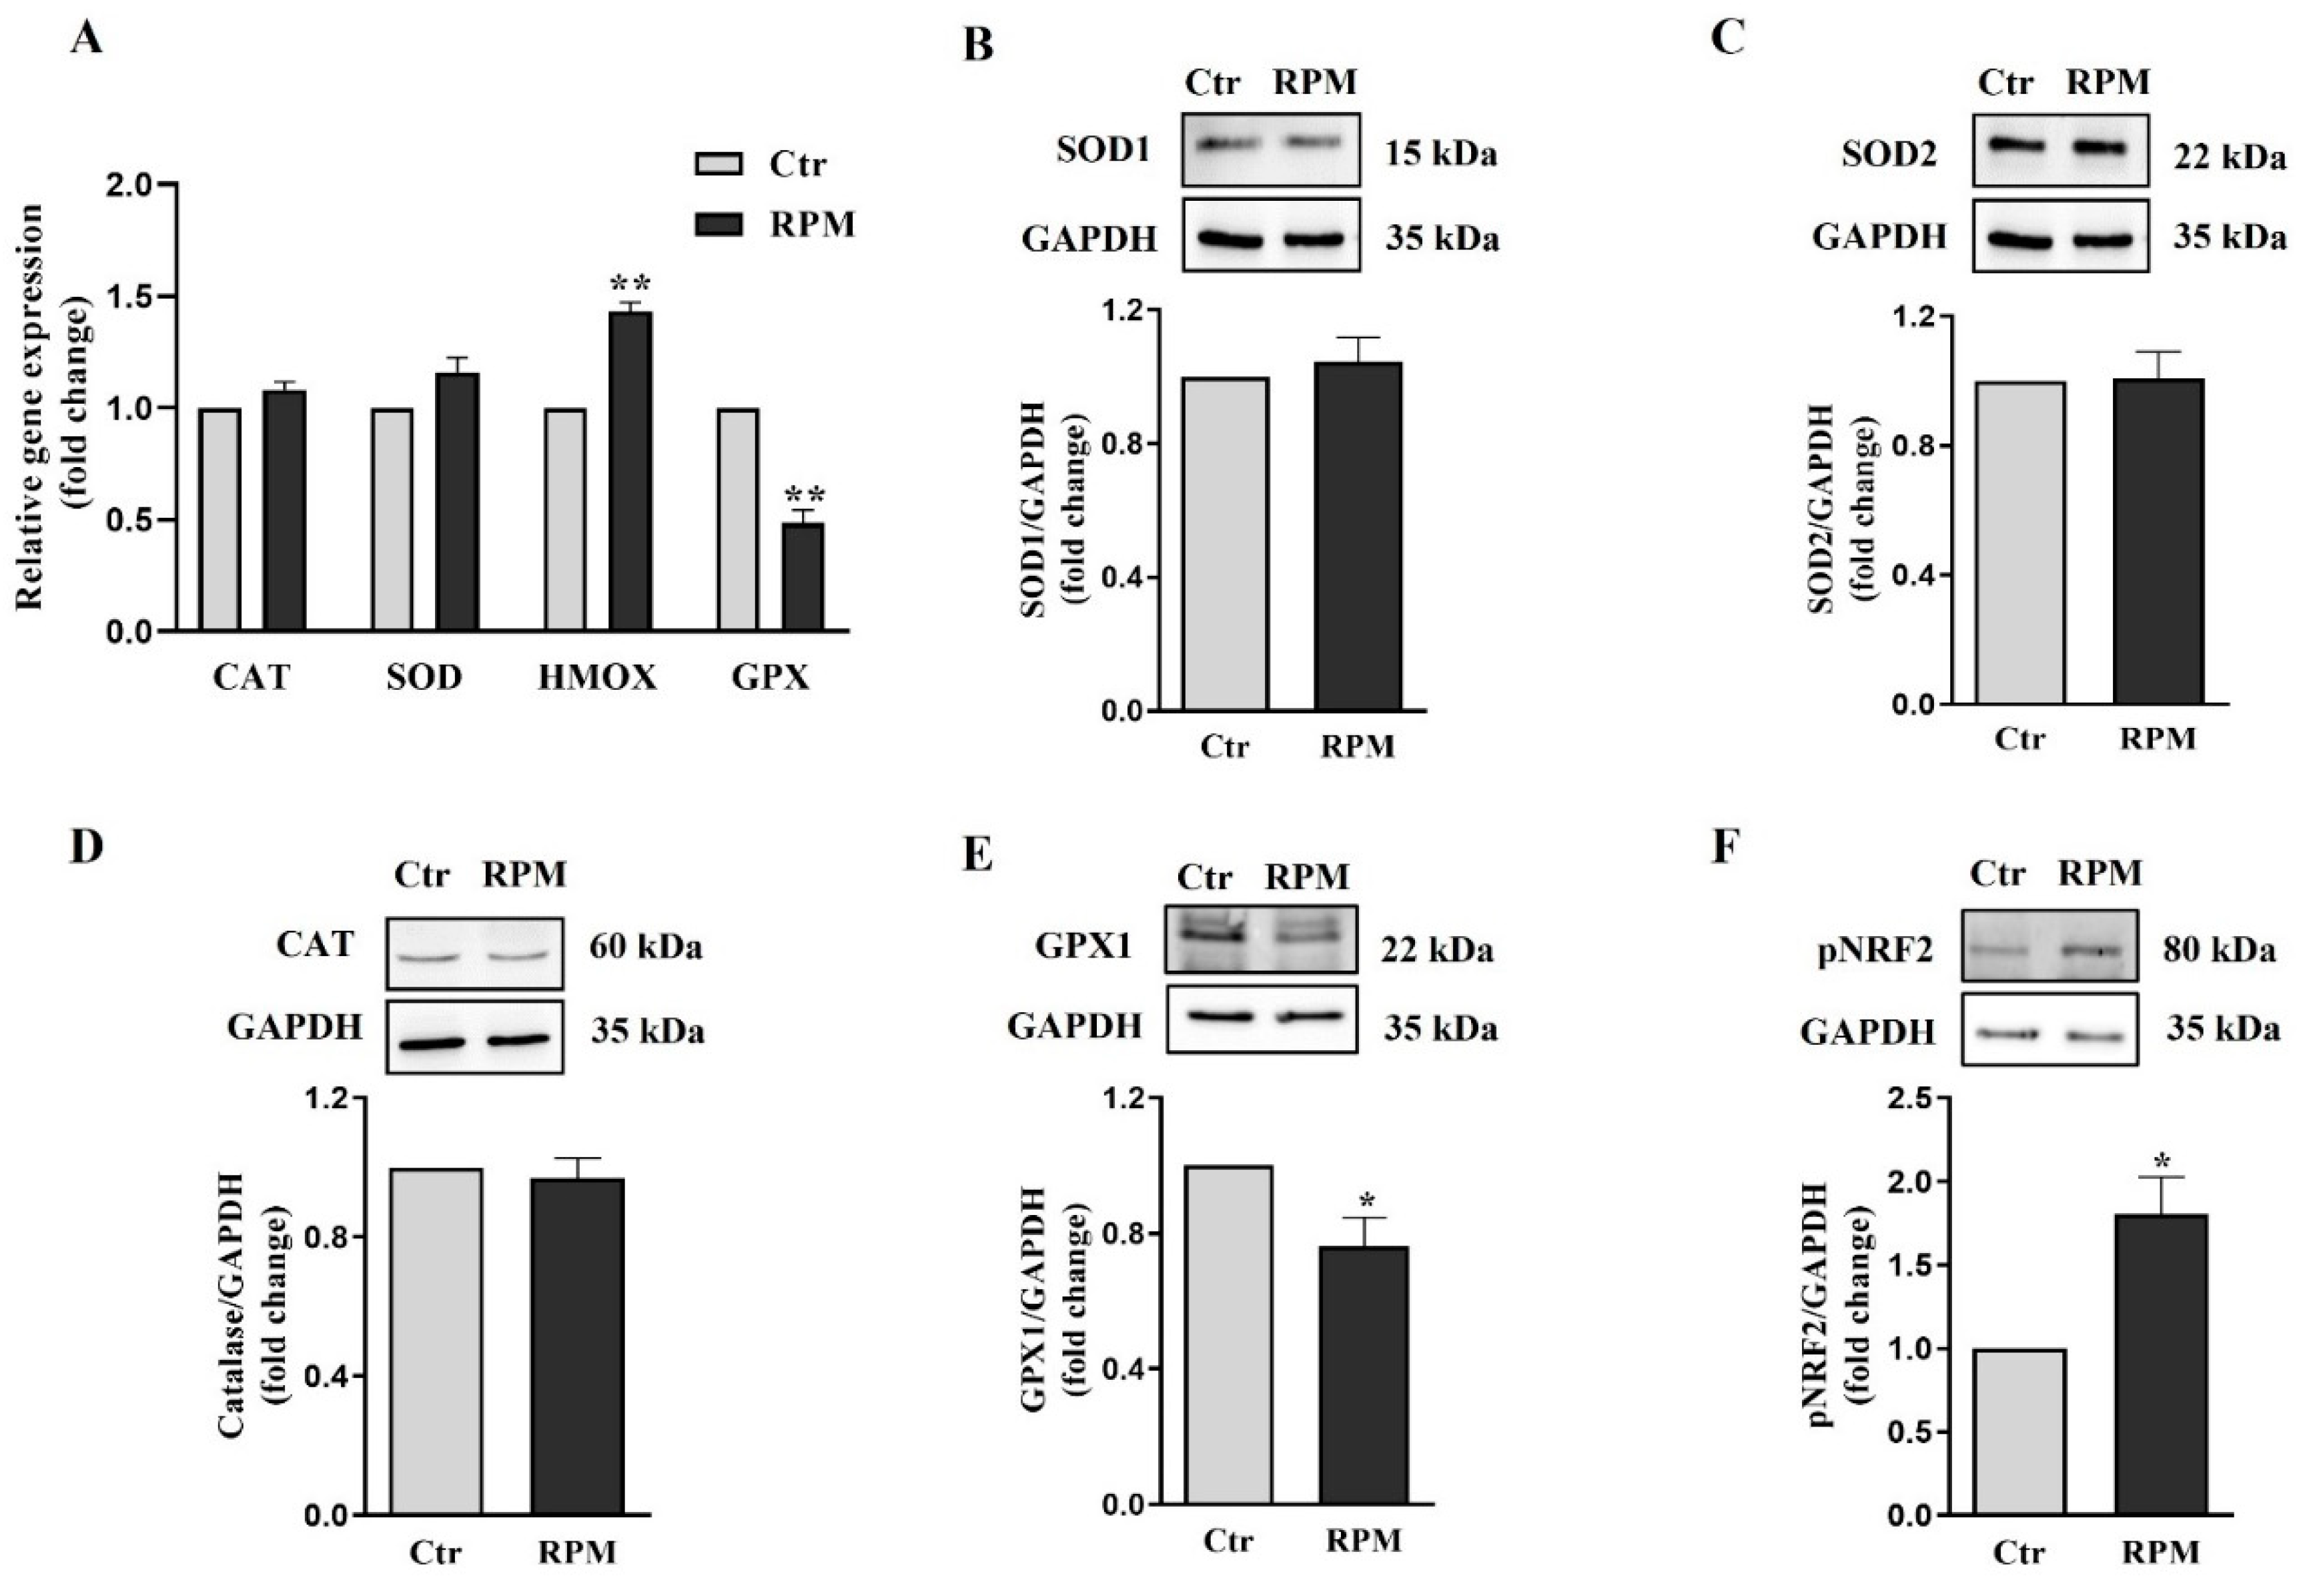
Trying to explain the source and the consequence of the observed ROS increase, we analyze by qRT-PCR and Western blot analyses the expression of key components of the redox cellular systems. We found a partial impairment of the antioxidant barrier since Glutathione Peroxidase (GPX1) gene and protein [
29], appeared downregulated being SOD 1-2 and catalase not affected by s-microgravity (
Figure 8). Moreover, in line with the ROS increase, we found a significant increase of NADPH oxidase 4 (NOX4) in TCam-2 spheroids exposed to s-microgravity (
Figure 7). All together these results can explain, at least in part, the s-microgravity triggered ROS increase. Notably, the s-microgravity-induced pro-oxidant environment does not seem passively tolerated by the TCam-2 cell spheroids, as we observed signs of recovery to attempt the rescue of redox balance. Indeed, CYBB mRNA, that codify for the catalytic domain of NOX2, and NCF1 mRNA, that codifies for the cytosolic subunit of neutrophil NADPH oxidase, appeared slightly but significantly reduced in spheroids exposed to s-microgravity (
Figure 7). It is fair to highlight that in spite to the decrease of gene transcription, the amount of NOX2 protein level does not seem affected by s-microgravity (
Figure 7), indicating that the rescue of oxidative balance was not already reached by TCam-2 spheroids. Moreover, we found the s-microgravity-induced upregulation of the Heme Oxygenase 1 (HMOX1) gene mRNA, probably as the consequence in turn of NRF2 transcription factor upregulation (
Figure 8) [
30]. HMOX1 codify for an enzyme, inducible by oxidative stress, that catalyzes the degradation of heme to form, carbon monoxide (CO), iron ion (Fe), and bilirubin. These molecules are considered to have direct or indirect antioxidant properties [
31,
32], and therefore, in TCam-2 spheroids, the upregulation of HMOX1 can counteract the s-microgravity-triggered oxidation. Moreover, being this enzyme involved in mitochondrial cytochrome metabolism, it can be also involved in the turnover of the oxidized s-mitochondria [
33] that we observed by MitoSOX assay and ultrastructural analysis as a consequence of s-microgravity exposure (
Figure 4 and
Figure 6). Notably, NRF2 is a key regulator of transcription of several genes involved in the cell response to oxidative stress, through the binding to a common DNA sequence called antioxidant response element (ARE) [
34,
35]. Therefore, the upregulation of NRF2 represent a good indicator of the homeostatic broad cellular response to microgravity-dependent oxidative stress.
Notably, even in bidimensional culture we observed a protective reaction against ROS increase, since after 24 h of RPM exposure SOD1 appeared increased [
27], but, as already mentioned, this protein levels are not affected by s-microgravity in 3D spheroids.
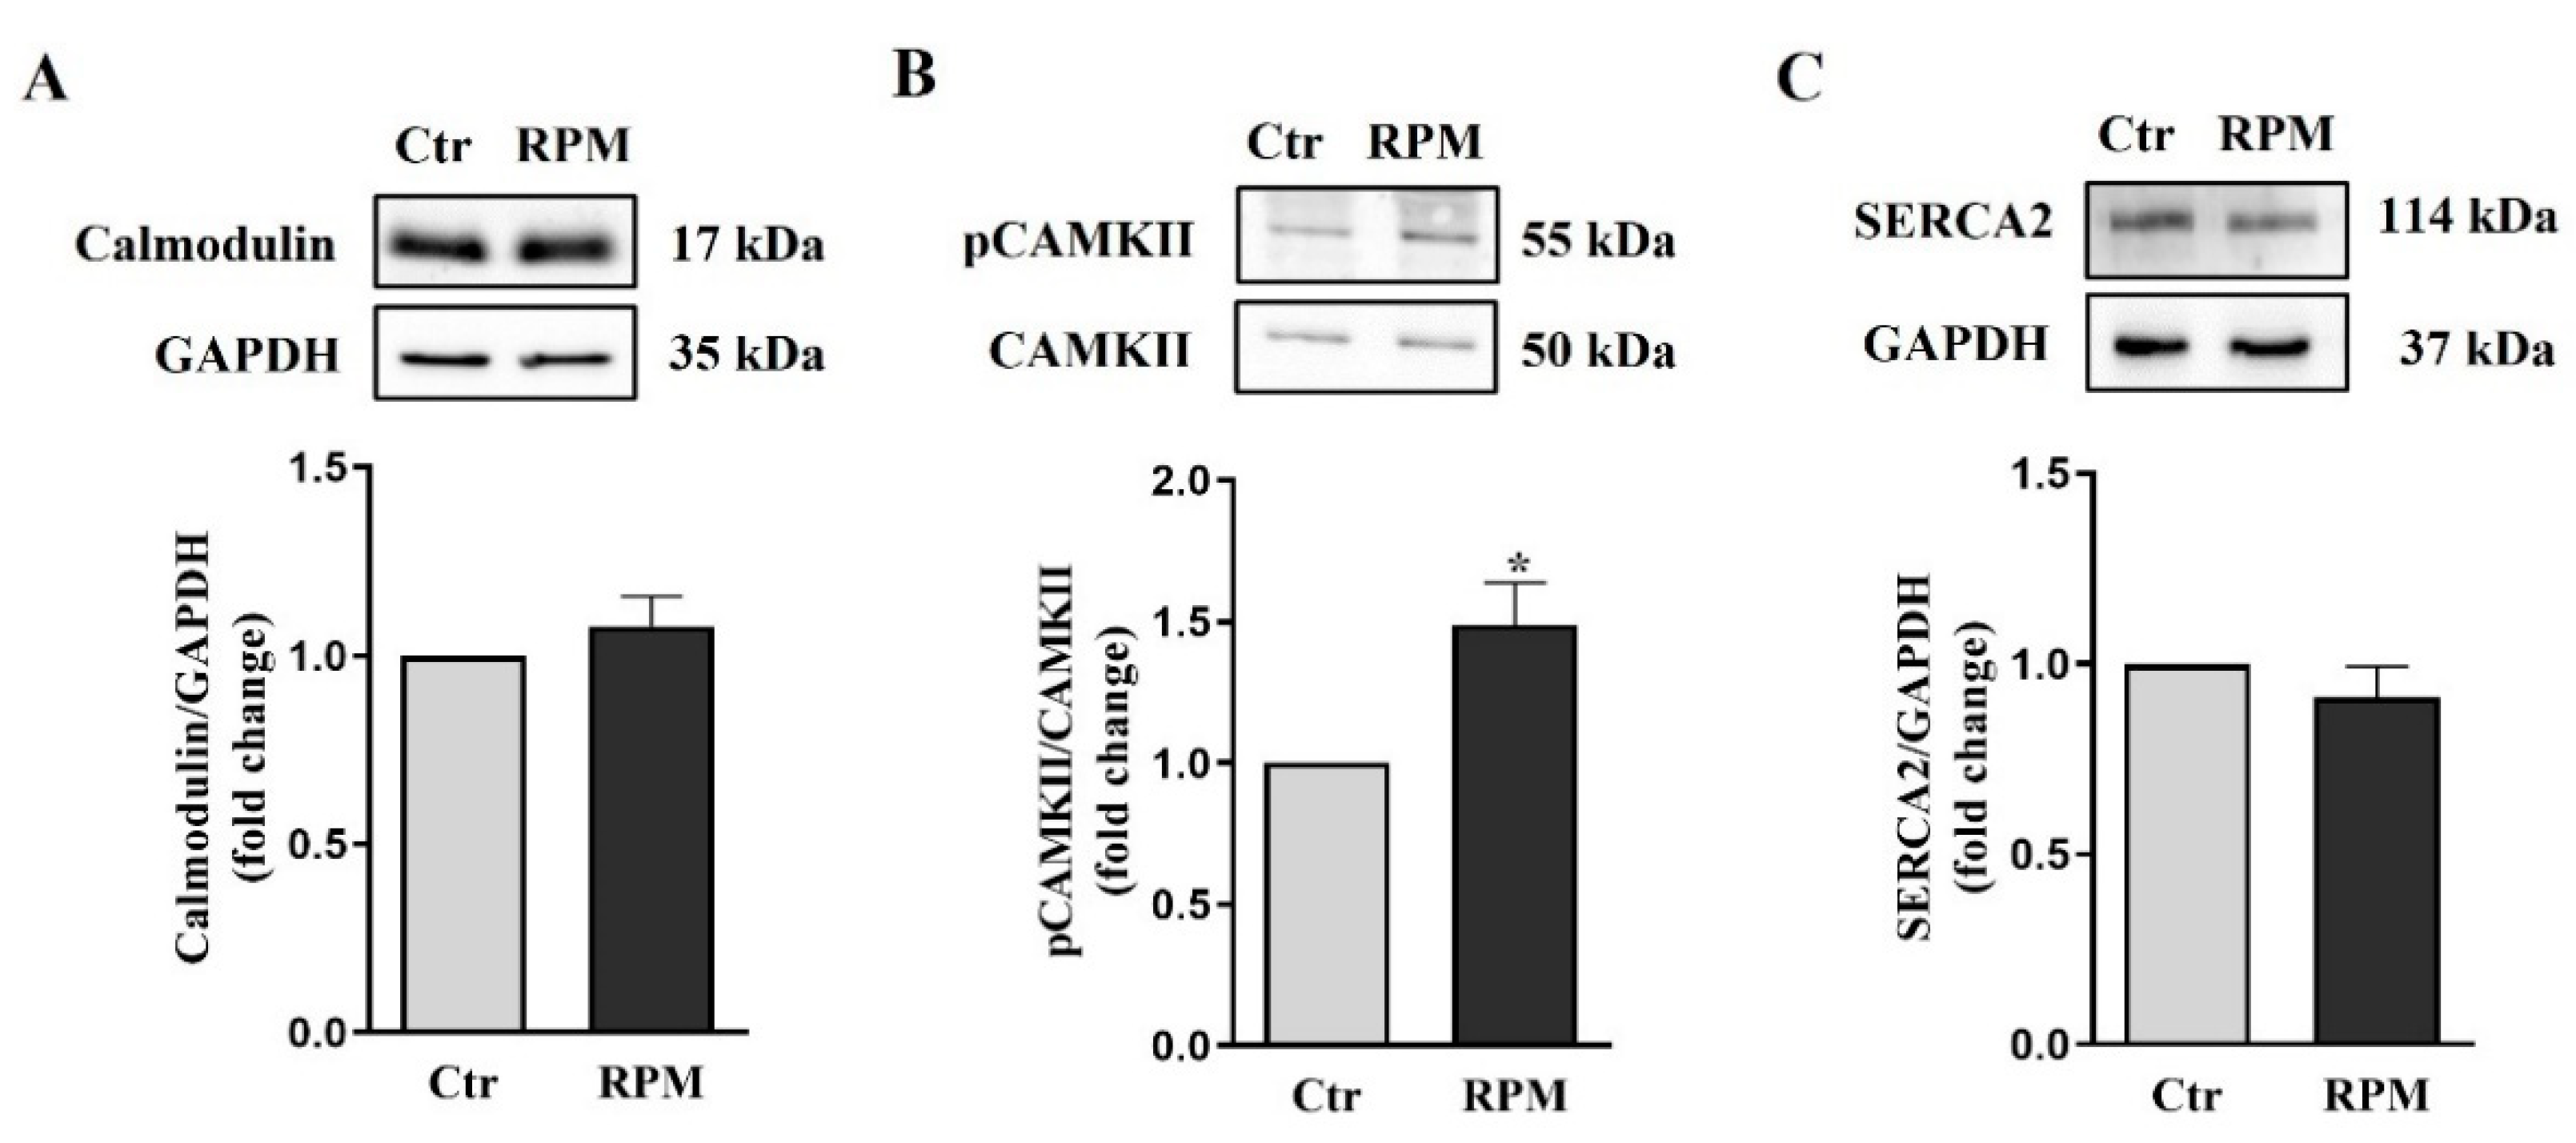
In the 2D cultures we also observed a s-microgravity-triggered increase of intracellular calcium, that is mirrored in the 3D culture system by the increase in the pCAMKII (
Figure 3). Interestingly, CAMKII can be activated both by the increase of intracytoplasmic calcium ions, or by the ROS increase [
36,
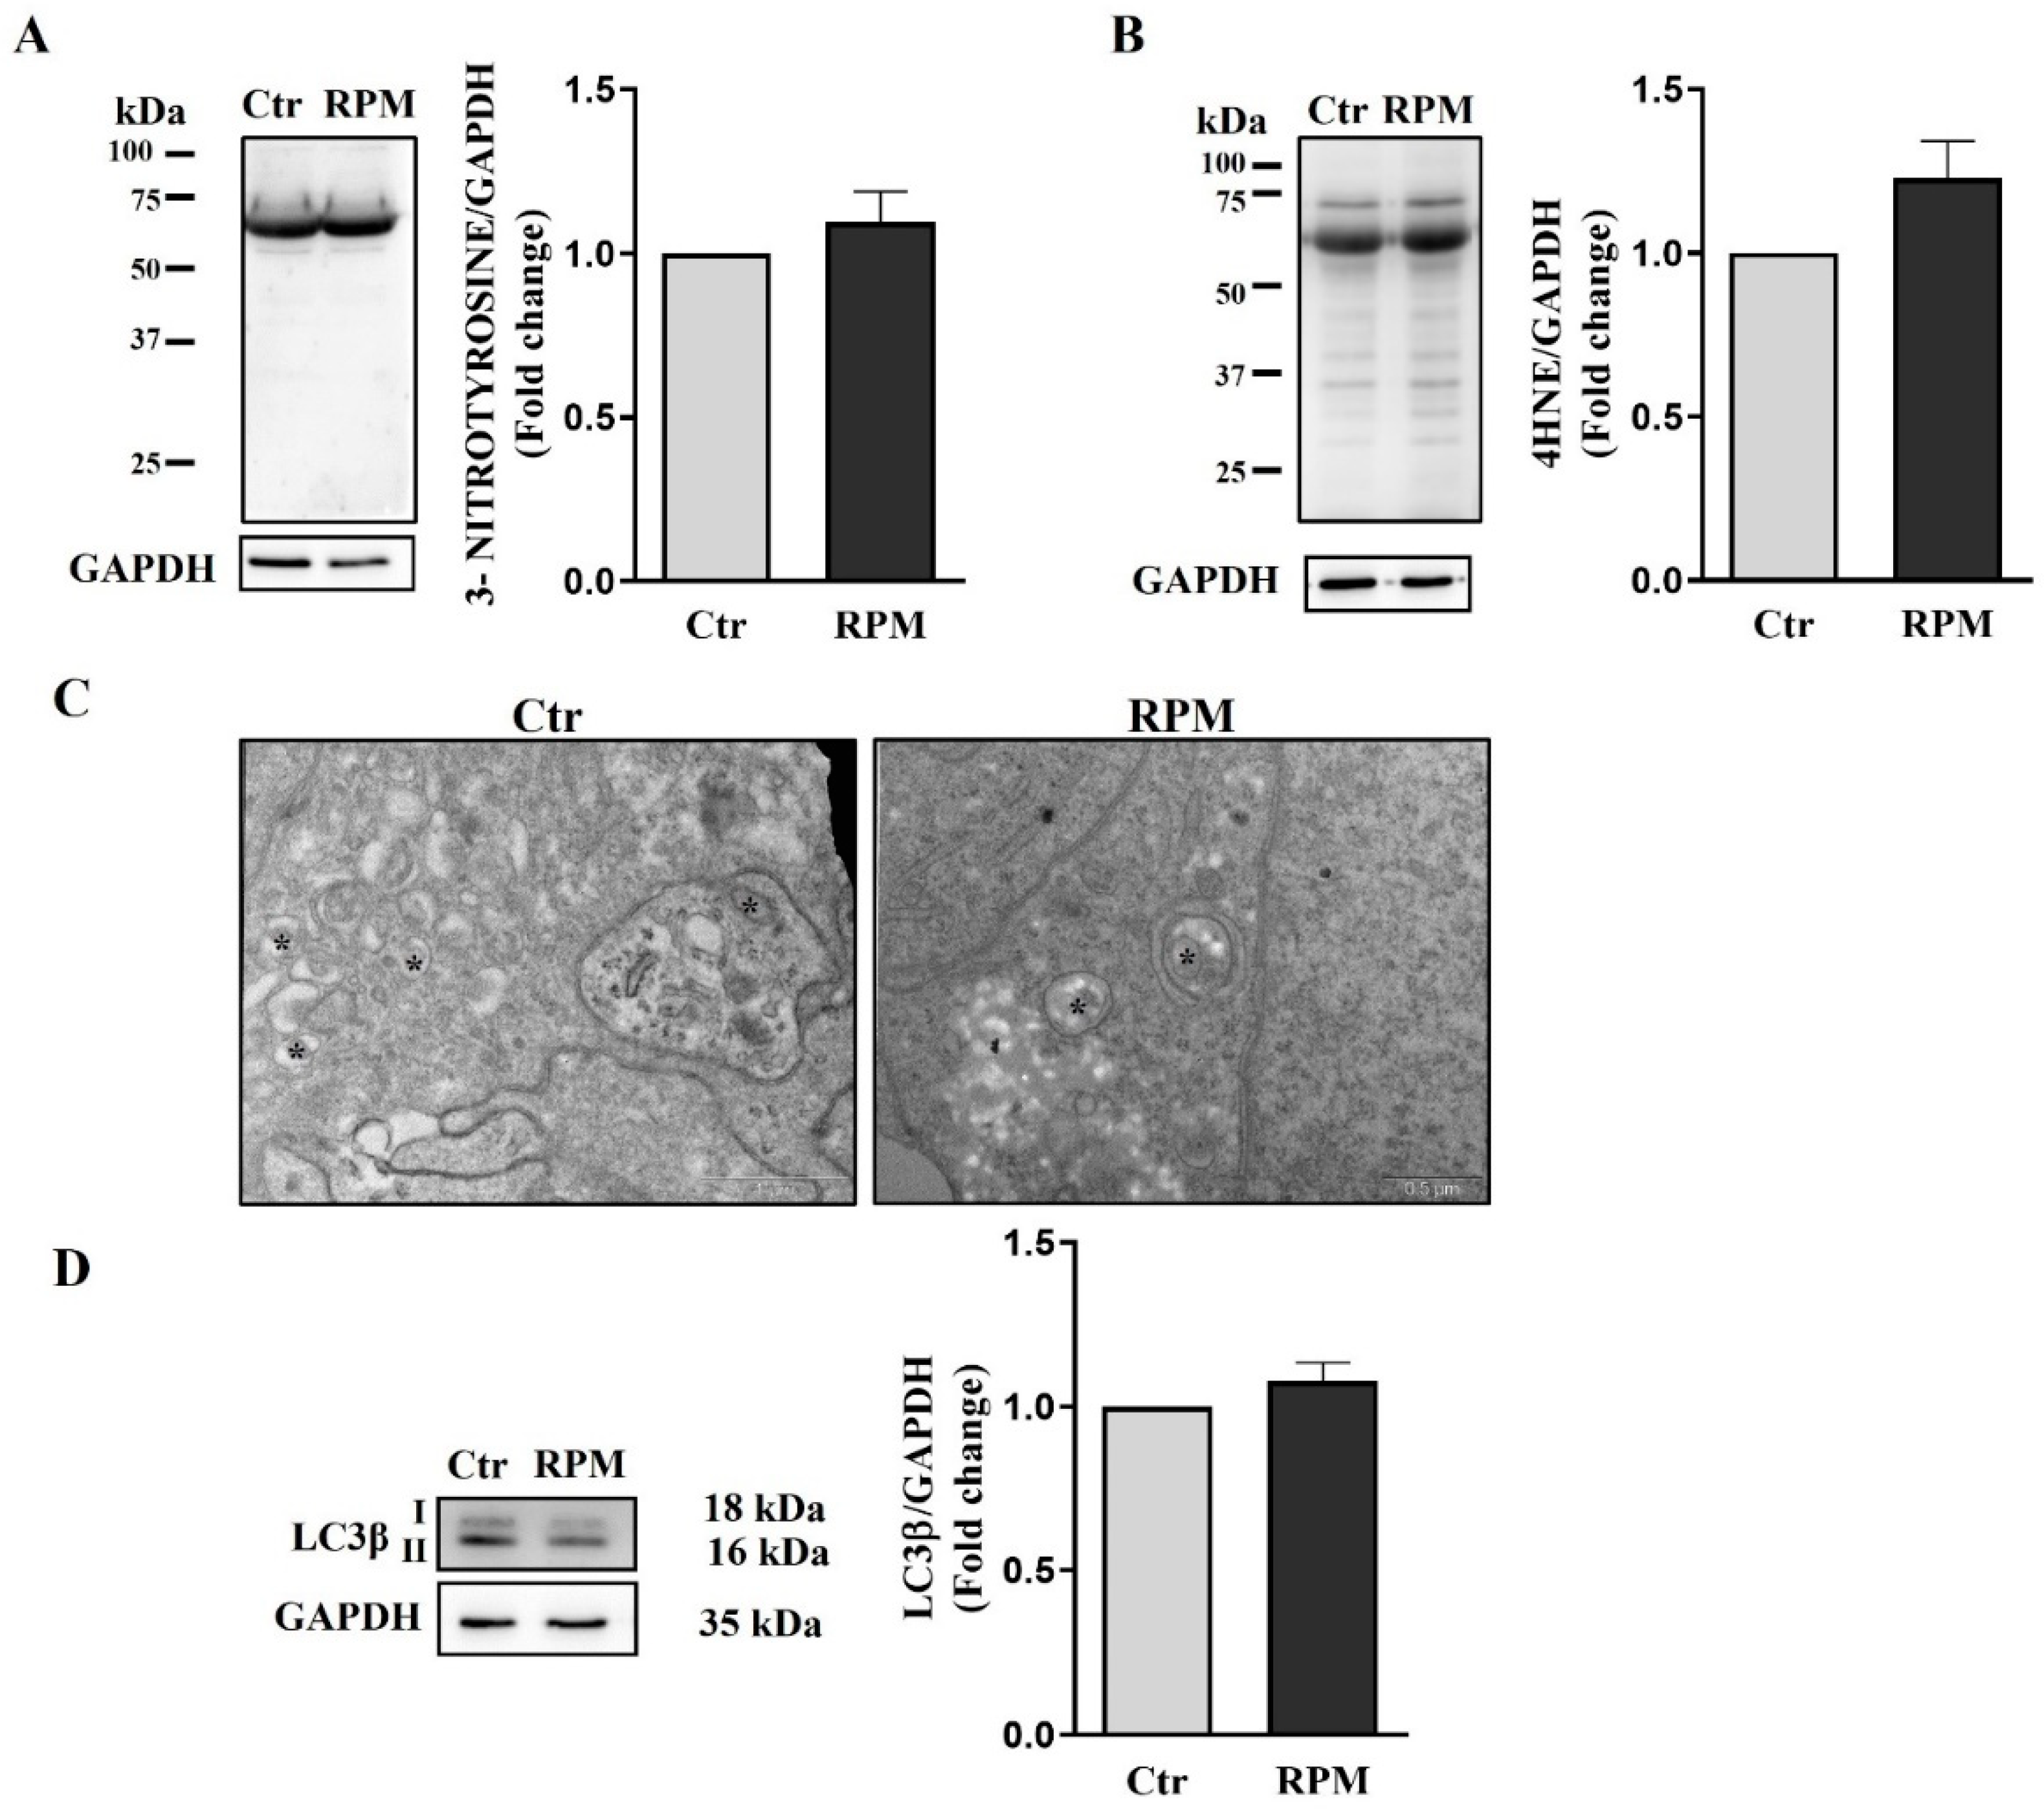
37] and therefore represents another sign of the cell reaction to ROS-induced by RPM exposure. The efficacy of cell counteraction to ROS increase in TCam-2 cell spheroids is demonstrated by the absence of a significant increase of protein and lipid oxidation of RPM-exposed samples with respect to the ones cultured at unitary gravity (
Figure 9). It should be highlighted that, autophagic process can exert protective role against oxidation removing the damaged cellular organelles, indeed, autophagy induction has been observed after s-microgravity exposure in 2D TCam-2 cell cultures [
28]. However, the study of the autophagy marker LC3β by Western blot analysis, fails to find a modulation of autophagy after 24 h of RPM exposure in TCam-2 3D cultures (
Figure 9). Interestingly, ultrastructural studies revealed that autophagy process is already active in TCam-2 spheroids even when cultured at unitary gravity (
Figure 9), and therefore, presumably, the capability to rescue against stressors is more pronounced in the TCam-2 three-dimensional cultures than in bidimensional ones.
Taken together our results demonstrate that 1) TCam-2 cells are sensitive to changes of gravitational forces even when cultured in three-dimensional cell suspension, 2) there are common features in the response to microgravity, but 3) the culture condition influences the type of molecular and cellular mechanisms that counteract the s-microgravity triggered stressors.
Author Contributions
Conceptualization, G.R., L.G., A.C., M.A.M., C.M., and M.B.; methodology, L.G., M.B., A.R., M.Z., K.K., C.M., A.T., L.B., and S.G.; software, L.G., M.B., C.M., S.G., and M.Z.; validation, G.R., A.C., L.G., M.A.M., C.M. and M.B.; formal analysis, G.R., L.G., A.C. M.A.M., C.M. and M.B; investigation, G.R., L.G., A.C. and M.B; resources G.R., L.G., A.C., M.B., M.A.M., C.M.; data curation, G.R., L.G., A.C., M.B., C.M., A.T., L.B., and A.R.; writing—original draft preparation, G.R.; writing—review and editing, G.R., A.C., M.A.M., C.M., L.G. and M.B.; visualization G.R. and A.C.; supervision, F.F.; project administration, G.R., A.C., M.A.M., and F.F.; funding acquisition, M.A.M., A.C. and G.R. All authors have read and agreed to the published version of the manuscript.
Figure 1.
Microgravity does not significantly affect cell survival of TCam-2 spheroids: (A) Representative images of adhesion test of TCam-2 spheroids after 24 h of culture in Ctr or RPM condition is shown. n=3. (B, upper panel) Representative images recovered after 24 h of TCam-2 spheroids in Ctr and RPM condition stained with Cytocalcein (health cells), 7-ADD (necrotic cells) and Apopxin (apoptotic cells) and analyzed by Confocal Microscopy. n=3.(B, lower panel) Quantitative analysis of red fluorescence/area (7-ADD) to evaluate necrotic cells, and quantitative analysis of green fluorescence/area (Apopxin) to evaluate apoptotic cells (means ± S.E.M., p= n.s, n=3).
Figure 2.
Glucose and lactate levels in growth medium: Data were expressed as the ratio between results from samples exposed to s-microgravity (RPM) and those from the corresponding control (Ctr). (A) glucose levels (g glucose/mg proteins). (B) lactate levels (mmol lactate/mg protein) (means ± S.E.M.., p= n.s, n=15).
Figure 3.
Expression of calcium handling proteins: (A-C) Representative immunoblots of Calmodulin, pCaMKII and SERCA2 and the corresponding densitometric analyses. The densitometric analyses were calculated as the ratio between the optical density (OD) × mm2 of each band and the OD × mm2 of the corresponding loading control (GAPDH band for Calmodulin and SERCA2; CaMKII for pCaMKII). The data were expressed as the ratio between results from samples exposed to s-microgravity (RPM) and those from the corresponding control (Ctr) (means ± S.E.M., *p< 0.05, n=6).
Figure 4.
Simulated microgravity significantly affects TCam-2 spheroid mitochondria ultrastructure without altering the global mitochondria network mass: (A) Representative images of ultrastructural analysis performed by TEM showing mitochondria morphology in Ctr and RPM culture condition. The asterisks indicate damaged mitochondria, n=3. (B) Representative immunoblots of TOMM20 and the corresponding densitometric analysis. The densitometric analyses were calculated as the ratio between the optical density (OD) × mm2 of each band and the OD × mm2 of the corresponding loading control (GAPDH band). The data were expressed as the ratio between results from samples exposed to s-microgravity (RPM) and those from the corresponding control (Ctr) (means ± S.E.M., p= n.s, n=6).
Figure 5.
Simulated microgravity induced a slight, but not significant, increase in mitochondrial membrane depolarization: (A) Representative orthogonal projections of confocal analysis of TCam-2 spheroids, Ctr and RPM, after JC-1 staining. Image magnification 20X, n=4. (B) The graph represents the ratio between the SUM(I) of red fluorescence and green fluorescence (means ± S.E.M., p= n.s, n=4).
Figure 6.
Mitochondria superoxide production: (A) Representative orthogonal projections of confocal analysis of TCam-2 spheroids in Ctr and RPM conditions after MitoSOX staining. (B) the graph represents the SUM(I) of red fluorescence/area µm2 (means ± SE.M., *p< 0.05, n=3).
Figure 6.
Mitochondria superoxide production: (A) Representative orthogonal projections of confocal analysis of TCam-2 spheroids in Ctr and RPM conditions after MitoSOX staining. (B) the graph represents the SUM(I) of red fluorescence/area µm2 (means ± SE.M., *p< 0.05, n=3).
Figure 7.
ROS production and prooxidant enzyme expression profile: (A) Representative Confocal orthogonal projections of TCam-2 spheroids, cultured in Ctr or RPM condition, after H2DCFDA staining. (B) Quantitative analysis of fluorescence after H2DCFDA staining (SUM(I) green fluorescence/AREA) (means ± S.E.M., *p< 0.05, n=3). (C) Representative immunoblots of NOX2 and NOX4, and the corresponding densitometric analyses. The densitometric analyses were calculated as the ratio between the optical density (OD) × mm2 of each band and the OD × mm2 of the corresponding GAPDH band, which was used as the loading control.
Figure 8.
Response of antioxidant machine to s-microgravity: (A) qRT-PCR analysis of gene expression in TCam-2 spheroids exposed to s-microgravity (RPM) and in control (Ctr) (means ± S.E.M., **P<0.01, n=3). (B-F) Representative immunoblots of SOD1, SOD2, catalase, GPX1 and pNRF2, respectively, and the corresponding densitometric analyses. The densitometric analyses were calculated as the ratio between the optical density (OD) × mm2 of each band and the OD × mm2 of the corresponding GAPDH band, which was used as the loading control. The data were expressed as the ratio between results from samples exposed to s-microgravity (RPM) and those from the corresponding control (Ctr) (means ± S.E.M., *p< 0.05, n=5).
Figure 9.
Protein and lipid oxidative damage: (A,B) Representative immunoblots of the expression levels of 3-nitrotyrosine and 4-hydroxynonenal (4HNE), respectively, and the corresponding densitometric analyses. The densitometric analyses were calculated as the ratio between the OD × mm2 of each band and the OD × mm2 of the corresponding GAPDH band, which was used as the loading control. The data were expressed as the ratio between results from samples exposed to s-microgravity (RPM) and those from the corresponding control (Ctr) (means ± S.E.M., p= n.s, n=7). (C) Representative images of ultrastructural analysis performed by TEM showing autophagic vesicles (asterisks) in Ctr and RPM culture conditions. This analysis revealed that autophagy is active in both cultural conditions. (D) Representative immunoblots of LC3β and the corresponding densitometric analyses. The densitometric analyses were calculated as the ratio between the optical density (OD) × mm2 of each band and the OD × mm2 of the corresponding GAPDH band, which was used as the loading control. The data were expressed as the ratio between results from samples exposed to s-microgravity (RPM) and those from the corresponding control (Ctr) (means ± S.E.M., p= n.s, n=3).
