
Submitted:
18 July 2023
Posted:
19 July 2023
You are already at the latest version
Abstract
Insurers act as institutional investors and underwriters of risk, therefore improving their own environmental, social, and governance (ESG) performance is important for the transmission of ESG values to all other economic sectors. We analyze ESG scores of worldwide Property and Casualty (P&C) insurers during 2012-2022, and show that more sustainable insurers have high operating leverage, although their combined ratios and z-scores reveal that they are financially stable. Additional results for the US subsample illustrate that stocks issued by sustainable insurers deliver positive excess returns. Overall, these findings suggest that sustainable practices are associated with the ability of insurers to execute business and create value.
This is important for insurance managers, investors, and policy makers, as insurers play a prominent role in promoting economic growth and stability.
Keywords:
insurance
; ESG
; sustainability
1. Introduction
The stable trend of equity capital flowing into environmental, social and governance (ESG) funds forces managers of insurance companies to deal with ESG strategies. The continued growth of “green” and sustainable funds means insurers must actively monitor and promote their ESG ratings to retain full access to capital and manage the potential impacts on their stock price. That is, ESG practices would prevent firms to be excluded from ESG funds and indices.1 To address sustainability risks, the United Nations Environment Programme Finance Initiative (UNEPFI) has produced a guide for the global insurance industry - the Principles for Sustainable Insurance (PSI), founded on the key principle that “insurers will incorporate ESG issues relevant to their business in their own decision making”.2
The topic of sustainability has received in recent years a much stronger focus from regulators and policy makers. Therefore, there is vivid research on the effects from ESG on corporate finance decisions. Empirical evidence analyzing the impact of ESG inside insurance firms is very much narrow compared to evidence for non-financial sectors, as typically financial intermediaries are examined separately, due to considerable differences in their business model and regulation.
Some previous articles document the benefits for insurers from ESG. For example, Chiaramonte et al. (2020) show that ESG scores enhance the stability of American insurers, while Di Tommaso and Mazzuca (2023) illustrate that ESG ratings upgrades generate abnormal stock returns inside European insurance companies. However, we lack of extensive evidence showing how ESG practices shape the financial conditions of insurance firms. We take up this challenge and analyze a sample of United States P&C insurers during 2012-2022. We find that ESG scores correlate positively with insurers’ operating leverage, while are not significantly associated with financial leverage. At the same time, high ESG scores reveal low combined ratios and high z-scores. As we examine equity market valuations, we find that market-to-book ratios decrease in ESG scores. Finally, using data from US markets, we show that stocks issued by sustainable insurers earn highly positive excess returns. Overall, these outcomes integrate the previous evidence about the influence of ESG scores on risk-return trade-offs inside insurance corporations (Chiaramonte et al. 2020; Di Tommaso and Mazzuca 2023), by showing that the ability of P&C insurers to achieve financial stability and create value is tightly linked to sustainability practices.
Our findings are important for a few stakeholders. First, for insurance managers is relevant to understand how incorporating ESG in decision making would affect fundamentals. Second, for investors that form assets’ portfolios it is crucial to gather information on the past (out)performance of sustainable firms. Finally, regulators would employ the insights from our analysis to corroborate their effort in addressing ESG values in the whole economy. In fact, policy makers worldwide encourage insurers to factor ESG in their underwriting activity as well in their investments. As insurers are key for the safeguard of the system, it is an important task to collect evidence proving that sound ESG practices would make the insurance sector effectively more resilient.
The article is organized as follows. Section 2 presents the previous literature which is more closely related to our topic. Section 3 describes the data that we use for the analysis. Section 4 outlines the results. Section 5 shows additional results for the subsample of US insurers. Section 6 concludes.
2. Review of the literature
The growing concerns of regulators and policy makers about ESG topics provide a strong incentive for academic research aimed at acquiring knowledge about the impact of sustainability on the financial decision making inside corporations. Still, the large majority of the previous contributions has addressed sustainability issues analyzing data from non-financial firms or indices, while only few studies concentrate on the insurance industry. This, instead, is the focus of this article.
Scholtens (2011) uses a transparent framework to assess the incorporation of corporate social responsibility in the business of 153 international insurers in 2007. The author finds a high level of variability across countries and firms, with social and ethical aspects of corporate social responsibility being better integrated than environmental aspects.
Few studies use ESG scores of insurance companies to test their relationship with financial dimensions. For American insurers during 2006-2018, Chiaramonte et al. (2020) illustrate that increasing ESG scores diminish distress risk as measured by z-scores. The conclusion is that sustainability enhances the financial stability of insurers, while the data also reveal that this effect is stronger for the social and environmental pillars while not for the governance pillar. Brogi et al. (2022) use data from large US insurers to implement a two-step method that first elaborates a measure for ESG awareness Brogi and Lagasio (2019), and then relates such quantity to characteristics that may reasonably explain the company’s ESG awareness. Solvency, profitability, and size, in particular, are found to be the most significant in determining the level of ESG awareness. In Bressan (2023) sustainability is associated with the purchase of reinsurance. The author finds that high ESG firms cede less risk to reinsurers, while they are also more profitable. She argues that sustainable insurers are less risky, and can save on reinsurance costs.
In the existing literature the correlation between ESG scores and financial performance has been found positive, negative, or even non-existent.3 For the insurance industry the evidence is much scarce, therefore it remains an open empirical issue to establish if sustainable insurers deliver superior returns to investors. Di Tommaso and Mazzuca (2023) study the effect of ESG ratings on the stock price of European insurance companies using the event study methodology. The results suggest that stock prices are highly responsive to ESG ratings, as the authors find that an upgrade in the ESG rating results in a significant stock price increase, while a rating downgrade leads to a decrease.
Following this stream of research, we analyze international P&C insurers, and examine the relationship of firms’ ESG scores with measures of financial strength and stock market valuation. In this way we integrate the previous evidence by providing additional results addressing the hypothesis that sustainability creates value in the insurance industry.
3. Data and variables
We use Standard and Poor’s Capital IQ to obtain annual information on the ESG scores, balance sheets and income statements of worldwide property and casualty (P&C) insurers during the period 2013-2022. As the companies spread all geographical regions in the world, we collect the data from the library denominated “universal insurance financials”. The Appendix reports the complete list of the companies in the sample.
S&P Capital IQ computes the ESG score as a discrete number ranging 0-100 reflecting the performance of the company on key environmental, social, and governance (ESG) issues according to an industry specific assessment methodology and aggregation schemes. Higher values of ESG scores indicate stronger performance in sustainability practices.4 In our analysis we denote the composite score as , and also exploit the granularity of our database to decompose the single pillars, calling E, S, and G the three separate components. Descriptive statistics in Table 1 show that the governance dimension has the best rating in the sample, with median G equal to 35. Instead, median E and S are smaller and respectively equal to 16 and 15.5
We examine the relationship between ESG scores and variables which approximate important concepts for the financial analysis of insurance companies. Table A1 in the Appendix summarizes the definition of all our variables.
First, we consider leverage. In an insurance company there are two kinds of leverage. We define the operating (or underwriting) leverage ratio, namely net premiums written divided by the policyholders’ surplus. This number is often called by practitioners “surplus ratio”, and quite often in the literature is viewed as a fundamental measure of leverage inside insurance companies (Powers 2006). At the denominator, the policyholders’ surplus is the amount by which a company’s assets exceed its liabilities, and is the asset cushion which an insurance company maintains to protect itself, its policyholders and its shareholders, against losses and adverse conditions. In general, leverage ratios serve as indicators or partial determinants of the riskiness of the owner’s investment in the firm. In particular, measures the insurer’s exposure to pricing errors in its current book of business. For example Leng and Meier (2006) use to approximate insurers’ risk taking behaviors, and investigate joint dynamics with the loss ratio in order to identify structural changes in the underwriting cycles of property and liability (P&L) insurers. In the US, the premium to surplus ratio is one of the tests used in the Insurance Regulatory Information System (IRIS) to predict insurers’ financial strength to prevent insolvency. A premium to surplus ratio of more than 3 indicates the insurer operates with high underwriting risk and would not be considered solvent.6 On average, our firms seem to be financially strong, as the median inside Table 1 equals to 1.07. For robustness, we also compute as the ratio of net premiums written to stockholders’ equity. The quantity is inversely related to financial strength, as high values of reveal that stockholders are highly exposed to operating risks.
The second dimension of leverage is the financing leverage, which we approximate by dividing the company’s debt by the capital raised by issuing stocks and equity. Therefore, the financial leverage ratio measures the degree to which the firm is vulnerable to investment related risks like interest rate and credit risks.
We calculate the combined ratio (also called “insurance ratio”, or “Kenney ratio”), which is a measure widely employed in the industry to evaluate the profitability and financial health of an insurance company. The quantity is the sum of incurred losses, loss adjustment expenses plus other underwriting expenses, divided by earned premiums. Thus, represents how much of losses and underwriting expenses are being paid out per dollar of premium. A combined ratio below 100% indicates that the insurer is making underwriting profit, while a ratio above 100% indicates an underwriting loss. In the literature, the combined ratio was often used to approximate insolvency rates, proving that patterns in insurers’ combined ratios would predict behaviors in the underwriting cycles (Browne and Hoyt 1995; Doherty and Garven 1993; Grace and Hotchkiss 1995).
We employ the z-score as an indicator for the firm stability. The quantity is the sum of equity to total assets and return on average assets scaled by the three-year standard deviation of the average return on assets Chiaramonte et al. (2020). The z-score is computed in previous research as well in the insurance industry to gauge financial strength of insurance firms, as increasing values of would reveal lowering distress probability (Chiaramonte et al. 2020; Gaganis et al. 2019; Pasiouras and Gaganis 2013; Shim 2017).
The market-to-book ratio is the ratio of market value of equity to book value of equity. This is an indicator that practitioners widely use to assess the capacity of a firm to generate value for shareholders. In fact, a ratio of one indicates that shareholders can only expect a return of book value. A ratio below one is typical for so-called “value companies”, meaning that investors could buy the firm stock for a low price relative to the value of its assets. A ratio above one instead indicates that the firm is overvalued. In the literature the market-to-book ratio is frequently used to capture the firm’s growth opportunities (Adam and Goyal 2008). Firms with a high (so-called “growth companies’’) entail high default risk, as they are usually more volatile with respect to the existing future growth opportunities. For example, Milidonis and Stathopoulos (2011) compute the market-to-book ratio for a sample of large insurers to analyze the link between default risk and executive compensation.
Finally, in our regressions we control for the corporate size by taking the natural logarithm of total assets (). Table 2 reports pairwise correlation coefficients. In order to more deeply investigate the relationship between ESG scores and the indicators for firm specific characteristics, we conduct a regression analysis in the next subsection.
4. Results
In Table 3 columns (1)-(4) report the outcomes from pooled OLS regressions of on the one period lagged , and the partial scores E, S, and G. All regressions control for , time fixed effects, and a constant term. T-statistics are reported in parentheses and the standard errors are robust. We observe that the coefficients are all positive, although the social and environmental dimensions are statistically significant, while the governance pillar is not significant. In columns (5)-(8) the regressions for exhibit a similar pattern. These findings suggest that high ESG firms are more exposed to underwriting risk, as they write a huge amount of policies without raising in a proportional way capital aimed at covering potential losses. In columns (9)-(12) the coefficients in the regressions estimated for financial leverage are negative but never significant. Thus, sustainability does not have a considerable impact on the capital structure of insurers.
In Table 4 columns (1)-(4) we find that the combined ratio decreases in the ESG scores, with E and G being also more significant. The combined ratio is inversely related to the company’s financial strength, therefore high ESG firms seem to have solid financial fundamentals. The estimates for the z-score reveal consistent outcomes, as in columns (5)-(8) the coefficients on are positive, and again significant for E and G. Finally, firms with a stronger ESG performance have lower market-to-book ratios (see columns (9)-(12)).
To summarize our findings, at first we observe that operating leverage increases with ESG scores. That is, the underwriting capacity of firms decreases as they exhibit a better ESG performance. However, it seems that sustainability does not have a substantial effect on the capital structure, as the financial leverage does not change substantially. Our interpretation is that improving ESG features do not affect the cost of debt financing in a considerable way, to the point of changing the funding structure, in line with Gigante and Manglaviti (2022).7
At the same time though, we find that high ESG insurers are more resilient, as increasing ESG scores are associated with low combined ratios and high z-scores. Our findings are in line with evidence in Chiaramonte et al. (2020) for American insurers. In fact, the authors document a positive effect from ESG scores on z-scores during 2006-2018, while disentangling the score components they discover that the relationship is statistically significant for the environmental and the social pillars. In our case instead, the environmental and the governance dimensions are the most significant.
Overall, the outcomes reveal that sustainability interacts with the financial strength of insurers. Although insurers with sound ESG profiles seem to face higher risks related to their operating business, the same firms don’t appear to face increasing investment risks. Our indicators for financial strength instead, suggest that high ESG insurers are financially solid. Moreover, as we use the market-to-book ratio as a metric for equity valuation, we conclude that increasing sustainability would enhance the “value” feature of insurers’ equity rather than the “growth” one. In order to examine more deeply the stock market performance of our companies, in the next section we analyze stock market returns for the subsample of US insurers.
5. Stock returns of US insurers
For the subsample of US companies we obtain from Compustat the market data with monthly frequency. Firms are traded on the NYSE or the NASDAQ. In Table 5 we conduct pooled regressions of stock returns (r) on scores besides controlling for the factors in Fama and French (1993) (i.e. market excess return , small-minus-big , and high-minus-low ), the momentum factor () as in Jegadeesh and Titman (1993), and time dummies. We find positive coefficients on and on the three components, yet only G is significant.8
However, in the asset pricing literature the standard approach is to analyze portfolio returns. Therefore, we rank our stocks into quintiles of and form value-weighted portfolios, i.e. the portfolio holdings are proportional to the stock market capitalization computed as average stock price times average number of outstanding shares. Portfolios of insurers in the first quintile are the least sustainable assets, while the fifth quintile corresponds to the most sustainable portfolios. In Table 6 we perform regressions in each quintile to compare the portfolio value-weighted return () to the performance of the benchmark market model.
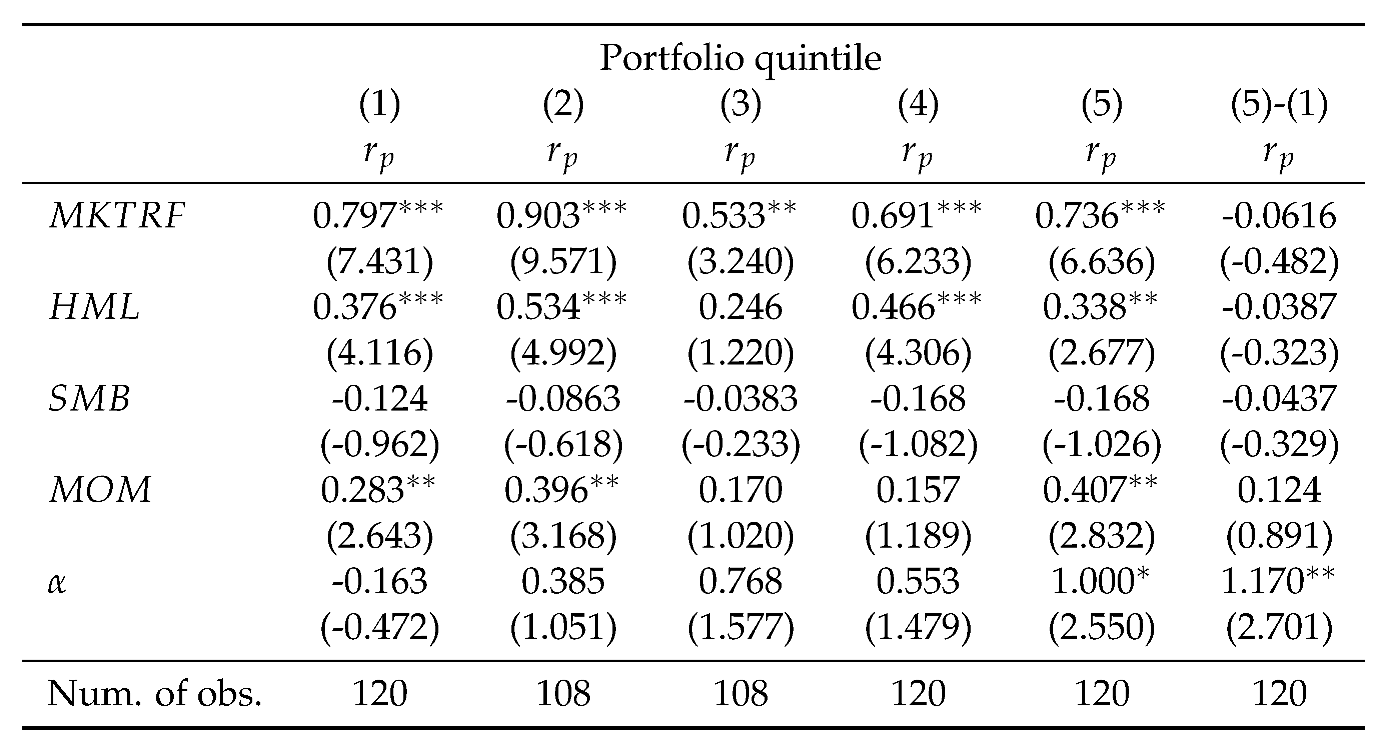
The coefficient on the constant term measures the excess (or abnormal) return in relation to the benchmark. Our regressions estimate a significant in the fifth quintile, i.e. the most sustainable portfolios outperform the market. In column (6) of Table 6 we consider a long-short position that goes long in a portfolio of the high ESG firms and short in a portfolio of the low ESG firms. This strategy delivers a positive excess return measured by close to 1%. As we make separate portfolio tests (see Table 7, Table 8 and Table 9), we find that the governance pillar drives the results that we observed for the composite rating. In fact, a long/short strategy on stocks with high/low governance delivers a significant close to 1.17% (see Table 9).
The results for the US subsample in Table 6, together with the results in Table 4, are consistent with previous articles on the “value premium” in stock returns. Documented among the first by Capaul et al. (1993), the value premium is a well-established finding in the finance literature, and it asserts that companies with low market-to-book ratios (i.e., value companies) yield higher returns than companies with higher such ratio (i.e., growth companies). For the subsample of US insurers we have also preliminary checked that decreases significantly with ESG scores, as it was for the whole sample in Table 4.9 Therefore, based on these additional outcomes we hypothesize that ESG scores would plausibly contribute to determine value premiums inside US insurers.
6. Conclusions
The growing ESG concerns across all economic sectors pose important challenges to insurance companies, and it is important to learn if ESG scores are informative on their financial strength and market performance. We analyze worldwide P&C insurers, and show how ESG scores affect in a significant way few indicators (leverage ratios, combined ratio, z-score, market-to-book ratio) that are widely employed by practitioners and asset managers to assess investment trade-offs. High ESG insurers seem to be financially healthy, although exposed to increasing underwriting risk. Furthermore, they earn abnormal returns in the stock market. These findings deliver important insights to insurers’ stakeholders, i.e. policy makers, managers and investors, while also leave hints for future research.
First, to policy makers our results show that ESG scores interact with parameters used for the monitoring of financial strength. It is therefore crucial to deeply understand this nexus, and use appropriate measures of strength in order to address and improve ESG inside P&C insurers.10 In fact, every insurance company has an investment portfolio reported to the insurance regulatory authority. In the current economic landscape, insurance firms are among the major investors, meaning that improving their own ESG profile would contribute substantially to the progress of the whole economy to ESG values. The European Insurance and Occupational Pensions Authority (EIOPA) points out that, as long-term investors with an overall balance sheet of around €8 trillion, insurers in the European Economic Area (EEA) can play a significant role in putting our economies on a more sustainable track (EIOPA 2023b). Enhancing ESG values inside insurers would ultimately benefit economic growth and financial stability, because insurers play a key role in the propagation of systemic risk (Acharya and Richardson 2014).
Second, managers and investors learn from our analysis that incorporating ESG factors in their decision making could improve in the short run the value created to equityholders.
Finally, to follow up research we leave the task of developing theoretical bases that explain the patterns shown in this article. Future studies should disentangle the channels that lead corporate sustainability to have an impact on insurers’ fundamentals, and, above all, should establish in which way more sustainable insurance companies would become also financially healthier.
Appendix A
These are the insurance companies that we analyze:
Asia-Pacific: Anicom Holdings Inc., DB Insurance Co. Ltd., Dhipaya Group Holdings Public Company Limited, Dream Incubator Inc., Hyundai Marine & Fire Insurance Co. Ltd., ICICI Lombard General Insurance Company Limited, Insurance Australia Group Limited, MS&AD Insurance Group Holdings Inc., Meritz Financial Group Inc., QBE Insurance Group Limited, Samsung Fire & Marine Insurance Co. Ltd., Shinkong Insurance Co. Ltd., Sompo Holdings Inc., Suncorp Group Limited, The People’s Insurance Company (Group) of China Limited, Tokio Marine Holdings Inc.
Europe: Admiral Group Plc, Alm. Brand A/S, Beazley Plc, Chubb Limited, Direct Line Insurance Group Plc, Linea Directa Aseguradora S.A., Sabre Insurance Group Plc, Tryg A/S.
Latin America and Caribbean: Qualitas Controladora S.A.B. de C.V.
Middle East: Qatar Insurance Company Q.S.P.C.
Unite States and Canada: AMERISAFE Inc., AXIS Capital Holdings Limited, Ambac Financial Group Inc., American Financial Group Inc., Arch Capital Group Ltd., Argo Group International Holdings Ltd., Assured Guaranty Ltd., Cincinnati Financial Corporation, Employers Holdings Inc., Erie Indemnity Company, Fairfax Financial Holdings Limited, HCI Group Inc., Hallmark Financial Services Inc., Heritage Insurance Holdings Inc., Hiscox Ltd, Intact Financial Corporation, James River Group Holdings Ltd., Kemper Corporation, Kinsale Capital Group Inc., Lancashire Holdings Limited, Loews Corporation, Markel Corporation, Mercury General Corporation, Old Republic International Corporation, Palomar Holdings, Inc., ProAssurance Corporation, RLI Corporation, Safety Insurance Group Inc., Selective Insurance Group Inc., The Allstate Corporation, The Hanover Insurance Group Inc., The Progressive Corporation, The Travelers Companies Inc., Trisura Group Ltd., United Fire Group Inc., United Insurance Holdings Corp., Universal Insurance Holdings Inc., W. R. Berkley Corporation, White Mountains Insurance Group Ltd.

Table A1.
Definition of variables.
| Variable | Definition |
| Combined ratio, i.e. the sum of incurred losses, loss adjustment expenses plus other underwriting expenses, divided by earned premiums. | |
| E | Natural logarithm of the company’s environmental score. The environmental score is a discrete number and ranges 0-100. |
| Company’s environmental, social, and governance (ESG) score. The ESG score is a discrete number and ranges 0-100. | |
| Financing leverage ratio, namely company’s debt divided by equity capital. | |
| G | Company’s governance score. The governance score is a discrete number and ranges 0-100. |
| High-minus-low (Fama and French 1993). | |
| Excess market return (Fama and French 1993). | |
| Momentum factor (Jegadeesh and Titman 1993). | |
| Stock market price divided by book value per share. | |
| Operating (or underwriting) leverage ratio, namely net premiums written divided by the policyholders’ surplus. Policyholders’ surplus is company’s assets minus liabilities. | |
| Net premiums written divided by equity. | |
| r | Monthly stock return |
| S | Company’s social score. The social score is a discrete number and ranges 0-100. |
| Natural logarithm of the company’s total assets. | |
| Small-minus-big (Fama and French 1993). | |
| Z-score, i.e. the sum of equity to total assets and return on average assets divided by the three-year standard deviation of the average return on assets. |
References
- Viral V Acharya and Matthew Richardson. Is the insurance industry systemically risky? Modernizing insurance regulation (Chapter 9), pages 151–179. 2014. [CrossRef]
- Tim Adam and Vidhan K Goyal. The investment opportunity set and its proxy variables. Journal of Financial Research, 31(1):41–63. 2008. [CrossRef]
- Ulrich Atz, Tracy Van Holt, Zongyuan Zoe Liu, and Christopher C Bruno. Does sustainability generate better financial performance? Review, meta-analysis, and propositions. Journal of Sustainable Finance & Investment, 13(1):802–825. 2023. [CrossRef]
- Silvia Bressan. Reinsurance and sustainability: Evidence from international insurers. Available at SSRN 4440281, 2023. [CrossRef]
- Marina Brogi and Valentina Lagasio. Environmental, social, and governance and company profitability: Are financial intermediaries different? Corporate Social Responsibility and Environmental Management, 26(3):576–587. 2019. [CrossRef]
- Marina Brogi, Antonella Cappiello, Valentina Lagasio, and Fabrizio Santoboni. Determinants of insurance companies’ environmental, social, and governance awareness. Corporate Social Responsibility and Environmental Management, 29(5):1357–1369, 2022. [CrossRef]
- Mark J Browne and Robert E Hoyt. Economic and market predictors of insolvencies in the property-liability insurance industry. Journal of Risk and Insurance, pages 309–327. 1995. [CrossRef]
- Carlo Capaul, Ian Rowley, and William F Sharpe. International value and growth stock returns. Financial Analysts Journal, 49(1):27–36. 1993. [CrossRef]
- Giovanni Cardillo and Murad Harasheh. Stay close to me: What do ESG scores tell about the deal timing in M&A transactions? Finance Research Letters, 51:103498. 2023. [CrossRef]
- CBIRC. https://www.cbirc.gov.cn/cn/view/pages/index/index.html, 2022.
- Laura Chiaramonte, Alberto Dreassi, Andrea Paltrinieri, and Stefano Piserà. Sustainability practices and stability in the insurance industry. Sustainability, 12(14):5530, 2020. [CrossRef]
- Caterina Di Tommaso and Maria Mazzuca. The stock price of European insurance companies: What is the role of ESG factors? Finance Research Letters, page 104071, 2023. [CrossRef]
- Neil A Doherty and James R Garven. Interest rates, financial structure and insurance cycles. University of Pennsylvania Working Paper, 1993.
- EIOPA. Prudential treatment of sustainability risks. https://www.eiopa.europa.eu/system/files/2022-12/discussion_paper_on_the_prudential_treatment_of_sustainability_risks.pdf, 2022.
- EIOPA. The role of insurers in tackling climate change: Challenges and opportunities. https://www.eiopa.europa.eu/publications/role-insurers-tackling-climate-change-challenges-and-opportunities_en, 2023a.
- EIOPA. Insurers’ green investments. https://www.eiopa.europa.eu/system/files/2023-02/Factsheet-Greeninvestments2023v5.pdf, 2023b.
- Eugene F Fama and Kenneth R French. Common risk factors in the returns on stocks and bonds. Journal of Financial Economics, 33(1):3–56, 1993. [CrossRef]
- Gunnar Friede, Timo Busch, and Alexander Bassen. ESG and financial performance: Aggregated evidence from more than 2000 empirical studies. Journal of Sustainable Finance & Investment, 5(4):210–233. 2015. [CrossRef]
- Chrysovalantis Gaganis, Iftekhar Hasan, Panagiota Papadimitri, and Menelaos Tasiou. National culture and risk-taking: Evidence from the insurance industry. Journal of Business Research, 97:104–116. 2019. [CrossRef]
- Guido Giese, Linda-Eling Lee, Dimitris Melas, Zoltán Nagy, and Laura Nishikawa. Foundations of ESG investing: How ESG affects equity valuation, risk, and performance. The Journal of Portfolio Management, 45(5):69–83. 2019. [CrossRef]
- Gimede Gigante and Davide Manglaviti. The ESG effect on the cost of debt financing: A sharp RD analysis. International Review of Financial Analysis, 84:102382, 2022. [CrossRef]
- Martin F Grace and Julie L Hotchkiss. External impacts on the property-liability insurance cycle. Journal of Risk and Insurance, 62(4):738–754. 1995. [CrossRef]
- Ly Ho, Min Bai, Yue Lu, and Yafeng Qin. The effect of corporate sustainability performance on leverage adjustments. The British Accounting Review, 53(5):100989, 2021. [CrossRef]
- Narasimhan Jegadeesh and Sheridan Titman. Returns to buying winners and selling losers: Implications for stock market efficiency. The Journal of Finance, 48(1):65–91, 1993. [CrossRef]
- Jaime F Lavin and Alejandro A Montecinos-Pearce. Heterogeneous firms and benefits of ESG disclosure: Cost of debt financing in an emerging market. Sustainability, 14(23):15760, 2022. [CrossRef]
- Chao-Chun Leng and Ursina B Meier. Analysis of multinational underwriting cycles in property-liability insurance. The Journal of Risk Finance, 7(2):146–159. 2006. [CrossRef]
- Andreas Milidonis and Konstantinos Stathopoulos. Do US insurance firms offer the “wrong” incentives to their executives? Journal of Risk and Insurance, 78(3):643–672. 2011. [CrossRef]
- Fotios Pasiouras and Chrysovalantis Gaganis. Regulations and soundness of insurance firms: International evidence. Journal of Business Research, 66(5):632–642. 2013. [CrossRef]
- Michael R Powers. An insurance paradox. The Journal of Risk Finance, 7(2):113–116. 2006. [CrossRef]
- Randy Priem and Andrea Gabellone. The impact of a firm’s ESG score on its cost of capital: Can a high ESG score serve as a substitute for a weaker legal environment? Available at SSRN 4286057 2022. [Google Scholar]
- Nicola Raimo, Alessandra Caragnano, Marianna Zito, Filippo Vitolla, and Massimo Mariani. Extending the benefits of ESG disclosure: The effect on the cost of debt financing. Corporate Social Responsibility and Environmental Management, 28(4):1412–1421, 2021. [CrossRef]
- Bert Scholtens. Corporate social responsibility in the international insurance industry. Sustainable Development, 19(2):143–156. 2011. [CrossRef]
- SEC. https://www.sec.gov/news/press-release/2022-46, 2022.
- Jeungbo Shim. An investigation of market concentration and financial stability in property–liability insurance industry. Journal of Risk and Insurance, 84(2):567–597. 2017. [CrossRef]
- The Geneva Association. The role of insurance in promoting social sustainability. https://www.genevaassociation.org/sites/default/files/2022-11/social_sustainability_report.pdf, 2022.
| 1 | ESG is the term used most commonly in relation to investment products and underwriting. This is also the terminology we use throughout the paper, and we call “sustainable insurers” firms that have high ESG ratings. |
| 2 | |
| 3 | Friede et al. (2015) survey about 2,200 empirical papers that examine the association of ESG to corporate financial performance. The large majority of studies reports that ESG enhances performance in a stable way over time. More recently, Atz et al. (2023) present findings from a survey of 1,141 papers and 27 meta-reviews published between 2015 and 2020, revealing that the financial performance of ESG investing is similar to conventional investing, with one-third of studies showing superior performance. |
| 4 | The S&P ESG ratings are based on the Corporate Sustainability Assessment (CSA), beside on information provided directly to S&P and certified by analysts, as well on public domain information. More information on the methodology employed by S&P Capital IQ to compute ESG ratings can be found at https://www.spglobal.com/esg/csa/methodology/. |
| 5 | Sometimes in empirical research ESG ratings are taken as logarithms, like for example in Cardillo and Harasheh (2023). Following the majority of the studies in this field, we opt for including in our regressions the levels of the ESG scores. However, we checked that using natural logarithms we obtain stronger coefficients but the quality of the outcomes does not change. |
| 6 | |
| 7 | In the previous research it is not well established whether debt issuances would grow with ESG practices. For example, Raimo et al. (2021) and Priem and Gabellone (2022) find that ESG disclosure and ESG scores have both a negative effect on the cost of debt financing. Lavin and Montecinos-Pearce (2022) instead argue that the cost of debt increases when ESG disclosures interact with growth opportunities in revealing prospective risk. Ho et al. (2021) show that the corporate sustainability performance has an impact on dynamics in the capital structure, by increasing the speed at which firms adjust their leverage ratios to the target levels. To investigate whether ESG scores influence dynamics in the financial leverage of our firms, we have tested regressions of annual changes in on lagged ESG scores. In line with the outcomes of Table 3, the coefficients on and on the three pillars are never statistically significant. These results are available upon request. |
| 8 | The factors , , and are taken from the Kenneth R. French’s data library at https://mba.tuck.dartmouth.edu/pages/faculty/ken.french/data_library.html. We have checked that the quality of the results does not change when all regressors are lagged by one period. These results are available upon request. |
| 9 | These results are available upon request. Still, the correlation between ESG scores and the market-to-book ratio remains an empirical issue, and for example Giese et al. (2019) compare ESG rating quintiles within the MSCI World Index over a 10-year period in 2007-2017, and show that the highest quintile has also highest market-to-book ratio. |
| 10 | Policy makers worldwide are increasing the issuance as well the stringency of rules addressed to tackle ESG issues in the insurance industry. For example, regarding the topic of climate change, the European Insurance and Occupational Pensions Authority (EIPOA) highlights the prominent role of the insurance industry in making the society and the economy more climate resilient (EIOPA 2023a). In particular, for non-life underwriting risks, the EIOPA works on guidelines to incorporate some climate-related measures in the solvency capital requirements EIOPA (2022). The US Securities and Exchange Commission (SEC) released recently its climate disclosure requirements proposal (SEC 2022). The proposal would move existing voluntary disclosures of climate-related risks to mandatory requirements that potentially carry increased legal liability. The Geneva Association outlines the pivotal role of insurance in promoting social sustainability, providing recommendations to insurance companies in order to foster socio-economic resilience and sustainability (The Geneva Association 2022). The China Banking and Insurance Regulatory Commission (CBIRC) issued in 2022 the green finance guidelines for banking and insurance sectors. These guidelines encourage insurers to improve their own ESG performance, and promote an all-round green transition of economic and social development (CBIRC 2022). |
Table 1.
Descriptive statistics. See Table A1 for the definitions of all variables included in the models.
Table 1.
Descriptive statistics. See Table A1 for the definitions of all variables included in the models.
| Mean | Median | Min | Max | St. dev. | |
| Variables | |||||
| 31.54 | 22.5 | 0 | 85 | 23.19 | |
| E | 27.56 | 16 | 0 | 97 | 29.97 |
| S | 25.1 | 15 | 0 | 86 | 25.66 |
| G | 38.71 | 35 | 1 | 87 | 20.89 |
| 1.12 | 1.07 | 0.04 | 4.45 | 0.74 | |
| 1.19 | 1.10 | -0.04 | 4.79 | 0.66 | |
| 0.004 | 0.003 | 0 | 0.080 | 0.01 | |
| 0.95 | 0.94 | 0.75 | 1.37 | 0.08 | |
| 0.93 | 0.59 | 0.04 | 10.82 | 1.22 | |
| 1.93 | 1.33 | .037 | 10.81 | 1.77 | |
| 16.95 | 17.13 | 10.29 | 21.04 | 1.60 |
Table 2.
Correlation. See Table A1 for the definitions of all variables included in the models. *** p<0.01, ** p<0.05, * p<0.1.
Table 2.
Correlation. See Table A1 for the definitions of all variables included in the models. *** p<0.01, ** p<0.05, * p<0.1.
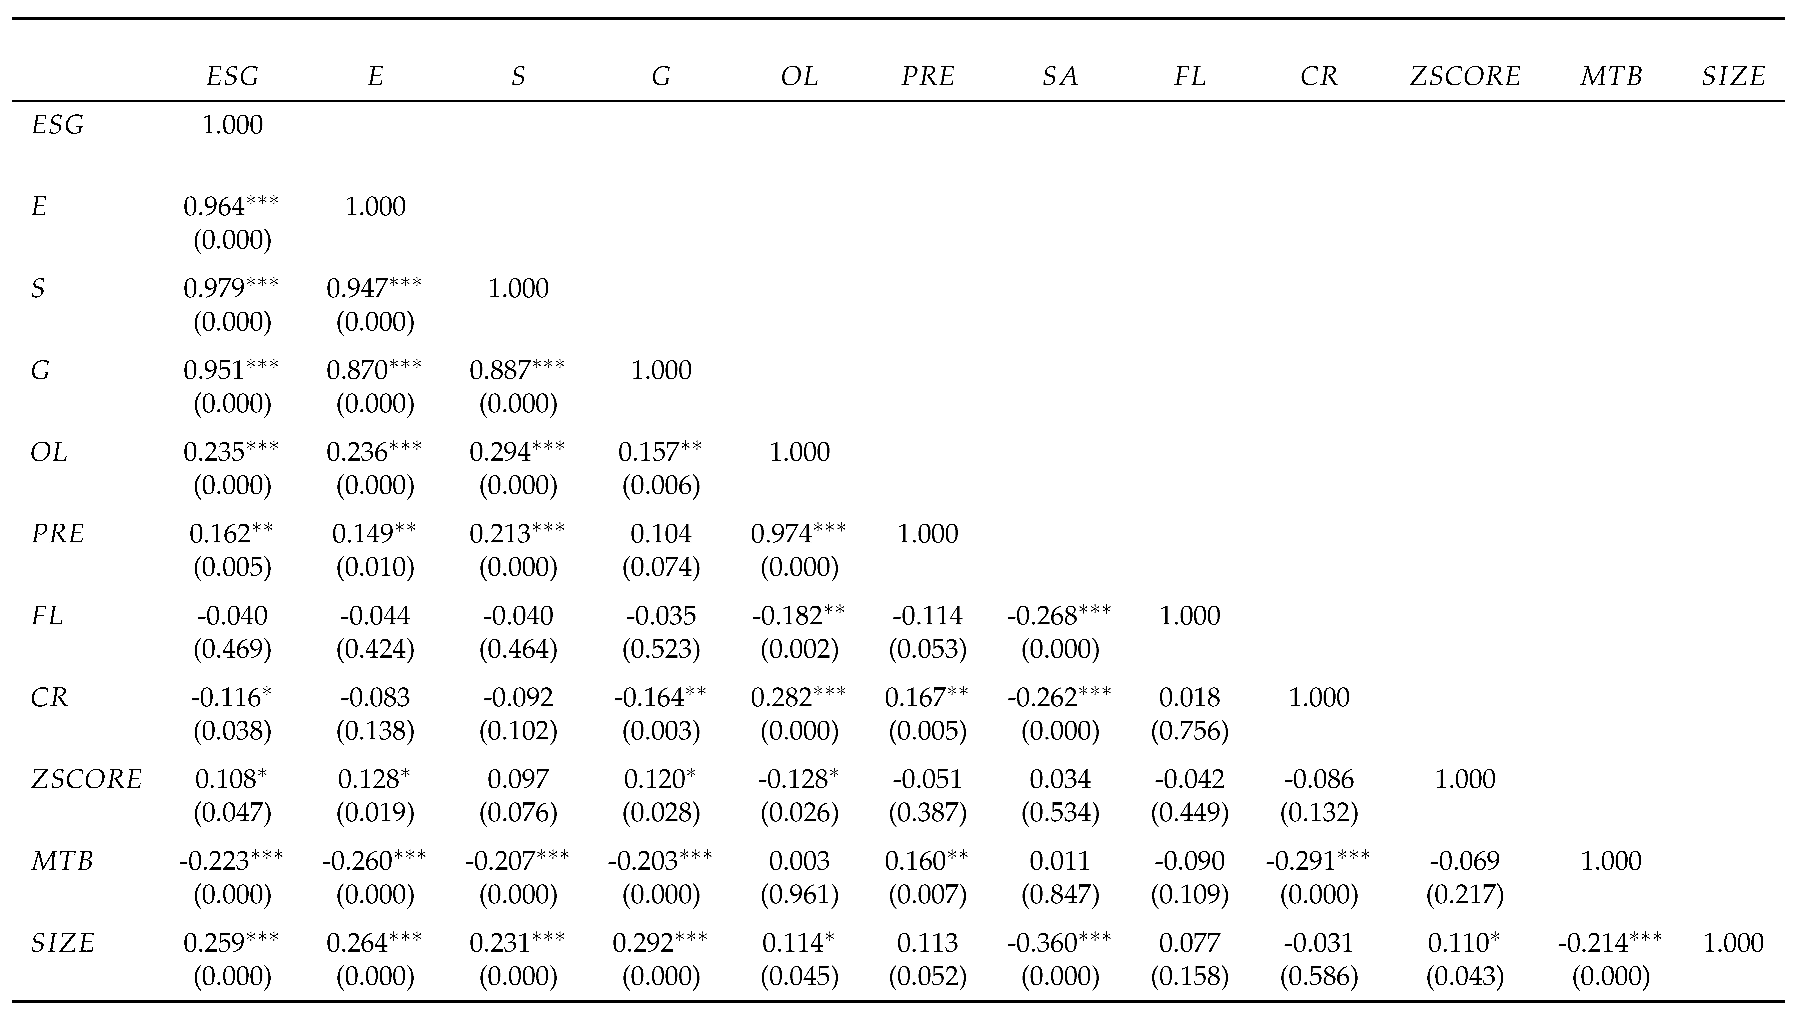 |
Table 3.
Results of OLS models with dependent variables , , and in t + 1. See Table A1 for the definitions of all variables included in the models. Controls include , time dummies, and a constant term. T-statistics are reported in parentheses and standard errors are robust. *** p<0.01, ** p<0.05, * p<0.1.
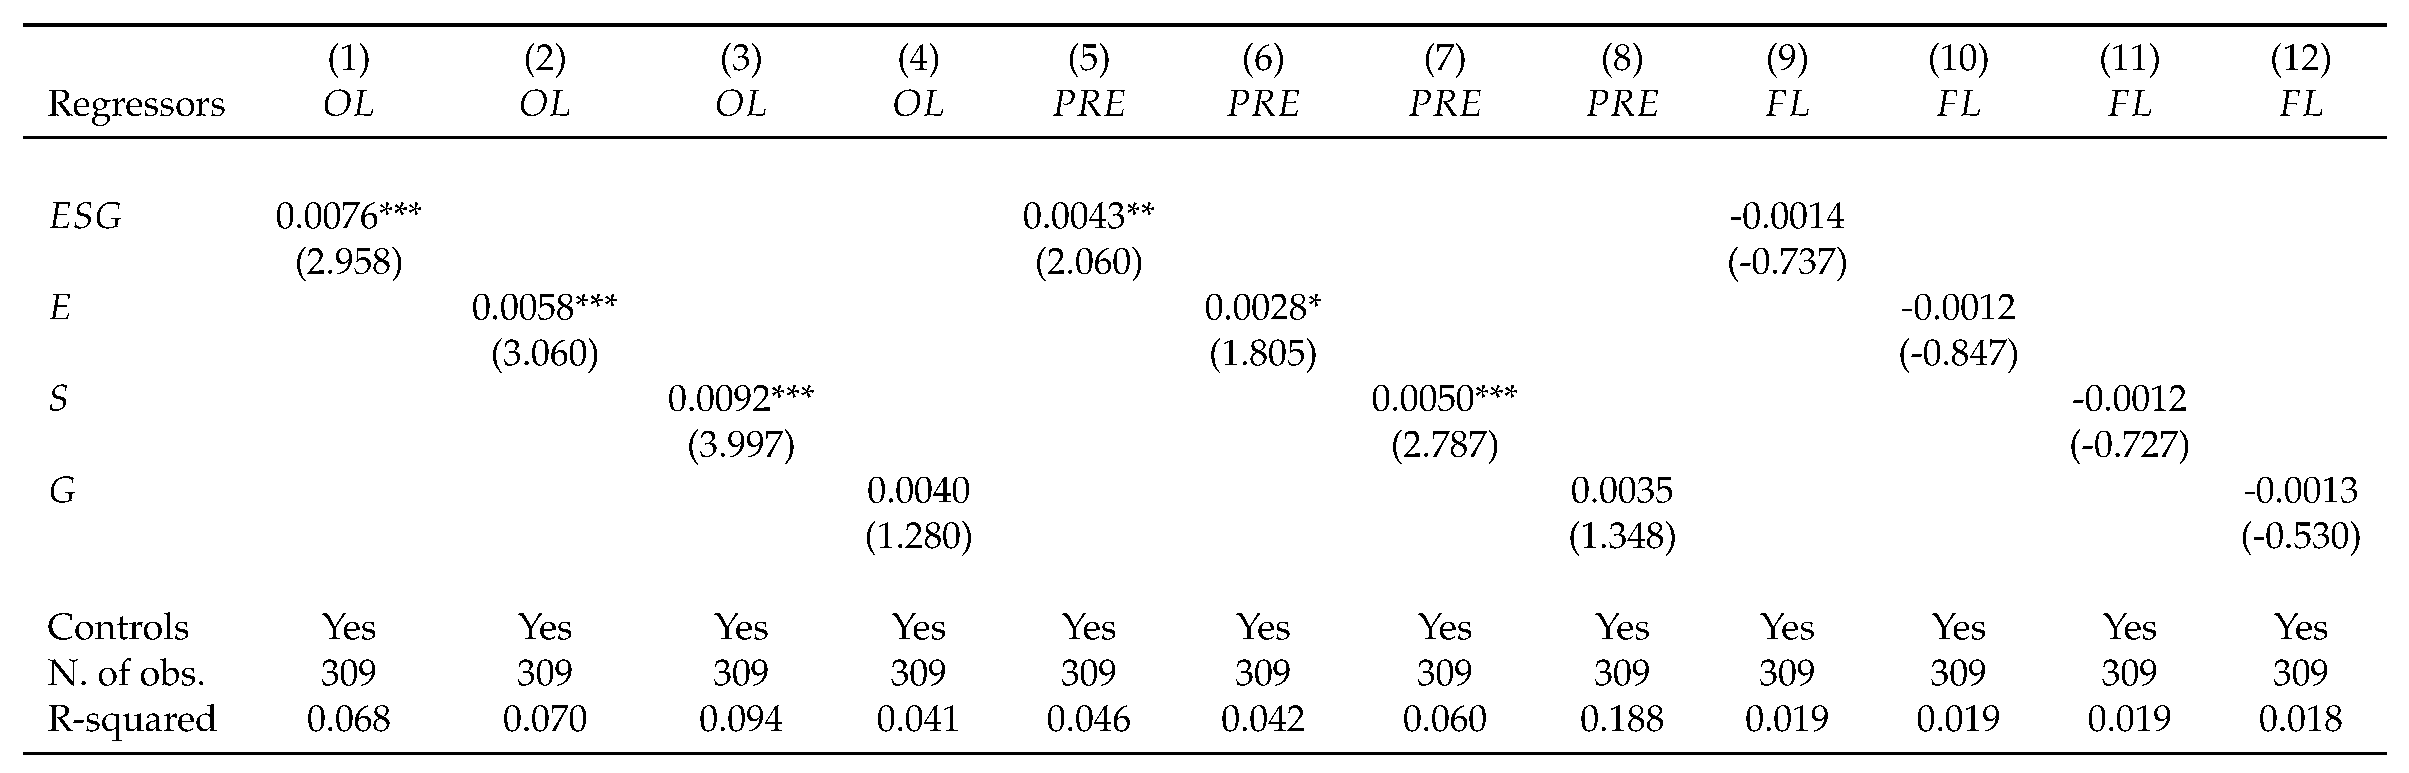 |
Table 4.
Results of OLS models with dependent variables , , and in t + 1. See Table A1 for the definitions of all variables included in the models. Controls include , time dummies, and a constant term. T-statistics are reported in parentheses and standard errors are robust. *** p<0.01, ** p<0.05, * p<0.1.
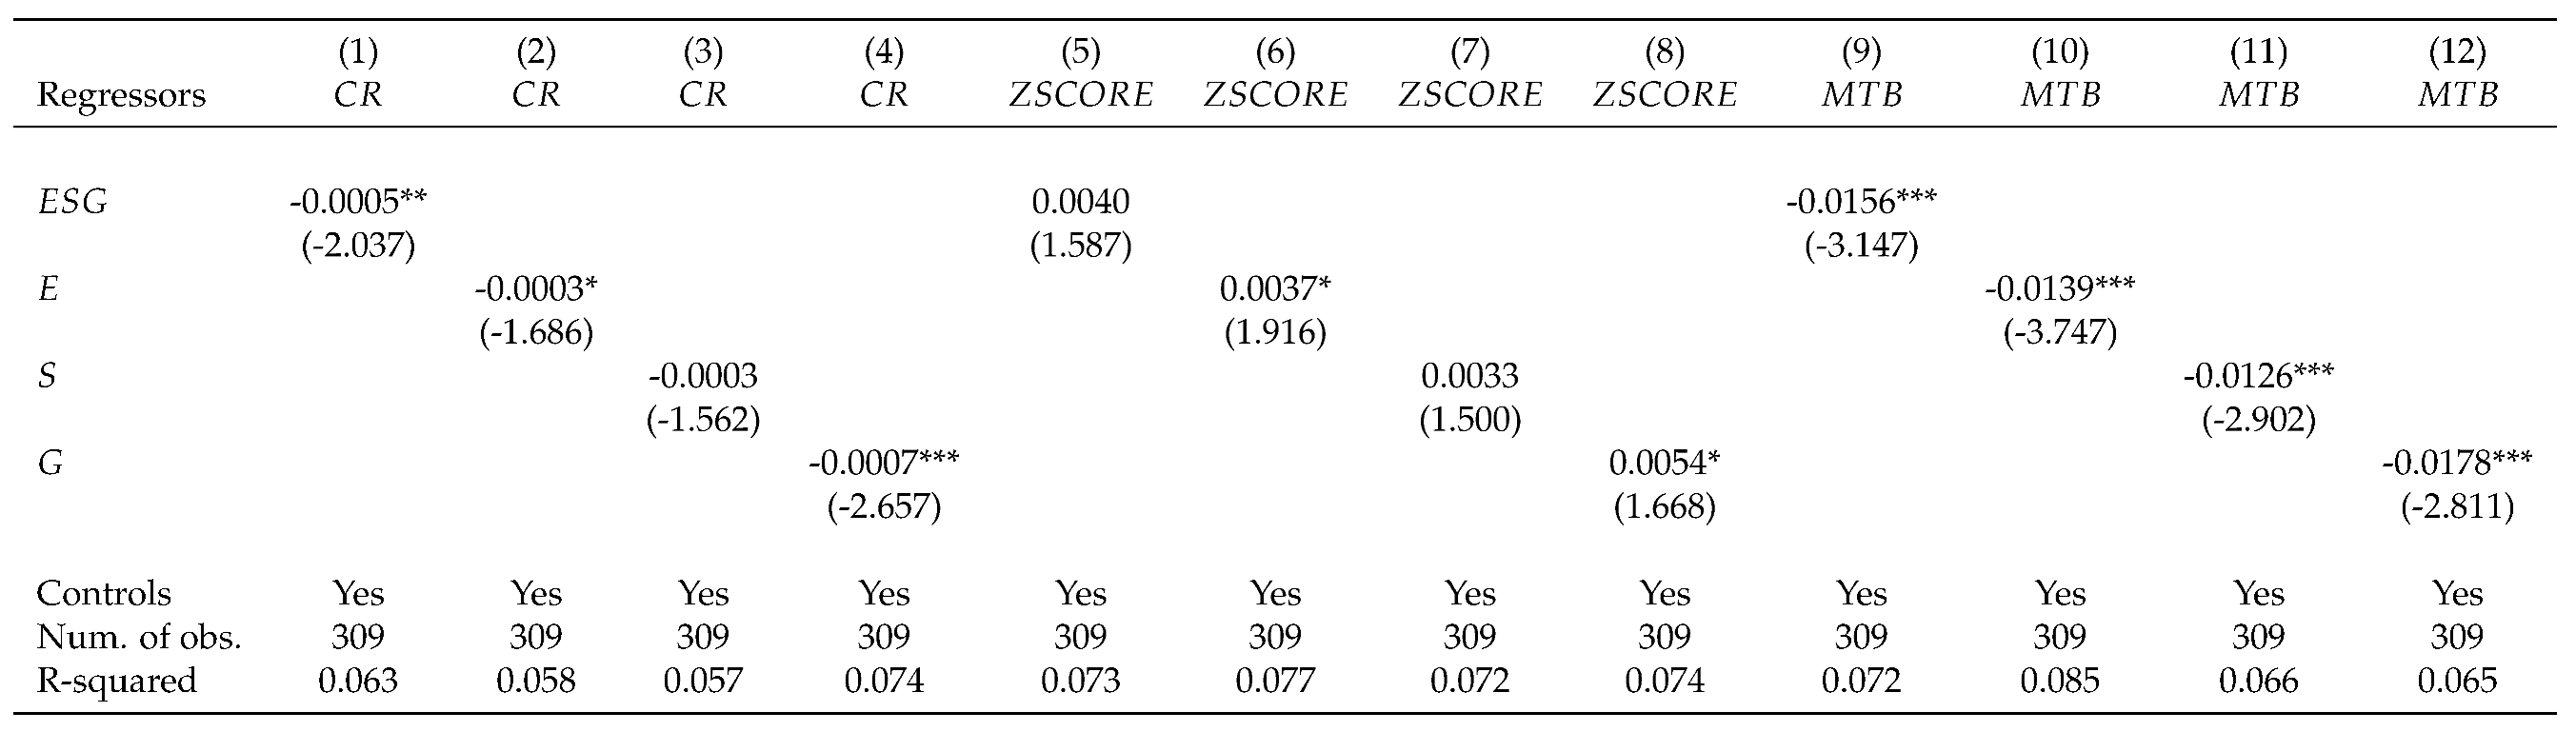 |
Table 5.
Results of OLS models with dependent variable r in t + 1. See Table A1 for the definitions of all variables included in the models. Time dummies and a constant term are included but not reported. T-statistics are reported in parentheses and standard errors are robust. *** p<0.01, ** p<0.05, * p<0.1.
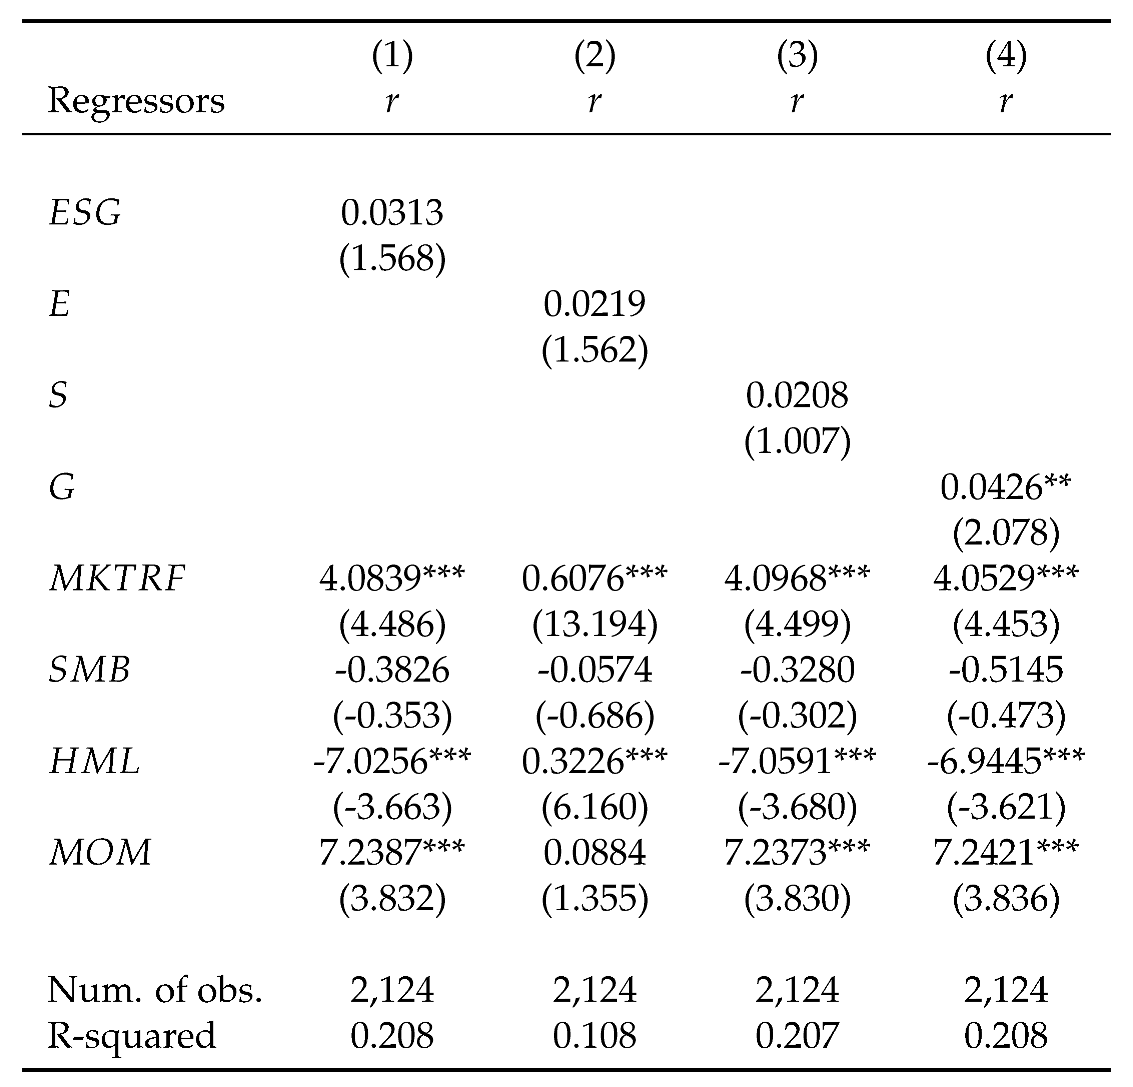 |
Table 6.
Results of OLS models for the returns of quintile portfolios. See Table A1 for the definitions of all variables included in the models. T-statistics are reported in parentheses and standard errors are robust. The coefficients on are in percentages. *** p<0.01, ** p<0.05, * p<0.1.
Table 6.
Results of OLS models for the returns of quintile portfolios. See Table A1 for the definitions of all variables included in the models. T-statistics are reported in parentheses and standard errors are robust. The coefficients on are in percentages. *** p<0.01, ** p<0.05, * p<0.1.
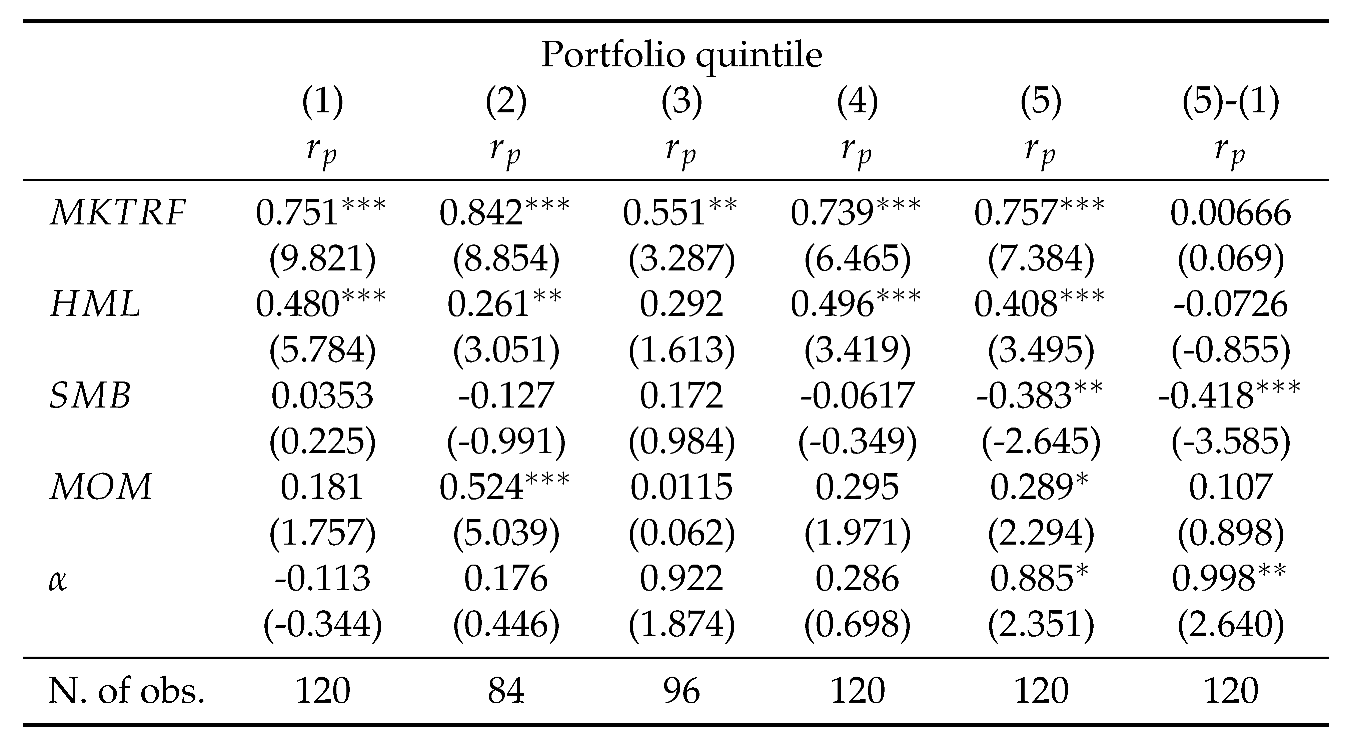 |
Table 7.
Results of OLS models for the returns of E quintile portfolios. See Table A1 for the definitions of all variables included in the models. T-statistics are reported in parentheses and standard errors are robust. The coefficients on are in percentages. *** p<0.01, ** p<0.05, * p<0.1.
Table 7.
Results of OLS models for the returns of E quintile portfolios. See Table A1 for the definitions of all variables included in the models. T-statistics are reported in parentheses and standard errors are robust. The coefficients on are in percentages. *** p<0.01, ** p<0.05, * p<0.1.
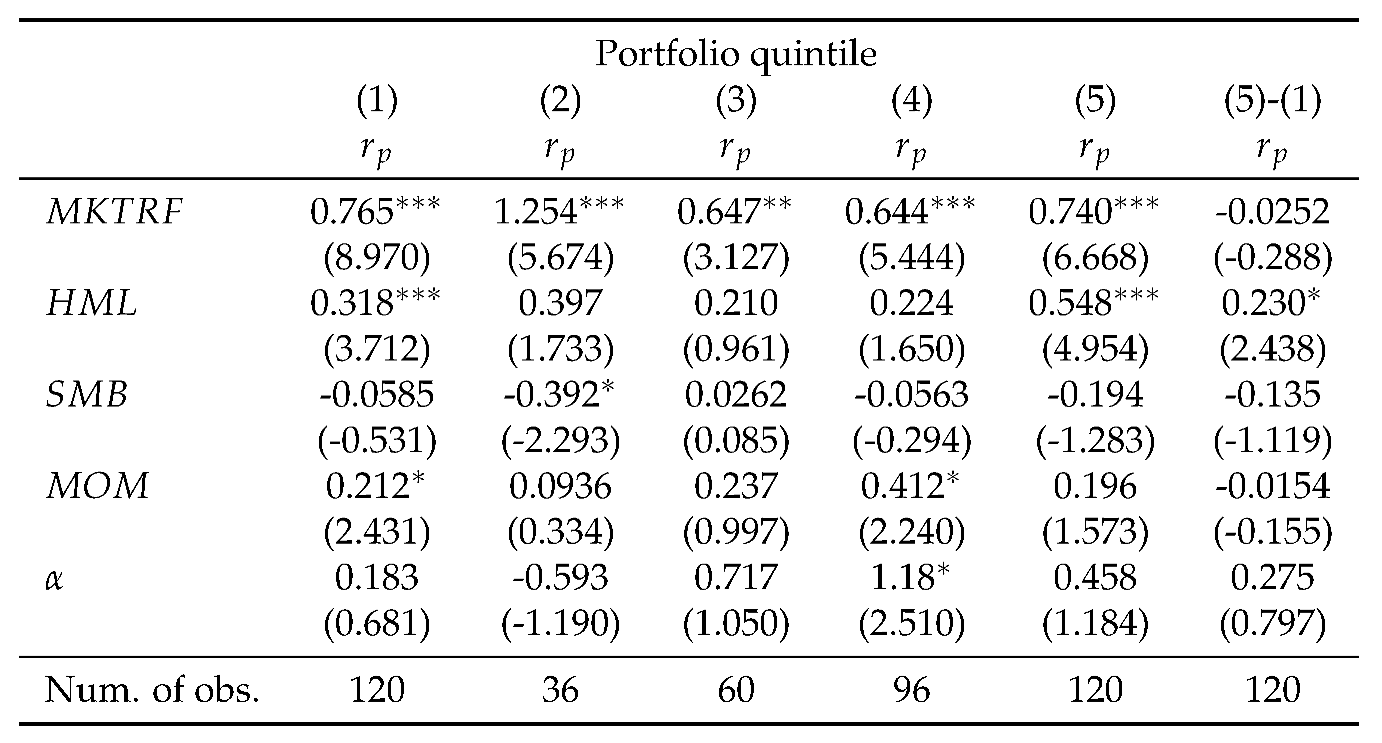 |
Table 8.
Results of OLS models for the returns of S quintile portfolios. See Table A1 for the definitions of all variables included in the models. T-statistics are reported in parentheses and standard errors are robust. The coefficients on are in percentages. *** p<0.01, ** p<0.05, * p<0.1.
Table 8.
Results of OLS models for the returns of S quintile portfolios. See Table A1 for the definitions of all variables included in the models. T-statistics are reported in parentheses and standard errors are robust. The coefficients on are in percentages. *** p<0.01, ** p<0.05, * p<0.1.
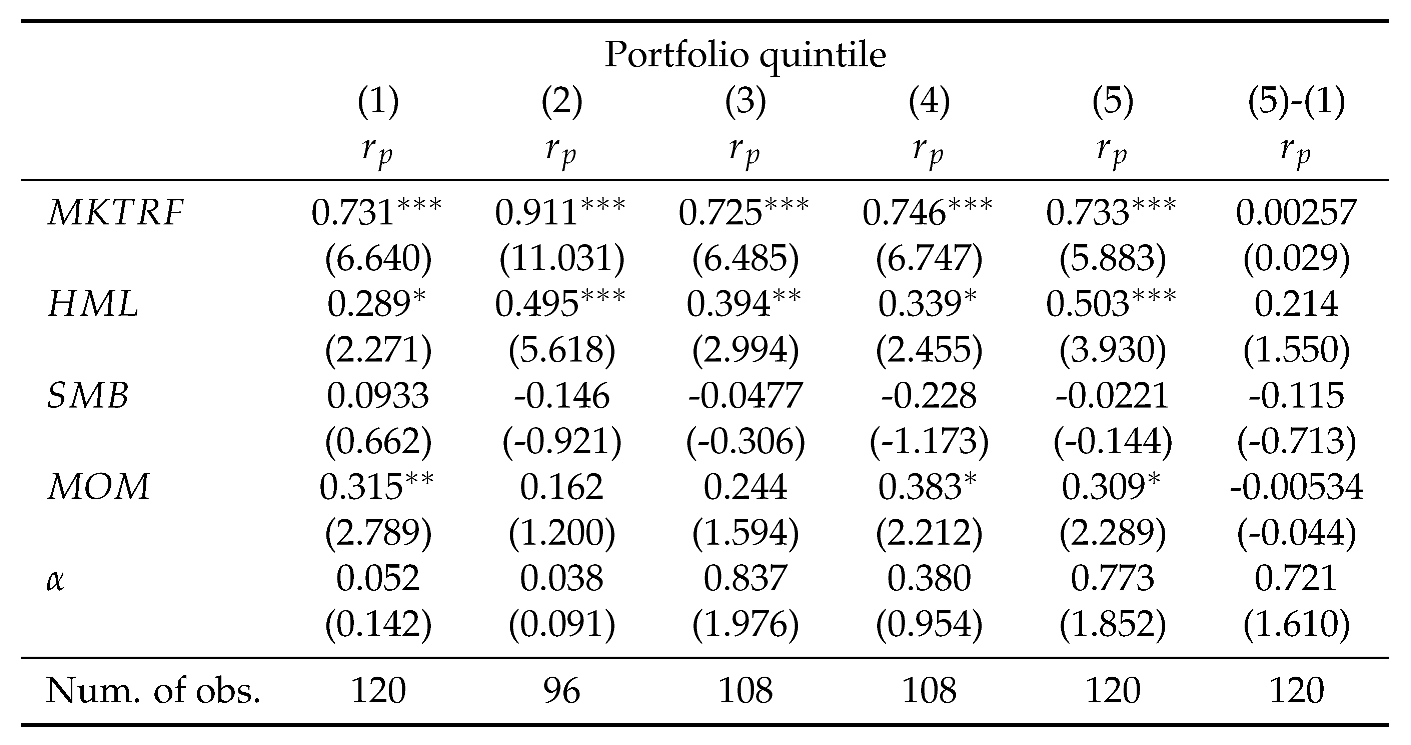 |
Table 9.
Results of OLS models for the returns of G quintile portfolios. See Table A1 for the definitions of all variables included in the models. T-statistics are reported in parentheses and standard errors are robust. The coefficients on are in percentages. *** p<0.01, ** p<0.05, * p<0.1.
Table 9.
Results of OLS models for the returns of G quintile portfolios. See Table A1 for the definitions of all variables included in the models. T-statistics are reported in parentheses and standard errors are robust. The coefficients on are in percentages. *** p<0.01, ** p<0.05, * p<0.1.
 |
Disclaimer/Publisher’s Note: The statements, opinions and data contained in all publications are solely those of the individual author(s) and contributor(s) and not of MDPI and/or the editor(s). MDPI and/or the editor(s) disclaim responsibility for any injury to people or property resulting from any ideas, methods, instructions or products referred to in the content. |
© 2023 by the authors. Licensee MDPI, Basel, Switzerland. This article is an open access article distributed under the terms and conditions of the Creative Commons Attribution (CC BY) license (http://creativecommons.org/licenses/by/4.0/).
Copyright: This open access article is published under a Creative Commons CC BY 4.0 license, which permit the free download, distribution, and reuse, provided that the author and preprint are cited in any reuse.


