Preprint
Article

Multimessenger Studies of One Subclass of Active Galactic Nucleus: Blazar

Altmetrics

Downloads

76

Views

27

Comments

0

This version is not peer-reviewed

Submitted:

18 July 2023

Posted:

19 July 2023

You are already at the latest version

Alerts
Abstract
In this article, we introduce some multi-messenger studies of blazars. Main contents contain the following parts, 1. the subclasses of blazars and the observational characteristics, 2. emission variabilities from the multi-messenger observations, 3. the physical origin for the multi-messenger studies. Based on mid-IR observations collected from the $WISE$ database, we collect two sources (BZQ J1700+6830 and BZQ J1842+6809) to analyze the mid-IR variabilities. \\ (1) For BZQ J1700+6830, the period is $P\approx$ 42 hr at the four bands ($W1$, $W2$, $W3$, $W4$); for BZQ J1842+6809, the period is $P\approx$ 123 hr at the two bands ($W1$, $W2$). \\ (2) Using the periodicities, we calculate that the central black hole mass ($BH$) should be $M = (5.44\sim33.0)\times10^8M_{\odot}$ for BZQ J1700+6830 and $M = (1.13\sim6.88)\times10^9M_{\odot}$ for BZQ J1842+6809.\\ (3) For the two sources, during the flaring stage, we find anti-clockwise variation trends based on the time-based relations built by the spectral indices ($\alpha$) and flux densities ($F$).\\ (4) We calculate the Doppler factor ($\delta$) when the sources are in the dimming or brightening stages, and find that with the frequency increasing, the Doppler factor become stronger.
Keywords: 
Subject: Physical Sciences  -   Astronomy and Astrophysics

1. Introduction

As a subclass of active galactic nuclei (AGN), blazars show very extreme properties, such as super-luminal motion, violently optical variability, core-dominance, strong polarization (>3%) from radio to optical, and so on. These properties are characterized by the jet with a viewing angle along ours sight (Blandford & Rees 1978, Angel & Stockman 1980), and can be explained as the relativistically non-thermal emission with a structure of central black hole + accretion disk + jets (Urry & Padovani 1995). Generally, the host galaxies of blazars are thought to be elliptical galaxies and produce a relativistic jet which can be closely aligned with our line of sight (Falomo et al.2014).
Blazars can be divided into two subclasses, BL Lacs and FSRQs, among which, the first one are characterized by featureless optical spectra or weak emission line (Stickel et al. 1991), and the second one have flat-spectrum radio spectrum and typical broad emission lines (Urry & Padovani 1995). According to the optical emission/absorption line features, blazars can be divided into two subclasses: flat spectrum radio quasars (FSRQs) and BL Lac objects (BL Lacs). FSRQs have E W > 5 Å , while BL Lac objects show E W < 5 Å (Urry & Padovani 1995, Ghisellini et al. 2011, Sbarrato et al. 2012, Ghisellini & Tavecchio 2015, Chen et al. 2023).
Blazars show highly and variablely optical, radio or near infrared (NIR) polarization, for example, the optical/NIR polarization of AO 0235+164 exceeding to 45 % (e.g. Ikejiri et al. 2011; Itoh et al. 2016, Roy et al. 2023, and references therein). FSRQs show strong optical emission lines and can be a useful probe of the variability in BLR output, which mightly come from the disk emission (Ezhikode et al. 2022).
For blazars, the flux variabilities can cover a wide range of timescales from minutes to years, and are typical properties of blazars, which play a very important role in distinguishing blazars from other AGNs. Dependence on the timescales, blazar variabilities can be divided into three types, the first one is micro-variability (Miller et al.1989), intra-day variability (IDV)(Wagner & Witzel 1995), intra-night variability (INV)(Sagar et al.2004), with the timescales within one day; the second one is short-term variability (STV), with the timescales from days to weeks; the last one is long-term variability (LTV) (e.g. Gupta et al. 2004, Fan et al. 2005, Yuan & Fan 2021, Raiteri et al. 2021, Yuan et al. 2022), with the timescales from months to years.
For example, Based on the lightcurves of AO 0235+164 during 1982 2019 , Roy et al.(2022) obtained a 5 cycles of double-peaked periodicity of 8.13 yr. Raiteri et al.(2021) used the optical R-band of S4 0954+65 from WEBT (Whole Earth Blazar Telescope) and TESS (Transiting Exoplanet Survey Satellite) to found a quasi-periodicity of 31.2 days, which might can be caused by the rotation of an inhomogeneous helical jet. The multi-message properties of some TeV-detected blazars are still poorly understood. Blazars display high and variable polarization covering from radio to optical bands and emit predominately non-thermal emission over the whole electromagnetic wavelength.
The mass of the black holes can be constrained by the observed minimum timescales of rapid variations in the optical regimes (Liu & Bai 2015). The study of the periodic variability on the the intra-day timescales can be explained by the presence of a single dominating hot spot on the accretion disk (e.g., Chakrabarti & Wiita 1993).
The spectral energy distributions (SEDs) of blazars consist of two broad humps (Fossati et al.1988), among which, the low-energy hump is ascribed to the synchrotron radiation from the relativistic leptons, and the high-energy hump arises from inverse Compton (IC) processes and possible from hadronic process (Romero et al.2017, Roy et al.2023, and references therein).
Based on the location of the lower energy component of the SEDs (spectral energy distributions), blazars can be classed as LSPs (low synchrotron peaked blazars), with the peak frequency ν p e a k 10 14 Hz; ISPs (intermediate synchrotron peaked blazars), with the peak frequency 10 14 Hz < ν p e a k < 10 15 Hz; HSPs (high synchrotron frequency peaked blazars), with the peak frequency ν p e a k 10 15 Hz (Abdo et al. 2010). Based on the locations of first hump, BL Lac objects can be divided into three subclasses, high BL Lac type (HBLs), intermediate BL Lac type (IBLs) and low BL Lac type (LBLs). In the optical region, HBLs display the weaker variable and the less variability amplitude than LBLs (e.g. Padovani & Giommi 1995, and the references therein).
The study about color variations are helpful to understand the emission mechanisms (e.g. Vagnetti, Trevese & Nesci 2003; Gu et al. 2006; Negi et al.2022; Zhang, Zhao & Wu 2022, and references therein).
There are many works (e.g., Villata et al. 2002; Gu et al. 2006; Papadakis et al. 2007; Dai et al. 2009; Poon et al. 2009; Fan et al. 2014, and the reference in) studying the relations between spectral indices ( α ) and brightnesses (F). Generally, BL Lacs show that when the sources become brighter, the spectrum become bluer (harder) behaviors (BWB behaviors). Some FSRQs show that when the sources become brighter, the spectrum become redder (softer) behaviors (RWB behaviors); but the other FSRQs show BWB behaviors, or no obvious correlation trendency.
For blazars, the studies about the emission variabilities almost cover all the electromagnetic bands, but the studies refereed to the mid-infrared (mid-IR) variabilities are relatively less. The mid-IR emission mainly come from the so-called dust torus (Nenkova et al.2008). However, because of less surveys about the mid-IR wavelength, the studies about the mid-IR variabilities are not very rich. Based on the observations from the Wide-Field Survey (SDWFS), Kozlowski (2016) found that the mid-IR variabilities can be well fitted by a simple SF (structure function).
WISE was launched on November 14, 2009, which can scan the entire the sky at four fixed mid-infrared wavelengths (centering at 3.4 μ m: W 1 , 4.6 μ m: W 2 , 12 μ m: W 3 and 22 μ m: W 4 ). This survey provided us more chance to study the mid-IR variabilities.
Based on WISE, blazars can occupy in special region located in the mid-IR color-color distribution, which is called as the WISE Blazar Strip (Massaro et al.2011, 2012; D’Abrusco et al.2012, 2019; Menezes et al.2019). The discovery about the WISE Blazar Strip can help to search for the blazar candidates (D’Abusco et al.2019).
Based on the survey scanning strategy, WISE supplied us light-curves of blazars on different monitored durations. Based on the survey design, WISE naturally has two timescales: the first one is about 3hr, which is two times of the orbital period of the spacecraft; the second one is about 0.5yr, which becomes obviously smaller near the ecliptic poles (Assef et al. 2018). So, when we study the mid-IR variabilities, we should omit the above two timescales.
BZQ J1700+6830 belongs to a target of the CGRaBS (Candidate Gamma-Ray Blazar Survey), and the redshift z=0.301 was reported by Henstock et al.(1997).
In this work, based on the WISE observations, we analyze the mid-IR variabilities of BZQ J1700+6830 and BZQ J1842+6809. This work is arranged as the following: section 2, sample; section 3, periodic analysis; section 4, spectral properties; section 5, discussion and conclusion.

2. Sample

The 5th version of ROMA-BZCat catalog (Massaro et al.2015) supply us a rich sample of blazars, which contain more than 3000 blazars. Based on these sources, we check the mid-IR light curves from WISE (http://irsa.ipac.caltech.edu/). Based on the scanning strategy of WISE, for every sources, there are more than one light-curves, so, for the whole blazars, we obtain more than 15000 light-curves.
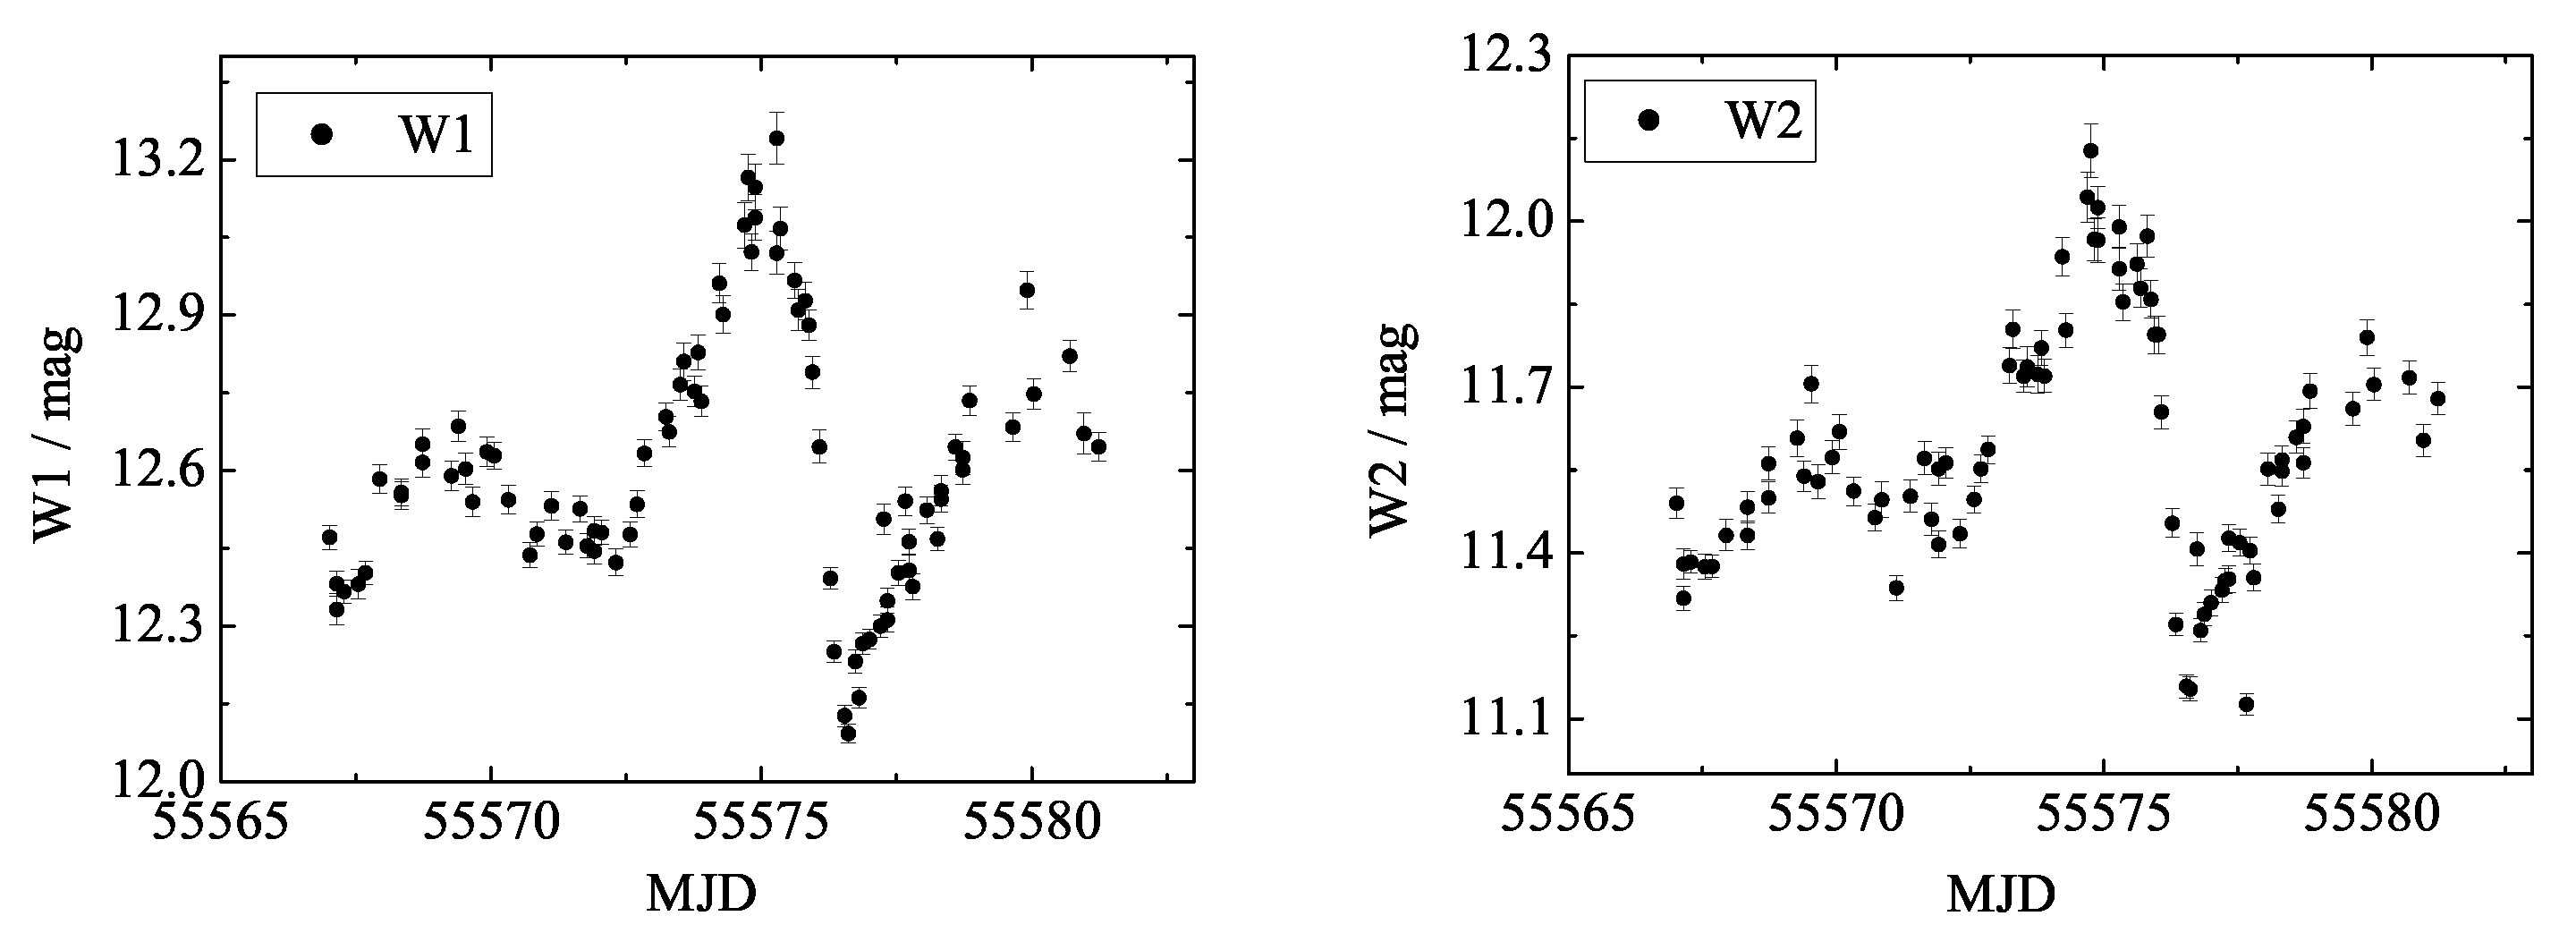
We check all the light-curves, and find that there lie two sources: BZQ J1700+6830 and BZQ J1842+6809, which have plentiful of observations and possible periodic phenomenon. Figure 1 displays the light-curves of BZQ J1700+6830, and Figure 2 shows the light-curves of BZQ J1842+6809.

3. Periodic analysis

3.1. Methods

It is difficult for blazars to determine the periodicity because the distributions of observation are usually uneven. In order to solve this problem, we avail more than one method to make analysis. When the results calculated from the different methods have common parts within the error range, we choose them as the last period.
We use the P S (the power spectrum) method and the J U R (Jurkevich) method to analyze the light-curves. The detailed descriptions about the two methods can be seen in Yuan & Fan (2021).

3.2. Results

We use the upper two methods to study the mid-IR variabilities. The results have been displayed in Figure 3, Figure 4 and Figure 5. Figure 3 and Figure 4 give the P S results and the J U R results of BZQ J1700+6830. Figure 5 give the P S and J U R results of BZQ J1842+6809. The results calculated by the different methods can be seen in Table 1, here,
Col.(1): N a m e ;
Col.(2): B a n d ;
Col.(3): M e t h o d ;
Col.(4): R e s u l t , in unit of hr.
We have listed the results in Table 1: Col.4, and choose the common parts as the periodicities, for BZQ J1700+6830, P w 1 = 41.84 ± 2.24 hr, P w 2 = 42.27 ± 2.05 hr, P w 3 = 41.82 ± 3.81 hr, P w 4 = 41.78 ± 1.54 hr; for BZQ J1842+6809, P w 1 = 123.56 ± 19.11 hr and P w 2 = 122.31 ± 15.91 hr, which have been listed in Table 1, Col.5.

4. The spectral properties

4.1. The linear correlations between the spectra and brightness

Firstly, we calculate the spectral index ( α ) by the following procedure.
1. Convert the magnitude ( m ν ) into flux density ( F ν ) ( ν = W 1 : 8.94 × 10 13 Hz, W 2 : 6.51 × 10 13 Hz, W 3 : 2.59 × 10 13 Hz and W 4 : 1.36 × 10 13 Hz).
2. The spectral index ( α ) can be calculated by the relations F ν ν α , here, F w 1 , F w 2 , F w 3 and F w 4 are from the same time.
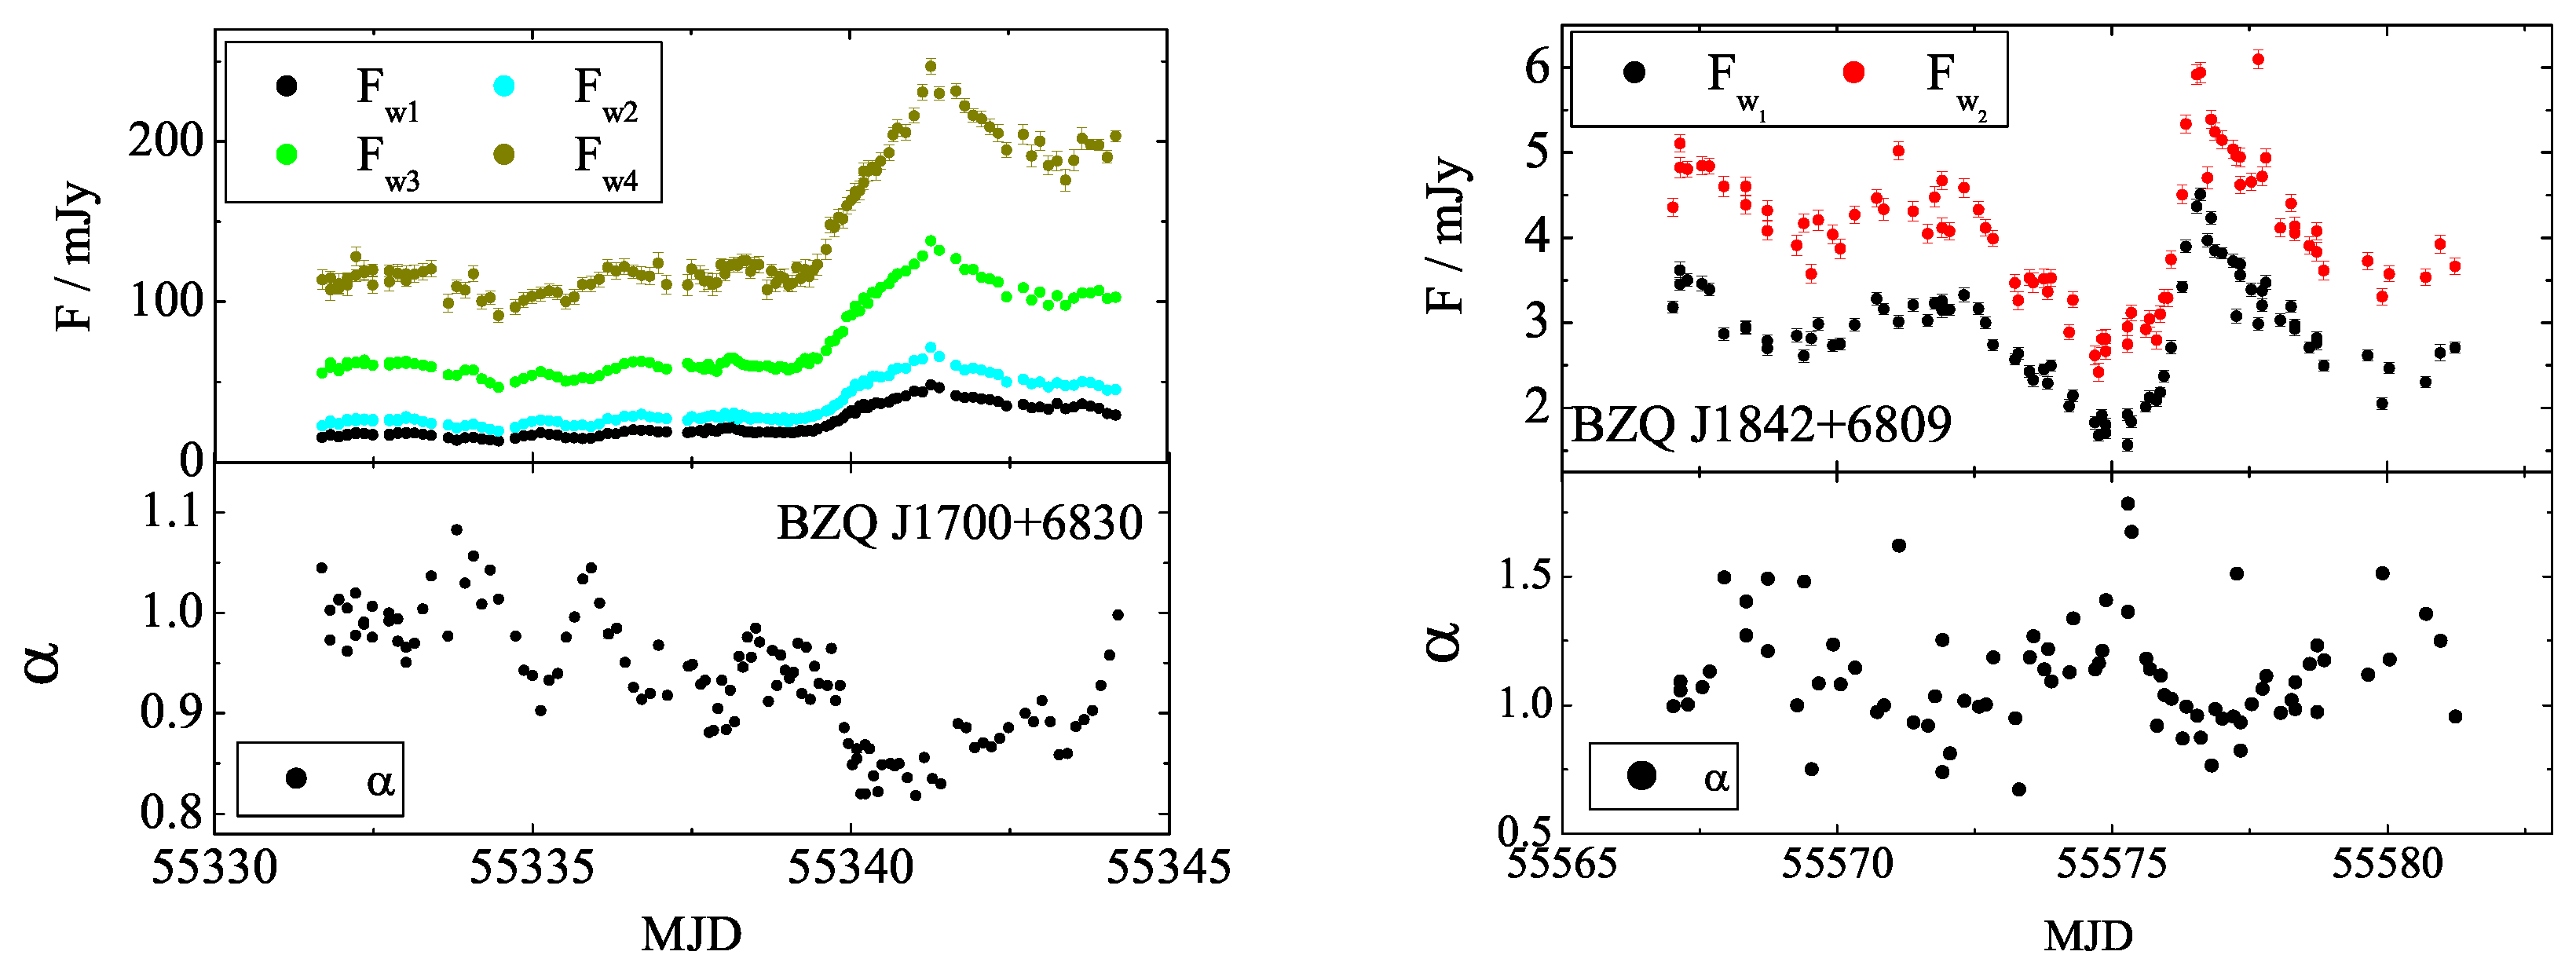
The results have been shown in Figure 6, where, the upper two sub-pictures display the light-curves, and lower two sub-pictures display the spectral variations. For BZQ J1700+6830, α are in the range from 0.82 ± 0.001 to 1.08 ± 0.01 , with the mean value α ¯ = 0.93 ± 0.06 . For BZQ J1842+6809, α locates from 0.54 to 1.78 , and the averaged value is α ¯ = 1.11 ± 0.22 .
The correction between α and F ν can be analyzed by a linear fitting, F ν = ( k ± Δ k ) α + ( b ± Δ b ) , here, k: the slope, b: the intercept, p: the chance probability and r: the correlation coefficient. These values have been described in Table 2, here,
Col.(1), N a m e ,
Col.(2), F ν . v s . α ,
Col.(3), k ± Δ k ,
Col.(4), b ± Δ b ,
Col.(5), r,
Col.(6), p.
Figure 7 display the correlations of α .vs. F ν . In Figure 7, the red lines note the linear fitting. Two studied sources show brighter-when-blurer (RWB) behaviors, with frequency increasing ( W 4 W 1 ), the correlation become stronger.

4.2. Using spectral index to estimate the Doppler factor

Xie et al.(1992) used the IDV timescales to propose that δ (Doppler factor) should be constrained as the following.
δ = [ η ( o b s ) / η ( i n t ) ] 1 / ( 4 + α ) ,
here, α was the spectral index, η ( o b s ) and η ( i n t ) were the observed and intrinsic efficiency in accretion disc. η ( o b s ) can be calculated as the following,
η ( o b s ) = 5.0 × 10 43 Δ L ( o b s ) / Δ t m i n ( o b s )
= 5.0 × 10 43 × 4 π D L 2 ν | Δ F ν / Δ t |
= 2.0 × 10 42 π D 2 ν | k ν | ,
here, ν : the frequency, D L : the luminosity distance, in unit of cm, k ν : the slope of flux density with time ( Δ F ν / Δ t ). The value of intrinsic efficiency ( η ( i n t ) ) can be assumed as η ( i n t ) = 0.05 (Xie et al.1992).
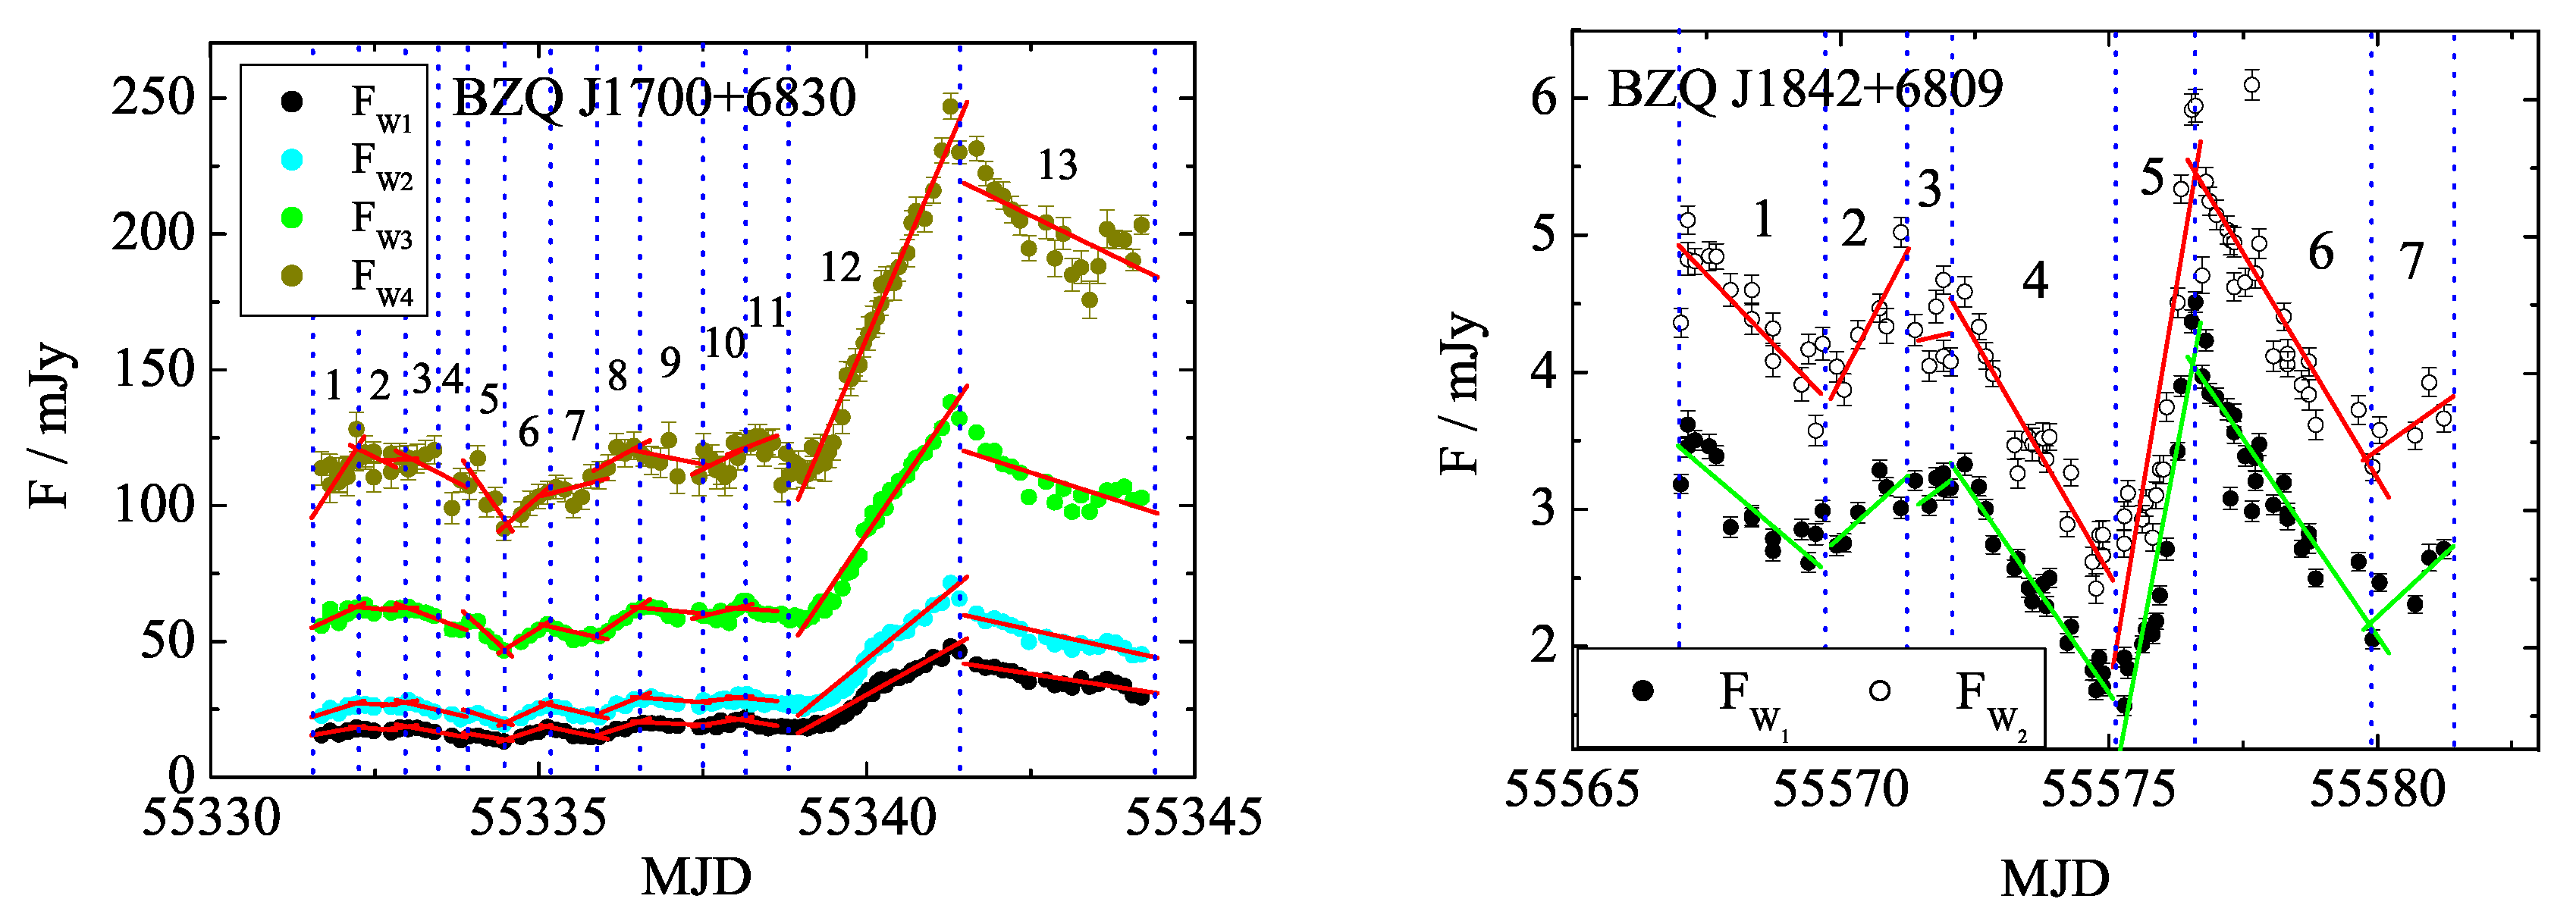
we convert the magnitude ( m ν , ν = W 1 , W 2 , W 3 and W 4 ) into flux density ( F ν , in unit of mJy), which have been shown in Figure 8, where, the left panel stand for BZQ J1700+6830 and the right panel stand for BZQ J1842+6809. In the light-curves of two sources, there are some dimming stages and brightening stages, which are noted by the dot lines in Figure 8 and marked as ’1’, ’2’, ’3’,...
On every stages, we calculated the slope ( k ν ) and the Doppler factor ( δ ν ), which have been described in Table 3, where,
Col.(1): N a m e ;
Col.(2): S t a g e ;
Col.(3): k w 1 : slope at W 1 band;
Col.(4): δ w 1 : Doppler factor at W 1 band;
Col.(5): k w 2 : slope at W 2 band;
Col.(6): δ w 2 : Doppler factor at W 2 band;
Col.(7): k w 3 : slope at W 3 band;
Col.(8): δ w 3 : Doppler factor at W 3 band;
Col.(9): k w 4 : slope at W 4 band;
Col.(10): δ w 4 : Doppler factor at W 4 band;
For BZQ J1700+6830, the mean Doppler factor at four bands are δ w 1 ¯ 7.92 , δ w 2 ¯ 7.43 , δ w 3 ¯ 4.85 , δ w 4 ¯ 4.37 . For BZQ J1842+6809, the mean Doppler factor at two bands are δ w 1 ¯ 1.05 , δ w 2 ¯ 0.87 . Our results show that with the frequency increasing, the Doppler factor become stronger.

5. Discussion and Conclusion

Some works claimed to find the intra-day periodic variabilities. For example, for OJ287, Visvanathan & Elliot (1973) obtained a period of about 40 minutes. Sillanpää (1991) obtained a period of 9.3 days at optical band.
In this work, we analyzed the variable properties of BZQ J1700+6830 and BZQ J1842+6809. For BZQ J1700+6830, at four bands, the quasi-period is P 42 hr. For BZQ J1842+6809, at two bands, the period is P 123 hr.

5.1. Periodic variability from the inner part of the blazar

If the origin of the mid-IR periodicities come from the inner part, they are relatively near to the central black hole. In the sense, we can use the short-term periodic signal to judge the mass of B H .
Based on the expression from Fan et al.(2017), the emission regions can be calculated as the following.
(1) r = 6 G M c 2 (Schwarzschild black hole in thin accretion disk);
(2) r = 4 G M c 2 (Schwarzschild black hole in thick accretion disk);
(3) r = 1.48 × 10 5 × ( 1 + 1 a 2 ) M M (Kerr black hole, r: the radius of the event horizon, a: angular momentum parameter).
P can be considered as the time when the light travel in the innermost stable orbit, ie. 2 π r = c P 1 + z , so the mass from different black hole should be
(1) M = 3.18 × 10 5 × P 1 + z M ;
(2) M = 4.77 × 10 5 × P 1 + z M ;
(3) M = 1.93 × 10 6 × P 1 + z M .
For BZQ J1700+6830, the redshift z=0.472, P 42 hr, so the mass of B H should be about ( 5.44 33.0 ) × 10 8 M . For BZQ J1842+6809, z=1.071, P 123 hr, so the mass of B H should be about 1.13 6.88 ( × 10 9 M ).

5.2. The variable profiles between flux densities and spectral indices

Generally, BL Lacs present the brighter-when-bluer behaviors (BWB). While, FSRQs show more complicated relations (Gaur et al.2012, Isler et al.2017).
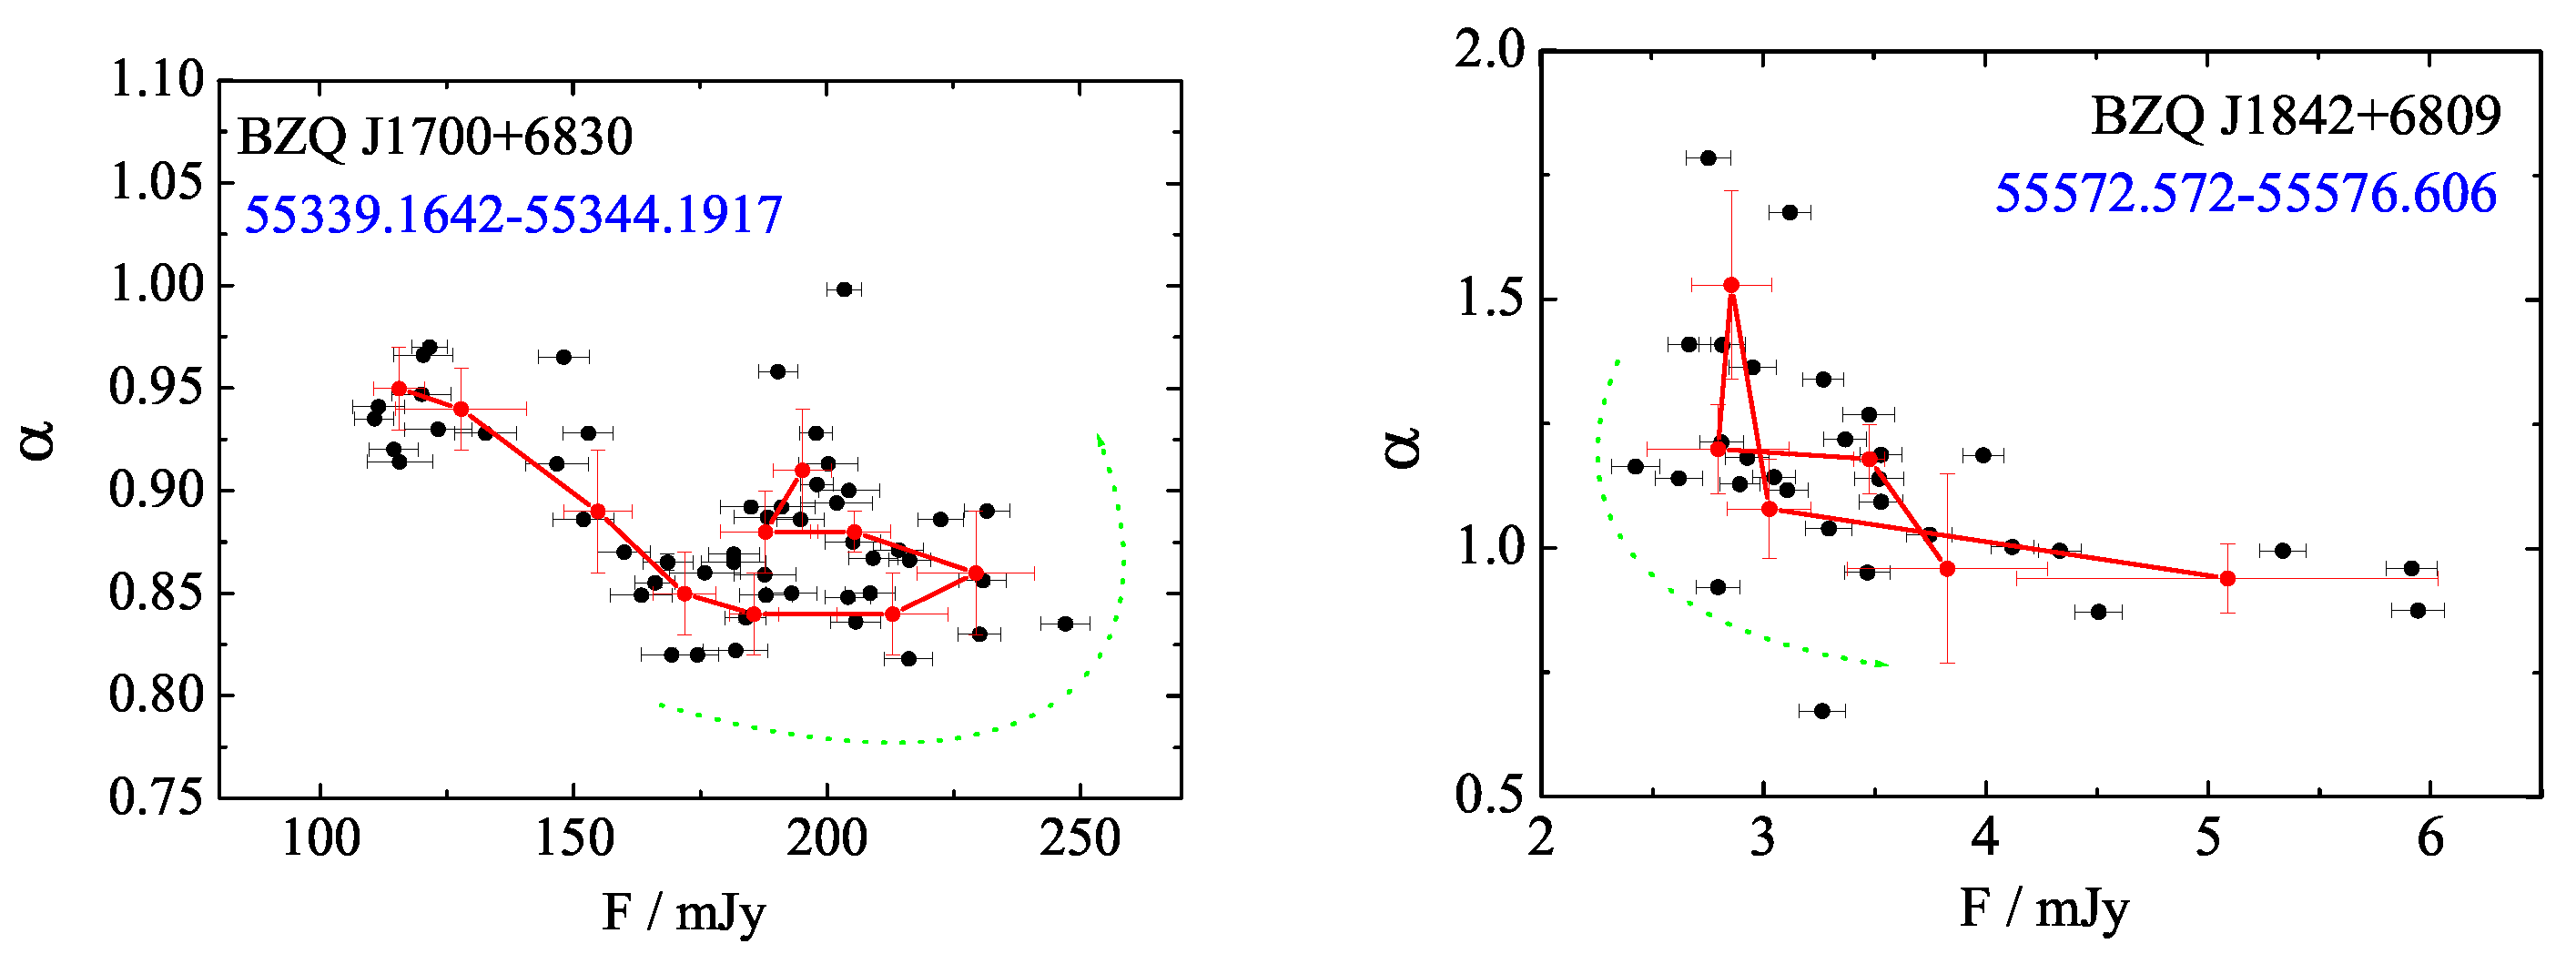
For BZQ J1700+6830, from MJD 55339.1642 to MJD 55344.1917, there is an obvious flaring emission. For BZQ J1842+6809, from MJD 55572.572 to MJD 55576.606, there is a flaring emission. We plot the F and α distributions in Figure 9, seeing the black dots. We average the observations every five dots, and place the results with red dots in Figure 9, and the locations of the time-based dots note anticlockwise variation trends.
BZQ J1700+6830 and BZQ J1842+6809 are all FSRQs. In this work, we find BWB behaviors in the two sources, which might come from electron acceleration process of the jet (Isler et al. 2017). During the flaring processes, we find that there lie anticlockwise variation trends, which also imply that those emission come from the electron acceleration process (Zheng et al.2013).

5.3. Periodic variability from the magnetized jet

An analytical solution about magnetically dominated astrophysical jets was been put forward by Chen & Zhang (2021),
P = 3.44 ( 1 + Γ 2 ) ( 1 + 1 a 2 a ) ( 1 / 2 f Ω ) ( M 10 8 M ) h r
, here, P: the cycle period of the magnetic field, Γ : the Lorentz factor; a: the BH spin parameter and in the range of 0.01 1 and a = 0.5 is used in this work; f Ω is parameter and f Ω = 1 is used in this work.
For BZQ J1700+6830, P 42 hr, so, the mass of B H should be M = 1.22 1 + Γ 2 × 10 9 M . We have obtained the mass M = ( 5.44 33.0 ) × 10 8 M , so we estimate the Lorentz factor Γ 1.11 .
For BZQ J1842+6809, p ≈ 108 hr, so the mass of B H should be M = 3.14 1 + Γ 2 × 10 8 M , We have obtained the mass M = 1.13 6.88 ( × 10 9 M ) , so we estimate the Lorentz factor Γ 1.33 .

5.4. Conclusions

In this paper, we collect the available mid-IR observations from W I S E survey to analyze the short-term variation of two FSRQs: BZQ J1700+6830 and BZQ J1842+6809.
(1)
Our studies imply that, for BZQ J1700+6830, the period is P 42 hr, which imply that the mass (central black hole) is M = ( 5.44 33.0 ) × 10 8 M ; for BZQ J1842+6809, the period is P 123 hr, so the mass should be M = ( 1.13 6.88 ) × 10 8 M .
(2)
The BWB behaviors and anticlockwise variation trends between flux densities and spectral indices imply that these emissions mainly come from the electron acceleration process.
(3)
During the variable stages (dimming stages and brightening stages), we calculate the Doppler factor, and find that with the frequency increasing, the Doppler factor become stronger.

Acknowledgments

Thanks for the good suggestion from the anonymous reviewer. The work is partially supported by the National Natural Science Foundation of China (NSFC U1831119, NSFC U2031201, NSFC 11733001).

References

  1. Abdo, A. A.; Ackermann, M.; Agudo, I.; et al., 2010, ApJ, 716, 30A.
  2. Angel J.R.P. & Stockman H.S., 1980, ARA&A, 18, 321.
  3. Assef, R.J., Stern, D., Noirot, G., et al., 2018, ApJS, 234: 23.
  4. Blandford R.D. & Rees M.J., 1978, BL Lac Objects(Pittsburgh, PA: Univ. Pittsburgh),328.
  5. Chakrabarti S.K., & Wiita P.J., 1993, ApJ, 411, 602.
  6. Chen L. & Zhang B., 2021, ApJ, 906: 105.
  7. Chen Y.Y., Gu Q.S., Fan J.H., et al., 2023, ApJ, 944: 157.
  8. D’Abrusco R., Massaro F., Ajello M., 2012, ApJ, 748, 68D.
  9. D’Abrusco R., Álvarez C.N., Massaro, F., 2019, ApJS, 242, 4D.
  10. Dai, B.Z., Li, X.H., Liu, Z.M., et al., 2009, MNRAS, 1181–1192.
  11. Ezhikode S.H., Shukla A., Dewangan G.C., et al., 2022, ApJ, 939: 76.
  12. Falomo, R., Pian, E., & Treves, A. 2014, A&ARv, 22, 37.
  13. Fan J.H., 2005, A&A, 436, 799.
  14. Fan J. H., Kurtanidze O., Liu Y., et al., 2014, ApJS, 213, 26.
  15. Fan J.H., Kurtanidze O., Liu Y., et al., 2017, ApJ, 837: 45.
  16. Fossati G., Maraschi L., Celotti A., Comastri A., & Ghisellini G. 1998, MNRAS, 299, 433.
  17. Gaur H., Gupta A.C., Strigachev A., et al., 2012, MNRAS, 425: 3002-3023.
  18. Ghisellini G. & Tavecchio F., 2015, MNRAS, 448, 1060.
  19. Ghisellini G., Tavecchio F., Foschini L. & Ghirlanda G., 2011, MNRAS, 414, 2674.
  20. Gu, M.F., Lee, C.U., Pak, S., Yim, H.S., Fletcher, A.B., 2006, A&A, 450, 39-51.
  21. Gupta, A. C., Banerjee, D. P. K., Ashok, N. M., & Joshi, U. C. 2004, A&A, 422, 505.
  22. Henstock, D.R., Browne, I.W.A., Wilkinson, P.N., McMahon, R.G., 1997, MNRAS, 290, 380-400.
  23. Ikejiri, Y., Uemura, M., Sasada, M., et al., 2011, PASJ, 63, 639.
  24. Isler J.C., Urry C.M., Coppi P., et al., 2017, ApJ, 844: 107.
  25. Itoh, R., Nalewajko, K., Fukazawa, Y., et al., 2016, ApJ, 833, 77.
  26. Kozłowski S., Kochanek C.S., Ashby M.L.N., 2016, ApJ, 817: 119.
  27. Liu H.T. & Bai J.M., 2015, AJ, 149, 191.
  28. Massaro, F.; D’Abrusco, R.; Ajello, M., 2011, ApJ, 740L, 48M.
  29. Massaro, F.; D’Abrusco, R.; Tosti, G.,2012, ApJ, 750, 138M.
  30. Menezes, R. B.; Ricci, T. V.; Steiner, J. E.,et al., 2019, MNRAS, 483, 3700M.
  31. Miller, H. R., Carini, M. T., & Goodrich, B. D. 1989, Nature, 337, 627.
  32. Negi V., Joshi R., Chand K., et al., 2022, MNRAS, 510, 1791.
  33. Nenkova, M., Sirocky, M. M., Nikutta, R., Ivezi & Elitzur, M. 2008, ApJ, 685: 160-180.
  34. Padovani P. & Giommi P., 1995, ApJ, 444, 567.
  35. Papadakis, I.E., Villata, M., Raiteri, C.M., 2007, A&A, 470, 857.
  36. Poon, H., Fan J.H., Fu J.N., 2009, ApJS, 185, 511.
  37. Raiteri, C. M., Villata, M., Larionov, V. M., et al. 2021, MNRAS, 504, 5629.
  38. Romero, G. E., Boettcher, M., Markoff, S., & Tavecchio, F. 2017, SSRv, 207, 5.
  39. Roy, A., Chitnis, V. R., Gupta, A. C., et al. 2022, MNRAS, 513, 5238.
  40. Roy, A., Gupta, A.C., Chitnis V.R., 2023, ApJS, 265, 14R.
  41. Sagar, R., Stalin, C. S., Gopal-Krishna, & Wiita, P. J. 2004, MNRAS, 348, 176.
  42. Sbarrato T., Ghisellini G., Maraschi L. & Colpi M., 2012, MNRAS, 421, 1764.
  43. Sillanpää A., 1991, Ap&SS, 176: 297-307.
  44. Stickel M., Fried J. W., Kuehr H., Padovani P., Urry C. M., 1991, ApJ, 374, 431.
  45. Urry C.M. & Padovani P., 1995, PASP, 107, 803.
  46. Vagnetti F., Trevese D. & Nesci R., 2003, ApJ, 590, 123.
  47. Villata, M., Raiteri, C.M., Kurtanidze, O.M., et al., 2002, A&A, 390, 407.
  48. Visvanathan N. & Elliot J.L., 1973, ApJ, 179: 721.
  49. Wagner, S. J., & Witzel, A. 1995, ARA&A, 33, 163.
  50. Xie, G. Z.; Li, K. H.; Liu, F. K., et al., 1992, ApJS, 80, 683X.
  51. Yuan Y.H. & Fan J.H., 2021, PASP, 133: 074101.
  52. Yuan Yu-Hai, Wang Ge-Ge, Xiao Hu-Bing, et al., ApJS, 2022, 262: 43.
  53. Zheng Y.G., Zhang L., Huang B.R., Kang S.J., 2013, MNRAS, 431: 2356-2361.
Figure 1. The mid-IR lightcurves of BZQ J1700+6830 at W 1 , W 2 , W 3 and W 4 band.
Preprints 79806 g001
Figure 2. The mid-IR lightcurves of BZQ J1842+6809 at W 1 and W 2 band.
Preprints 79806 g002
Figure 3. The periodic analyses of BZQ J1700+6830 calculated by the P S method. The black lines stand for the signal, the red, the green, the blue and the cyan lines stand for the 85%, 90%, 95% and 99% red noise level respectively. The red dot lines stand for the possible periods.
Preprints 79806 g003
Figure 4. The periodic analyses of BZQ J1700+6830 based on the JUR method. The red dot lines stand for the possible periods.
Preprints 79806 g004
Figure 5. The periodic analyses of BZQ J1842+6809. The left two sub-pictures stand for the PS results, and the right two sub-pictures stand for the JUR results.
Preprints 79806 g005
Figure 6. The light curves and spectral variations of BZQ J1700+6830 BZQ J1842+6809. The upper sub-pictures display light-curves, and the lower sub-pictures display spectral variations.
Preprints 79806 g006
Figure 7. The correlations lying in F and α of BZQ J1700+6830 BZQ J1842+6809.
Preprints 79806 g007
Figure 8. The light-curves and variable profiles of BZQJ1700+6830 and BZQJ1842+6809. The different stages of variabilities are separated by the dot lines and noted as ’1’, ’2’,....
Preprints 79806 g008
Figure 9. The variable trends of BZQ J1700+6830 and BZQ J1842+6809.
Preprints 79806 g009
Table 1. The Short-term Mid-IR Periods of BZQ J1700+6830 and BZQ J1842+6809.
N a m e B a n d M e t h o d R e s u l t P e r i o d
(hr) (hr)
(1) (2) (3) (4) (5)
BZQ J1700+6830 W1 PW 215.61±91.62, 39.26±7.11 41.84±2.24
JUR 78.87±5.91, 41.84±2.24
W2 PW 186.99±35.47, 38.91±5.35 42.27±2.05
JUR 76.94±6.61, 42.27±2.05
W3 PW 208.33±69.83, 42.55±4.86 41.82±3.81
JUR 76.65±7.08, 41.82±3.81
W4 PW 188.68±22.01, 43.48±3.48 41.78±1.54
JUR 75.94±6.61, 41.78±1.54
BZQ J1842+6809 W1 PW 149.70±49.71, 13.51 ± 0.53 , 10.99 ± 0.57 123.56 ± 19.11
JUR 123.56 ± 19.11
W2 PW 148.59 ± 55.82 , 13.16 ± 0.66 , 10.99 ± 0.35 122.31 ± 15.91
JUR 122.31 ± 15.91
Table 2. The correlations between the flux density and spectral index of BZQ J1700+6830 and BZQ J1842+6809.
N a m e F ν α k ± Δ k b ± Δ b r p
(1) (2) (3) (4) (5) (6)
BZQ J1700+6830 F w 1 α ( 5.44 ± 0.34 ) × 10 4 1.07 ± 0.008 -0.82 3.38 × 10 31
F w 2 α ( 3.76 ± 0.25 ) × 10 4 1.07 ± 0.009 -0.81 7.45 × 10 29
F w 3 α ( 1.89 ± 0.15 ) × 10 4 1.08 ± 0.012 -0.75 2.89 × 10 23
F w 4 α ( 1.06 ± 0.09 ) × 10 4 1.08 ± 0.015 -0.70 3.87 × 10 19
BZQ J1842+6809 F w 1 α 0.20 ± 0.03 1.68 ± 0.09 -0.57 1.92 × 10 8
F w 2 α 0.09 ± 0.03 1.47 ± 0.12 -0.31 4.53 × 10 3
Table 3. The slope and Doppler factor of two sources from every stages.
N a m e S t a g e k w 1 δ w 1 k w 2 δ w 2 k w 3 δ w 3 k w 4 δ w 4
( 1 ) ( 2 ) ( 3 ) ( 4 ) ( 5 ) ( 6 ) ( 7 ) ( 8 ) ( 9 ) ( 10 )
BZQ J1700+6830 1 4.11 6.60 7.44 8.71 11.14 5.19 37.14 9.09
2 -1.94 3.13 -0.70 0.82 -2.10 0.98 -11.72 2.87
3 3.08 4.95 3.40 3.98 0.78 0.36 0.98 0.24
4 -4.47 7.18 -5.67 6.64 -9.05 4.21 -12.44 3.04
5 -4.00 6.43 -7.42 8.69 -22.13 10.31 -34.78 8.51
6 7.82 12.57 10.92 12.79 14.95 6.97 20.99 5.13
7 -4.94 7.95 -5.72 6.69 -5.30 2.47 6.46 1.58
8 7.66 12.32 9.98 11.69 16.65 7.76 12.96 3.17
9 -1.16 1.86 -1.83 2.14 -2.33 1.09 -4.82 1.18
10 3.76 6.04 2.26 2.65 5.98 2.79 11.93 2.92
11 -3.90 6.27 -2.07 2.43 -1.61 0.75 9.28 2.27
12 13.48 21.68 19.83 23.22 35.61 16.59 56.74 13.88
13 -3.71 5.96 -5.30 6.21 -7.79 3.63 -11.75 2.87
BZQJ1842+6809 1 -0.33 0.54 -0.41 0.48
2 0.35 0.57 0.76 0.88
3 0.29 0.46 0.09 0.11
4 -0.57 0.92 -0.68 0.80
5 2.09 3.36 2.36 2.76
6 -0.58 0.93 -0.66 0.77
7 0.37 0.59 0.28 0.32
Disclaimer/Publisher’s Note: The statements, opinions and data contained in all publications are solely those of the individual author(s) and contributor(s) and not of MDPI and/or the editor(s). MDPI and/or the editor(s) disclaim responsibility for any injury to people or property resulting from any ideas, methods, instructions or products referred to in the content.
Copyright: This open access article is published under a Creative Commons CC BY 4.0 license, which permit the free download, distribution, and reuse, provided that the author and preprint are cited in any reuse.
Prerpints.org logo

Preprints.org is a free preprint server supported by MDPI in Basel, Switzerland.

Subscribe

© 2024 MDPI (Basel, Switzerland) unless otherwise stated