
Submitted:
19 July 2023
Posted:
20 July 2023
You are already at the latest version
Abstract
A novel manufacturing process is presented for producing Nano powders and thin films of CuCoO2 (CCO) material. This process utilizes three cost-effective synthesis methods: hydrothermal, sol-gel, and solid-state reactions. The resulting delafossite CuCoO2 samples were deposited onto transparent substrates through spray pyrolysis, forming innovative thin films with a Nano crystal powder structure. Prior to the transformation into thin films, CuCoO2 powder was first produced using a low-cost approach. The precursors for both powders and thin films were deposited onto glass surfaces using a spray pyrolysis process, and their characteristics were examined through X-ray diffraction, scanning electron microscopy, HR-TEM, UV-visible, and Electrochemical impedance spectroscopy (EIS) analyses was conducted to determine the conductivity in transversal direction of this groundbreaking material for solar cell applications. On the other hand, the sheet resistance of the samples was investigated using the four probe-method to obtain the sheet resistivity and them calculate the in plane conductivity of the samples. We also investigated the aging characteristics of different precursors with varying durations. The functional properties of CuCoO2 samples were explored by studying chelating agent and precursor solution aging periods. Resuming, this study thoroughly discusses the synthesis of delafossite powders and their conversion into thin films, which hold potential as hole transport layers in transparent optoelectronic devices.
Keywords:
Delafossite
; powder
; films
; spray pyrolysis
; EIS
; conductivity
; relaxation time
1. Introduction
In recent decades, there has been a significant demand for advancements in the integration of high-efficiency p-type transparent conductive oxides (TCOs) into industrial applications, particularly in the past few decades1-5. However, the research community is keen on exploring alternative TCOs and enhancing their electrical and optical properties to improve device efficiency6-8. Among various delafossite oxides, copper-based delafossite oxides stand out as promising candidates due to their desirable electrical and optical characteristics. The copper-based delafossite oxide, specifically CuMO2 (where M represents Al, Ga, Fe, Co, Mg, Fe, Cr...), has attracted considerable attention for diverse applications such as batteries9-15, luminescent materials16-21, thermoelectrics22-29, solar energy conversion and photocatalysis30-36, hydrogen production through water splitting using photocathodes37-42, and gas sensors43-50. In this study, we focus on the CuCoO2 compound, since it exhibits intriguing structural, optical and electrical properties; it has only been studied in a limited number of publications and in most of them, the CuCoO2 compound has shown interesting properties to be treated as a possible material in photovoltaic solar cells51-59. Extensive studies on delafossite powders and thin films reveal that CuCoO2 is a p-type semiconductor that crystallizes in two distinct structures: rhombohedral (3R)60-62 and hexagonal (2H)61,63-64. The successful synthesis of the CuCoO2 phase has been reported in only a few papers to date. Moreover, various efforts have been made to manipulate the properties of CuCoO2, such as characterizing it using different printing techniques or exploring its physical and chemical properties through doping processes involving a wide range of elements66-68. Considerable attention has been devoted to the integration of this delafossite material into various domains using different methodologies. Beekman et al. published a study on the synthesis of undoped delafossite through ion exchange60, while Z. Du et al. synthesized it as an electrocatalyst for the oxygen reaction51, and also investigated the solvothermal synthesis of CuCoO267. Isacfranklin et al. focused on CuCoO2 electrodes for supercapacitor applications72, whereas D. Xiong et al. conducted a study on the polyvinylpyrrolidone-assisted hydrothermal synthesis of CuCoO273. Other researchers explored hydrogen-related aspects, such as J. Ding et al., who investigated Co3O4-CuCoO2 composites74.
Several studies have reported on the effects of Ca+2 doping in CuCoO2. Z. Du et al. studied the optical and electrical properties of the material55,66, while M. Yang et al. examined the impact of nickel doping on the structure and morphology of delafossite67-69. Limited research has been conducted on the transformation of delafossite powder into thin films53,57,59. Notably, the literature currently lacks any research projects specifically investigating the structural and electrochemical properties of CuCoO2 crystalline nanopowders and thin films deposited on glass substrates.
Several physical and chemical processes, such as spray pyrolysis54,74,75 and spin-coating76-77, have been employed to fabricate thin films of CuCoO2. However, previous attempts to produce CuCoO2 thin films have predominantly utilized complex and expensive techniques, posing significant practical limitations. Currently, only a few endeavors have focused on generating CuCoO2 thin films in the hexagonal phase, particularly through chemical deposition methods. Therefore, the objective of this study is to develop a simpler and more efficient chemical synthesis using three different methods based on the utilization of CuCoO2 powder, which yield an excellent, ordered crystalline mixture between two structures: rhombohedral and hexagonal with and good band gap values aiming to achieve thin films of this material. Comprehensive investigations were conducted to thoroughly analyze the optical and electrical characteristics of these thin films. In particular studies of electrochemical impedance spectroscopy (EIS) analysis and simulation of delafossites based solar cell where the CuCoO2 as HTL are reported for the first time. The conductivity of samples, prepared using the three different techniques, was measured in direct current (named in-plane conductivity) using the four-point probe and alternating current (named transversal conductivity) by electrochemical impedance spectroscopy.
Additionally, Density Functional Theory were employed to provide a theoretical understanding of the role played by each element in the electronic structure, as well as to accurately determine the bandgap of the material.
2. Experimental part:
2.1. Synthesis of CuCoO2 Powders:
CuCoO2 was produced using three different methods. The grains of copper(II) nitrate trihydrate (Cu(NO3)2,3H2O; 99%) were used as Cu+2 source; cobalt(II) nitrate hexahydrate (Co(NO3)2, 6H2O; 98%) were used as Co2+ source and sodium hydroxide (NaOH) from Sigma–Aldrich. As a solvent, deionized water (DW) was utilized. At room temperature, all chemicals were added. The amount of each precursor was 2 mM of each of the copper and cobalt sources, 4.40 g of sodium hydroxide, and 70 mL of deionized water (DW), respectively. All of the precursors were measured and mixed in a reasonable amount of solvent for three hours. For hydrothermal synthesis: method 1 (sample named CuCoO2_H), the liquid was placed in a 100 ml Teflon autoclave and autoclaved at 100 °C for 24 hours; we washed the obtained solution several times with distilled water. Method 2: solid state reaction (sample named CuCoO2_SSR); stoichiometric amounts of the above-mentioned powders had been ground with ethanol solution (95%) for 24 h. The ground powder had been calcined at 800°C for 5 h. Method 3: sol-gel (sample named CuCoO2_SG); copper (II) nitrate and cobalt (II) nitrate were mixed in ethylene glycol. The solution was agitated at room temperature for 1 hour in a beaker before being dried at 150°C for 5 hours. On a heated plate with a magnetic stirrer, gelation took place until a purple color emerged. The amorphous powder was heated incrementally from 50 °C to 800 °C.
2.2. Synthesis of the CuCoO2 Thin Films:
The glass substrate cleaning process was performed by ultrasonically cleaning and drying the substrate. The dissolved nanocrystal precursor solution is then converted into a thin film. CuCoO2/glass films were produced using spray pyrolysis technology. First, we dispersed 1 mg of CuCoO2 powder in 10 mL of ethanol/water mixture and sonicated for 30 min to form homogeneous slurry. The CuCoO2 slurry was then deposited on the glass film (Figure 1). The resulting film was annealed in air at 350° C. for 40 minutes to form a CuCoO2 -coupled glass film.
2.3. Electrochemical Impedance Spectroscopy (EIS) Measurements:
The conductivity was measured through the samples with a Novocontrol broadband dielectric spectrometer (BDS) equipped with an SR 830 lock-in amplifier and an Alpha dielectric interface in the frequency interval from 10-1 to 107 Hz with 0.1 V amplitude of the signal at temperatures ranging from 20 to 120°C in increments of 20°C. The samples had been airbrushed before being tested, and their thicknesses have been determined via a micrometer, averaging 10 readings from various sections of the surface. The samples were dried in a vacuum cell and placed between two gold round electrodes that served as blocking electrodes before being heated in the Novocontrol system in a neutral nitrogen-free environment. A temperature cycle from 20 to 120°C in 20°C increments was performed before collecting the dielectric spectra at every step to ensure uniformity and reduce interference from remaining water. During the testing, the electrodes were kept completely wet below 100°C and replicated a 100% relative humidity environment above 100°C in a BDS 1308 liquid device that was attached to the spectrometer and contained deionized water. To accurately control the temperature conditions, the temperature was kept constant throughout the conductivity measures (isothermal investigations) or shifted stepwise from 20 to 120°C using a nitrogen jet (QUATRO from Novocontrol), alongside a temperature error of 0.1 K throughout each frequency sweep.
The frequency dependence of complex impedance Z*(ω) = Z’(ω) + j.Z”(ω), yields the real component of conductivity as
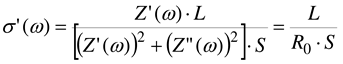 Where L and S represent the thickness and area of the sample in contact with the electrodes, and R0 its resistance.
3. Results and Discussion
3.1. Structural analysis
Figure 2 presents the XRD diffractograms of the as-prepared samples a) CuCoO2_H, b) CuCoO2_SG, and c) CuCoO2_SSR with a mixture of two structures: rhombohedral and hexagonal. This was confirmed by checking the database: JCPDS Map No. 074-1855 and JCPDS Map No. 021-0256. The three patterns observed in Figure 2 were identified as pure phases of CuCoO2 without secondary phases. The main peak of delafossite CuCoO2 in the rhombohedral structure (110) is at 2θ = 37.92°, and the hexagonal structure is at 2θ = 38.27°.
After characterization of CuCoO2 nanoparticles prepared by three methods: hydrothermal method, sol-gel method and solid-state reaction method, we examined their structure following deposition onto glass substrates and thin film synthesis using spray pyrolysis. Figure 3 shows the XRD graphs of the thin films CuCoO2 on the glass substrates. We observed some of the peaks shown in the XRD pattern, which now appear in the diffractograms of the deposited film. However, the structure did not change and the material showed two structures containing Delafossite: 3R-CuCoO2 (JCPDS#21-0256) and 2H-CuCoO2 (JCPDS#74-1855). Furthermore, it is clear that each XRD pattern begins with a tablet. It belongs to the glass substrate.
3.2. FE-SEM Analysis
We are interested in the morphology and particle size distribution of our compound CuCoO2. Observations by scanning electron microscopy (SEM) were carried out on a submicron scale on the three prepared CuCoO2 nanocrystal powders as shown in Figure 4. A 1μm magnification is given.
FE-SEM images of the powders show the submicron CuCoO2_H, CuCoO2_SG, and CuCoO2_SSR are in the form of a powder made up of crystals of different sizes, and they contain agglomerates of hexagonal particles and crystals like rhombohedral shapes. There have been no additional morphologies detected, which confirms the XRD results.
Figure 5 shows FE-SEM images of produced thin films comprising CuCoO2_H, CuCoO2_SG, and CuCoO2_SSR at 1 μm. After deposition with the spray pyrolysis technique, all films had a uniform distribution of nanocrystalline particles.
3.3. HR-TEM Analysis
Figure 6 shows the characterization of the three samples with transmission electron microscope (TEM) characterization and the high resolution transmission electron microscopy (HRTEM) images of CuCoO2 are illustrated in Figure 6. As a result, we could assume that the crystallinity of CuCoO2 retains a structure mostly constituted of nanocrystals smaller than 15 nm in diameter. HR-TEM d-spacings are likewise consistent with a mixture of rhombohedral and hexagonal CuCoO2 chalcopyrite phases. The results from the FE-SEM agree with the HR-TEM images, which show clearly established small grains of some tens of nanometers.
Figure 7 depicts the transmission electron microscopy (TEM-HR) mapping. The photos of the three CuCoO2 powders reveal a good distribution of copper-cobalt oxide components, with the hydrothermal CuCoO2 powder having a higher crystallinity.
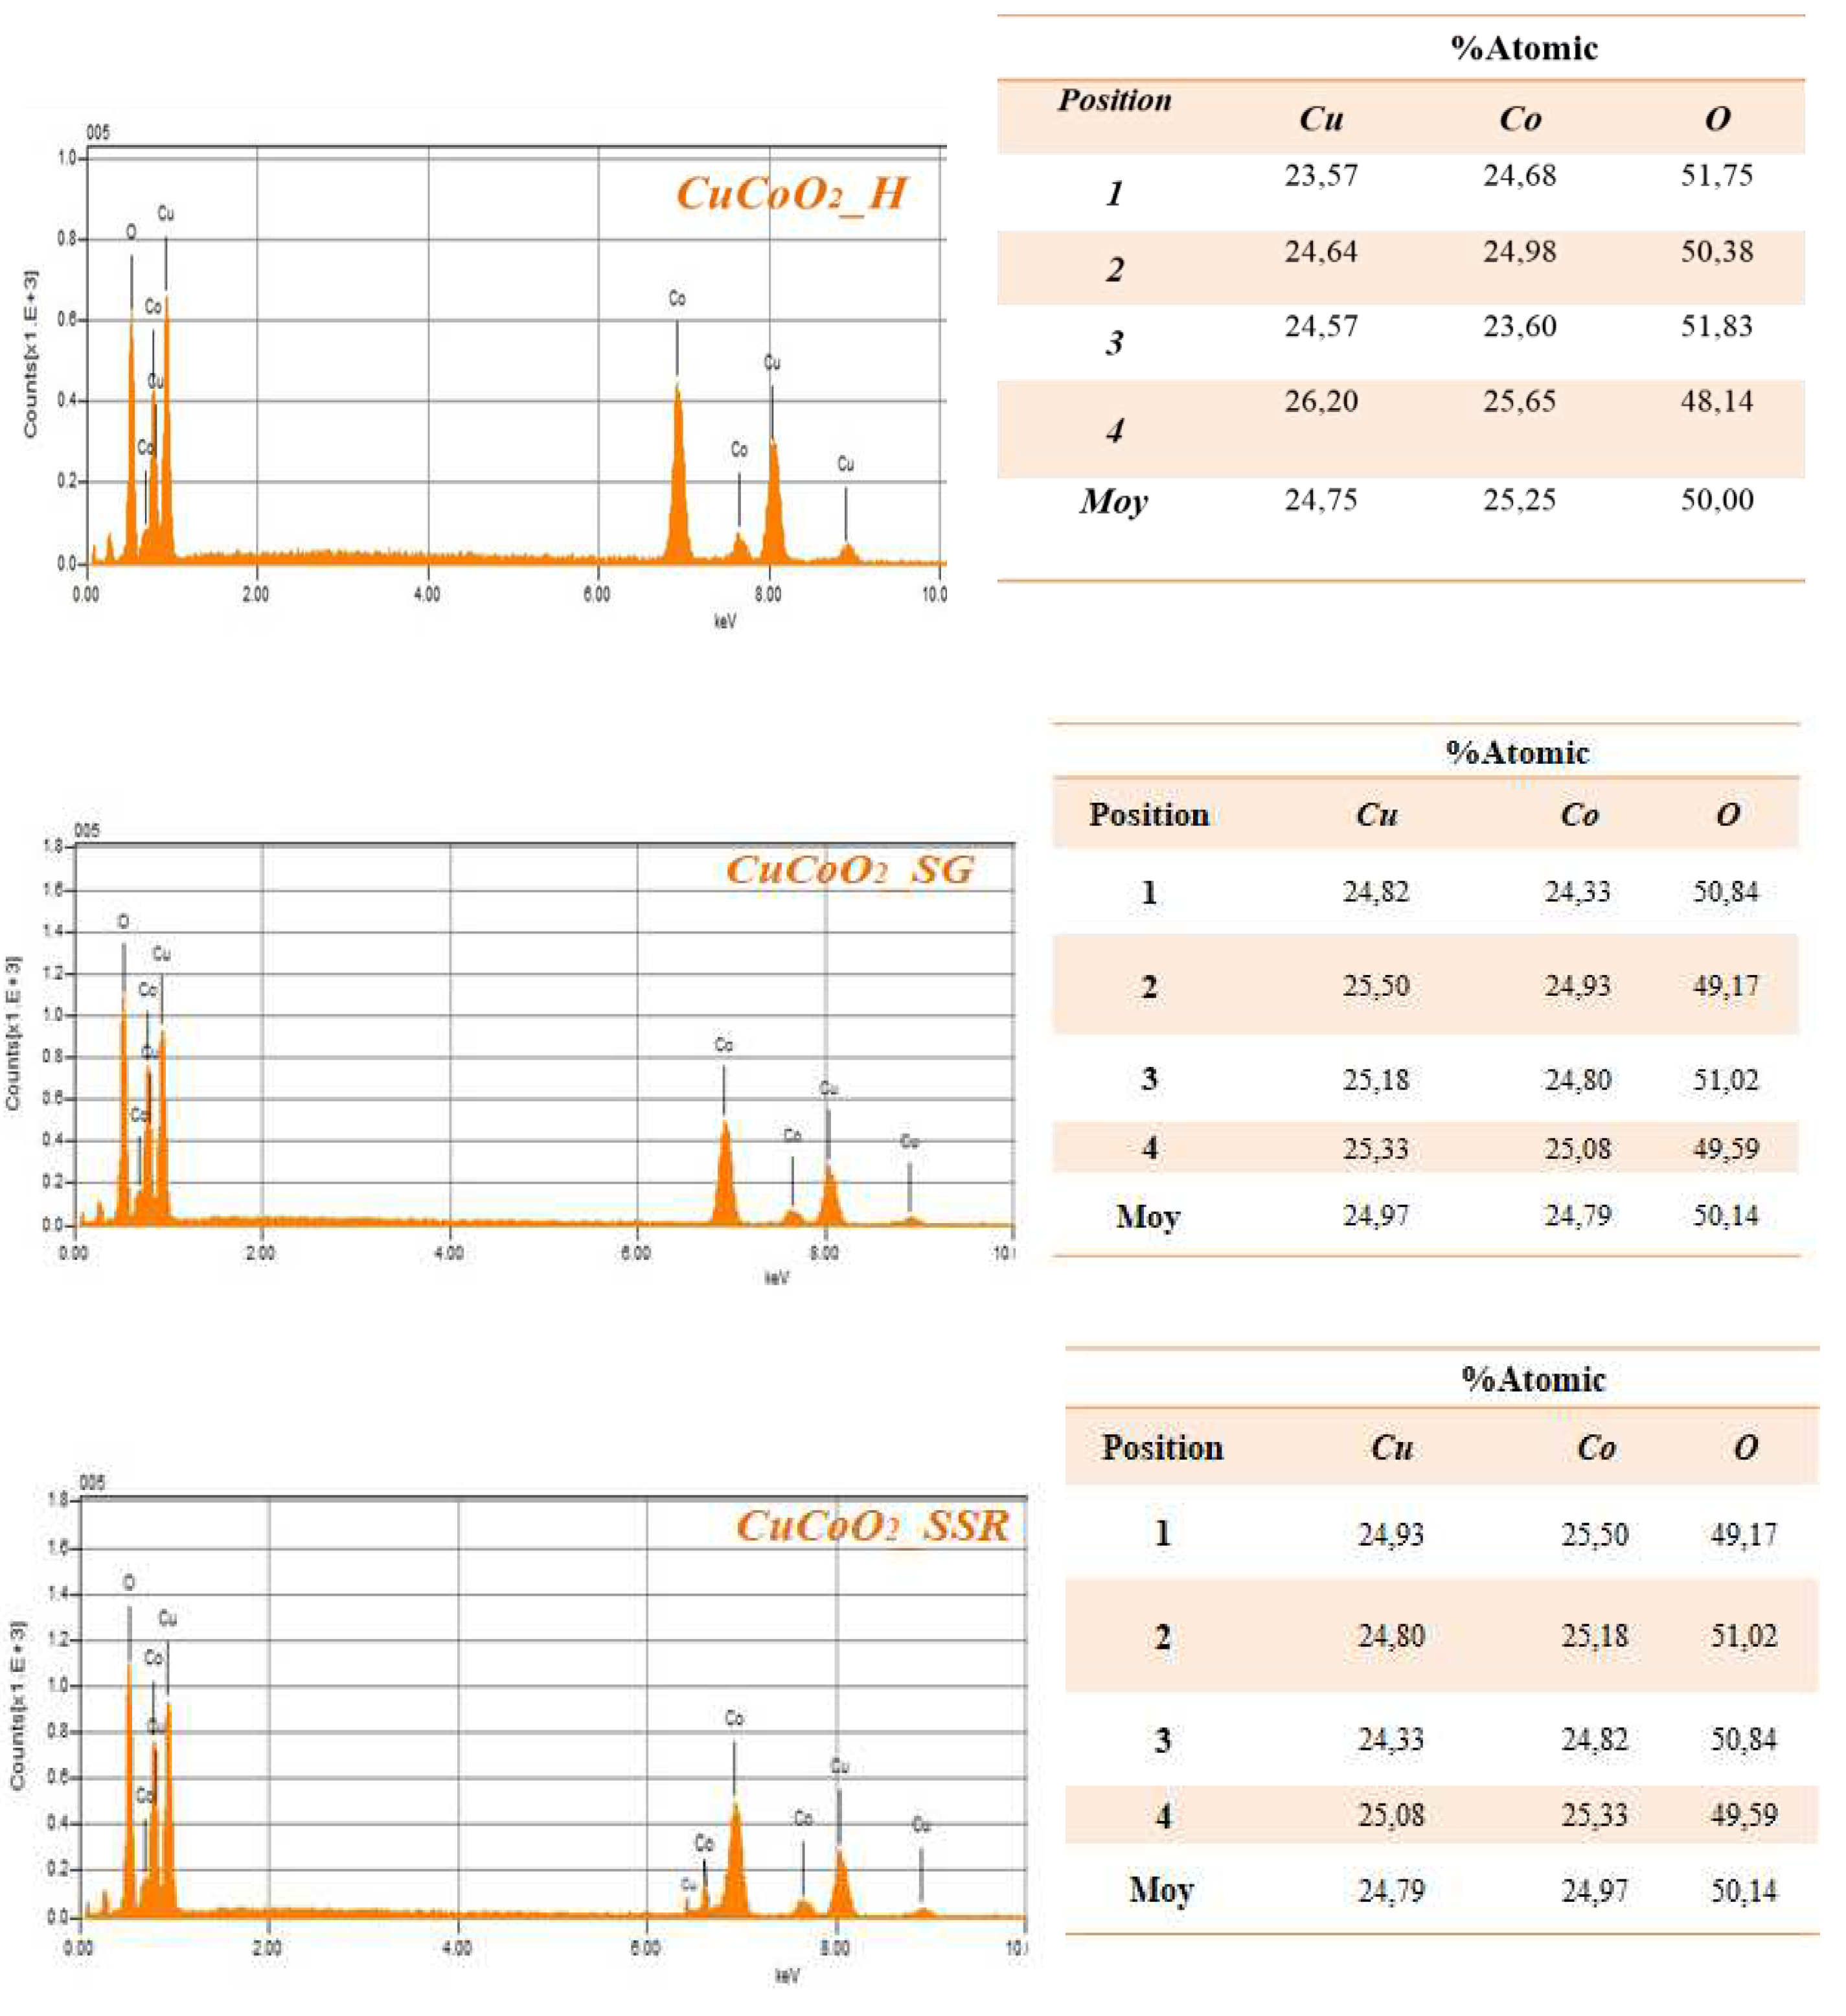
4. EDX Analysis
We further investigate the chemical composition of our sample using the EDS technique. The figures and tables below show the results of the EDS analysis for the cracked surfaces of the CuCoO2_H, CuCoO2_SG, and CuCoO2_SSR samples. From the table above the percentages of each Cu and Co in a position are approximately the same, but the percent oxygen is a bit high. This difference may be due to the oxidation of copper or cobalt.
Figure 8.
Cracked surface test results of three CuCoO2 powders using EDS.
5. Optical Properties
The transmittance spectra have been used to examine optical qualities. In the visible area, all of the CuCoO2 thin films displayed extensive absorption. The absorbance coefficients for thin film samples generated utilizing a spray pyrolysis method containing nanocrystals were determined. In the transmittance spectrum of materials, the absorption coefficient is connected with the optical energy gap or in the strong absorption zone, which may be estimated using Tauc's equation78
A is a constant, h is the Planck constant, υ is frequency, and n is an indicator of the optical absorption process. It equals 2 for directly permitted transitions and 0.5 for indirectly permitted transitions. Figure 9 shows (a) the transmission values and (b) the Tauc plot for CuCoO2 thin films. The arrangement of Tauc's figure suggests that the CuCoO2 thin film under deposit has a straight band gap. Eg may be estimated by extrapolating by projecting a horizontal line to the point of zero absorption coefficient (α = 0). The band gaps were calculated by graphing (αhυ)2 vs. energy in eV and extrapolating the linear portion of the spectrum (hυ). According to the transmission graph (Figure 9a), the powder CuCoO2_SG has the highest transmission value compared to the two other powders CuCoO2_H and CuCoO2_SSR. The order of the delafossite powders transmission is obviously confirmed with the band gap graphs (Figure 9b).
6. In-plane conductivity measurements
The measurement of conductivity in powders and polymeric thin membranes is a complex task that is influenced by various factors, including sample casting preparations, thermal/hydrothermal treatments, relative humidity, and the cell configuration used for film resistance measurements, as well as the pressure applied between the probe electrodes79. The four-probe method is commonly used to measure sample sheet resistance and estimate in-plane conductivity, but it may result in inaccuracies, particularly for materials with morphological anisotropy80-81. According to this method, the sheet conductivity can be calculated, from the inverse of the sheet resistivity, as
where ρ is the sheet resistivity, Rs the in plane resistance and t is the sheet sample thickness. In our samples the thickness values are 140 nm, 136 Nano powdersNnm and 142 nm for CuCoO2_H, CuCoO2_SG, and CuCoO2_SSR, respectively. Figure 10 depicts the physical setup for evaluating in-plane conductivity in a typical four-probe arrangement. The resistivity may be calculated through determining the potential difference between the RE and S electrodes, that is caused by current passing via an easily identifiable connection between the WE and CE electrodes (Figure 10). The in-plane conductivity of a sample is measured throughout its surface using this approach. Nevertheless in reality, ionic conduction perpendicular to the membrane is now recognized as a strong electrochemical approach for measuring through-plane conductivity in membranes82. In powders used for solar cells, the four point probe method is the most often used method for assessing the electrical characteristics of conducting films83. This approach has been utilized to evaluate the in-plane conductivity of CuCoO2 films on top of non-conductive substrates (in our instance, glass), which are typically created by spray pyrolysis technology the dispersions employed in this work. The four point probe method makes use of relatively basic equipment in which four probes are arranged equidistantly in a straight line and pushed against the film such is shown in Figure 10.
The experimental procedure used is the following. The four point probe is attached to a source meter that may supply a certain current. A source meter's current (I) flows through the two outer probes, and a voltammeter can measure the voltage (V) across the two inner probes. Plotting the voltage measured for each current intensity permit us determine the sheet resistance, Rs, such as is shown in Figure 11.
A close inspection of these figures permit us observe that sample resistance (Rs) of the CuCoO2 films is constant and its values can be obtained from the slope of the experimental fit determined from the plot of the voltage versus intensity, where a clear linearity is observed for all the samples. According to the KIT used to measure the resistance of the film by means of the four points method, the value of Rs is given by
Being the constant 4.532 the value given for said KIT as a consequence of the geometry used in the measurement. Therefore, the in-plane conductivity, given in Eq. (3), is determined from the sheet resistance from Eq.(4). The results obtained, measured at ambient temperature, of three produced CuCoO2 samples, using the four point probe technique, are presented in Table 1. The conductivity values change depending on the chelating agent and the aging duration. These findings imply that aging period and thickness change have an effect on electrical conductivities.
7. Dielectric Spectra Analysis
The electrical impedance spectroscopy (EIS) measurements were performed on all samples to determine the conductivity measured in transversal direction, named direct current conductivity (σdc). Such measurements were carried out over a temperature interval of 20°C to 120°C in two steps to ensure reproducibility within the temperature interval. The experimental data obtained for the samples from the Novocontrol, were examined of the complex dielectric permittivity function, denoted as ε*(ω,T), and the complex conductivity function, denoted as σ*(ω,T), where j is the imaginary unit (j2 = -1), ε0 is the vacuum permittivity, and ω is the angular frequency of the electric field that was applied (ω =2πf). Different methods have been used to determine the dc-conductivity of a sample from dielectric spectroscopy data analysis84-94. In this work we have used the Bode diagram obtained from the complex dielectric spectra, where the complex conductivity is given by σ*(ω,T)=j ε0 ω ε*(ω,T), which can be expressed in terms the real and imaginary part, σ’(ω,T) and σ” (ω,T) , respectively, and the direct current conductivity σdc was calculate93-96. This technique was used in this study to examine data for the real component of conductivity in dry conditions by graphing conductivity (in S cm-1) vs frequency (in Hz) using appropriate Bode diagrams for all temperature ranges.
The Bode diagrams for CuCoO2_H, CuCoO2_SG, and CuCoO2_SSR delafossite materials were investigated at temperatures ranging from -20ºC to 120ºC, with increments of 20ºC, as shown in Figure 12. Additional graphs demonstrating the fluctuation of phase angle (ϕ) vs frequency at identical temperatures are included in the Supplementary Information. Upon closer examination of the figures, it can be observed that the conductivity tends to a constant value (plateau) when the phase angle (ϕ) approaches zero or reaches a maximum, indicating the direct-current conductivity (σdc) of the sample. Furthermore, a decrease in conductivity with decreasing frequency was observed in the high-frequency region, along with a transition zone where the cut-off frequency ranges from 105 to 106 Hz for CuCoO2_SG and CuCoO2_SSR samples, and starts increasing with frequency. In the case of the hydrothermal sample CuCoO2_H, the real part of conductivity remains constant at low frequencies until a cut-off frequency between 103 Hz and 106 Hz, after which it starts increasing with frequency. The initial process is connected to the sample's resistance/stability, but this second process is connected to the dispersion (charge transfer) caused by the charge's mobility, as the sample behaves like a capacitor. The conductivity values presented were derived using the peak frequency when the phase angle approaches 0.
Upon careful examination of Figure 12, it can be observed that samples CuCoO2_SG and CuCoO2_SSR exhibit a nearly constant conductivity across a wide range of frequencies and temperatures, that is standard behavior for a conductive material. Identical behavior has been reported in previous studies on nanocomposites of multilayer graphene in polypropylene95. This phenomenon is due to Debye relaxation, which occurs as a result of the mobility and redirection of dipoles and localized charges at high frequencies in response to an applied electric field and dominates direct-current conductivity96-98. The change in dc conductivity of the samples at various temperatures may be determined from the plateau where the phase angle approaches zero. Moreover, with rising temperature the frequency at which the point of equilibrium occurs moves to greater frequencies, suggesting thermal activation of ionic transport. The constant value of conductivity suggests that the sample solely shows resistive contribution, and the quantity measured represents the sample's electrical conductivity. For example, Figure 12 shows, at 20 °C, the trough plane conductivity values followed the trend: σCuCoO2_SG (5.2 × 10⁻⁵ S cm−1) > σCuCoO2_SSR (2.9 × 10⁻⁵ S cm−1) > σCuCoO2_H (4.53 × 10⁻⁸ S cm−1). Similar trends can be observed for the other temperatures studied (for example, 40ºC, 60ºC, 80ºC, 100ºC and 120ºC). For 120ºC the conductivity values obtained, follow the trend, σCuCoO2_SG (1.4 × 10⁻³ S cm−1) > σCuCoO2_SSR (5.7 × 10⁻⁴ S cm−1) > σCuCoO2_H (1.0 × 10⁻⁵ S cm−1), respectively. Among the three samples, the greatest proton conductivity of about 10−3 S cm−1 at 120 °C was found for the CuCoO2_SG one order of magnitude higher than CuCoO2_SSR, where also excellent ionic conductivities of about 10−4 S cm-1. These results shown that the preparation method used is very relevant to get excellent results in the measured transversal conductivity, in our case around of one order of magnitude than the sample CuCoO2_H was reached. All these values have better conductivities than CIGS:Cr crystalline nanopowders and CuInGaSe2 (CIGS) chalcopyrite thin films doped with Cr varying its concentrations99.
From the plot showed in Figure 13, we observe that dc-conductivity of all mixtures increases with temperature increase and follow an Arrhenius behavior for the thermal activation energy. The measurements of the activation energy calculated from the slopes follow the trend Eact (CuCoO2_SSR) = 27.4 kJ/mol< Eact (CuCoO2_SG) = 30.8 kJ/mol < Eact (CuCoO2_H) =52.3 kJ/mol, respectively.
These results indicate that the thin films prepared from hydrothermal synthesis have higher activation energy and lower conductivities than the samples prepared from: a) solid state reaction where stoichiometric amounts of the above-mentioned powders have been grinded with ethanol solution and after had calcined at temperature 800°C for 5h. b) sol-gel; copper (II) nitrate and cobalt (II) nitrate were mixed in ethylene glycol and after the gelation occurred on a magnetic-stirring hot plate till a purple color appeared become darker. The amorphous powder was heated until 800 °C, by the step of 50 °C.
Figure 14, shows the relationship between the relaxation time obtained from the cut-off frequency where the conductivity changes from a constant value in the bode diagram (plateau) to an increasing with the frequency when the frequency increase for all temperatures. In such circumstances, such as is observed, more focused, in case of CuCoO2_H (see figure 12-C) for all the temperatures, we can say according the power low model, that real part of the conductivity σ’(ω,T) can be expressed in terms of dc-conductivity σdc and hopping diffusion rate of protons ωH ≈1/τ (in this case) as100
where n is an exponent compress between 0 and 1, related to interactions between mobile ions (H+ in our case) and dimensionally of conduction pathway101, such is happen in polymer electrolytes of P[VBTC][Cl]80-ran-PMMA20 at different temperatures (303K to 363K), and P[VBTC][TFSIl]80-ran-PMMA20 at (308K to 378K), respectively102. From the fit of the real part of the conductivity showed in the Bode diagrams showed in Figure12 we have obtained the values of sample relaxation time that we are plotted in Figure 14 for each temperature.
From Figure 14 we can see that the relaxation time follow an Arrhenius behavior in all the powders studied, but is interesting to observe that samples prepared using method 2 (CuCoO2_SSR and method 3 (CuCoO2_SG), have a relaxation time around one order of magnitude smaller than sample prepared using the method 1 (CuCoO2_H). That’s mean that the method to produce powders to build thin films is very important if we want enhanced optical and electrical properties. In these results we observe that delafossites are extremely sensitive on a wide variety of parameters, in particular the method used in its preparation, and the results indicate that these materials have the potential destined for use in thin-film solar cells.
8. Theoretical insight
Theoretical simulations are critical in the understanding of the properties of systems at the atomic level. Therefore, first-principles calculations were performed to complement the experimental results with an insight on the electronic structure and properties of. For this purpose the atomic positions were optimized and the electronic properties were computed within the Density Functional Theory (DFT) approach, based on the framework of the generalized Kohn−Sham scheme103-106 in combination with the projector augmented-wave (PAW) method107 and the Heyd−Scuseria−Ernzerhof hybrid functional with the modified fraction of screened short-range Hartree−Fock exchange (HSE06)108-110 as implemented in the Vienna ab initio simulation package (VASP)111-112. Hybrid functionals allow a more accurate description of electronic properties of some systems compared to simple DFT calculations with a generalized gradient approximation for the exchange and correlation term in the Kohn−Sham scheme. The more accuracy, however, is reached at the cost of a higher computational time needed to achieve convergence.
To model thein the tetragonal phase, a unit cell with 12 atoms (Co3Cu3O6) was used, while for the hexagonal cell a smaller cell with 8 atoms (Co2Cu2O4) was needed. The electronic wave functions were expanded in a plane wave basis setup to a kinetic energy cutoff of 400 eV, and the atomic positions were optimized using the conjugate gradient method up until the forces on each atom were less than 0.01 eV A-1 and the energy convergence less than 10−8 eV for the optimization, and less than 10−5 eV for the calculations with the hybrid functional. For the Brillouin zone integration, a 12 × 12 × 6 Monkhorst−Pack scheme k-point mesh was used113,114 both for the optimization and electronic structure calculation.
Figure 15 shows the atom positions and geometrical structure of the converged unit cells. The delafossite structure of this ternary oxide can be appreciated fairly. In the tetragonal structure an alternate stacking of O-Cu-O dumbbells parallel to the z axis, and a layer of Co-centered octahedral in the xy planes. The stacking follows an ABCABC pattern, forming a trigonal system with lattice parameters a = 2.86 Å and c = 16.98 Å corresponding to a rhombohedral Bravais lattice of volume 120.1 Å3. In the hexagonal cells, the same layers of O-Cu-O dumbbells and Co-centered octahedral are observed, but with an ABAB stacking pattern. The lattice constant a = 2.83 Å is practically identical, but c = 11.30 Å is significantly lower, as well as the unit cell volume of 78.47 Å3. However, these differences are due to the fact that a smaller distance is enough to represent the structure, because of the stacking sequence. Hence, important distances within the unit cell, such as the distance between O atoms in the O-Cu-O dumbbells (3.71 Å for the tetragonal 3.69 Å in the hexagonal) or the distance from cornered O to centered Co in the octahedral (1.92 Å for the tetragonal and 1.91 Å in the hexagonal) are practically the same.
The bands structure and density of states, for the tetragonal phase can be appreciated in Figure 16. Tough the inclusion of hybrid functional allows the possibility of avoiding the typical underestimation of gaps in pure DFT approaches; the bandgap values obtained seems to remain underestimated: 2.31eV for the tetragonal structure and 2.34 for the hexagonal one. However, the structure of the bands and density of states form of the curves is usually well described in this type of calculations, and despite the small difference in bandgap values for both structures, the form of the density of states is practically the same, which is why only one of them is plotted.
The obtained gap is an indirect one, which can be appreciated by simple inspection of the bands structure in the left part of Figure 16. The right part shows the density of states in which it is appreciable that the edge of the covalent band is apparently dominated by Cu-3d states, and O states show a wide dispersion through the band, but the presence of Co-3d states is high in this region, and except for the peak at the edge of the band, is comparable with the contribution from Cu states. Also, the first peak in the conduction band is mainly due to Co-3d states followed by a second peak with a structure similar to the one that can be found in and as it has been previously reported98,99.
9. Conclusions
In summary, the preparation of delafossite CuCoO2 using three cost-effective techniques yields a well-ordered crystalline mixture comprising two structures: rhombohedral and hexagonal, exhibiting similar properties and favorable band gap values. To ensure the development of an effective coating solution, careful treatment of the resultant nano-sized precursor powder is necessary. The desired thin films, namely CuCoO2_H (produced via hydrothermal method), CuCoO2_SG (produced via sol-gel method), and CuCoO2_SSR (produced via solid-state reaction method), were successfully obtained through the spray pyrolysis process. Electrochemical impedance spectroscopy measurements reveal that the Sol-Gel method yields films with superior conductivity compared to the other preparation methods. As a result, CuCoO2 thin films hold significant potential for solar cell applications. This is supported by the examination of the electronic properties of the rhombohedral CuCoO2 through theoretical simulations. Furthermore, electrochemical impedance spectroscopy measurements demonstrate that the copper cobalt delafossites prepared using different synthesis methods have the potential to serve as semiconductor materials. The conductivity values, measured through plane, increase with temperature as expected: σCuCoO2_SG > σCuCoO2_SSR > σCuCoO2_H. Among the three samples, CuCoO2_SG exhibits the highest conductivity of approximately 10-3 S cm-1 at 120 °C, which is one order of magnitude greater than CuCoO2_SSR, while still maintaining good ionic conductivities of approximately 10-4 S cm-1. This value is approximately two orders of magnitude higher than that of CuCoO2_H. These conductivity measurements, obtained through impedance spectroscopy, are in agreement with the values determined using the four-probe method, where resistivity follows the trend of ρCuCoO2_SG < ρCuCoO2_SSR ≈ ρCuCoO2_H. Lastly, our study demonstrates that samples prepared using method 2 (CuCoO2_SSR) and method 3 (CuCoO2_SG) have relaxation times approximately one order of magnitude smaller than samples prepared using method 1 (CuCoO2_H). This result emphasizes the significant impact that the synthesis method and sample preparation can have on producing powders for building thin films to enhance optical and electrical properties, particularly for solar cell applications.
Data Availability Statement
The data presented in this study are available on request from the corresponding author.
Acknowledgement
The author Amal Bouich acknowledges MCIN for funding support through Margarita Salas Fellowship (MCIN/AEI/10.13039/501100011033). This work has been funded by the Ministerio de Ciencia e Innovación (Spain) and by the Spanish Agencia Estatal de Investigación through projects BESTMAT PID2019-107137RB-C21/AEI/10.13039/5011000 11033 and PID2019-107137RB-C22/AEI/10.13039/ 501100011033 and by ERDF under the funding “A way of making Europe”.
Conflicts of Interest
The authors declare no conflict of interest.
References
- Ai, B.; Fan, Z.; Wong, Z.J. Plasmonic–perovskite solar cells, light emitters, and sensors. Microsystems & Nanoengineering 2022, 8, 1–28. [Google Scholar]
- Fukuda, K.; Yu, K.; Someya, T. The future of flexible organic solar cells. Advanced Energy Materials 2020, 10, 2000765. [Google Scholar] [CrossRef]
- Sehrawat, P.; Malik, R.K.; Khatkar, S.P.; Taxak, V.B. Highly efficient green-glimmering Y3Al5O12: Er3+ NPs for next generation electro-optic appliances, mainly white-LEDs and solar-cells. Chemical Physics Letters 2021, 773, 138592. [Google Scholar] [CrossRef]
- Sargent, E.H. Solar cells, photodetectors, and optical sources from infrared colloidal quantum dots. Advanced Materials 2008, 20, 3958–3964. [Google Scholar] [CrossRef]
- Cappelli, I.; Carli, F.; Fort, A.; Micheletti, F.; Vignoli, V.; Bruzzi, M. Self-Sufficient Sensor Node Embedding 2D Visible Light Positioning through a Solar Cell Module. Sensors 2022, 22, 5869. [Google Scholar] [CrossRef] [PubMed]
- Dinh, N.N.; Khanh, T.S.T.; Long, L.M.; Cuong, N.D.; Nam, N.P.H. Nanomaterials for Organic Optoelectronic Devices: Organic Light-Emitting Diodes, Organics Solar Cells and Organic Gas Sensors. Materials Transactions 2020, 61, 1422–1429. [Google Scholar] [CrossRef]
- Dai, B.; Biesold, G.M.; Zhang, M.; Zou, H.; Ding, Y.; Wang, Z.L.; Lin, Z. Piezo-phototronic effect on photocatalysis, solar cells, photodetectors and light-emitting diodes. Chemical Society Reviews 50 2021, 13646–13691. [Google Scholar] [CrossRef]
- Xu, J.; Shalom, M. Conjugated carbon nitride as an emerging luminescent material: quantum dots, thin films and their applications in imaging, sensing, optoelectronic devices and photoelectrochemistry. ChemPhotoChem 2019, 3, 170–179. [Google Scholar] [CrossRef]
- Youn, D.H.; Choi, Y.H.; Kim, J.H.; Han, S.; Heller, A.; Mullins, C.B. Simple Microwave-Assisted Synthesis of Delafossite CuFeO2 as an Anode Material for Sodium-Ion Batteries. ChemElectroChem 2018, 5, 2419–2423. [Google Scholar] [CrossRef]
- Amrute, A.P.; Łodziana, Z.; Mondelli, C.; Krumeich, F.; Perez-Ramirez, J. Solid-state chemistry of cuprous delafossites: Synthesis and stability aspects. Chemistry of Materials 2013, 25, 4423–4435. [Google Scholar] [CrossRef]
- Sheets, W.C.; Mugnier, E.; Barnabé, A.; Marks, T.J.; Poeppelmeier, K.R. Hydrothermal synthesis of delafossite-type oxides. Chemistry of materials 2006, 18, 7–20. [Google Scholar] [CrossRef]
- Karati, A.; Parida, T.; Gupta, J.; Adigilli, H.K.; Borse, P.H.; Joardar, J. Band-gap engineering in novel delafossite-type multicomponent oxides for photocatalytic degradation of methylene blue. Materials Research Bulletin 2021, 137, 111181. [Google Scholar] [CrossRef]
- Singh, A.N.; Mondal, R.; Rath, C.; Singh, P. Electrochemical performance of delafossite, AgFeO2: a pseudo-capacitive electrode in neutral aqueous Na2SO4 electrolyte. Journal of The Electrochemical Society 2021, 168, 120512. [Google Scholar] [CrossRef]
- Bennett, J.W.; Jones, D.T.; Hudson, B.G.; Melendez-Rivera, J.; Hamers, R.J.; Mason, S.E. Emerging investigator series: first-principles and thermodynamics comparison of compositionally-tuned delafossites: cation release from the (001) surface of complex metal oxides. Environmental Science: Nano 2020, 7, 1642–1651. [Google Scholar] [CrossRef]
- Dong, Y.; Cao, C.; Chui, Y.S.; Zapien, J.A. Facile hydrothermal synthesis of CuFeO 2 hexagonal platelets/rings and graphene composites as anode materials for lithium ion batteries. Chemical Communications 2014, 50, 10151–10154. [Google Scholar] [CrossRef] [PubMed]
- Liu, Y.; Gong, Y.; Mellott, N.P.; Wang, B.; Ye, H.; Wu, Y. Luminescence of delafossite-type CuAlO2 fibers with Eu substitution for Al cations. Science and Technology of advanced MaTerialS 2016, 17, 200–209. [Google Scholar] [CrossRef]
- Fujishiro, F.; Murakami, M.; Hashimoto, T.; Takahashi, M. Orange luminescence of Eu3+-doped CuLaO2 delafossite oxide. Journal of the Ceramic Society of Japan 2010, 118, 1217–1220. [Google Scholar] [CrossRef]
- Jacob, A.; Parent, C.; Boutinaud, P.; Le Flem, G.; Doumerc, J.P.; Ammar, A.; ... & Elaatmani, M. Luminescent properties of delafossite-type oxides LaCuO2 and YCuO2. Solid state communications 1997, 103, 529–532.
- Zhao, T.; Liu, Q.L.; Zhao, Z.Y. High-throughput screening delafossite CuMO2 (M= IIIA, 3d, 4d, 5d, and RE) optoelectronic functional materials based on first-principles calculations. The Journal of Physical Chemistry C 2019, 123, 14292–14302. [Google Scholar] [CrossRef]
- Tsuboi, N.; Ohara, H.; Hoshino, T.; Kobayashi, S.; Kato, K.; Kaneko, F. Luminescence properties of delafossite-type CuYO2 doped with calcium, oxygen or rare earth Tb. Japanese journal of applied physics 2005, 44, 765. [Google Scholar] [CrossRef]
- Siedliska, K.; Pikula, T.; Oleszak, D.; Jartych, E. Structure and Hyperfine Interactions of Mechanically Activated Delafossite CuFeO2. Acta Physica Polonica, A. 2018, 133. [Google Scholar] [CrossRef]
- Daou, R.; Frésard, R.; Eyert, V.; Hébert, S.; Maignan, A. Unconventional aspects of electronic transport in delafossite oxides. Science and Technology of Advanced Materials 2017, 18, 919–938. [Google Scholar] [CrossRef]
- Okuda, T.; Jufuku, N.; Hidaka, S.; Terada, N. Magnetic, transport, and thermoelectric properties of the delafossite oxides Cu Cr 1− x Mg x O 2 (0⩽ x⩽ 0.04). Physical Review B 2005, 72, 144403. [Google Scholar] [CrossRef]
- Van Hoang, D.; Pham, A.T.T.; Ta, H.K.T.; Nguyen, T.H.; Pham, N.K.; Hoa, L.T.; ... & Phan, T.B. Effects of multi-scale defects on the thermoelectric properties of delafossite CuCr1-xMgxO2 materials. Journal of Alloys and Compounds 2020, 844, 156119.
- Feng, Y.; Elquist, A.; Zhang, Y.; Gao, K.; Ferguson, I.; Tzempelikos, A.; Lu, N. Temperature dependent thermoelectric properties of cuprous delafossite oxides. Composites Part B: Engineering 2019, 156, 108–112. [Google Scholar] [CrossRef]
- Van Hoang, D.; Le, T.A.K.; Pham, A.T.T.; Ta, H.K.T.; Pham, N.K.; Nguyen, T.H.; ... & Phan, T.B. The roles of interstitial oxygen and phase compositions on the thermoelectric properties CuCr0. 85Mg0. 15O2 delafossite material. Journal of Alloys and Compounds 2021, 867, 158995.
- Ruttanapun, C.; Wichainchai, A.; Prachamon, W.; Yangthaisong, A.; Charoenphakdee, A.; Seetawan, T. Thermoelectric properties of Cu1− xPtxFeO2 (0.0≤ x≤ 0.05) delafossite-type transition oxide. Journal of alloys and compounds 2011, 509, 4588–4594. [Google Scholar] [CrossRef]
- Ruttanapun, C.; Wichainchai, A.; Prachamon, W.; Yangthaisong, A.; Charoenphakdee, A.; Seetawan, T. Thermoelectric properties of Cu1− xPtxFeO2 (0.0≤ x≤ 0.05) delafossite-type transition oxide. Journal of alloys and compounds 2011, 509, 4588–4594. [Google Scholar] [CrossRef]
- Sinnarasa, I.; Thimont, Y.; Presmanes, L.; Bonningue, C.; Barnabé, A.; Tailhades, P. Influence of thickness and microstructure on thermoelectric properties of Mg-doped CuCrO2 delafossite thin films deposited by RF-magnetron sputtering. Applied Surface Science 2018, 455, 244–250. [Google Scholar] [CrossRef]
- Liu, Q.L.; Zhao, Z.Y.; Zhao, R.D.; Yi, J.H. Fundamental properties of delafossite CuFeO2 as photocatalyst for solar energy conversion. Journal of Alloys and Compounds 2020, 819, 153032. [Google Scholar] [CrossRef]
- Liu, Q.L.; Zhao, Z.Y.; Yi, J.H. Excess oxygen in delafossite CuFeO2+ δ: Synthesis, characterization, and applications in solar energy conversion. Chemical Engineering Journal 2020, 396, 125290. [Google Scholar] [CrossRef]
- Dong, X.D.; Zhao, Z.Y. Boosting and regulating solar energy conversion performance of delafossite AgFeO 2 by spin polarization. Journal of Materials Chemistry A 2022, 10, 4800–4816. [Google Scholar] [CrossRef]
- Zhao, R.D.; Zhang, Y.M.; Liu, Q.L.; Zhao, Z.Y. Effects of the preparation process on the photocatalytic performance of delafossite CuCrO2. Inorganic Chemistry 2020, 59, 16679–16689. [Google Scholar] [CrossRef]
- Zhao, Q.M.; Zhao, Z.Y.; Liu, Q.L.; Yao, G.Y.; Dong, X.D. Delafossite CuGaO2 as promising visible-light-driven photocatalyst: synthesize, properties, and performances. Journal of Physics D: Applied Physics 2020, 53, 135102. [Google Scholar] [CrossRef]
- Ahmed, J.; Mao, Y. Synthesis, characterization and electrocatalytic properties of delafossite CuGaO2. Journal of Solid State Chemistry 2016, 242, 77–85. [Google Scholar] [CrossRef]
- Xu, Q.; Li, R.; Wang, C.; Yuan, D. Visible-light photocatalytic reduction of Cr (Ⅵ) using nano-sized delafossite (CuFeO2) synthesized by hydrothermal method. Journal of Alloys and Compounds 2017, 723, 441–447. [Google Scholar] [CrossRef]
- Díaz-García, A.K.; Lana-Villarreal, T.; Gómez, R. Sol–gel copper chromium delafossite thin films as stable oxide photocathodes for water splitting. Journal of Materials Chemistry A 2015, 3, 19683–19687. [Google Scholar] [CrossRef]
- Jang, Y.J.; Lee, J.S. Photoelectrochemical water splitting with p-type metal oxide semiconductor photocathodes. ChemSusChem 2019, 12, 1835–1845. [Google Scholar] [CrossRef]
- Jang, Y.J.; Park, Y.B.; Kim, H.E.; Choi, Y.H.; Choi, S.H.; Lee, J.S. Oxygen-intercalated CuFeO2 photocathode fabricated by hybrid microwave annealing for efficient solar hydrogen production. Chemistry of Materials 2016, 28, 6054–6061. [Google Scholar] [CrossRef]
- Prévot, M.S.; Li, Y.; Guijarro, N.; Sivula, K. Improving charge collection with delafossite photocathodes: a host–guest CuAlO 2/CuFeO 2 approach. Journal of Materials Chemistry A 2016, 4, 3018–3026. [Google Scholar] [CrossRef]
- Li, C.; He, J.; Xiao, Y.; Li, Y.; Delaunay, J.J. Earth-abundant Cu-based metal oxide photocathodes for photoelectrochemical water splitting. Energy & Environmental Science 2020, 13, 3269–3306. [Google Scholar]
- Garcia-Torregrosa, I.; Geertzema, Y.G.; Ismail, A.S.; Lee, T.L.; de Groot, F.M.; Weckhuysen, B.M. Facile Two-Step Synthesis of Delafossite CuFeO2 Photocathodes by Ultrasonic Spray Pyrolysis and Hybrid Microwave Annealing. ChemPhotoChem 2019, 3, 1238–1245. [Google Scholar] [CrossRef]
- Deng, Z.; Meng, G.; Fang, X.; Dong, W.; Shao, J.; Wang, S.; Tong, B. A novel ammonia gas sensors based on p-type delafossite AgAlO2. Journal of Alloys and Compounds 2019, 777, 52–58. [Google Scholar] [CrossRef]
- Tong, B.; Deng, Z.; Xu, B.; Meng, G.; Shao, J.; Liu, H.; ... & Fang, X. Oxygen vacancy defects boosted high performance p-type delafossite CuCrO2 gas sensors. ACS applied materials & interfaces 2018, 10, 34727–34734.
- Upadhyay, D.; Roondhe, B.; Pratap, A.; Jha, P.K. Two-dimensional delafossite cobalt oxyhydroxide as a toxic gas sensor. Applied Surface Science 2019, 476, 198–204. [Google Scholar] [CrossRef]
- Liu, H.; Cao, X.; Wu, H.; Li, B.; Li, Y.; Zhu, W. . & Huang, Y. Innovative development on a p-type delafossite CuCrO2 nanoparticles based triethylamine sensor. Sensors and Actuators B: Chemical 2020, 324, 128743. [Google Scholar]
- Patzsch, J.; Balog, I.; Krauß, P.; Lehmann, C.W.; Schneider, J.J. Synthesis, characterization and p–n type gas sensing behaviour of CuFeO 2 delafossite type inorganic wires using Fe and Cu complexes as single source molecular precursors. RSC Advances 2014, 4, 15348–15355. [Google Scholar] [CrossRef]
- Beatriceveena, T.V.; Murthy, A.S.R.; Prabhu, E.; Gnanasekar, K.I. Wide range hydrogen sensing behavior of a silver delafossite: Performance towards long term stability, repeatability and selectivity. International Journal of Hydrogen Energy 2021, 46, 2824–2834. [Google Scholar] [CrossRef]
- Kong, L.; Xu, S.; Liu, H.; Wu, X.; Tu, X.; Bo, M.; Zhu, W. Hybridized Ag-CuCrO2 Nanostructured Composites for Enhanced Gas Sensing. ACS Applied Nano Materials 2022, 5, 12690–12698. [Google Scholar] [CrossRef]
- Liu, H.; Zhao, T.; Kong, L.; Cao, X.; Zhu, W.; Huang, Y.; Bo, M. Twinning enhanced electrical conductivity and surface activity of nanostructured CuCrO2 gas sensor. Sensors and Actuators B: Chemical 2021, 338, 129845. [Google Scholar] [CrossRef]
- Du, Z.; Xiong, D.; Verma, S.K.; Liu, B.; Zhao, X.; Liu, L.; Li, H. A low temperature hydrothermal synthesis of delafossite CuCoO 2 as an efficient electrocatalyst for the oxygen evolution reaction in alkaline solutions. Inorganic Chemistry Frontiers 2018, 5, 183–188. [Google Scholar] [CrossRef]
- Kurita, K.; Yagisawa, M.; Okazaki, R. Electrical resistivity and thermopower of hole-doped delafossite CuCoO2 polycrystals. Japanese Journal of Applied Physics 2021, 60, 013001. [Google Scholar] [CrossRef]
- Bouakaz, H.; Abbas, M.; Brahimi, R.; Trari, M. Physical properties of the delafossite CuCoO2 synthesized by co-precipitation/hydrothermal route. Materials Science in Semiconductor Processing 2021, 136, 106132. [Google Scholar] [CrossRef]
- Zhang, Y.M.; Zhao, Z.Y.; Zhao, Y.K.; Wang, C.X. One-pot synthesis of delafossite CuCoO2 microcrystal as visible-light-driven photocatalyst. Journal of Materials Science 2022, 57, 18687–18710. [Google Scholar] [CrossRef]
- Xiong, D.; Du, Z.; Li, H.; Xu, J.; Li, J.; Zhao, X.; Liu, L. Polyvinylpyrrolidone-assisted hydrothermal synthesis of CuCoO2 nanoplates with enhanced oxygen evolution reaction performance. ACS Sustainable Chemistry & Engineering 2018, 7, 1493–1501. [Google Scholar]
- Gao, H.; Yang, M.; Du, Z.; Liu, X.; Dai, X.; Lin, K.; ... & Xiong, D. Metal–organic framework derived bimetal oxide CuCoO 2 as efficient electrocatalyst for the oxygen evolution reaction. Dalton Transactions 2022, 51, 5997–6006.
- Gao, H.; Liu, X.; Han, N.; Shi, L.; Wang, L.; Mi, Y.; ... & Xiong, D. Nanocrystals of CuCoO 2 derived from MOFs and their catalytic performance for the oxygen evolution reaction. Dalton Transactions 2022, 51, 11536–11546.
- Du, Z.; Qian, J.; Bai, J.; Li, H.; Wang, M.; Zhao, X.; Xiong, D. Surfactant-modified hydrothermal synthesis of Ca-doped CuCoO2 nanosheets with abundant active sites for enhanced electrocatalytic oxygen evolution. Inorganic Chemistry 2020, 59, 9889–9899. [Google Scholar] [CrossRef]
- Yang, M.; Han, N.; Shi, L.; Gao, H.; Liu, X.; Mi, Y.; ... & Xiong, D. Effect of nickel doping on the structure, morphology and oxygen evolution reaction performance of Cu-BTC derived CuCoO 2. Dalton Transactions 2022, 51, 8757–8765.
- Beekman, M.; Salvador, J.; Shi, X.; Nolas, G.S.; Yang, J. Characterization of delafossite-type CuCoO2 prepared by ion exchange. Journal of alloys and compounds 2010, 489, 336–338. [Google Scholar] [CrossRef]
- Toyoda, K.; Hinogami, R.; Miyata, N.; Aizawa, M. Calculated descriptors of catalytic activity for water electrolysis anode: application to delafossite oxides. The Journal of Physical Chemistry C 2015, 119, 6495–6501. [Google Scholar] [CrossRef]
- Miyata, N.; Toyoda, K.; Hinogami, R.; Katayama, M.; Inada, Y.; Ohta, T. Spin states investigation of delafossite oxides by means of X-ray absorption and photoemission spectroscopy. Journal of Solid State Chemistry 2019, 275, 83–87. [Google Scholar] [CrossRef]
- Upadhyay, D.K. (2021). Investigation of Structural, Electronic, Magnetic and Dynamical Properties of Transition Metal Doped Delafossite-Type Oxides (Doctoral dissertation, Maharaja Sayajirao University of Baroda (India)).
- Burlet, C.; Goethals, H.; Vanbrabant, Y. Delafossite structure of heterogenite polytypes (HCoO2) by Raman and infrared micro-spectroscopy. Spectrochimica Acta Part A: Molecular and Biomolecular Spectroscopy 2016, 159, 90–97. [Google Scholar] [CrossRef] [PubMed]
- Du, Z.; Qian, J.; Bai, J.; Li, H.; Wang, M.; Zhao, X.; Xiong, D. Surfactant-modified hydrothermal synthesis of Ca-doped CuCoO2 nanosheets with abundant active sites for enhanced electrocatalytic oxygen evolution. Inorganic Chemistry 2020, 59, 9889–9899. [Google Scholar] [CrossRef] [PubMed]
- Du, Z.; Xiong, D.; Qian, J.; Zhang, T.; Bai, J.; Fang, D.; Li, H. Investigation of the structural, optical and electrical properties of Ca 2+ doped CuCoO 2 nanosheets. Dalton Transactions 2019, 48, 13753–13759. [Google Scholar] [CrossRef]
- Gao, H.; Liu, X.; Han, N.; Shi, L.; Wang, L.; Mi, Y.; ... & Xiong, D. Nanocrystals of CuCoO2 derived from MOFs and their catalytic performance for the oxygen evolution reaction. Dalton Transactions 2022, 51, 11536–11546.
- Isacfranklin, M.; Yuvakkumar, R.; Ravi, G.; Pannipara, M.; Al-Sehemi, A.G. CuCoO2 electrodes for supercapacitor applications. Materials Letters 2021, 296, 129930. [Google Scholar] [CrossRef]
- Feng, Y.; Liao, J.; Chen, X.; Liao, Q.; Wang, H.; Ji, S.; ... & He, M. Co3 O4–CuCoO2 hybrid nanoplates as a low-cost and highly active catalyst for producing hydrogen from ammonia borane. New Journal of Chemistry 2021, 45, 2688–2695.
- Du, Z.; Qian, J.; Zhang, T.; Ji, C.; Wu, J.; Li, H.; Xiong, D. Solvothermal synthesis of CuCoO 2 nanoplates using zeolitic imidazolate framework-67 (ZIF-67) as a co-derived precursor. New Journal of Chemistry 2019, 43, 15233–15239. [Google Scholar] [CrossRef]
- Ding, J.; Li, L.; Zheng, H.; Zuo, Y.; Wang, X.; Li, H.; ... & Li, G. Co3O4–CuCoO2 nanomesh: an interface-enhanced substrate that simultaneously promotes CO adsorption and O2 activation in H2 purification. ACS Applied Materials & Interfaces 2019, 11, 6042–6053.
- Zhong, X.; He, H.; Du, J.; Ren, Q.; Huang, J.; Tang, Y.; ... & Zhou, Y. Boosting solar water oxidation activity and stability of BiVO4 photoanode through the Co-catalytic effect of CuCoO2. Electrochimica Acta 2019, 304, 301–311.
- Kurita, K.; Yagisawa, M.; Okazaki, R. Electrical resistivity and thermopower of hole-doped delafossite CuCoO2 polycrystals. Japanese Journal of Applied Physics 2021, 60, 013001. [Google Scholar] [CrossRef]
- Dursun, S.; Akyıldız, H.; Kalem, V. Production of CuCoO2 nanoparticle/SnO2 nanofiber heterostructures for visible light photocatalytic applications. Journal of Photochemistry and Photobiology A: Chemistry 2023, 434, 114233. [Google Scholar] [CrossRef]
- Xing, W.; Kong, L.; Zhang, X.; Zhang, Y.; Tu, X.; Yu, J.; ... & Huang, J. Enhanced Methanol Electrooxidation Performance Based on Pt Cluster-Decorated CuCoO2 on Carbon. ChemistrySelect 2022, 7, e202200513.
- Mariappan, K.; Chen, T.W.; Chen, S.M.; Tseng, T.W.; Bian, Y.; Sun, T.T.; ... & Yu, J. Fabrication of Hexagonal CuCoO2 Modified Screen-Printed Carbon Electrode for the Selective Electrochemical Detection of Furaltadone. Int. J. Electrochem. Sci 2022, 17, 2.
- Ruttanapun, C.; Sa.nguan-cheep,M.; Kahatta, S.; Buranasiri, P.; Jindajitawat, P. (2013, June). Optical and electronic transport properties of p-type CuCoO2 transparent conductive oxide. In ICPS 2013: International Conference on Photonics Solutions (Vol. 8883, pp. 319-325). SPIE.
- Makuła, P.; Pacia, M.; Macyk, W. How To Correctly Determine the Band Gap Energy of Modified Semiconductor Photocatalysts Based on UV–Vis Spectra. J. Phys. Chem. Lett. 2018, 9, 6814–6817. [Google Scholar] [CrossRef]
- Müller, F.; Ferreira, C.A.; Franco, L.; Puiggalí, J.; Alemán, C.; Armelin, E. New sulfonated polystyrene and styrene-ethylene/butylene styrene block copolymers for applications in electrodialysis. J Phys Chem B 2012, 116, 11767–79. [Google Scholar] [CrossRef]
- TSoboleva; Xie, Z.; Shi, Z.; Tsang, E.; Navessin, T.; Holdcroft, S. Investigation of the through-plane impedance technique for evaluation of anisotropy of proton conducting polymer membranes. Electroanal. Chem. 2008, 622, 145. [CrossRef]
- Blachot, J.F.; Diat, O.; Putaux, J.L.; Rollet, A.L.; Rubatat, L.; Vallois, C.; Muller, M.; Gebel, G. Anisotropy of structure and transport properties in sulfonated polyimide membranes. J. Membr. Sci. 2003, 214, 31. [Google Scholar] [CrossRef]
- Zawodzinski, T.A., Jr.; Derouin, C.; Radzinski, S.; Sherman, R.J.; Smith, V.T.; Springer, T.E.; Gottesfeld, S. Water Uptake by and Transport Through Nafion® 117 Membranes. J. Electrochem. Soc. 1993, 140, 1041. [Google Scholar] [CrossRef]
- Escorihuela, J.; Narducci, R.; Compañ, V.; Costantino, F. Proton conductivity of composite polyelectrolyte membranes with metal-organic frameworks for fuel cell applications. Adv. Mater. Interfaces 2019, 6, 1801146. [Google Scholar] [CrossRef]
- Sacco, A. Electrochemical Impedance Spectroscopy: Fundamentals and Application in Dye-Sensitized Solar Cells. Renewable and Sustainable Energy Reviews 2017, 201779, 814–829. [Google Scholar] [CrossRef]
- Barsoukov, E.; Macdonald, J.R. Impedance Spectroscopy: Theory, Experiment, and Applications; John Wiley & Sons, Inc.: Hoboken, New Jersey, 2005. [Google Scholar]
- Jun, Y.S.; Um, J.G.; Jiang, G.; Lui, G.; Yu, A. Ultra-large sized graphene nano-platelets (GnPs) incorporated polypropylene (PP)/GnPs composites engineered by melt compounding and its thermal, mechanical, and electrical properties. Composites Part B: Engineering 2018, 133, 218–225. [Google Scholar] [CrossRef]
- Vega-Moreno, J.; Lemus-Santana, A.A.; Reguera, E.; Andrio, A.; Compañ, V. High proton conductivity at low and moderate temperature in a simple family of Prussian blue analogs, divalent transition metal hexacyanocobaltates (III). Electrochimica Acta 2020, 360, 136959. [Google Scholar] [CrossRef]
- del Castillo, R.M.; del Castillo, L.F.; Calles, A.G.; Compañ, V. Experimental and computational conductivity study of multilayer graphene in polypropylene nanocomposites. J. Mater. Chem. C, 2018, 6, 7232. [Google Scholar] [CrossRef]
- Sarjanović, J.; Stojić, M.; Rubčić, M.; Pavić, L.; Pisk, J. Impedance Spectroscopy as a Powerful Tool for Researching Molybdenum-Based Materials with Schiff Base Hydrazones. Materials 2023, 16, 1064. [Google Scholar] [CrossRef]
- Lin, P.; Sun, X.M. A Universal Interpretation of Three Types of Resonator-based Controllers. IEEE Transactions on Circuits and Systems II: Express Briefs 2023. [Google Scholar] [CrossRef]
- Dong, J.; Gong, C.; Bao, J.; Zhu, L.; Chen, H.; Wang, Z. Power Synchronization Compensation Strategy Based on Second-Order Compensation Links for Voltage-Controlled Inverters in Microgrids. Journal of Modern Power Systems and Clean Energy 2023. [Google Scholar]
- García-Bernabé, A.; Rivera, A.; Granados, A.; Luis, S.V.; Compañ, V. Ionic transport on composite polymers containing covalently attached and absorbed ionic liquid fragments. Electrochimica Acta 2016, 213, 887–897. [Google Scholar] [CrossRef]
- Andrio, A.; Hernández, S.I.; García-Alcántara, C.; del Castillo, L.F.; Compañ, V.; Santamaría-Holek, I. Temperature dependence of anomalous protonic and superprotonic transport properties in mixed salts based on CsH2PO4. Phys. Chem. Chem. Phys. 2019, 21, 12948. [Google Scholar] [CrossRef]
- Fuentes, I.; Mostazo-López, M.J.; Kelemen, Z.; Compañ, V.; Andrio, A.; Morallón, E.; Cazorla-Amorós, D.; Viñas, C.; Teixidor, F. Are the Accompanying Cations of Doping Anions Influential in Conducting Organic Polymers? The Case of the Popular PEDOT. Chem. Eur. J. 2019, 25, 14308–14319. [Google Scholar] [CrossRef]
- Galindo, B.; Benedito, A.; Gimenez, E.; Compañ, V. Comparative study between the microwave heating efficiency of carbon nanotubes versus multilayer graphene in polypropylene nanocomposites. Compopsites Part B. Engineering 2016, 98, 330–338. [Google Scholar] [CrossRef]
- Valverde, D.; Garcia-Bernabé, A.; Andrio, A.; García-Verdugo, E.; Luis, S.V.; Compañ, V. Free ion diffusivity and charge concentration on cross-linked Polymeric Ionic Liquid iongels films based on sulfonated zwitterion salts and Lithium ions. Phys. Chem. Chem. Phys.; 2019, 21, 12948. [Google Scholar] [CrossRef]
- Prokhorov, Y.; Luna-Barcenas, G.; Kovalenko, Y. Interphase percolation phenomena in chitosan-graphene oxide nanocomposites, the role of water content. Express Polymer Letters 2023, 17. [Google Scholar] [CrossRef]
- Chfii, H.; Bouich, A.; Soucase, B.M.; Abdlefdil, M. A new approach for growing high-quality delafossite CuCoO2 films by spray pyrolysis through the optimization of the Cu/Co ratio. Optical Materials 2023, 135, 113229. [Google Scholar] [CrossRef]
- Saber, S.; Marí, B.; Andrio, A.; Escorihuela, J.; Khattab, N.; Eid, A.; El Nahrawy, A.; Aly, M.A.; Compañ, V. Structural and Electrochemical Analysis of CIGS: Cr Crystalline Nanopowders and Thin Films Deposited onto ITO Substrates. Nanomaterials 2021, 11, 1093. [Google Scholar] [CrossRef]
- Jonscher, A.K. The ‘universal’ dielectric response. Nature 1977, 267, 673. [Google Scholar] [CrossRef]
- Sidebottom, D.L. Dimensionality Dependence of the Conductivity Dispersion in Ionic Materials. Phys. Rev. Lett. 1999, 83, 893. [Google Scholar] [CrossRef]
- Banerjee, P.; Pal, P.; Ghosh, A.; Tarun, K.; Ion, M. Transport and relaxation in phosphoonium poly(ionic liquid) homo-and co-polymers. J. Polym. Sci.; May 2021, 1–15. [Google Scholar] [CrossRef]
- Bouich, A.; Torres, J.C.; Chfii, H.; Marí-Guaita, J.; Khattak, Y.H.; Baig, F.; ... & Palacios, P. Delafossite as hole transport layer a new pathway for efficient perovskite-based solar cells: Insight from experimental, DFT and numerical analysis. Solar Energy 2023, 250, 18–32.
- El Messaoudi, N.; El Khomri, M.; Fernine, Y.; Bouich, A.; Lacherai, A.; Jada, A.; ... & Lima, E.C. Hydrothermally engineered Eriobotrya japonica leaves/MgO nanocomposites with potential applications in wastewater treatment. Groundwater for Sustainable Development 2022, 16, 100728.
- Gilbert, T.L. Hohenberg-Kohn Theorem for Nonlocal External Potentials. Phys. Rev. B 1975, 12, 2111–2120. [Google Scholar] [CrossRef]
- Seidl, A.; Görling, A.; Vogl, P.; Majewski, J.A.; Levy, M. Generalized Kohn-Sham Schemes and the Band-Gap Problem. Phys. Rev. B 1996, 53, 3764–3774. [Google Scholar] [CrossRef] [PubMed]
- Blöchl, P.E. Projector Augmented-Wave Method. Phys. Rev. B 1994, 50, 17953–17979. [Google Scholar] [CrossRef] [PubMed]
- Krukau, A.V.; Vydrov, O.A.; Izmaylov, A.F.; Scuseria, G.E. Influence of the Exchange Screening Parameter on the Performance of Screened Hybrid Functionals. J. Chem. Phys. 2006, 125, 224106. [Google Scholar] [CrossRef] [PubMed]
- Heyd, J.; Scuseria, G.E.; Ernzerhof, M. Hybrid Functionals Based on a Screened Coulomb Potential. J. Chem. Phys. 2003, 118, 8207–8215. [Google Scholar] [CrossRef]
- Heyd, J.; Scuseria, G.E. Assessment and Validation of a Screened Coulomb Hybrid Density Functional. J. Chem. Phys. 2004, 120, 7274–7280. [Google Scholar] [CrossRef]
- Kresse, G.; Hafner, J. Ab Initio Molecular Dynamics for Open-shell Transition Metals. Phys. Rev. B 1993, 48, 13115–13118. [Google Scholar] [CrossRef]
- Kresse, G.; Furthmüller, J. Efficient Iterative Schemes for Ab Initio Total-Energy Calculations Using a Plane-Wave Basis Set. Phys. Rev. B 1996, 54, 11169–11186. [Google Scholar] [CrossRef]
- Kresse, G.; Joubert, D. From Ultrasoft Pseudopotentials to the Projector Augmented-Wave Method. Phys. Rev. B 1999, 59, 1758–1775. [Google Scholar] [CrossRef]
- Monkhorst, H.J.; Pack, J.D. Special Points for Brillouin-Zone Integrations. Phys. Rev. B 1976, 13, 5188–5192. [Google Scholar] [CrossRef]
Figure 1.
Schematic description of the synthesis process of the CuCoO2/Glass film.

Figure 2.
XRD patterns of CuCoO2 nanocrystals prepared by a) hydrothermal (CuCoO2_H ), b) sol-gel (CuCoO2_SG), and c) solid-state reaction (CuCoO2_SSR).
Figure 2.
XRD patterns of CuCoO2 nanocrystals prepared by a) hydrothermal (CuCoO2_H ), b) sol-gel (CuCoO2_SG), and c) solid-state reaction (CuCoO2_SSR).
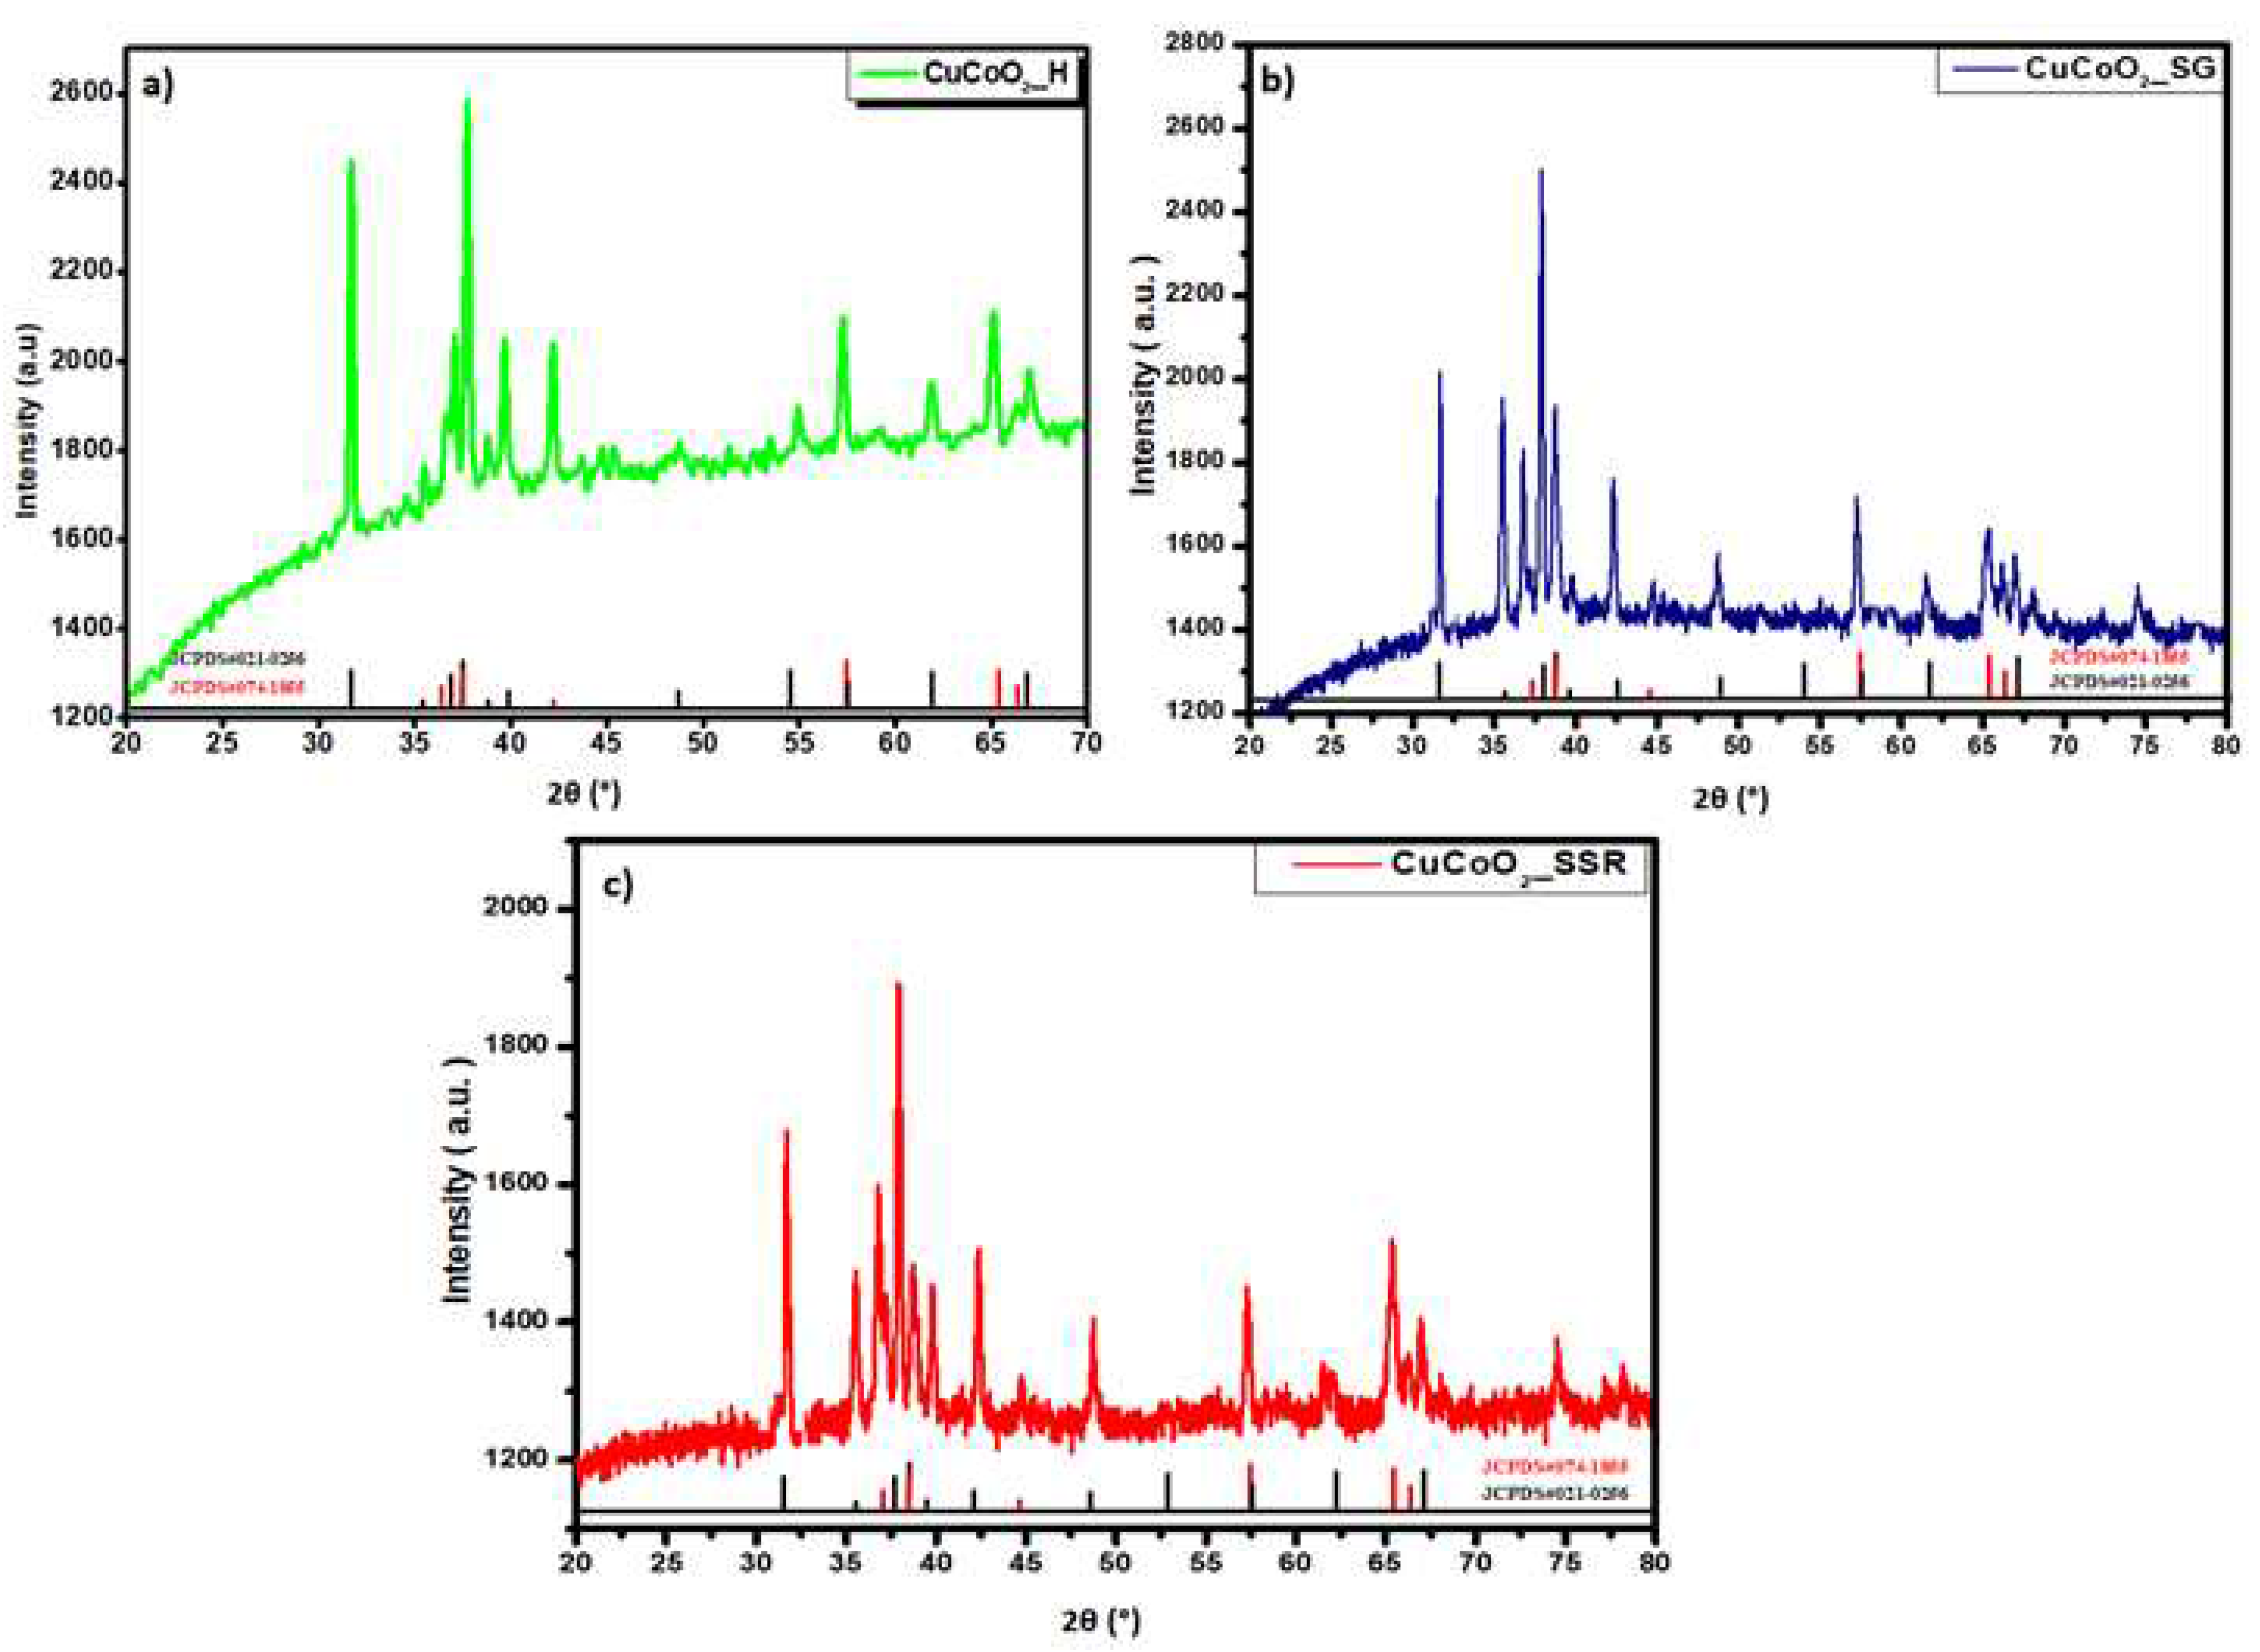
Figure 3.
XRD diffractograms of films deposited on glass substrates of a) CuCoO2_H, b) CuCoO2_SG, and c) CuCoO2_SSR.
Figure 3.
XRD diffractograms of films deposited on glass substrates of a) CuCoO2_H, b) CuCoO2_SG, and c) CuCoO2_SSR.
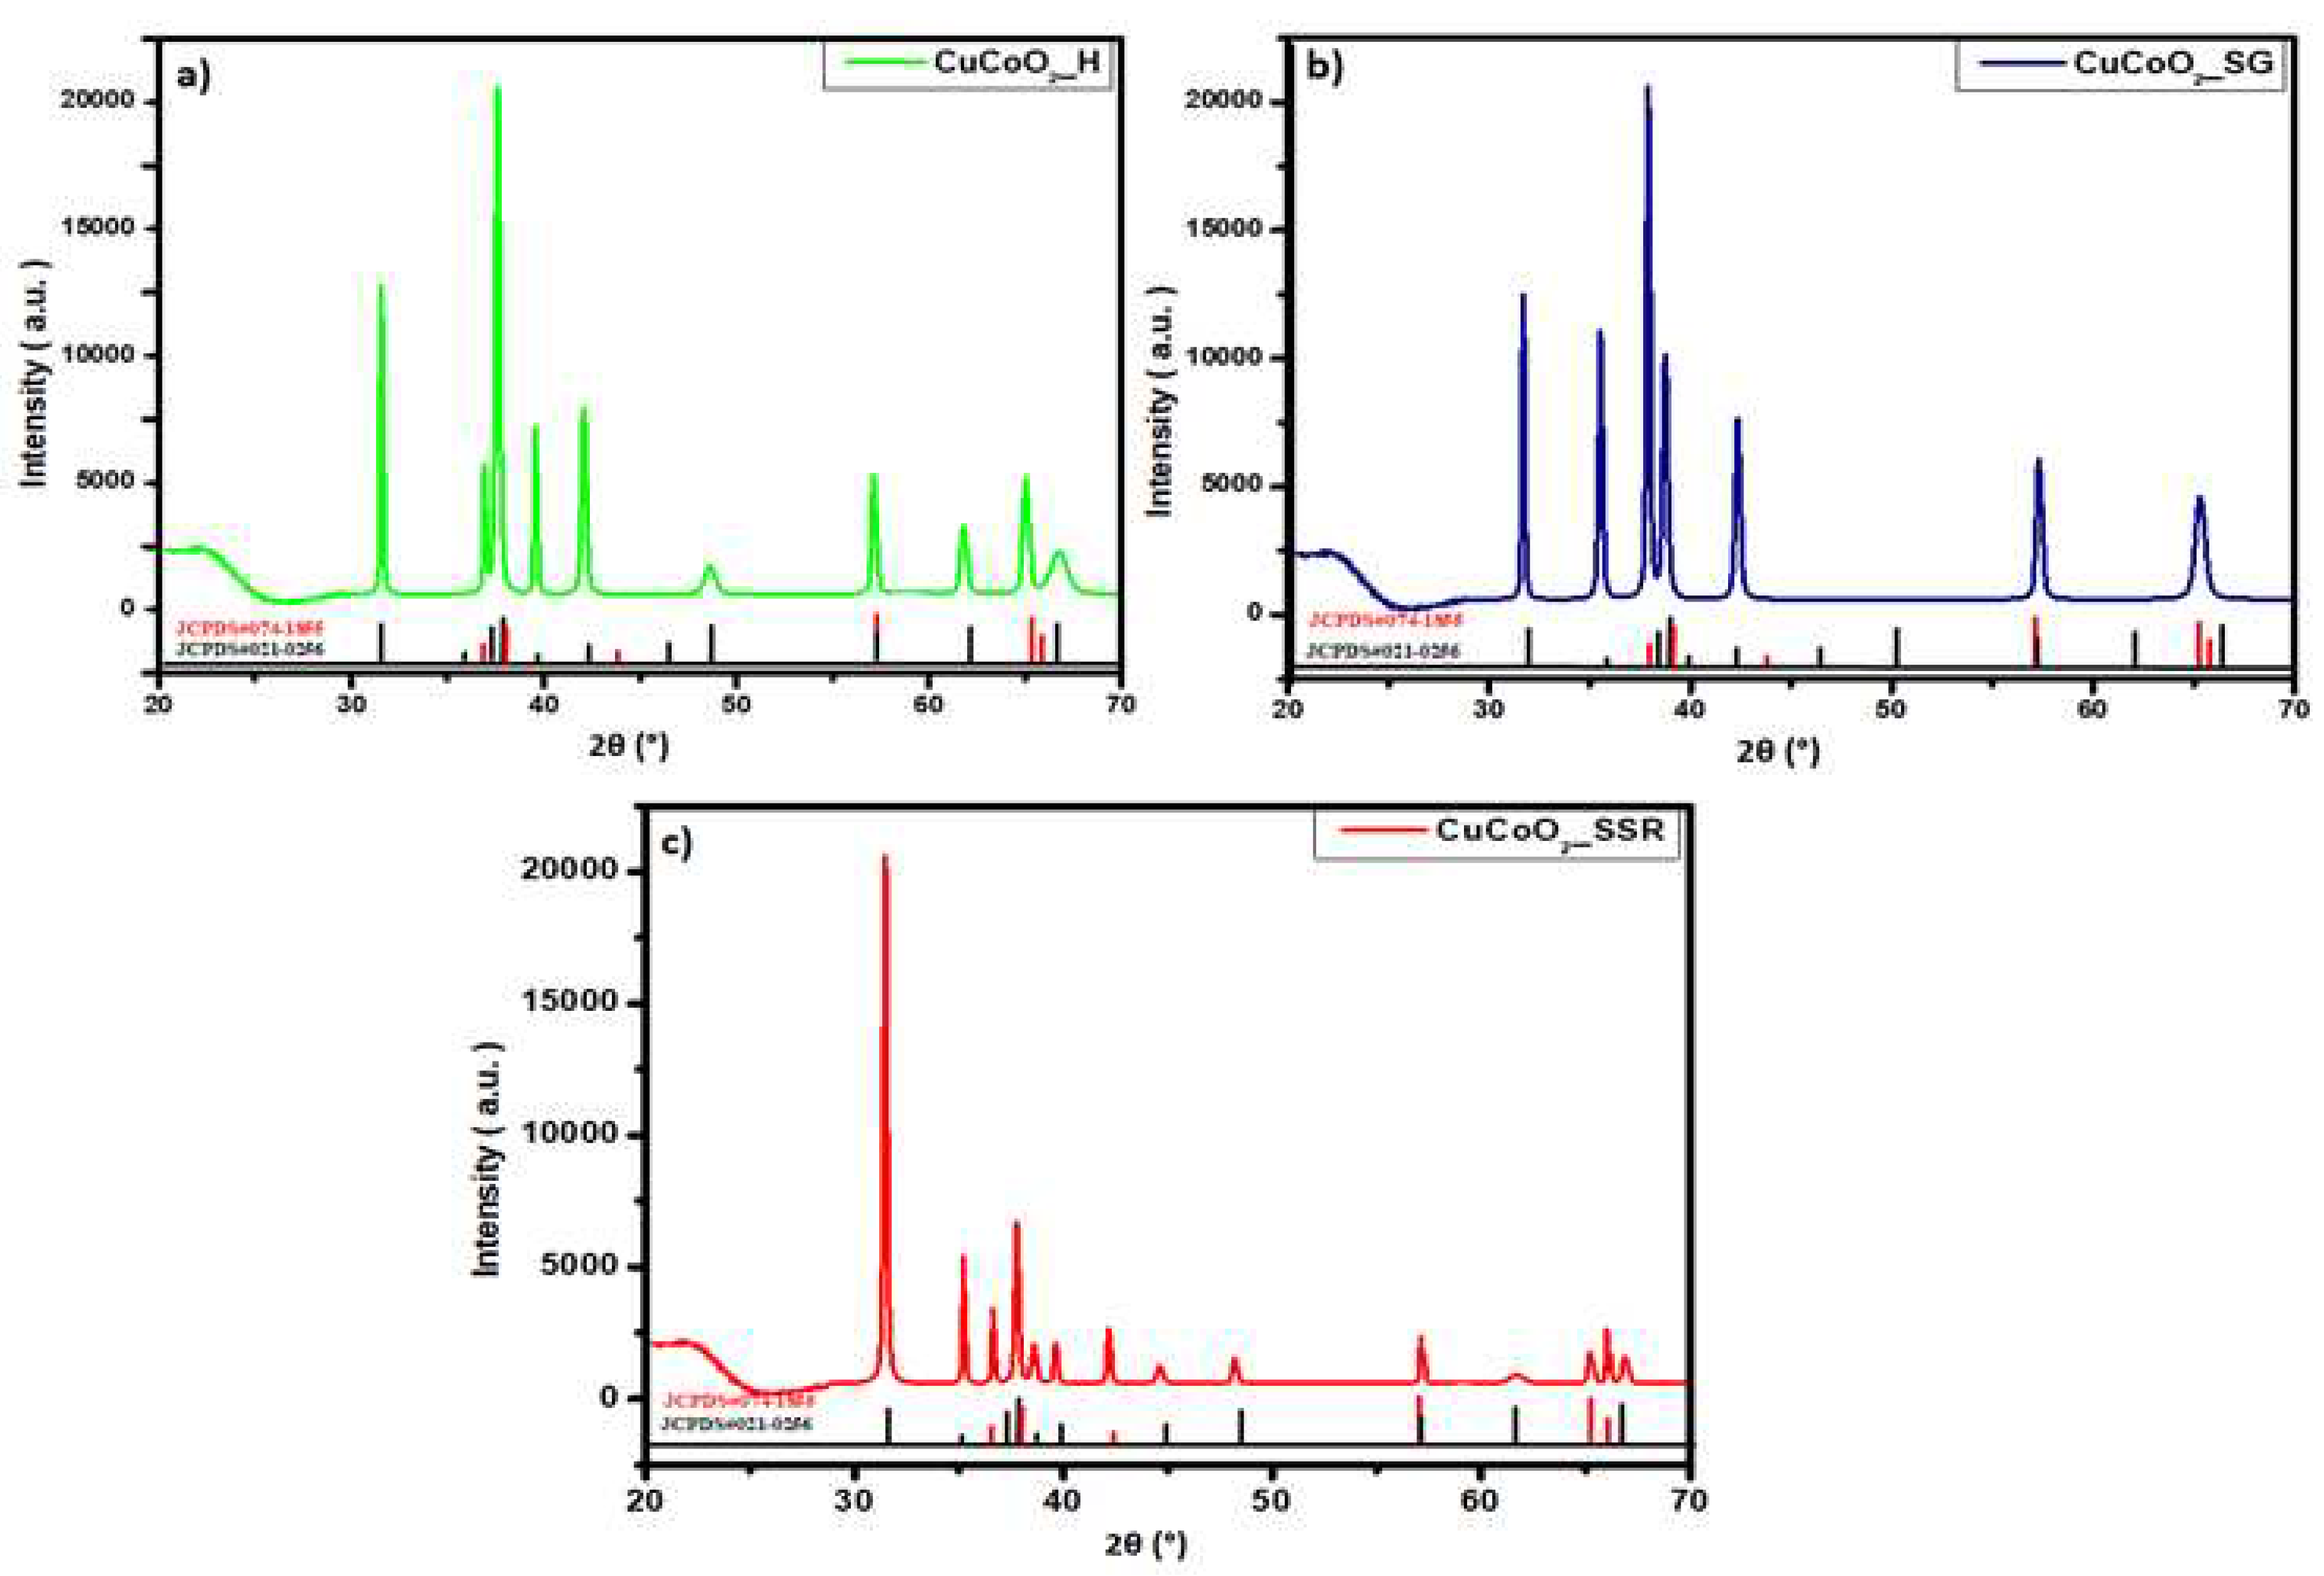
Figure 4.
FE-SEM images for the three nano-crystalline powders.
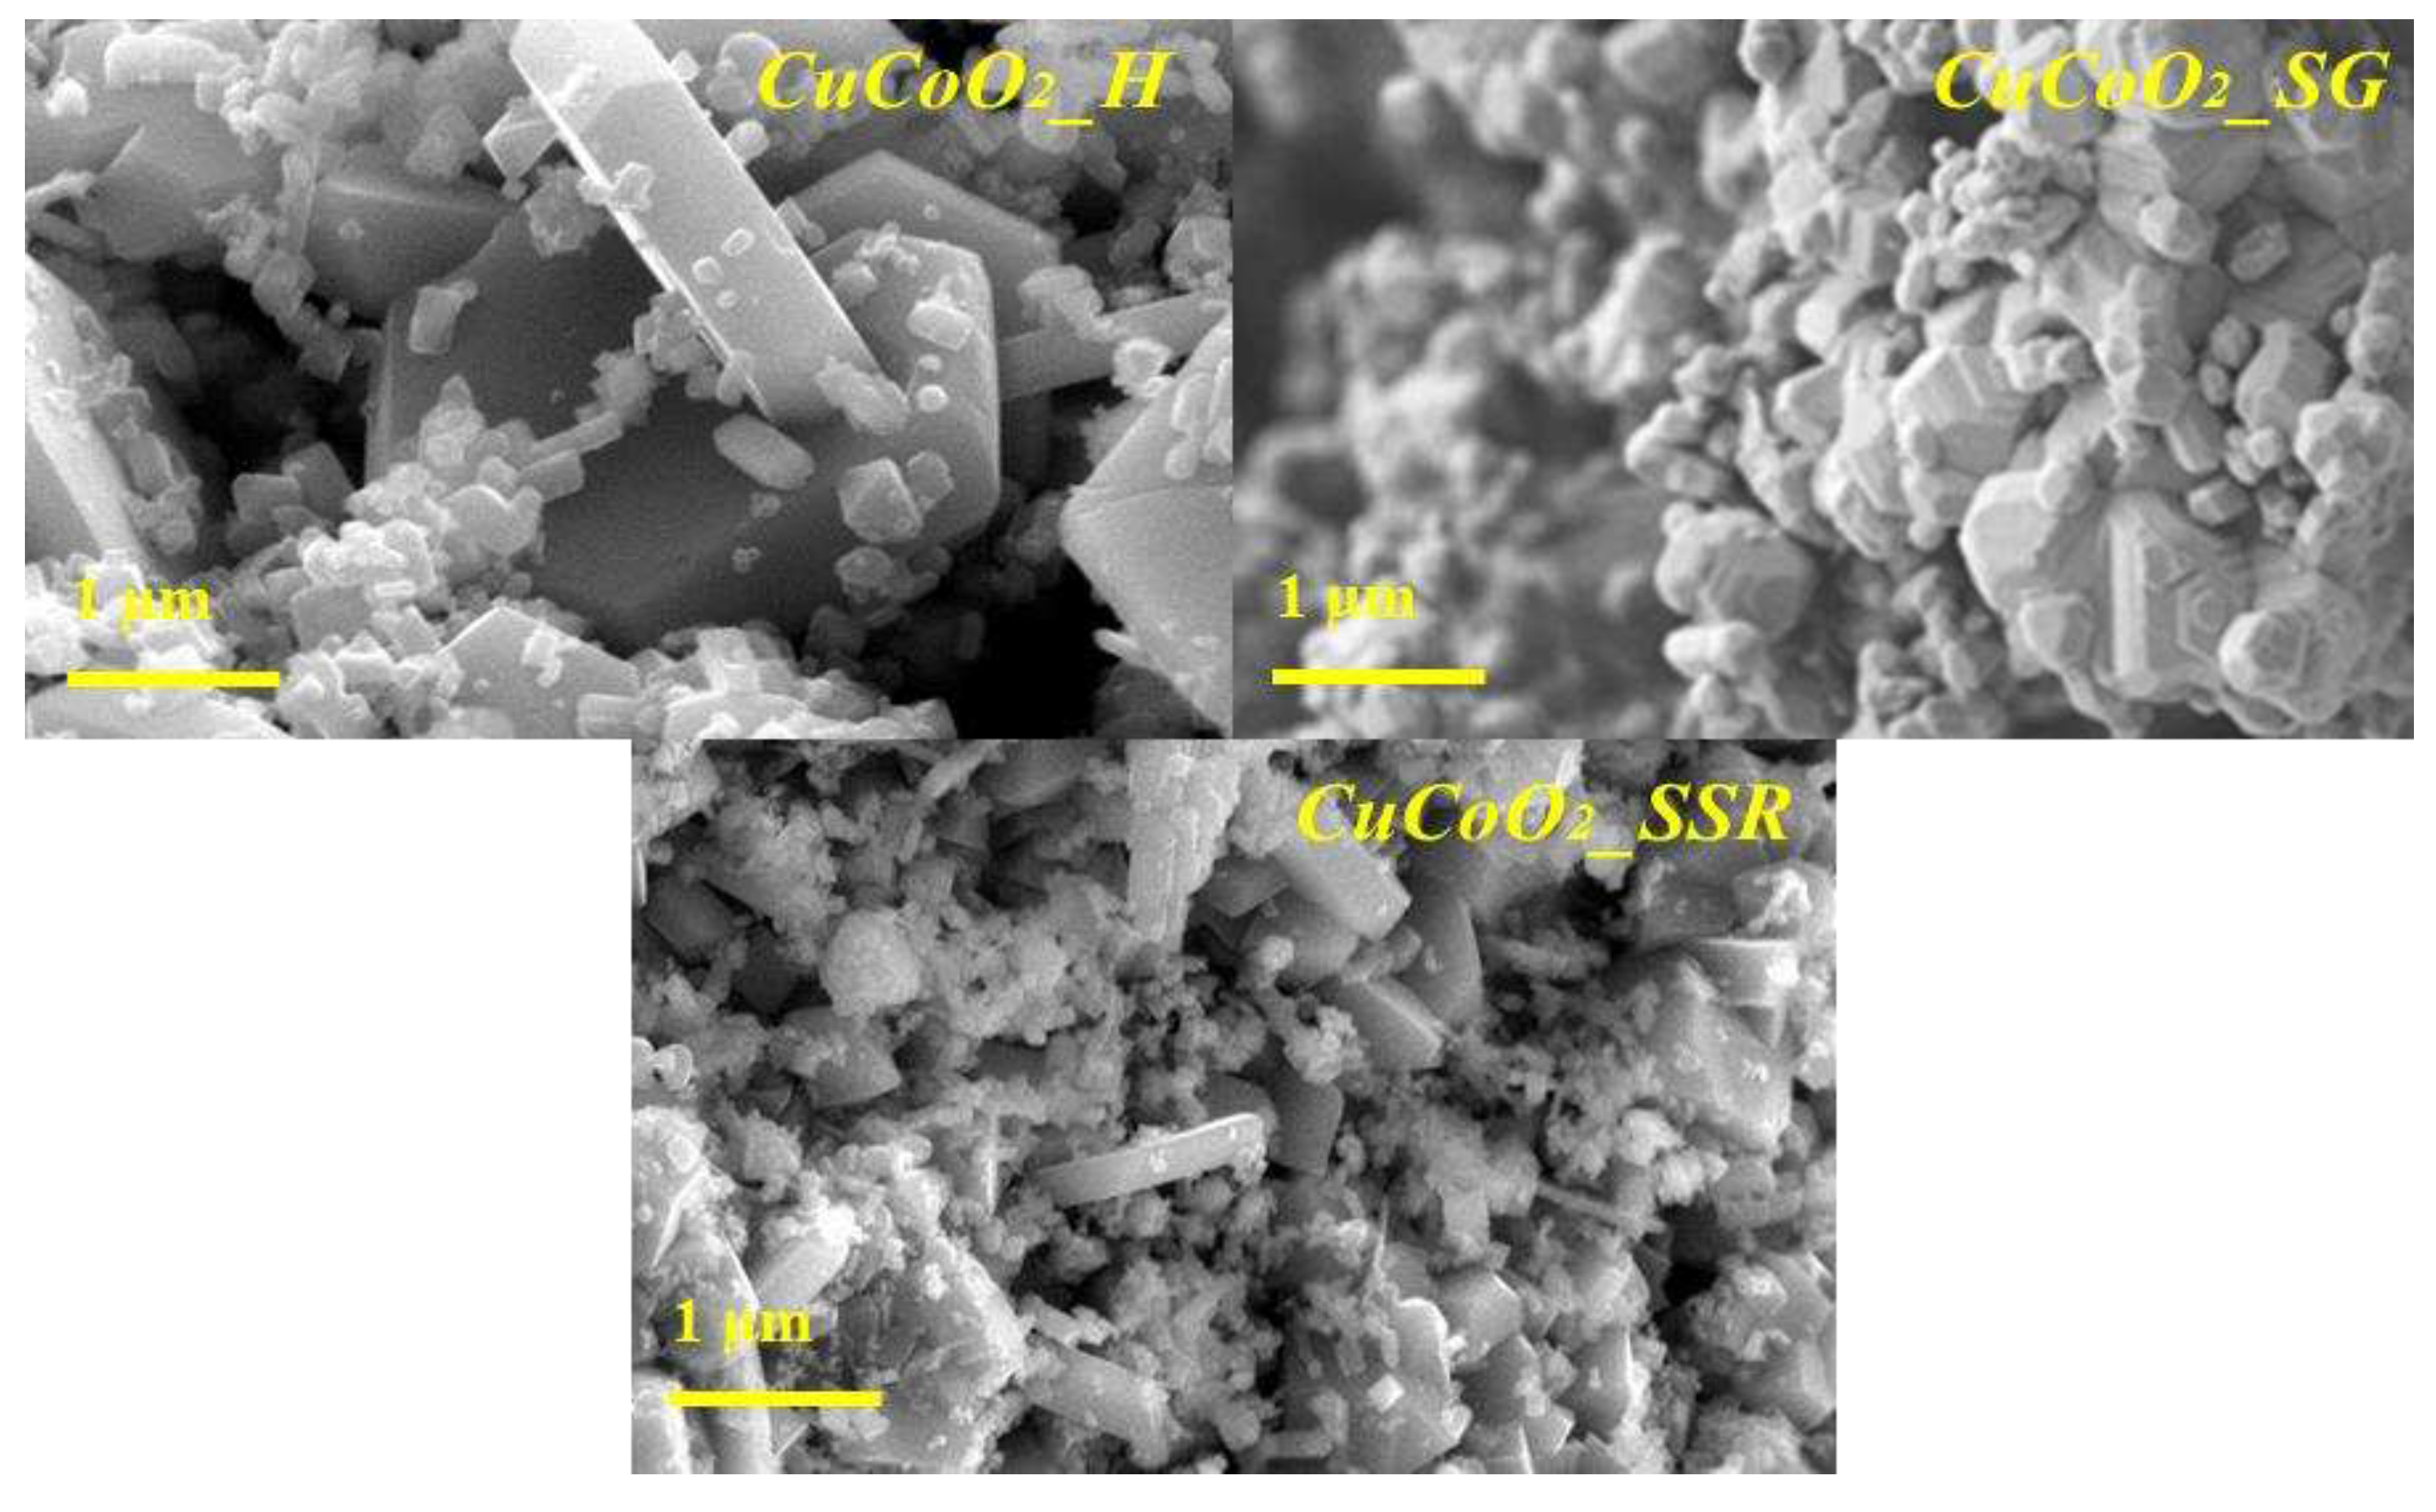
Figure 5.
FE-SEM images for CuCoO2_H, CuCoO2_SG, and CuCoO2_SSR films at 1μm.
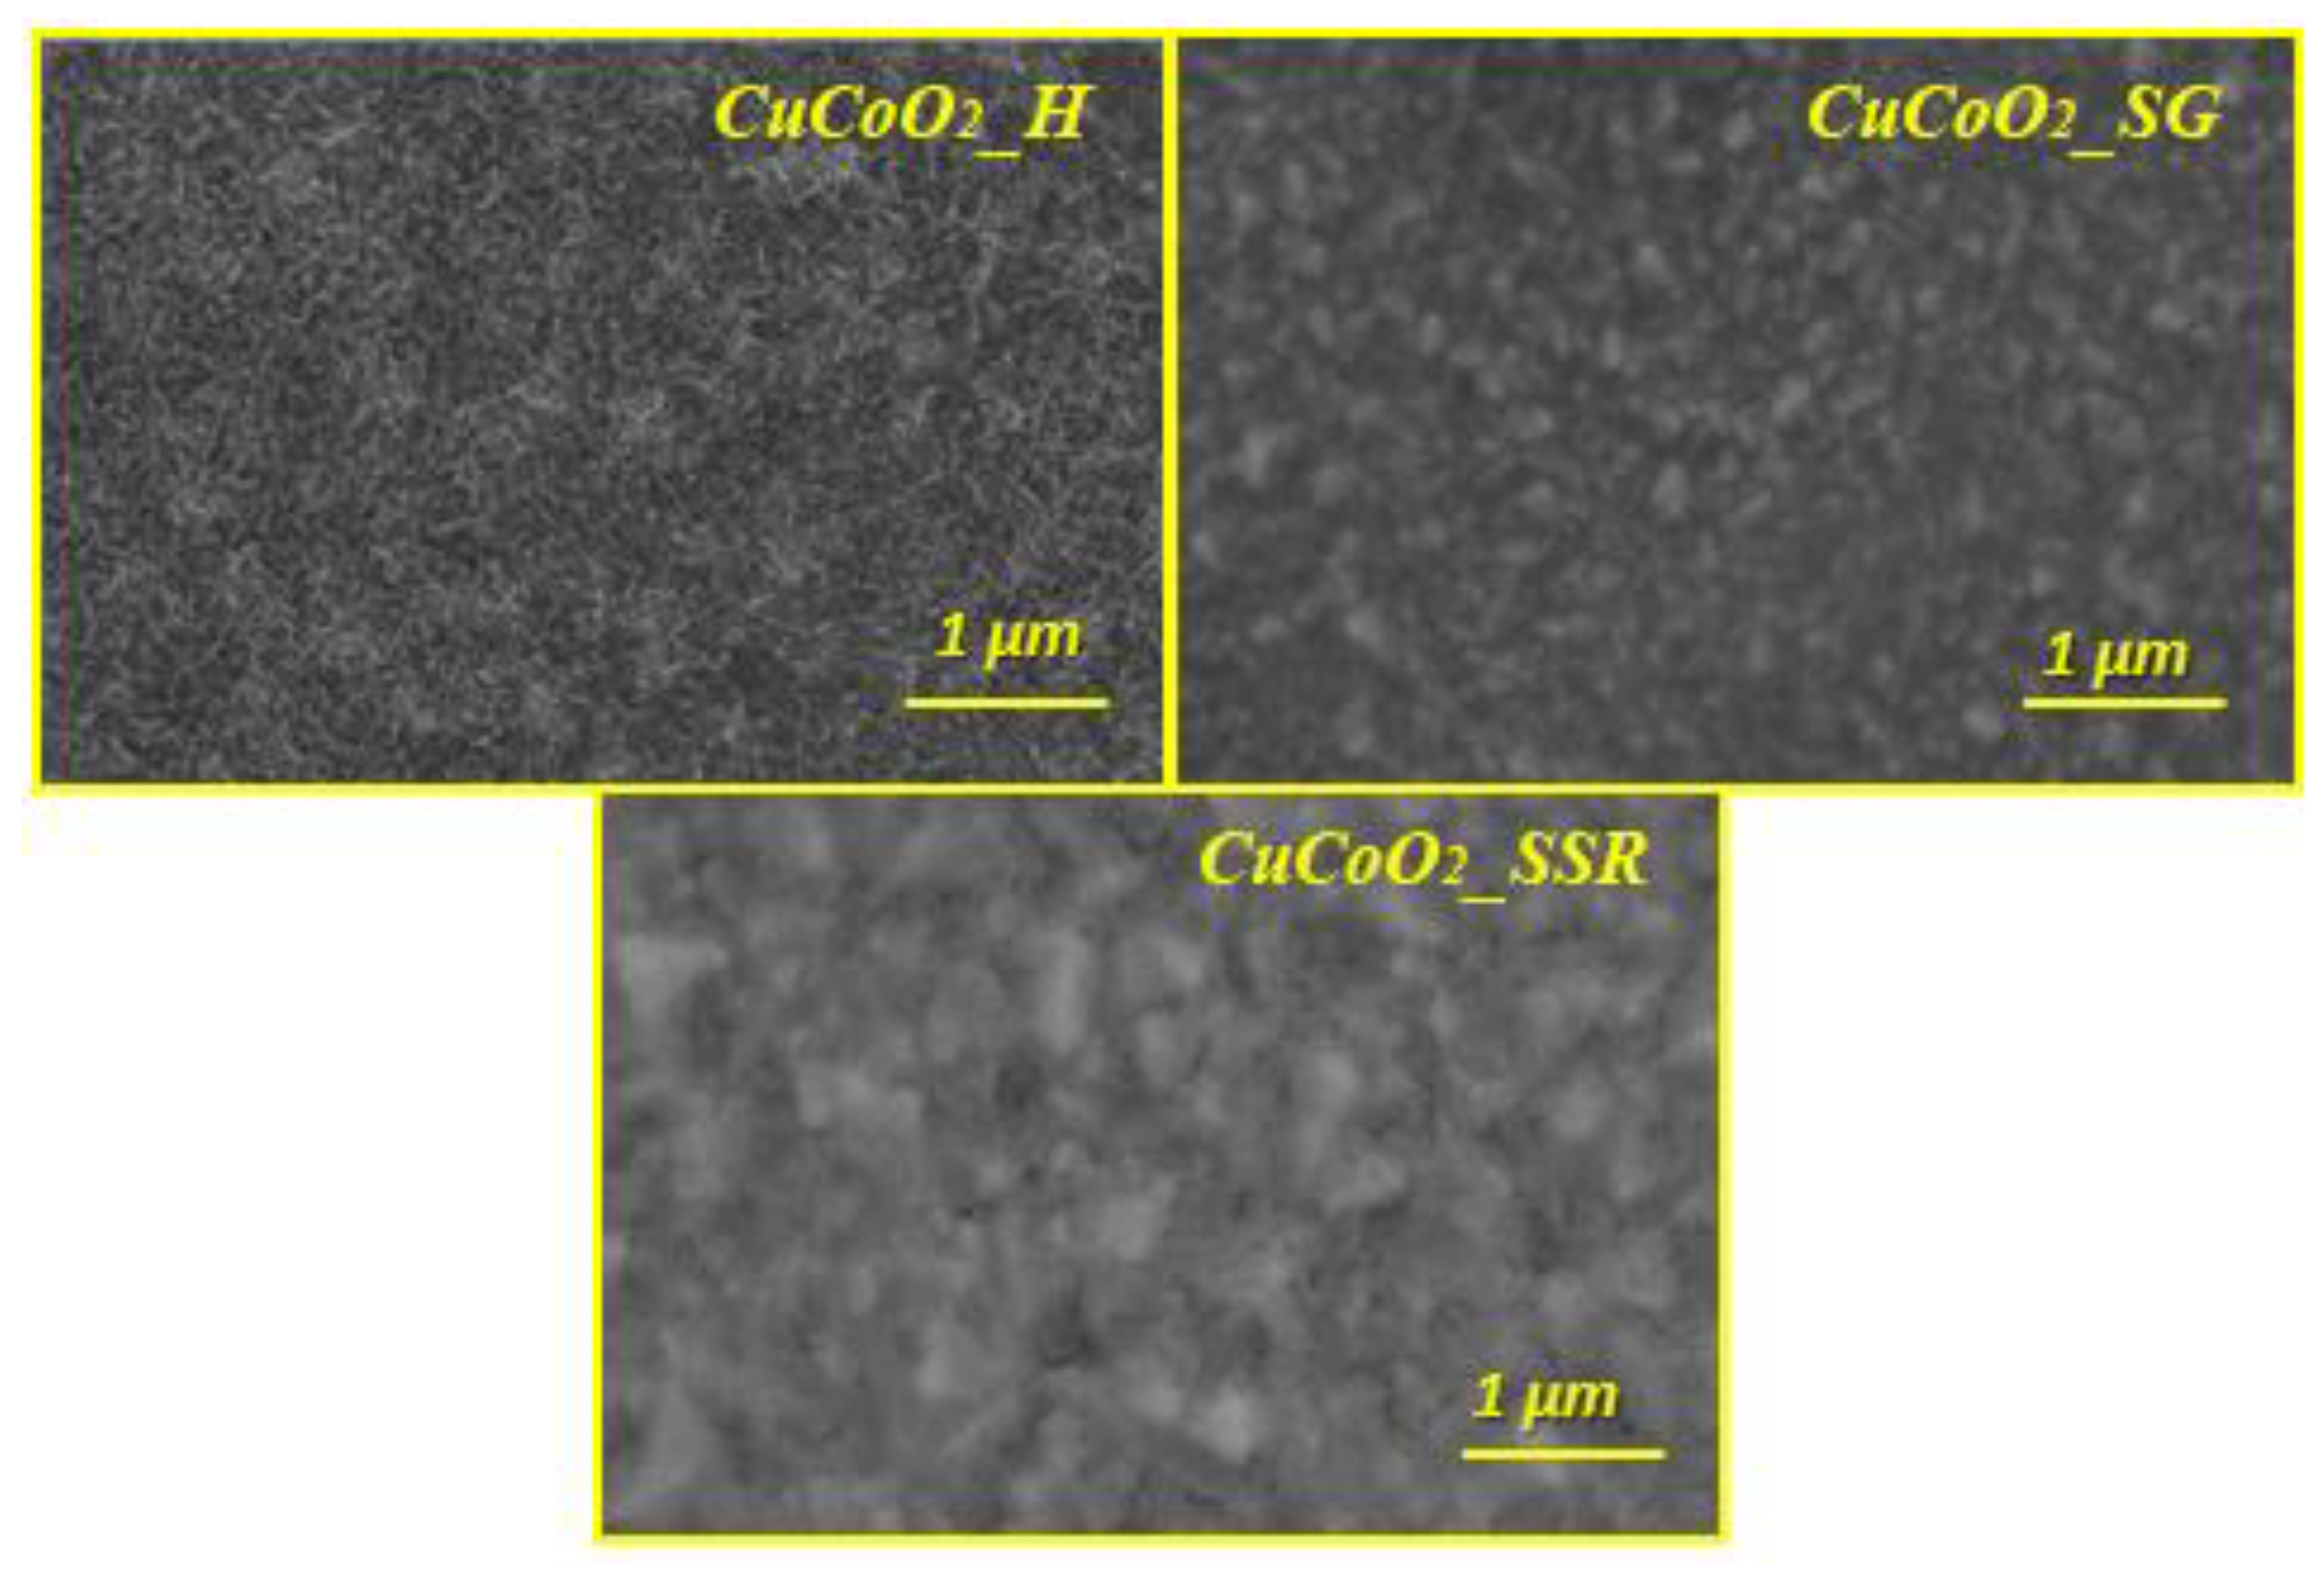
Figure 6.
HRTEM images of CuCoO2_H, CuCoO2_SG, and CuCoO2_SSR.
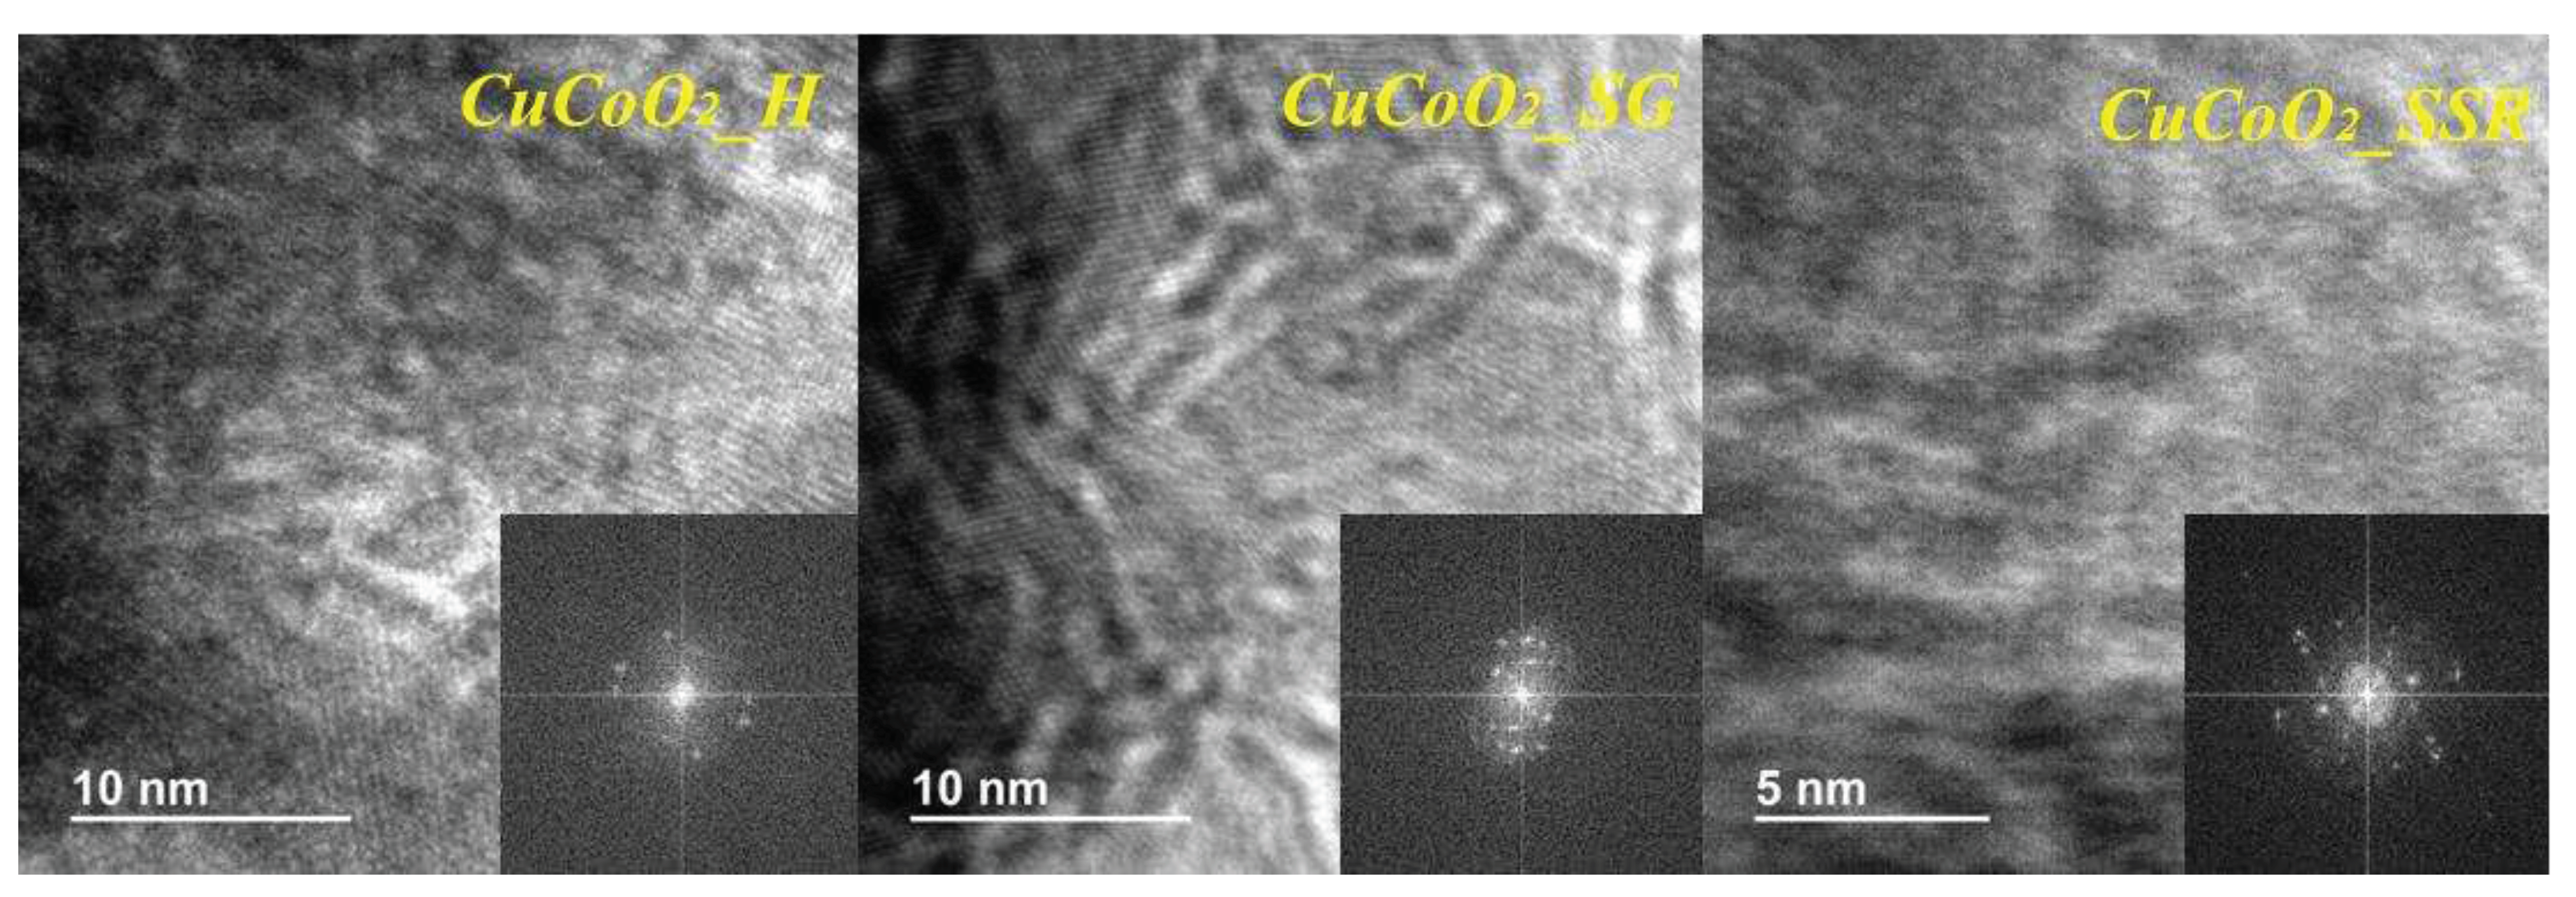
Figure 7.
Element mapping analysis of CuCoO2 with TEM.
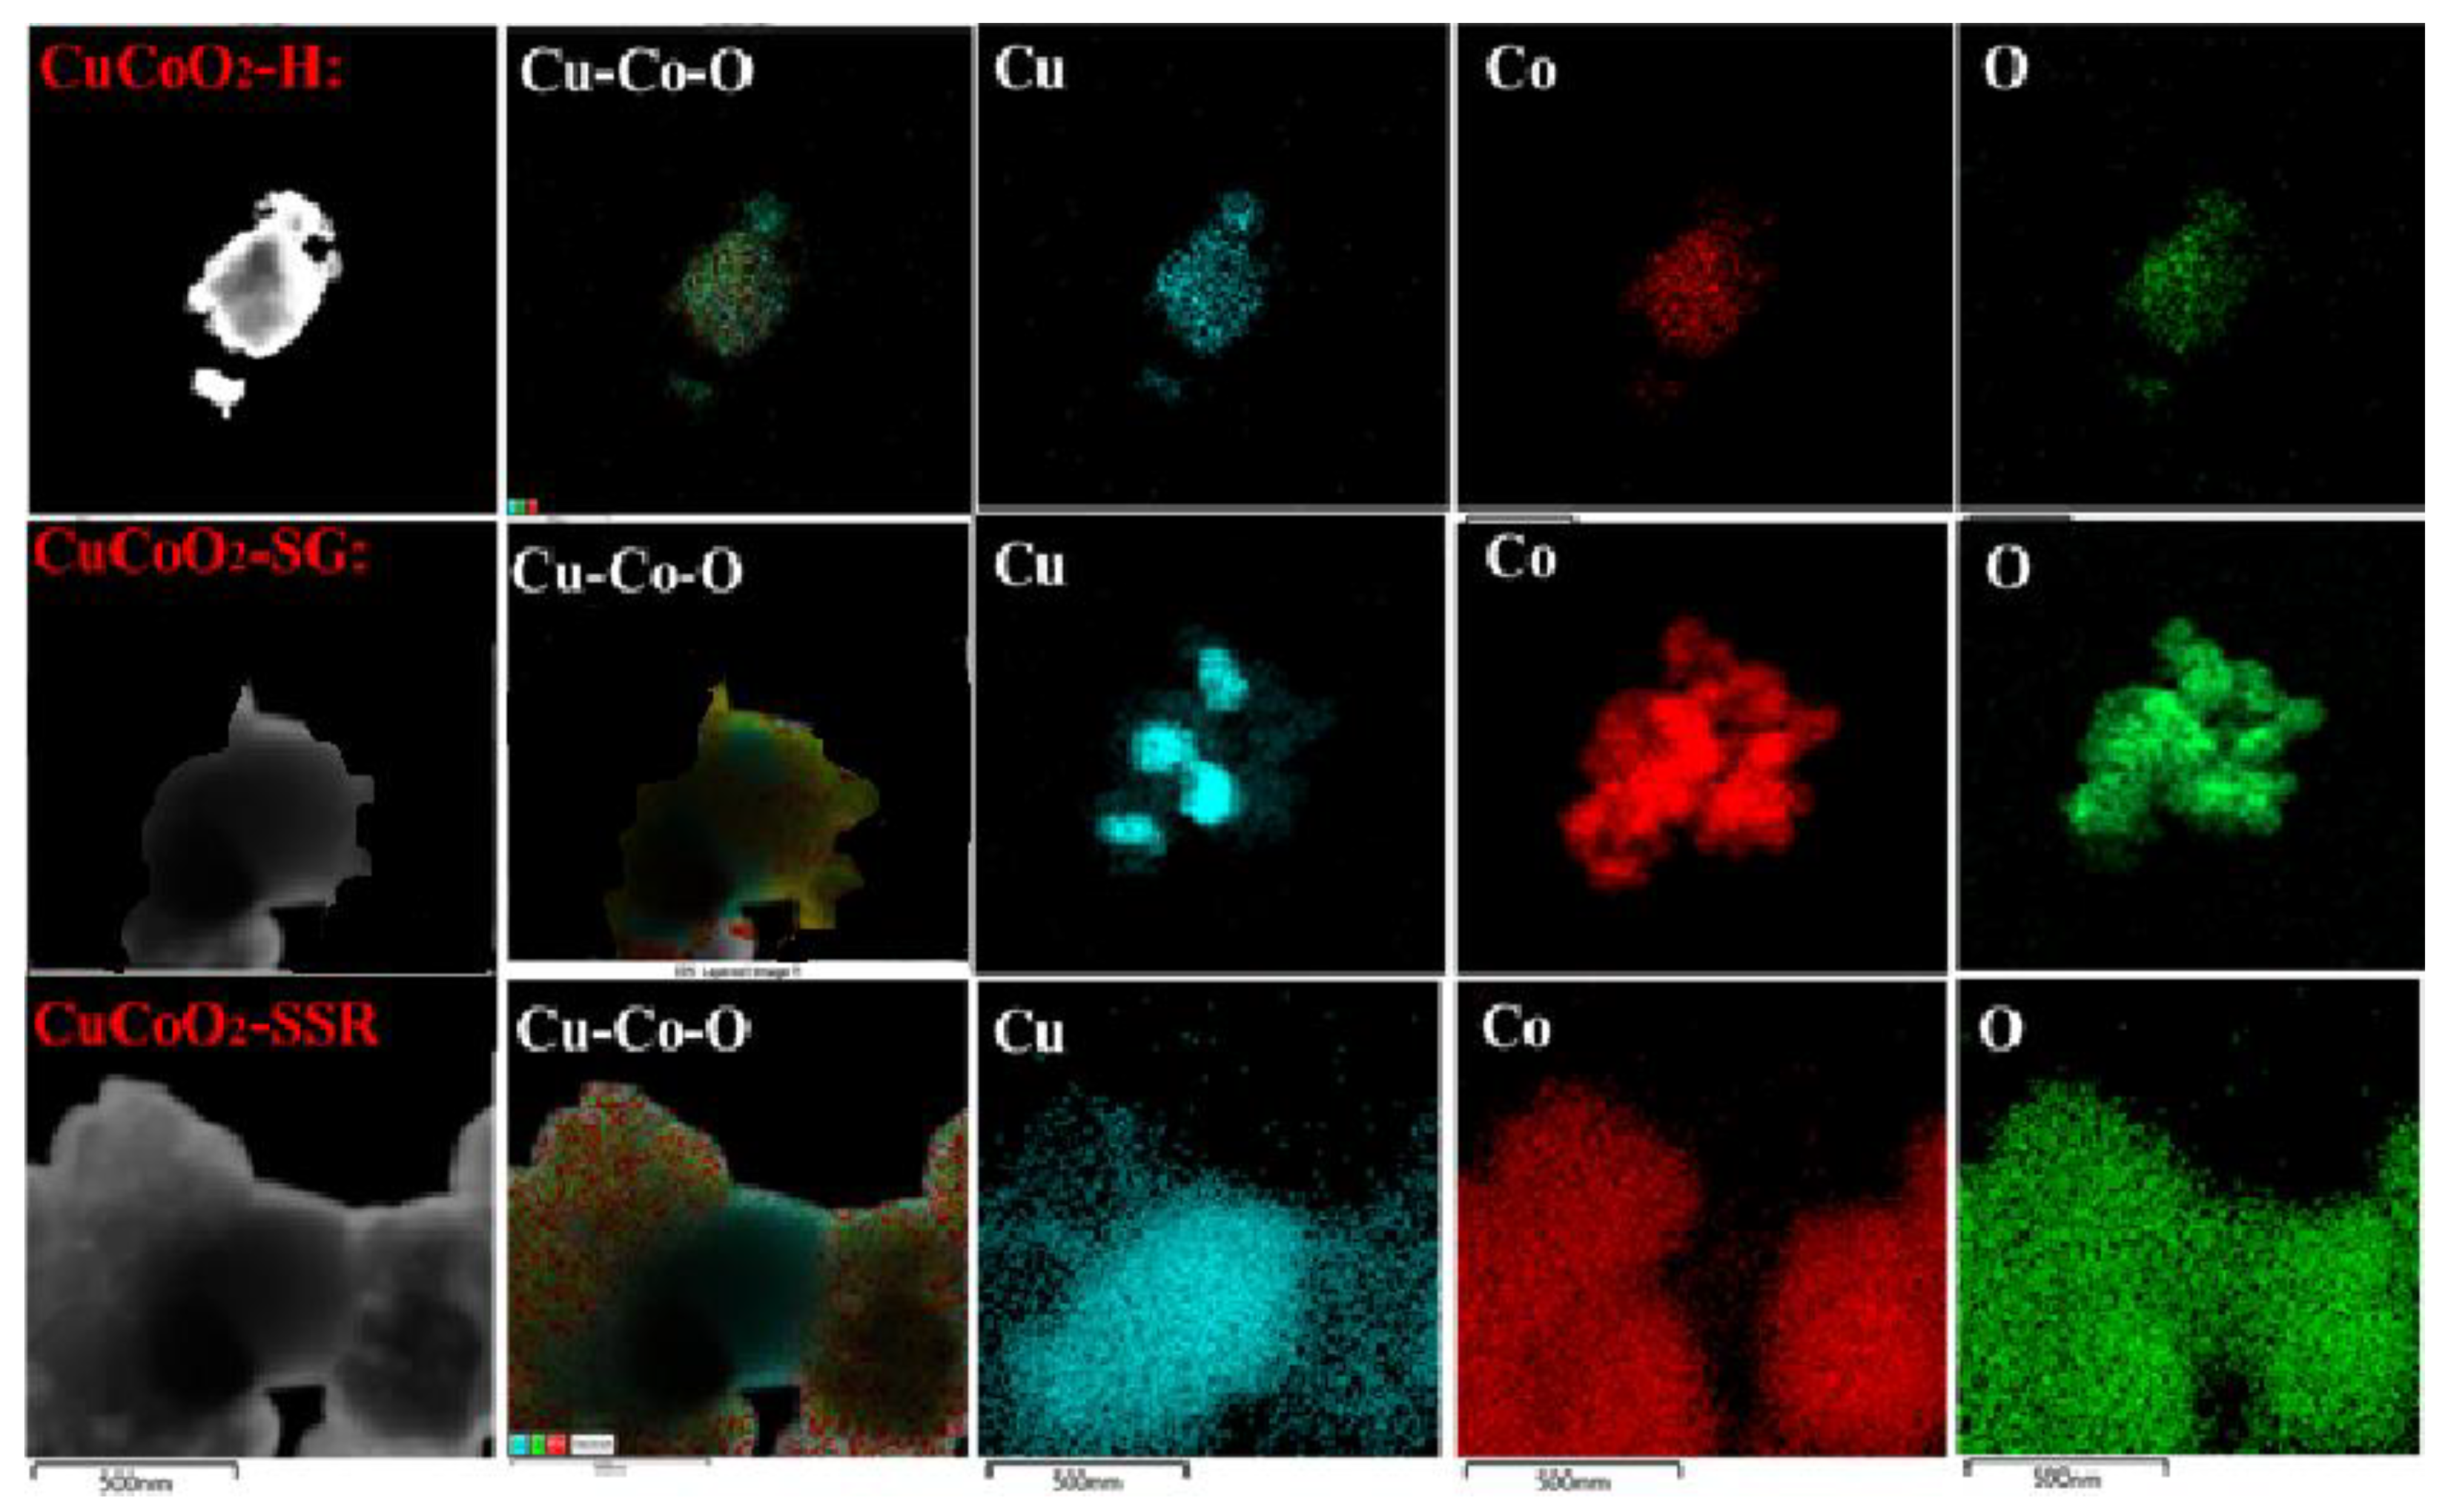
Figure 9.
a) Transmission and b) Tauc’s plot for CuCoO2_H, CuCoO2_SG, and CuCoO2_SSR precursor powders.
Figure 9.
a) Transmission and b) Tauc’s plot for CuCoO2_H, CuCoO2_SG, and CuCoO2_SSR precursor powders.
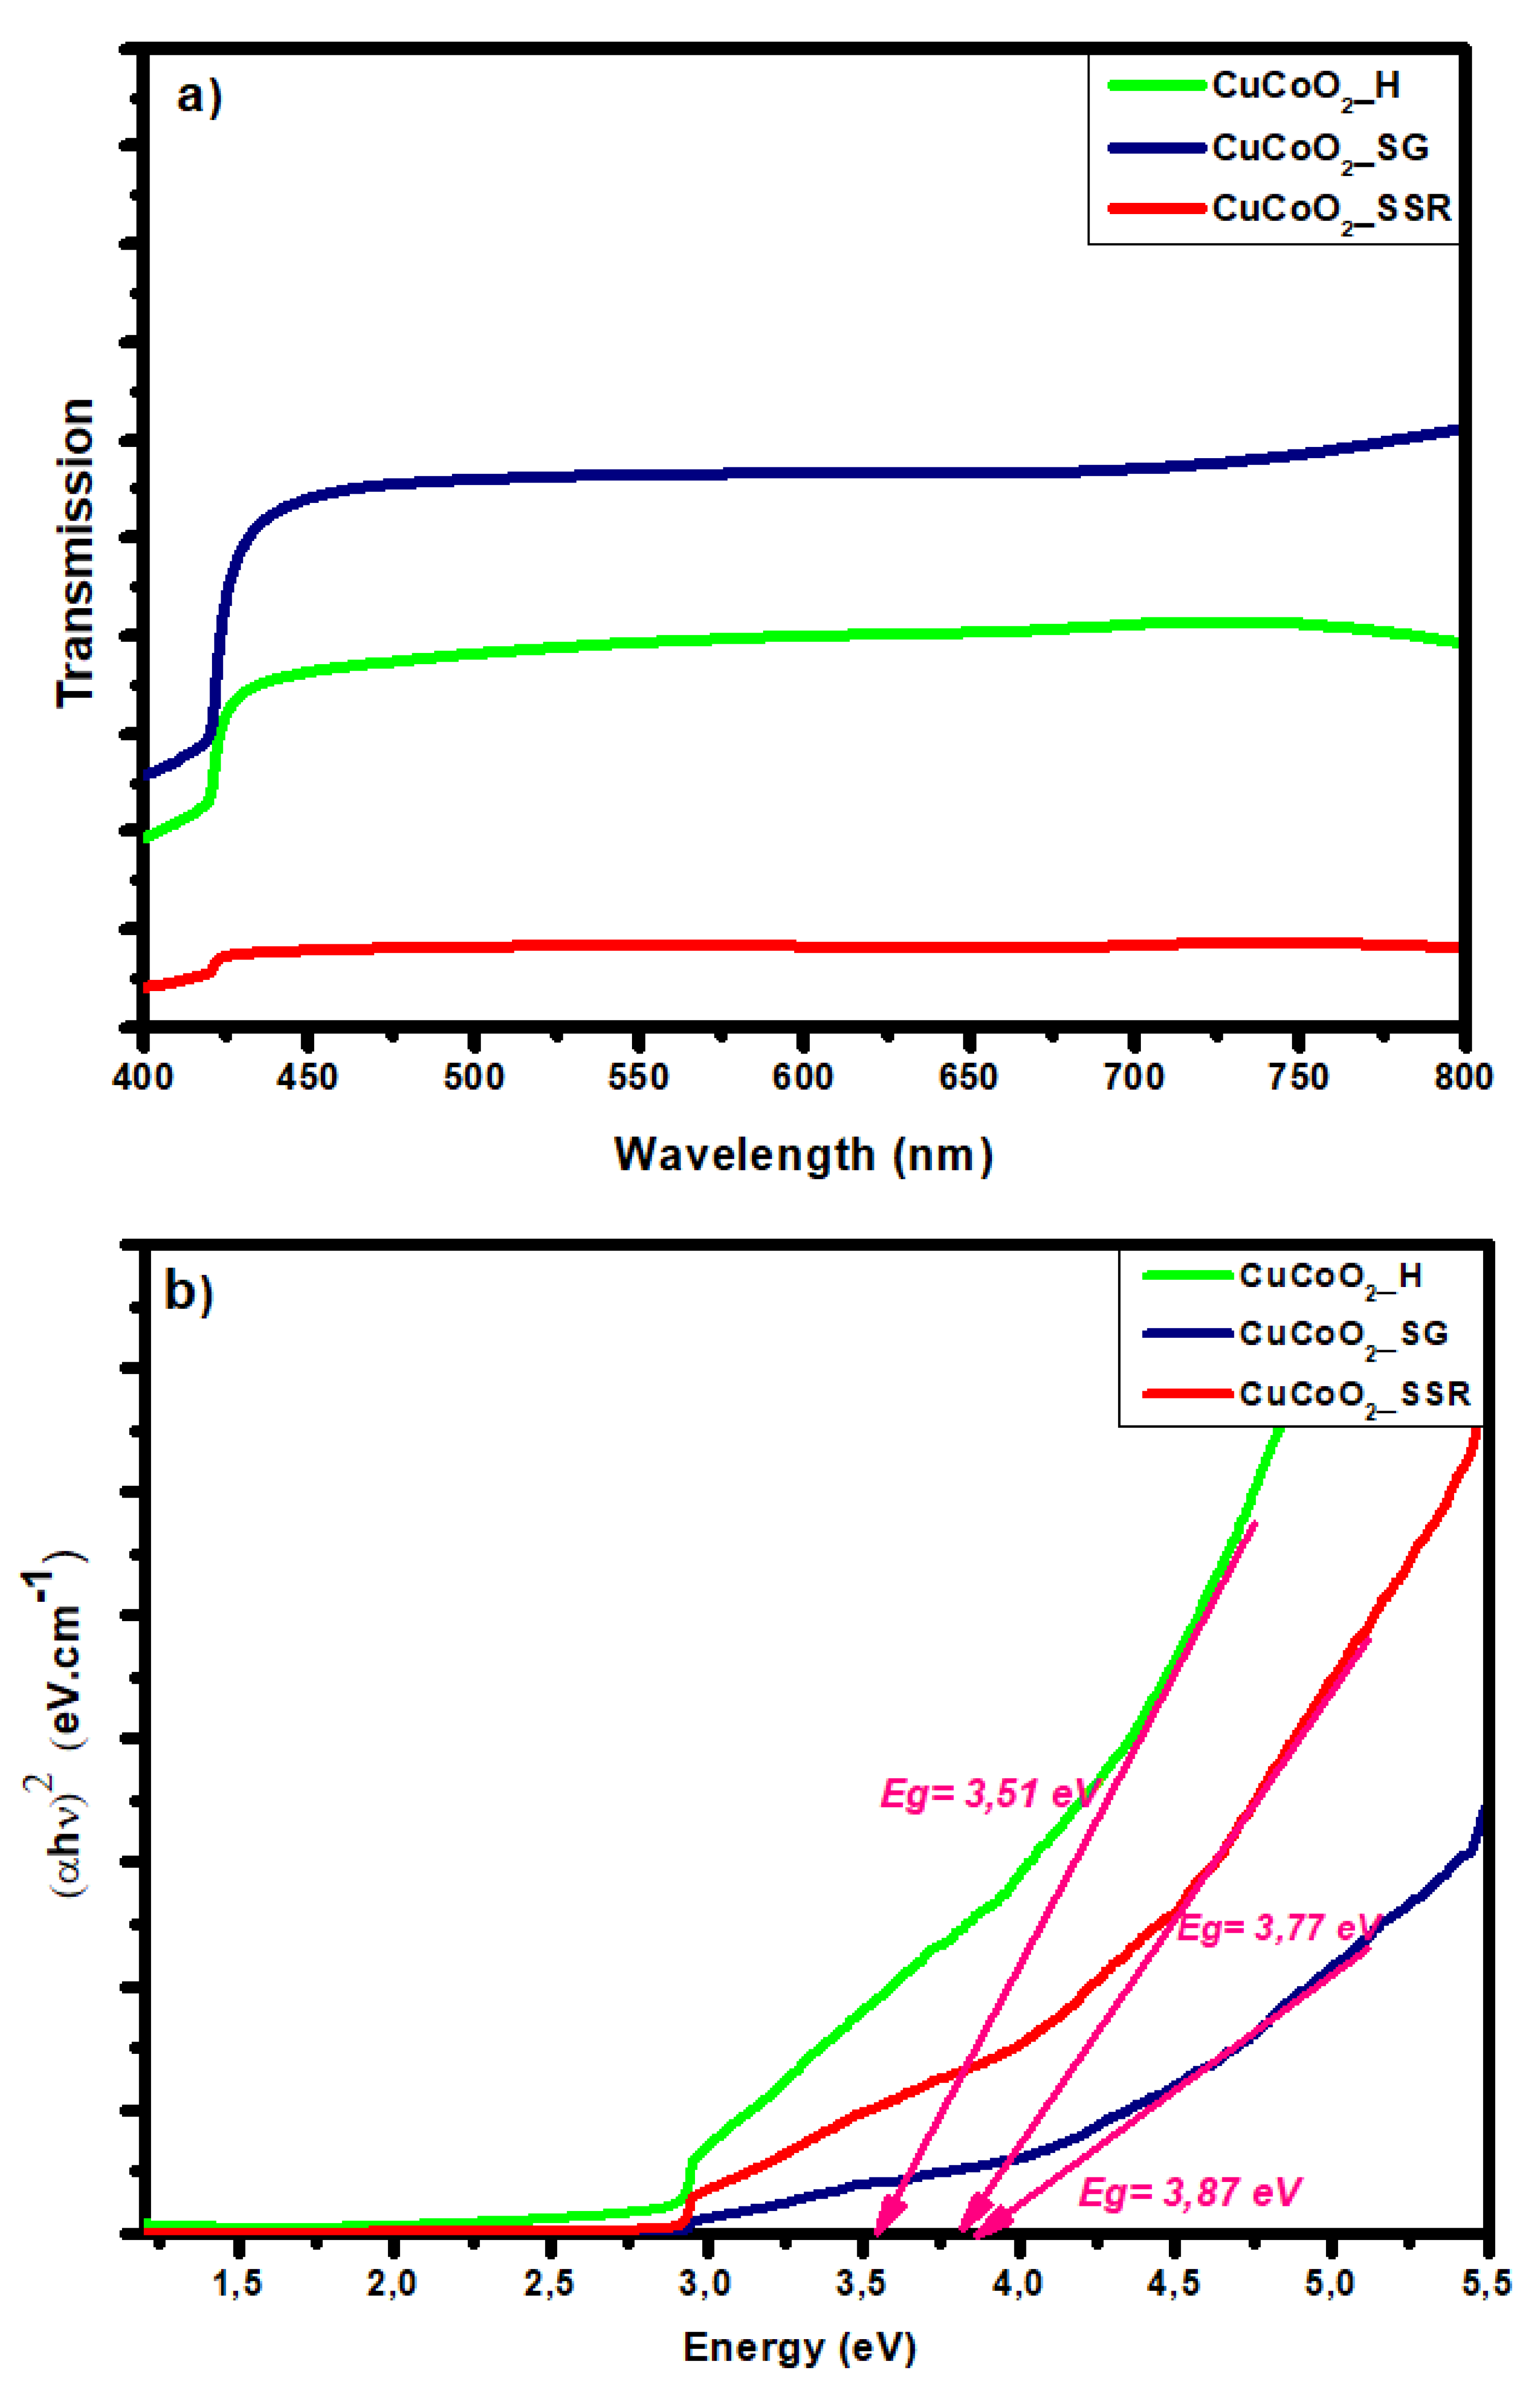
Figure 10.
Schematic diagram of the four-point probe method.
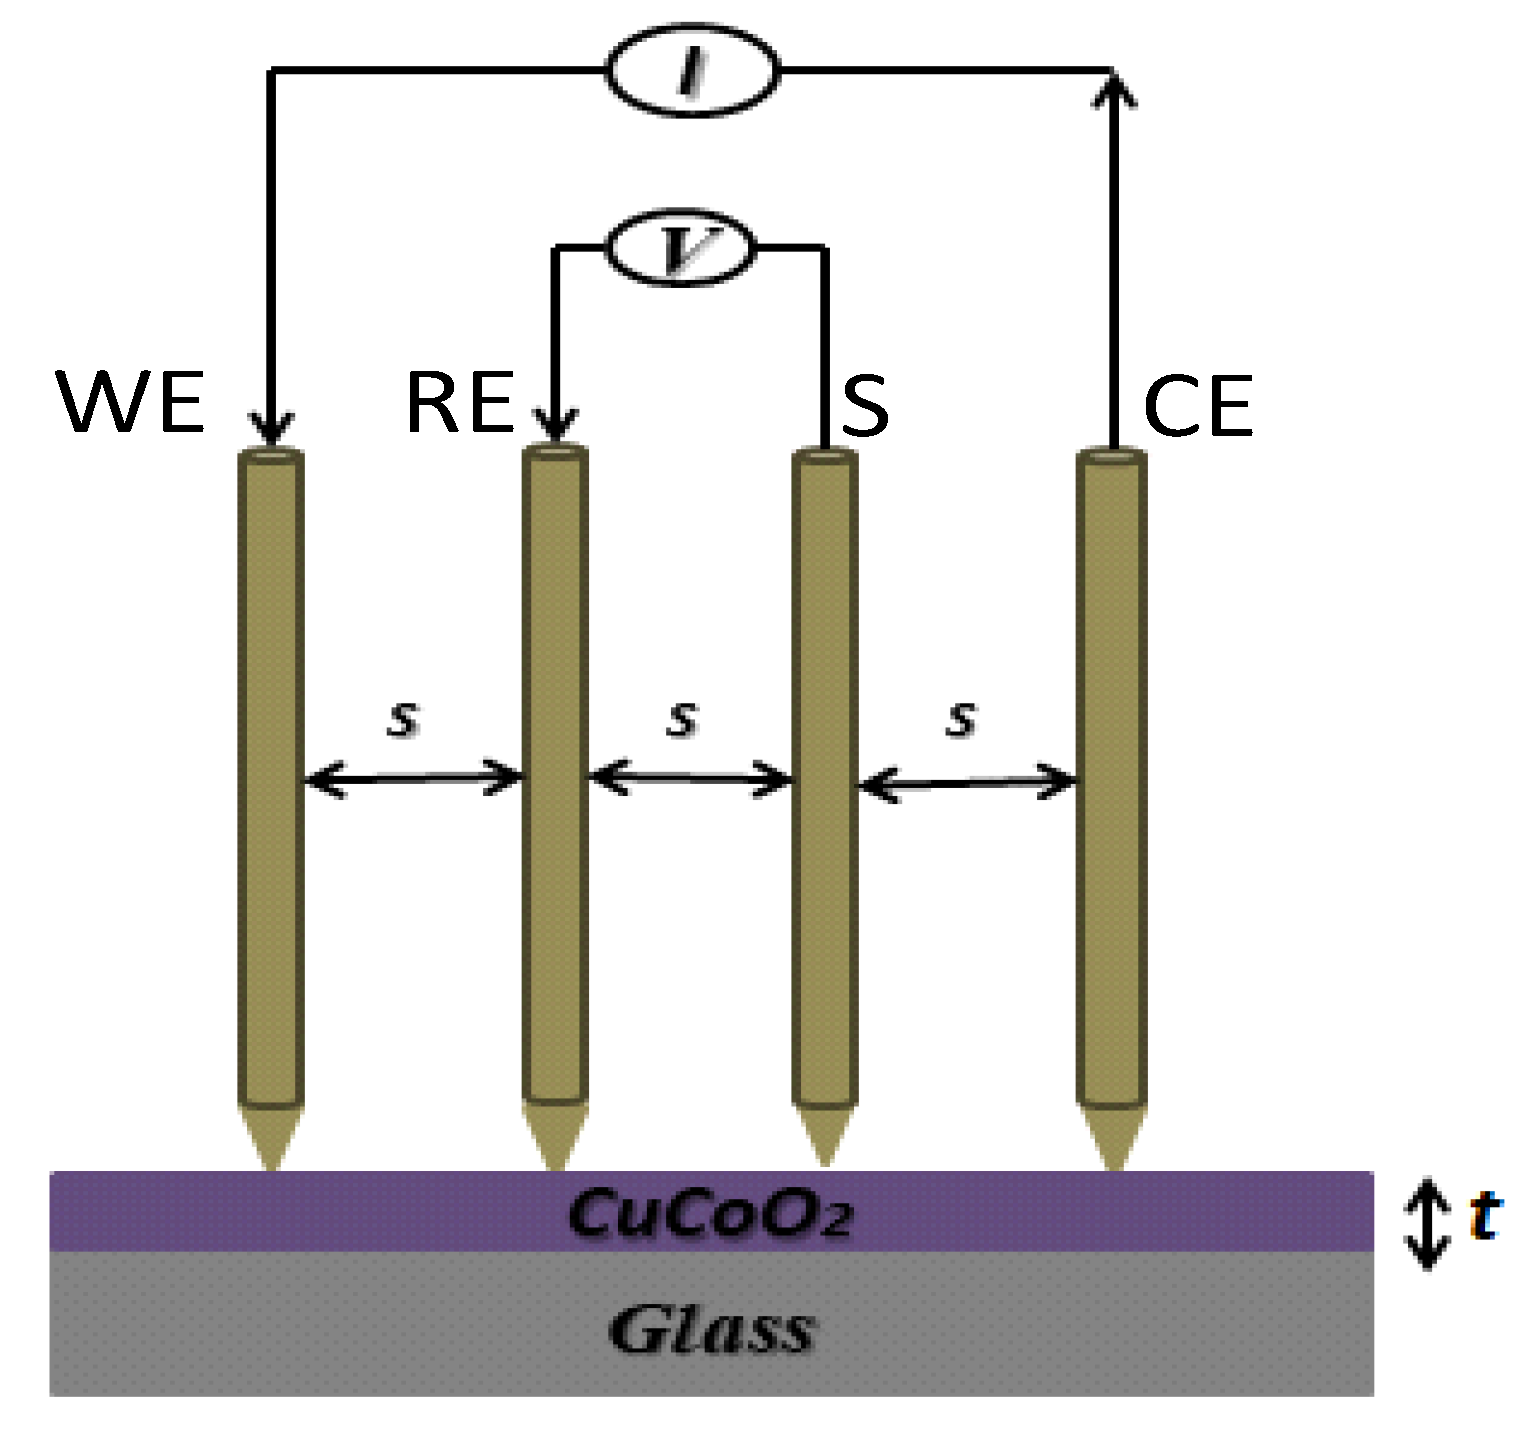
Figure 11.
Variation of the potential between RE and S electrodes when a current intensity is given between WE and CE electrodes for the samples CuCoO2 thin films. (  ), CuCoO2_H, (
 ) CuCoO2_SG, and (
 ) CuCoO2_SSR, at ambient temperature:.
), CuCoO2_H, () CuCoO2_SG, and () CuCoO2_SSR, at ambient temperature:.
Figure 11.
Variation of the potential between RE and S electrodes when a current intensity is given between WE and CE electrodes for the samples CuCoO2 thin films. ( ), CuCoO2_H, () CuCoO2_SG, and () CuCoO2_SSR, at ambient temperature:.
), CuCoO2_H, () CuCoO2_SG, and () CuCoO2_SSR, at ambient temperature:.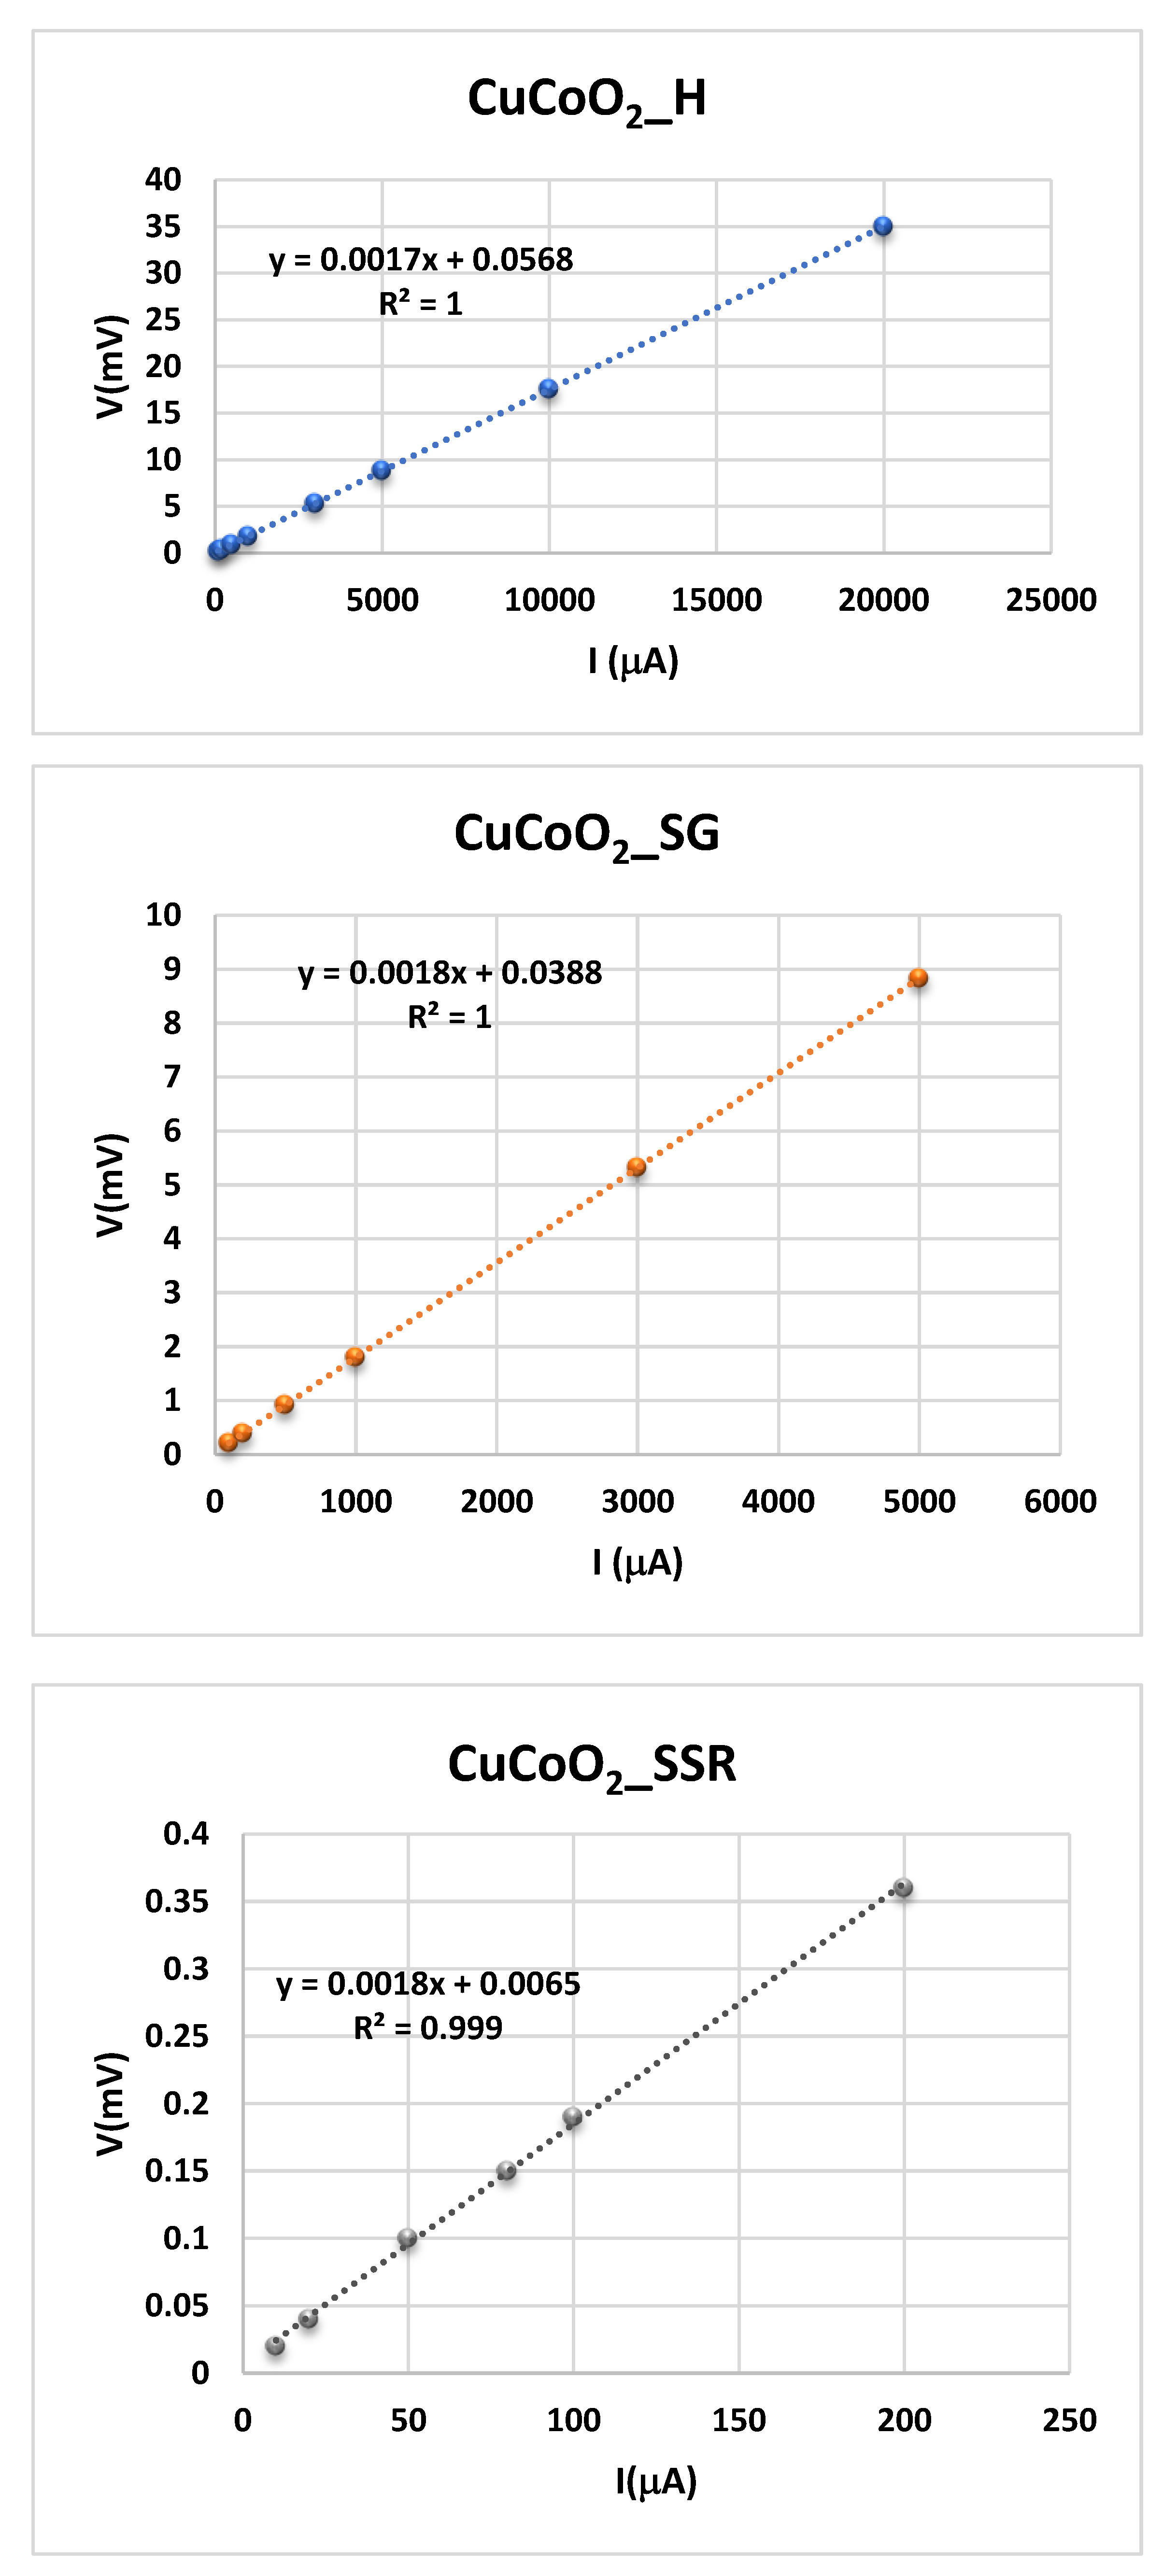
Figure 12.
Bode diagrams of the conductivity for a) CuCoO2_SG, b) CuCoO2_SSR, and c) CuCoO2_H at different temperatures.
Figure 12.
Bode diagrams of the conductivity for a) CuCoO2_SG, b) CuCoO2_SSR, and c) CuCoO2_H at different temperatures.
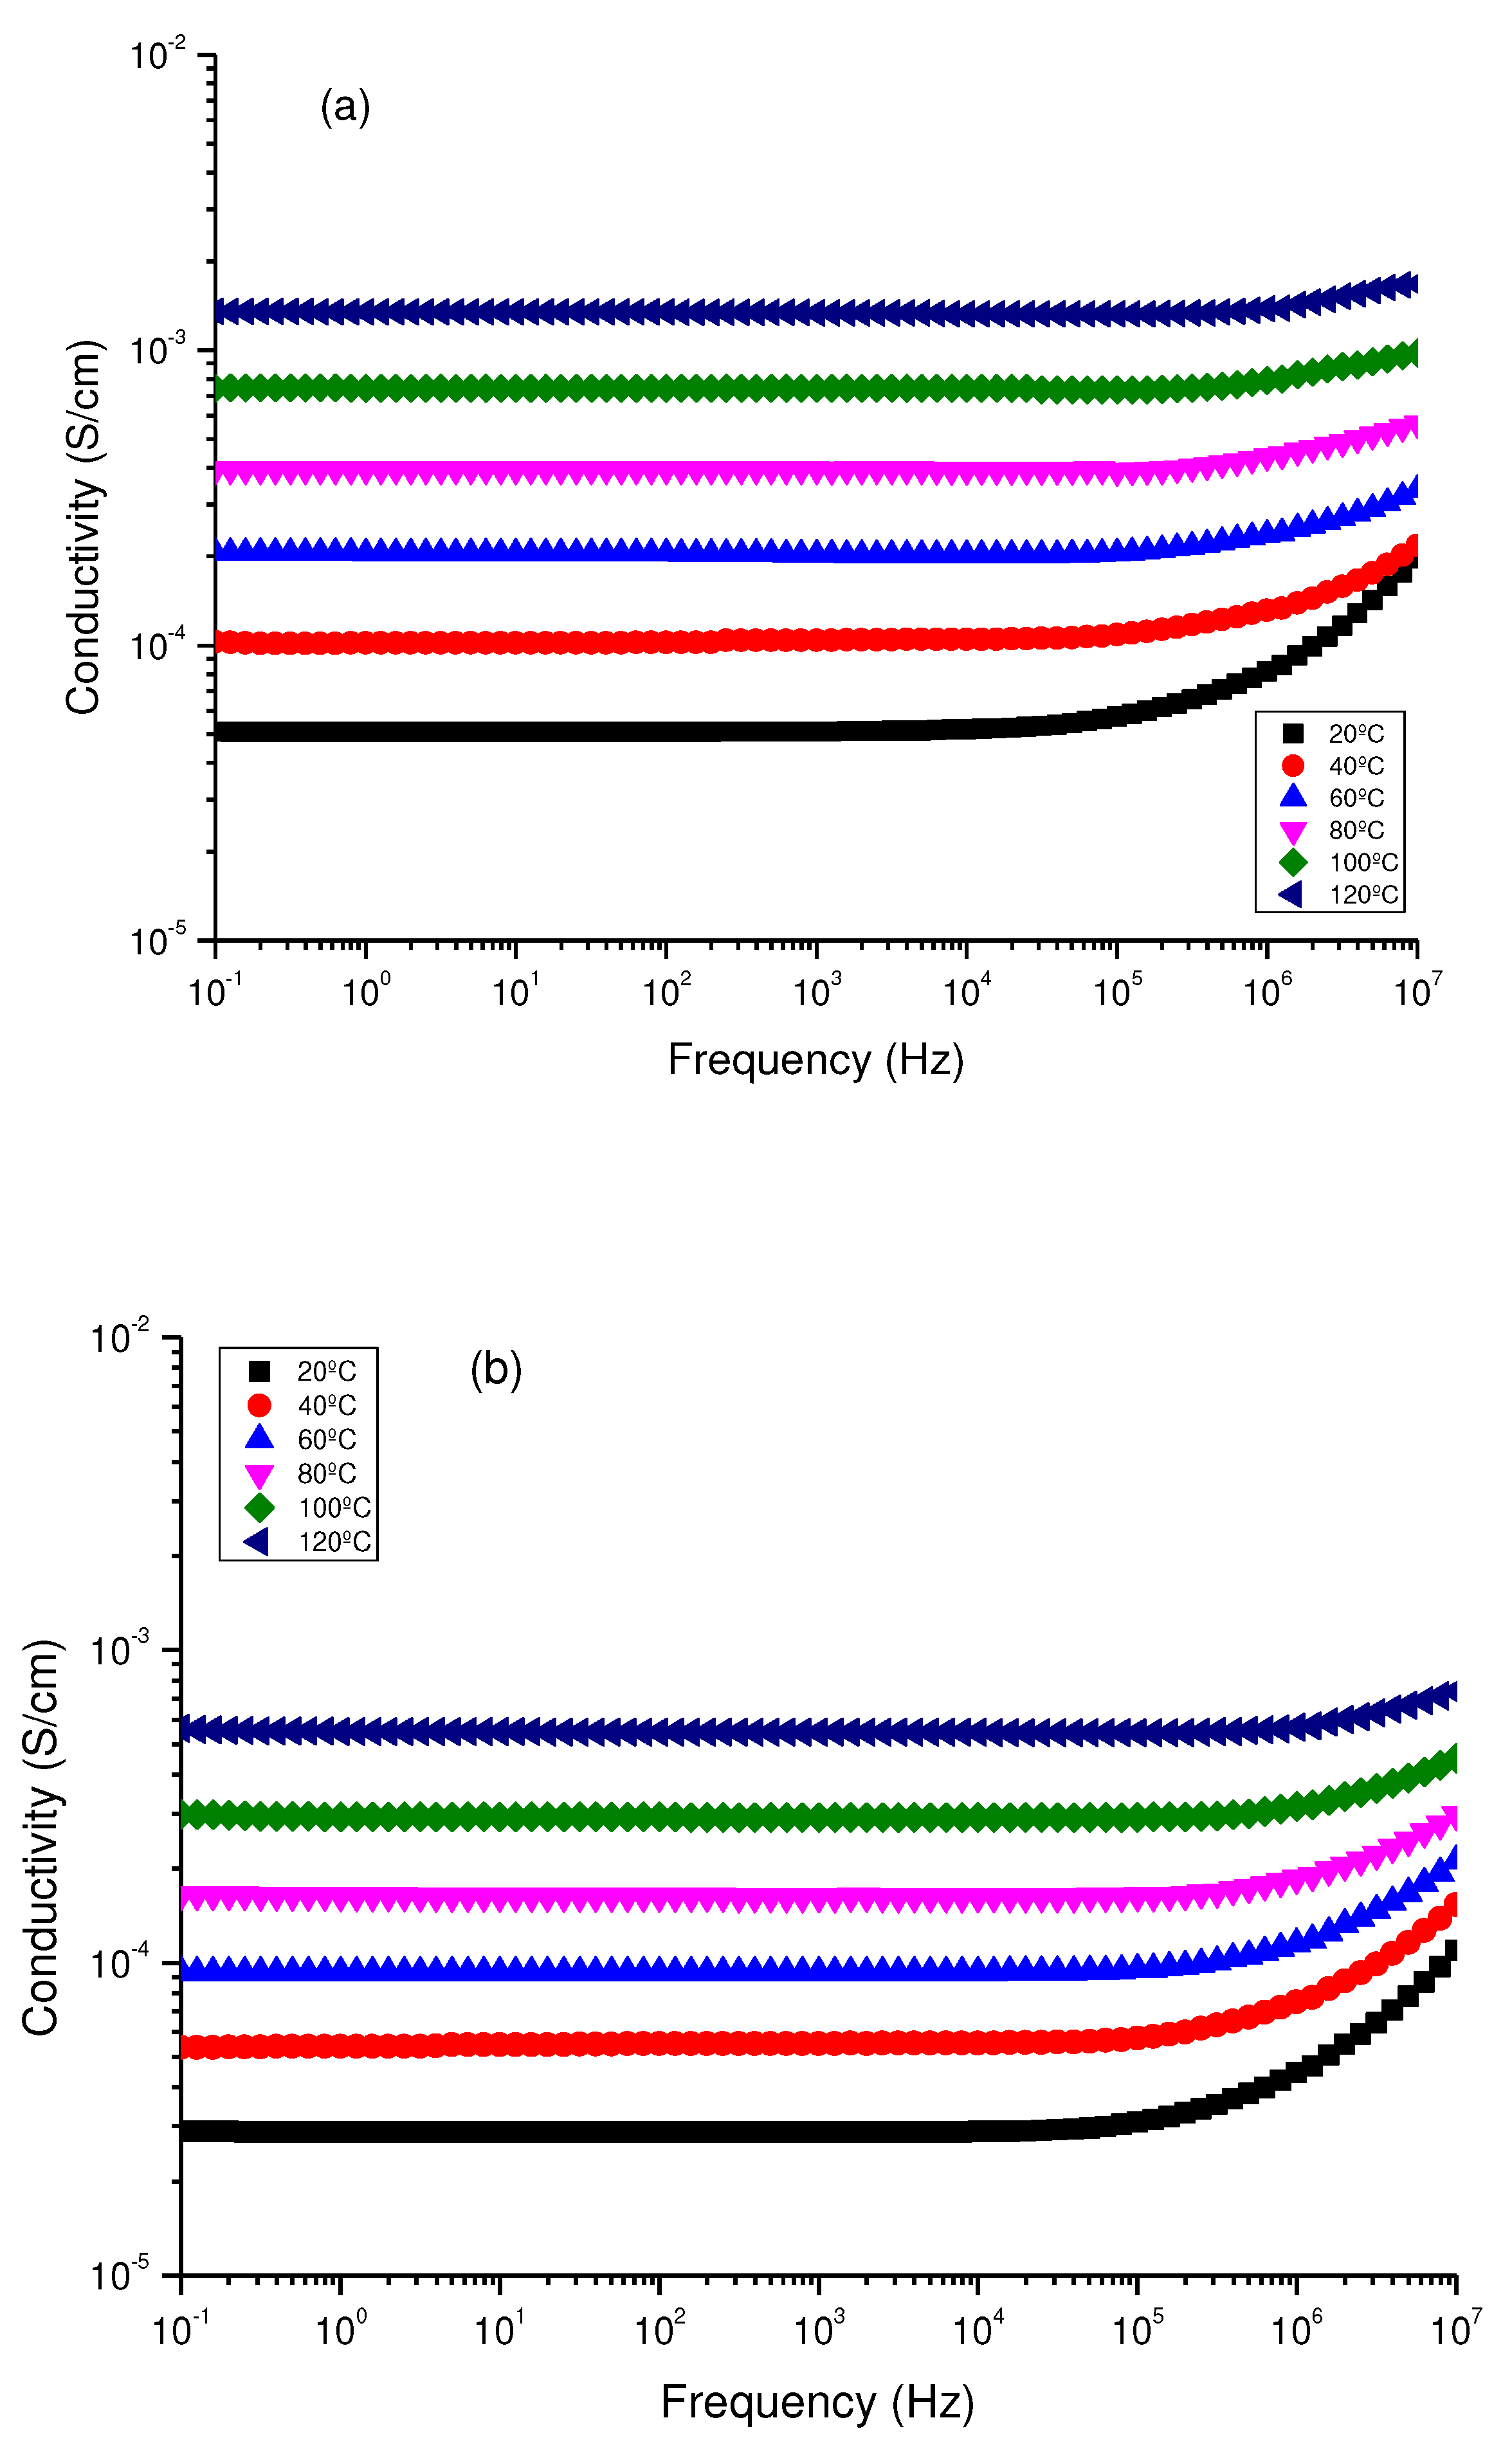
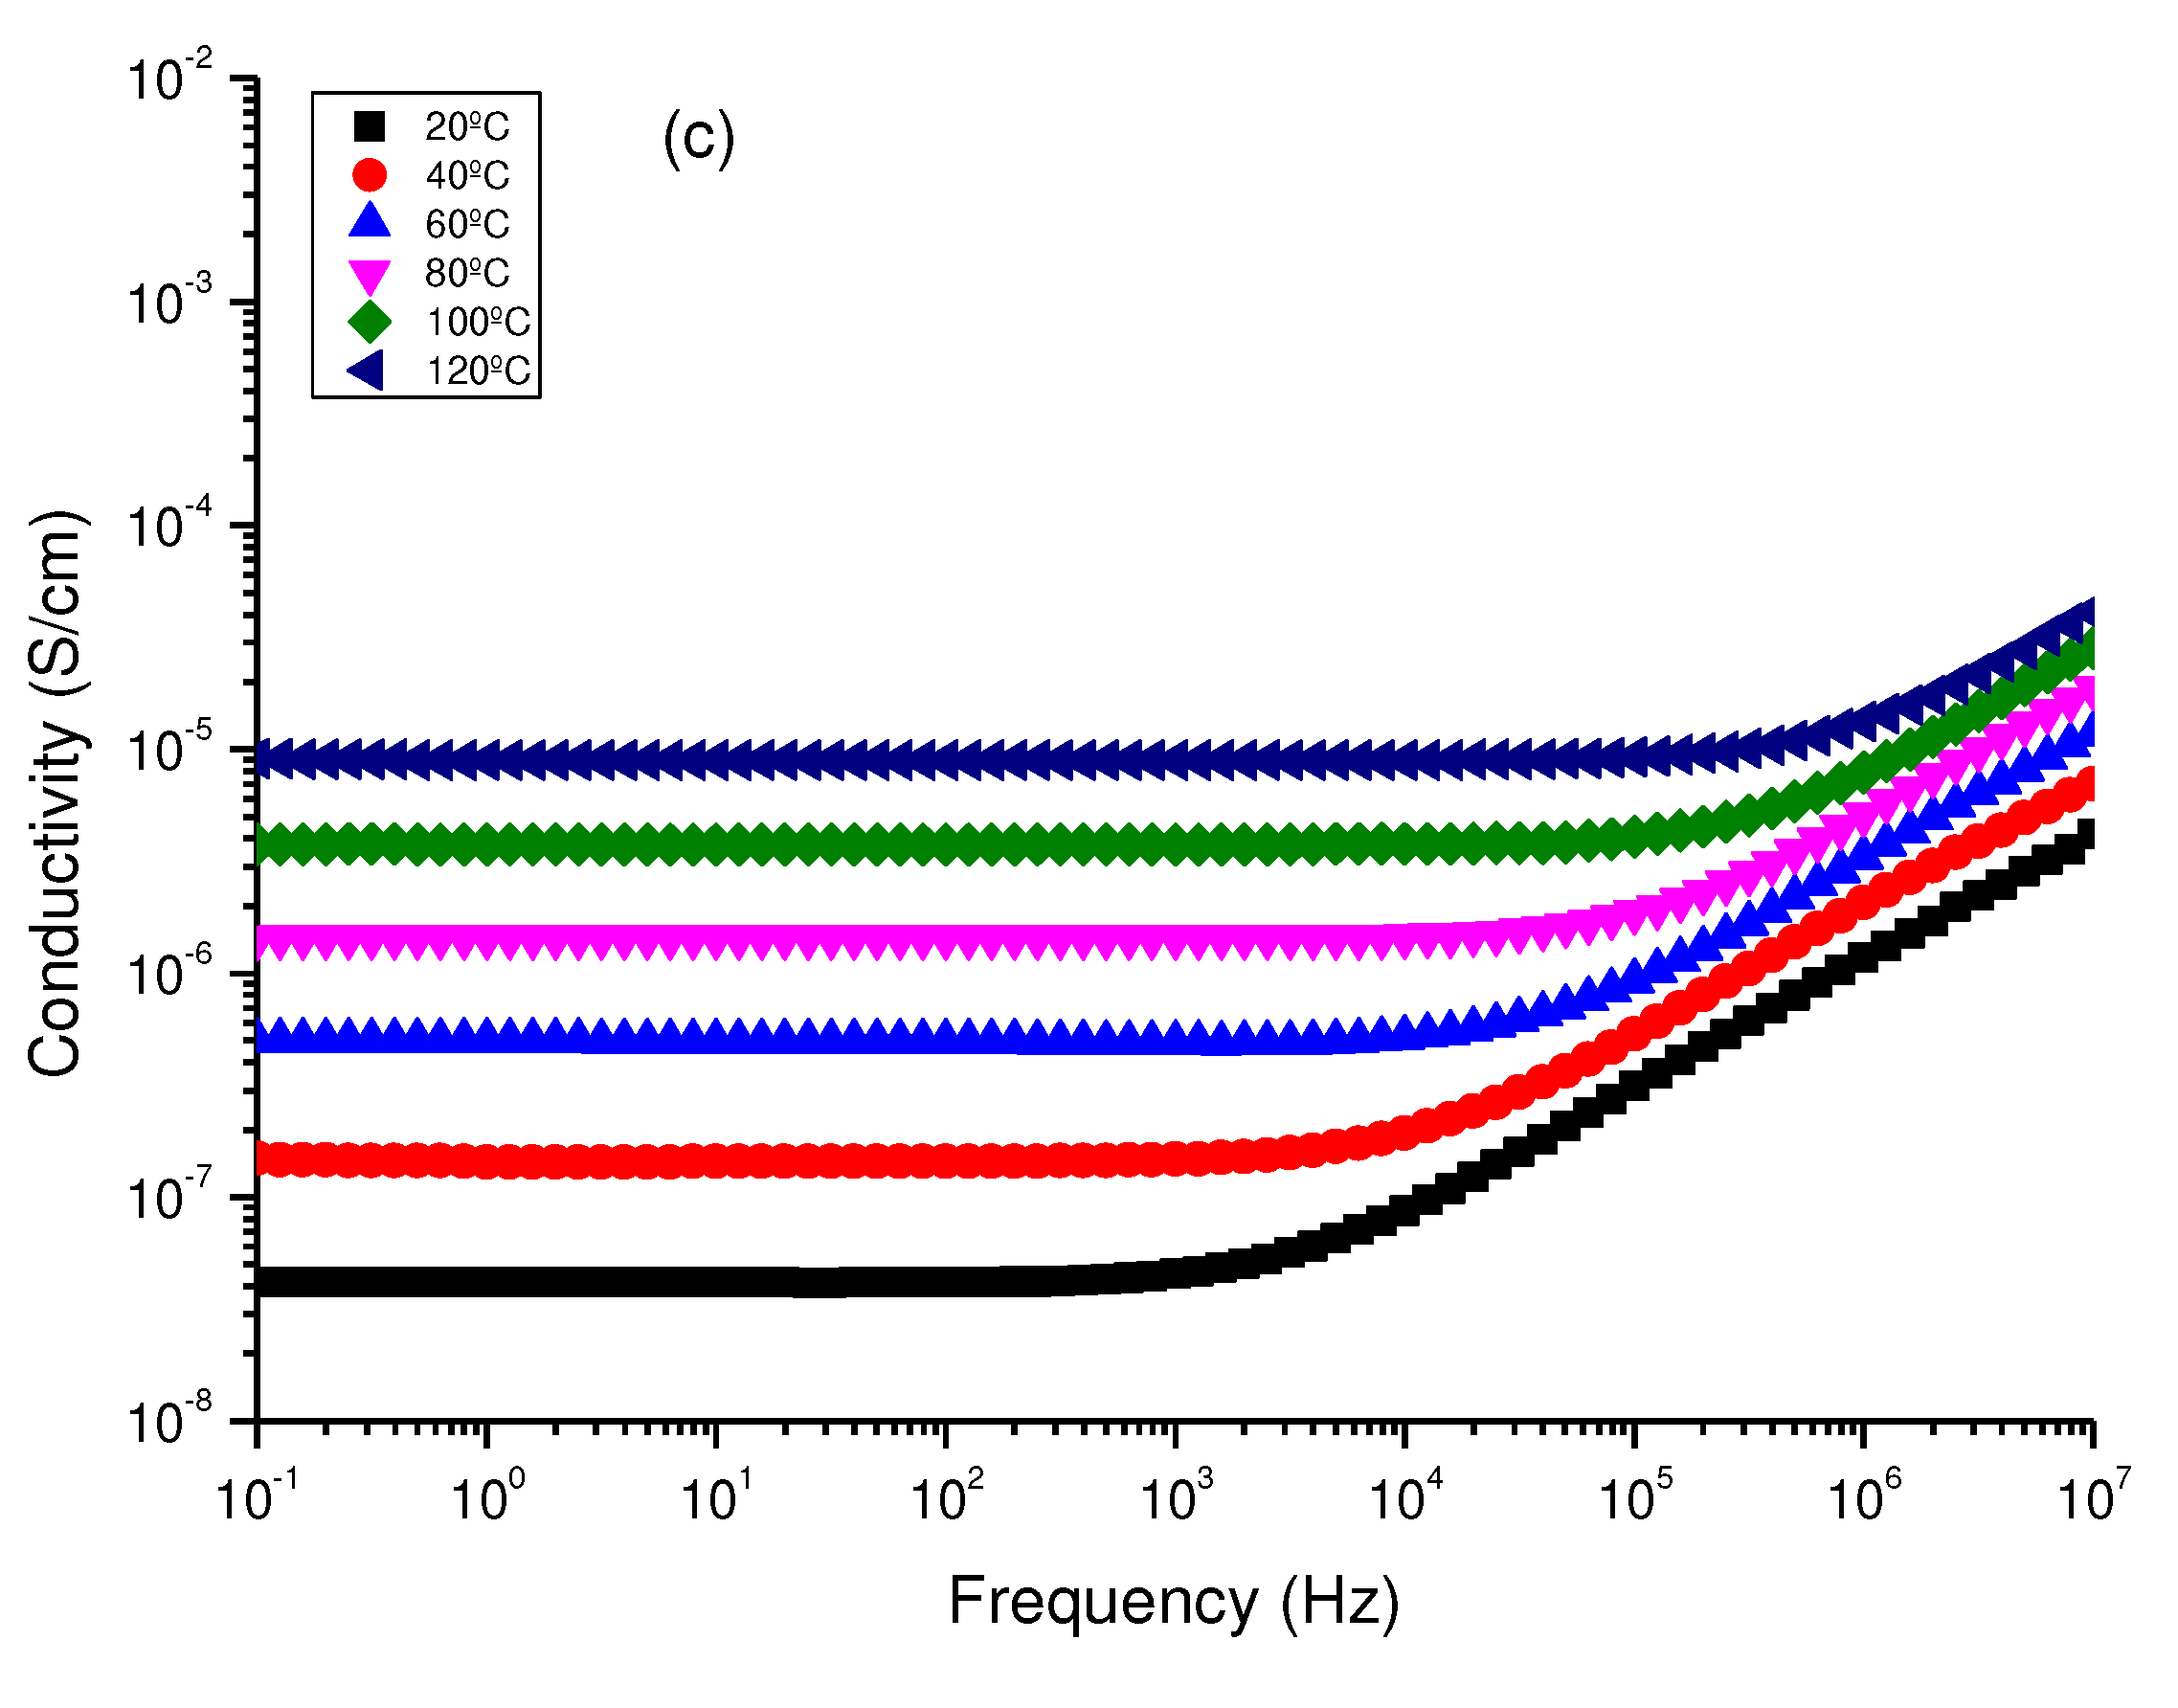
Figure 13.
Temperature dependence of conductivity determined using Bode graphs for all samples examined.
Figure 13.
Temperature dependence of conductivity determined using Bode graphs for all samples examined.
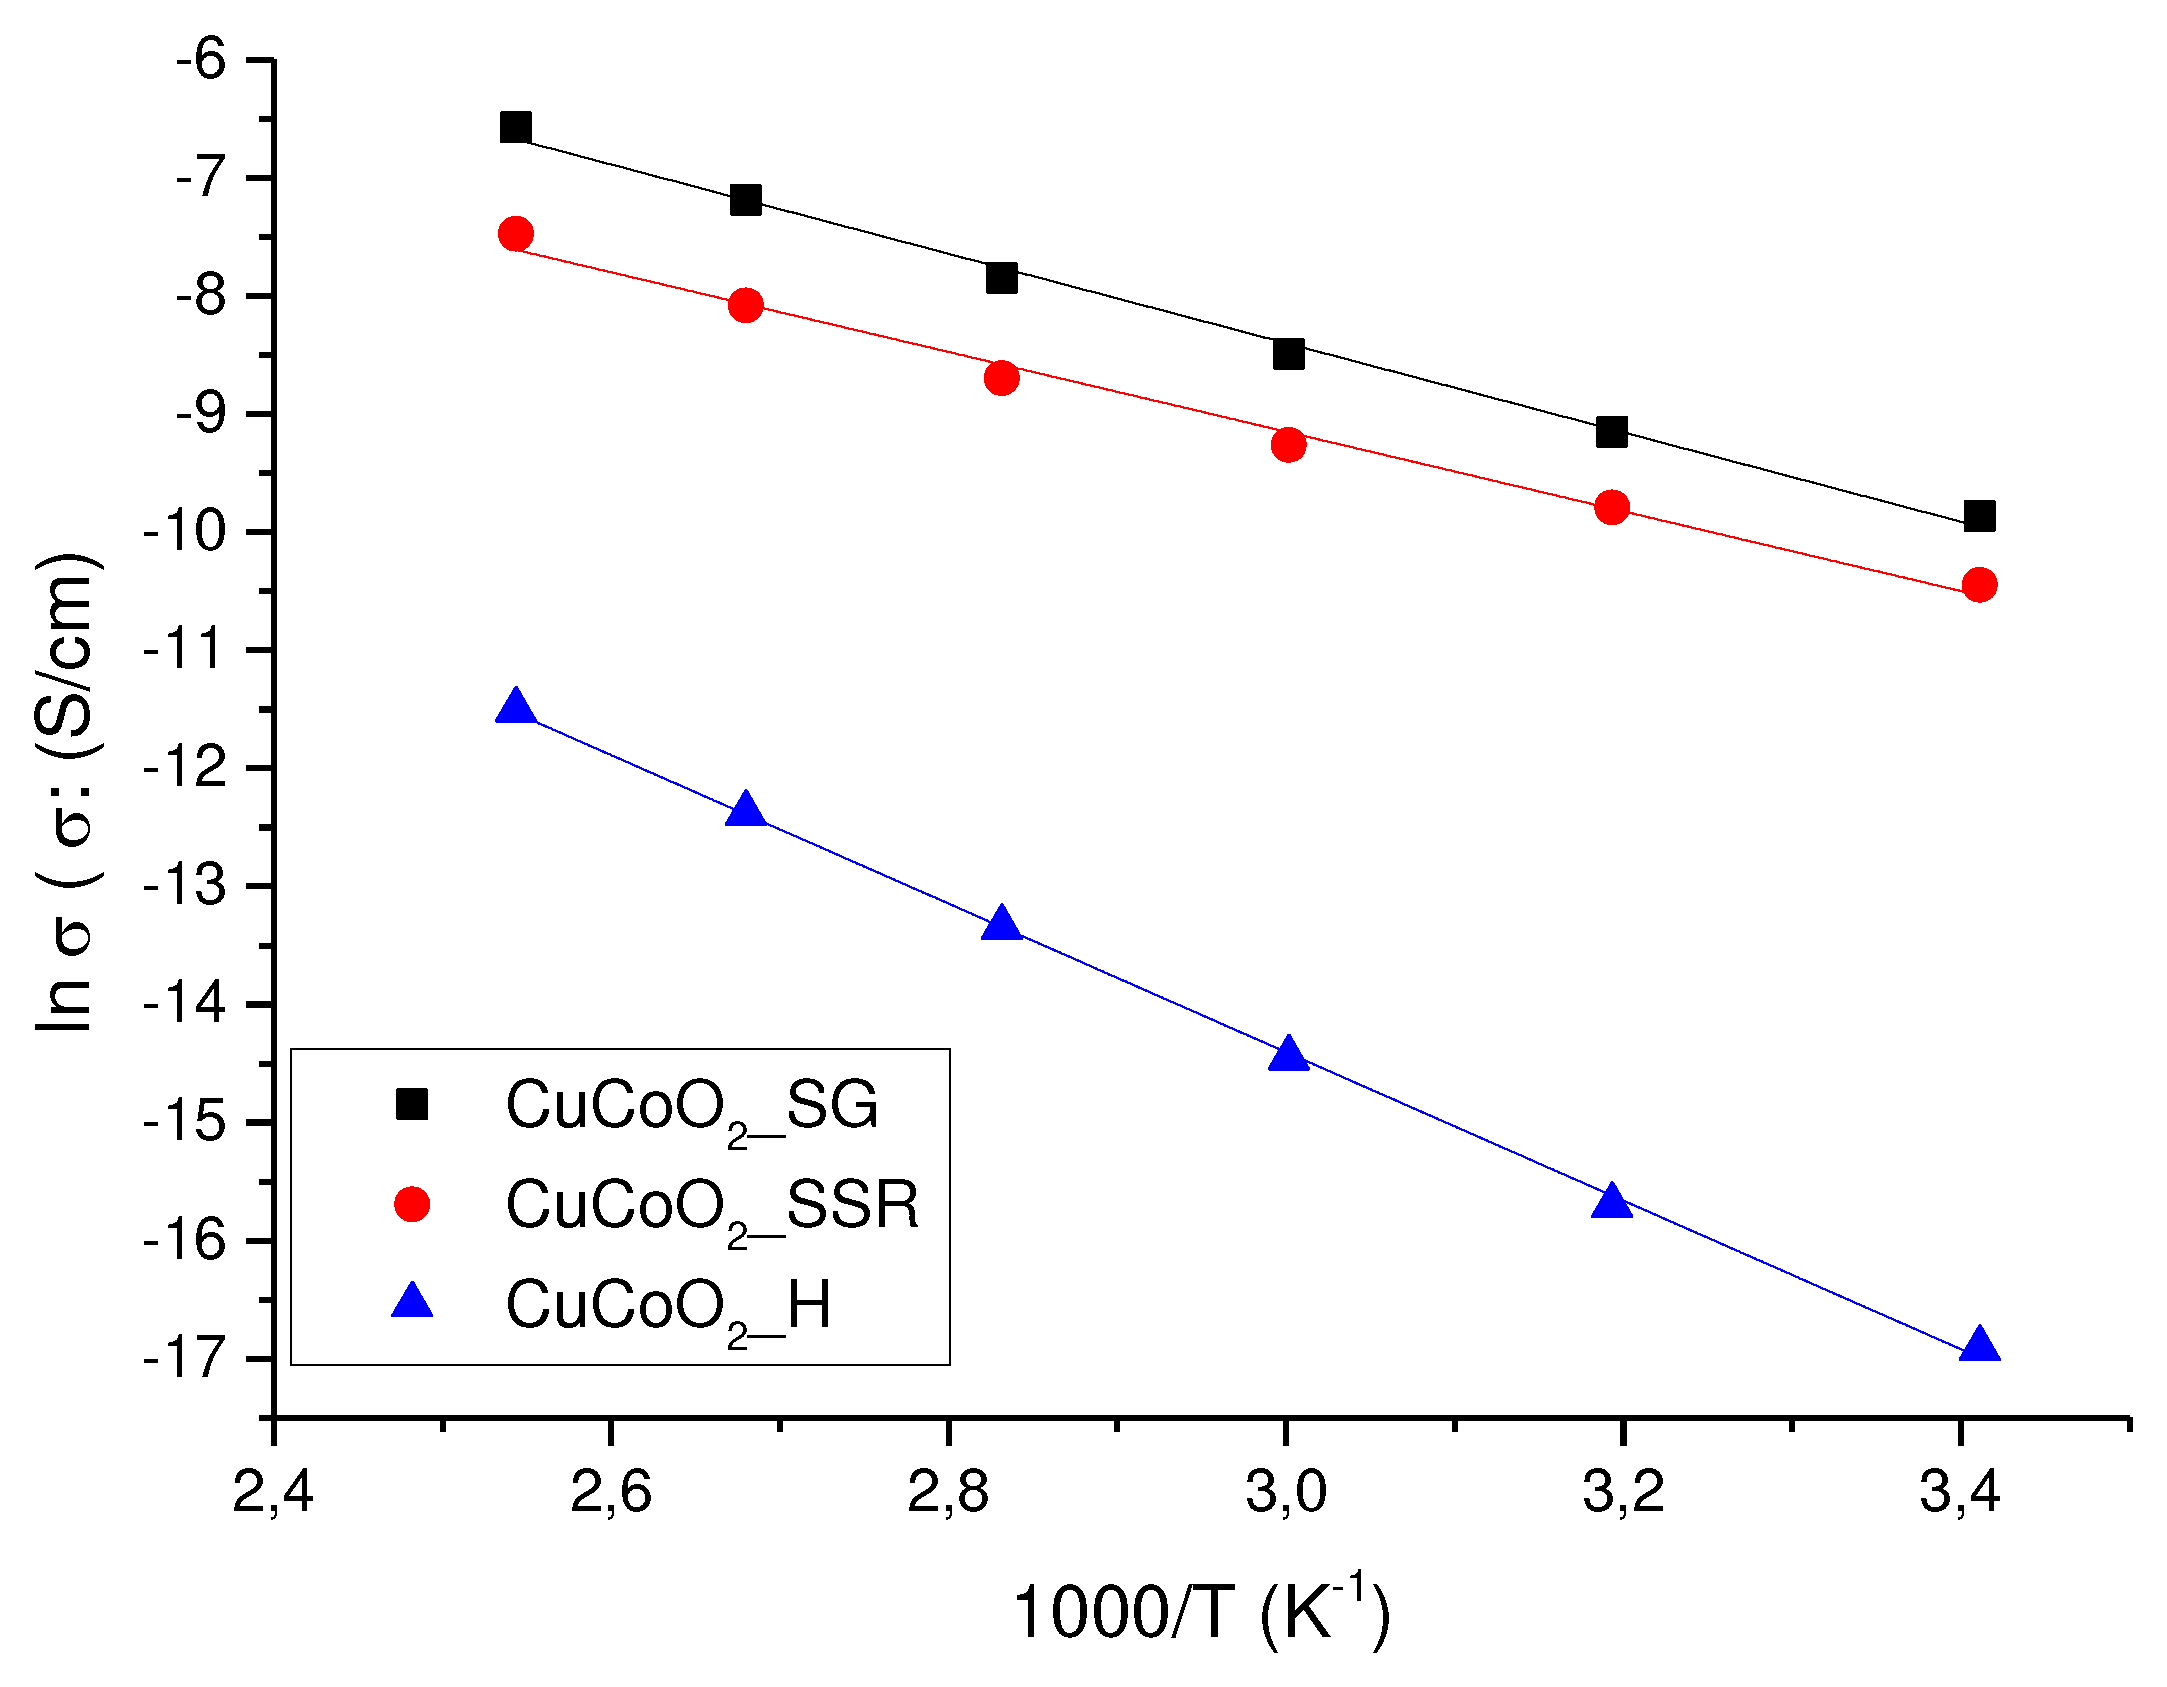
Figure 14.
Variation of the sample relaxation time against the reciprocal of temperature for the delafossites investigated.
Figure 14.
Variation of the sample relaxation time against the reciprocal of temperature for the delafossites investigated.
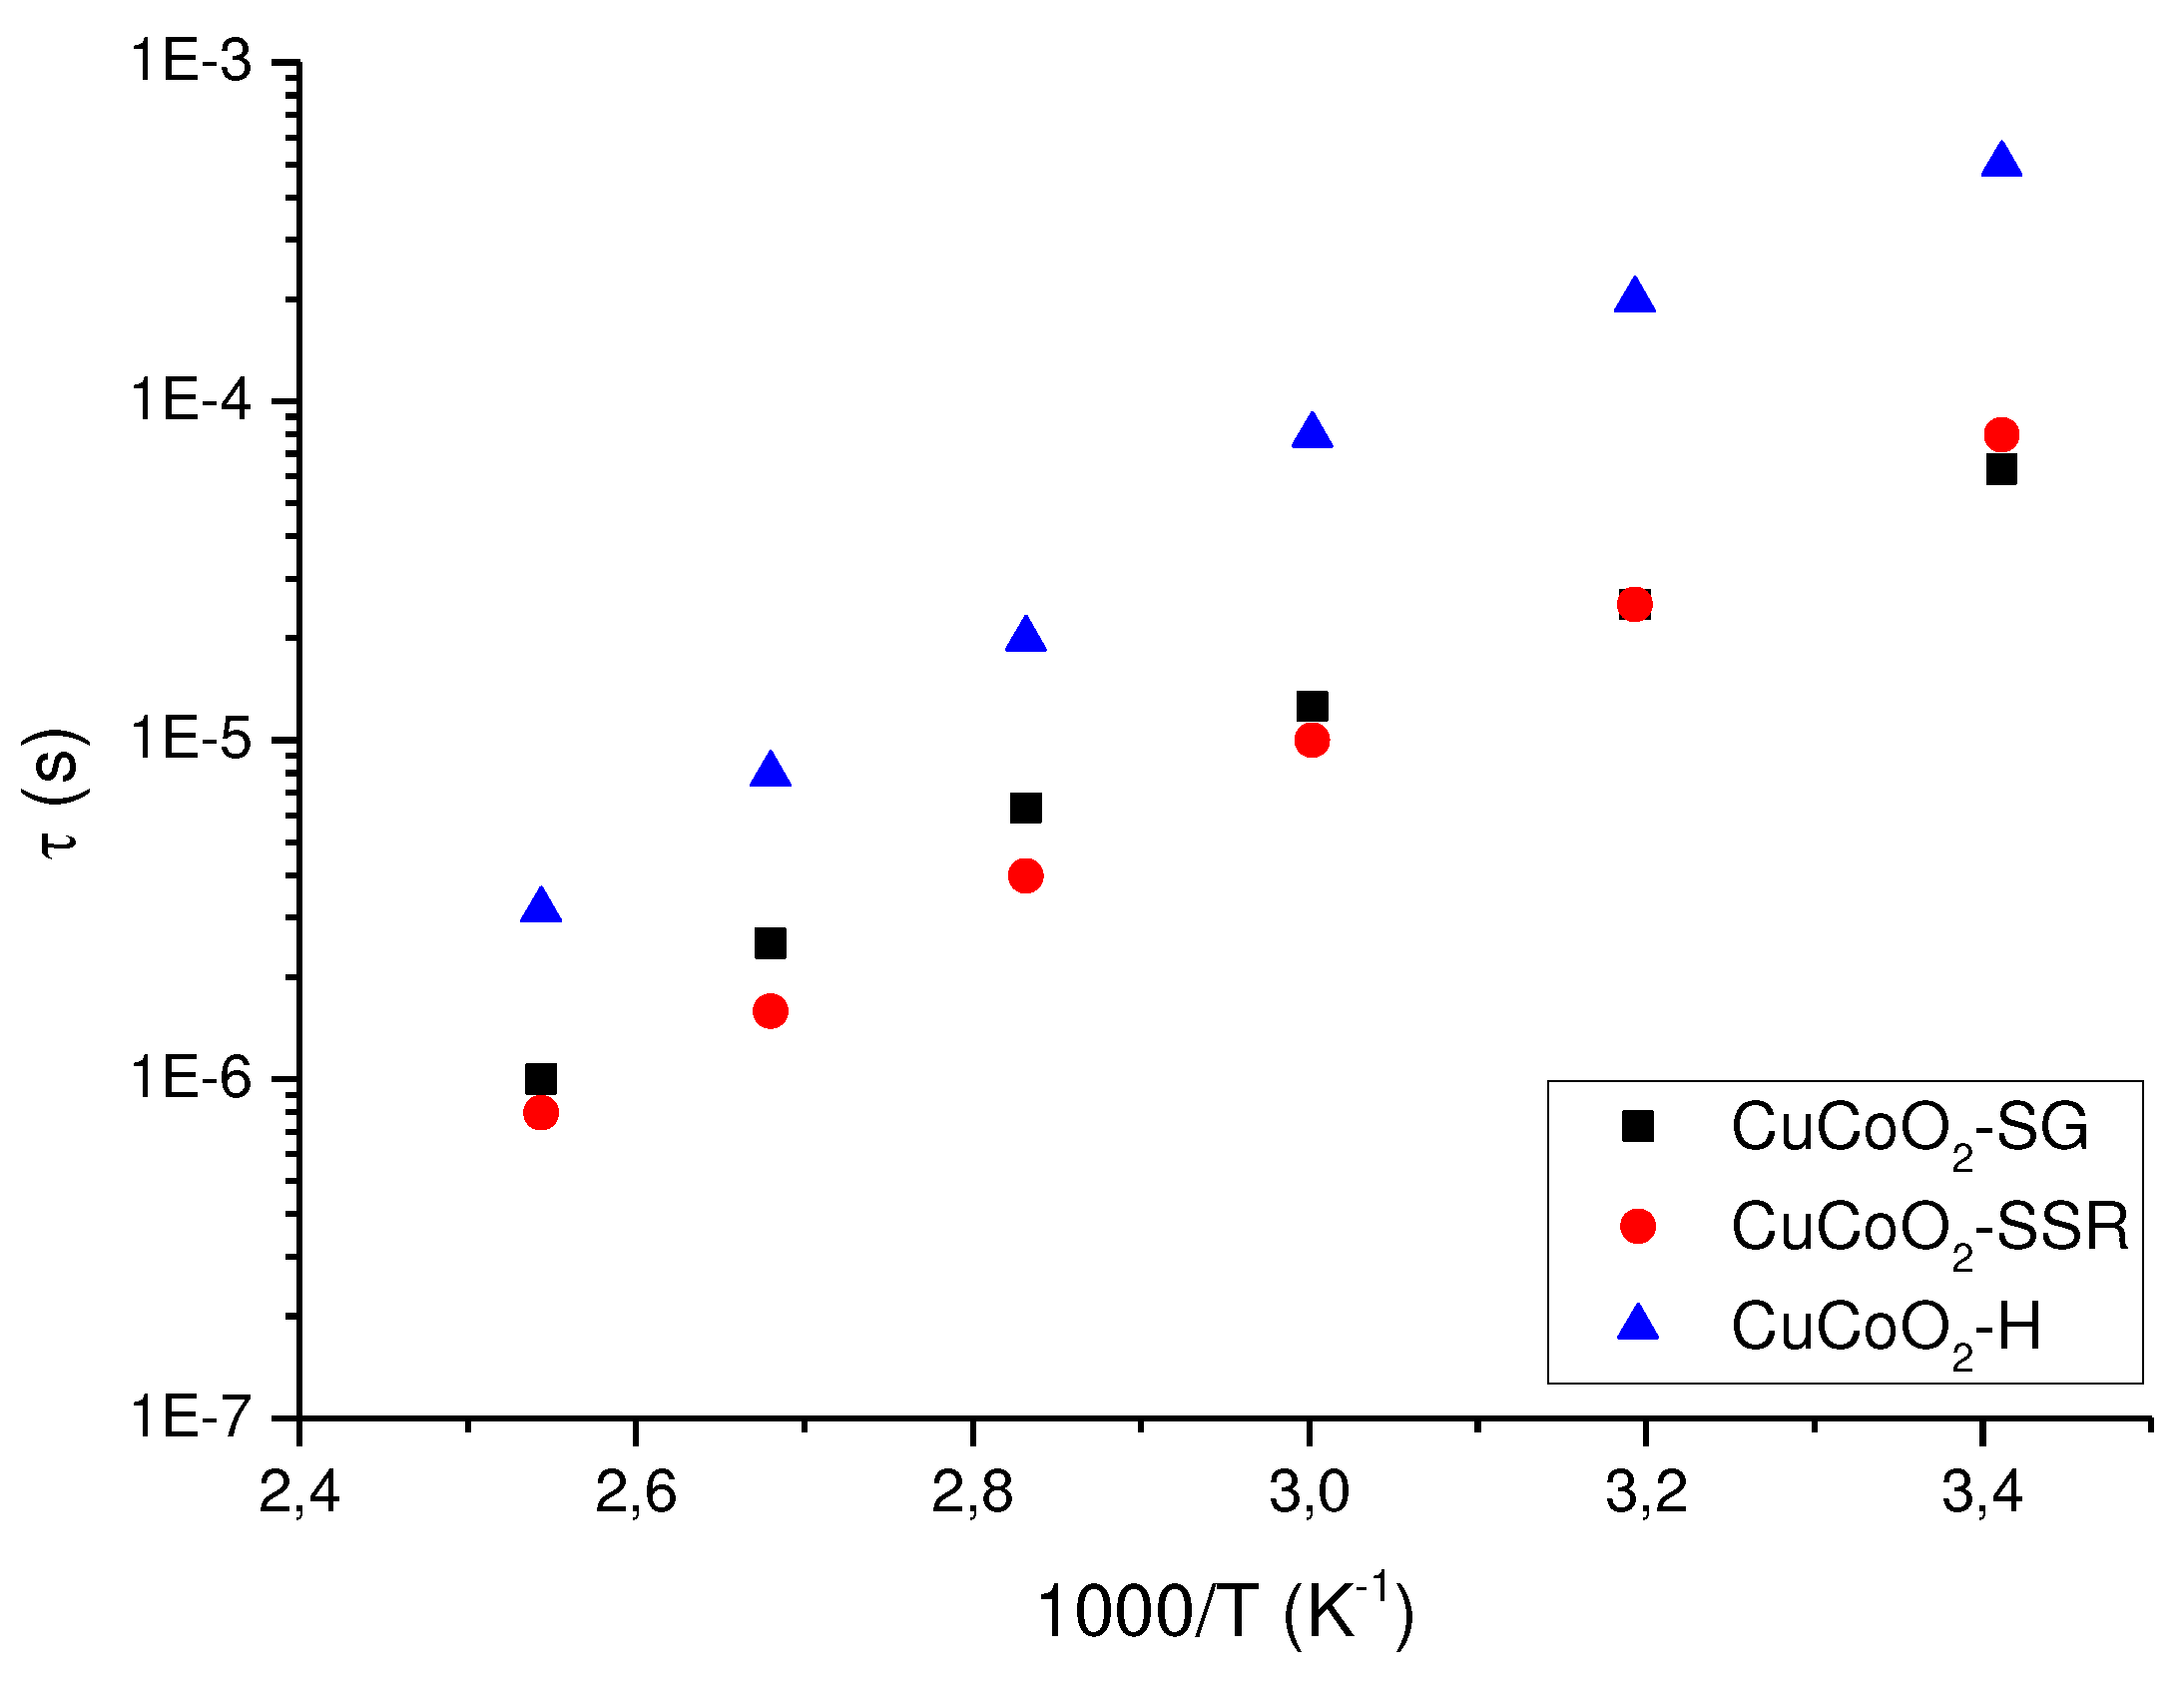
Figure 15.
Trigonal and hexagonal structures of . The atoms of Cu are represented in blue; O atoms are presented in red, and the metal atoms lies inside the green octahedral.
Figure 15.
Trigonal and hexagonal structures of . The atoms of Cu are represented in blue; O atoms are presented in red, and the metal atoms lies inside the green octahedral.
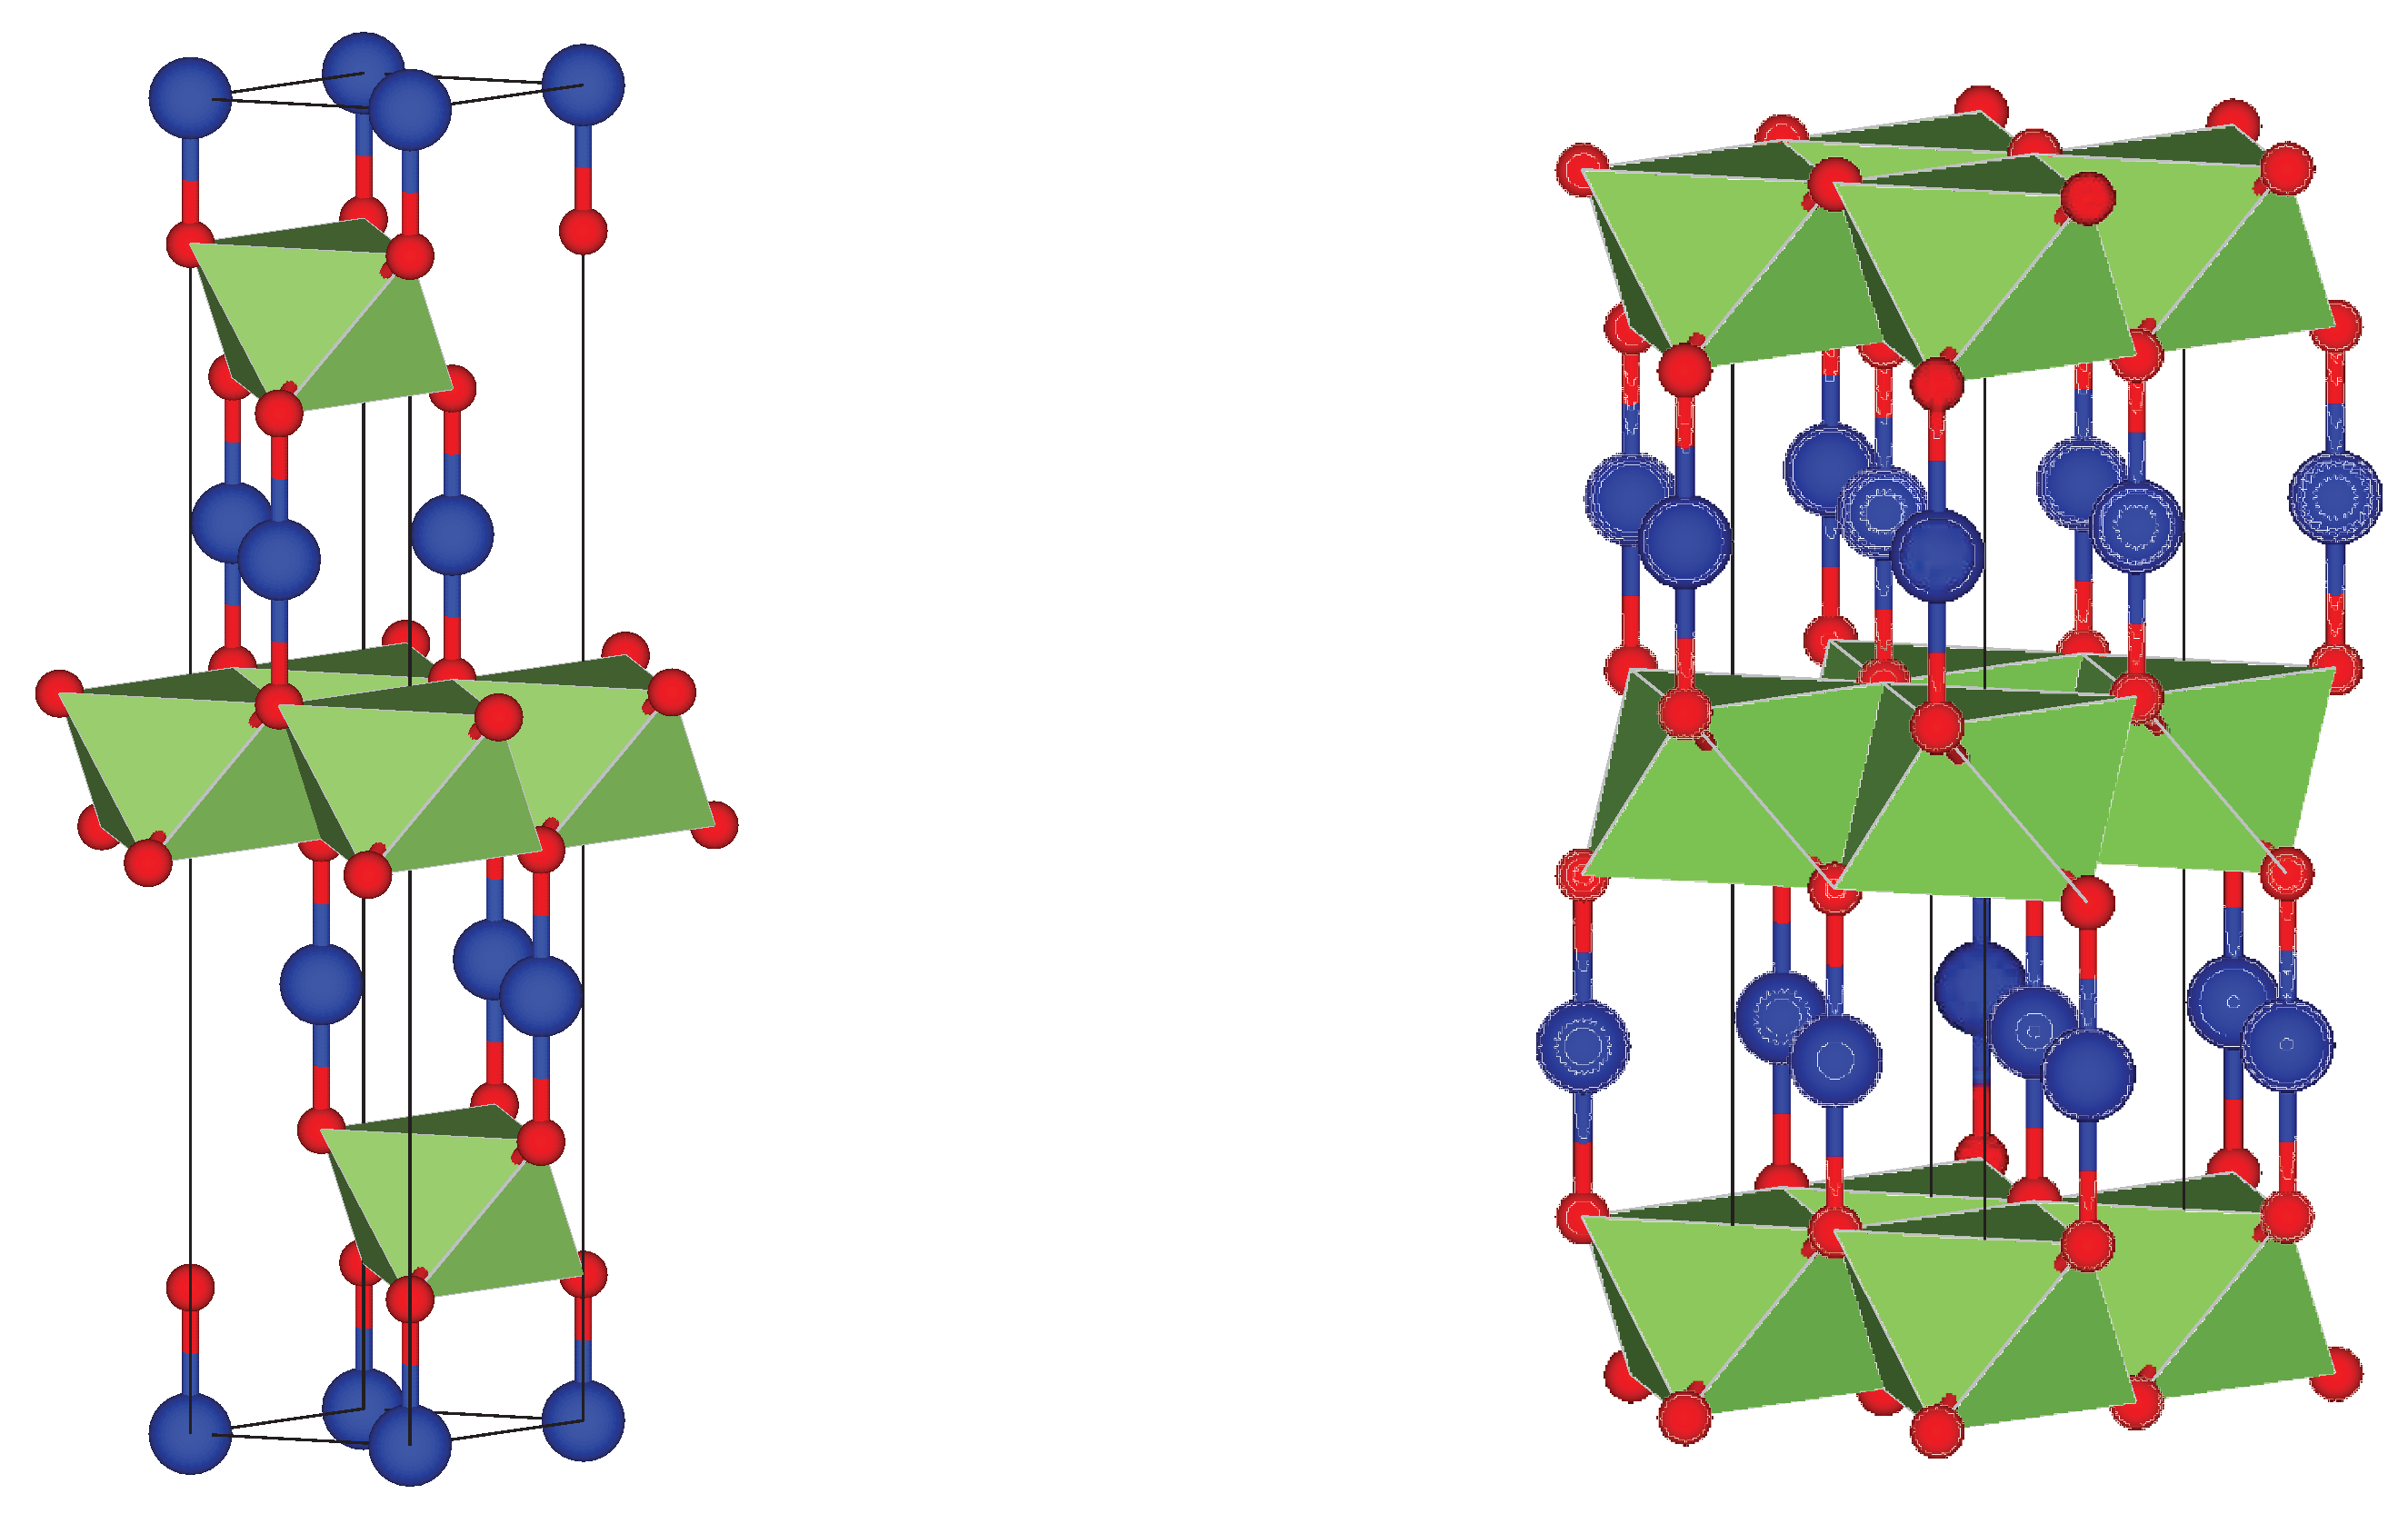
Figure 16.
Bands structure (left) and states’ density (right) acquired by HSE simulations for the tetragonal structure. Energies are expressed with respect to the Fermi Energy. Black line accounts for total DOS in the right part, and coloured lines accounts for the contribution of every species to the density of states: Co atoms are represented by pink, Cu atoms by red, and O atoms by green.
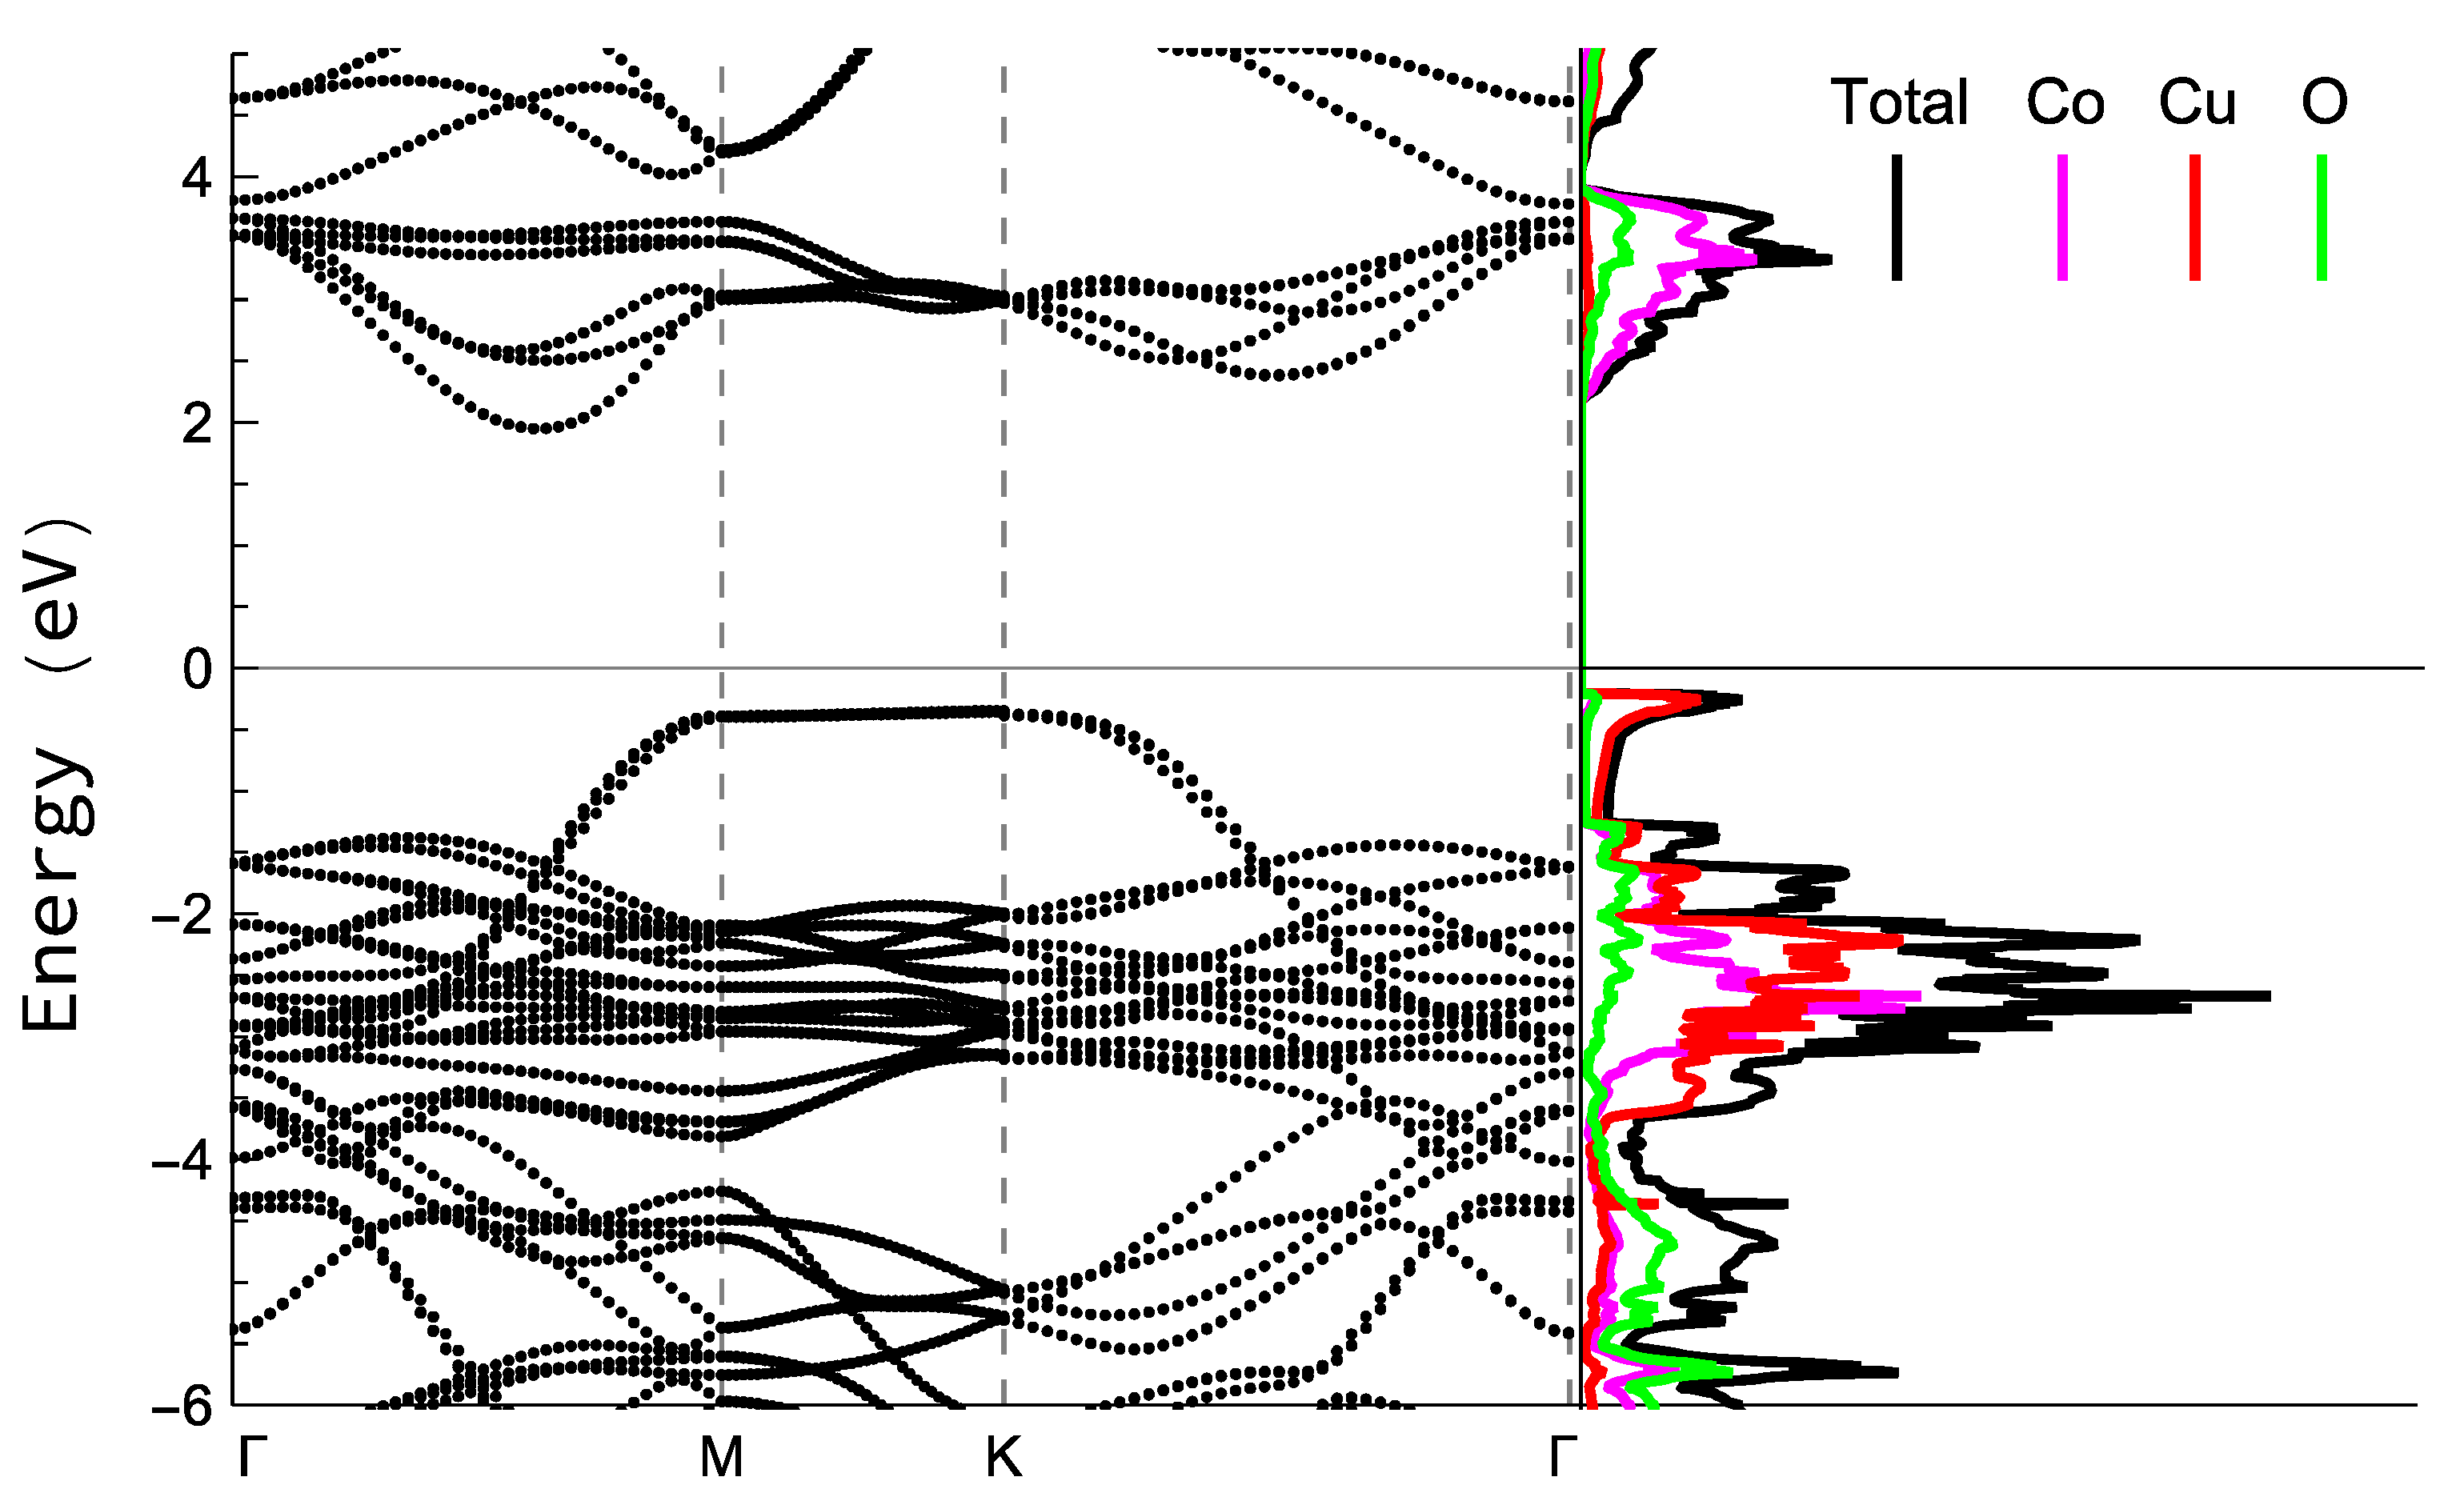

Table 1.
The electrical properties of the CuCoO2 thin films determined at ambient temperature.
| Samples | Thickness(nm) | Sheet Resistivity(ρs)×10-3(Ω.cm) | Sheet resistance (Rs)(Ω) | Sheet Conductivity ×103 (S.cm-1) |
|---|---|---|---|---|
| CuCoO2_H | 140±5 | 0.114 ±0.002 | 8.16±0.05 | 8.8±0.2 |
| CuCoO2_SG | 136±5 | 0.105±0.002 | 7.70±0.04 | 9.5±0.2 |
| CuCoO2_SSR | 142±5 | 0.116±0.002 | 8.16±0.04 | 8.6±0.2 |
Disclaimer/Publisher’s Note: The statements, opinions and data contained in all publications are solely those of the individual author(s) and contributor(s) and not of MDPI and/or the editor(s). MDPI and/or the editor(s) disclaim responsibility for any injury to people or property resulting from any ideas, methods, instructions or products referred to in the content. |
© 2023 by the authors. Licensee MDPI, Basel, Switzerland. This article is an open access article distributed under the terms and conditions of the Creative Commons Attribution (CC BY) license (http://creativecommons.org/licenses/by/4.0/).
Copyright: This open access article is published under a Creative Commons CC BY 4.0 license, which permit the free download, distribution, and reuse, provided that the author and preprint are cited in any reuse.


