
Submitted:
19 July 2023
Posted:
19 July 2023
You are already at the latest version
Abstract
Changes in coastal topography can affect the ecological environment and marine industries. In this study, we analyzed the patterns and causes of changes in shoreline and undersea topography in the Nakdong River estuary in the southeast of South Korea using depth and shoreline surveys of the estuary, as well as data on discharge, suspended sediments, and precipitation in the Nakdong River basin. The results showed that erosion and sedimentation occurred repeatedly owing to complex factors such as the discharge of the estuary and invasion by open sea waves. However, no clear unilateral trend was observed. Unlike previous survey data, a large amount of erosion occurred in the second half of 2020. Previously, sedimentation was the main process, but erosion occurred rapidly, which was observed in the summer of 2020 when the erosion was three times higher than that in other periods owing to the severe rainy season and torrential rains for over a month. In addition, regarding the flow rate and force of the river water outflow, the amount of discharge increased rapidly, causing erosion. Moreover, a strong typhoon in the summer of 2020 affected the topography of the estuary.
Keywords:
Nakdong River estuary
; shoreline survey
; discharge
; sediment
; erosion
; bathymetry
; sandbar
; topography
1. Introduction
Data on coastal topography and offshore areas are crucial for interpreting spatial and temporal changes. In particular, the importance of coastal topography and offshore data has been recognized in the modern society with the development of the marine industries. The construction of large-scale artificial structures for dredging and landfilling in offshore areas alters the natural topography, leading to changes in water flow patterns, magnitude, wave characteristics, and other related factors. Such changes in hydraulic mechanics result in variations in sedimentation, causing alterations in the existing topography and substrates [1,2]. Estuarine areas possess particularly complex hydraulic characteristics, and artificial structures alter these hydraulic properties, leading to multifaceted changes in topographical features. In addition, estuarine areas are where seawater and freshwater mix, and considerable amounts of sediment, transported from upstream, are deposited as the water depth and velocity decrease, leading to the development of numerous sandbars, both large and small, parallel to the shoreline [3,4,5]. Shorelines are directly affected by the relationship between the discharge of suspended sediment and the flow rate of a river estuary. Monitoring changes in the coastline is essential to conserve ecosystems, and the preservation of marine ecosystems is necessary for maintaining human livelihoods.
The estuary of the Nakdong River, in the southeast of Korea, has undergone important artificial environmental changes since the 1980s. These include the development of industrial complexes, the construction of levees along the river, and the development of the surrounding areas, such as the establishment of residential areas through landfill and the construction of the New Port. Recently, as a part of a large-scale smart city industrial project, a scheme to create an international eco-friendly cultural city in this region is underway, making it an even more crucial area in terms of its transformation.
The Nakdong River estuary has undergone considerable changes in terms of its topography owing to frequent industrial and residential development, including the construction of artificial structures and large-scale projects that affect the mixing of fresh- and saltwater [6]. Additionally, the construction of the estuary embankment has altered the pattern of intermittent mixing between the freshwater and saltwater, causing continuous sedimentation near previously formed islands owing to a loss of momentum toward the open sea [6]. Topographical changes, in both seafloor topography and sandbar formation, are occurring extensively throughout the estuarine region [7,8,9,10,11].
Currently, the estuarine area of the Nakdong River is a subject of research in various fields owing to its social and environmental importance. Kim et al. [12] explored the characteristics of changes in the downstream oceanic physical environment depending on the opening and closing of the Nakdong River estuarine dike. Kim and Kim [13] studied the discharge tendencies of the outflow water according to the structural shape of the estuary dam to examine the tendency of geomorphic changes in the southern part of the estuary. Park et al. [14] studied the topographical changes on Jinwoo and Shinja Islands in the Nakdong River estuary from 2007 to 2012. Park et al. [15] analyzed changes in the seafloor topography in the southern part of Jinwoo Island, comparing the results with the effects of typhoons. Recently, aerial photographs and satellite images have been actively analyzed. For example, Kim et al. [16] analyzed the coastal erosion rate of the sandbar area using aerial surveys and Jung et al. [17] analyzed the coastal erosion rate of the sandbars in the Nakdong River estuary using aerial photographs and SPOT-5 satellite images. Park et al. [18] monitored changes in the river mouth and tidal flat using a video monitoring system for Doyo sandbar. Additionally, Kim et al. [16] conducted a quantitative analysis of the coastline change rate of sandbars in the Nakdong River estuary using aerial photographs. Global studies have also used remote sensing data, such as aerial photographs and artificial satellite images, to analyze coastal terrain changes [19]. Following the coronavirus disease 2019 (COVID-19) lockdowns, when industrial activities increased again, the technique of order of preference by similarity to ideal solution method was used to evaluate a water-quality monitoring network for 34 tributaries in the Nakdong River basin, and information necessary for setting up and managing a water-quality monitoring system was presented [20]. The analysis of coastal seafloor changes using remote sensing data has the advantage of easy acquisition of comprehensive data, but it has the disadvantage of low accuracy compared to direct survey data. Studies on the correlation between environmental factors and changes in the topography of estuarine areas have also been conducted. Jeon et al. [21] studied the basics of the formation and development of topography in sandbars in the Nakdong River estuary by analyzing the surface sediment transport rate. Jang and Kim [22] analyzed the ocean circulation in the Nakdong River estuary to elucidate the patterns of marine environmental changes. Kim and Kim [23] also analyzed the factors affecting geomorphic changes in the estuary, specifically the influence of environmental factors, such as the discharge rate of the estuarine dike and meteorological factors.
In this study, we aimed to elucidate the patterns of coastal topographical changes in the Nakdong River estuary from 2018 to 2022 using bathymetric data and coastline survey data obtained during this period, as well as precipitation data from the Korea Meteorological Administration [24] and water discharge and suspended sediment discharge data from the Nakdong River estuary dike managed by K-Water Corporation [25]. We conducted a comprehensive comparative analysis of these data, taking seasonal variations into account.
2. Materials and Methods
2.1. Study Area
We focused on the Nakdong River estuary, in the southeastern part of South Korea, as shown in Figure 1. With a length of approximately 513.5 km, the Nakdong River is the third longest river in South Korea. Owing to its geographical features, large quantities of sediments from upstream are deposited in downstream areas with shallow depths and reduced flow velocities, resulting in the development of multiple sandbars parallel to the coastline. In this study, bathymetric data were acquired for the sandbars and surrounding seafloor of the Nakdong River estuary to analyze changes over time.
2.2. Data Acquisition
Coastal surveys and bathymetric investigations were conducted simultaneously to identify coastal changes and analyze seafloor topographical changes caused by sedimentation around the sandbars at the mouth of the Nakdong River. Nine data acquisition surveys were conducted from the second half of 2018 (October) to the second half of 2022 (October) to analyze the river mouth sandbars and overall seabed topography. The surveys were conducted consistently in April for the first half of the year and October for the second half of the year. The survey schedule is shown in Table 1.
2.2.1. Shoreline Surveys
Shoreline surveys were conducted using Sokkia GRX1 and GSX2 Global Navigation Satellite System receivers (Sokkia Topcon, Atsugi, Japan), as shown in Table 2. The shoreline was surveyed at two sandbars formed by sedimentation. To obtain accurate results, a triangulation network was formed using nearby tidal benchmarks and adjusted accordingly. The survey was conducted at low and high tides based on tidal forecasts. The coastline was measured every 10–15 m, and Figure 2 shows the surveying process. The results of the shoreline survey were processed using the Universal Transverse Mercator coordinate system, and the heights were based on Korean National Geoid 14. In addition, the data obtained through the field survey were compared with the data surveyed by period using the AutoCAD program, which is effective for creating 2D drawings or 3D object files by sketching/drawing and designing them with graphics software.
2.2.2. Bathymetry Survey
The bathymetry survey was conducted using the Aqua Ruler 200 echosounder from Sonar Tech Co., Ltd. (Busan, South Korea). The detailed specifications of the equipment used are shown in Table 3. The bathymetry survey data were corrected for sound velocity and draft using the bar-check procedure. The tidal elevation was corrected using tidal data from the Gaduk Island tidal station of the Korea Hydrographic and Oceanographic Agency to convert the data to the Gadeok Island datum. The horizontal position of the offshore area was determined using Trimble's Differential Global Positioning System, and both shoreline survey results and offshore horizontal positions were determined using the Universal Transverse Mercator coordinate system. Figure 3 shows the shoreline survey and seabed topography investigation system.
2.2.3. Effects of Meteorological Factors
The data on the discharge of the Nakdong River estuary dike and the outflow of suspended sediments were obtained from K-Water Corporation (K-WATER) [22], and the precipitation data for Busan, Gimhae, and Yangsan weather observation stations (Korea Meteorological Administration) [23] are presented as average values.
The data from May 2018 to October 2022 were divided into semi-annual data. The period from the previous November to the following April was classified as the first half of the year and that from May to October as the second half of the year. This is because the seafloor topography surveys were conducted in April and October.
3. Results and Discussion
3.1. Bathymeric Changes in Survey Area
The maximum depth of the southern survey area (near the sandbars) was approximately 9.5 m, regardless of the survey period. The depth data from 2018 to 2022 are shown in Figure 4, and the overall depth range was from (+)1.9 m to (−)9.5 m, based on the datum level (D.L. 0 m) benchmark of Gaduk Island.
3.2. Bathymetric Changes in Channel Sections
The sandbars in the study area are not connected to the mainland at either end, forming embayments. Therefore, channels are formed between each sandbar, and erosion and deposition trends in these channels were analyzed by dividing them into four sections from Area A to D, as shown in Figure 5. Each survey was conducted along three to five survey lines, spaced 100 m apart, in the north–south (vertical) and east–west (horizontal) directions, as shown in Table 4.
Area A is characterized by a narrow channel where the waterway narrows owing to the nearby bridge, river, and port outflow. Both outflow from the inner part of the coastal shoal and inflow from the outside of the southern part of the shoal occur as the water flows into the estuary. Therefore, there is a higher possibility of changes in the underwater topography compared with that in the other areas. Similar to Area A, Area B also experiences heavy ship traffic, whereas Areas C and D are channels through which the main stream of the Nakdong River is discharged. Area C is the most strongly affected by discharge from the Nakdong River, whereas Area D can also be considered a major tributary, despite its narrow waterway, owing to discharge from the Nakdong River estuary dike.
As shown in Figure 6, erosion and deposition appear to occur repeatedly in the survey area, with erosion observed in April after a period of low rainfall and deposition observed in October after a period of heavy rainfall. In Area B, there is a tendency for the southern pit to move westward and the northern pit to move eastward. This area, which is the main waterway of the West Nakdong River, is subject to repeated erosion and sedimentation owing to various factors, such as discharge from the Nakdong River estuary dike and the intrusion of waves from the open sea. In some areas where the flow rate decreases, sedimentation occurs owing to the transport of suspended sediment from inland by the West Nakdong River. In other areas with relatively fast flow rates, erosion occurs. This tendency is particularly intensified by external forces, such as heavy rainfall and typhoon waves, increasing the vulnerability of terrain changes by external force. The analysis of the survey lines in Areas C and D revealed that in Area C, there is a tendency for erosion to occur to the east of the survey line. This tendency can be attributed to the influence of the discharge from the Nakdong River, which causes the main channel to move in the north and east directions toward the Nakdong River estuary. The seasonal phenomenon of erosion in the first half of the year and sedimentation in the second half of the year, which has been observed in the past, continued in the study period. In addition, owing to the increase in discharge from the Nakdong River during the typhoon season in 2020, the eastern part of the main channel in the Nakdong River estuary showed a tendency towards erosion. The southern part of the main channel, which is the inlet for the discharge from the Nakdong River, did not show a substantial change in shape, but erosion occurred overall, resulting in an increase in the width of the channel. This trend was also observed in Area D. In both Areas C and D, erosion was more prominent than sedimentation in the second half of 2020, which is thought to be the result of significant changes in the topography caused by a sudden increase in discharge from the Nakdong River estuary dike and the effects of typhoons in the summer of 2020.
3.3. Shoreline Changes
The analysis of shoreline changes was conducted in the coastal areas adjacent to Areas B and C (Figure 6; Shorelines 1 and 2, respectively), which are heavily influenced by the main stream of the Nakdong River. Figure 7 provides a detailed representation of the range of the shoreline changes.
In the Nakdong River estuary, the sandbars change position in response to differences in tidal currents, and changes in the shoreline can considerably affect the marine ecosystem. In particular, the Eulsuk Island, which lays immediately above the river mouth and includes a sandbar, is a highly valuable environmental and ecological habitat for migratory birds.
The analysis of Shorelines 1 and 2 represented on CAD (Figure 8) showed that the range of the coastal indentations is changing owing to differences between high and low tides. For Shoreline 1, the shape of the terrain changed based on the tide level, with the reference point being October 2020. This is considered to be associated with changes in the terrain caused by the typhoons MAYSAK and HAISHEN that passed through South Korea in 2020. As shown in Figure 9, in October 2020, it was confirmed that Shoreline 2 was interrupted and a channel was formed.
Furthermore, by analyzing the height distributions and changes in the planar position of the shoreline from a total of nine shoreline surveys, it was found that the height values of the same location increased from 2018 to April 2020. As shown in Figure 10, the maximum height values of both Shorelines 1 and 2 increased. This observation indicates that sediment deposition occurred every year, leading to an increase in the height of the shoreline.
After October 2020, both Shorelines 1 and 2 showed decreasing trends in height, followed by increasing trends. This phenomenon was attributed to erosion caused by typhoons, as observed in the previous analysis of shoreline range. However, in October 2022, Shorelines 1 and 2 showed different patterns. Shoreline 1, where the industrial complex is located, showed erosion, whereas Shoreline 2 exhibited deposition. The industrial wastewater may have affected Shoreline 1, and with the end of the COVID-19 lockdowns, the discharge of industrial wastewater increased, causing an increase in flow velocity in the narrow channel, leading to erosion rather than deposition. In contrast, Shoreline 2 showed relatively slow deposition as suspended sediment flowed slowly through the wider channel, probably facilitated by the increased discharge from the Nakdong River estuary.
3.4. Analysis of Discharge in the Nakdong River Estuary Dike
The hydraulic factor that primarily influences the bathymetry in the estuary is the inflow of river water. The underwater topography is affected by not only the supply of sediments but also various physical environmental factors that cause erosion and deposition. The estuary, which hosts the confluence of freshwater and saltwater, can also be influenced by density gradients caused by the difference in density between freshwater and saltwater, affecting the transport of suspended particles, as well as, the bathymetry changes owing to various meteorological factors such as tides, waves, and other weather conditions.
The study area experiences repeated erosion and sedimentation events owing to various factors, such as discharge from the Nakdong River estuary dike and inundation of waves from the open sea. There appears to be no unilateral tendency in the area. In particular, Area C, which is directly affected by the discharge from the Nakdong River estuary dike, is influenced by two canals (the Eulsuk Island and Myeongji shipping routes) that drain into the open sea. The seabed topography has been found to fluctuate repeatedly between erosion and deposition. Figure 11 shows the data on the discharge of the Nakdong River estuary dike, outflow of suspended sediment, and precipitation in the Busan area.
The precipitation data obtained from the Korea Meteorological Administration revealed that both discharge and suspended sediment discharge change similarly when precipitation increases or decreases. This result may be considered to be obvious given that increased precipitation leads to increased inflow to the Nakdong River, and the increased water flow can naturally explain the increase in the sediment discharge. The results in Figure 5 show a general trend that as the discharge increases, the suspended sediment discharge also increases. However, compared with that in the second halves of 2018, 2019, and 2021, the discharge in the second half of 2020 increased by approximately 3-fold, but the suspended sediment discharge decreased or remained almost the same. The seasonal effect showed a clear trend, with a decrease in the first half and an increase in the second half of the year for both discharge and suspended sediment discharge, reflecting the amount of precipitation. However, it was found that the suspended sediment discharge did not increase in proportion to the discharge.
In the latter half of 2020, the average discharge of the Nakdong River estuary dike increased by approximately 2.5-fold compared with that in the same period in previous years owing to heavy rainfall that affected the Korean Peninsula during the summer of 2020. The increase in discharge is estimated to have affected the topography of the estuary. Until the first half of 2020, according to the main outflow route of the discharge from the estuary dike, the Doyo sandbar area was eroded, whereas the Shinja Island area, which was less affected by the discharge, showed a tendency to accumulate sediment. However, analysis in the latter half of 2020 showed that a considerable amount of the Doyo sandbar area had been eroded, and it is necessary to confirm whether the bathymetry will return to its previous trend of erosion in the first half of the year and sedimentation in the second half.
Factors such as waves, tides, and typhoons can considerably affect topographical changes in the estuarine region. Recent typhoons have been characterized by short cycles and strong intensities, resulting in cumulative effects of typhoons before the area could be restored to its original state. The erosional topography was formed by the rapid increase in discharge caused by concentrated heavy rains and prolonged monsoons, and it is believed that numerous topographical changes have occurred since then owing to subsequent typhoons.
4. Conclusions
We conducted nine shoreline and bathymetry surveys in the Nakdong River estuary and analyzed the factors that affect seafloor topography and sandbar morphology in this area by comprehensively analyzing the discharge, suspended sediment concentration, and precipitation in the Nakdong River estuary over 6-month periods, including the shoreline and bathymetry survey periods.
Erosion occurred repeatedly in the first half of the year and sedimentation in the second half, owing to various factors such as discharge from the Nakdong River estuary dike and intrusion of offshore waves. Upon examining the data from the second half of 2020, a significant erosion phenomenon was observed, which was different from the patterns observed in the other survey periods (which primarily showed sedimentation in the second half of the year). Additionally, the adjacent narrow channel expanded substantially. The shoreline survey results also showed a continuous deposition pattern, which was eroded in the latter half of 2020. This is because, during this period, there was over a month of heavy rain and several instances of concentrated heavy rain, causing the discharge volume in 2020 to increase by approximately 3-fold. The increased discharge volume is speculated to have washed away the sediment more strongly owing to the increase in sedimentation, countering the sedimentation effect and resulting in erosion. In addition, the erosion effect was greater than the sedimentation effect because of the large typhoons that passed through the area. Therefore, the topographical changes in the Nakdong River estuary in 2020 are considered to be formed by a combination of the rapid increase in discharge from the Nakdong River dike and the complex action of typhoons.
The study area is a region of high social and environmental interest, and continuous field investigations are necessary to analyze the effects of environmental factors such as seabed topography and meteorological factors. A comprehensive analysis of the data obtained through numerical model experiments, hydraulic model experiments, and field investigations is needed for long-term research and data acquisition, along with research on the complex effects of changes in landforms and seabed topography on the ecological environment.
Author Contributions
Conceptualization, S.B.K.; methodology, D.P.K.; software, S.B.K.; validation, D.P.K.; formal analysis, S.B.K.; investigation, S.B.K.; resources, S.B.K.; data curation, S.B.K.; writing—original draft preparation, D.P.K.; writing—review and editing, S.B.K.; visualization, S.-B.K.; supervision, D.P.K.; project administration, D.P.K.; funding acquisition, S.B.K. All authors have read and agreed to the published version of the manuscript.
Funding
This research was funded by the Young-san University Research Fund of 2022.
Institutional Review Board Statement
Not applicable.
Informed Consent Statement
Not applicable.
Data Availability Statement
Data will be made available by the corresponding author on reasonable request.
Conflicts of Interest
The authors declare no conflict of interest. The funders had no role in the design of the study; in the collection, analyses, or interpretation of data; in the writing of the manuscript, or in the decision to publish the results.
References
- Busan Development Institute, Ecological Monitoring of the Nakdong River Estuary (2007–2008); Busan Metropolitan City: Busan, South Korea, 2008; pp. 3–5.
- Hayes, M.O. Barrier island morphology as a function of tidal and wave regime. In Barrier Islands; Leatherman, S.P., Ed.; Academic Press: New York, USA, 1979; pp. 1–27. [Google Scholar]
- Gao, S.; Collins, M.B. Analysis of grain size trends, for defining sediment transport pathways in marine environments. J. Coast. Res. 1994, 10, 70–78. [Google Scholar]
- Baily, B.; Nowell, D. Techniques for monitoring coastal change: a review and case study. Ocean Coast. Manage. 1996, 32, 85–95. [Google Scholar] [CrossRef]
- Stutz, M.L.; Pilkey, O.H. Global distribution and morphology of deltaic barrier island systems. Proc. 6th Int. Coast. Symp. 2002, 25–29. [Google Scholar] [CrossRef]
- Jang, Y.J.; Lee, J.G.; Ryu, J.H.; Kim, K.L.; Jung, H.C.; Kim, K.Y. The dataset of UAV based high-resolution tidal topography at the Nakdong Estuary: focusing on Jin-u Island and Shin-ja Island. Geo Data 2022, 4, 27–36. [Google Scholar] [CrossRef]
- Allen, J.R.L. Phase differences between bed configuration and flow in natural environments, and their geological relevance. Sedimentology 1973, 20, 323–329. [Google Scholar] [CrossRef]
- McLaren, P. An interpretation of trends in grain size measures. J. Sediment. Petrol. 1981, 51, 611–624. [Google Scholar]
- Davis, R.A.; Hayes, M.O. What is a wave-dominated coast? Mar. Geol. 1984, 60, 313–329. [Google Scholar] [CrossRef]
- Le Roux, J.P. A spreadsheet template for determining sediment transport vectors from grain-size parameters. Comput. Geosci. 1994, 20, 433–440. [Google Scholar] [CrossRef]
- Le Roux, J.P.; O'Brien, R.D.; Rios, F.; Cisternas, M. Analysis of sediment transport paths using grain-size parameters. Comput. Geosci. 2002, 28, 717–721. [Google Scholar] [CrossRef]
- Kim, K.C.; Yang, H.S.; Kim, C.K.; Moon, C.H.; Jang, S.T. Variations of physical oceanographic environment caused by opening and closing the floodgate in Nakdong estuary. J. Korean Soc. Mar. Environ. Eng. 1999, 2, 49–59. [Google Scholar]
- Kim, K.C.; Kim, S.B. Characteristics of the plume formed by the buoyant discharges from the river. J. Korean Soc. Mar. Eng. 2014, 38, 988–1001. [Google Scholar] [CrossRef]
- Park, B.W.; Kim, S.B.; Kim, J.J.; Kim, K.C. Bathymetric changes off the sea south of Jinwoo-do Island in the Nakdong River estuary. J. Korean Soc. Mar. Eng. 2016, 40, 69–74. [Google Scholar]
- Park, J.K.; Khim, B.K.; Lee, H.J.; Lee, S.R. Recent morphological changes off the shoreface of Jinwoodo and Shinjado in the Nakdong river estuary: 2007–2012. Ocean Polar Res. 2014, 36, 87–101. [Google Scholar] [CrossRef]
- Kim, B.O.; Khim, B.K.; Lee, S.R. Development of mosaic aerial photographs for shoreline change study in Nakdong estuary. Ocean Polar Res. 2005, 27, 497–507. [Google Scholar]
- Jung, S.H.; Khim, B.K.; Kim, B.O.; Lee, S.R. Shoreline-change rates of the barrier islands in Nakdong river estuary using aerial photography and SPOT-5 image. Ocean Polar Res. 2013, 35, 1–14. [Google Scholar] [CrossRef]
- Park, J.H.; Yoon, H.S.; Yoo, C.I.; Ryu, C.R. Video monitoring of shoreline changes of an offshore bar in the Nakdong River Estuary, South Korea. J. Korean Soc. Mar. Eng. 2010, 34, 575–584. [Google Scholar]
- Mahapatra, M.; Ratheesh, R.; Rajawat, A.S. Shoreline change analysis along the coast of south Gujarat, India, using digital shoreline analysis system. J Indian Soc. Remote Sens. 2014, 42, 869–876. [Google Scholar] [CrossRef]
- Shim, K.H.; Kim, D.S. Estimating Nakdong Estuary Barrage outflow using upstream hydrograph. J. Wetl. Res. 2023, 24, 44–51. [Google Scholar]
- Jeon, Y.H.; Yoon, H.S.; Lee, K.S. Spatiotemporal variations of coastal sediment transport at barrier islands in the Nakdong river estuary. J. Korean Soc. Mar. Environ. Safety 2010, 16, 161–168. [Google Scholar]
- Jang, S.T.; Kim, K.C. Change of oceanographic environment in the Nakdong Estuary. Korean Soc. Oceangr. 2006, 11, 11–20. [Google Scholar]
- Kim, K.C.; Kim, S.B. Bathymetric changes in the Nakdong River Estuary owing to discharge from the Nakdong River barrier and environmental factors. J. Environ. Sci. Int. 2021, 30, 507–517. [Google Scholar] [CrossRef]
- Korea Meteorological Administration (KMA). Available online: http://typ.kma.go.kr/ (accessed on 20 December 2022).
- K-water. Information About Quality of Water at a Multipurpose Dam. Available online: http://www.kwater.or.kr (accessed on 20 December 2022).
Figure 1.
Satellite image of the Nakdong River estuary in South Korea.
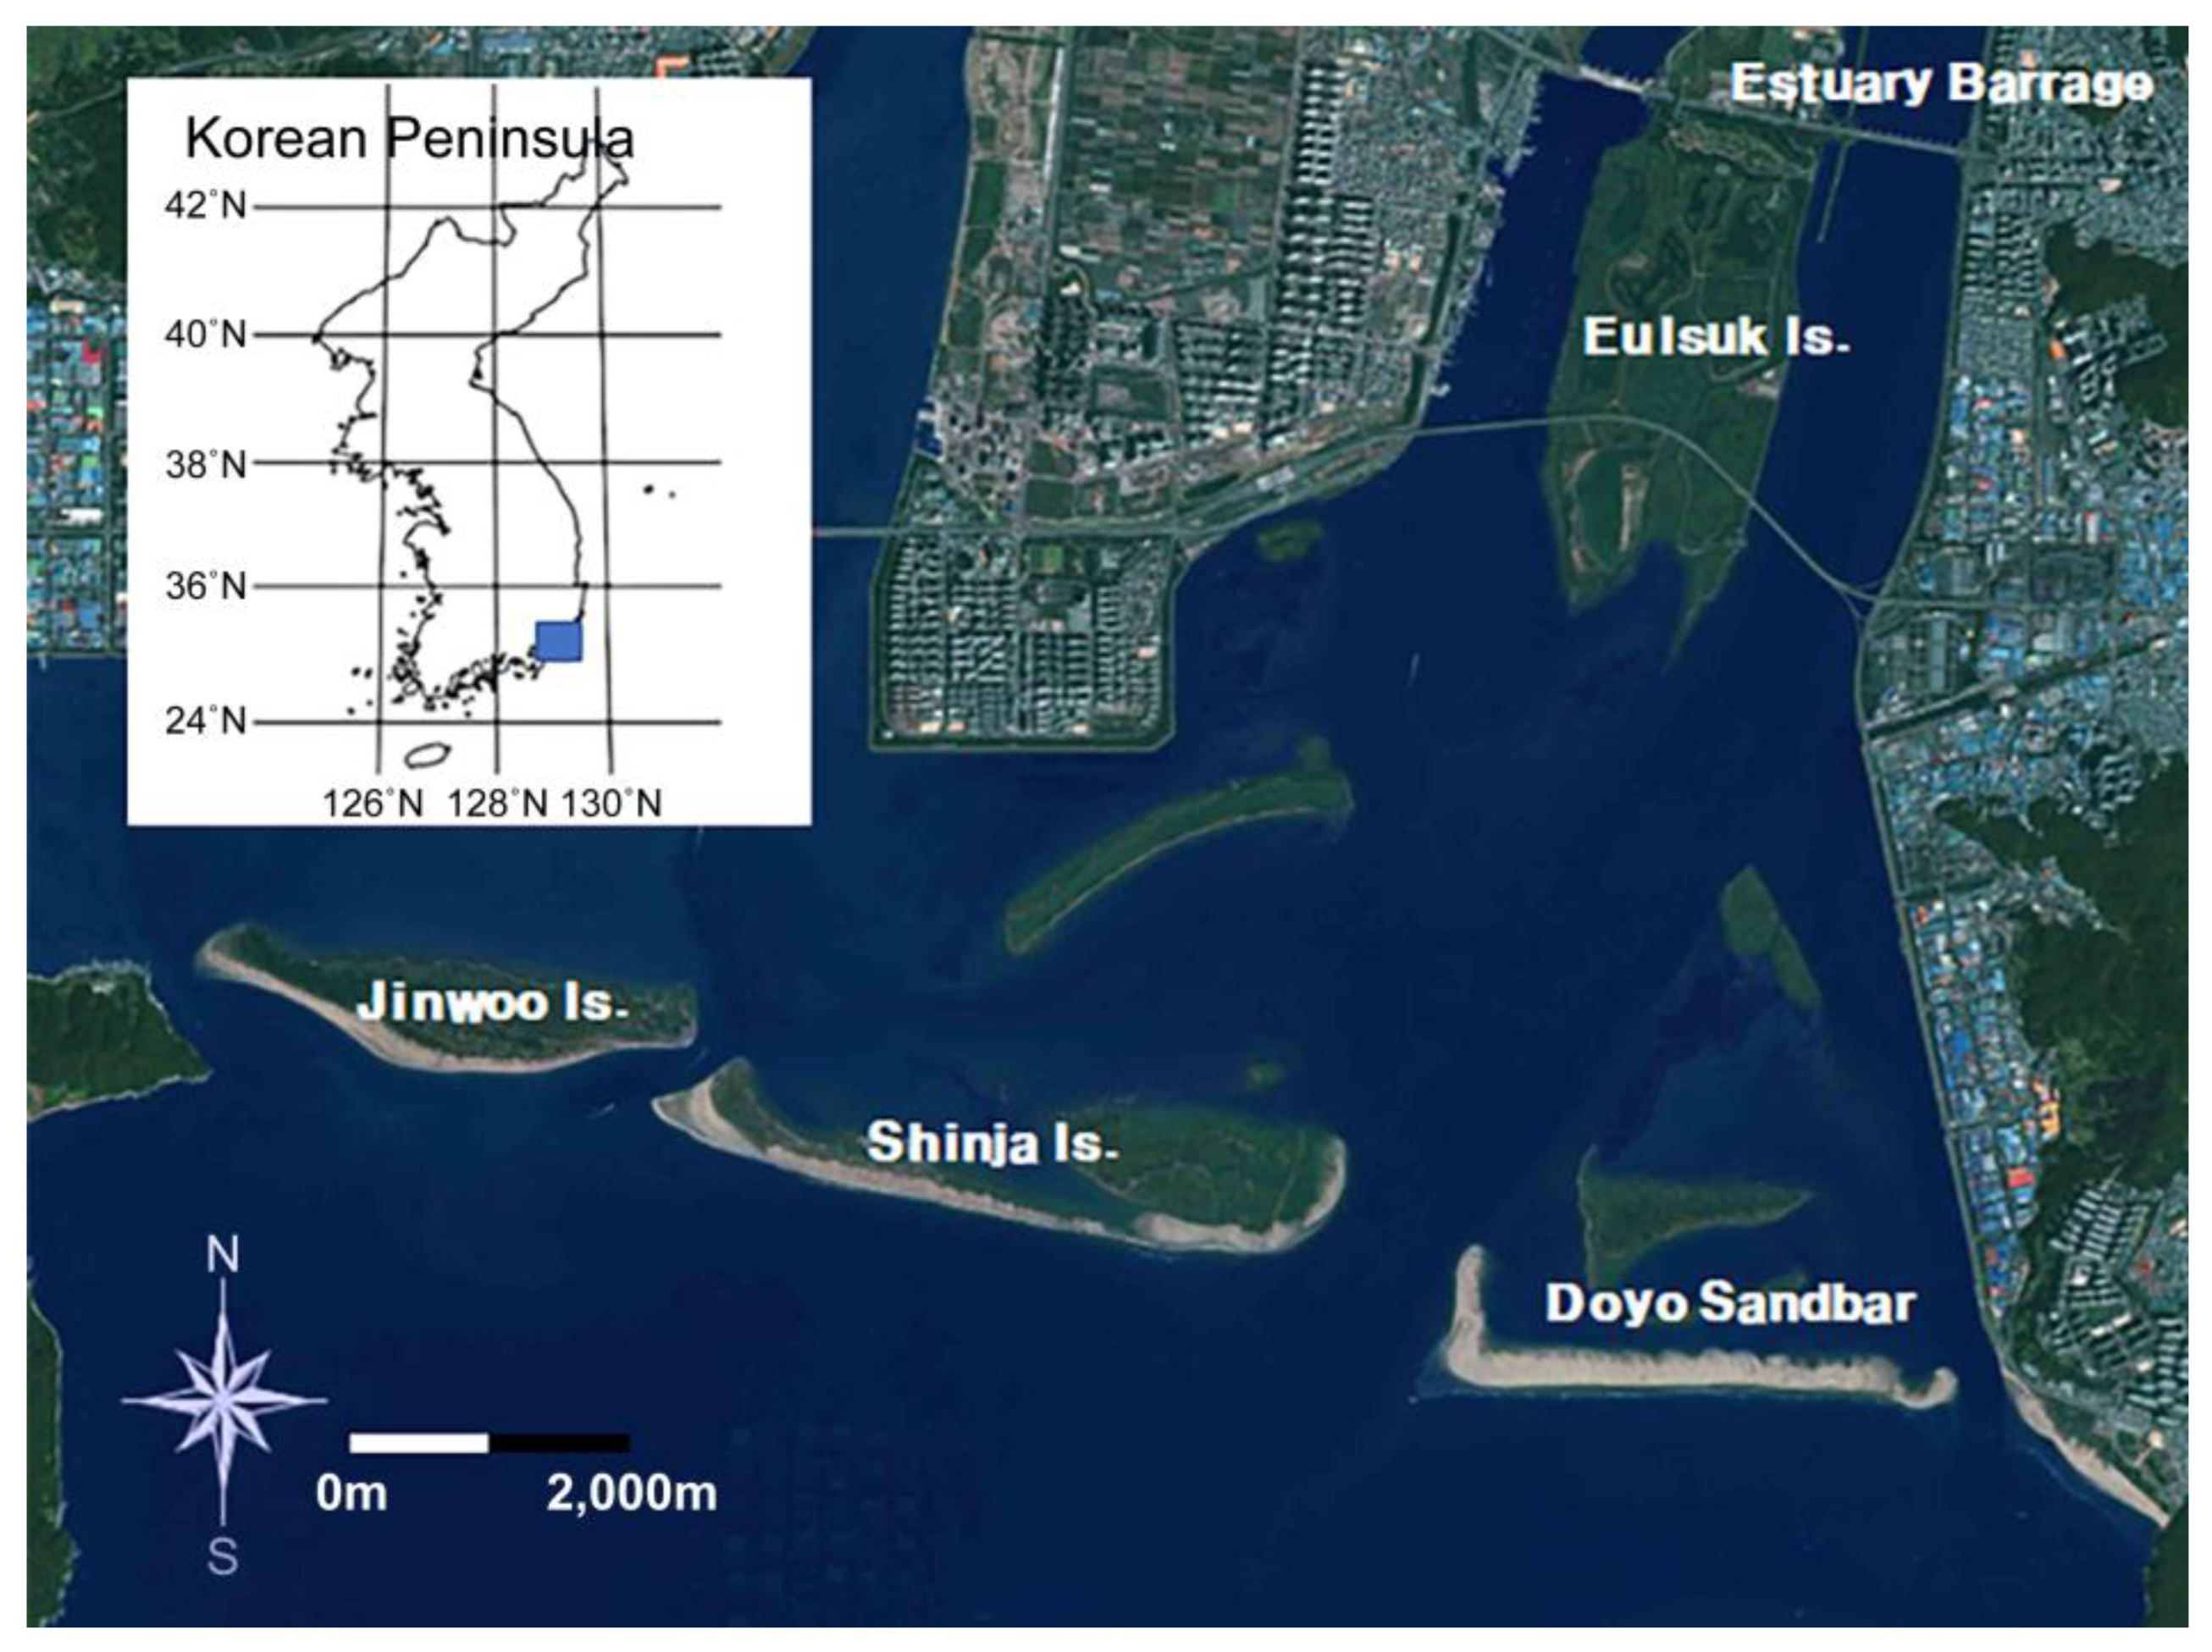
Figure 2.
Acquisition of shoreline data using GPS surveying.
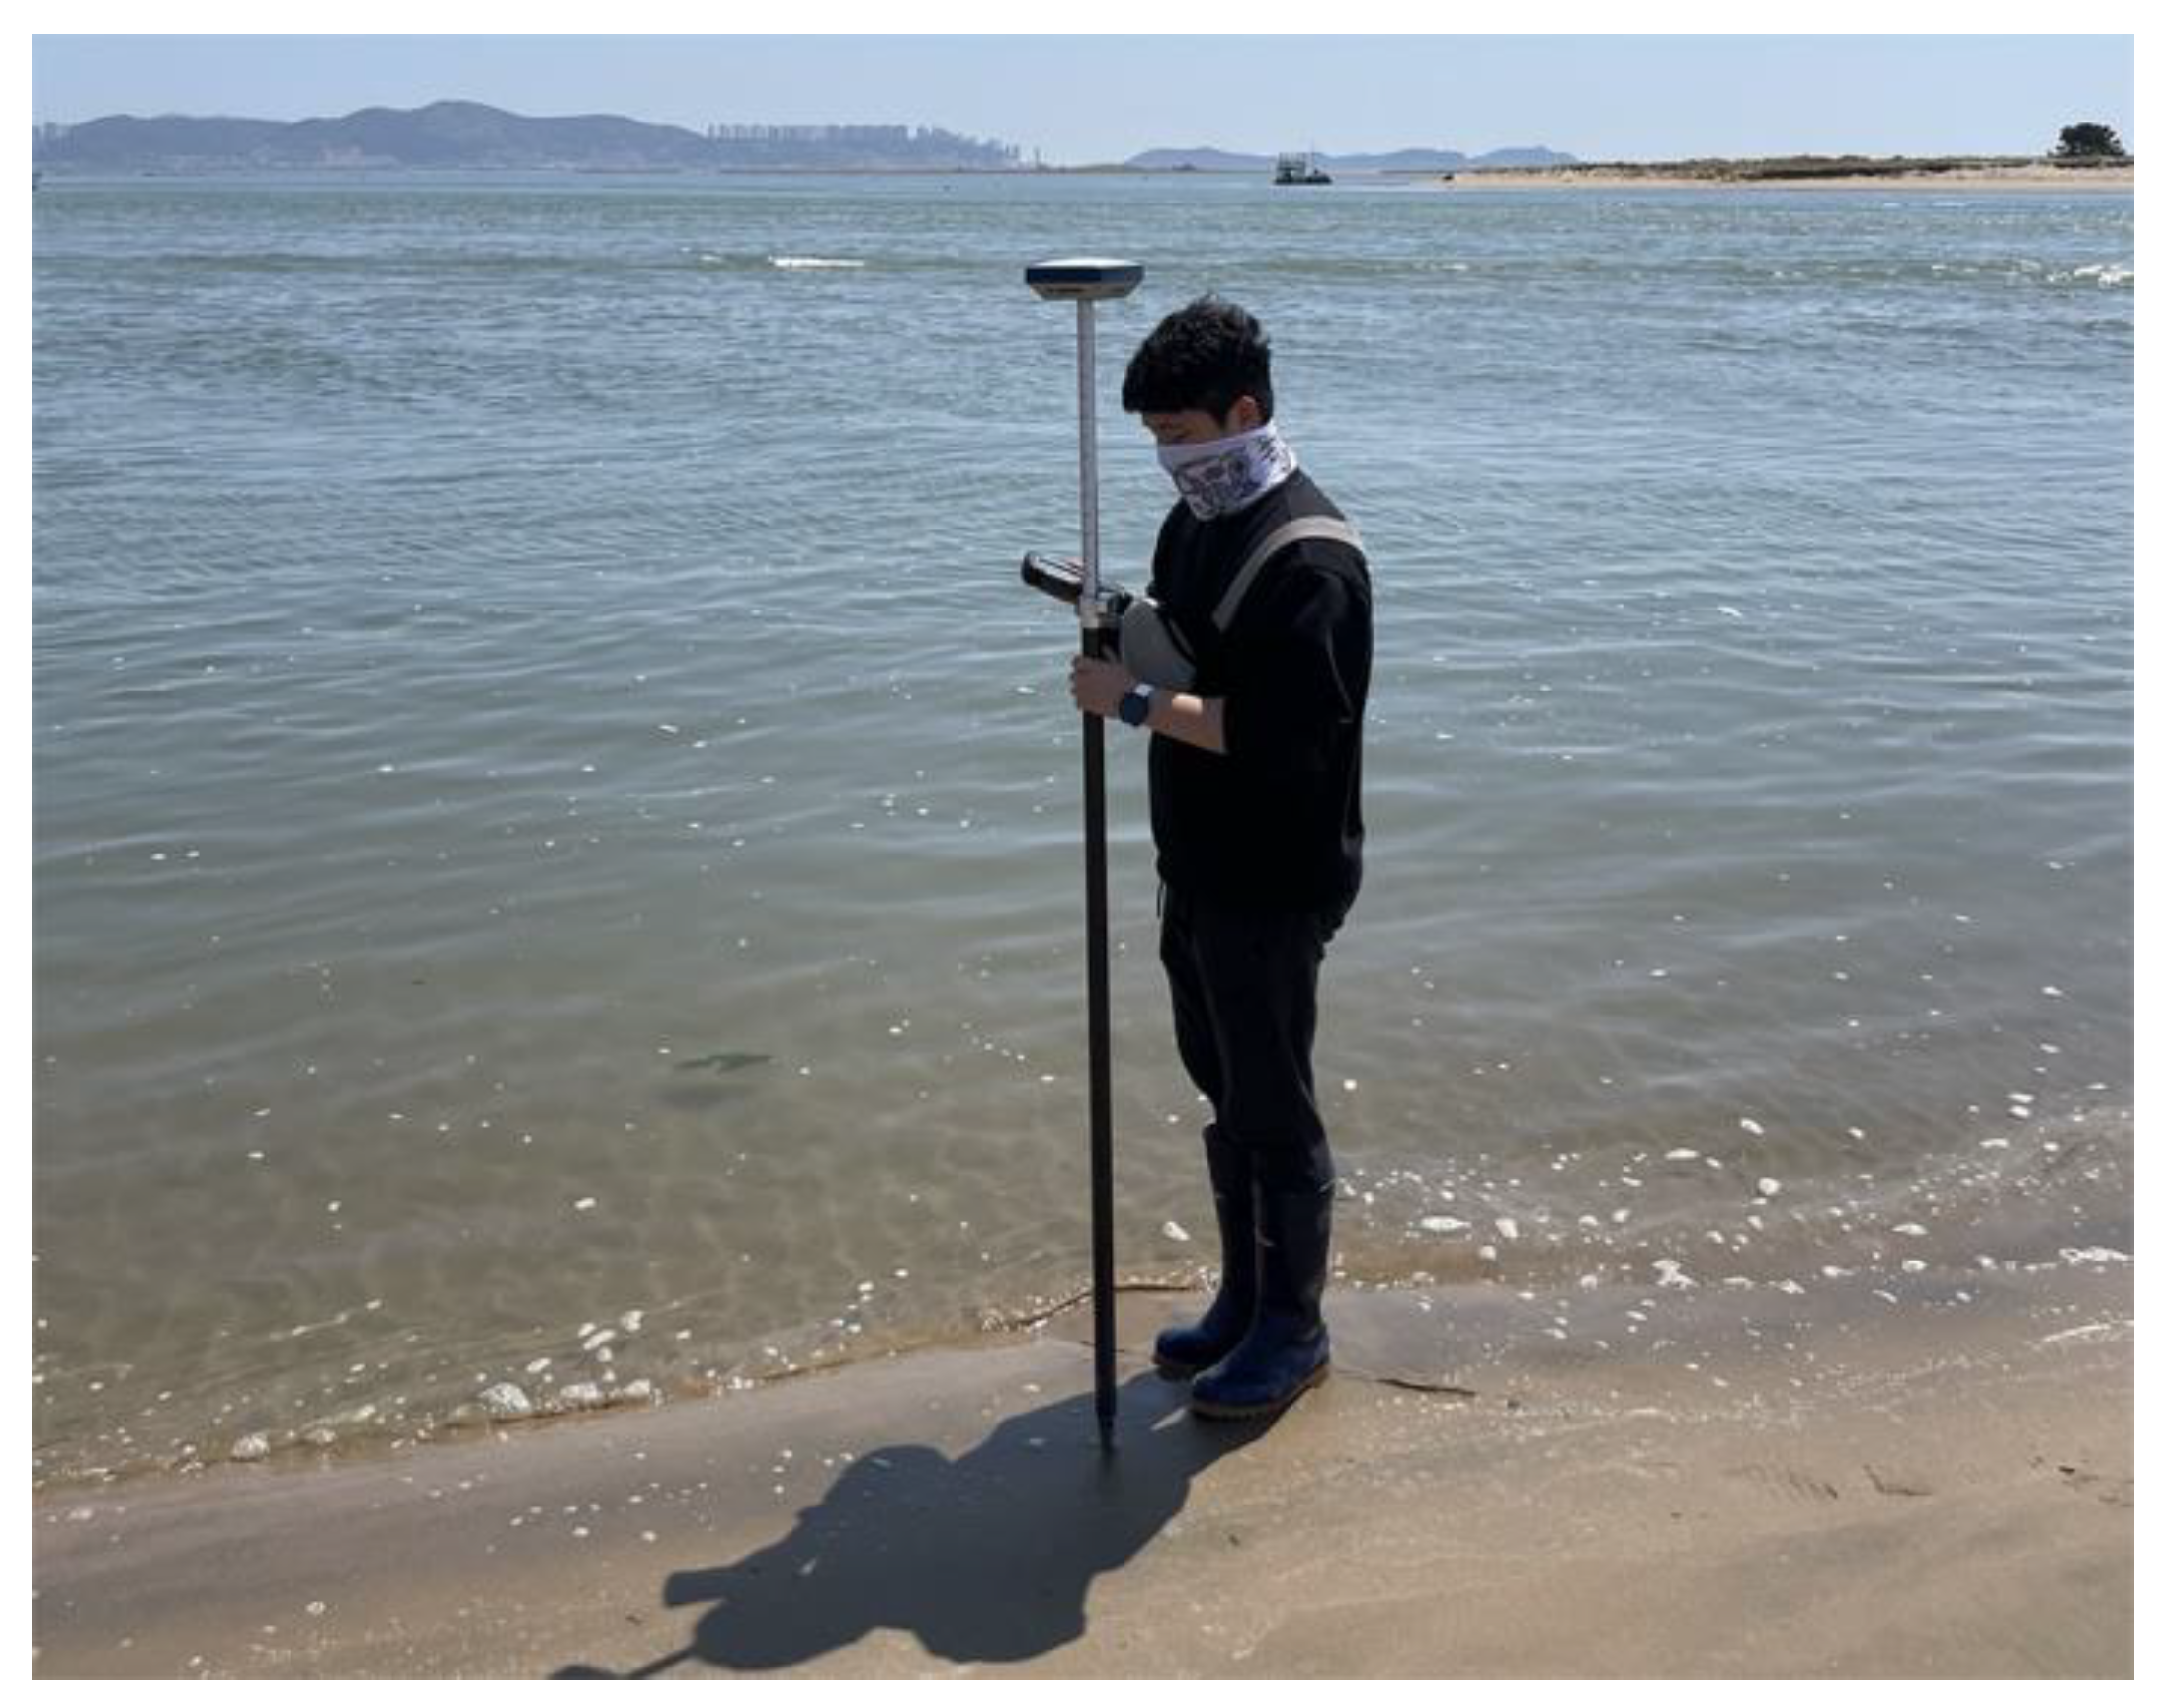
Figure 3.
Survey system for bathymetric mapping. (a) Echo sounder system; (b) echo sounder transducer mounted to the side of the ship; (c) data acquisition and navigation system; and (d) DGPS data acquirer.
Figure 3.
Survey system for bathymetric mapping. (a) Echo sounder system; (b) echo sounder transducer mounted to the side of the ship; (c) data acquisition and navigation system; and (d) DGPS data acquirer.
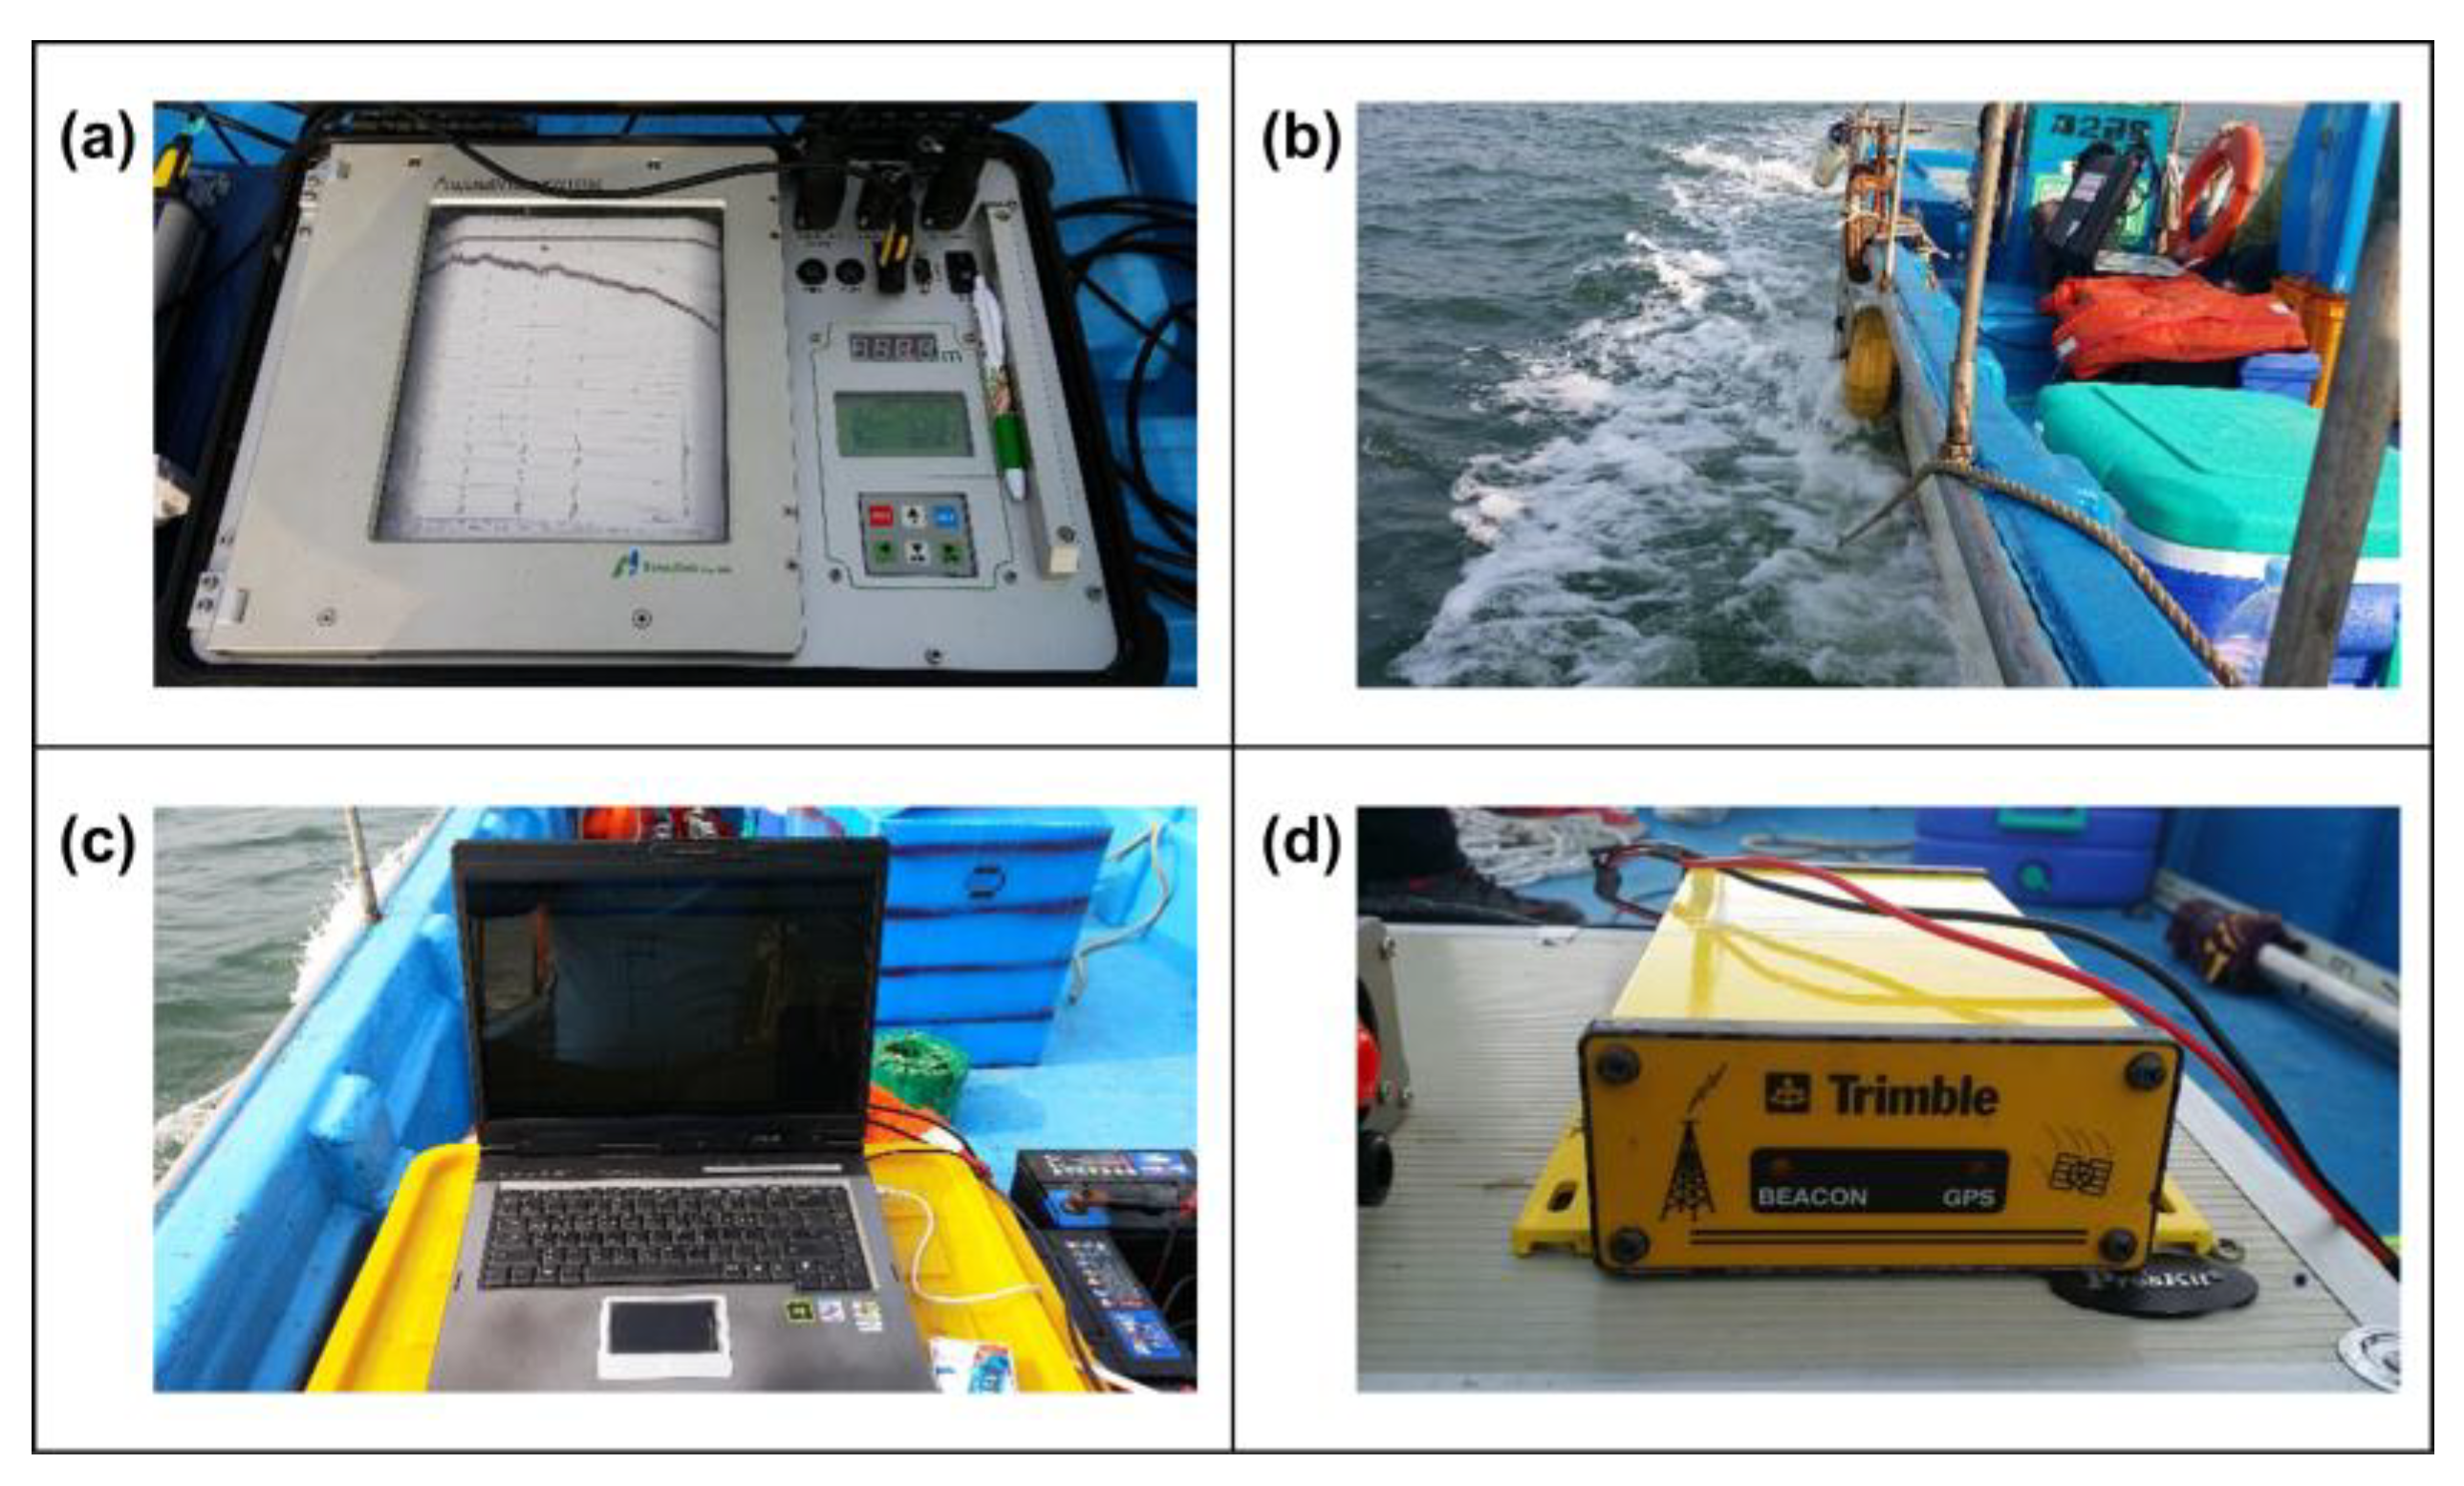
Figure 4.
Overall bathymetric data (depth) for each survey time obtained in the survey area (Oct 2018–Oct 2022).
Figure 4.
Overall bathymetric data (depth) for each survey time obtained in the survey area (Oct 2018–Oct 2022).
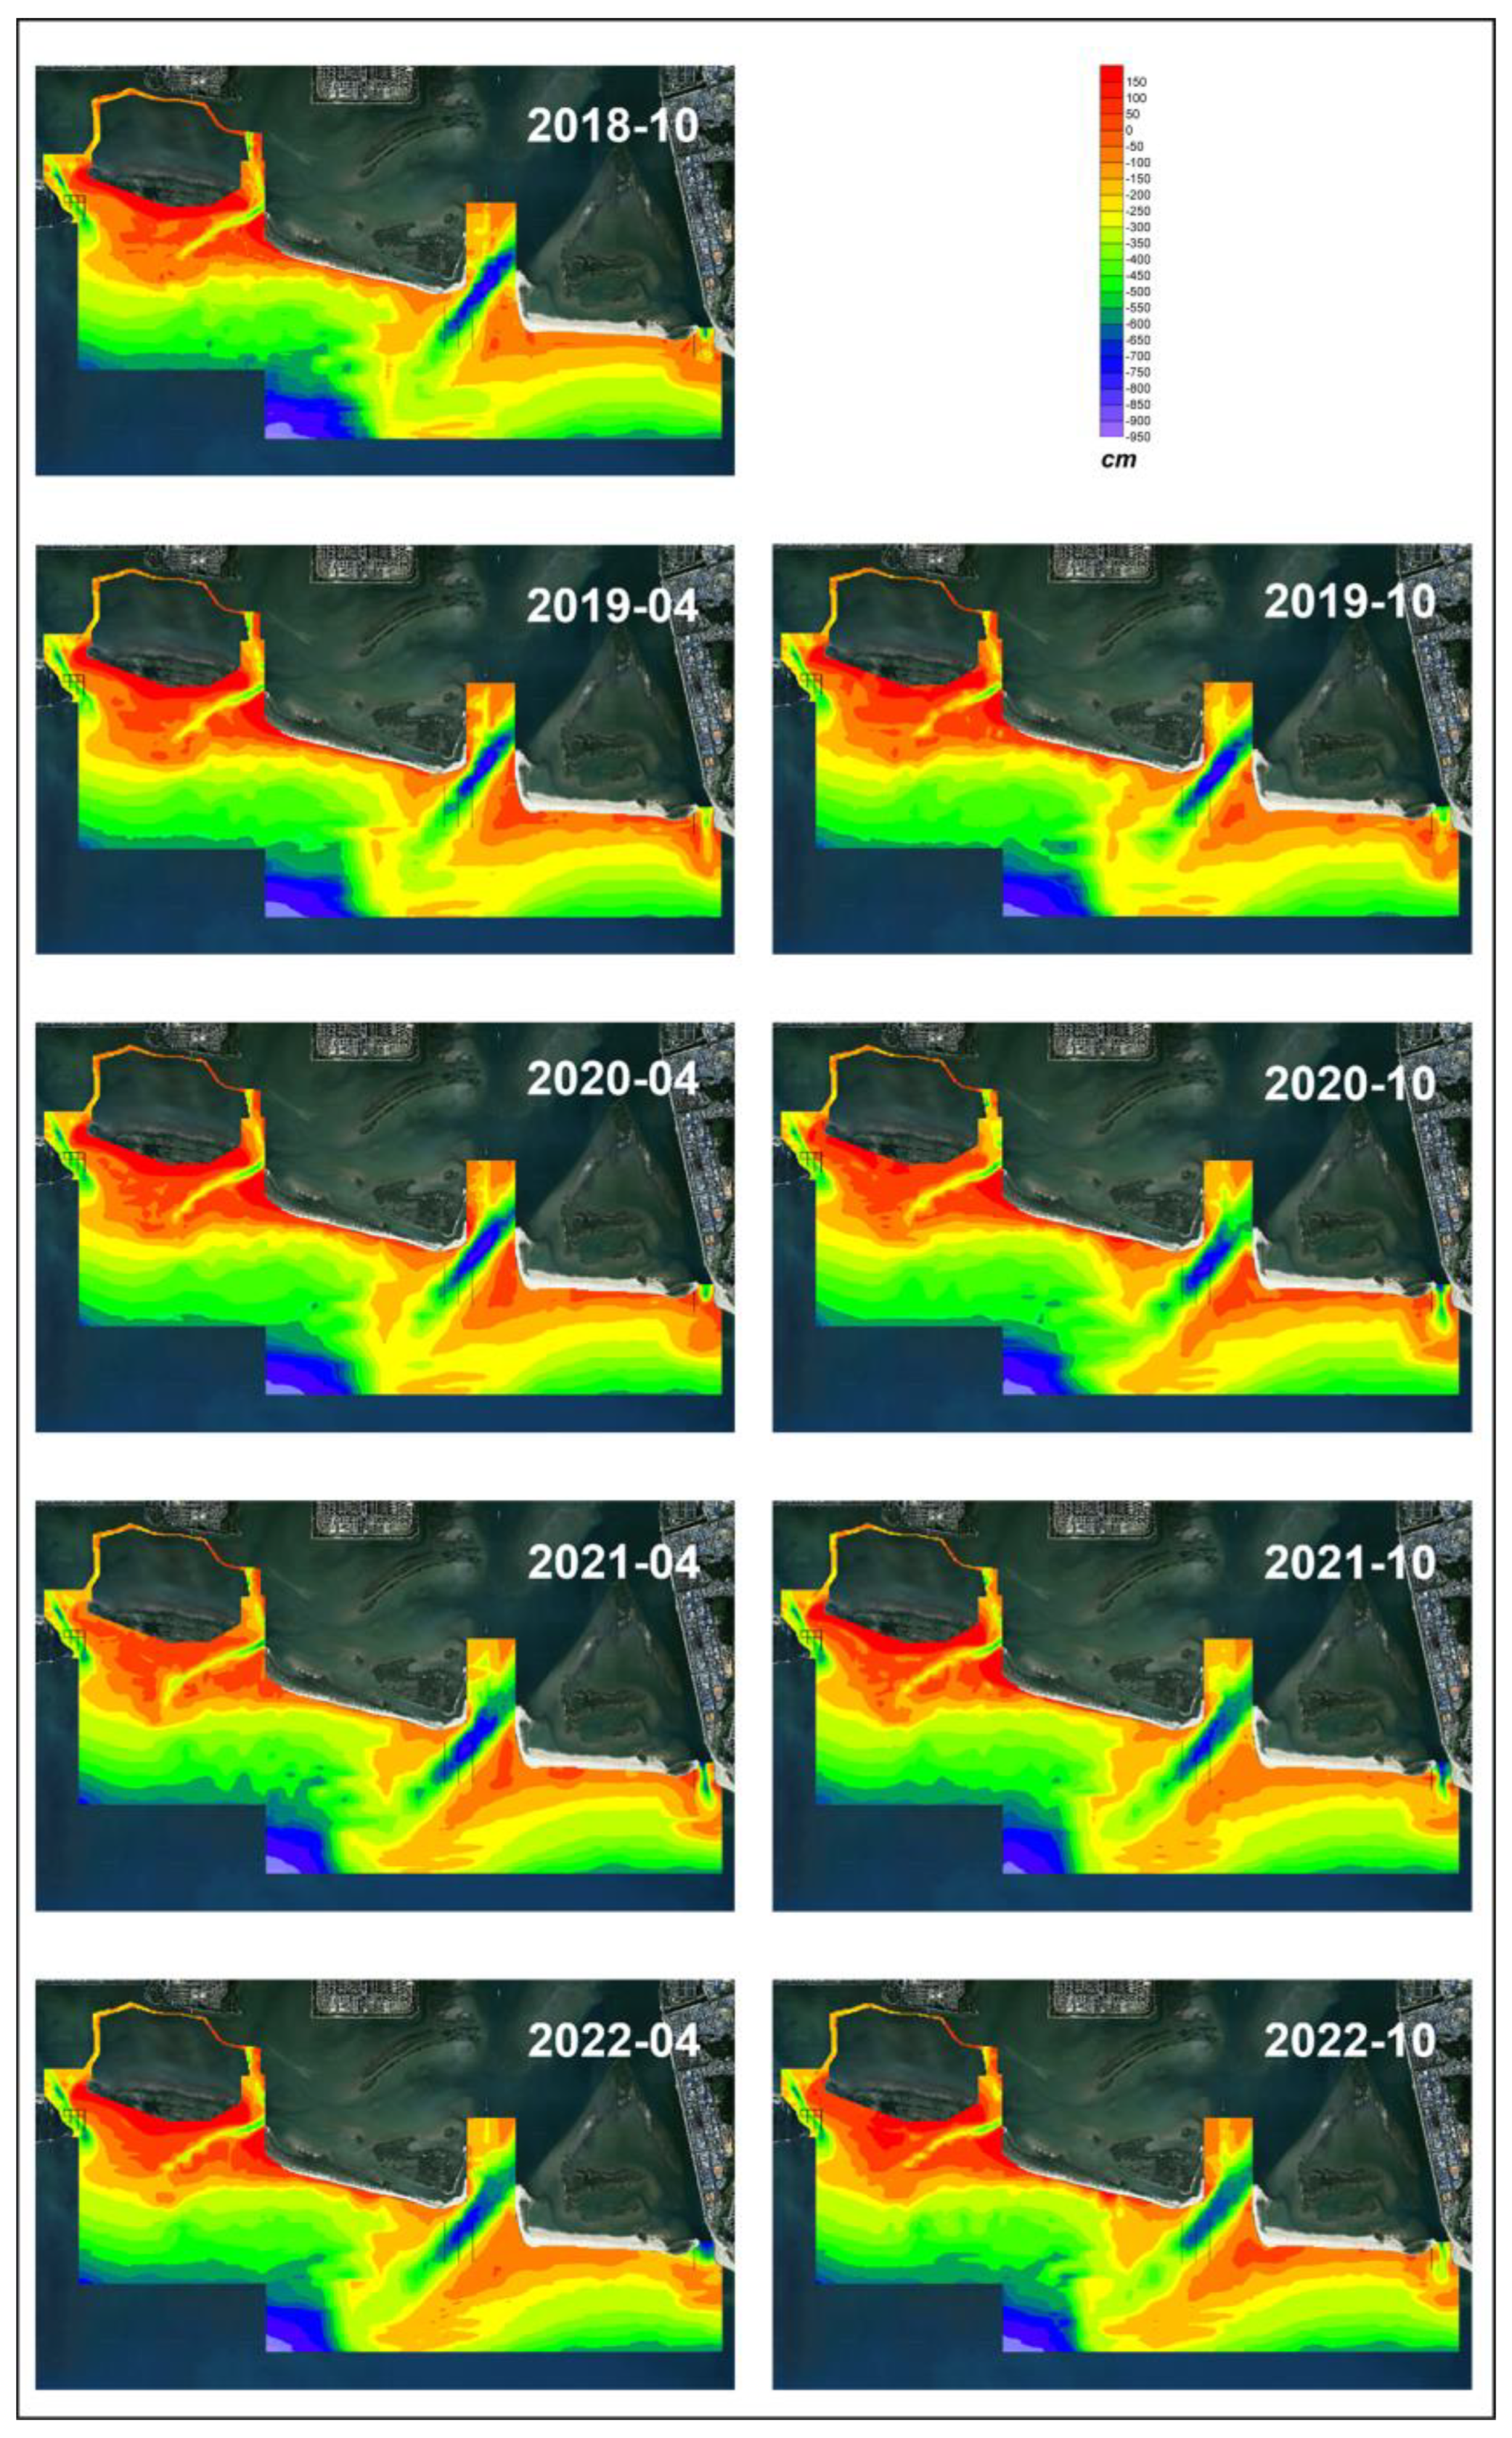
Figure 5.
Survey areas for channel analysis. Areas A–D are defined in Table 4.
Figure 5.
Survey areas for channel analysis. Areas A–D are defined in Table 4.
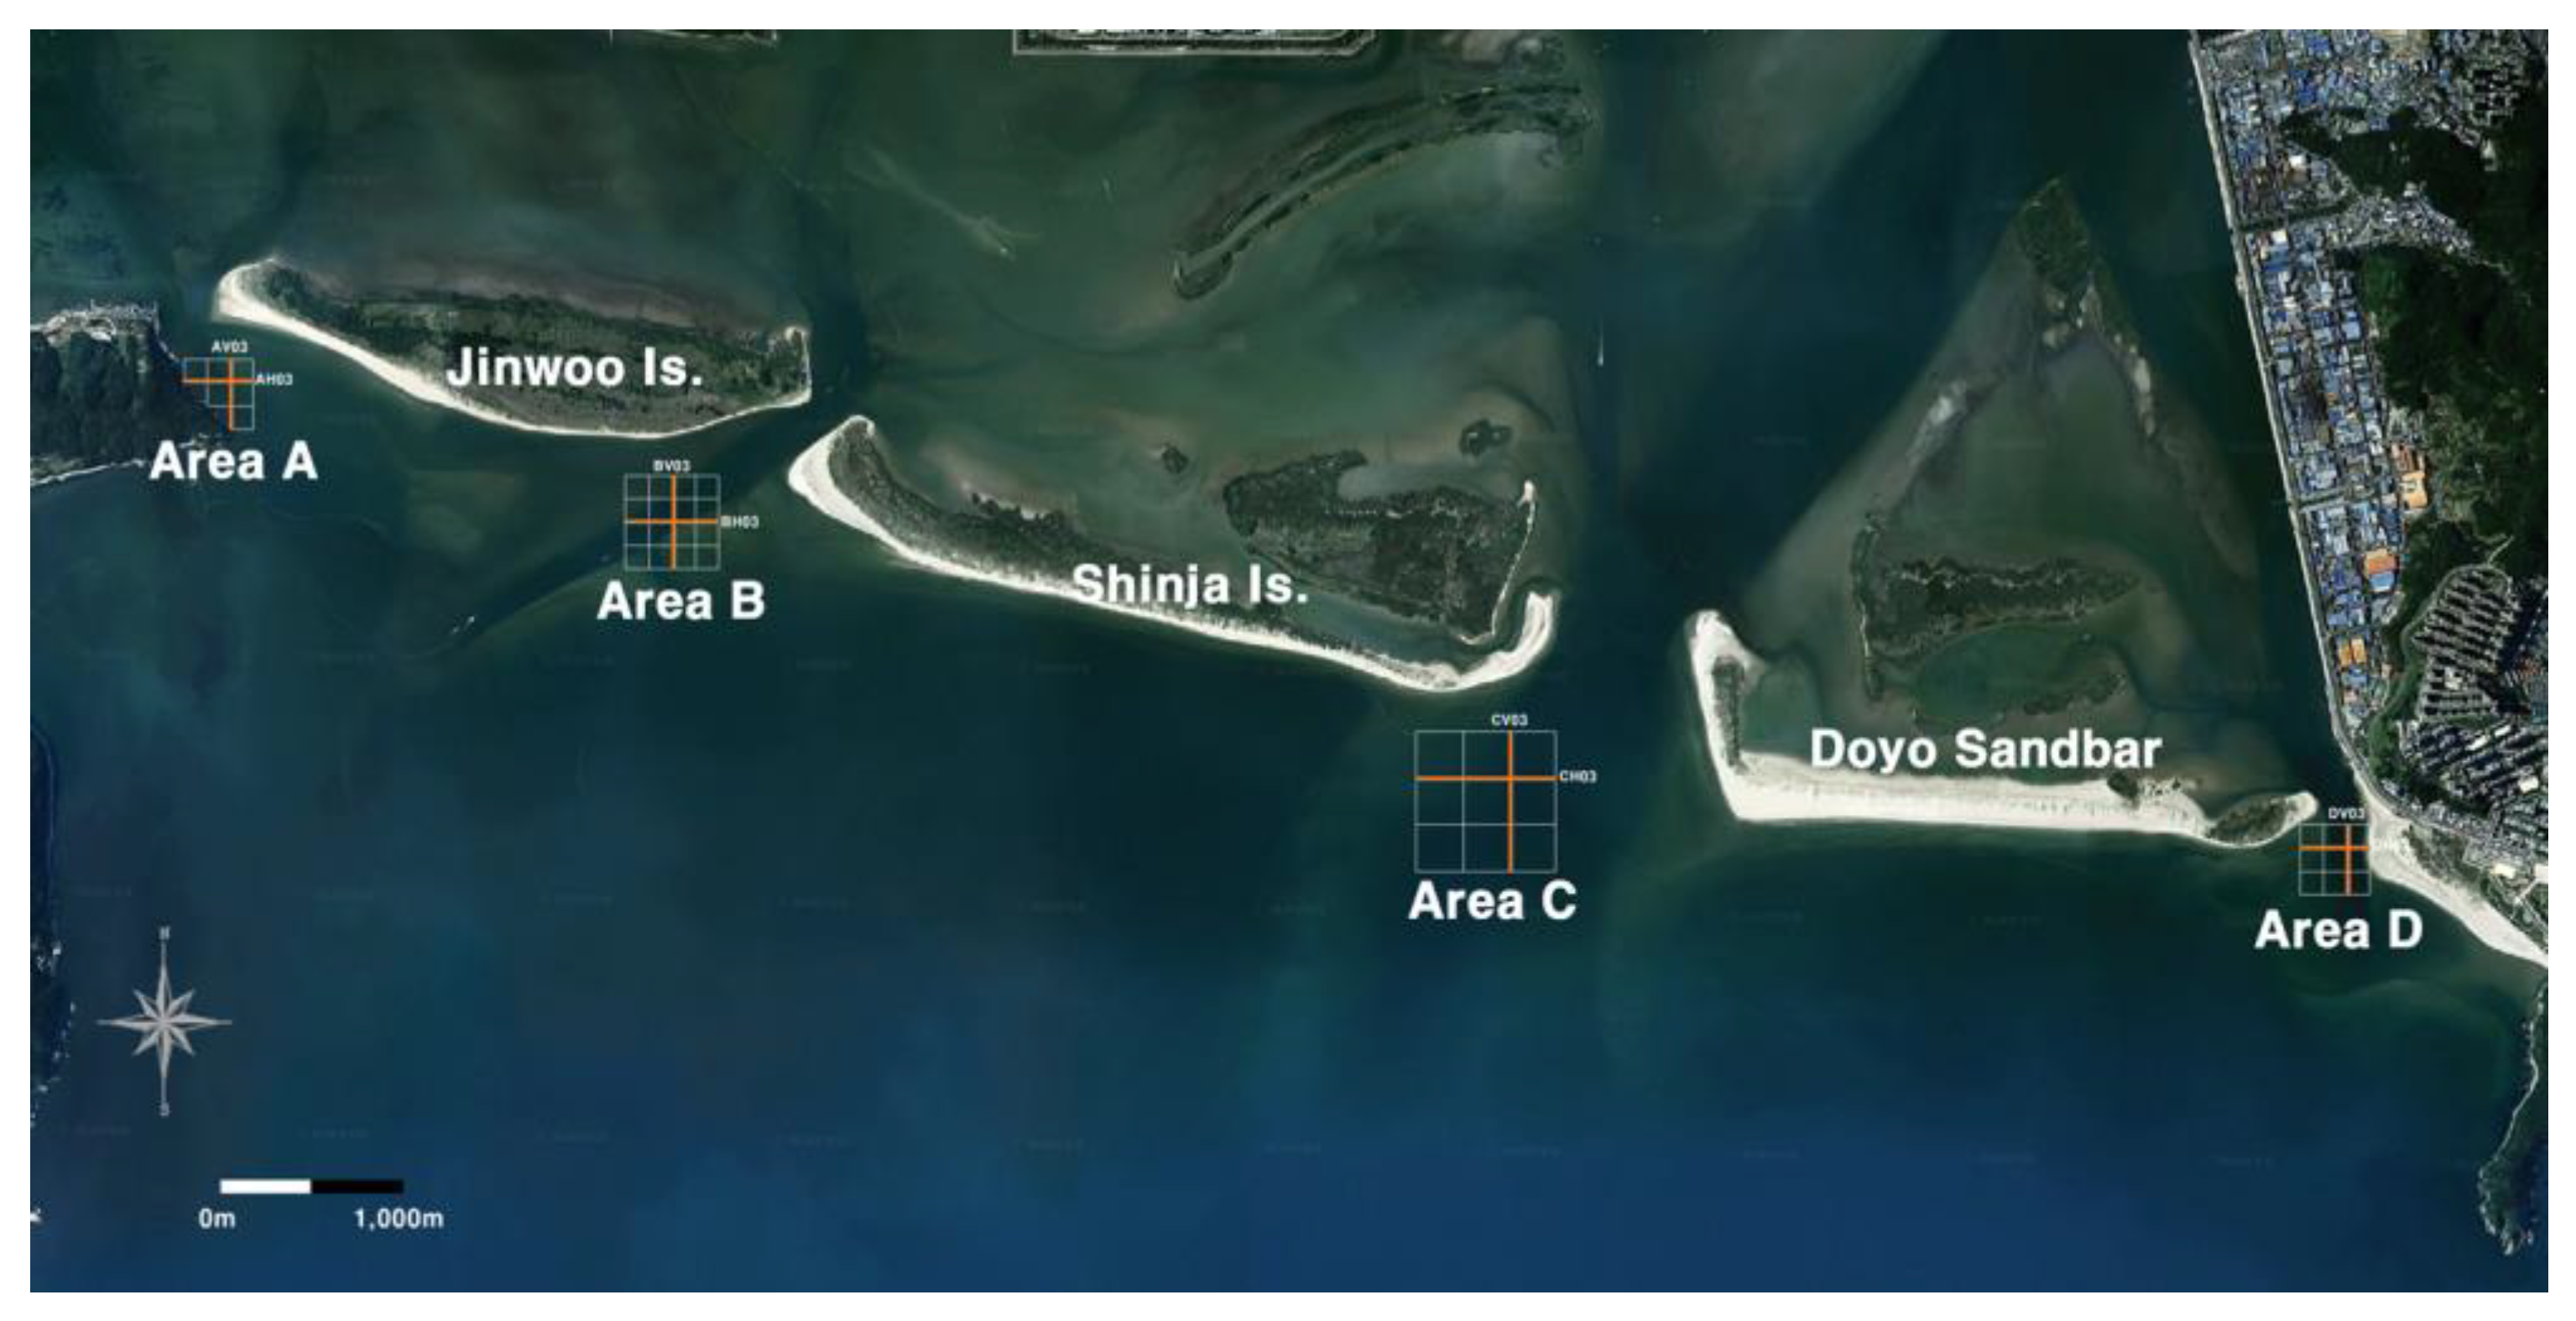
Figure 6.
Bathymetric changes by line in each area (Oct. 2018–Oct. 2022).
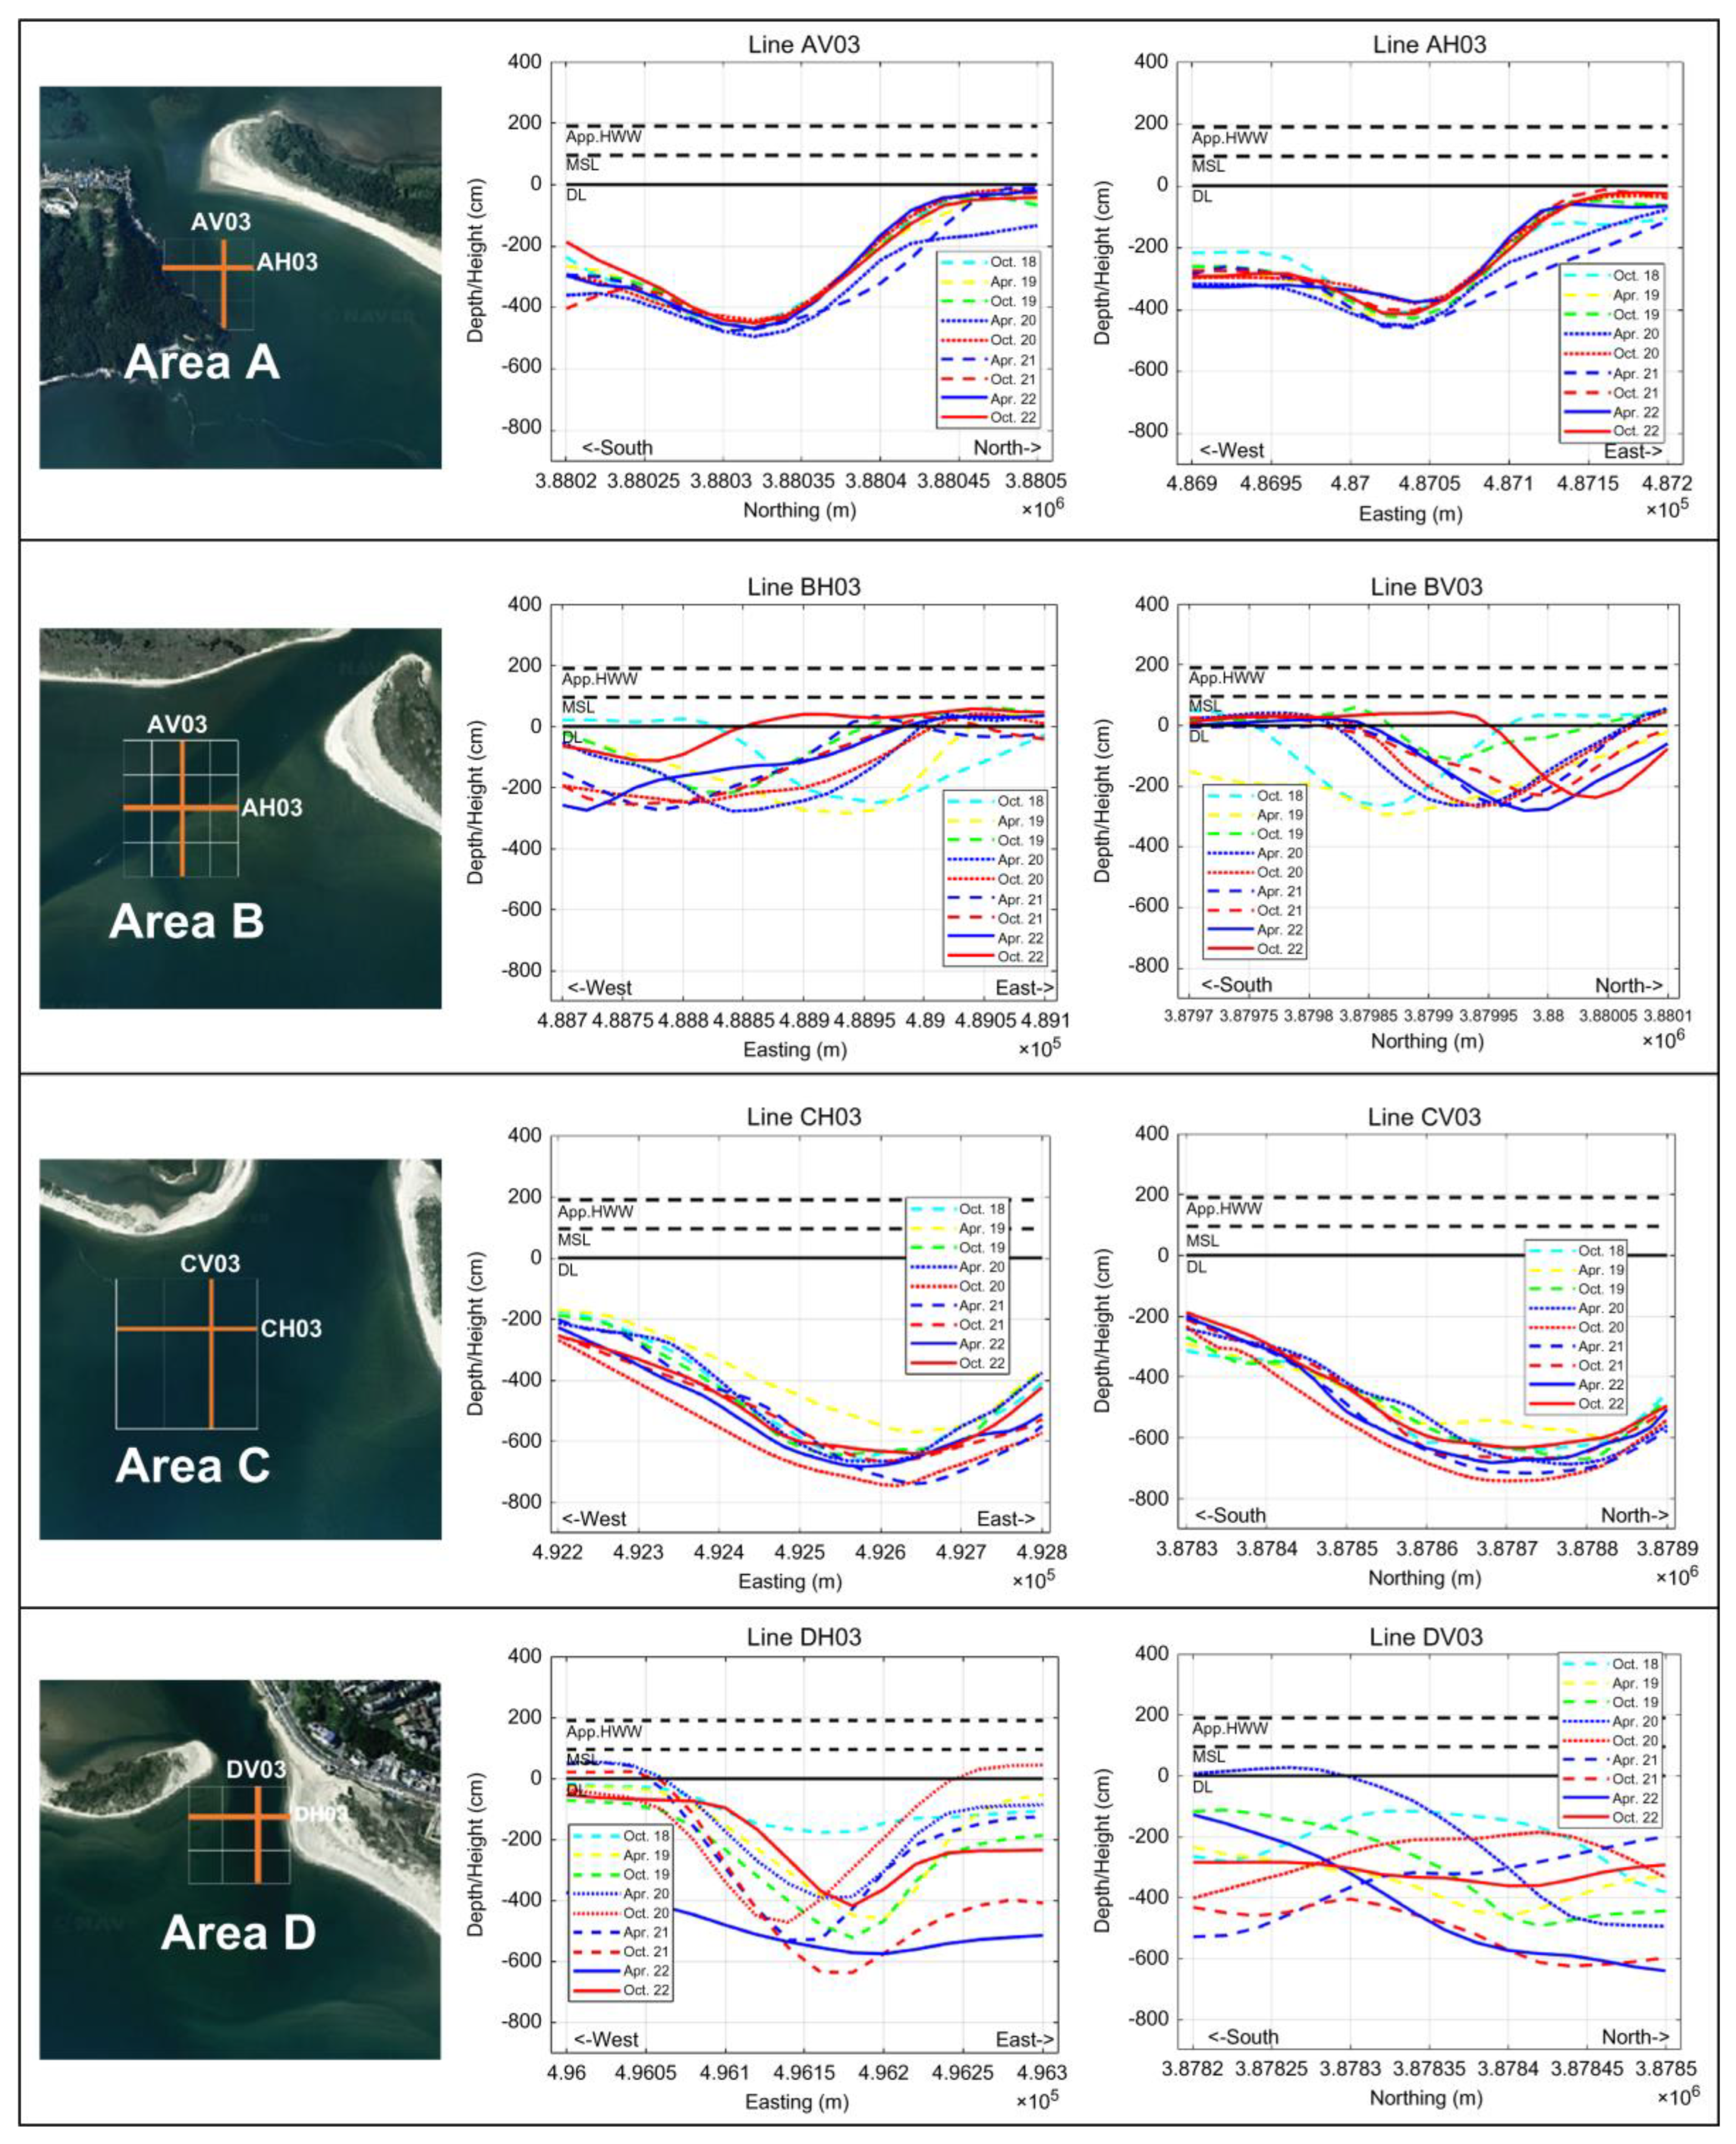
Figure 7.
Study area of shoreline survey. Yellow dotted shapes show the range of shoreline measurements.
Figure 7.
Study area of shoreline survey. Yellow dotted shapes show the range of shoreline measurements.
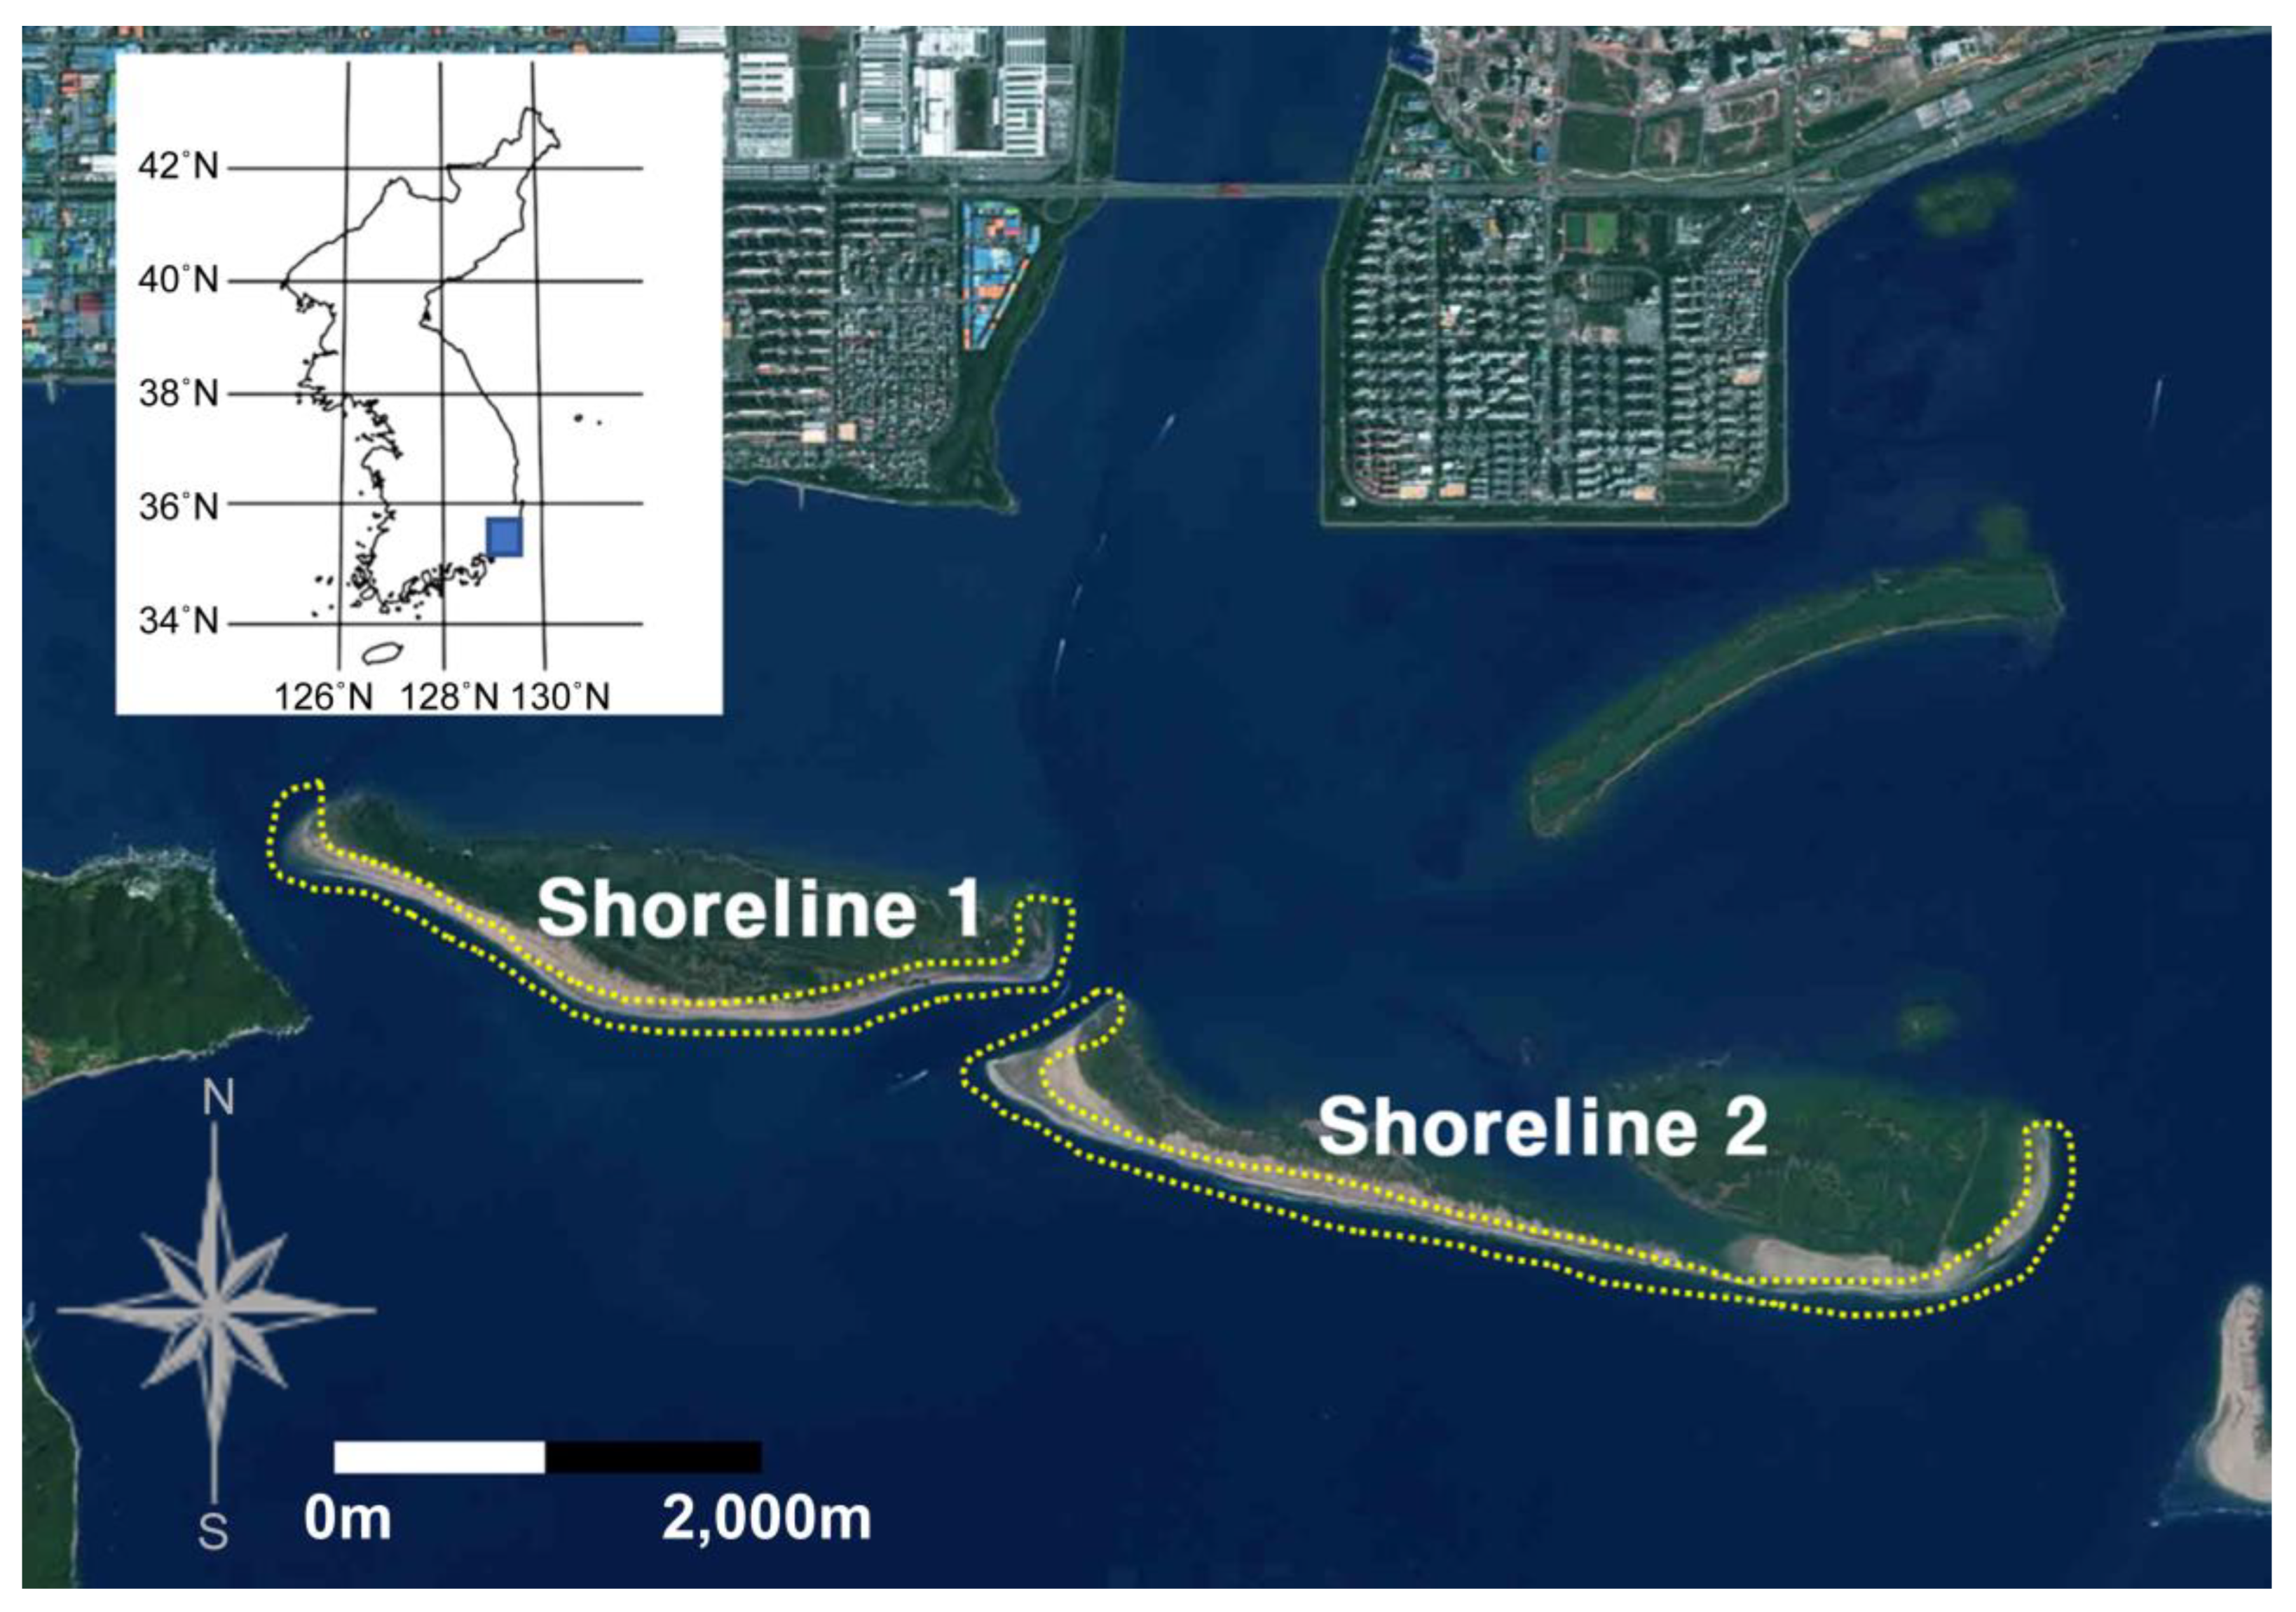
Figure 8.
Changes in the shoreline owing to typhoons.
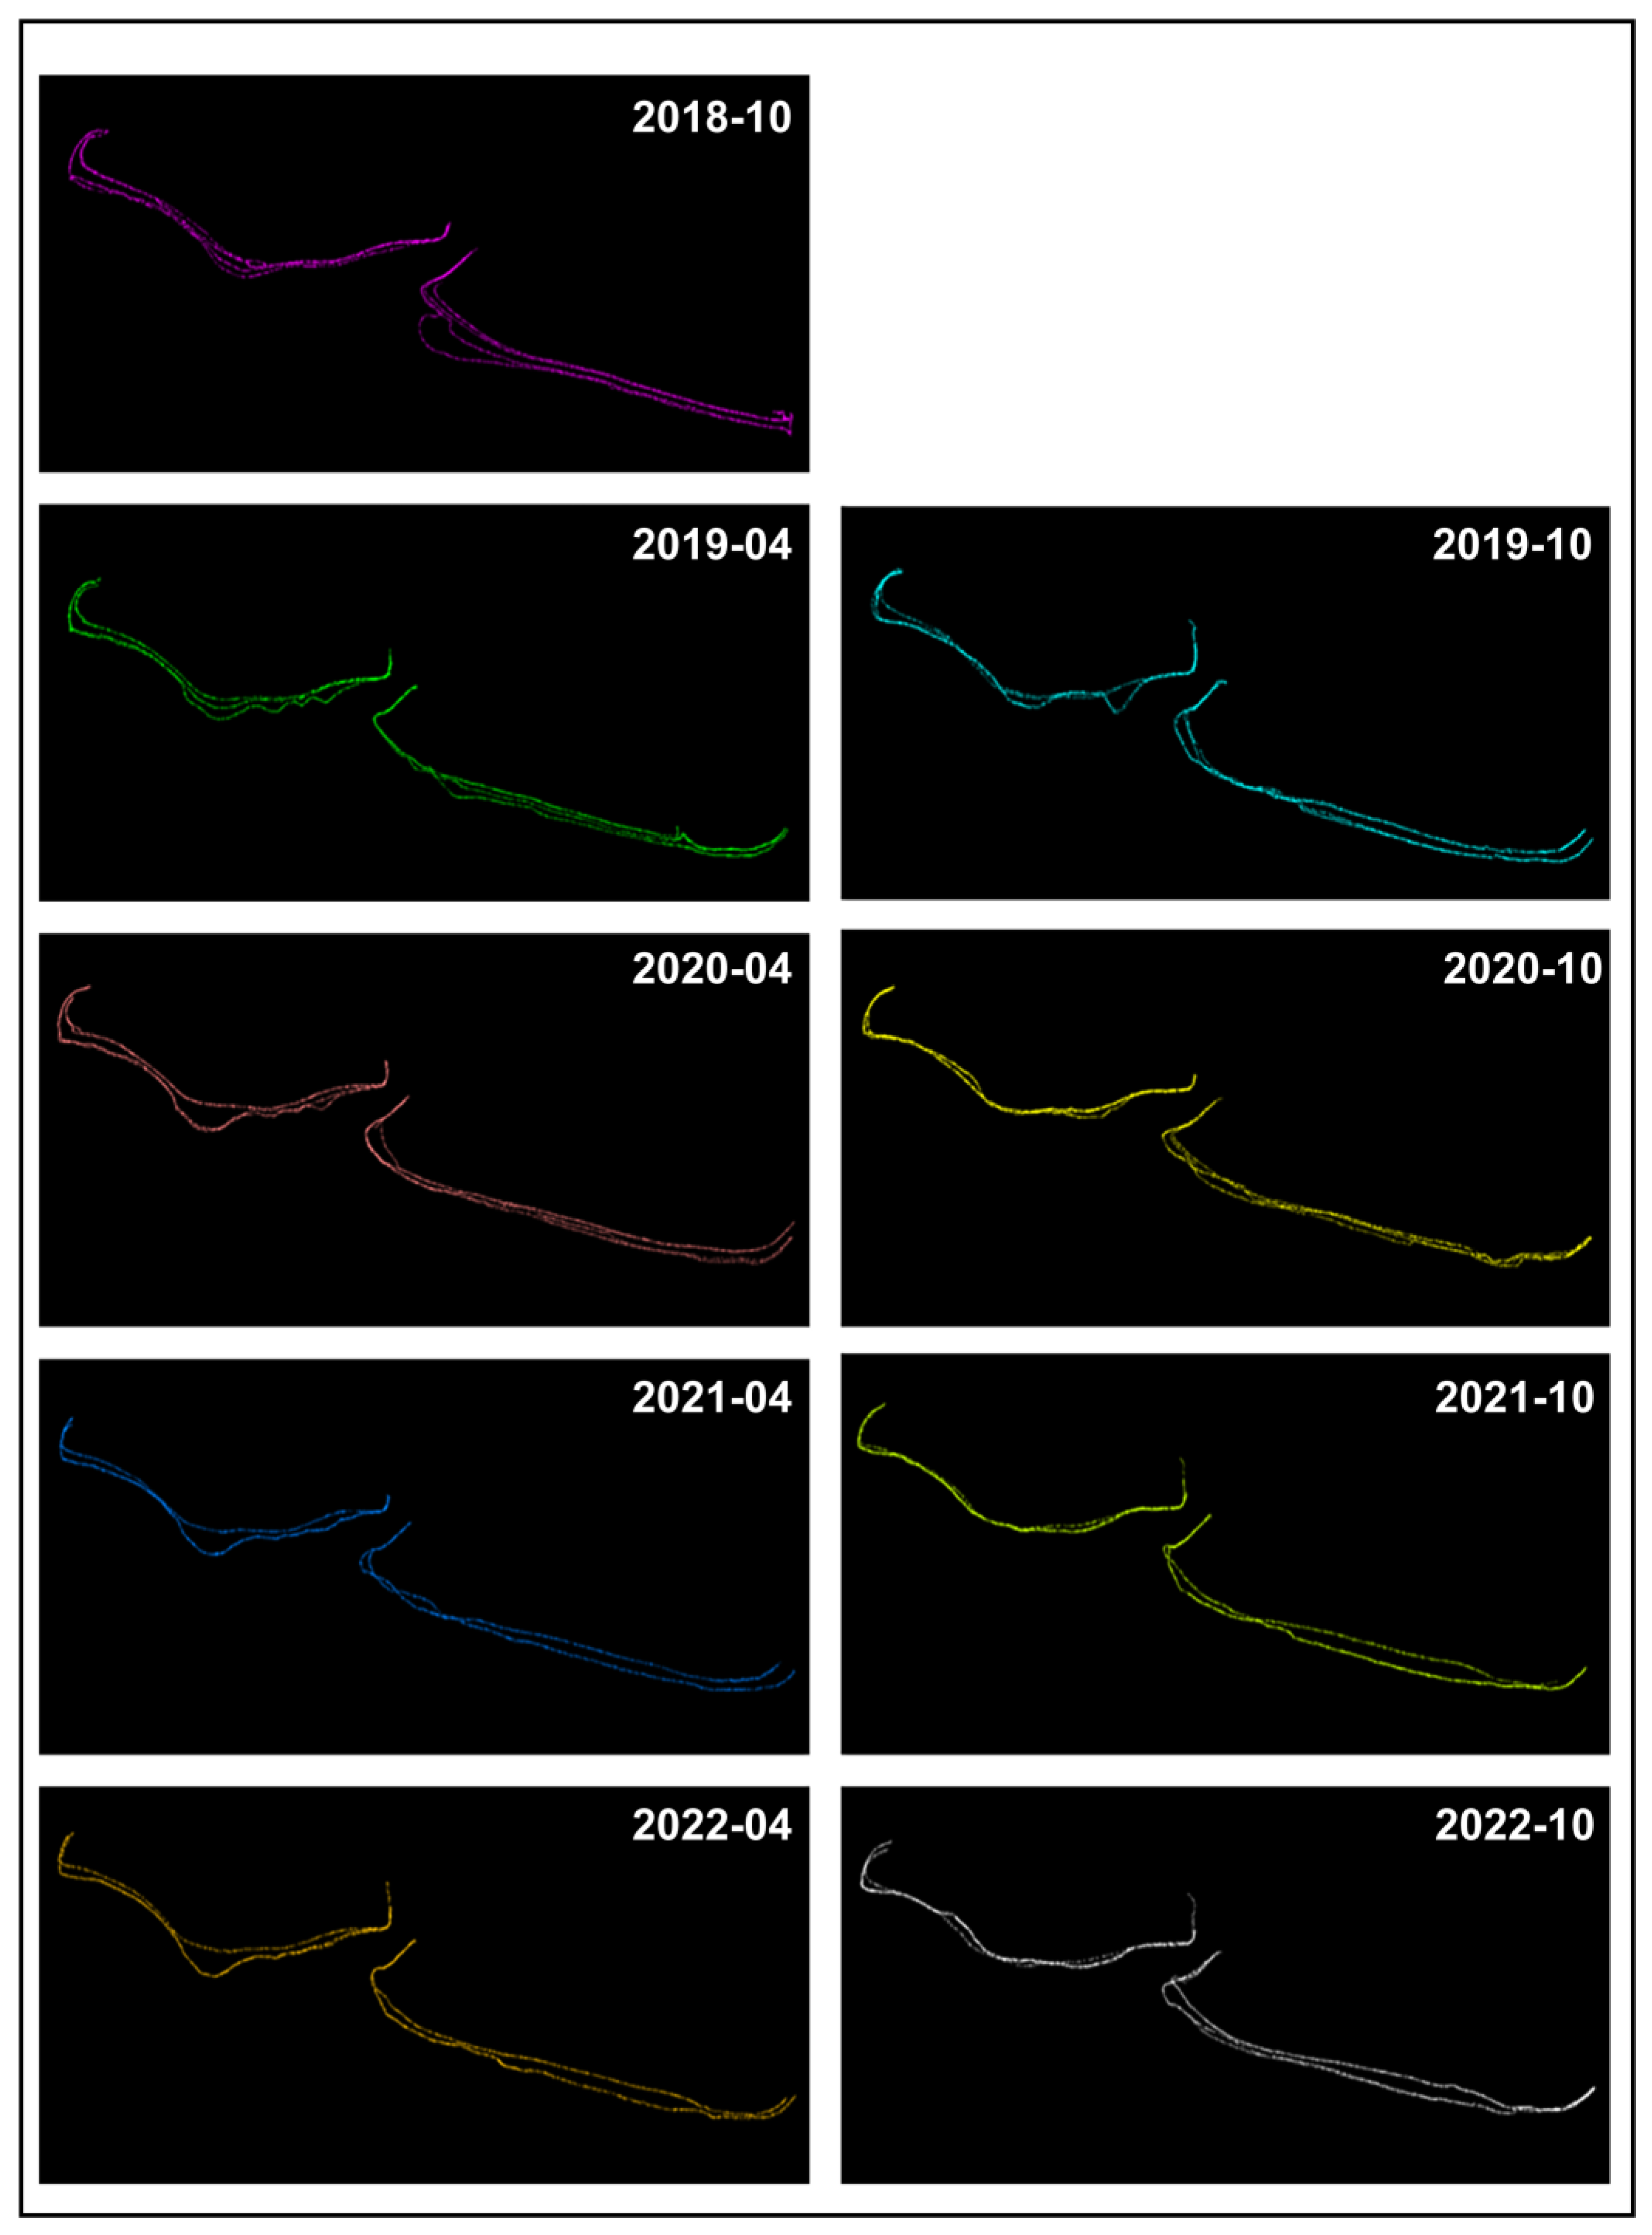
Figure 9.
Shoreline surveying using GPS (Oct. 2018–Oct. 2022).
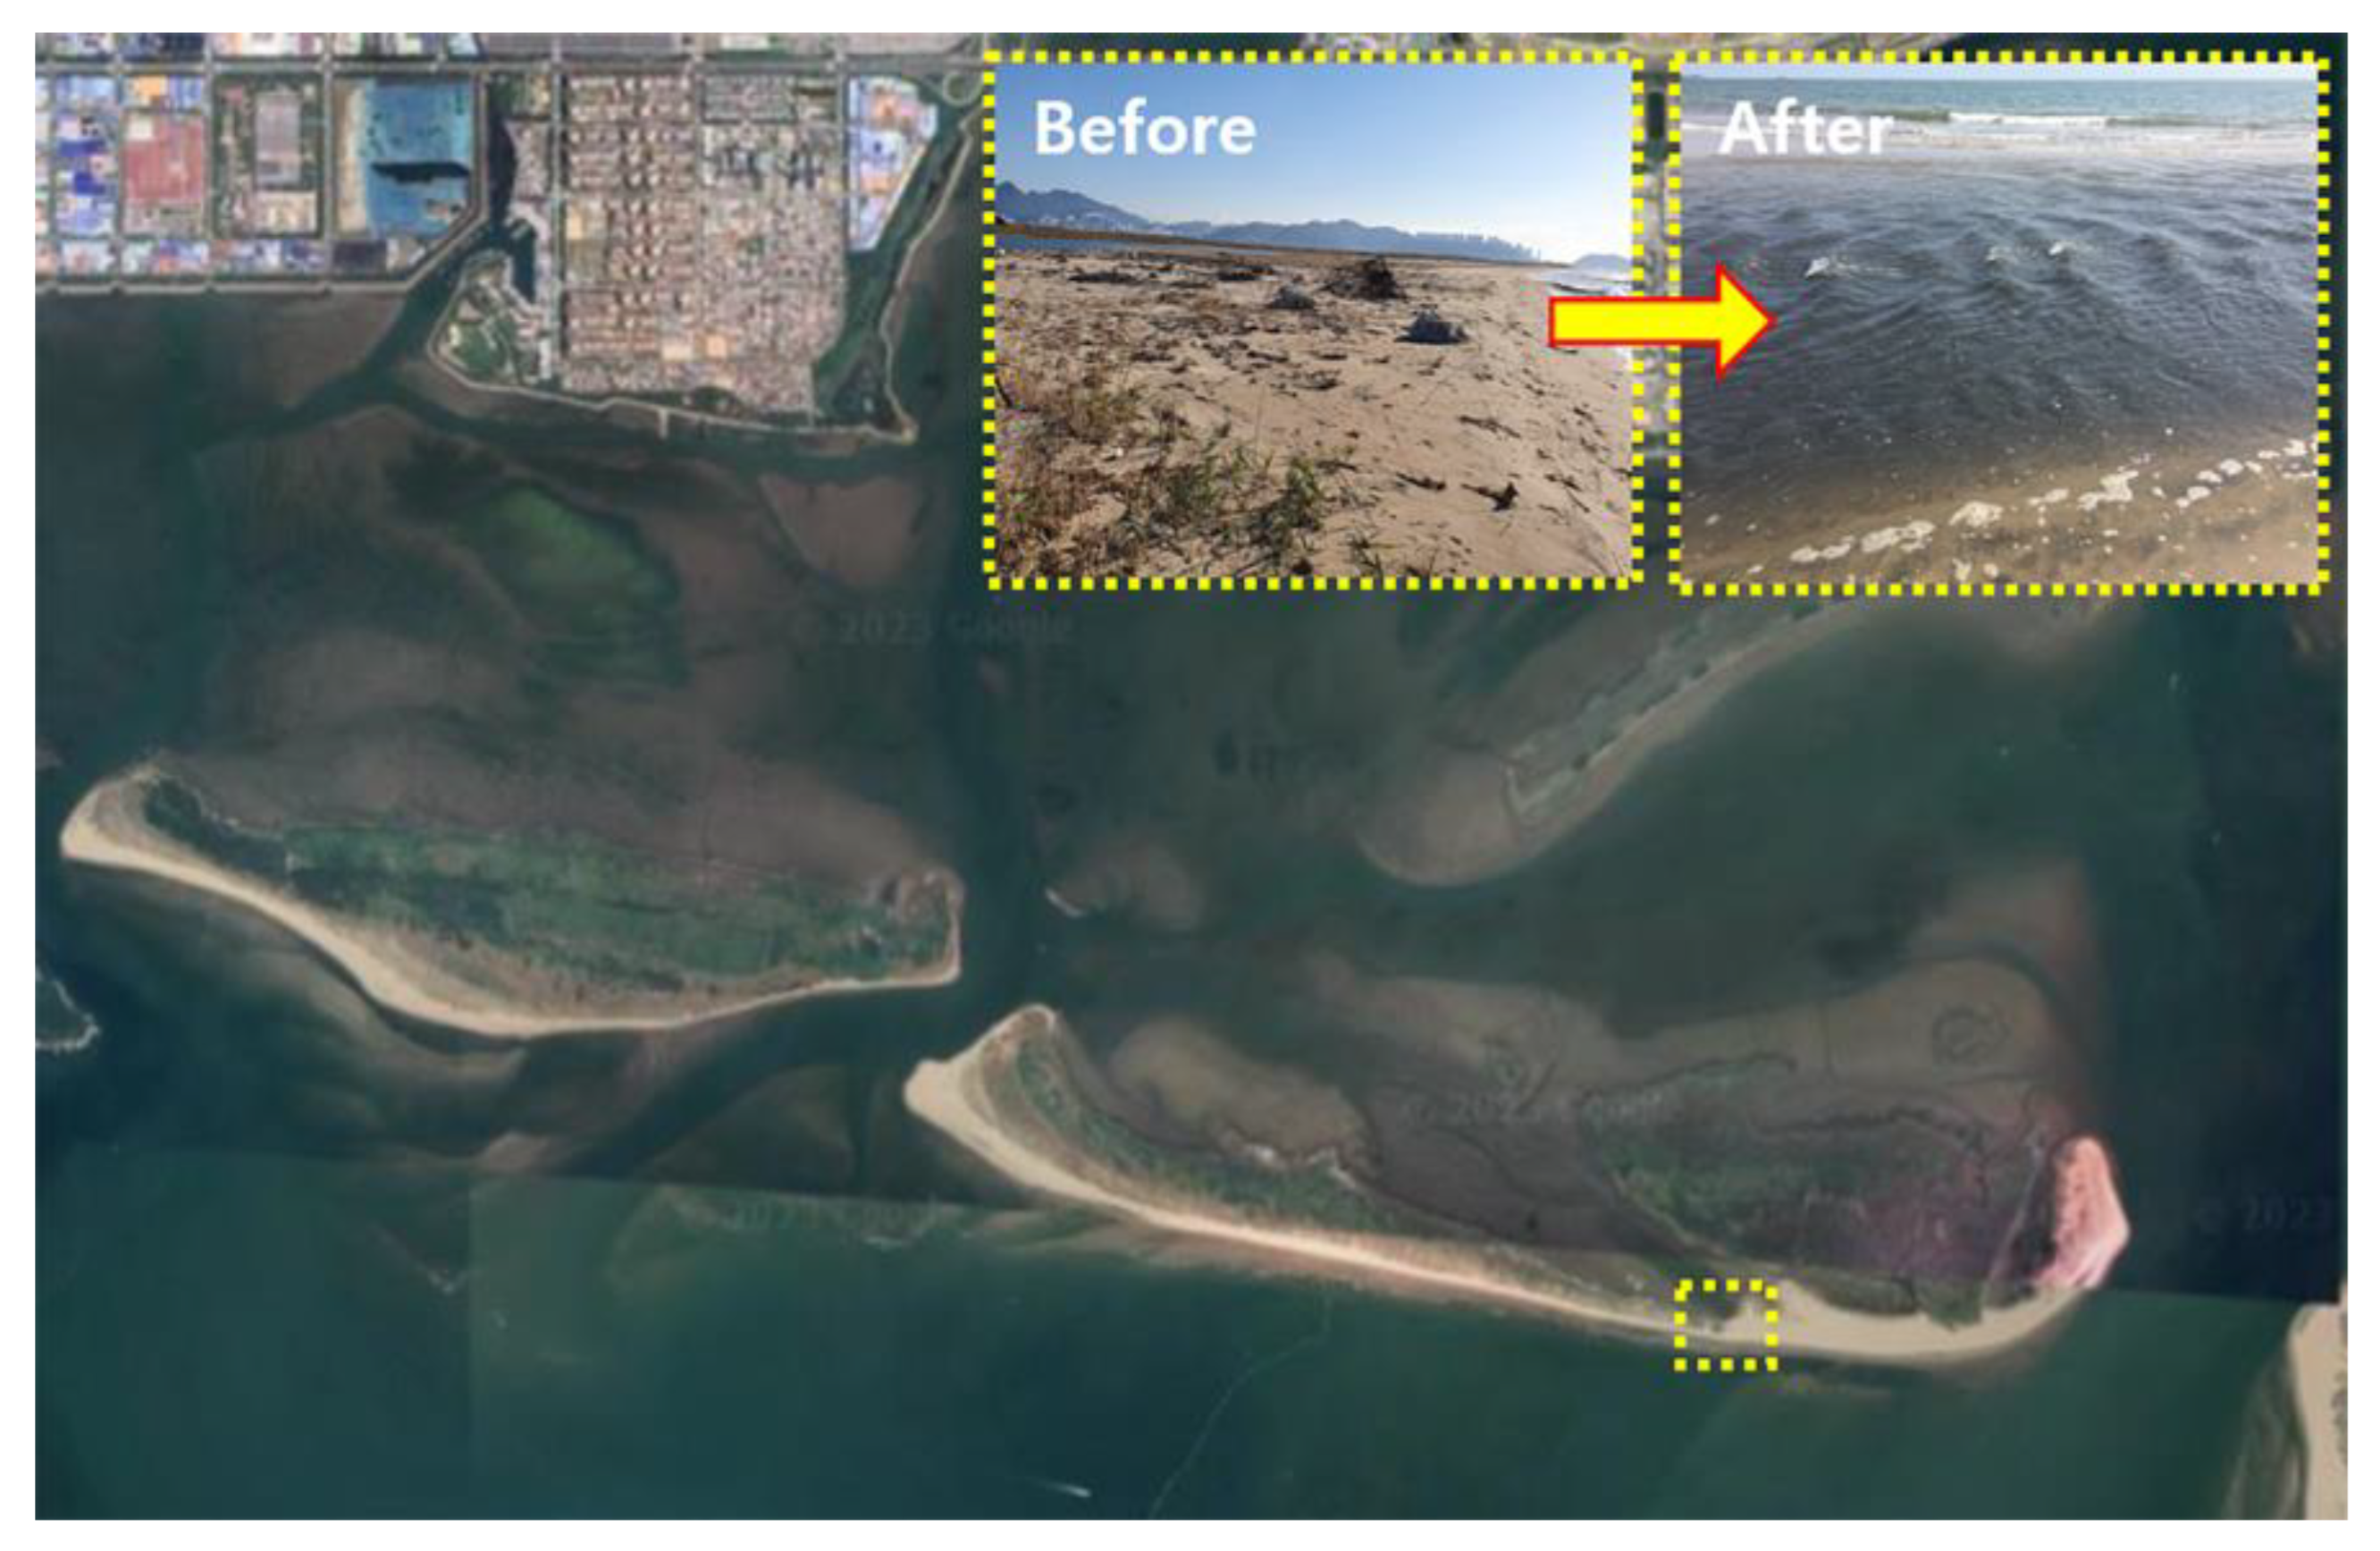
Figure 10.
Distribution changes in the height (H) for Shorelines 1 and 2. (a) Shoreline 1: Jinwoo Island; (b) Shoreline 2: Shinja Island. Severe distortion is possible if there is an abnormality in the coastline data of traditionally widely used methods, such as average or standard deviation for shoreline changes.
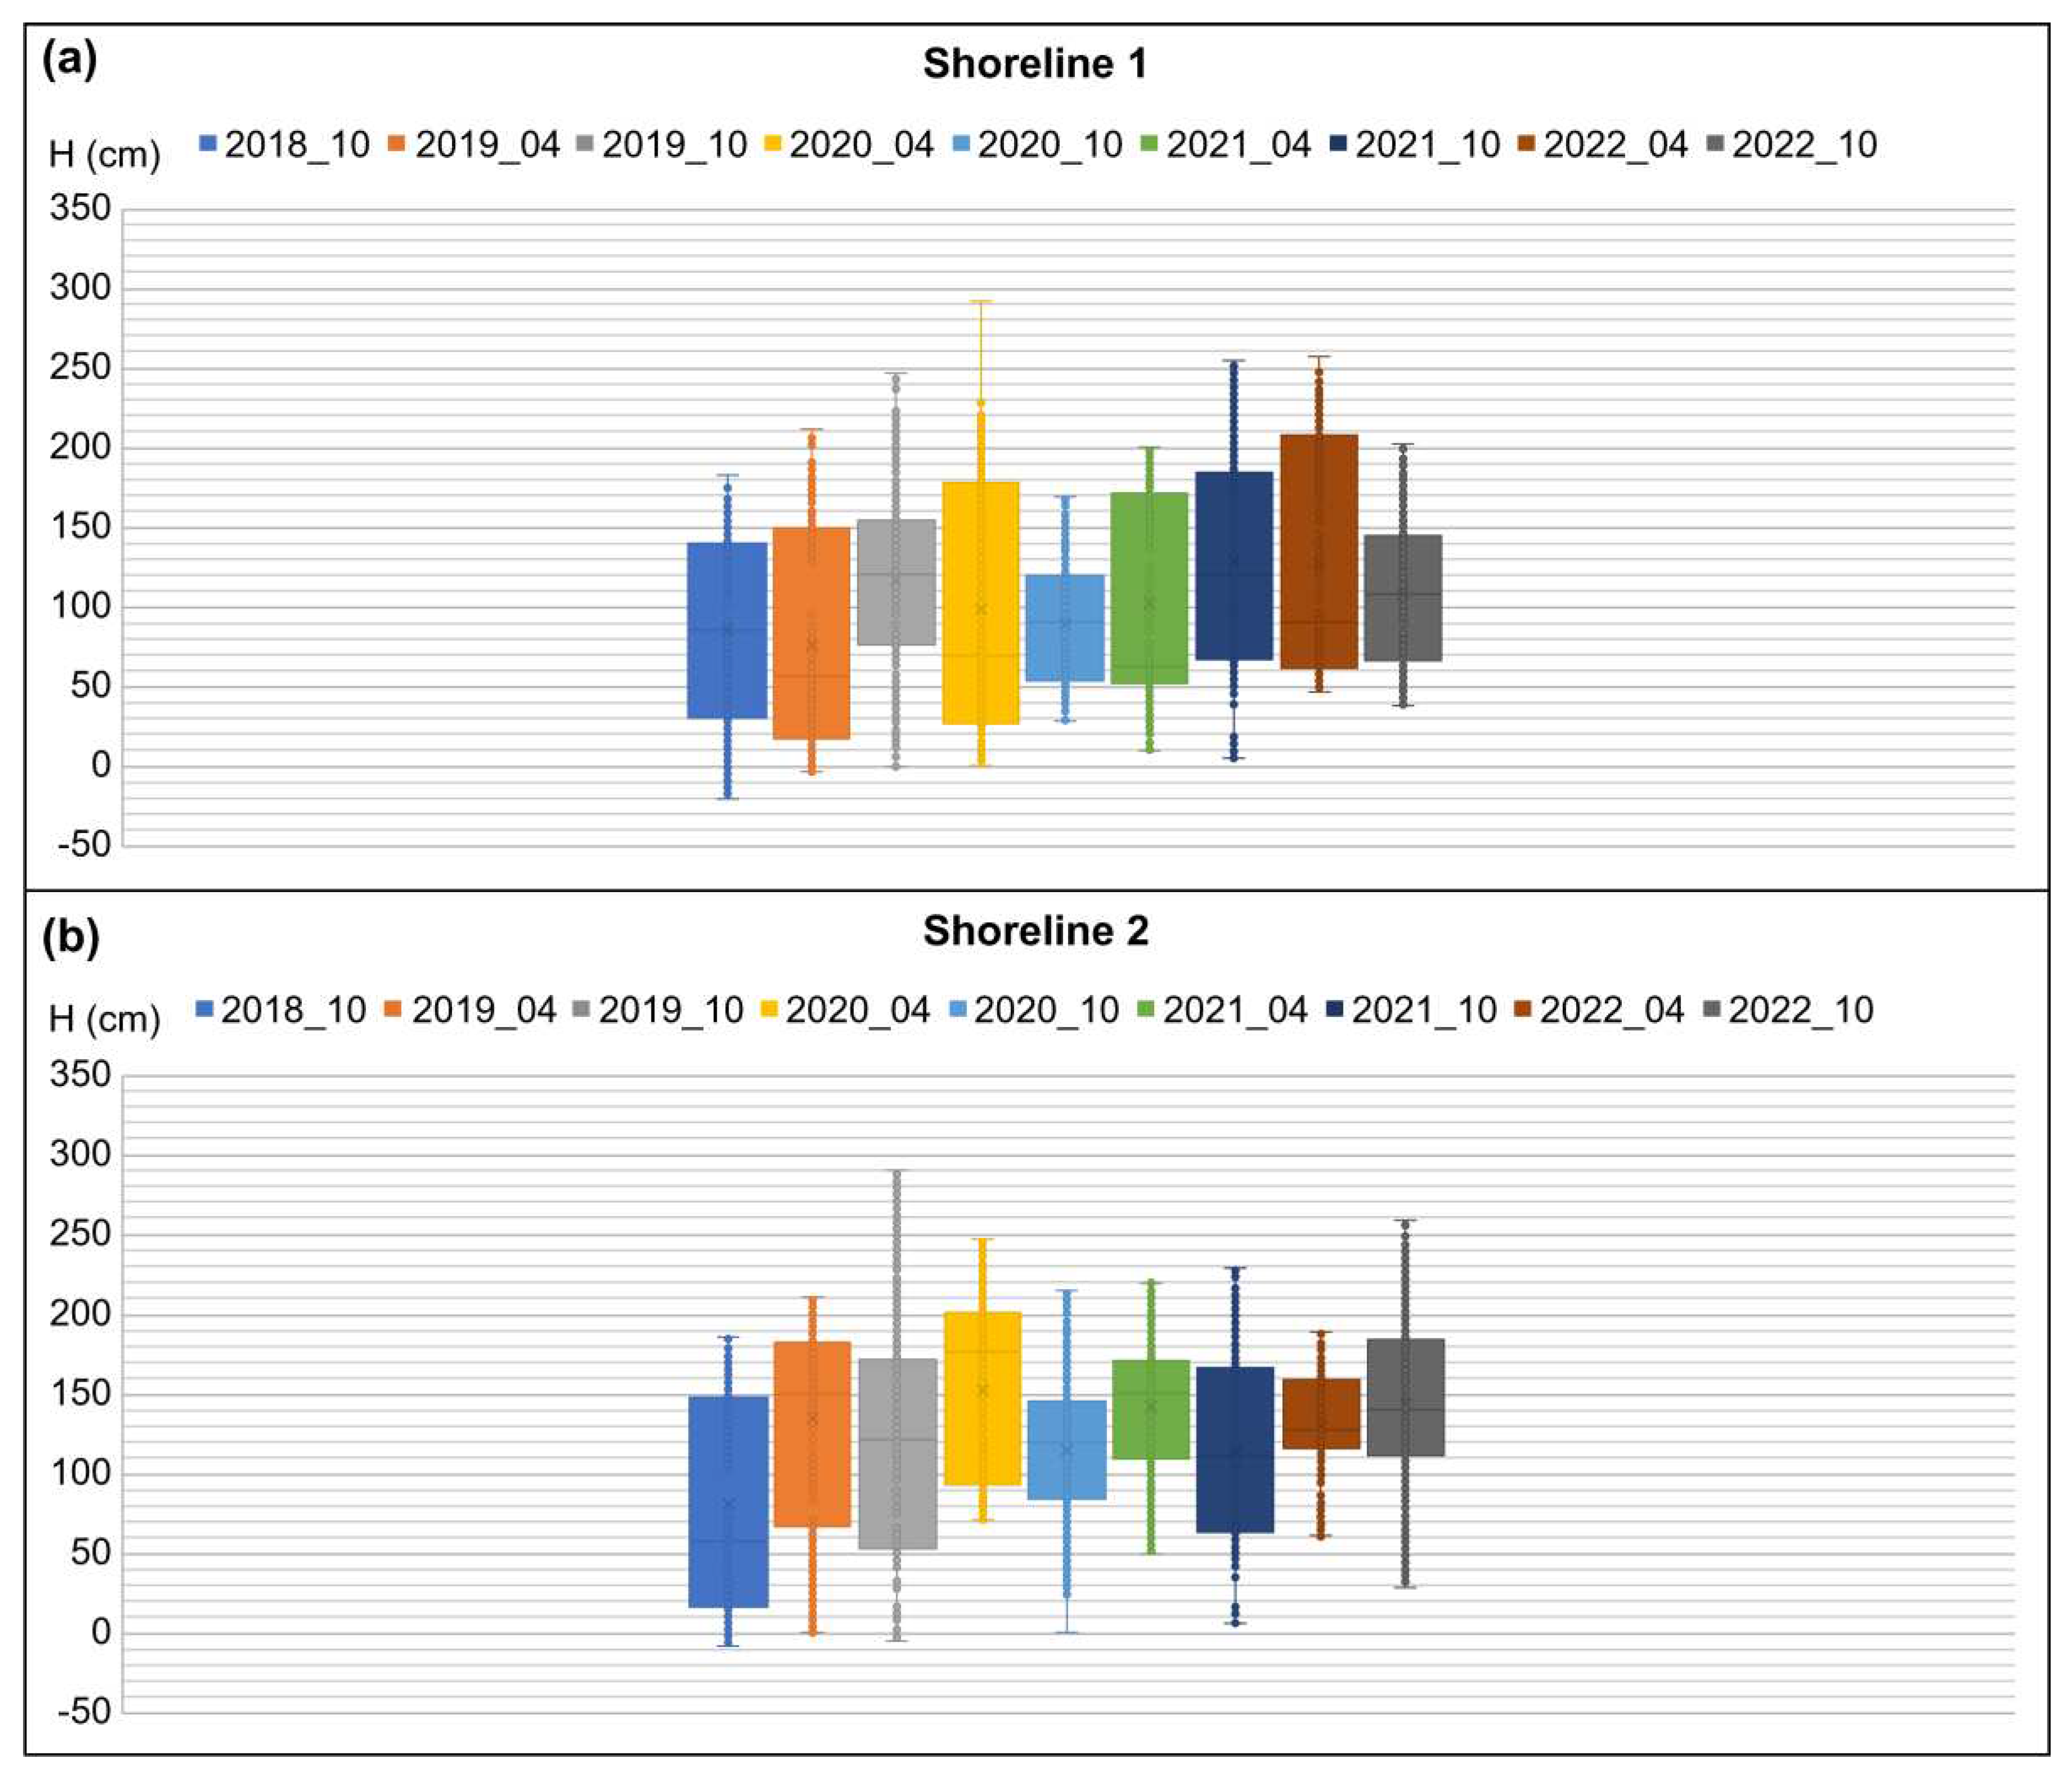
Figure 11.
Time series of semi-annual data for the duration of the study (K-WATER, KMA). (a) Average daily discharge; (b) total precipitation; and (c) average daily suspended sediment outflow.
Figure 11.
Time series of semi-annual data for the duration of the study (K-WATER, KMA). (a) Average daily discharge; (b) total precipitation; and (c) average daily suspended sediment outflow.
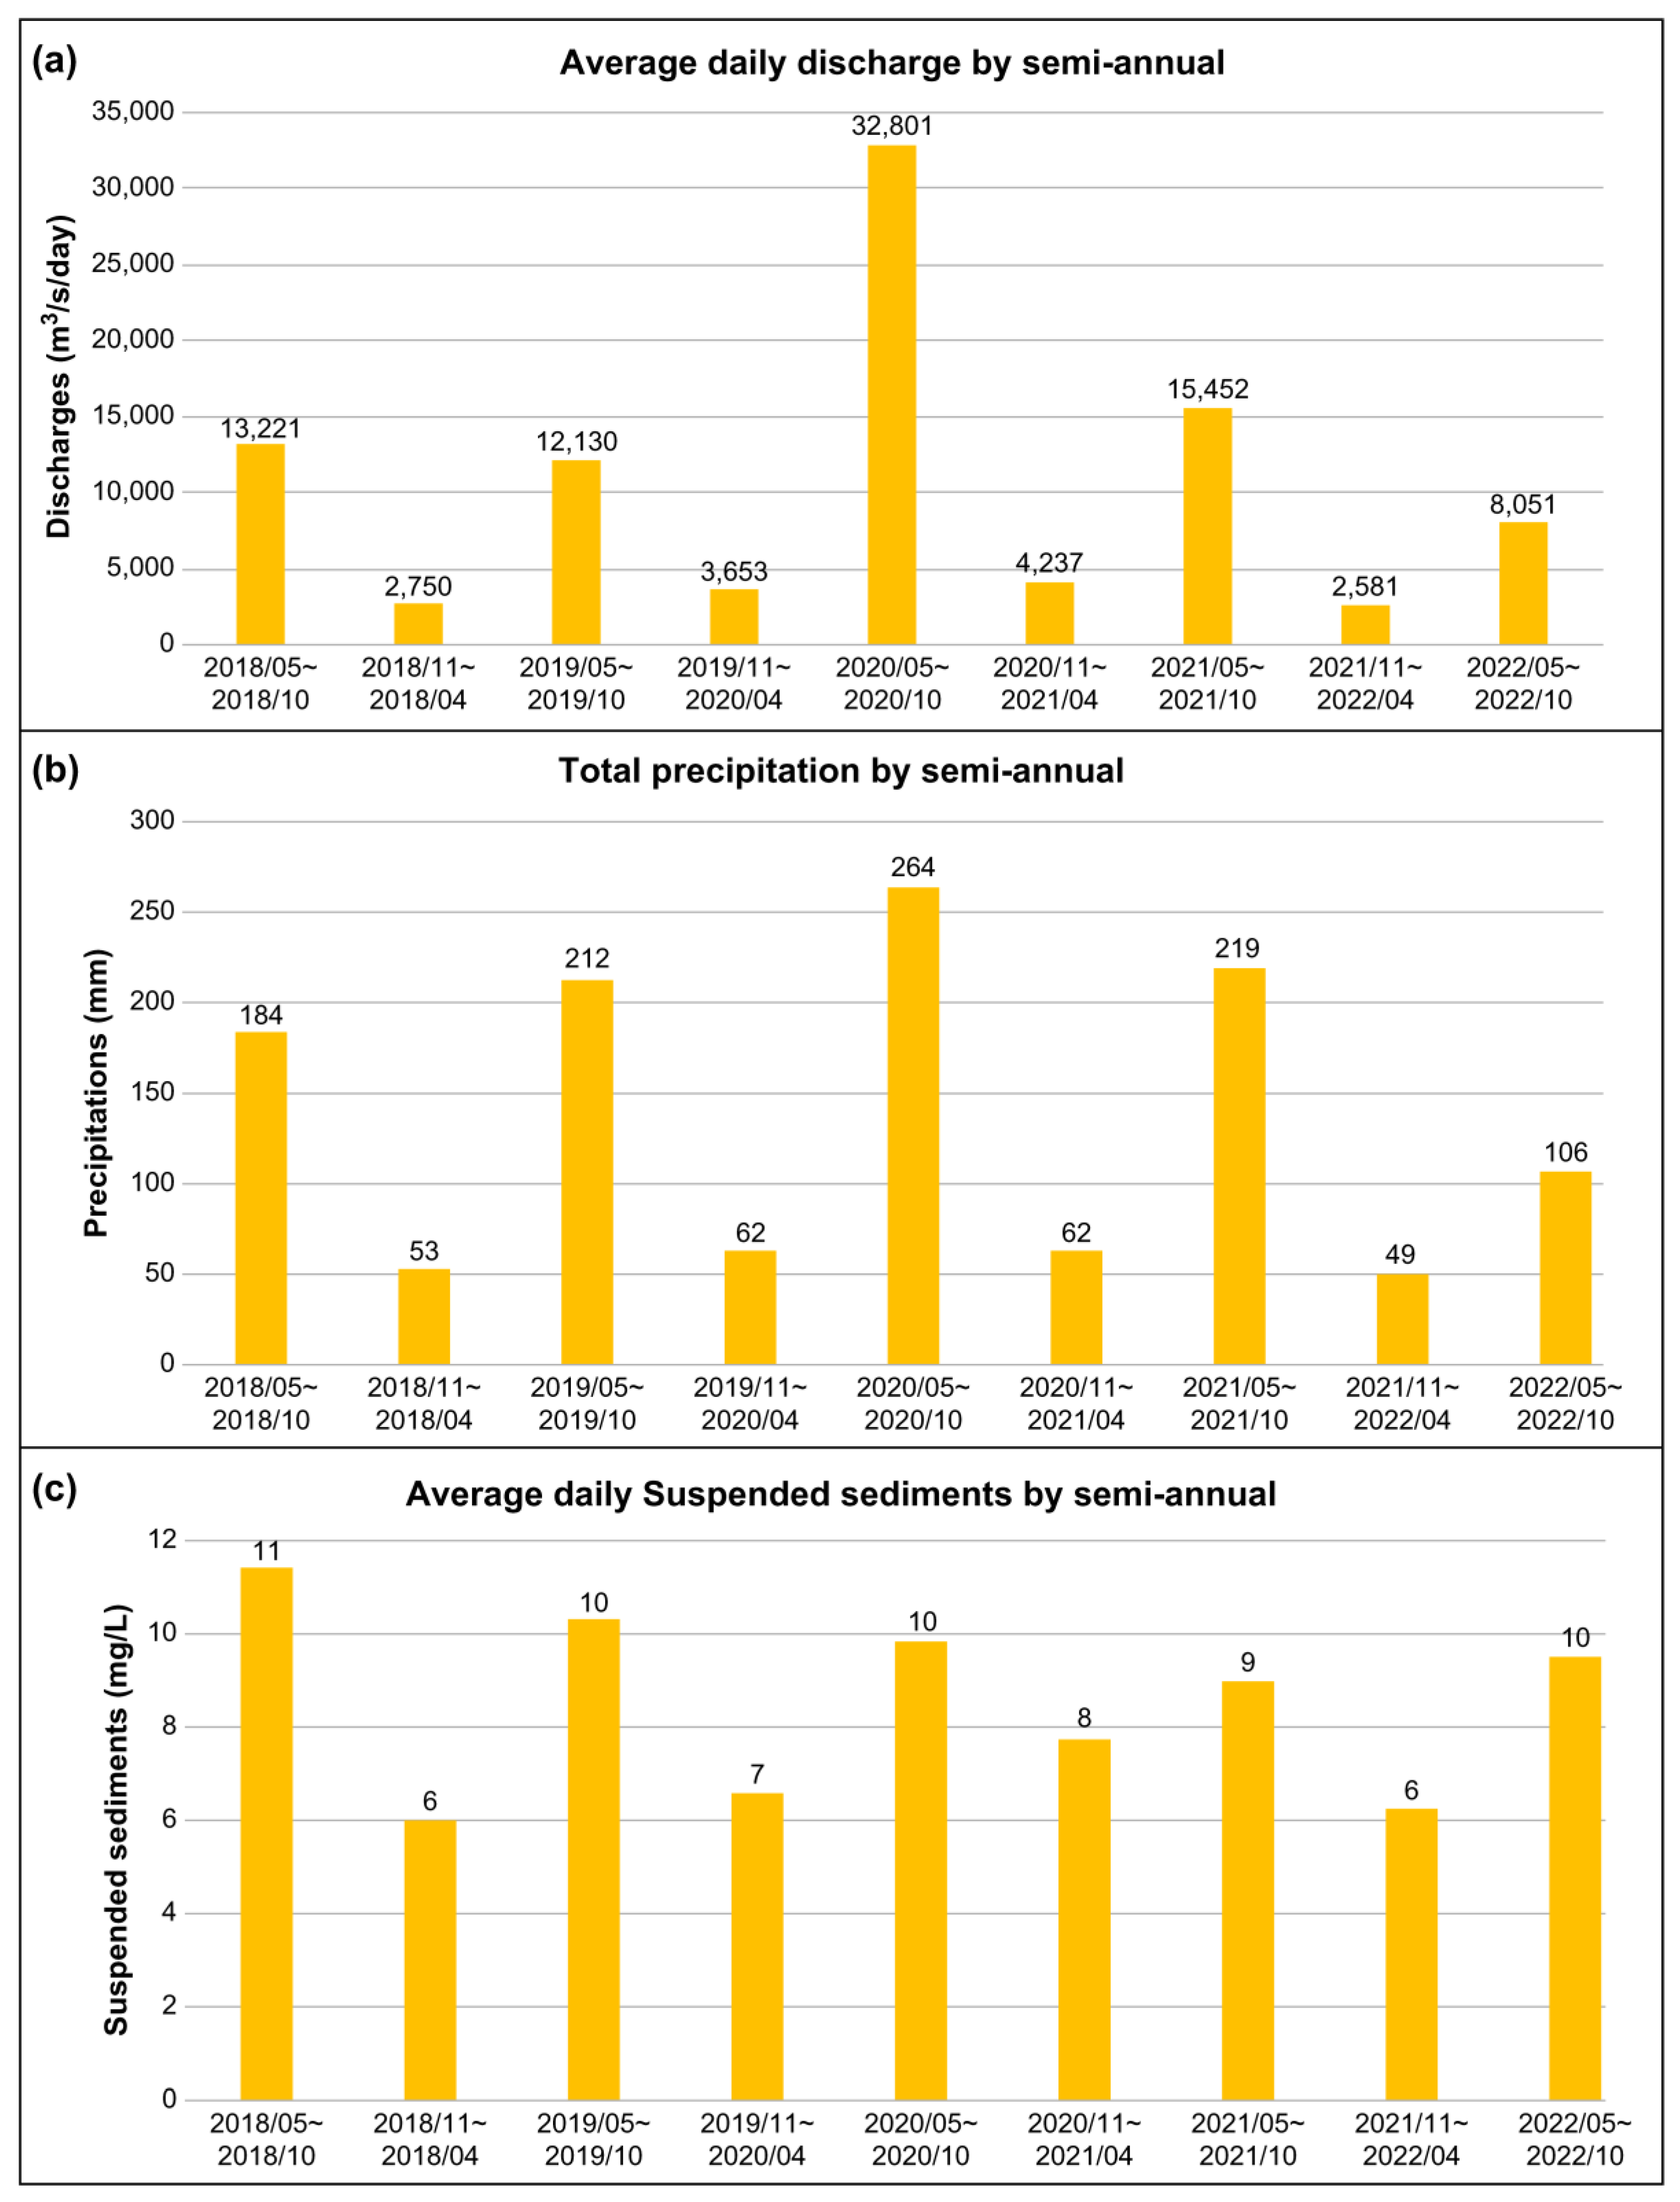

Table 1.
Survey dates for this study.
| Year | Month | Period |
|---|---|---|
| 2018 | Oct | 26–11 |
| 2019 | Apr | 18–22 |
| Oct | 18–22 | |
| 2020 | Apr | 7–12 |
| Oct | 16–21 | |
| 2021 | Apr | 8–13 |
| Oct | 20–25 | |
| 2022 | Apr | 13–19 |
| Oct | 26–31 |
Table 2.
Specifications of the GPS devices used in this study.
| Image |  |
|
| Specification | Model | GRX1/GSX2 |
| Manufacturer | Sokkia | |
| Accuracy | Kinematic H: 10 mm + 1.0 ppm V: 15 mm + 1.0 ppm |
|
Table 3.
Specification of the echo sounder used for this study.
| Instrument | Specification | |
| Echo sounder | Model | AquaRuler 200 D |
| Manufacturer | SonarTech, Busan, Korea | |
| Resolution | ±1 cm (0–200 m), ±10 cm (20–2,000 m), ±1 m (2,000–8,000 m) |
|
| Gain | Manual, Automatic gain control, Time varying gain | |
| Power | 12–24 V DC MAX 100 Watt |
|
Table 4.
Survey lines in each study area.
| Survey Area | Survey Line | |
| Vertical | Horizontal | |
| A | AV01 (West)–AV04 (East) | AH01 (South)–AV04 (North) |
| B | BV01 (West)–BV05 (East) | BH01 (South)–BV05 (North) |
| C | CV01 (West)–CV04 (East) | CH01 (South)–CV04 (North) |
| D | DV01 (West)–DV04 (East) | DH01 (South)–DV04 (North) |
Disclaimer/Publisher’s Note: The statements, opinions and data contained in all publications are solely those of the individual author(s) and contributor(s) and not of MDPI and/or the editor(s). MDPI and/or the editor(s) disclaim responsibility for any injury to people or property resulting from any ideas, methods, instructions or products referred to in the content. |
© 2023 by the authors. Licensee MDPI, Basel, Switzerland. This article is an open access article distributed under the terms and conditions of the Creative Commons Attribution (CC BY) license (http://creativecommons.org/licenses/by/4.0/).
Copyright: This open access article is published under a Creative Commons CC BY 4.0 license, which permit the free download, distribution, and reuse, provided that the author and preprint are cited in any reuse.


