Submitted:
18 July 2023
Posted:
20 July 2023
You are already at the latest version
Abstract
Keywords:
1. Introduction
2. Materials and Methods
2.1. Wastewater Samples
2.2. RNA Extraction
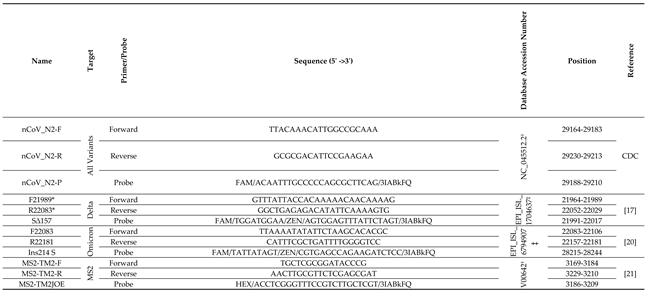
2.3. RT-qPCR
3. Results
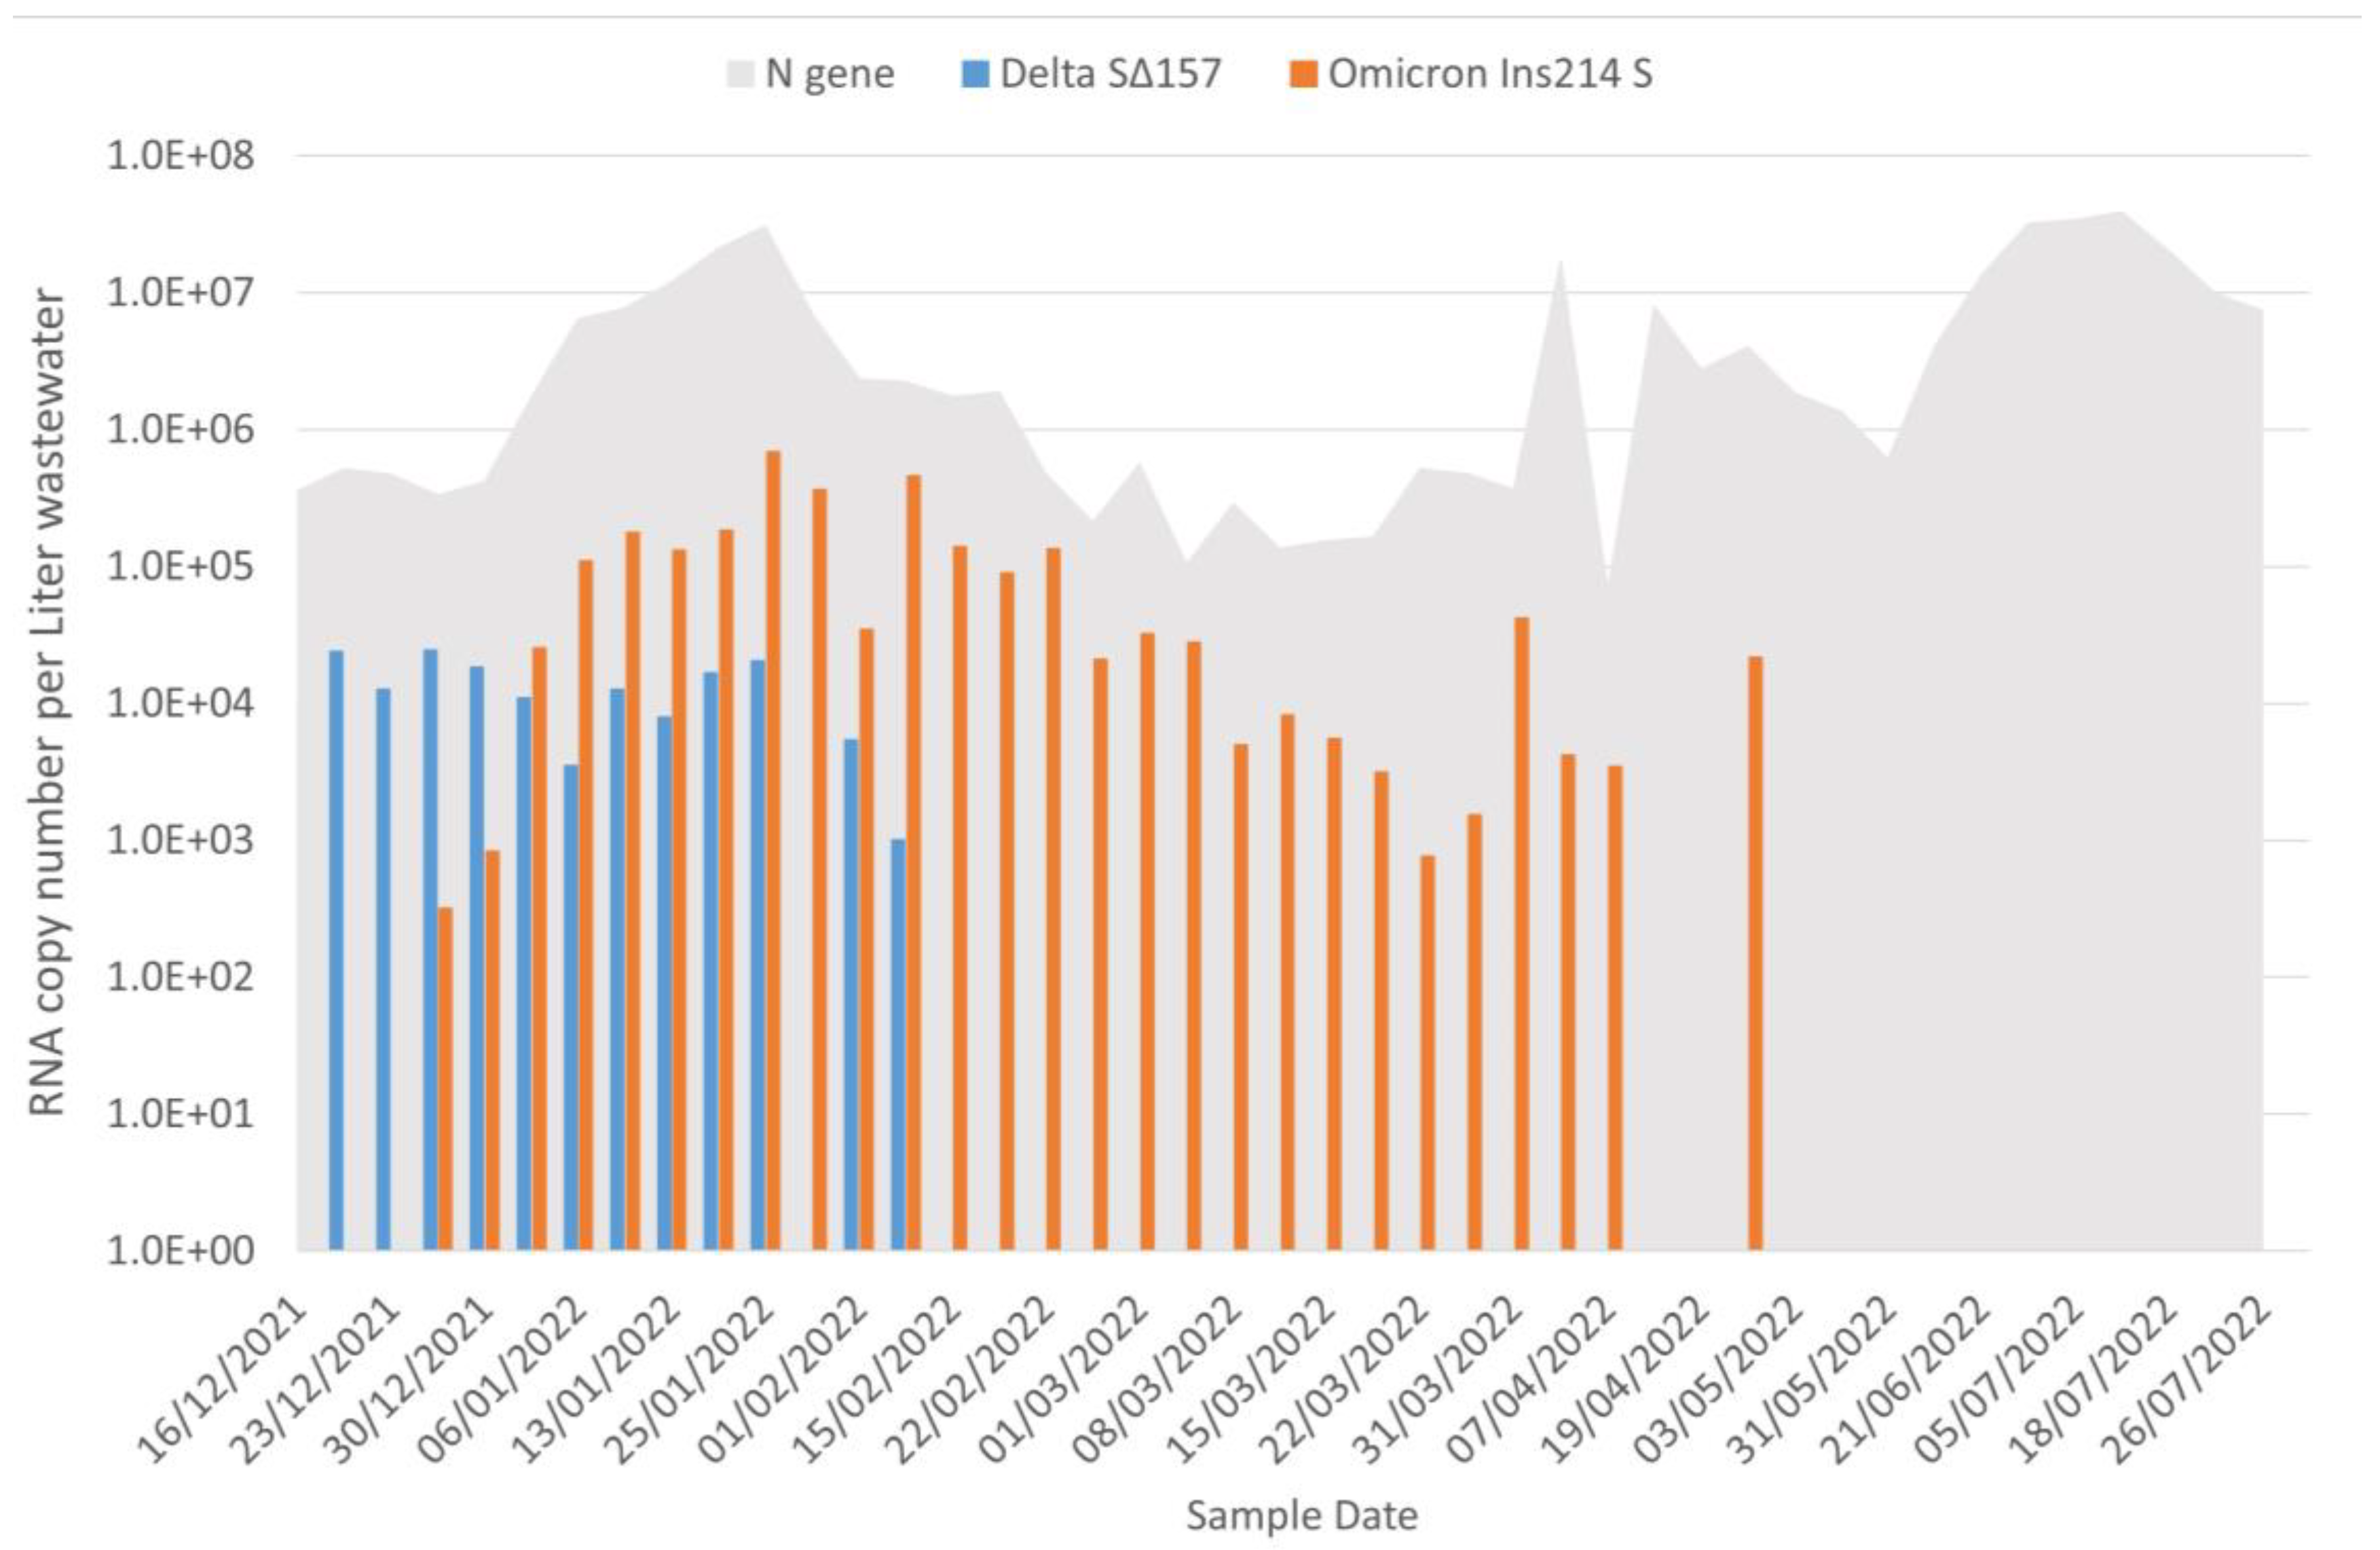
3.1. Wastewater Portrait of SARS-CoV-2
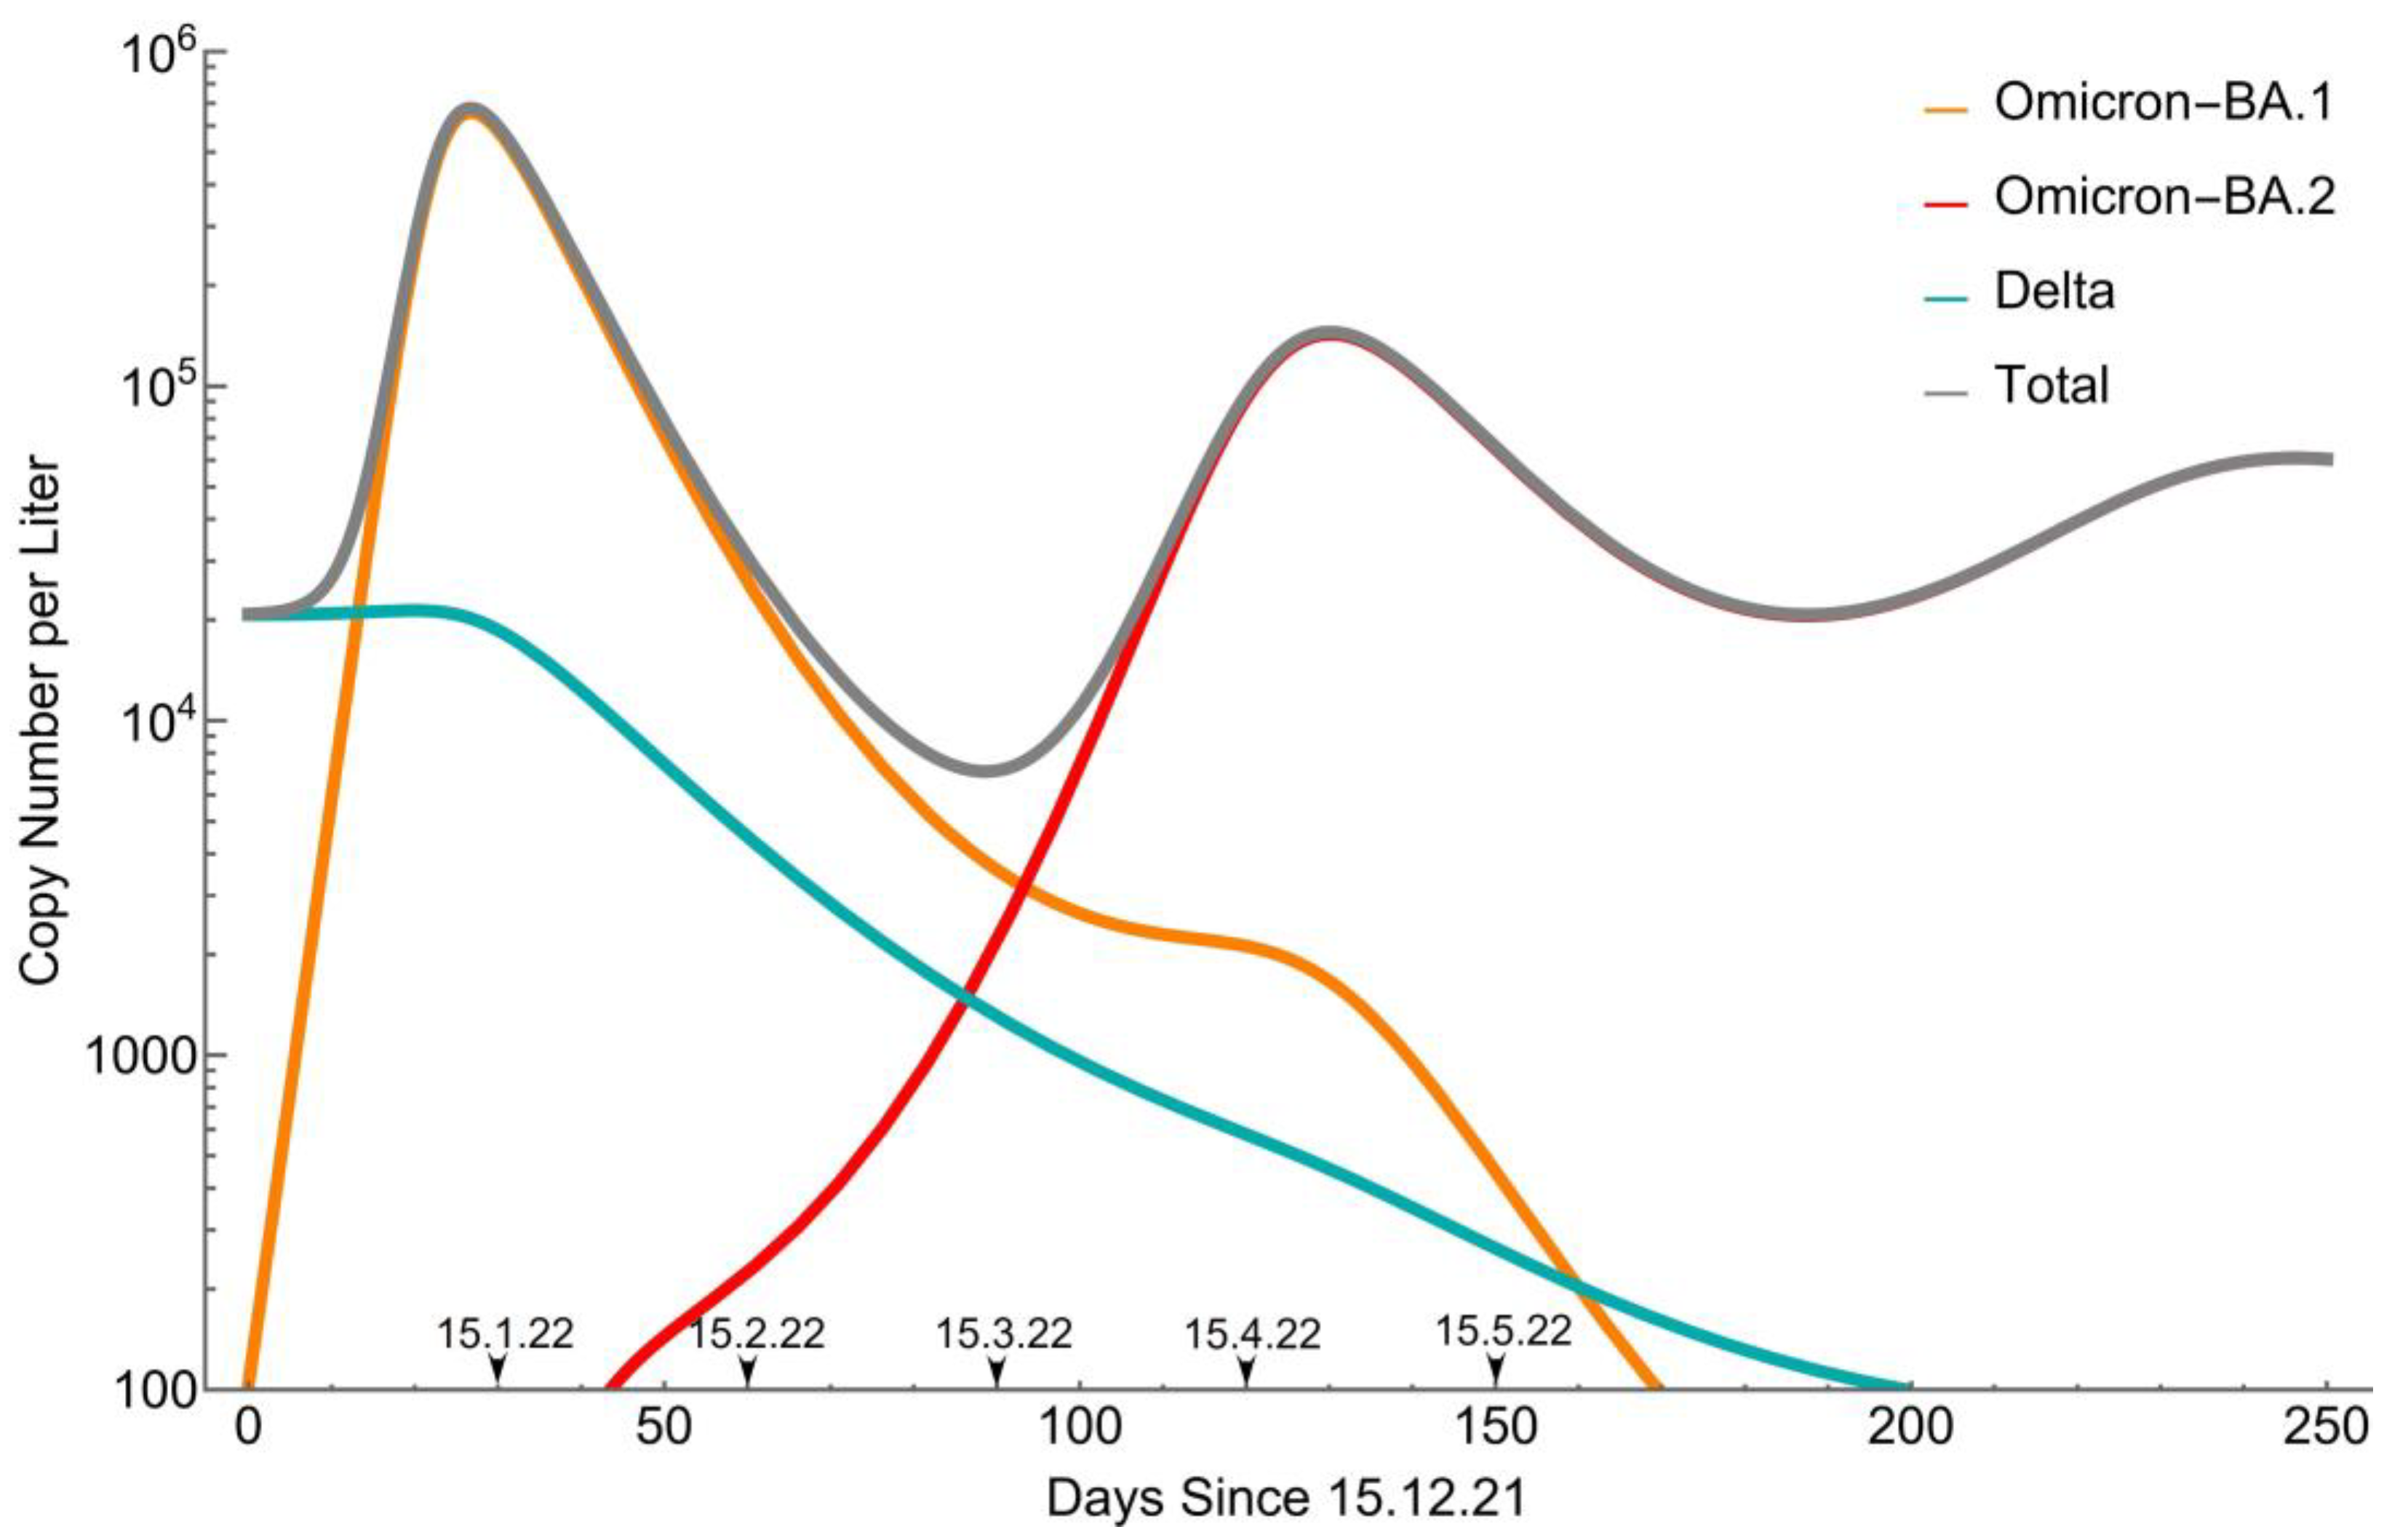
3.2. Remodeling
- , and are the fractions of actively infected populations in Delta, Omicron-BA.1, and Omicron-BA.2, respectively.
- , and are the effective fractions of susceptible populations to Delta, Omicron-BA.1, and Omicron-BA.2 infections, respectively, henceforth "susceptibilities". These variables present an average over the diverse immunity presented in the population, although, in the original SIR model, they simply present the fraction of population that is neither actively infected nor recovered.
- , and are the fractions of recovered population from Delta, Omicron-BA.1, and Omicron-BA.2, respectively. The contribution of recovered individuals from previous outbreaks is accounted for in the initial conditions.
- , and are the infection time-period of Delta, Omicron-BA.1, and Omicron-BA.2, respectively.
- , and are the basic reproduction numbers of Delta, Omicron-BA.1, and Omicron-BA.2, respectively.
- , , and are the corresponding characteristic waning-immunity times, based on exponential decay of the immunity.
-
Basic reproduction numbers
-
Infection periods(days)(days)(days)
-
Characteristic waning-immunity times(days)(days)
-
Cross immunity probabilities,,,

4. Discussion
Supplementary Materials
Author Contributions
Funding
Institutional Review Board Statement
Informed Consent Statement
Data Availability Statement
Acknowledgments
Conflicts of Interest
References
- WHO COVID-19 Weekly Epidemiological Update - Edition 144 2023.
- Wang, H.; Paulson, K.R.; Pease, S.A.; Watson, S.; Comfort, H.; Zheng, P.; Aravkin, A.Y.; Bisignano, C.; Barber, R.M.; Alam, T.; et al. Estimating Excess Mortality Due to the COVID-19 Pandemic: A Systematic Analysis of COVID-19-Related Mortality, 2020–21. The Lancet 2022, 399, 1513–1536. [CrossRef]
- Goswami, S.; Gupta Bakshi, U.; Bhattacharya, S. SARS-CoV-2 and Its Variants. In COVID-19 and SARS-CoV-2: The Science and Clinical Application of Conventional and Complementary Treatments; CRC Press, 2022; pp. 49–60 ISBN 978-1-00-317851-4.
- Farheen, S.; Araf, Y.; Tang, Y.; Zheng, C. The Deltacron Conundrum: Its Origin and Potential Health Risks. J. Med. Virol. 2022, 94, 5096–5102. [CrossRef]
- Tao, K.; Tzou, P.L.; Nouhin, J.; Gupta, R.K.; De Oliveira, T.; Kosakovsky Pond, S.L.; Fera, D.; Shafer, R.W. The Biological and Clinical Significance of Emerging SARS-CoV-2 Variants. Nat. Rev. Genet. 2021, 22, 757–773. [CrossRef]
- Kannan, S.; Shaik Syed Ali, P.; Sheeza, A. Omicron (B.1.1.529) - Variant of Concern - Molecular Profile and Epidemiology: A Mini Review. Eur. Rev. Med. Pharmacol. Sci. 2021, 25, 8019–8022. [CrossRef]
- Karim, S.S.A.; Karim, Q.A. Omicron SARS-CoV-2 Variant: A New Chapter in the COVID-19 Pandemic. The Lancet 2021, 398, 2126–2128. [CrossRef]
- Singh, A.K.; Misra, A. Impact of COVID-19 and Comorbidities on Health and Economics: Focus on Developing Countries and India. Diabetes Metab. Syndr. 2020, 14, 1625–1630. [CrossRef]
- Callaway, E. Heavily Mutated Omicron Variant Puts Scientists on Alert. Nature 2021, 600, 21–21. [CrossRef]
- Chatterjee, S.; Bhattacharya, M.; Nag, S.; Dhama, K.; Chakraborty, C. A Detailed Overview of SARS-CoV-2 Omicron: Its Sub-Variants, Mutations and Pathophysiology, Clinical Characteristics, Immunological Landscape, Immune Escape, and Therapies. Viruses 2023, 15, 167. [CrossRef]
- Kliker, L.; Zuckerman, N.; Atari, N.; Barda, N.; Gilboa, M.; Nemet, I.; Abd Elkader, B.; Fratty, I.S.; Jaber, H.; Mendelson, E.; et al. COVID-19 Vaccination and BA.1 Breakthrough Infection Induce Neutralising Antibodies Which Are Less Efficient against BA.4 and BA.5 Omicron Variants, Israel, March to June 2022. Eurosurveillance 2022, 27. [CrossRef]
- WHO COVID-19 Weekly Epidemiological Update - Edition 115 2022.
- Collivignarelli, M.C.; Collivignarelli, C.; Carnevale Miino, M.; Abbà, A.; Pedrazzani, R.; Bertanza, G. SARS-CoV-2 in Sewer Systems and Connected Facilities. Process Saf. Environ. Prot. 2020, 143, 196–203. [CrossRef]
- Martin, J.; Klapsa, D.; Wilton, T.; Zambon, M.; Bentley, E.; Bujaki, E.; Fritzsche, M.; Mate, R.; Majumdar, M. Tracking SARS-CoV-2 in Sewage: Evidence of Changes in Virus Variant Predominance during COVID-19 Pandemic. Viruses 2020, 12, 1144. [CrossRef]
- La Rosa, G.; Bonadonna, L.; Lucentini, L.; Kenmoe, S.; Suffredini, E. Coronavirus in Water Environments: Occurrence, Persistence and Concentration Methods - A Scoping Review. Water Res. 2020, 179, 115899. [CrossRef]
- Westhaus, S.; Weber, F.-A.; Schiwy, S.; Linnemann, V.; Brinkmann, M.; Widera, M.; Greve, C.; Janke, A.; Hollert, H.; Wintgens, T.; et al. Detection of SARS-CoV-2 in Raw and Treated Wastewater in Germany – Suitability for COVID-19 Surveillance and Potential Transmission Risks. Sci. Total Environ. 2021, 751, 141750. [CrossRef]
- Yaniv, K.; Ozer, E.; Lewis, Y.; Kushmaro, A. RT-QPCR Assays for SARS-CoV-2 Variants of Concern in Wastewater Reveals Compromised Vaccination-Induced Immunity. Water Res. 2021, 207, 117808. [CrossRef]
- Yaniv, K.; Ozer, E.; Shagan, M.; Lakkakula, S.; Plotkin, N.; Bhandarkar, N.S.; Kushmaro, A. Direct RT-QPCR Assay for SARS-CoV-2 Variants of Concern (Alpha, B.1.1.7 and Beta, B.1.351) Detection and Quantification in Wastewater. Environ. Res. 2021, 201, 111653. [CrossRef]
- Maida, C.M.; Tramuto, F.; Giammanco, G.M.; Palermo, R.; Priano, W.; De Grazia, S.; Purpari, G.; La Rosa, G.; Suffredini, E.; Lucentini, L.; et al. Wastewater-Based Epidemiology as a Tool to Detect SARS-CoV-2 Circulation at the Community Level: Findings from a One-Year Wastewater Investigation Conducted in Sicily, Italy. Pathogens 2023, 12, 748. [CrossRef]
- Yaniv, K.; Ozer, E.; Shagan, M.; Paitan, Y.; Granek, R.; Kushmaro, A. Managing an Evolving Pandemic: Cryptic Circulation of the Delta Variant during the Omicron Rise. Sci. Total Environ. 2022, 836, 155599. [CrossRef]
- Dreier, J.; Störmer, M.; Kleesiek, K. Use of Bacteriophage MS2 as an Internal Control in Viral Reverse Transcription-PCR Assays. J. Clin. Microbiol. 2005, 43, 4551–4557. [CrossRef]
- Nill, F. Endemic Oscillations for SARS-CoV-2 Omicron -- A SIRS Model Analysis. Chaos Solitons Fractals 2023, 173, 113678. [CrossRef]
- Goncalves, S.; Abramson, G.; Gomes, M.F.C. Oscillations in SIRS Model with Distributed Delays. 2009. [CrossRef]
- Laurie, M.T.; Liu, J.; Sunshine, S.; Peng, J.; Black, D.; Mitchell, A.M.; Mann, S.A.; Pilarowski, G.; Zorn, K.C.; Rubio, L.; et al. SARS-CoV-2 Variant Exposures Elicit Antibody Responses With Differential Cross-Neutralization of Established and Emerging Strains Including Delta and Omicron. J. Infect. Dis. 2022, 225, 1909–1914. [CrossRef]
- Suryawanshi, R.K.; Chen, I.P.; Ma, T.; Syed, A.M.; Brazer, N.; Saldhi, P.; Simoneau, C.R.; Ciling, A.; Khalid, M.M.; Sreekumar, B.; et al. Limited Cross-Variant Immunity after Infection with the SARS-CoV-2 Omicron Variant Without Vaccination; Infectious Diseases (except HIV/AIDS), 2022;
- Data Resources - COVID-19 Data Tracker - IsraeliMinistryofHealthDashboard Available online: https://datadashboard.health.gov.il/portal/dashboard/corona.
- Tsori, Y.; Granek, R. Epidemiological Model for the Inhomogeneous Spatial Spreading of COVID-19 and Other Diseases. PLOS ONE 2021, 16, e0246056. [CrossRef]
- Tsori, Y.; Granek, R. Spatio-Temporal Spread of COVID-19: Comparison of the Inhomogeneous SEPIR Model and Data from South Carolina. PLOS ONE 2022, 17, e0268995. [CrossRef]
- Dos Santos, J.P.C.; Monteiro, E.; Ferreira, J.C.; Teixeira Lemes, N.H.; Rodrigues, D.S. Well Posedness and Qualitative Analysis of a SEIR Model with Spatial Diffusion for COVID-19 Spread. SSRN Electron. J. 2022. [CrossRef]
- La Torre, D.; Liuzzi, D.; Marsiglio, S. Geographical Heterogeneities and Externalities in an Epidemiological-macroeconomic Framework. J. Public Econ. Theory 2022, 24, 1154–1181. [CrossRef]
- Yaniv, K.; Shagan, M.; Lewis, Y.E.; Kramarsky-Winter, E.; Weil, M.; Indenbaum, V.; Elul, M.; Erster, O.; Brown, A.S.; Mendelson, E.; et al. City-Level SARS-CoV-2 Sewage Surveillance. Chemosphere 2021, 283, 131194. [CrossRef]


Disclaimer/Publisher’s Note: The statements, opinions and data contained in all publications are solely those of the individual author(s) and contributor(s) and not of MDPI and/or the editor(s). MDPI and/or the editor(s) disclaim responsibility for any injury to people or property resulting from any ideas, methods, instructions or products referred to in the content. |
© 2023 by the authors. Licensee MDPI, Basel, Switzerland. This article is an open access article distributed under the terms and conditions of the Creative Commons Attribution (CC BY) license (http://creativecommons.org/licenses/by/4.0/).


