1. Introduction
The one-car-per-person era is imminent, and the amount of traffic is rapidly increasing. It is thus important to develop solutions for the traffic problems such as congestion and car accidents that would result from these situations. Traffic problems can occur from a variety of causes such as inefficient traffic systems or inadequate infrastructure. Traffic problems create inconveniences not only for transportation users but also for residents in traffic areas and have wide-ranging effects, including economic losses. Thus, ways of resolving traffic problems, such as the use of traffic event detection techniques, are attracting attention among researchers [
1,
2].
Traffic event detection via the identification of circumstances that influence the flow of traffic plays an important role in increasing the safety and efficiency of transportation systems [
3]. Traffic events refer to circumstances that influence the flow of traffic, and through the quick detection of and response to traffic events, problems such as traffic congestion and accidents can be prevented, and challenges due to road construction and special occasions can be handled in advance. In this way, the safety and efficiency of traffic flow can be increased by reductions in the rate at which accidents occur and the resolution of traffic congestion. In addition, through the collection and analysis of information on traffic events, the operation and management of traffic systems can be improved. Therefore, traffic event detection techniques play an important role in improving the safety and efficiency of traffic systems [
4].
Crowdsourcing is a research method in which a large workforce is recruited via the Internet to help solve a problem. It can be used for tasks requiring large amounts of labeled data, such as event identification. The large volumes of data that are collected via crowdsourcing can be used to perform machine learning to learn the information needed to identify events and to increase the accuracy of event detection. Crowdsourcing-based traffic event identification generally uses human intelligence to identify traffic events [
5,
6]. This method is performed via online platforms where ordinary people gather. For example, a mobile application is used to observe and record traffic events; the data obtained by the application are then uploaded to a central server. These data are provided by human workers, who review them to distinguish events and assign accurate labels. Crowdsourcing-based traffic event identification can be used for a variety of purposes. For example, [
7] used crowdsourcing to design a driver assistance system platform, whereas [
8] proposed a technique that uses crowdsourcing to efficiently predict road traffic conditions. In these ways, among others, crowdsourcing can be used to measure the degree of road traffic congestion and rapidly respond to traffic accidents.
Traffic events can occur in a variety of circumstances. Manually classifying all of these events is very difficult and costly work. For example, in a traffic jam, in which vehicles block a street and cannot move, it is very difficult to manually count all of the cars and perform classification. In addition, manual classification requires great amounts of time, and therefore, with it, it is impossible to accomplish real-time event detection and handling. If events can be identified via machine learning to resolve these problems, then existing events can be learned, and new data can be identified based on what have been learned by models thus far. For example, [
9] proposed an event detection technique that collects real-time tweets and uses text mining. On the other hand, [
10] presented a methodology that collects traffic-related tweets and uses a big data processing platform known as SAP HANA to preprocess and analyze the data. Through such efforts, traffic events can be quickly and accurately classified, and various services such as traffic congestion prediction can be provided. Therefore, machine learning is an essential technology in traffic event identification. However, conventional techniques generally use entire datasets when collecting and classifying data. Because such methodologies use social data as is, they may include unnecessary data, which can be seriously problematic during analysis. In traffic event identification, the characteristics of the data vary greatly according to the region where the traffic congestion occurs and the type of event; therefore, to distinguish events, it is very important to select the relevant data and geographical locations. Currently, studies are being conducted on event detection techniques that use the geo-tag functions provided by social media to extract regional information [
11]. A geo-tag is a function that tags posts with geographically identifiable data to enable other users to learn information about the regions that are associated with the posts. However, because only 2% of all users actually use geo-tags, event detection techniques that use only geo-tags are limited by poor accuracy.
This paper proposes a regional traffic event detection technique that uses machine learning in a social crowd environment. To effectively analyze traffic events, the events are identified via machine learning, and the keywords in the text are used to extract the locations where the events occurred. This study provides the following contributions.
The ratio of irrelevant data is reduced via the analysis of data that are collected via crowdsourcing.
Through the use of self-learned word embedding, it becomes possible to perform more effective and flexible event detection that is not dependent on a certain social media service.
Several models are compared, and the model with the best performance is selected.
Geographic locations can be determined through text mining rather than by reliance on social media functions.
This paper is organized as follows.
Section 2 analyzes and describes the problems of existing techniques.
Section 3 introduces the processes and content of the proposed regional traffic event detection technique.
Section 4 discusses the results of experiments that evaluated the performance of the proposed technique. Finally,
Section 5 presents the conclusions of this paper and proposes follow-up research.
2. Related Work
Existing traffic event detection techniques have adopted methods that improve event detection accuracy by combining different kinds of data or have used social media in conjunction with machine learning.
For example, [
12] proposed an architecture that detects traffic events using social media and taxi GPS data to increase event detection accuracy. This technique combines different kinds of data to improve the accuracy of its processing. That is, it uses social media data to distinguish traffic problems, and GPS data to extract spatiotemporal information. It also uses density-based clustering to group related roads into single groups and analyze them. Taxi GPS data are used to accurately understand the times and locations of traffic abnormalities, whereas social data are used to describe the causes of traffic abnormalities. However, the presented framework can only detect traffic events and cannot determine the precise causes of the events.
Meanwhile, [
13] proposed the Smart Traffic Management Platform (STMP), which integrates and analyzes sensors and social media to detect traffic events and increase the accuracy of event detection. STMP detects concept drift by integrating heterogenous big data streams such as IoT, smart sensors, and social media, and distinguishes repeating and non-repeating traffic events. This information is used to determine the spread of event influence, predict traffic flow, analyze commuter sentiment, and determine optimal traffic control. However, this system requires semantic information to accurately process both sensor and social media data.
The authors of [
14] proposed a detection method that detects several emergency situations, including traffic situations, by using machine learning to perform event identification. This technique uses binary classification to select data that indicate emergency situations from among social data, and multi-class classification to classify event types. In addition, a bidirectional long short-term memory (BiLSTM) model is used to extract time and location information. Finally, grouping is performed based on calculations of similarities in terms of event type, time, and location. This technique is able to recognize different data points as a single event through grouping and is able to understand how events change over time. However, it has demonstrated poor performance in traffic events where location is important because its similarity calculation formula uses the same weights for time and location.
In [
15], the researchers focused on using machine learning to distinguish complaints regarding road irregularities and poor road conditions. In this approach, places and people are extracted through Twitter-based entity name recognition, and the latitude and longitude of each extracted entity name are obtained through the OpenStreetMap API. In addition, machine learning is used to classify tweets into three categories: useful, normal, and not useful. “Normal” classified tweets can then be converted into useful tweets using a technique proposed by the researchers. However, this approach has exhibited poor performance in terms of precision and recall.
In [
16], the authors proposed a contextual word embedding method that combines a convolutional neural network (CNN) model and a bidirectional encoder representation from transformers (BERT) model to detect traffic events. This technique shows that a CNN model created for image processing can also be used for text processing. Furthermore, it shows that two or more models can be combined and used together, rather than the method relying on only one model. The technique was demonstrated to be of excellent performance. However, it can be improved further to extract the times and locations at which traffic events occur to perform additional analysis.
In [
17], the researchers used Twitter to detect events that influence traffic congestion and proposed an automatic labeling access method that automatically assigns labels, taking into account the large volume of data. However, because the method was created based on an existing dictionary, it experiences errors when dealing with keywords that are not included in the dictionary. As a result, it is unable to detect events when posts use place names, etc., rather than city names, which is complicated further by the fact that 98% of Twitter users do not use geo-tags. The utilization of user profiles may introduce errors in the detection of location information, particularly when users post content from a location different from the one indicated on their profile.
3. Proposed Regional Traffic Event Detection Technique
3.1. Structure of Proposed Technique
Existing event detection methods that use social media data have the following problems. First, detection accuracy decreases when the ratio of posts that are unrelated to the event of interest is unbalanced and when there are insufficient data. Second, cases in which geographic location information (geo-tags) are provided in social media are very limited; therefore, accuracy can be poor in fields of application where location information is essential. Furthermore, when different types of data are combined and used, inconsistencies between data can occur. As the amount of data increases, accuracy can be decreased by increased preprocessing complexity and the inclusion of unnecessary information. In the case of sensor data, there is the possibility that unreliable values are collected by malfunctioning devices.
In this study, data collected via crowdsourcing are applied to a machine-learning model to perform event detection. The collected data are first preprocessed, and features are extracted. A machine-learning model is trained based on the extracted features. The trained model later receives new data as input and judges whether the data are related to an event. The machine-learning method used is a classification model. This model classifies the input data into predefined classes. To do this, it learns the decision boundary, which is the standard by which the model makes decisions based on the training data. Later, when new data are entered as input, the model determines to which class the data belong according to the decision boundary and outputs the classification results. Therefore, this paper presents a machine-learning method that preprocesses data collected via crowdsourcing and trains a classification model based on the data to perform event detection. In this way, the accuracy of event detection can be improved.
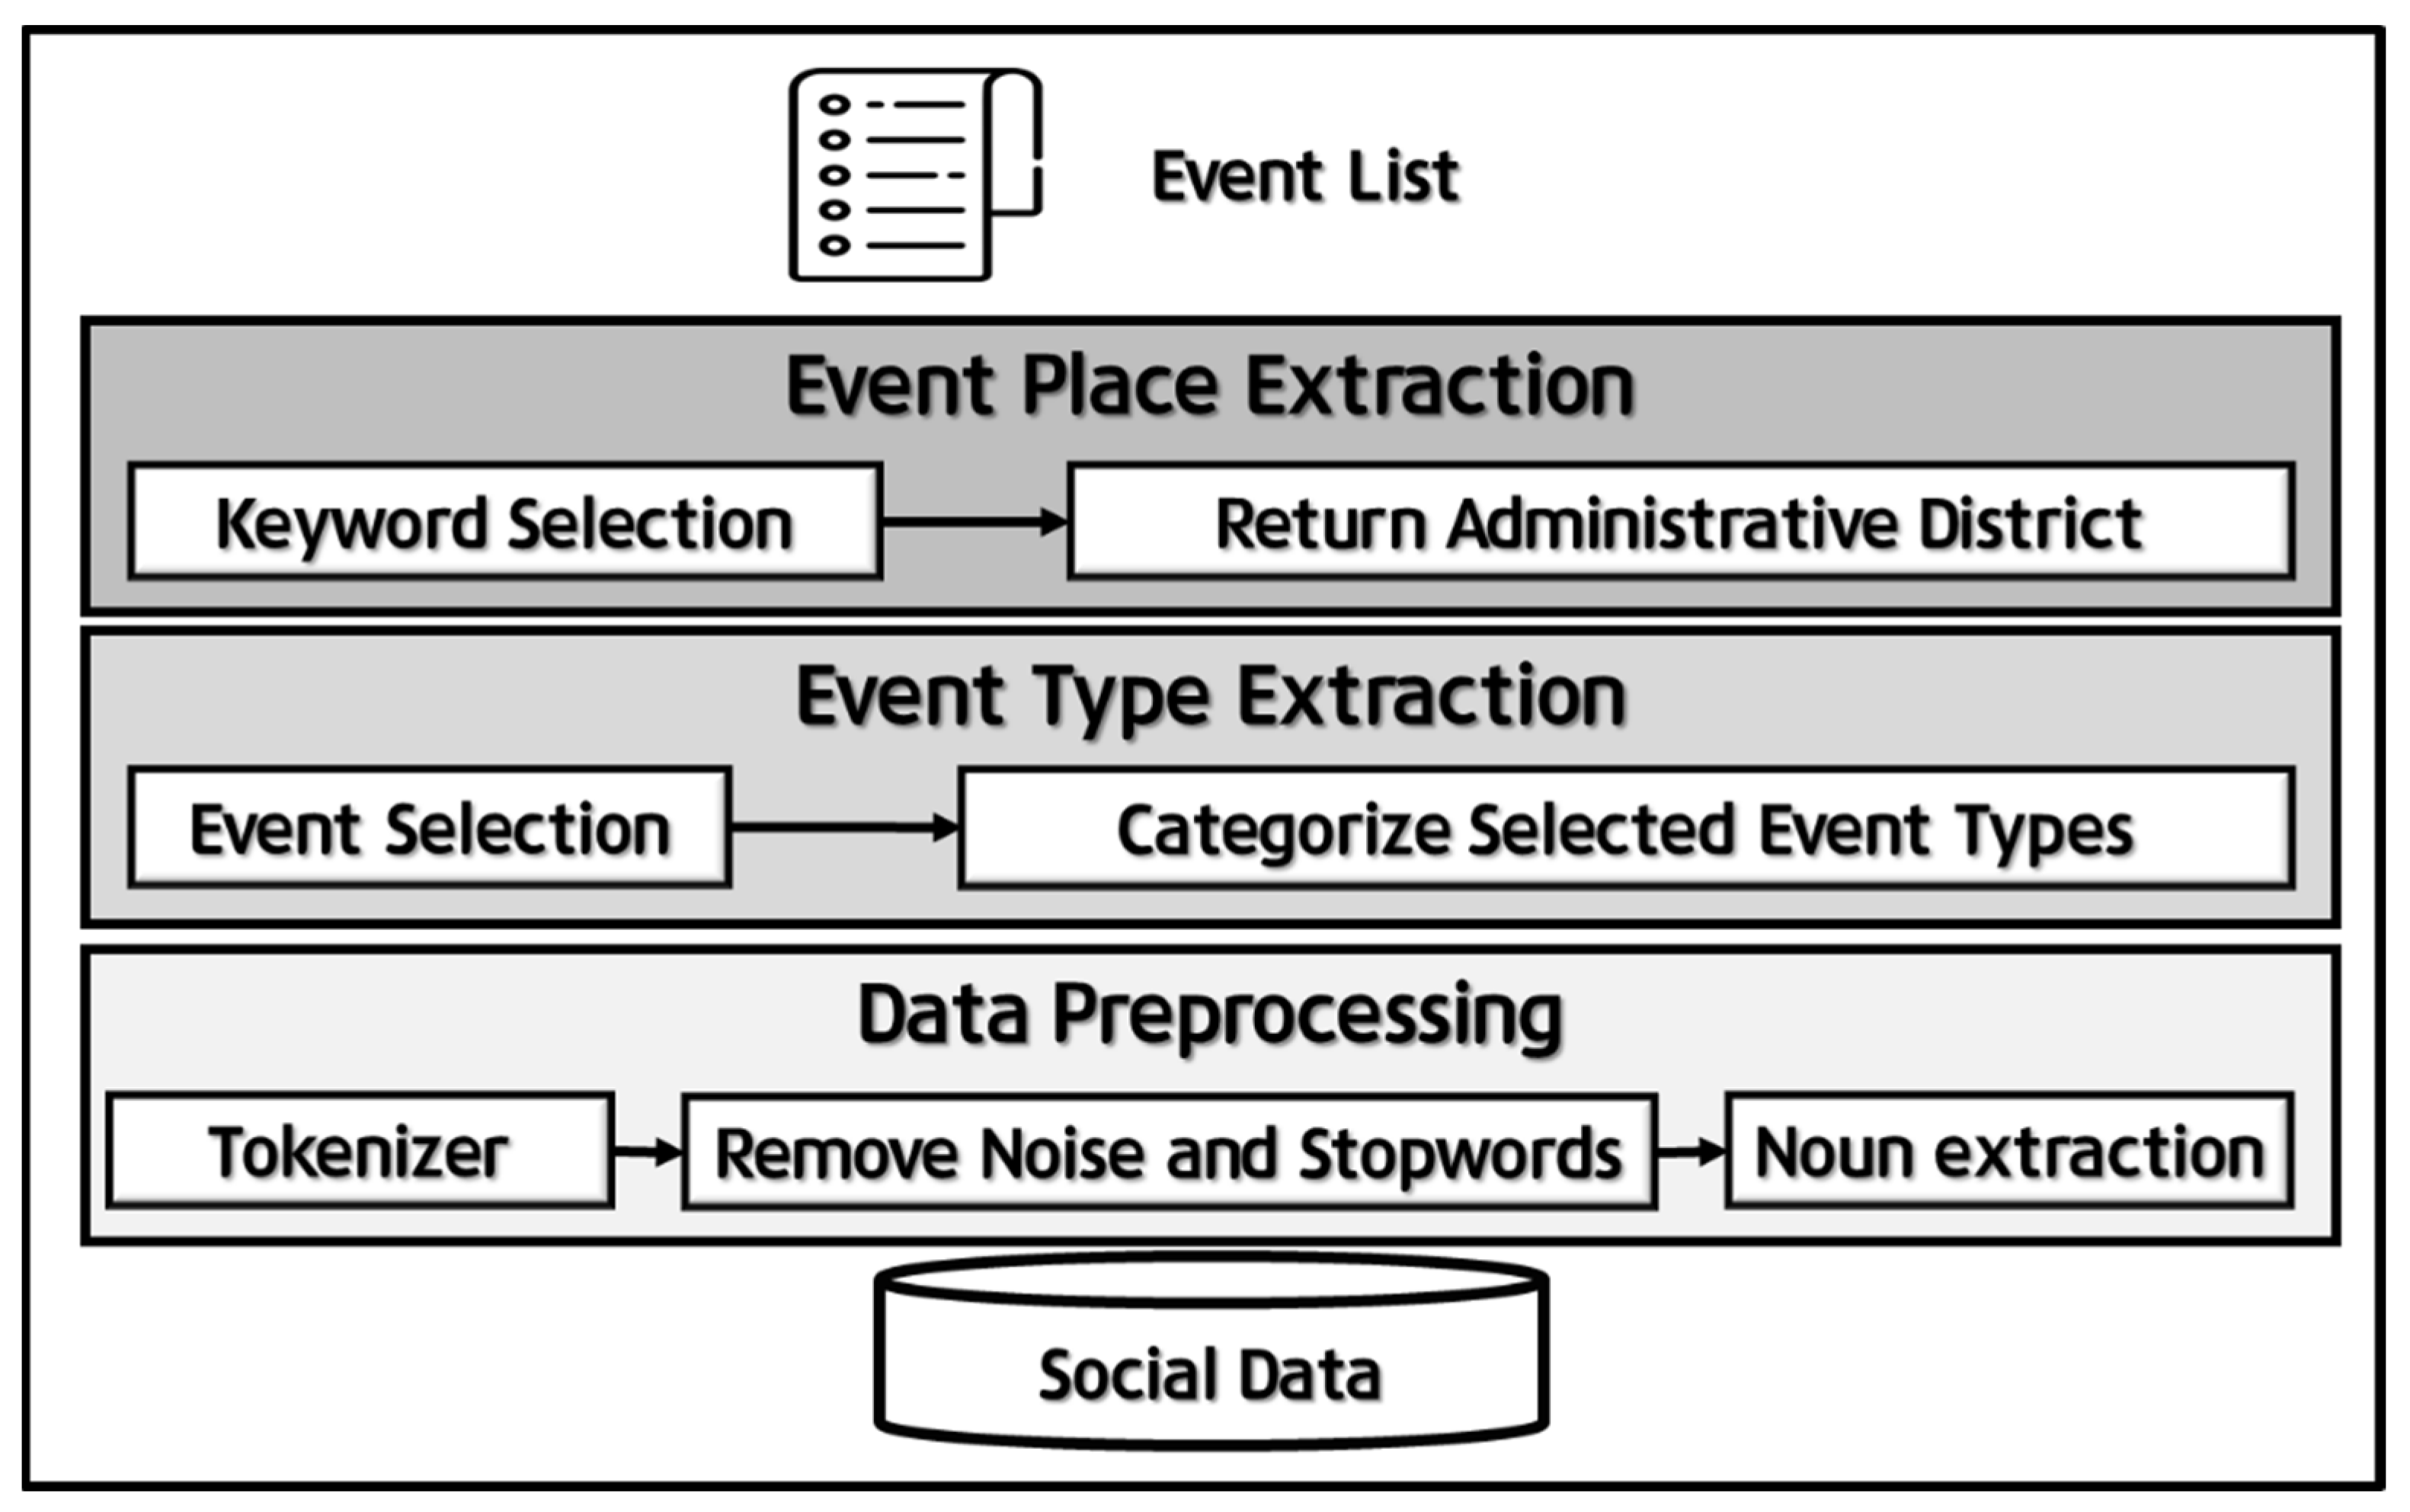
Figure 1 shows the overall structure of the proposed technique. It consists of three modules such as Data Preprocessing, Event Type Extraction, and Event Place Extraction. Each module is necessary to increase the accuracy of the event detection. The first module, the Data Preprocessing module, includes a Tokenizer, Remove Noise And Stopwords, and Noun Extraction stages. It refines the collected data by removing any noise and stopwords. Social data contain many grammatically incorrect expressions, which reduce the accuracy of event detection. The second module, the Event Type Extraction module, identifies which event the collected data represent. The Event Selection stage first selects the traffic-related events, and then the Categorize Selected Event Types stage determines the traffic-event types of the selected events. The final module, the Event Place Extraction module, extracts the locations of the events that are represented by the data. Because traffic events occur in specific regions, the location information of the events must be known. To do this, keywords in the text that represent regions are identified in the Keyword Selection stage, and the administrative districts where the events occurred are extracted in the Return Administrative District stage. In this way, the regional information can be obtained.
3.2. Data Preprocessing
Social data are freely expressed by users and are therefore irregular data by nature; they vary in terms of structure and form and almost always contain typographical errors, special characters, etc. Analysis techniques that use machine learning are greatly influenced by the form of the data. If the data are used as is, errors may occur, or accuracy may be reduced during event detection. As such, a data refinement process is needed. The following data refinement methods can be used to present the nonstandard data in a standardized form and thereby enable accurate event detection.
Tokenization is a process that converts complex text into word sets known as tokens. Data that consist of text includes spaces, punctuation, mathematical symbols, special characters, and typographical errors. In the proposed system, characters other than Korean letters and numbers are removed, and an n-gram tokenization approach is used to divide each part of the text into words. After this stage, each text in the corpus is expressed as a series of words for additional processing.
Unnecessary data can greatly reduce machine-learning performance. Therefore, the proposed approach removes noise and stopwords, which are considered unnecessary data, from the text. Noise refers to mathematical symbols such as ‘@, *, _’, special characters including punctuation, and typographical errors. The Korean language uses consonants and vowels, specifically in patterns composed of initial consonants, medial vowels, and final consonants. Text that does not follow this pattern is considered meaningless. Therefore, text that contains only consonants or vowels is considered to be a typographical error and removed. On the other hand, stopwords are words that appear often but are meaningless. For this study, meaningless words such as "urgent” or “first” are selected and removed.
Index words or keywords that represent sentences are in the form of nouns. Therefore, by extracting nouns to convey meaning accurately, the proposed method can reduce the dimensions of the text expressions during machine learning and increase accuracy. In this study, a morpheme analyzer is used to perform noun extraction.
3.3. Event Type Extraction
Event type extraction is the process by which the events in the traffic data are classified into specific types. It performs an essential role in understanding, and quickly responding to or preventing, traffic conditions. Through this, traffic safety and efficiency can be increased. Event type extraction is performed using machine learning. Traffic data should first be processed by a text classification algorithm to extract important information that influences the event type. For this purpose, natural language processing (NLP) and machine-learning algorithms are generally used, and data refinement, preprocessing, and feature extraction processes are performed to increase the event type extraction accuracy. Through such a process, accurate and reliable event type extraction is made possible.
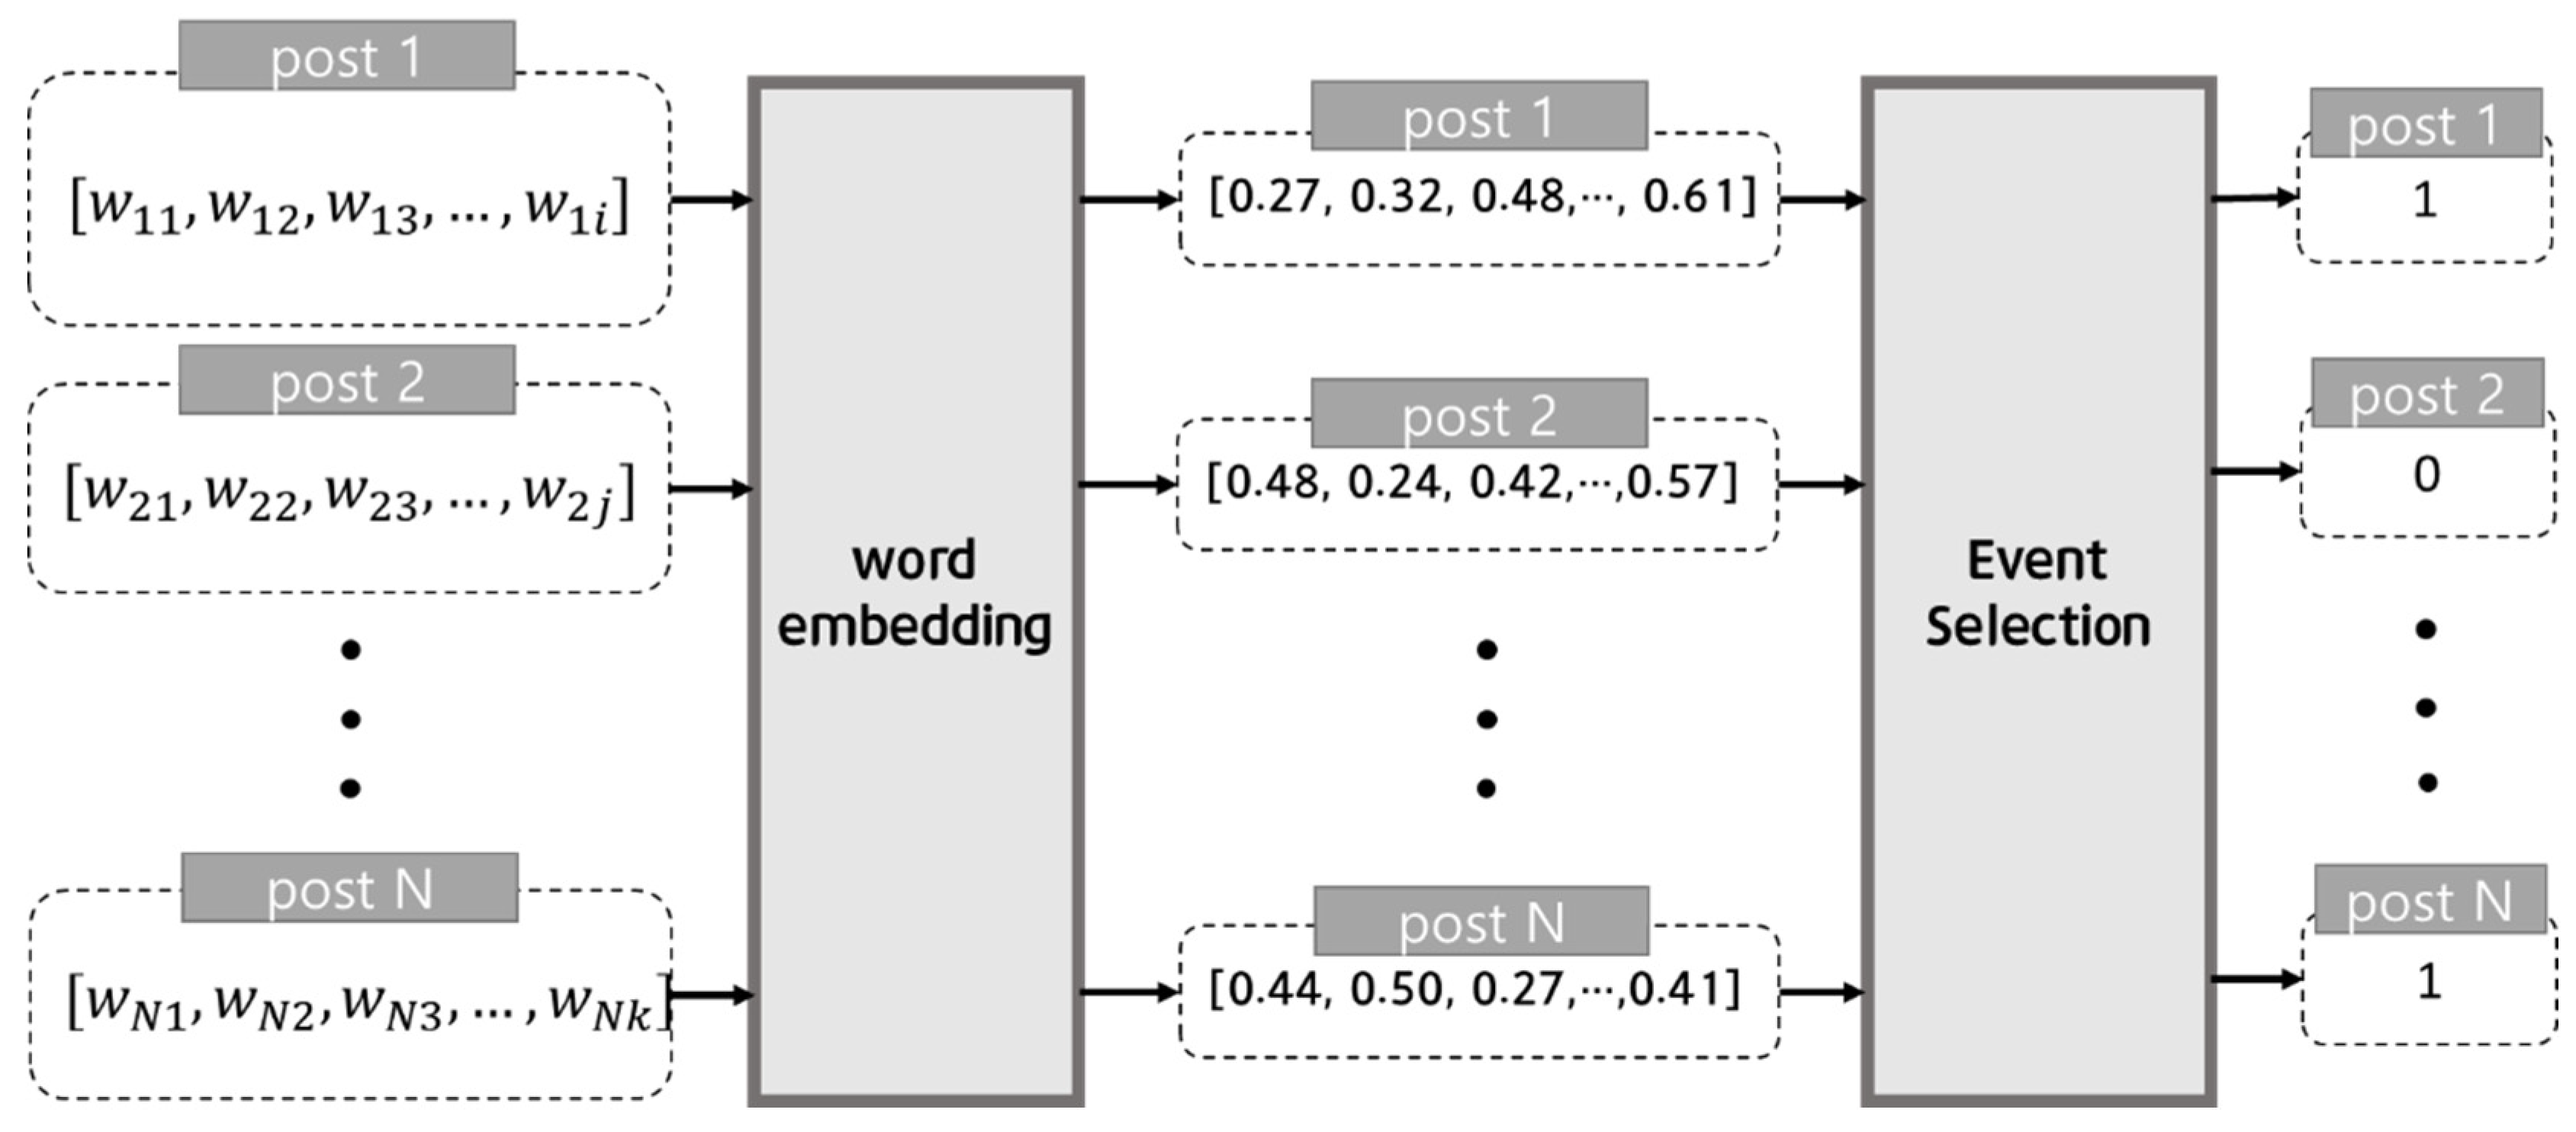
Figure 2 shows an overall flowchart of the event classification process. Event type extraction consists of two stages: Event Selection and Categorize Selected Event Types. In the Word Embedding stage, the term frequency–inverse document frequency (TF–IDF) values for each word are calculated and vectorized, and then are stored in the model. Vectorization is performed by the model that stores the words of each post. In the Event Selection stage, the data are divided into those that influence traffic conditions and those that do not, and only the influential data are selected. This prevents the accuracy from decreasing in the traffic event extraction stage. Subsequently, the Categorize Selected Event Types stage determines the event types of the selected traffic events.
Table 1 shows the event types and event meanings. In this study, the traffic-related data were classified into six events (accident, construction, special event, weather, congestion, and others) according to the traffic events defined by Korea’s National Transportation Information Center [
18].
In this study, TF–IDF was used as the word embedding method for machine learning. TF–IDF is a statistical method that is used to calculate the relative importance of words in text data, and assigns weight values based on word frequency, including with respect to the entire document [
19]. Thus, it reflects the importance of each word within the document. Through this approach, the model can know the meanings and relative importance of words to accurately identify event types.
During Event Selection, a binary classifier is used to classify the data into those that influence traffic conditions and those that do not, to select only the influential data.
Figure 3 shows an example of event selection. Posts that have completed preprocessing are divided by word; therefore, they maintain an array form. An embedding model is used to vectorize the words in these arrays into numbers. Machine learning is applied to the vectorized values, deriving a result of 1 if the post is related to a traffic event, and 0 if the post is not.
In this study, classification is performed using five types of binary classification models: naïve bayes, random forest, support vector classifier (SVC), linear SVC, and logistic regression [
20,
21,
22,
23,
24]. Binary classification refers to the problem of classifying data into 1s (true) or 0s (false). That is, binary classification is performed to classify data into two classes according to the form of the data.
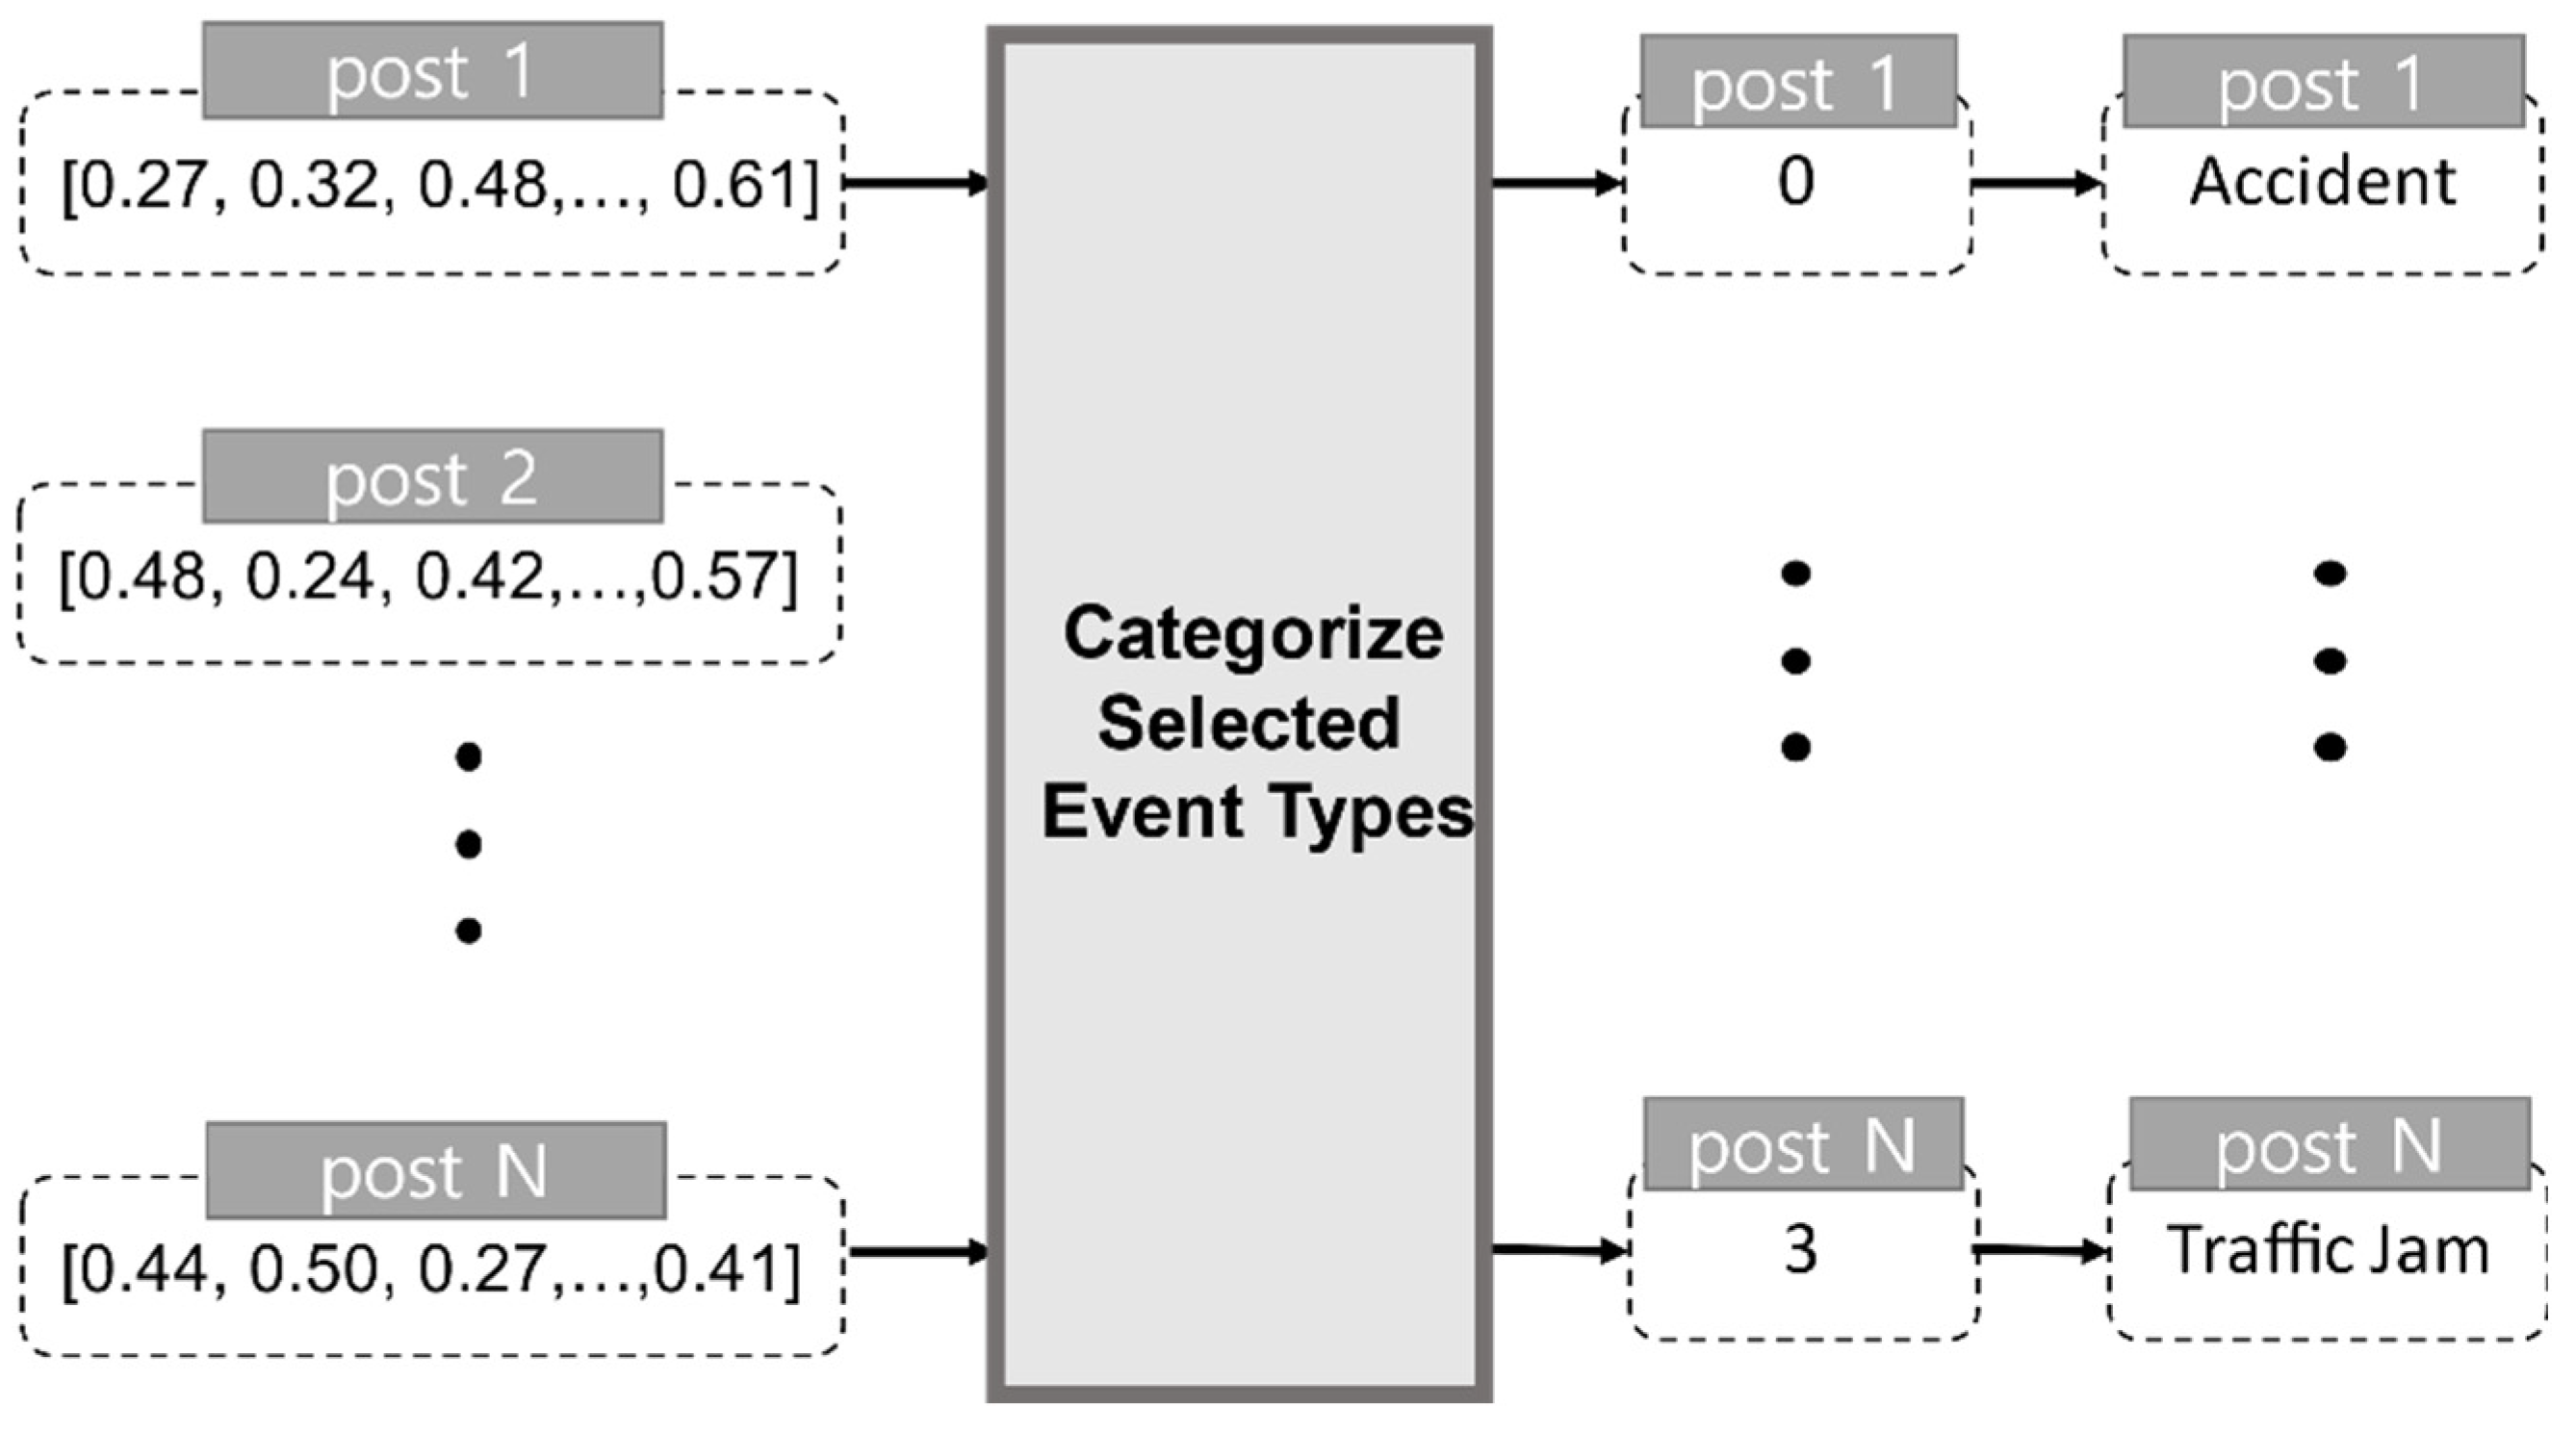
After event selection, the process undergoes the Categorize Selected Event Types stage to classify the events according to event type. An example of the Categorize Selected Event Types stage is shown in
Figure 4, depicting multi-class classification. The vector values of the posts that were selected as being related to traffic events via Event Selection are inputted into the multi-class classifier. When the results are outputted by the multi-class classifier, they are changed to text referring to the types of these events.
In this study, classification is performed using a total of six models: naïve Bayes, random forest, SVC, linear SVC, BiLSTM, and TextCNN, which is a CNN for text classification [
25,
26]. Multi-class classification refers to the classification of items into three or more classes. Multi-class classification includes the one-versus-all (OvA) strategy and the one-versus-one (OvO) strategy. The OvA strategy creates a binary classifier for each class and selects the class that produces the highest score. By contrast, the OvO strategy creates binary classifiers for all possible combinations of two classes and selects the class that is classified as the most positive.
3.4. Event Occurrence Region Extraction
The importance of traffic events can vary according to the location of the user; therefore, location detection is very important. To perform location detection, it is necessary to extract the event occurrence region to know the place where the event occurred. In general, social data may provide the location information of users; however, this is limited to only 2% of all users. For this reason, it is necessary to select keywords that allow the region to be known from the text data and to use these keywords to identify administrative districts.
This study used an entity name recognition API based on the BERT model to extract keywords that indicate region from the text. The BERT model, a natural language processing model developed by Google, is unlike conventional models in that it is able to understand context by learning sentences in both the left and right directions [
27]. An entity name recognition API recognizes certain entity names in text and provides semantic information for words that represent the entities.
Table 2 shows the keywords that represent regions among the entity name tags [
28]. These tags are used to extract region-related keywords from the data. The entity name recognition API is used to recognize and assign entity names to each word of the text data. Then, the words that have been assigned location-related entity names are extracted. To do this, location-related entity names are defined, and entity names are assigned to each word before the keywords are extracted. Then, the words that include matching entity names are extracted.
After the Keyword Extraction stage is finished, the process proceeds to the Return Administrative District stage to return administrative districts. If there are several keywords, the administrative district is returned based on the last keyword because Korean addresses are arranged with the most specific location listed last. Korean administrative districts consist of one special city, six metropolitan cities, eight islands, one special autonomous province, and one special autonomous city for a total of 17 administrative districts, which are classified into regional local governments. The administrative subdistricts of the regional local governments are called basic local governments, and they consist of cities and areas referred to by the Korean terms “gun” and “gu.” Geocoding is used to extract administrative districts based on the previously extracted keywords. Geocoding refers to converting locations on the Earth surface to addresses or coordinates based on unique names. That is, it generates location information that has geographical coordinate information. To do this, the inputted address or location information is analyzed and mapped to a geographic information database. For geocoding, an API is generally provided, to which addresses or location information are inputted as strings of text and converted into geographic coordinates. With this, the user can obtain geographic information through simple API calls. Typical geocoding services include Google Maps API and Naver Maps API. Because the data provided by each API are different, accuracy is increased through the use of several APIs rather than a single API. This is important because when geocoding is used to extract all administrative districts for location keywords, there may be administrative districts that do not exist for each geocoding API. Additionally, because the last keyword is the keyword that is close to the event, geocoding is performed based on the last extracted administrative district among the extracted administrative districts.
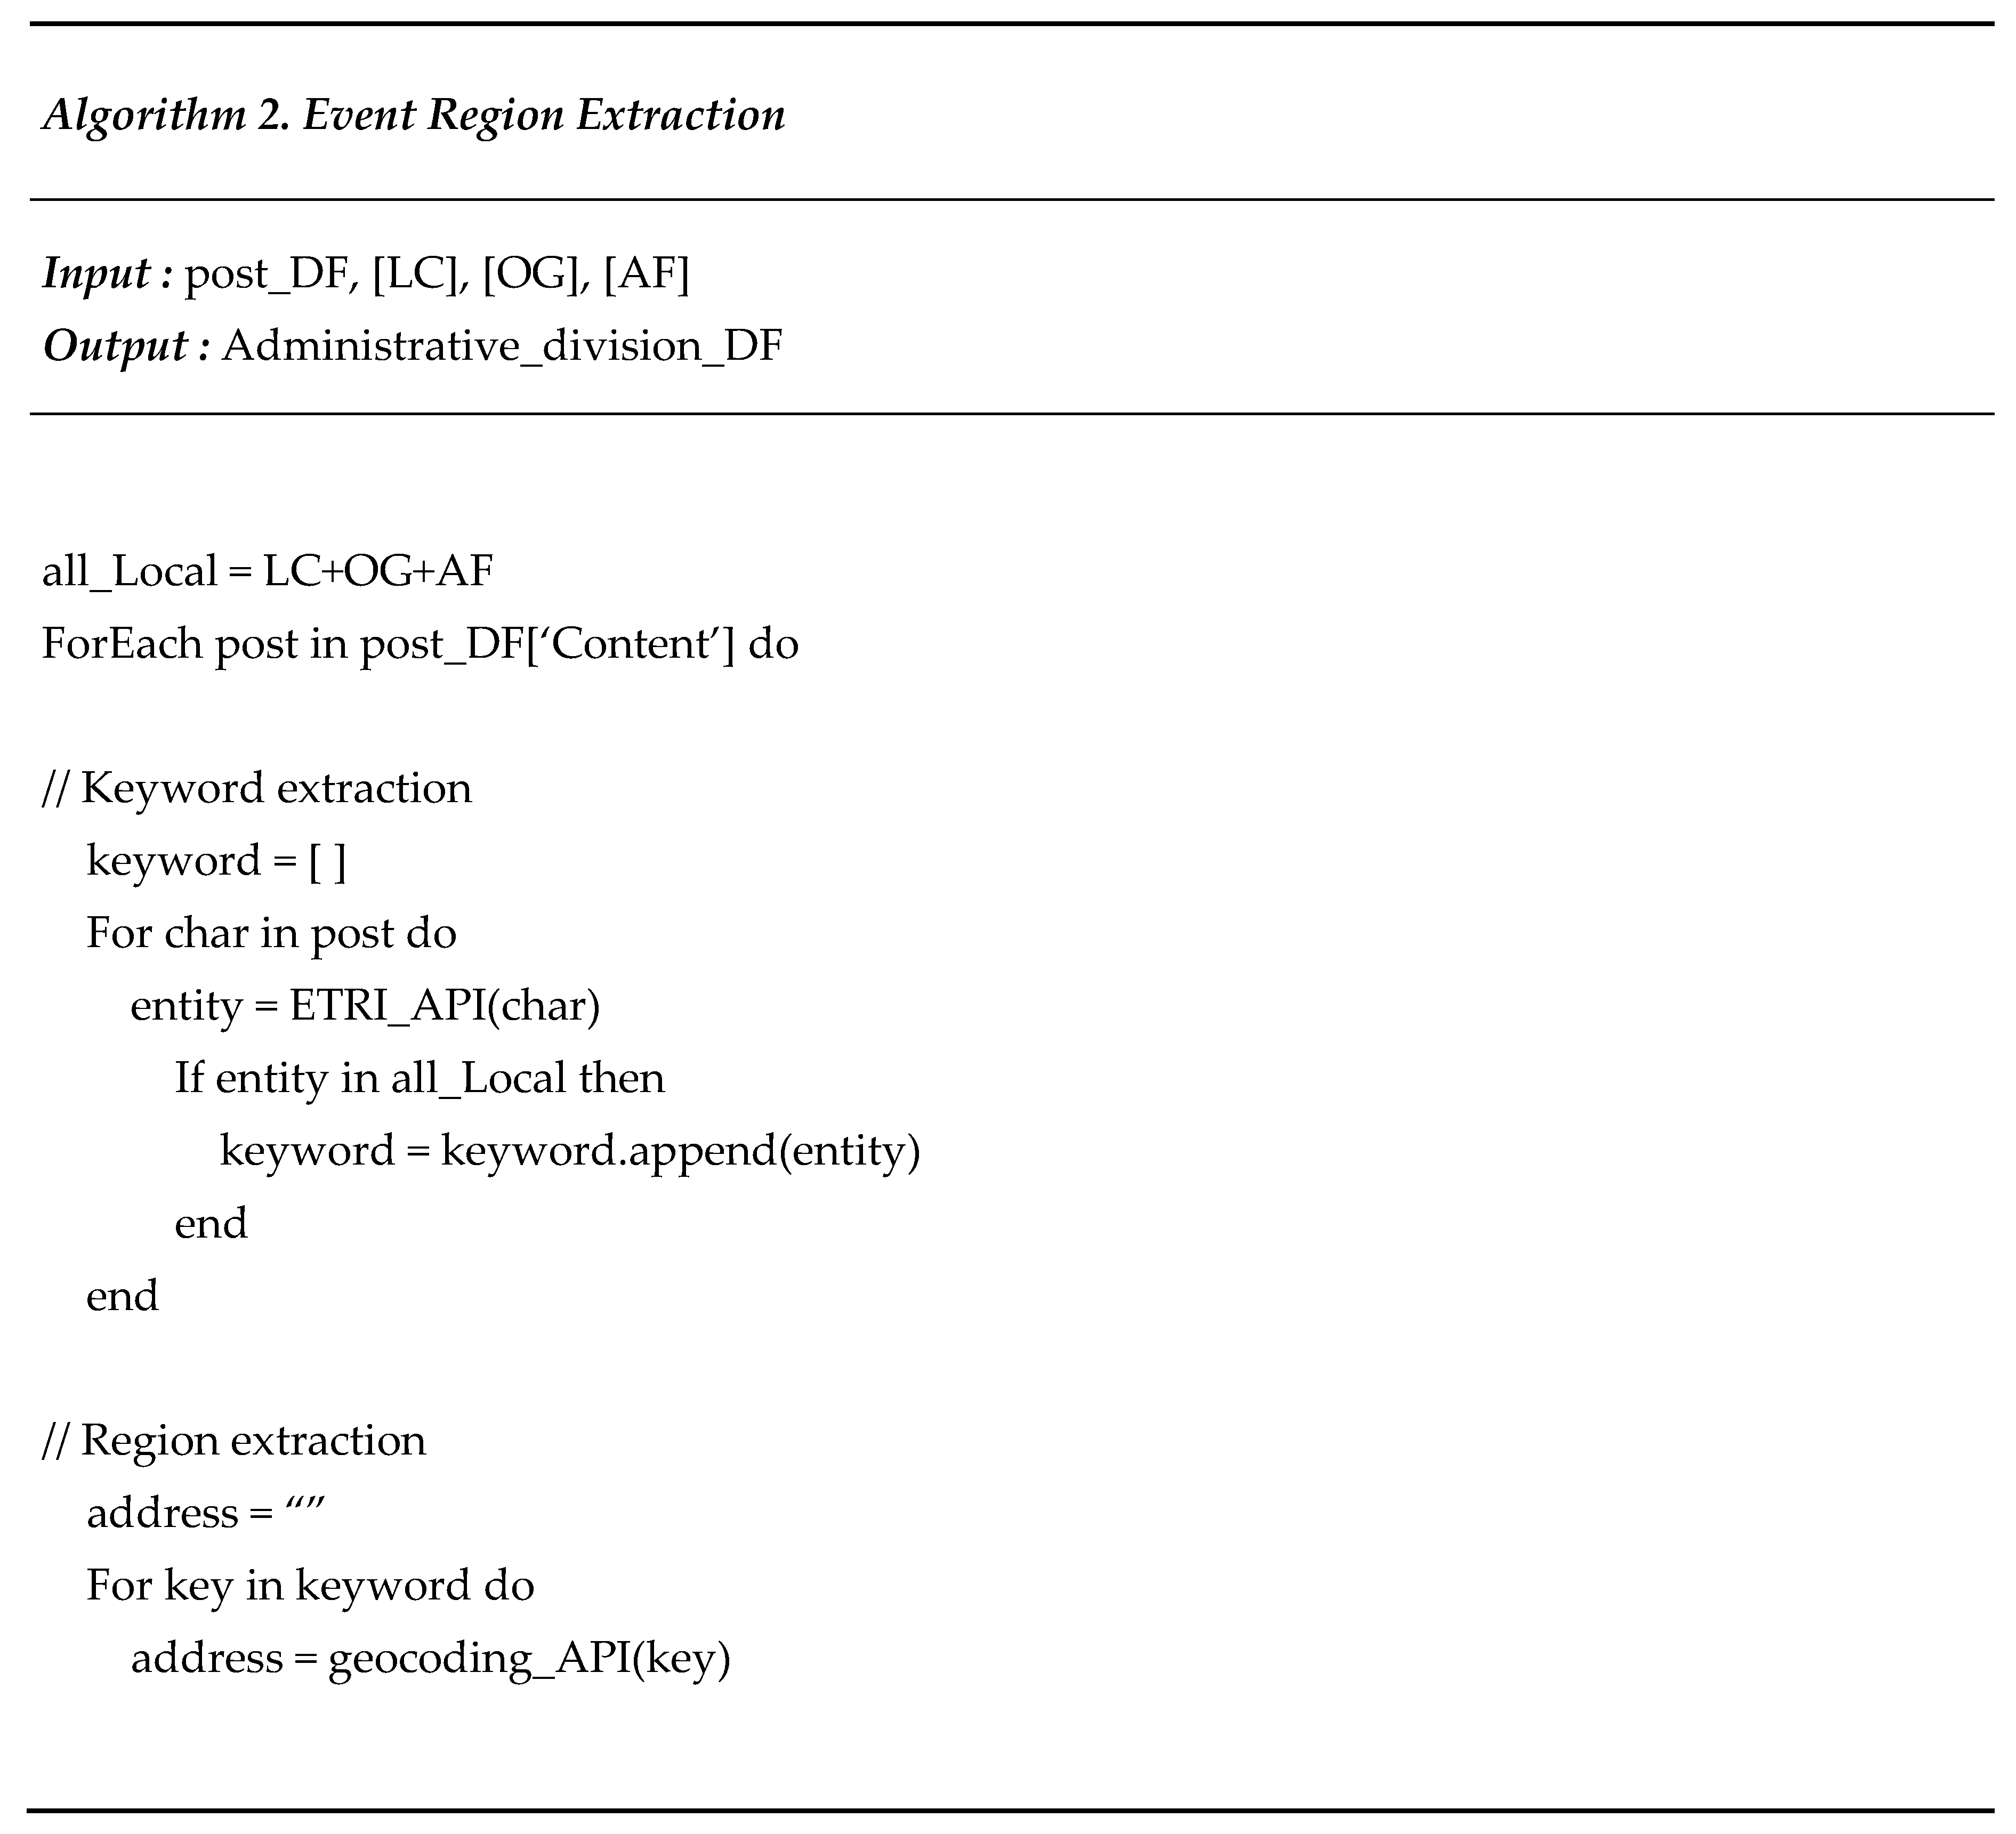
Figure 5 shows the event occurrence region extraction algorithm. The subclassification items of LOCATION(LC) and ORGANIZATION(OG), which are tags that represent regions among the entity name tag set, and AF_ROAD and AF_BUILDING, which are subclassifications of ARTIFACTS(AF), are defined as the new array all_Local. To perform keyword extraction on each post, the entity name recognition API is used to obtain entity name tags for each word. If the inputted entity name tag exists in all_Local, it is considered to be a keyword that represents a region name and is stored in the keyword array. Administrative district extraction is performed based on the selected keywords. The geocoding API is used to convert the administrative districts, and the converted administrative districts are divided and stored as metropolitan local governments, basic local governments, and subdistricts.
4. Performance Evaluation
The superiority of the proposed regional traffic event detection technique was proven through comparisons of the performance of the proposed technique with those of conventional techniques. The sklearn and tensorflow libraries were used for machine learning, and the entity name recognition API provided by ETRI was used for entity name recognition [
28]. The geocoding APIs provided by Google and Kakao were used for region extraction [
29,
30].
Data provided by the TBN Korea Traffic Broadcast were used for this evaluation [
31]. TBN Korea Traffic Broadcast is one of South Korea’s terrestrial broadcasting stations and airs programs related to 24-hour traffic information. TBN provides real-time traffic information via its National Traffic Information Center, which is operated in association with South Korea’s Road Traffic Authority. For the performance evaluations, data from Friday, March 05, 2021, to Thursday, September 30, 2021, excluding the data for July, were used as the training dataset, whereas data from Thursday, July 1, 2021, to Saturday, July 31, 2021, were used as the test dataset. The collected traffic data include the region, ID, report data, and content. The regions are divided into all regions, Busan, Gwangju, Daegu, Daejeon, Gyeongin, Gangwon, Jeonbuk, Ulsan, Gyeongnam, Gyeongbuk, Jeju, and Chungbuk. The IDs are the reporter’s name or social media name. In the case of data reported by a public organization, the public organization’s name is the ID. The report date is the date and time at which the data were reported and consists of the year, month, day, hour, and minute. The content indicates traffic conditions such as accidents, construction, etc., and consists of text.
The performance evaluation of the proposed regional traffic event detection technique consisted of an event type classification performance evaluation and an event occurrence region extraction performance evaluation. The event classification performance evaluation compared the performance of the models and determined which model is most suitable. In addition, to demonstrate the necessity of binary classifiers, the validity of the proposed technique was proven through comparisons of the results of using binary classifiers together with multi-class classifiers and the results of using only multi-class classification without binary classification. To evaluate the accuracy of the event occurrence region extraction, 100 random regions were extracted 5 times repeatedly, and the accuracy based on the five repetitions was calculated.
In this study, accuracy was evaluated based on the receiver operating characteristic (ROC) curve, area under the curve (AUC), precision, recall, and F-measure. In the proposed technique, the data were classified via binary classification into those that influence traffic conditions (i.e., relevant data) and those that are considered non-influential (i.e., irrelevant data). Then, the influential data were classified via multi-class classification according to the type of event, which can be one of six types: construction, weather, accident, congestion, special event, and others. An evaluation was performed to determine which models are suitable for binary and multi-class classification using the classified data.
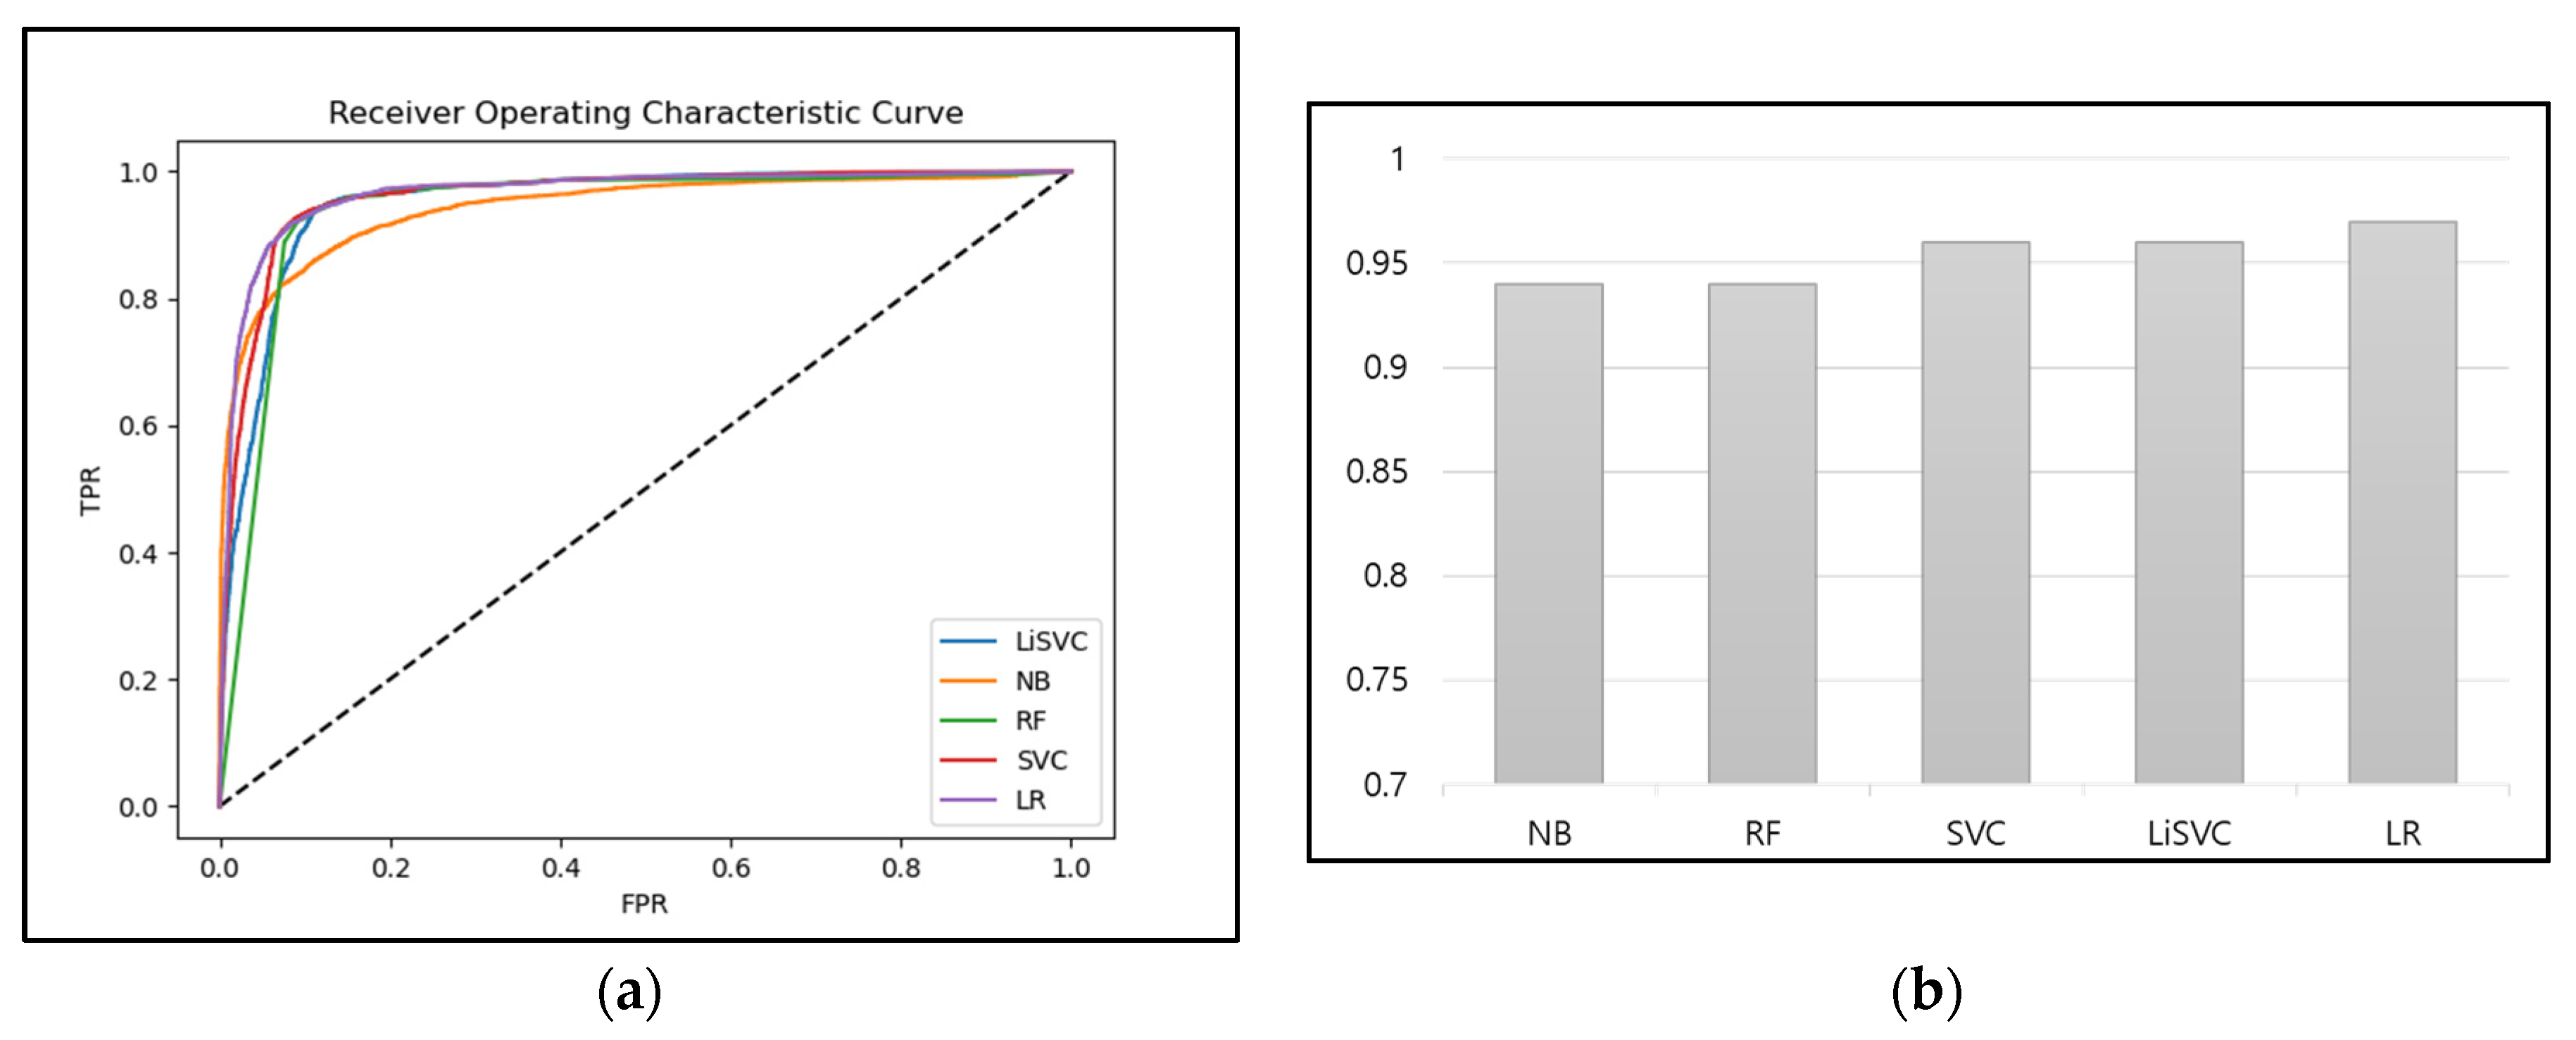
Figure 6 shows the ROC curves and AUC of the binary classifiers.
Figure 6a shows the ROC curves of the naïve Bayes, random forest, SVC, linear SVC, and logistic regression binary classifiers. The curves indicate that the true positive rates (TPR) and false positive rates (FPR) of the five models used for the proposed technique were all close to one. The AUC results in
Figure 6b show that all five models exhibited levels of performance of 0.9 or greater. In particular, SVC, linear SVC, and logistic regression showed values of 0.95 or greater and can be said to have exhibited the best levels of performance.
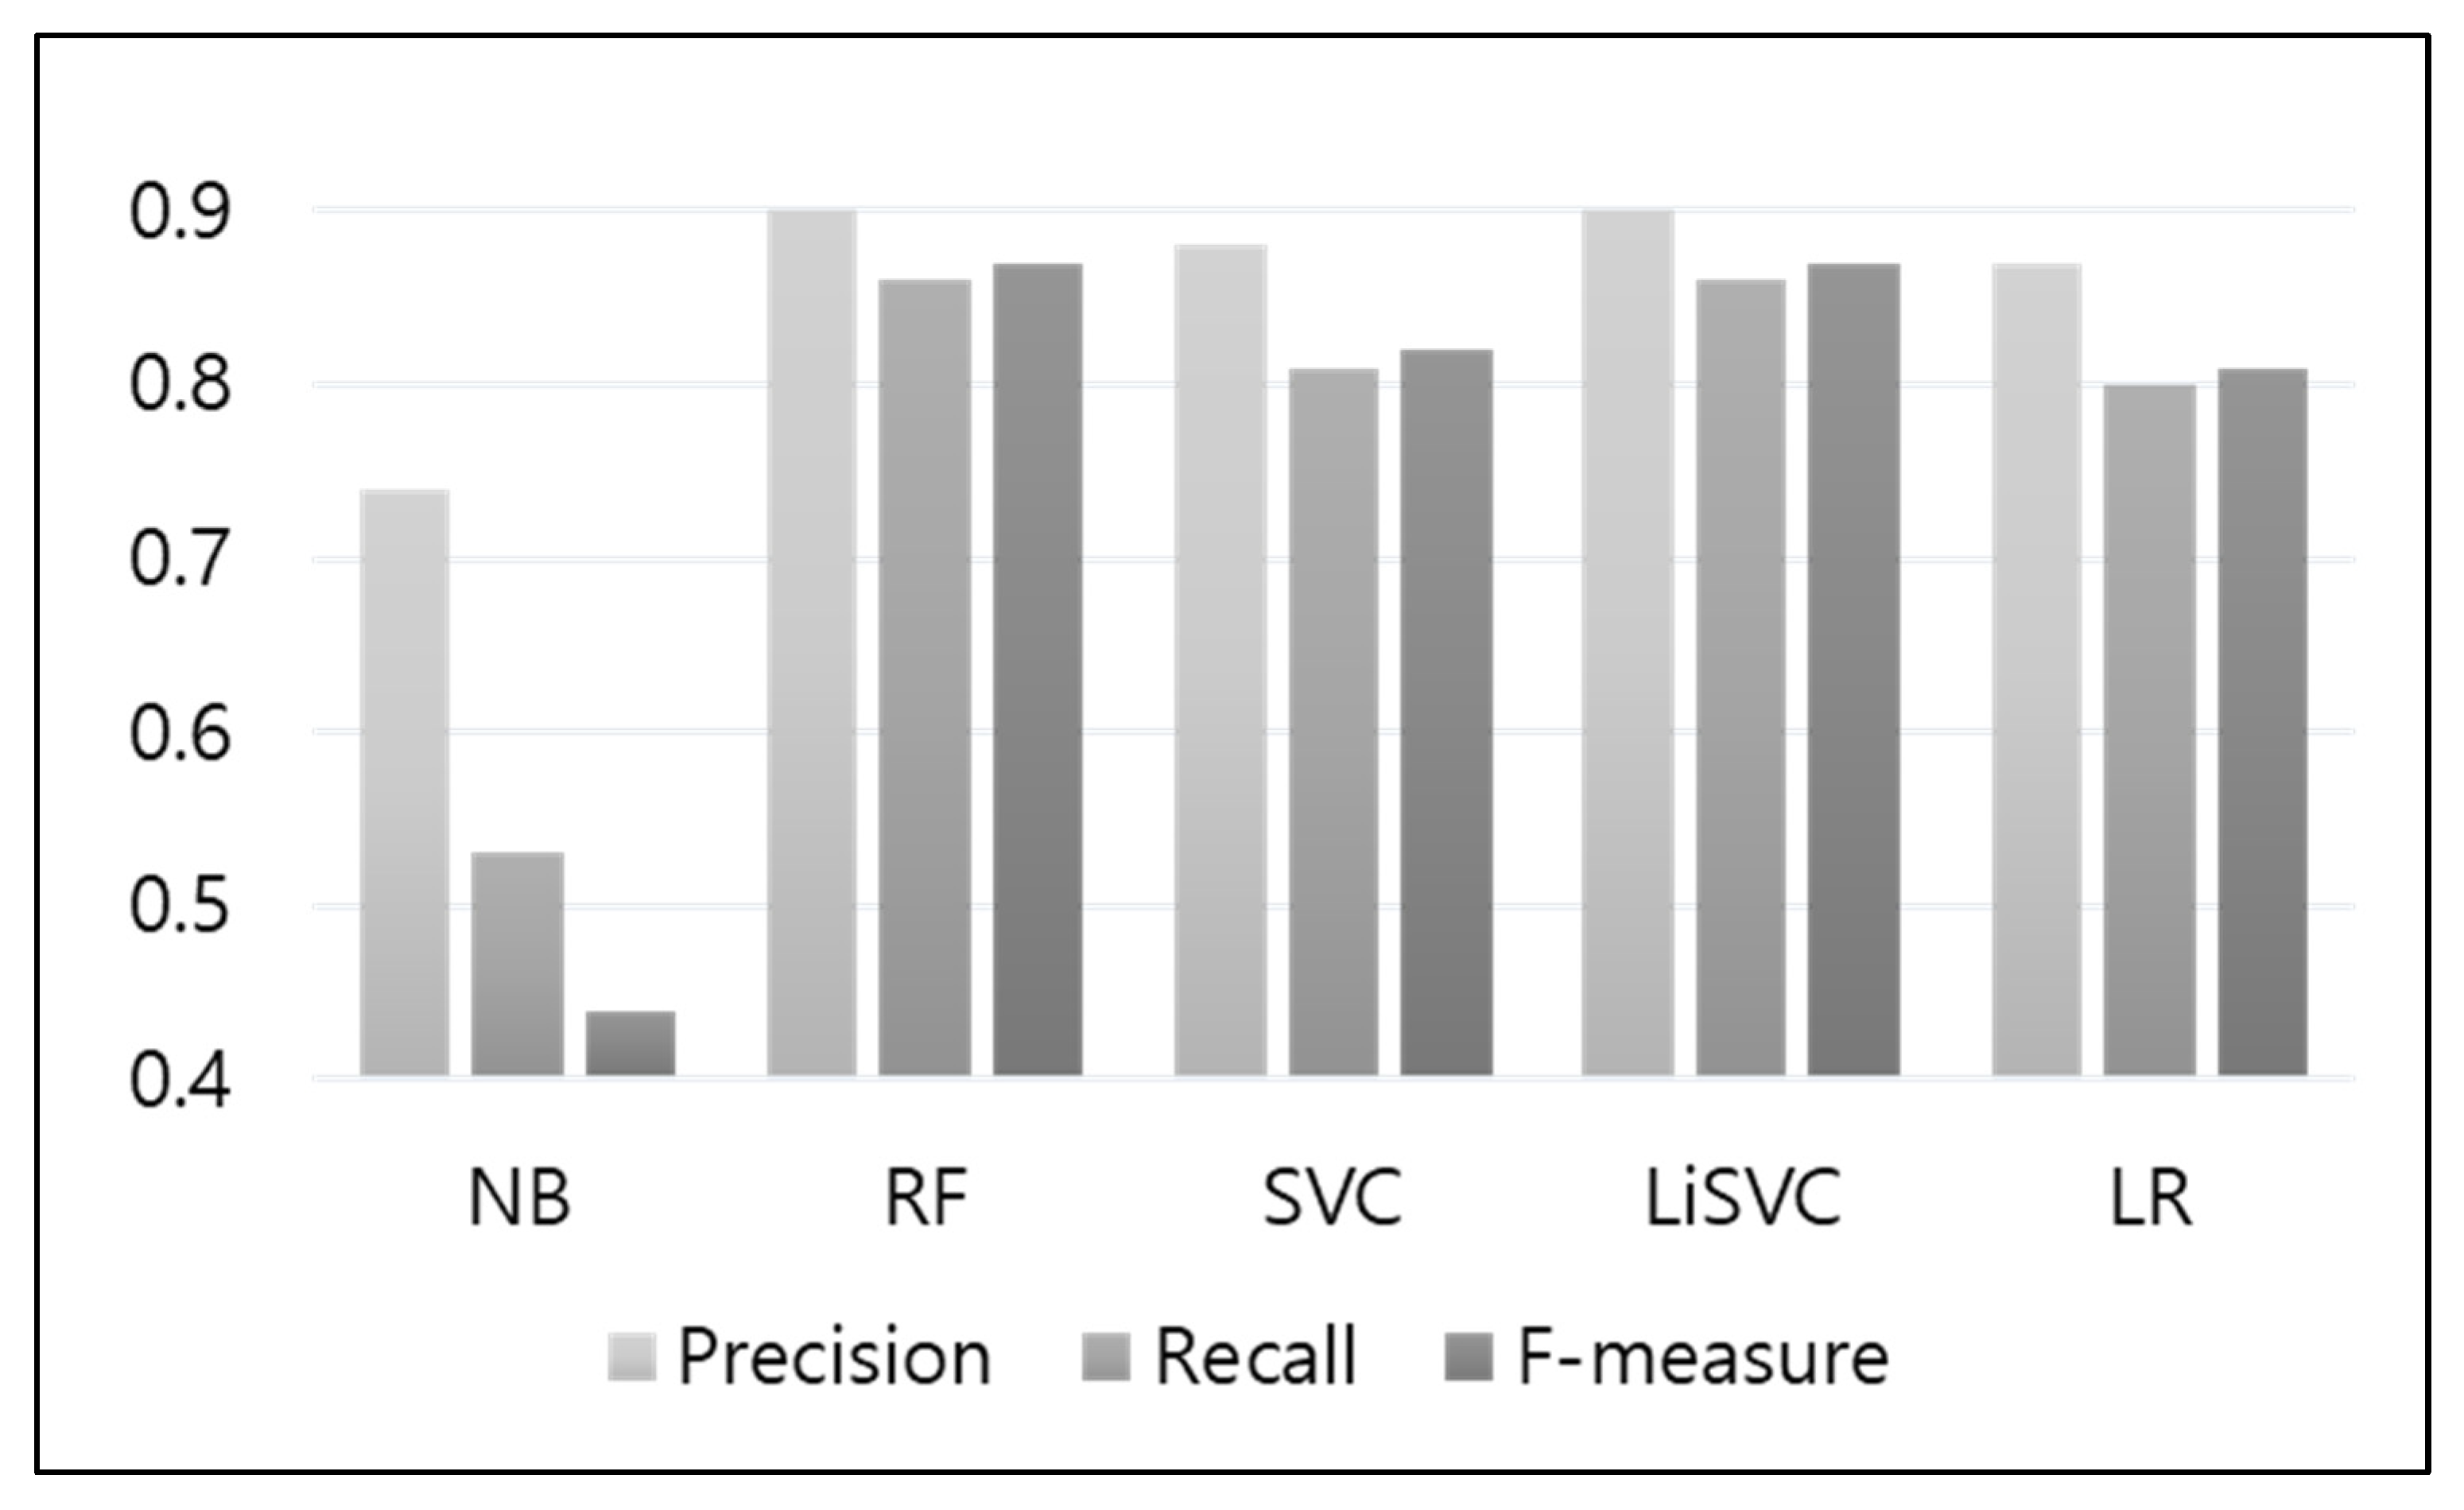
Figure 7 shows the precision, recall, and F-measures of the binary classifiers. In terms of precision, random forest and linear SVC exhibited the highest values, at 0.9, followed by the SVC and logistic regression models, which exhibited values of 0.88 and 0.87, respectively. The naïve Bayes model was confirmed to have exhibited the lowest precision among the examined models, at 16%. In terms of recall, the random forest and linear SVC models also exhibited the highest values, at 0.86, followed by SVC, with 0.81, and logistic regression, with 0.80. The naïve Bayes model showed the worst performance among the tested models, with a recall of 0.53. In terms of the F-measure, which is the harmonic mean of precision and recall, random forest and linear SVC, which had the highest precision and recall, had the highest values at 0.86, corresponding to a 43% better performance than that of naïve Bayes. Based on the results for these models in terms of ROC curves, AUC, precision, recall, and F-measures, the linear SVC model was selected to be the binary classifier for traffic event detection.
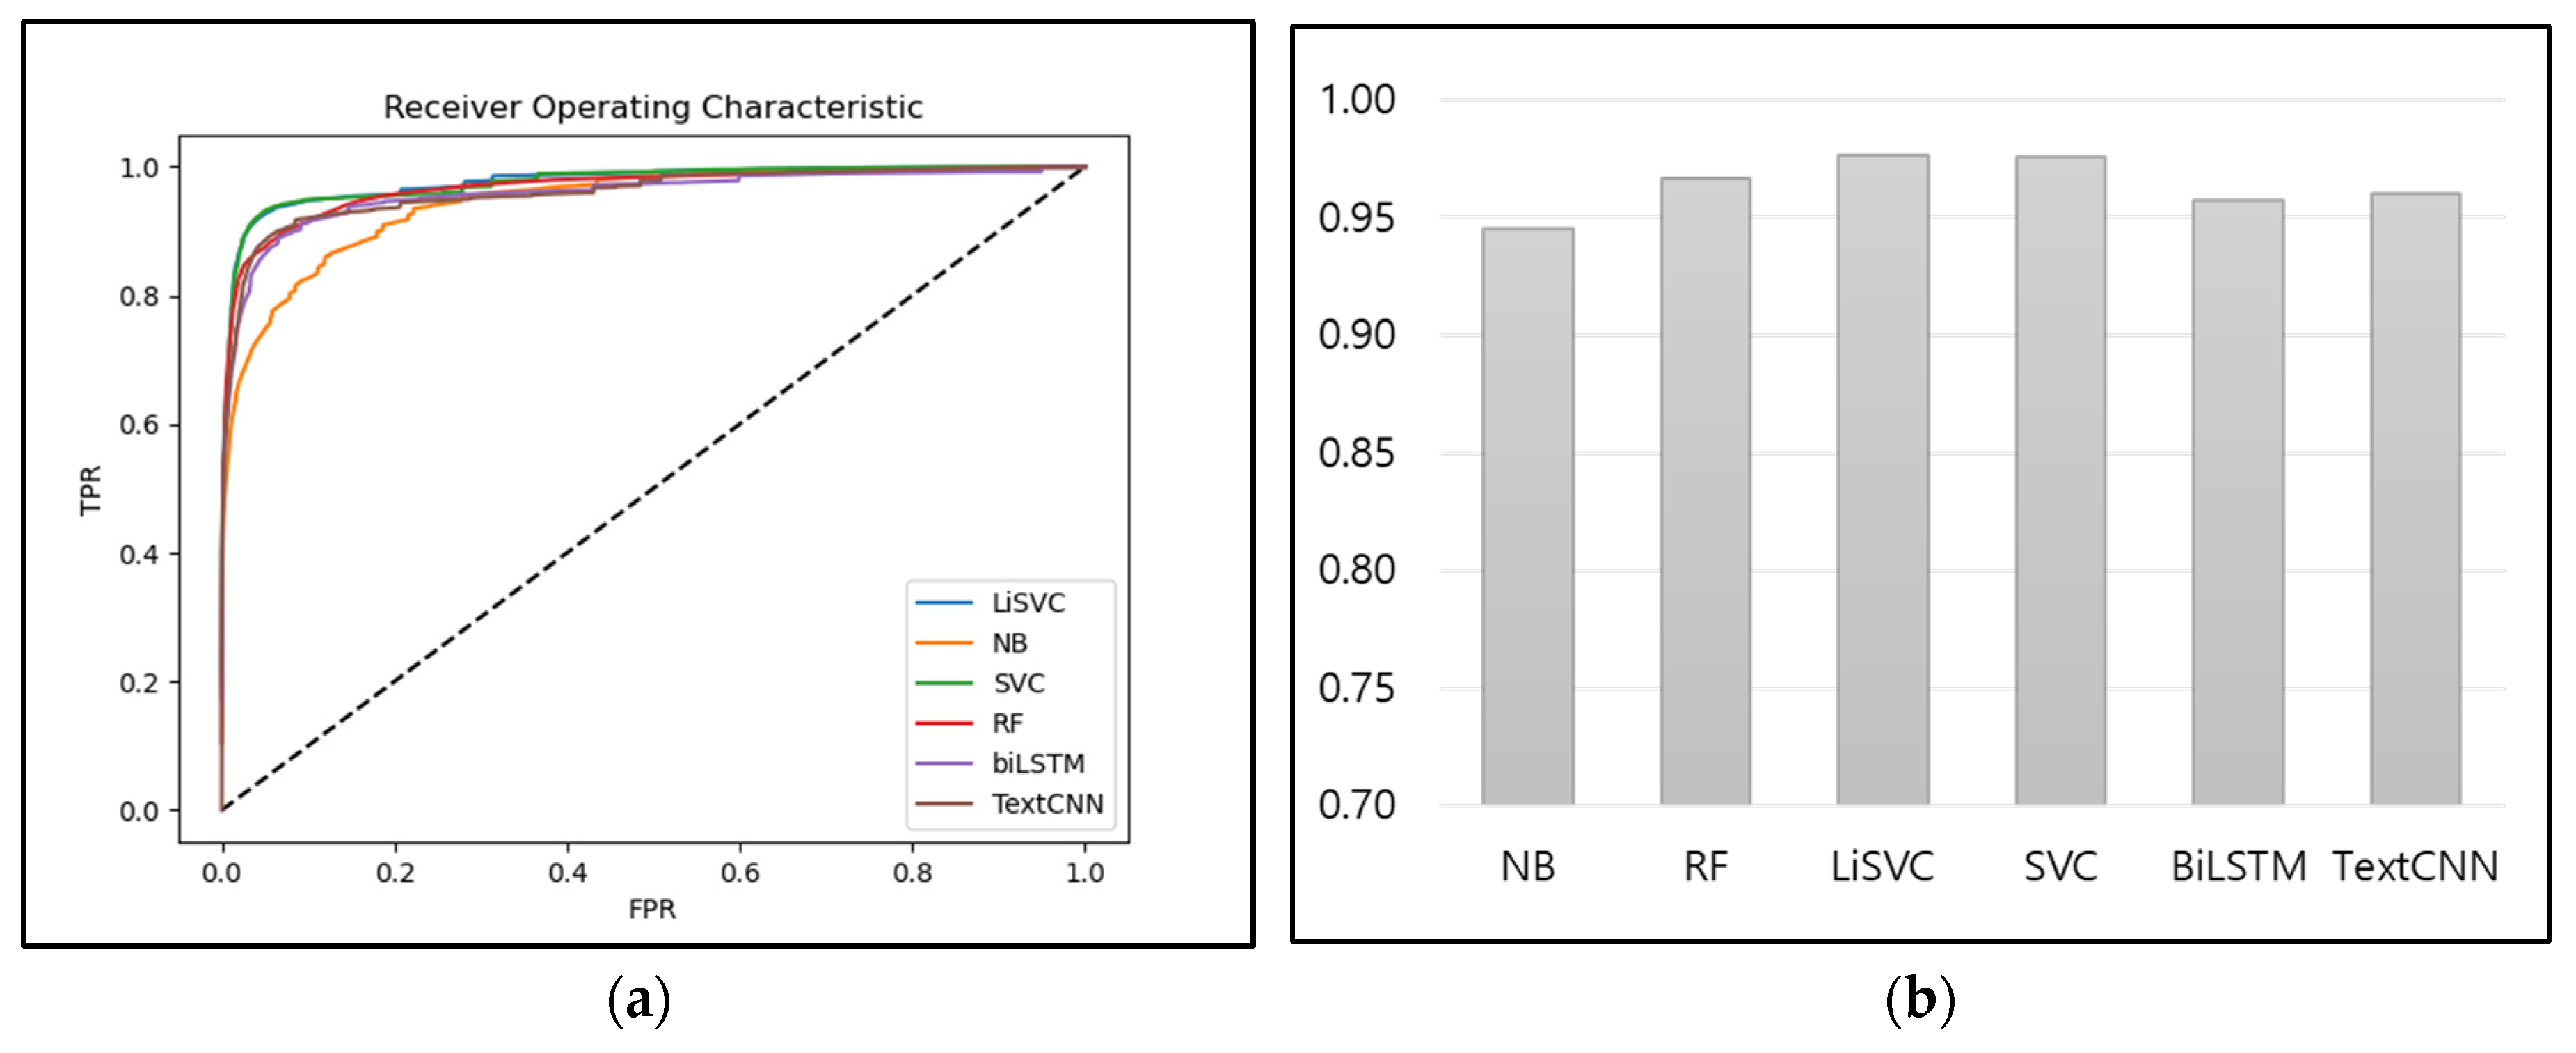
Figure 8 shows the ROC curves and AUC for the six multi-class classifiers.
Figure 8a shows the ROC curves, from which it can be observed that the curve for the naïve Bayes model was the farthest from 1, and that those of the linear SVC and SVC models were the closest to 1.
Figure 8b shows the AUC values of all models, which all exhibited values of 0.9 or greater. As such, their performance in this aspect can be said to be good. Of the evaluated models, the linear SVC model and the SVC model were found to have the best performance, with AUC values of 0.98.
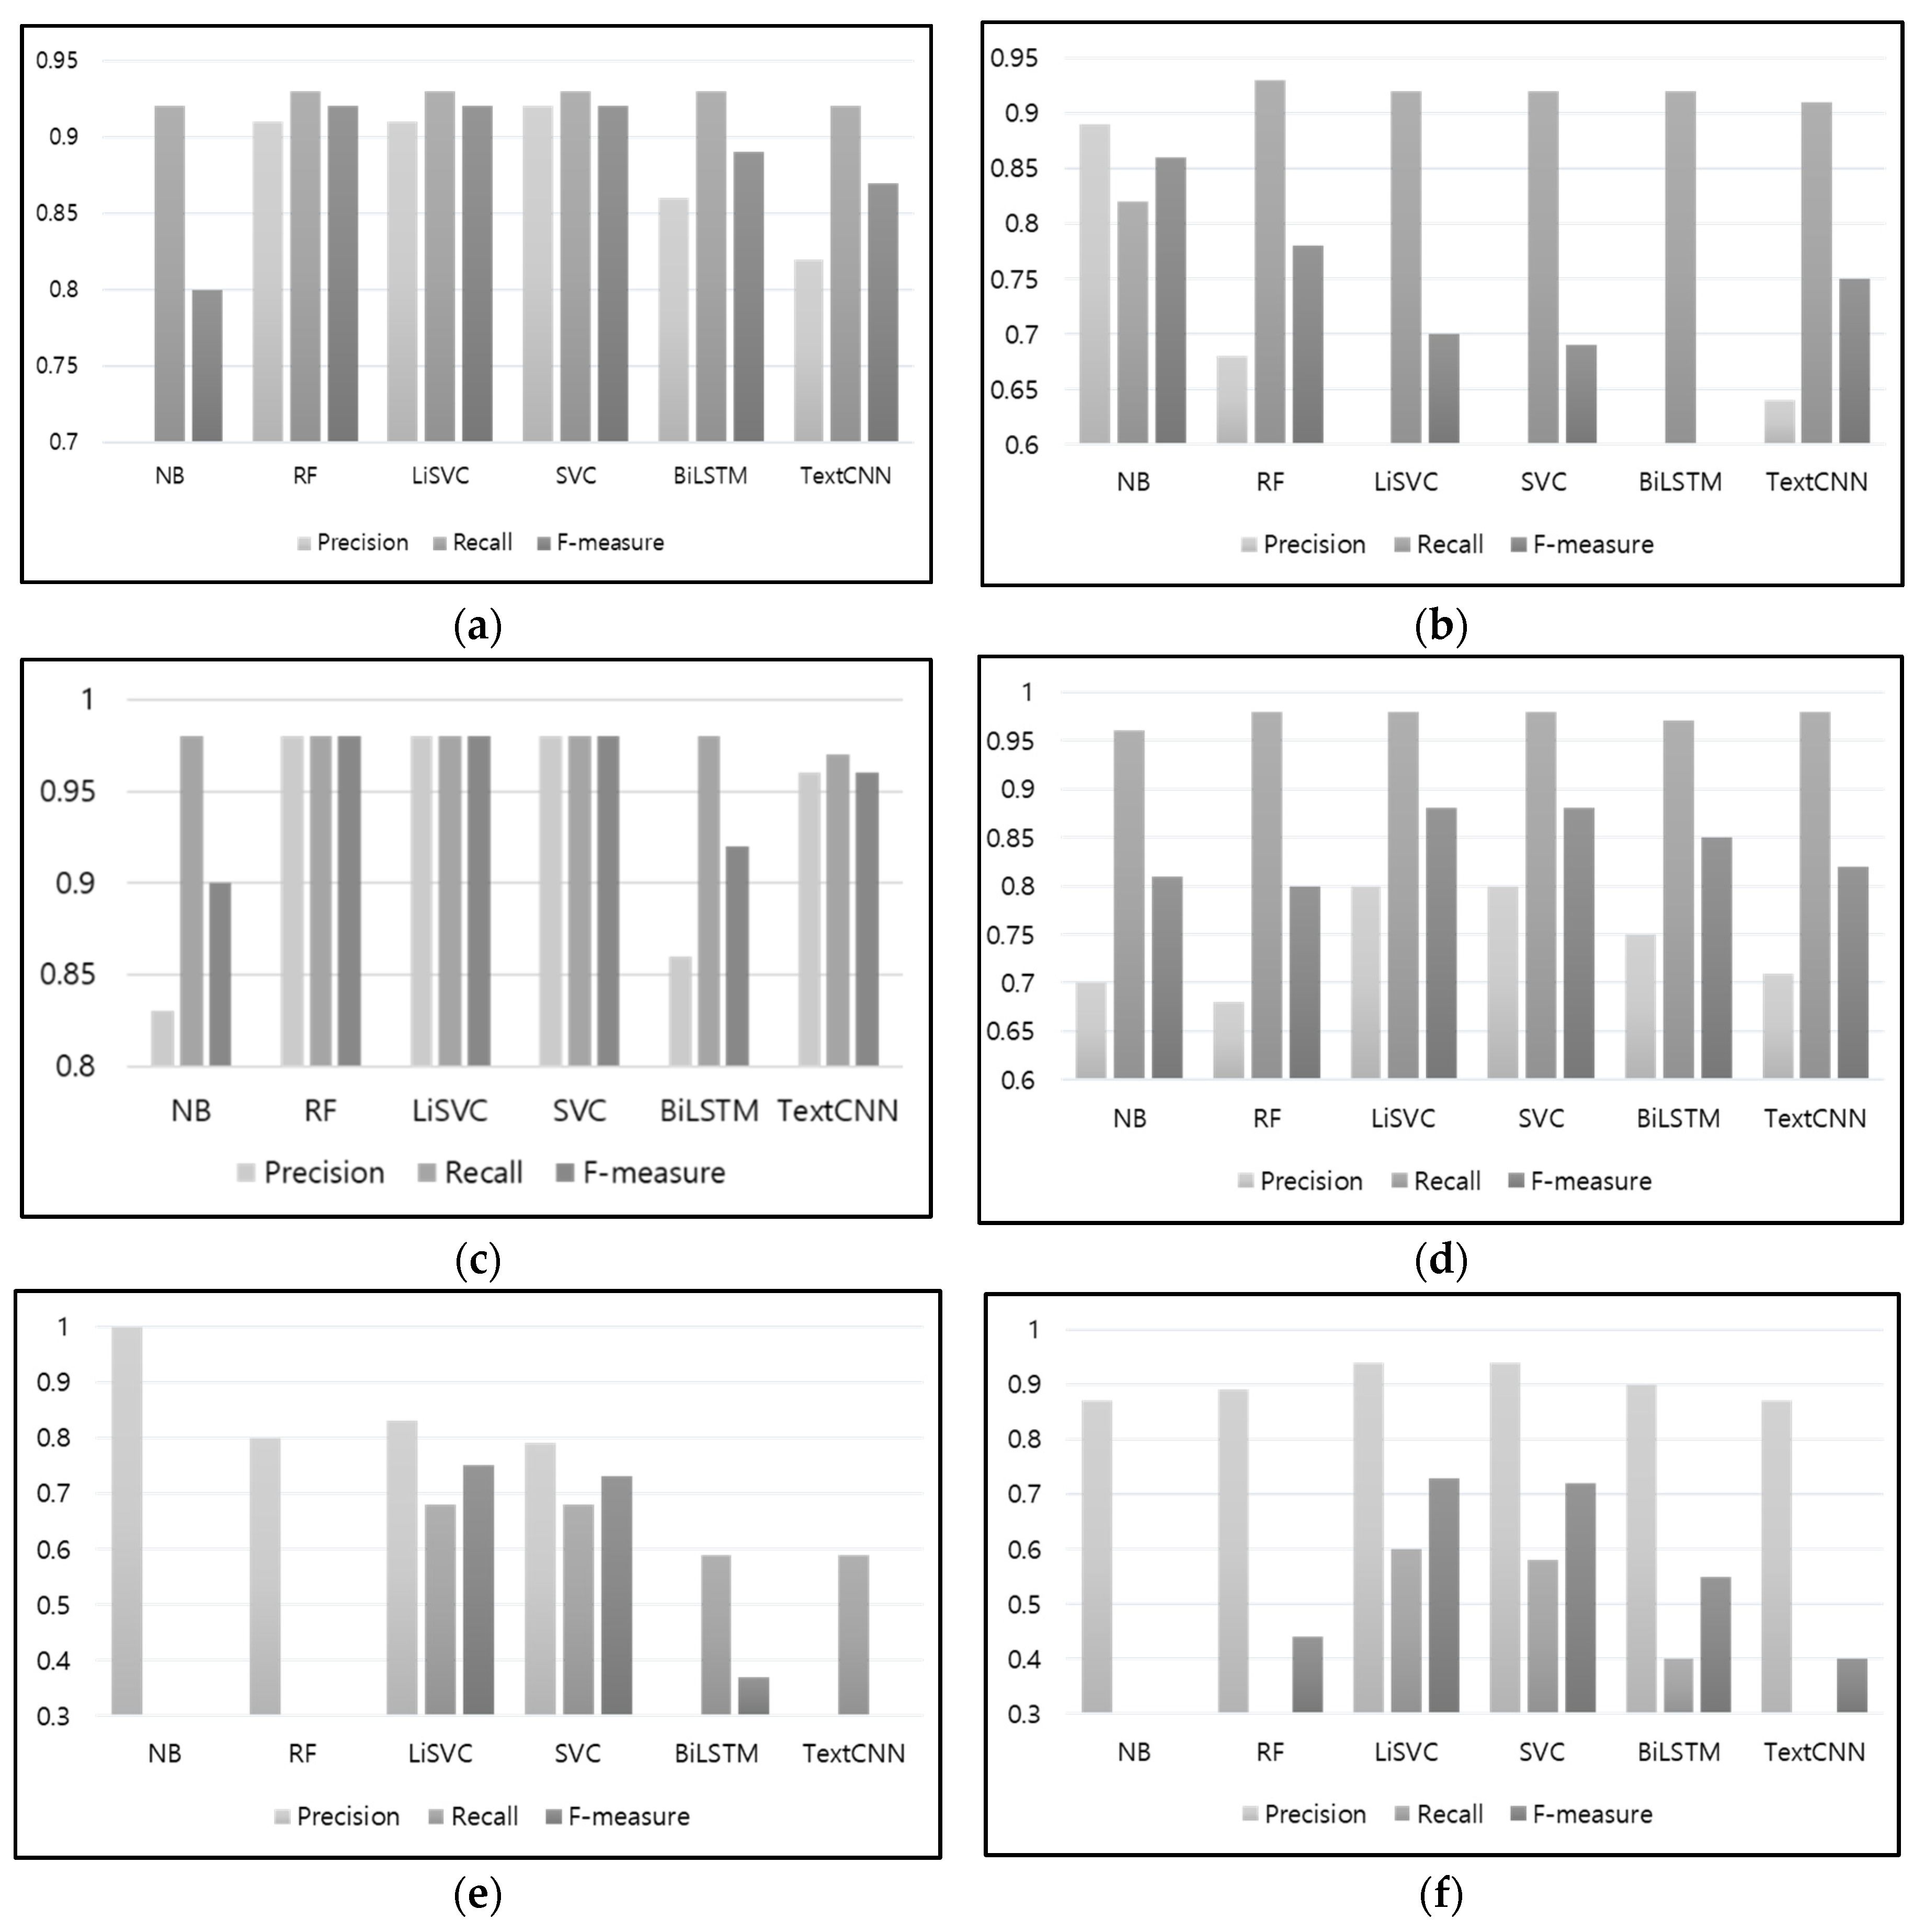
Figure 9 shows the precision, recall, and F-measures for each class. For the “construction” class, linear SVC and SVC showed the best performance, with precision, recall, and F-measure values of 0.92, 0.93, and 0.92, respectively. For the “weather” class, naïve Bayes showed the best values, at 0.8, 0.82, and 0.86, respectively, whereas random forest showed the second-best values, at 0.68, 0.93, and 0.78, respectively. For the “accident” class, random forest, linear SVC, and SVC showed the highest precision, recall, and F-measure values, at 0.98, 0.98, and 0.98, respectively. For the “congestion” class, linear SVC and SVC showed the highest performance, with values at 0.8, 0.98, and 0.88, respectively. For the “special event” class, linear SVC showed the highest values, at 0.83, 0.68, and 0.75, respectively, whereas SVC showed the second-highest values, at 0.7, 0.68, and 0.73, respectively. Finally, for the “others” class, linear SVC and SVC showed the highest values, at 0.94, 0.6, 0.73, respectively, and 0.94, 0.58, 0.72, respectively.
To compare the overall classification performance of the six models,
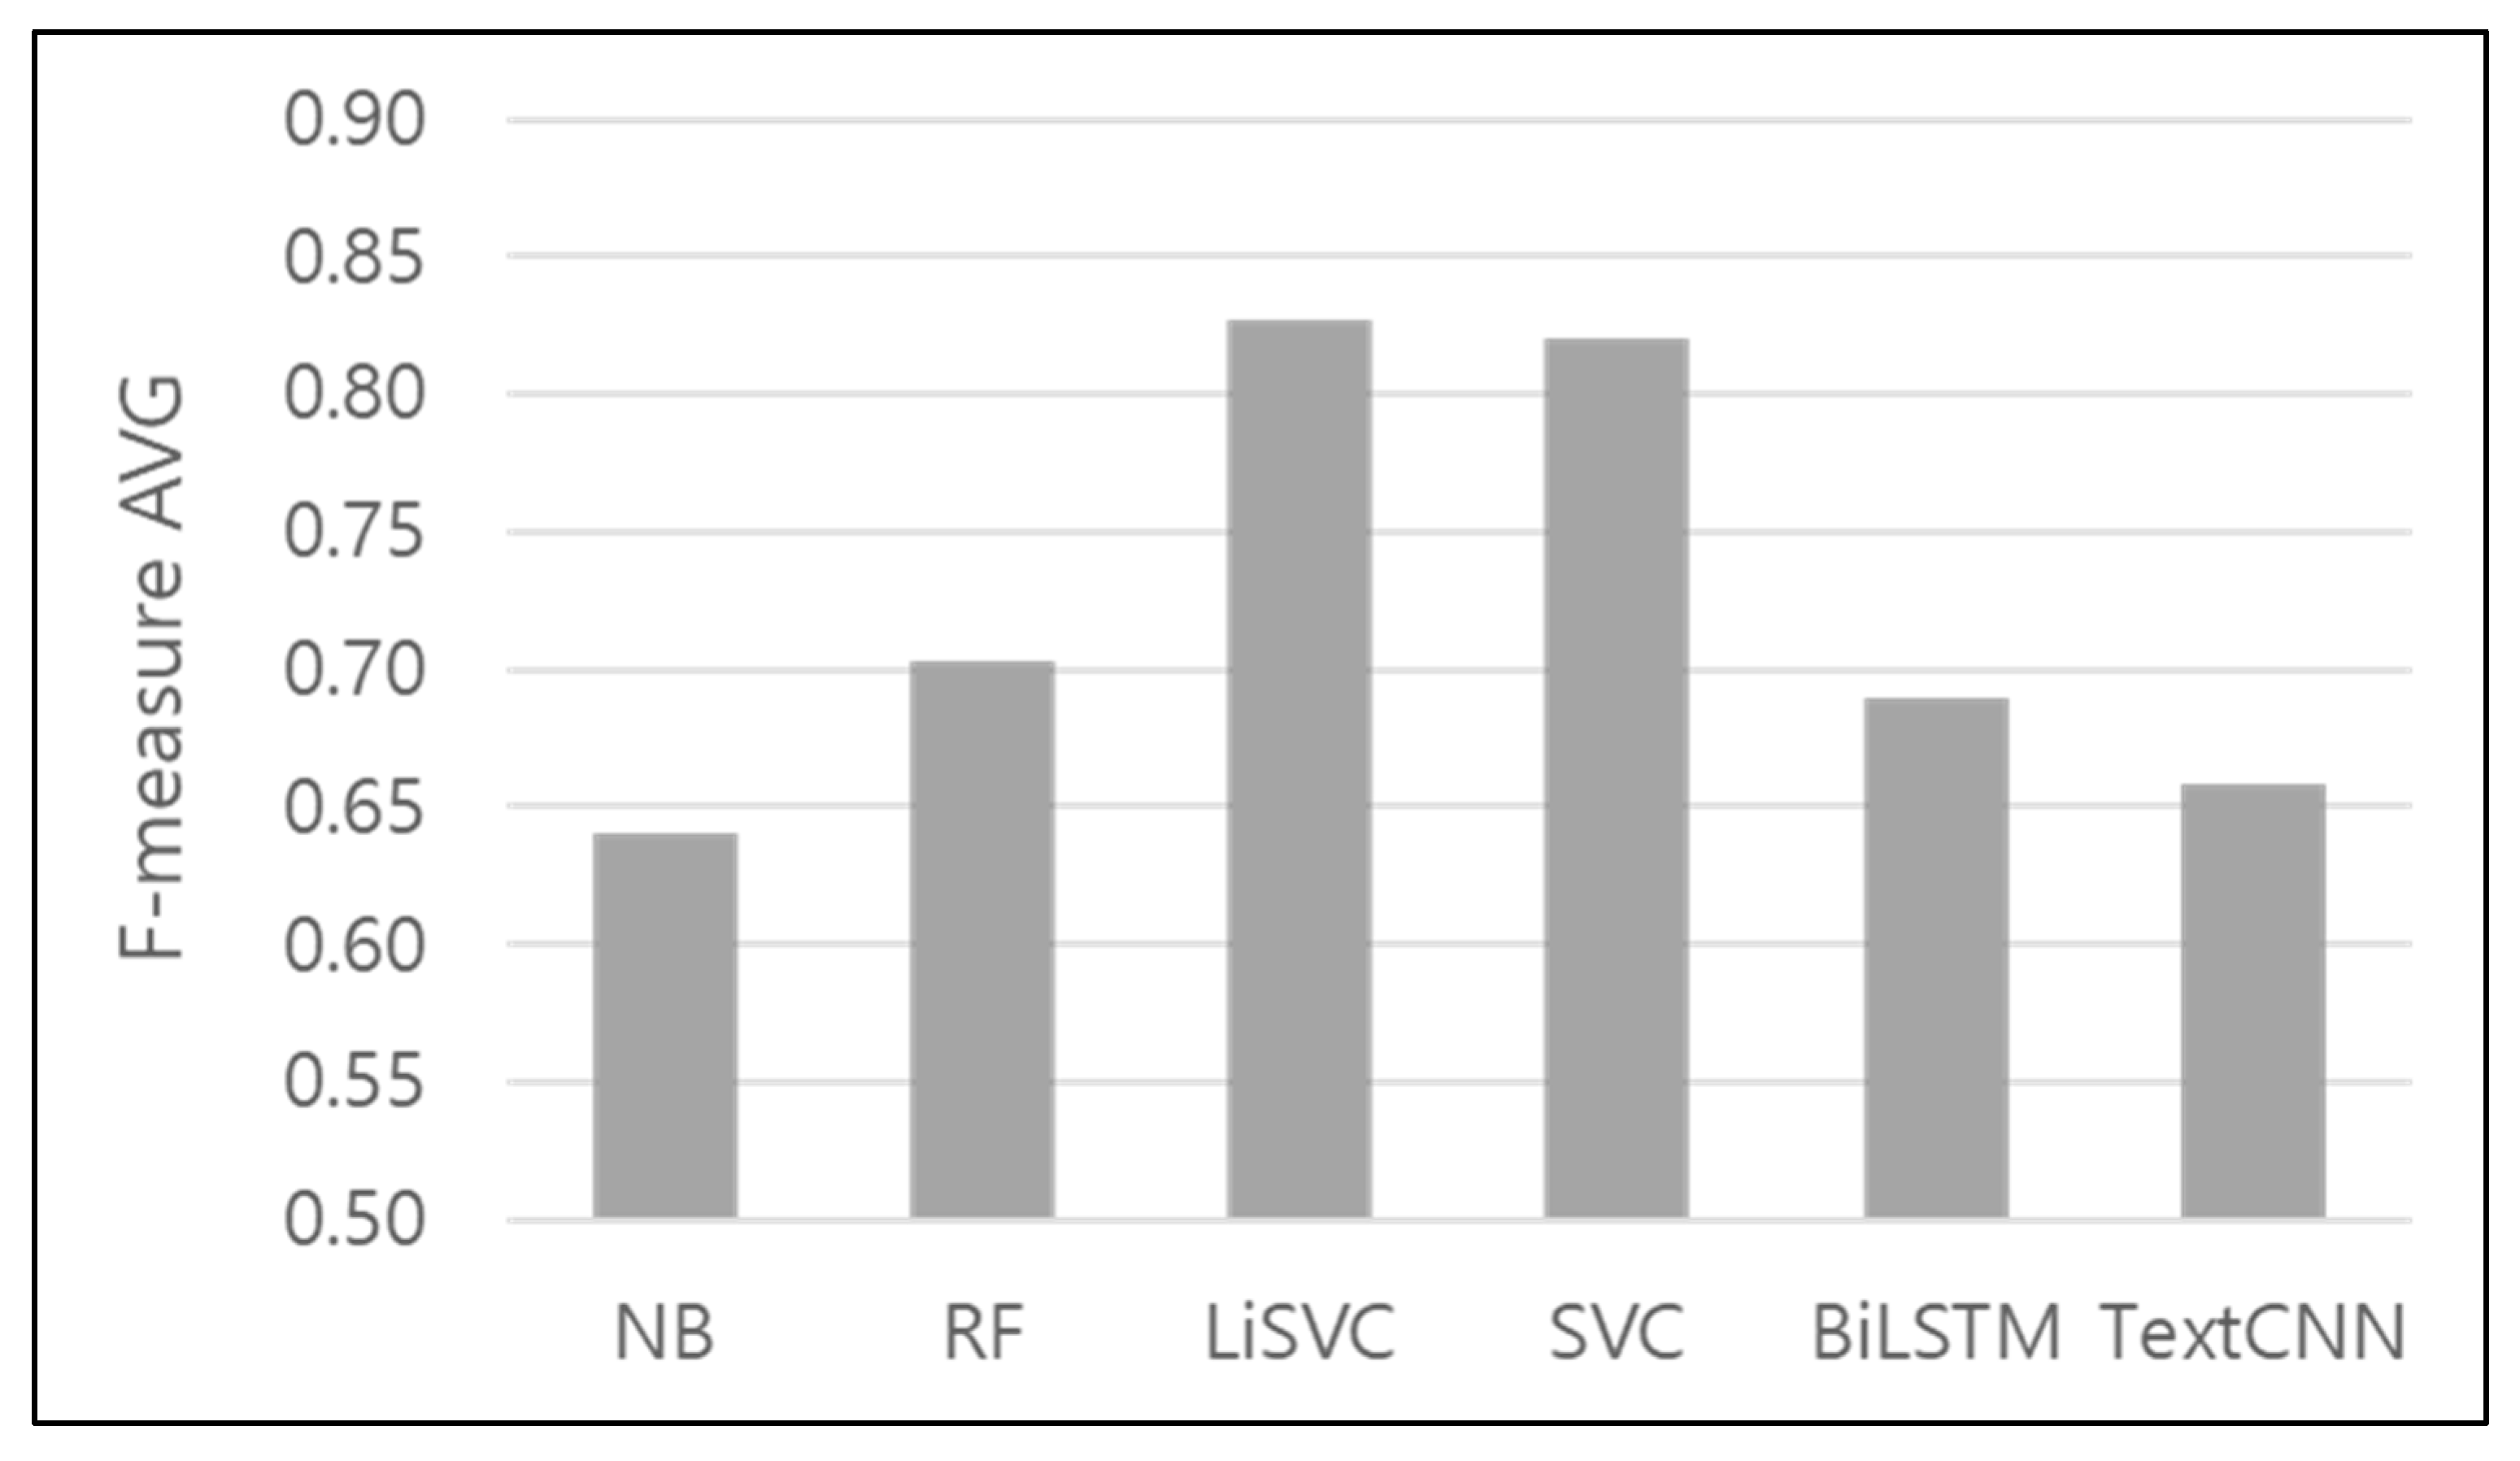
Figure 10 shows the average values of their F-measures, which show that linear SVC had the best performance, with an average value of 0.83, corresponding to a performance difference of approximately 19% compared to that of the naïve Bayes model. As a result of the performance evaluations, linear SVC was chosen as the most suitable model for use as the binary classifier and the multi-class classifier for event classification.
As indicated earlier, the proposed technique uses binary classification to determine the data that influence traffic conditions and then uses multi-class classification to classify the selected data according to the type of event. To demonstrate the necessity of removing data that do not influence traffic conditions, this section compares and evaluates the results of not using the binary classifier. During multi-class classification without binary classification, all of the data that do not influence traffic conditions are classified as “others.” In this performance evaluation, the cases in which multi-class classification is performed after binary classification are labeled as AB, whereas the cases in which multi-class classification is performed without binary classification are labeled as WB.
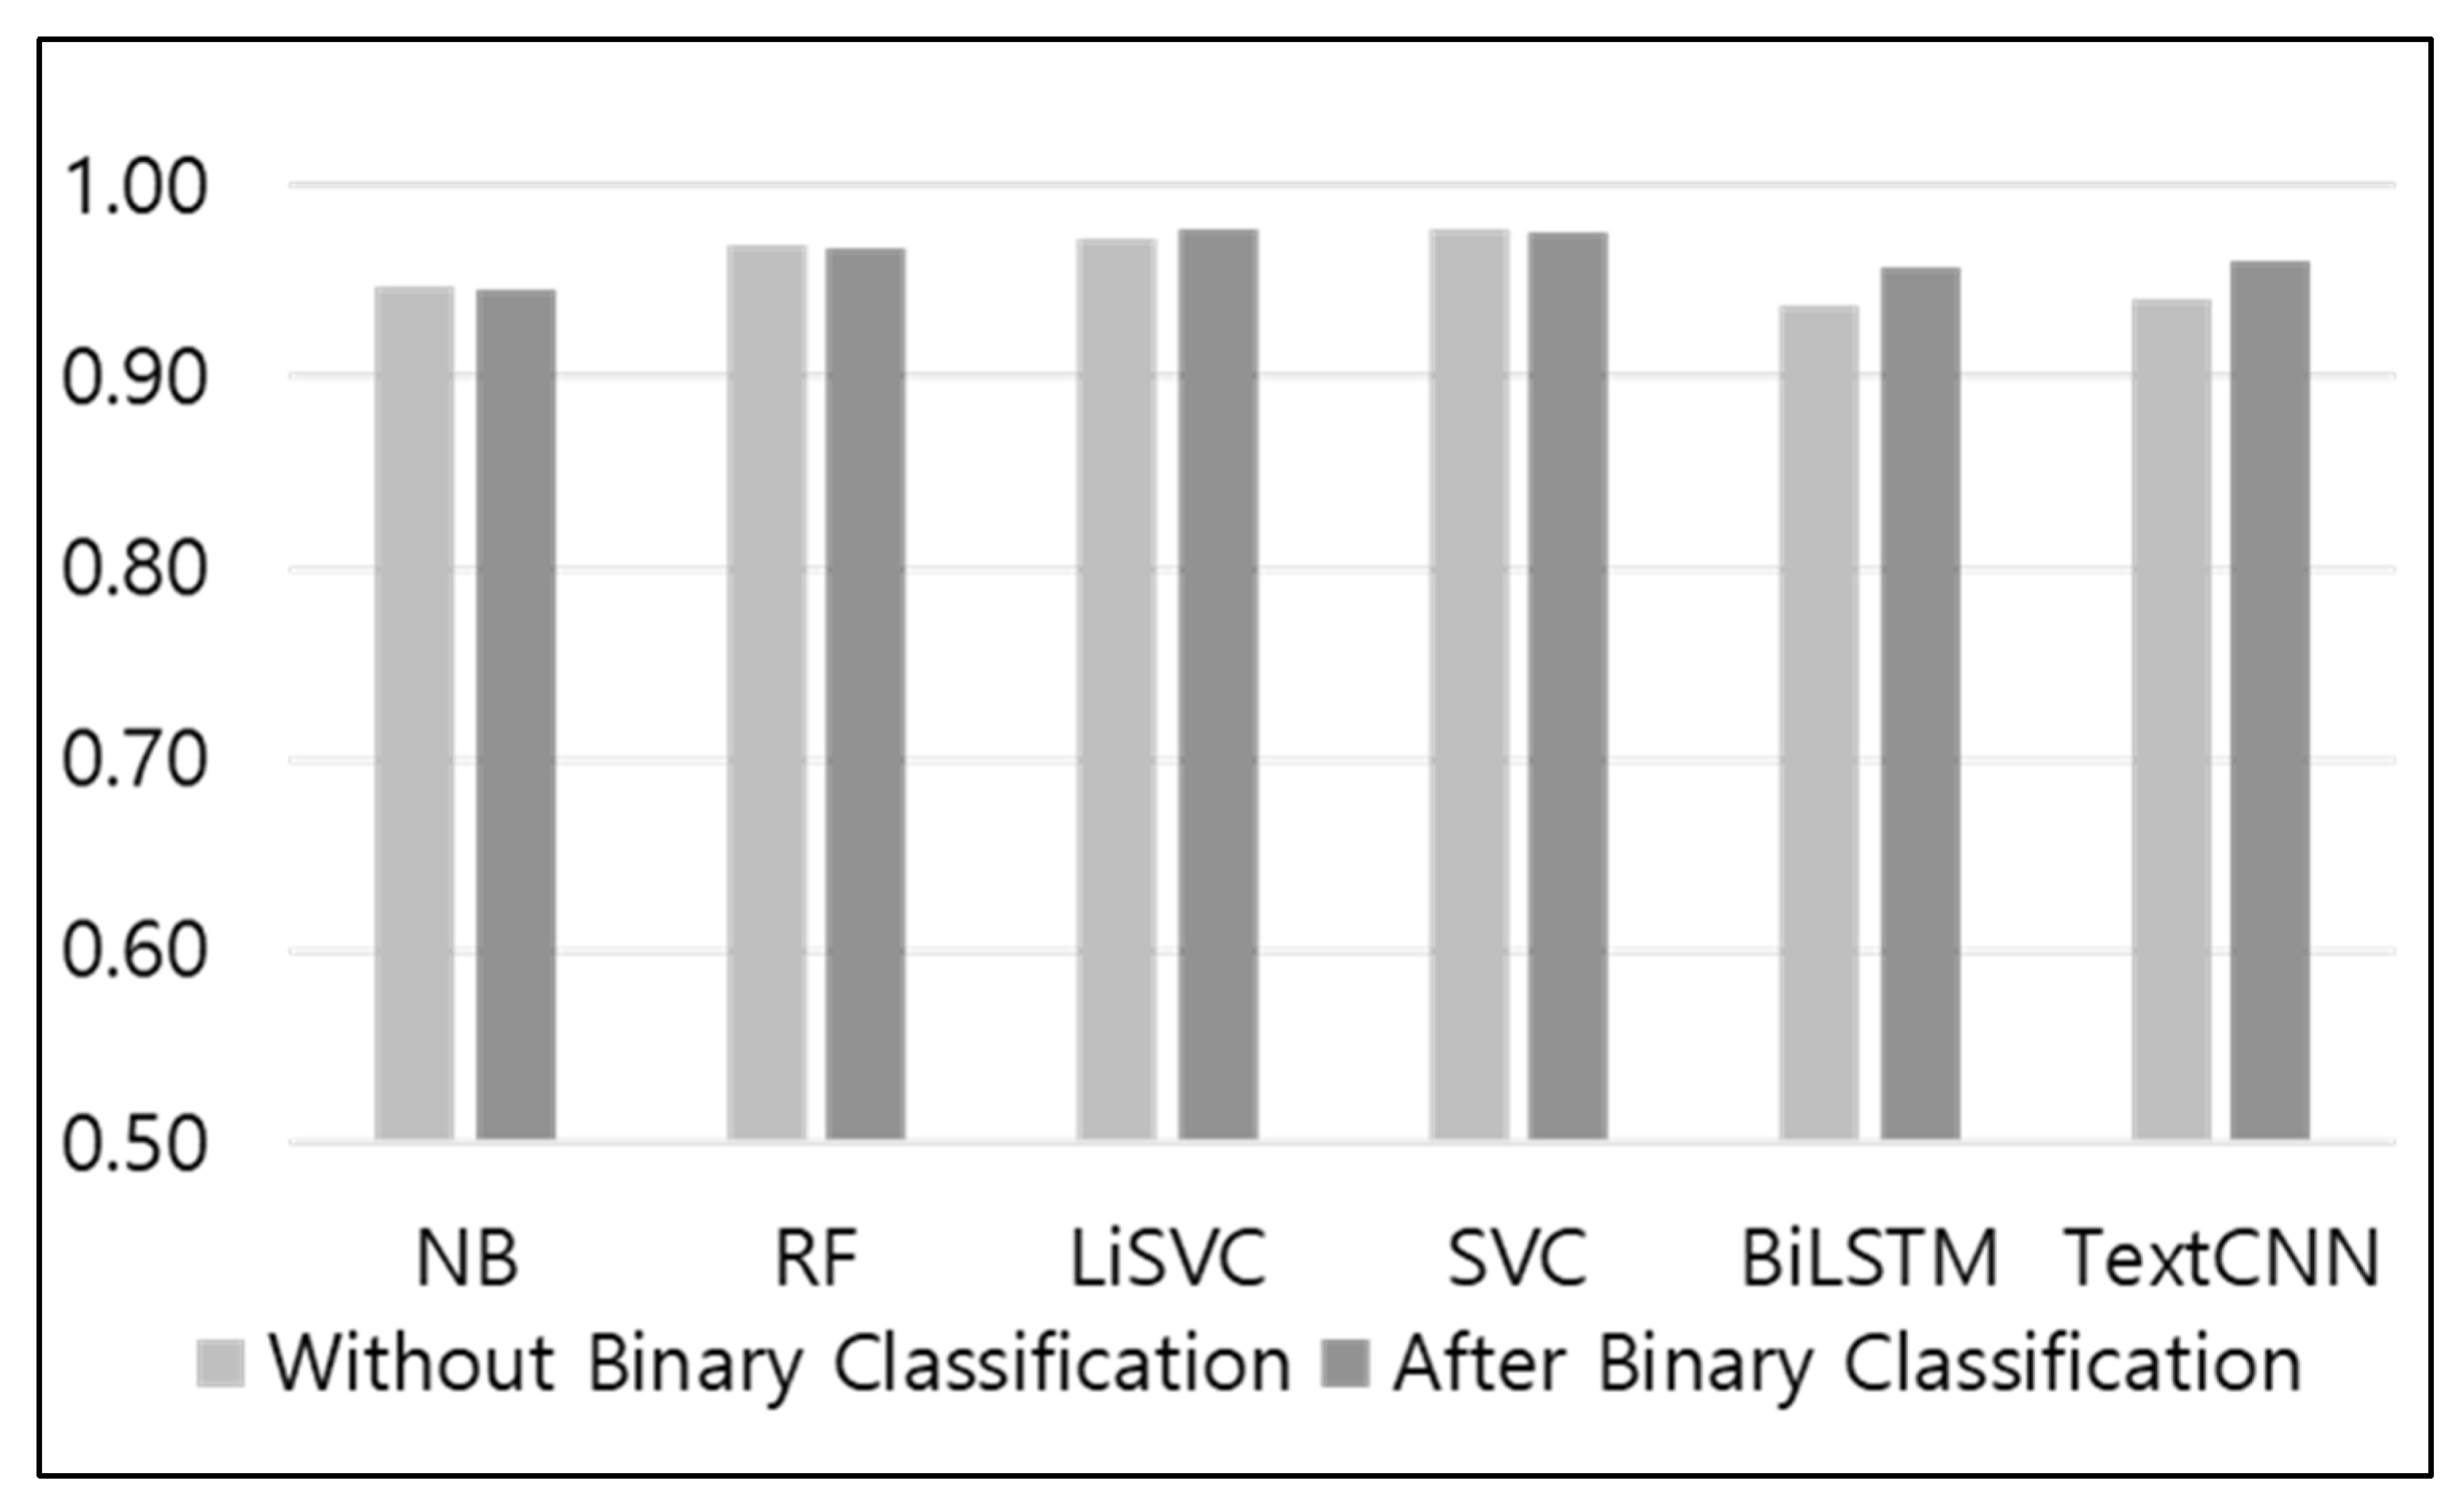
Figure 11 shows the AUC values for AB and WB. The AUC results for each of the AB and WB models show that there were no differences between AB and WB for the naïve Bayes, random forest, and SVC models, which had AUC values of 0.95, 0.97, and 0.98, respectively. By comparison, in the case of the linear SVC model, the result for AB was 0.98, and that for WB was 0.97, indicating that the value for AB was higher by 0.1. In the case of BiLSTM, the result for AB was 0.96, and that for WB was 0.94, corresponding to a 2% difference. In the case of TextCNN, the result for AB was 0.96, and that for WB was 0.94, indicating that the value for AB was 2% higher for both models.
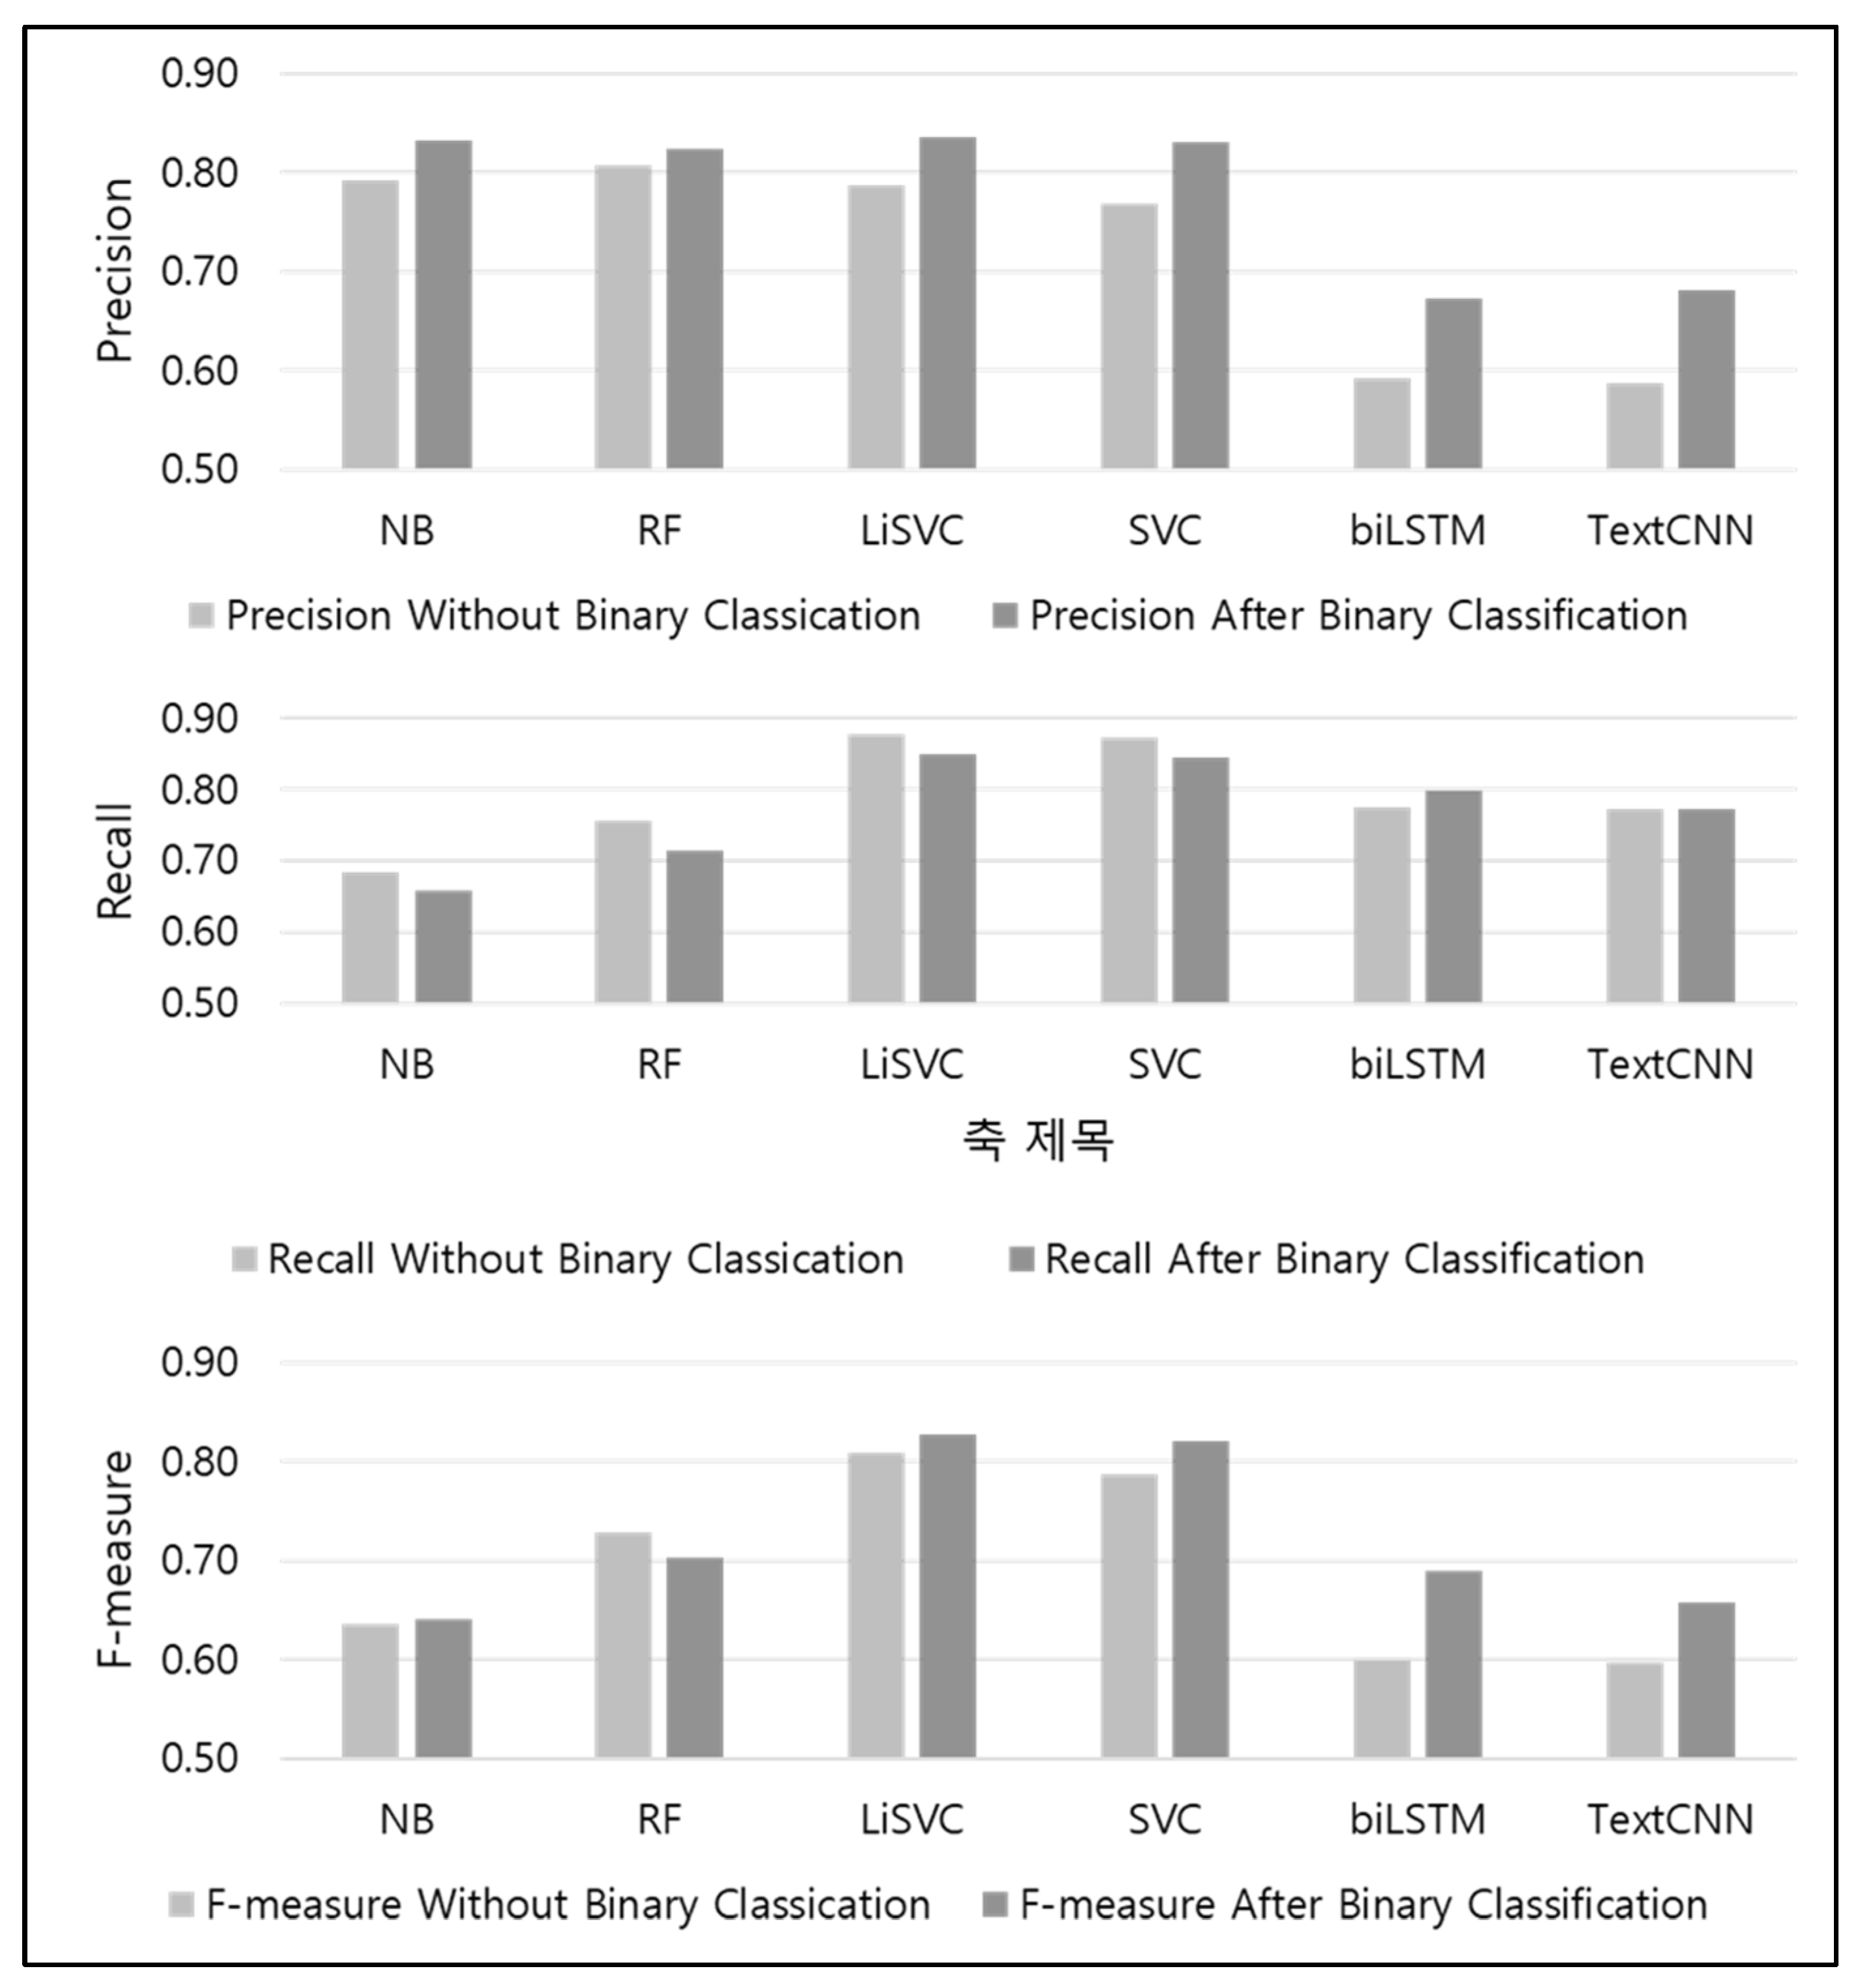
Figure 12 shows the precision, recall, and F-measures of each of the AB and WB models. The precision results show that AB resulted in better performance for all evaluated models. For the linear SVC model, which had been selected as the most suitable classifier in the earlier parts of the study, the value for WB was 0.79, whereas that for AB was 0.84, which was 5% higher. In terms of recall, WB generally showed higher performance; however, in the case of BiLSTM, AB showed 2% higher performance, whereas TextCNN exhibited the same results for WB and AB. Finally, in terms of the harmonic means of the precision and recall, random forest WB exhibited a value of 0.73, whereas its AB exhibited a value of 0.70, indicating a better performance by WB. By comparison, for the rest of the models (excluding random forest), AB showed better performance. In particular, in the case of the linear SVC model, the value for WB was 0.81, whereas that for AB was 0.83, confirming that AB led to better performance.
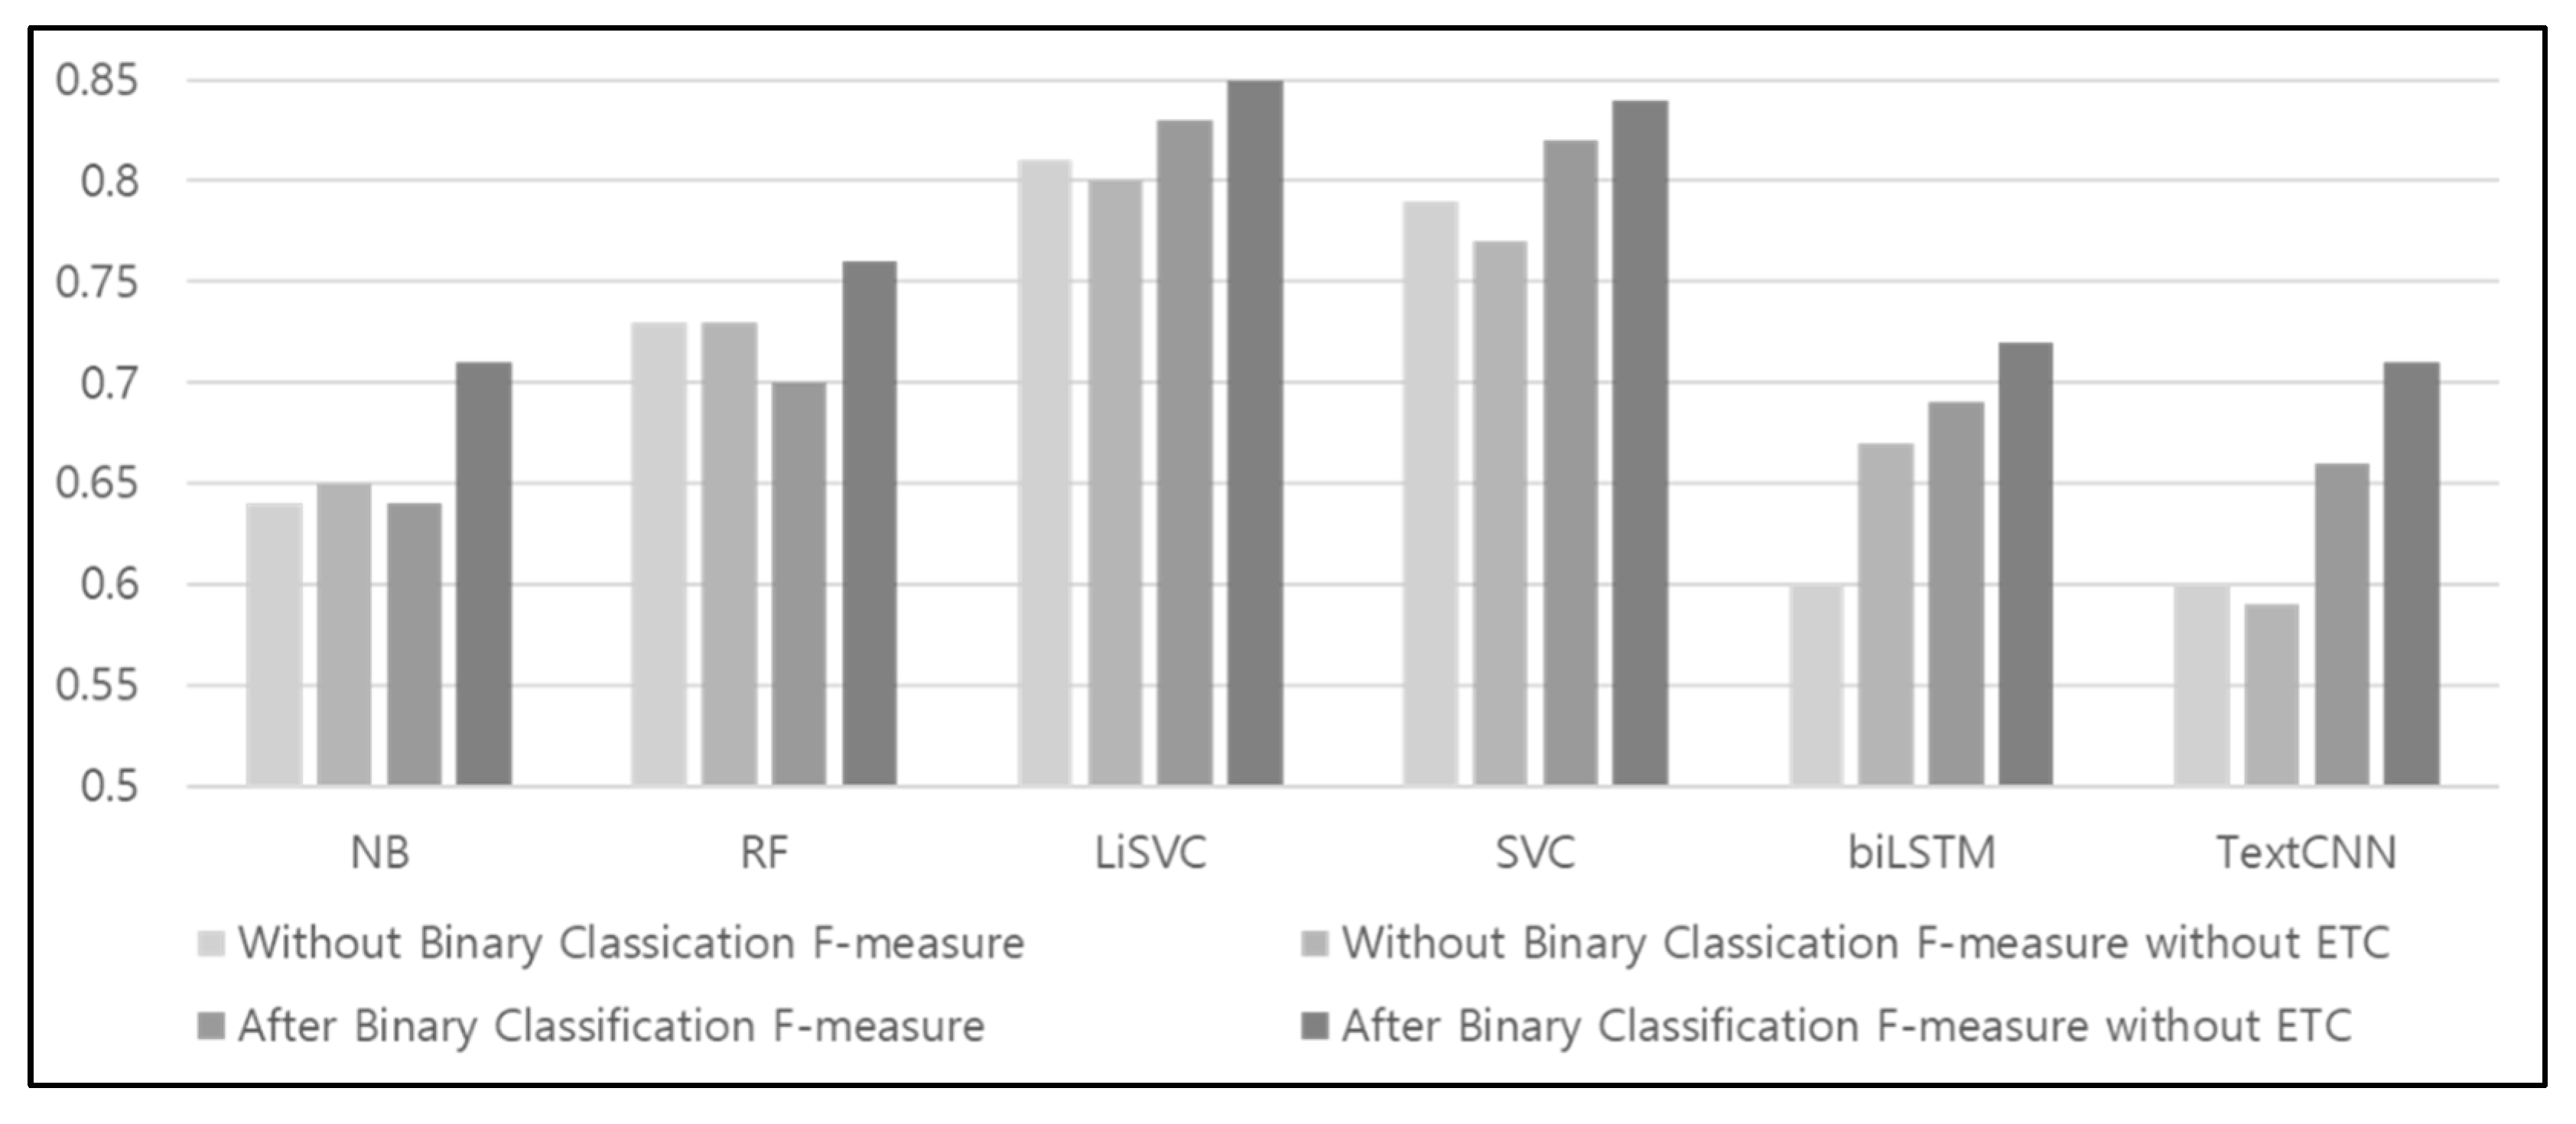
Figure 13 shows the F-measures of the six models in the AB and WB cases, in comparison against the F-measures without the “others” class. In the case of the naïve Bayes model, the F-measure values were the same for AB and WB, whereas in the case of the random forest model, WB led to better results than those of AB. However, with regard to the F-measure values of the four models, i.e., excluding the two aforementioned models, those for AB were higher than those for WB. In particular, in the case of the linear SVC model, which had been selected as the most suitable classifier based on the earlier performance evaluation results, the F-measure value for AB was 2% higher than that for WB. In the case of WB, data that did not influence traffic conditions were classified as “others;” therefore, when the F-measure values without the “others” class were examined, the F-measure values for AB for all six models increased. However, it was found that for the WB cases, the F-measure values increased in the case of Naïve Bayes and BiLSTM, but remained the same or decreased in the case of the other models. Thus, it was confirmed that accuracy is improved through the use of a binary classifier to determine the data that are relevant to traffic conditions.
The evaluations verified the performance of the proposed technique, which selects keywords that allow regions to be inferred from text data and converts them to administrative district names. The analysis was performed based on the results of linear SVC, which exhibited the best performance after event classification. The total number of data points was 8100.
Table 3 shows the accuracies, which were obtained based on random selections of 100 data points from the overall set of 8100 data points. This process was then repeated 5 times, and the average accuracy values were calculated.
The average accuracy for the five extraction results was 80.4%. There were two factors that reduced the administrative district extraction accuracy. First, it was difficult to extract administrative districts if a precise location name such as “National Highway 46” was not mentioned. Second, when sections of a single large road were described based on bridges, as in “construction in lane 4 of Seoul’s Gangbyeonbuk Expressway in the Guri direction from the Hannam Bridge to the Dongho Bridge,” the administrative district was converted to the location of the bridges, which reduced accuracy for non-autonomous regions.
