1. Introduction
Low-dose dental cone-beam computed tomography (CBCT) is one of the most important technological achievement in oral and maxillofacial radiology in the last forty years. In time, this has found numerous applications starting from diagnostic applications to pre-implant assessment and surgical guidance using specialized software [
1]. The main parameter that determines CBCT image quality is image resolution, which refers to the overall detail of the acquired image and is described by the maximum frequency that can be perceived [
2]. Resolution is distinguished to spatial and contrast: Spatial resolution is a key intrinsic parameter that characterizes imaging systems and is widely used for their evaluation. It expresses the ability of the imaging system (in mm) to distinguish two small objects that are very close to each other, in a high-contrast environment, and for this reason it is also called high-contrast discrimination ability [
3,
4]. Contrast resolution is the parameter that describes the ability of a system to distinguish small differences in the intensity of the recorded signal and to be able to image anatomical structures with approximately linear attenuation coefficients. Factors affecting resolution are mA, kV, Field of View (FOV), and image reconstruction algorithms. Also, general image degradation factors such as noise, radiation scatter, and artifacts may compromise resolution [
5].
The x-ray beam of the CBCT machine consists of primary radiation that yields useful imaging information through the patient and secondary radiation which is scattered radiation. The primary radiation is produced within the x-ray tube, enters the patient, interacts with human tissues and attenuates variably in the area under examination, conveying the useful information about the structures to be imaged. Scattered radiation is a secondary radiation generated during the interaction of the primary beam with the patient tissues [
6].The scattered photons are of a lower energy and show an altered direction in comparison with that of the primary beam. Thus, scattered radiation has a negative effect on image quality [
7] and essentially stands as the main factor to contribute in reduced spatial resolution, reduced contrast resolution, and increased noise in CBCT [
8,
9,
10].
The health risks associated with occupational radiation exposure are either of a deterministic or stochastic nature [
11]. Stochastic effects occur by chance and include cancer risk. The stochastic effect risk is considered to increase with dose according to the linear -no- threshold model. The International Commission on Radiological Protection has recommended an annual occupational exposure limit of 20 mSv/year, averaged over 5 years, in both effective dose and equivalent eye lens dose [
12,
13]. These effects can develop independently of the radiation dose, and no threshold effect can be defined. Therefore, added exposures of the patient increase the chance of occurrence of a stochastic effect [
14]. Although radiation doses are low during dental practice, there is always a concern in the dental community about radiation exposure [
15,
16,
17,
18]. Deterministic effects are limited to a certain threshold dose, thus, unlikely to appear with range of dental examination exposures [
11].
Our hypothesis assumes that in some exceptional occasions the dentist or the staff (dental assistant, radiology technologist) may need to be present in the x-ray room during the CBCT examination. Thus, we wanted to determine if there is a safety distance from the CBCT device to stand, so to receive the lowest possible scattered radiation [
6,
11].
This research study specifically aims: to estimate the patterns of scattered radiation and its spatial distribution around three CBCT devices, in order to determine relatively safe positions for an operator to stand if needed to be present in the x-ray room during the CBCT examination.
2. Materials and Methods
2.1. Study Material
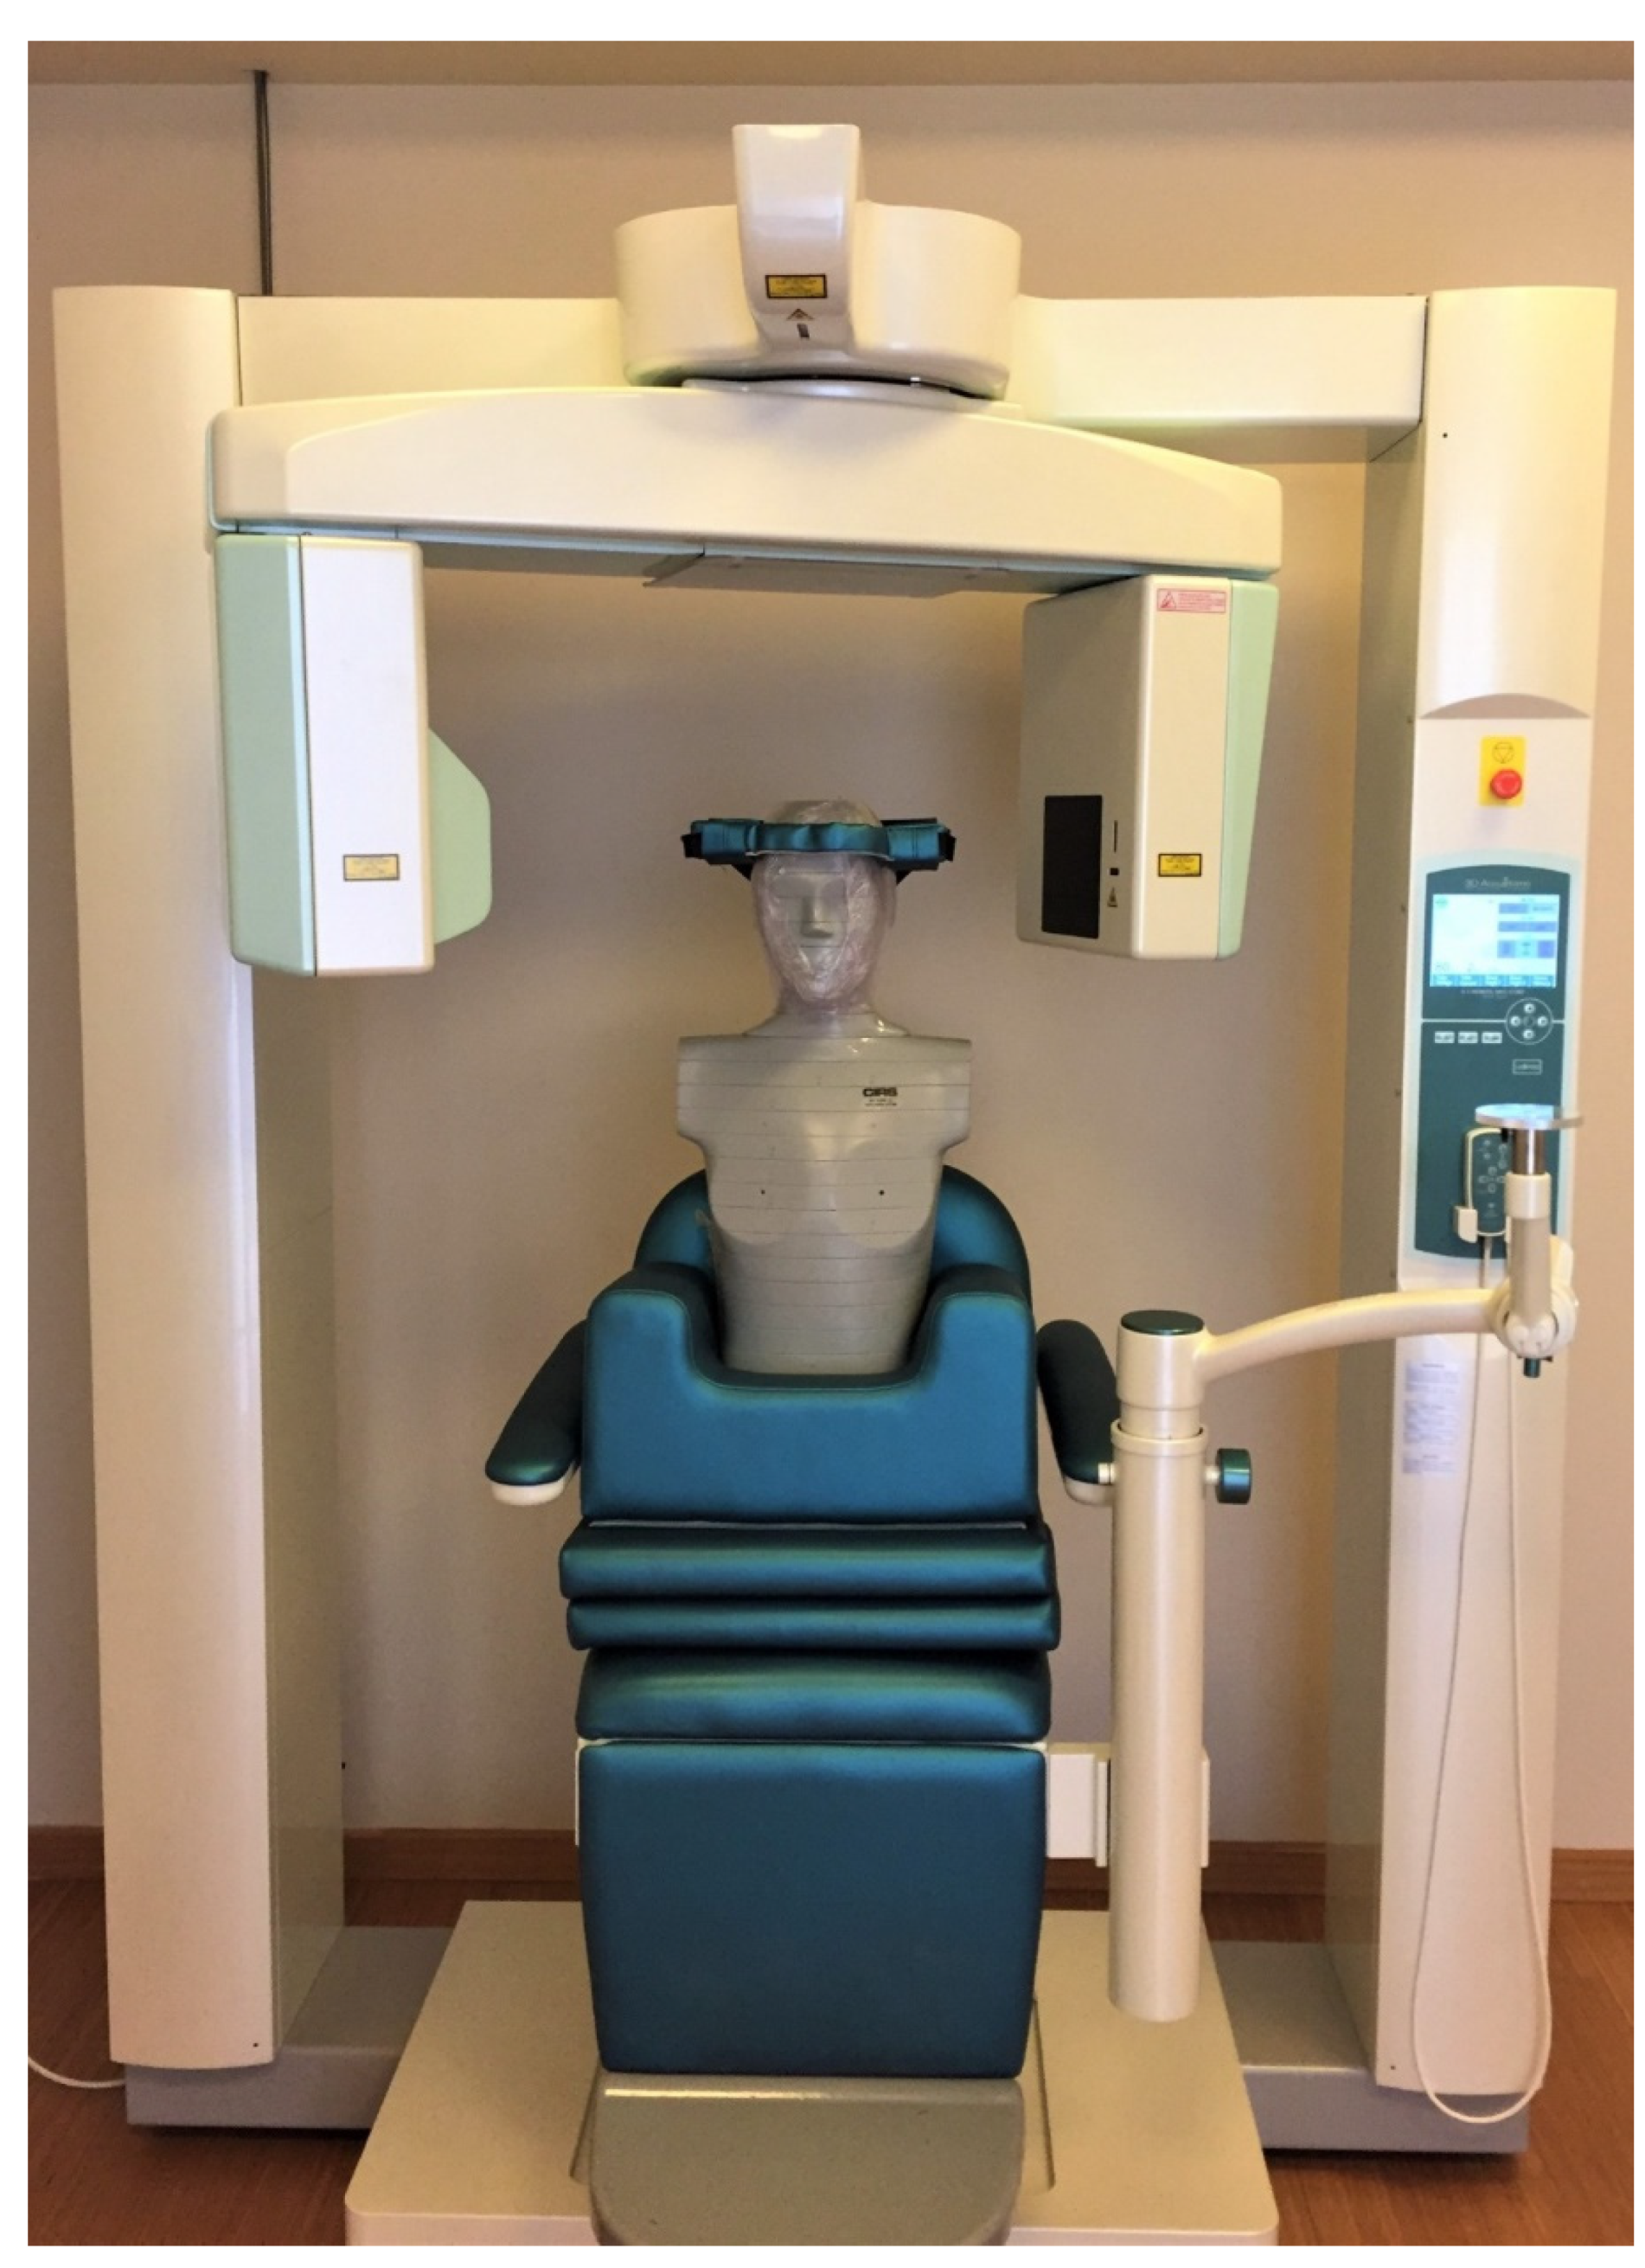
The following devices were tested in this research study: Morita Accuitomo (CBCT1) (J. Morita Corp. Osaka, Japan), Newtom Giano HR (CBCT2) (Cefla s.c., Bologna, Italy), Newtom VGi (CBCT3) (Cefla s.c., Bologna, Italy). Exposure measurements were performed for different kVp, mA and Field of View (FOV) values. An anthropomorphic phantom (NATHANIA) (Computerized Imaging Reference Systems, CIRS, Inc., Norfolk, USA) was placed in the x-ray gantry to imitate clinical conditions (
Figure 1).
In terms of ambient dose equivalent H*(10), scattered radiation measurements were taken with a Victoreen ionization chamber (Inovision 451P), with dimensions 10cm x 20cm x 15cm (451P) (Fluke Biomedical Radiation Management Services, Ohio, USA.). Calibration of ionization chambers provides traceability to Physikalisch-Technische Bundesanstalt (PTB) through Ionizing Radiation Calibration Laboratory of the Greek Atomic Energy Commission [Secondary Standard Dosimetry Laboratory, (SSDL)]. The survey meter was placed at fixed distances from each irradiation isocenter, away from the primary beam [
11,
19]. The ionization chamber (451P) exhibited a direct response for measuring scattered radiation dose and showed a high detection capability for very small radiation doses, including radiation present in the natural environment and stable energy dependence in 40-100 keV range. Scattered radiation measurements were performed at the same distances from the CBCT devices (
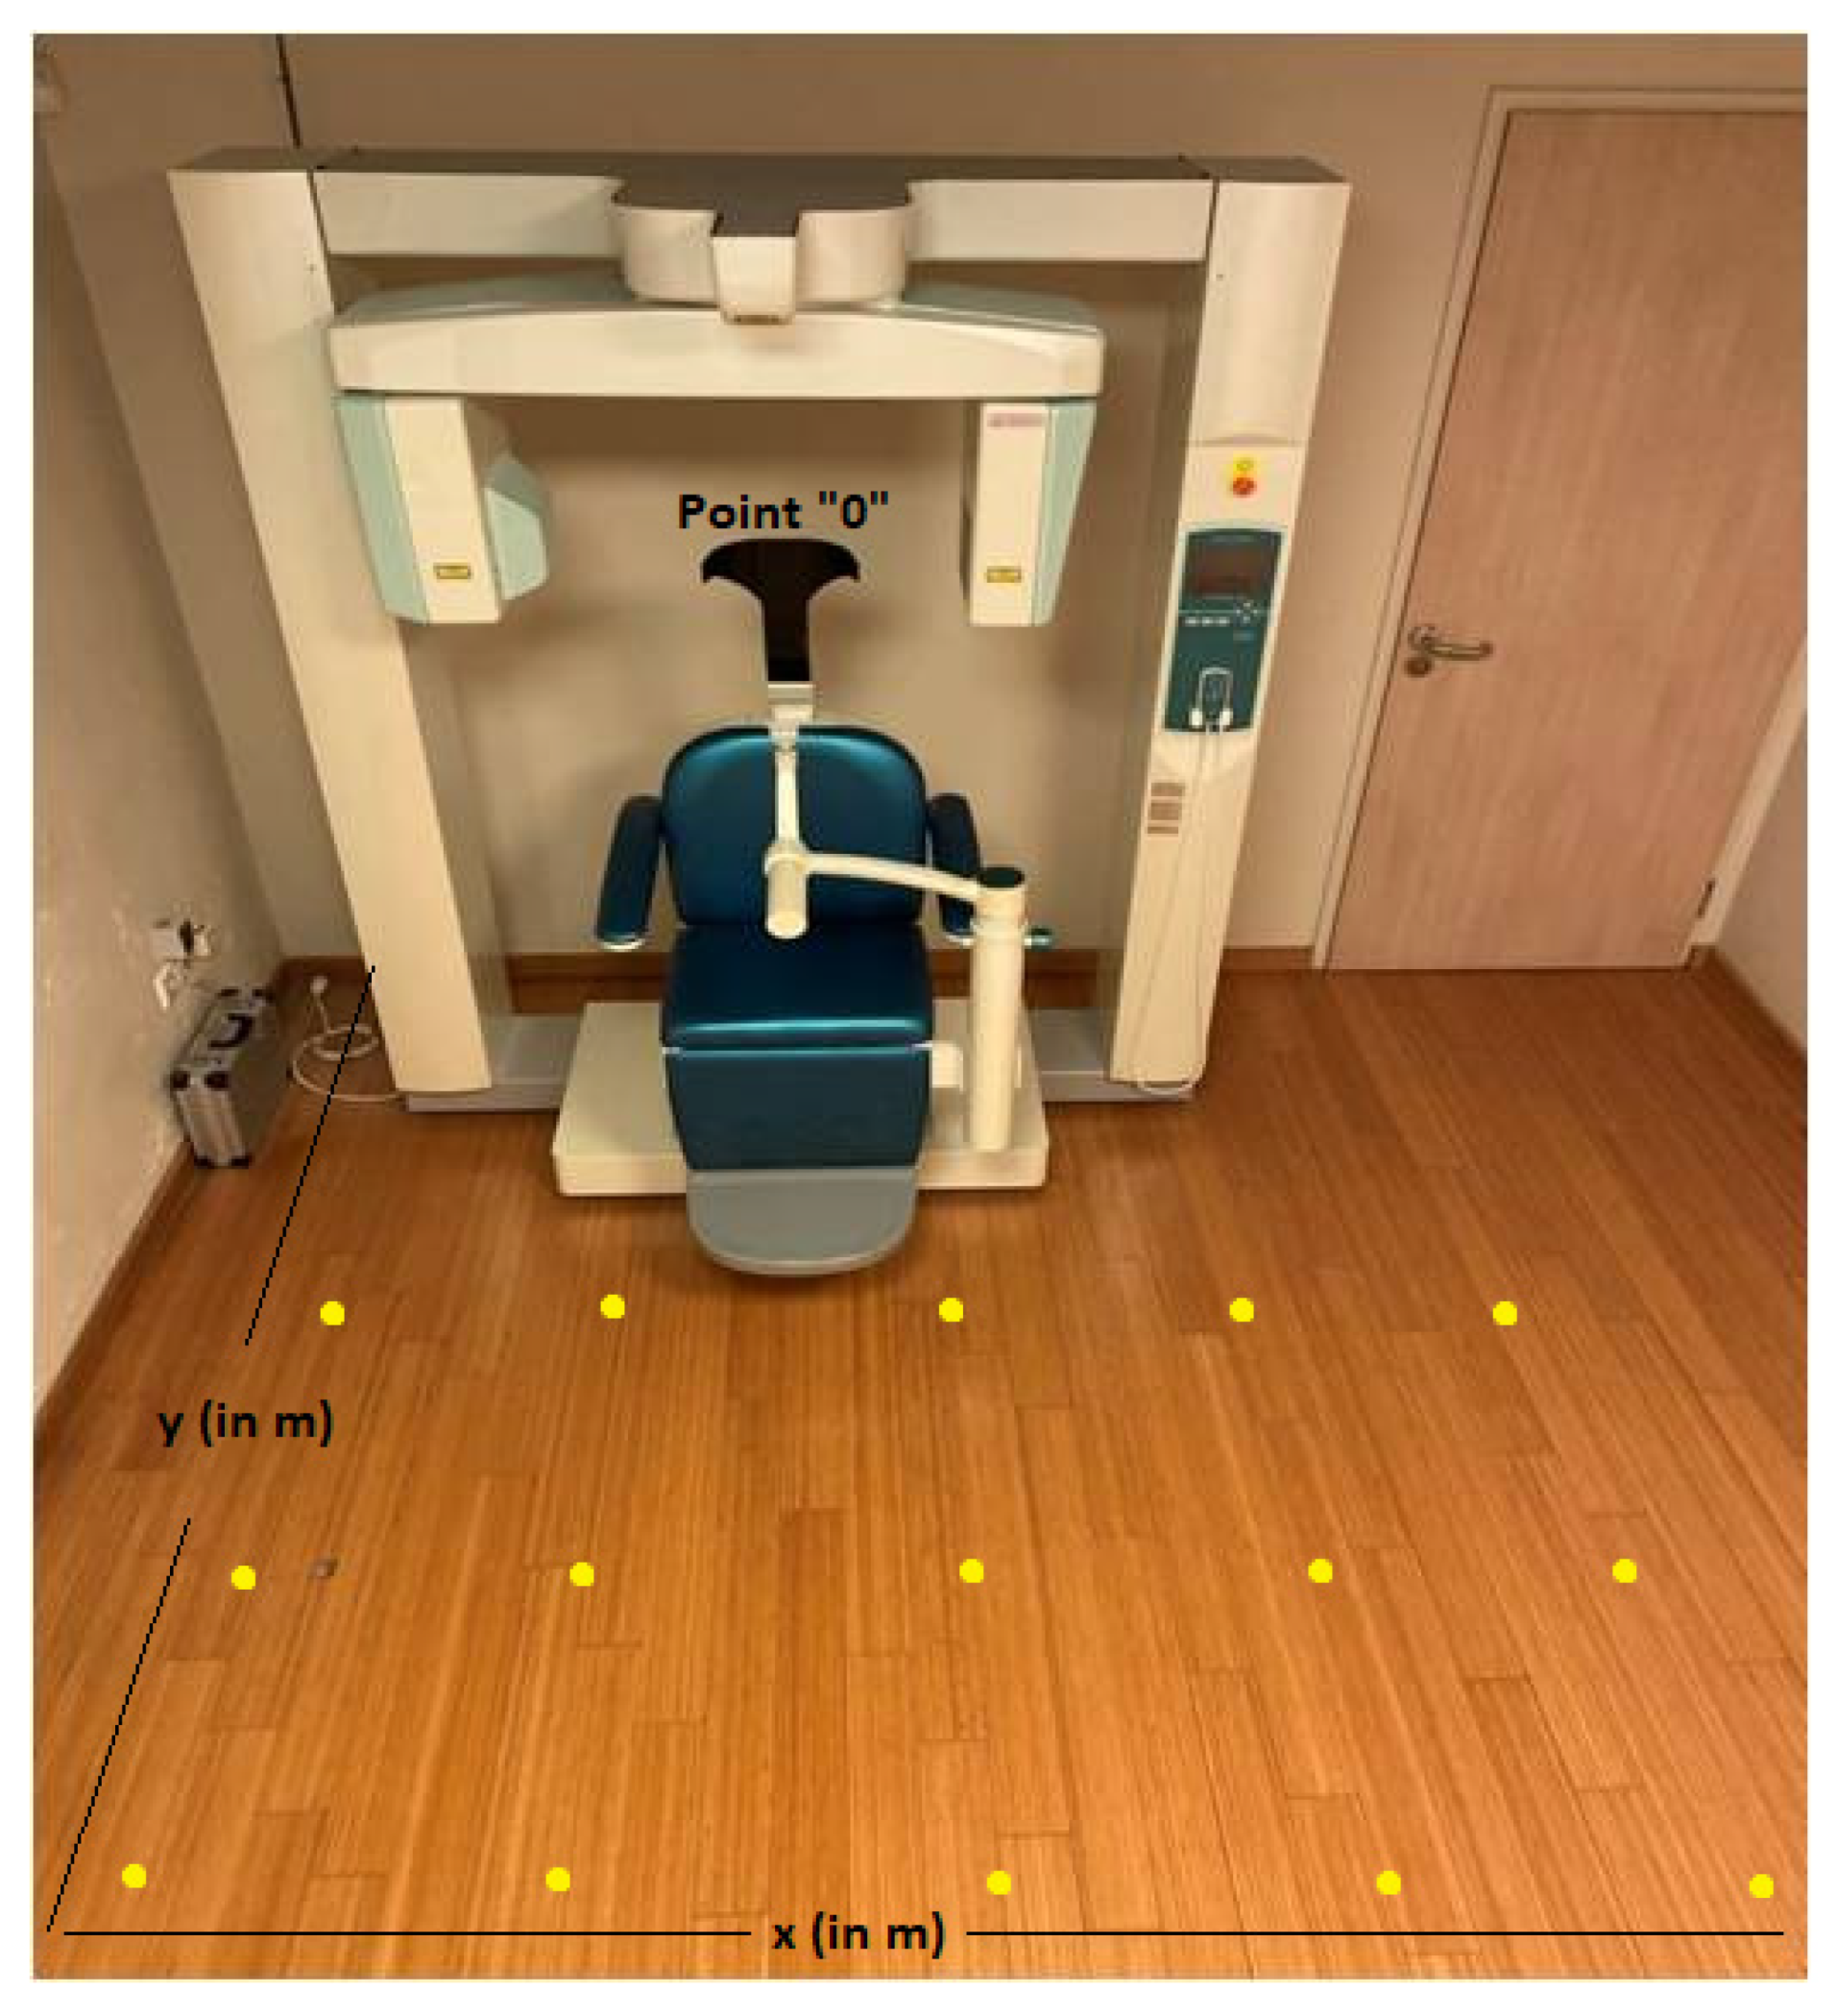
Figure 2).
The placement positions of 451P were determined in each CBCT room based on point “0”, which represented the fixed position of each CBCT device [
20]. More specifically, two reference axes were drawn in the floor: the first (
x-axis) represented the distance (in m) of the 451P to the right and left of the CBCT device, showing positive (right) and negative (left) values, respectively. The second (
y-axis) represented the distance (in m) of the 451P from the CBCT device, in front of the CBCT device, perpendicular to the
x-axis (
Figure 2) [
20].
191 (CBCT1) and 32 (CBCT2) measurements of scattered radiation at two different heights (1m or 1.3m from the floor) were carried out in the rooms of CBCT1 and CBCT2 devices at each point of intersection of the x and y axes (yellow points) (
Figure 2). The measurement at a height of 1m from the floor, represented the anatomical location of the gonads as well as at a height of 1.3m from the floor, represented the anatomical location of the thyroid gland [
21]. It is of importance that in the CBCT3 room all measurements (36 measurements) were carried out at the same height (1.3m), due to technical difficulties (room and device restrictions).
Measurements of scattered radiation from different Field of Views (FOVs) were also performed. More specifically, measurements of scattered radiation were carried out in the CBCT1 device in three different FOVs [(4 × 4), (6 × 6), (8 × 8)], in the CBCT2 device in two different FOVs [(8 × 8), (11 × 8)] and in the CBCT3 device in two different FOVs [(8 × 8), (15 × 15)].
2.2. Statistical Analysis
Data were described using mean values and standard deviation (SD) for the scattered radiation dose measurements (µGy) in the ionization chamber (451P) at three different rooms of CBCT devices (CBCT1, CBCT2, CBCT3). One-way analysis of variance (ANOVA) and independent samples t-test were used to assess the mean difference of 451P measurements between the three rooms and between the FOVs in each room. Following, Bonferroni tests for multiple comparison corrections were applied. In order to investigate whether the position of CBCT device, in the three rooms, was related to 451P, the Euclidean distance of each measurement point was calculated as distance in meters (m). Generalized additive models (GAM) were applied to assess the relationship between 451P (dependent variable) and distance (m) from the CBCT device (independent variable), in each room. Mixed effect linear regression models were used to assess the relationship between 451P and the FOV, in each room. All models were adjusted for the height (m) that the measurement was carried out and for the coordinates (x, y) of each measurement point, by including a bivariate smooth function (thin plate spline) of (x, y). The spatial distribution of scattered radiation in 451P was estimated through rigging universal interpolation method. A test for trend was applied to investigate the trend of 451P in the FOVs of each room.
All statistical analysis was performed using R version 4.1.3 (2022-03-10), library (mgcv) and library (lme4). All spatial analysis was done using ArcGIS Desktop v.10.1. (Spatial Analyst Tools, Interpolation, Spline). Two-tailed p-values are reported. A p-value less than 0.05 was considered as statistically significant.
3. Results
Table 1 presents the number of points and measurements performed in each room, the height of the measurements performed, the distribution of 451P measurements and maximum distance value from point “0”. It is worth noting that all measurements were carried out at the same height in room 3. A statistical significant difference was observed in mean 451P measurements (
p < 0.001) between rooms. Specifically, after applying Bonferroni test, mean 451P measurements differed statistically significant between room 2 and 3 (
p <0.001), room 1 and 3 (
p <0.001) and between room 1 and 2 (
p < 0.001). The maximum value of 451P measurements (9.03 µGy) was observed in CBCT1, in a distance of 100 cm from point “0”, while in CBCT2 and CBCT3 the maximum values were 5.70 and 8.70 µGy in a distance of 50 cm and 55 cm from point “0”, respectively (
Table 1).
Table 2 presents the distribution of 451P measurements, for different FOV in each room. A statistically significant difference in 451P measurements according to FOV was found in room 1 (
p = 0.012) and in room 3 (
p = 0.001). Regarding room 1, a significant difference in 451P measurements was observed between FOVs 4 × 4 and 8 × 8 (Bonferroni multiple comparison
p = 0.010). Also, as the FOV increases, a significant increasing trend in 451P measurements was shown in rooms 1 and 3 (
p <0.001). For example, in room 1, 451P measurements made at FOV 6 × 6 compared to FOV 4 × 4, were on average higher by 0.523 μGy [95% Confidence Interval (C.I.): 0.139 to 0.820) μGy]. Moreover, 451P measurements were performed at FOV 8 × 8 compared to 4 × 4, were on average higher by 0.776 μGy [95% C.I.: 0.365 to 1.053) μGy] (
Table 2).
Table 3 shows the results from applying generalized additive models, with 451P measurement as the dependent variable and distance of measurements as the independent variable, also adjusting for height of measurements made (only in rooms 1 and 2) and coordinates (x, y) of measurement points, in each room. In room 1, a 1-meter increase in the distance from the CBCT device, resulted in a decrease in mean 451P by 0.047 μGy [95% C.I.: -0.057 to -0.037) μGy], adjusting for the other variables. In room 2, a 1-meter increase in the distance from the CBCT device, resulted in a decrease in mean 451P by 0.036 μGy [95% C.I.: -0.062 to -0.010) μGy], taking into account the other variables. Note that in both rooms, the height of the measurements did not significantly predict 451P (
p = 0.956 and
p = 0.323, respectively). In room 3, a 1-meter increase in the distance from the CBCT device, resulted in a decrease in mean 451P by 0.079 μGy [95% C.I.: -0.115 to -0.043) μGy], adjusting for the other variables (
Table 3).
Table 4 presents the results from linear mixed effect regression models, with 451P measurement as the dependent variable and FOV as the independent variable, also adjusting for height of measurements made (only for room 1 and 2) and coordinates (x, y) of measurement points, in each room. A statistically significant effect between FOV and 451P was found in rooms 1 and 3. Specifically in room 1, FOV 6 × 6 and 8 × 8, compared to FOV 4 × 4, had on average a higher value of 451P by 0.480 [95% C.I.: 0.139 to 0.820) μGy] and 0.709 μGy [95% C.I.: 0.365 to 1.053) μGy], respectively. While in room 3, FOV 15 × 15 compared to FOV 8 × 8, had a higher mean value of 451P by 2.005 μGy [95% C.I.: 1.453 to 2.558) μGy] (
Table 4).
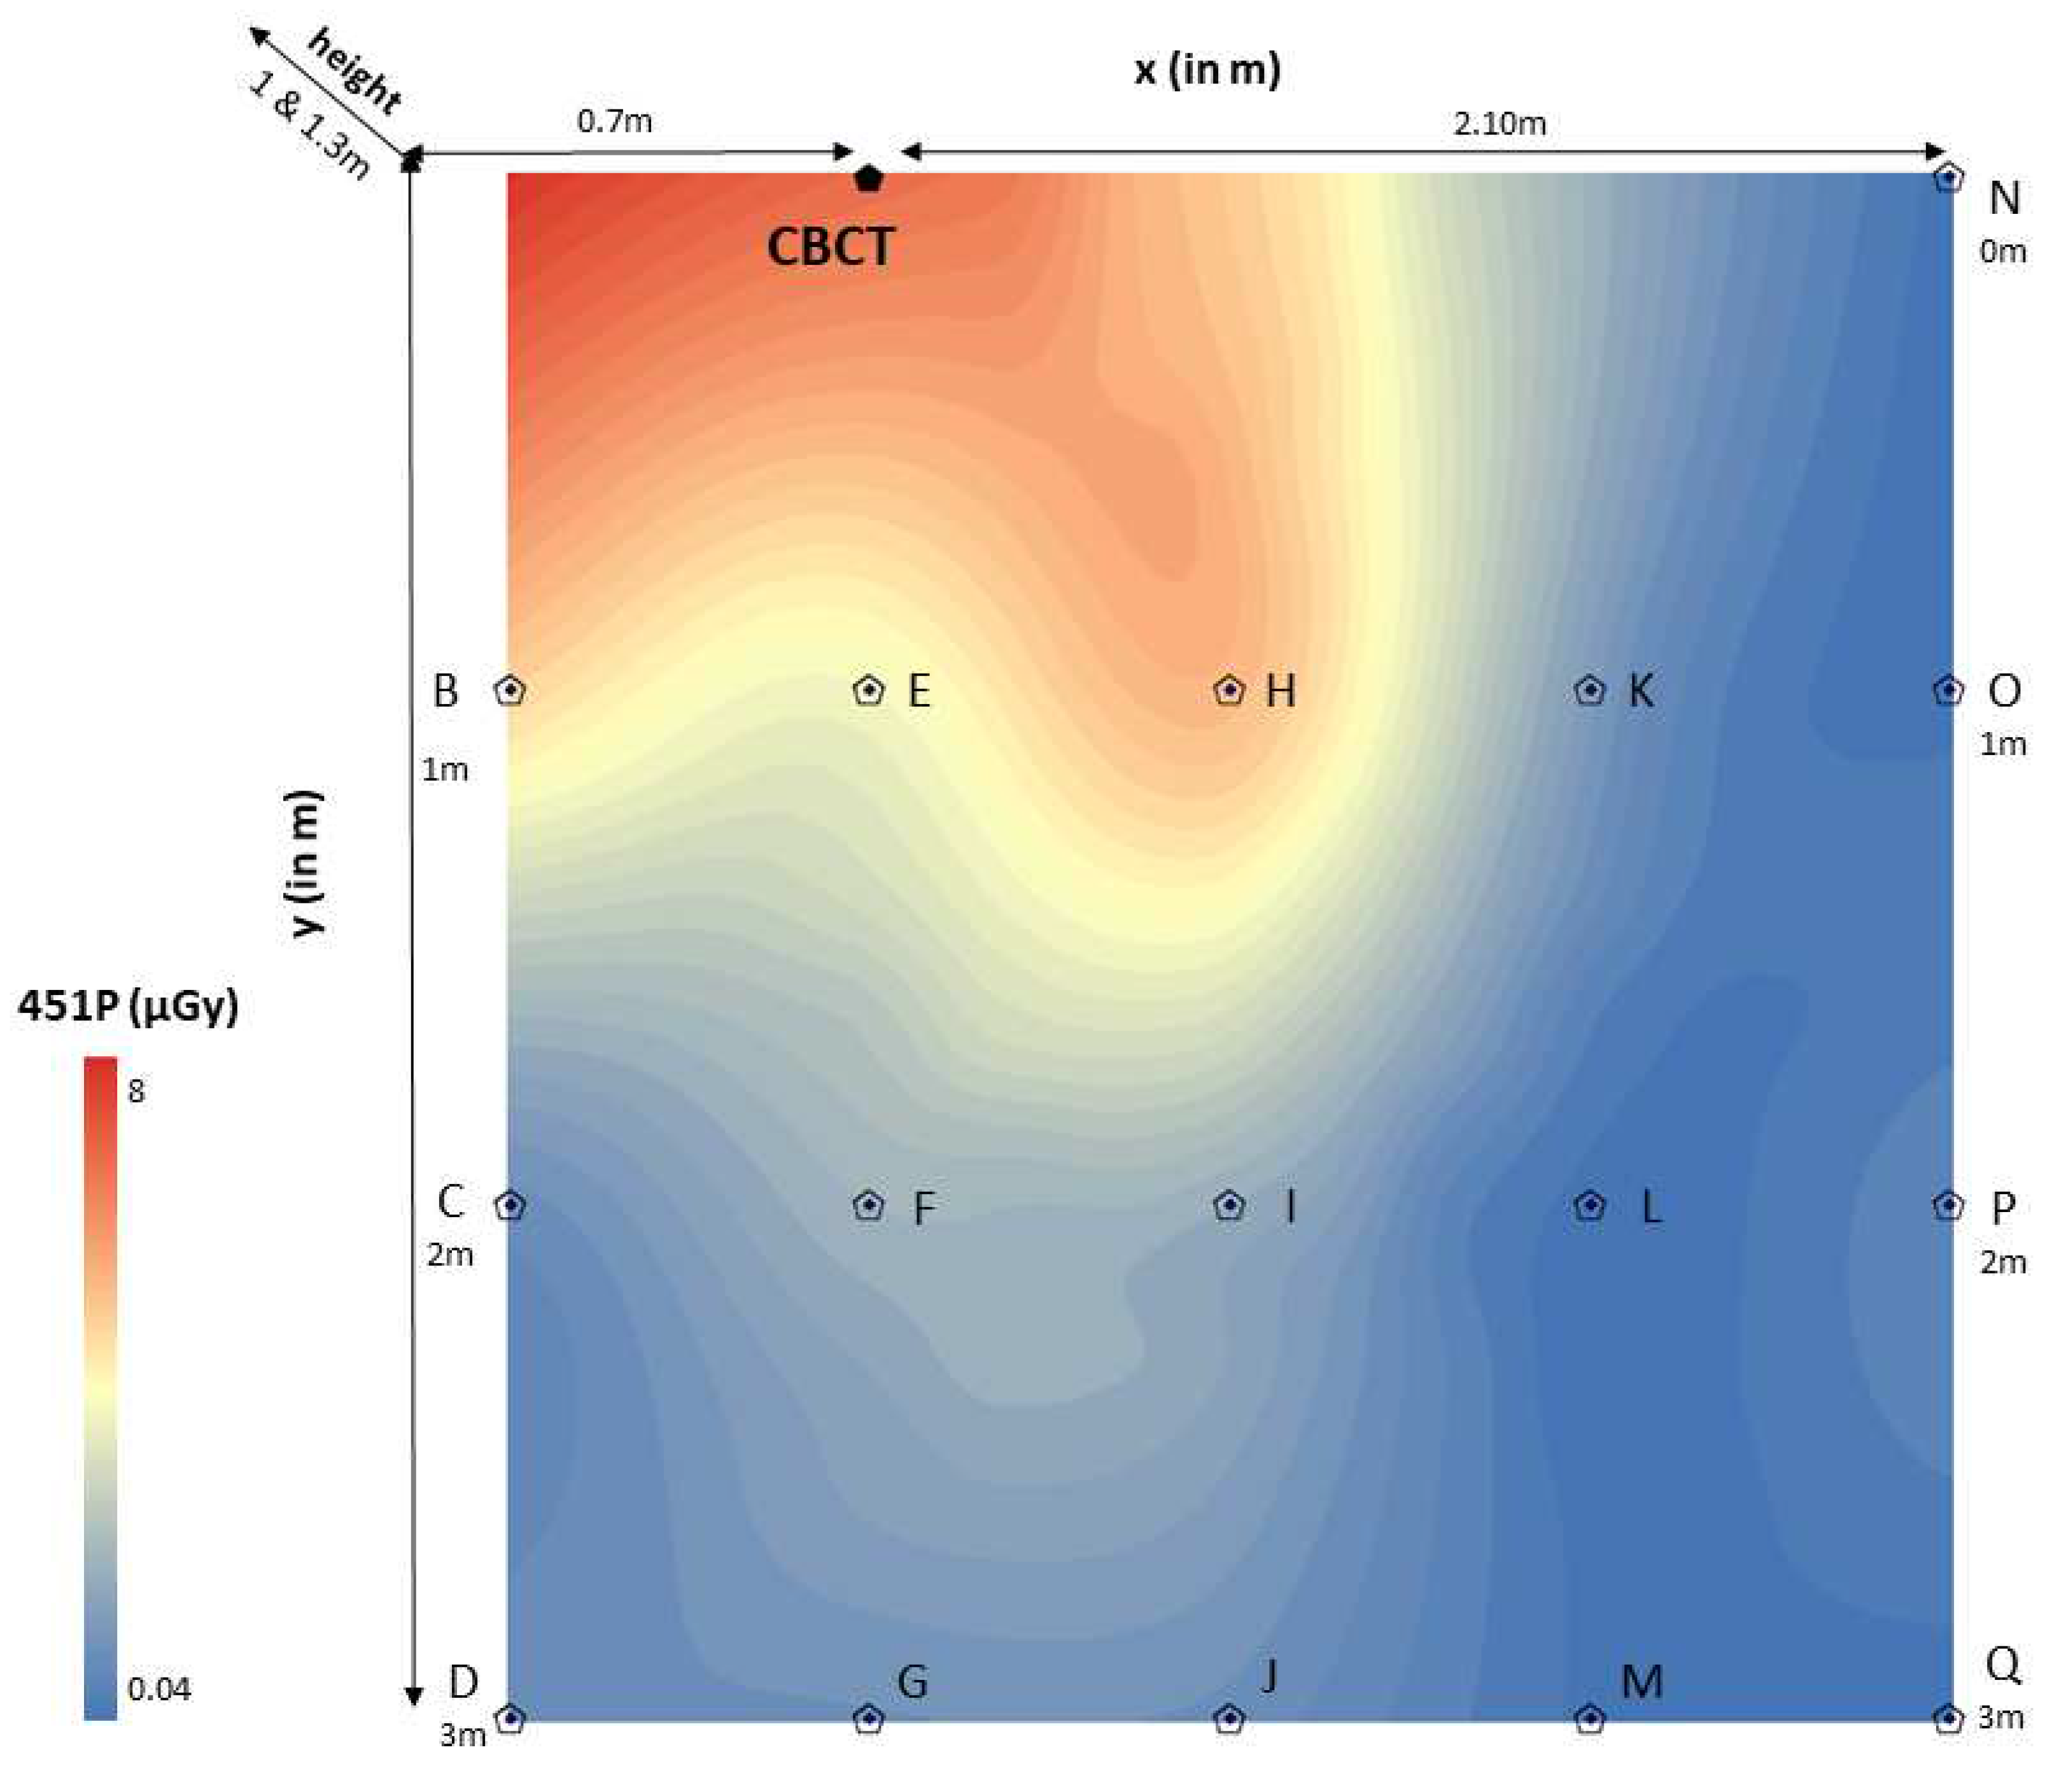
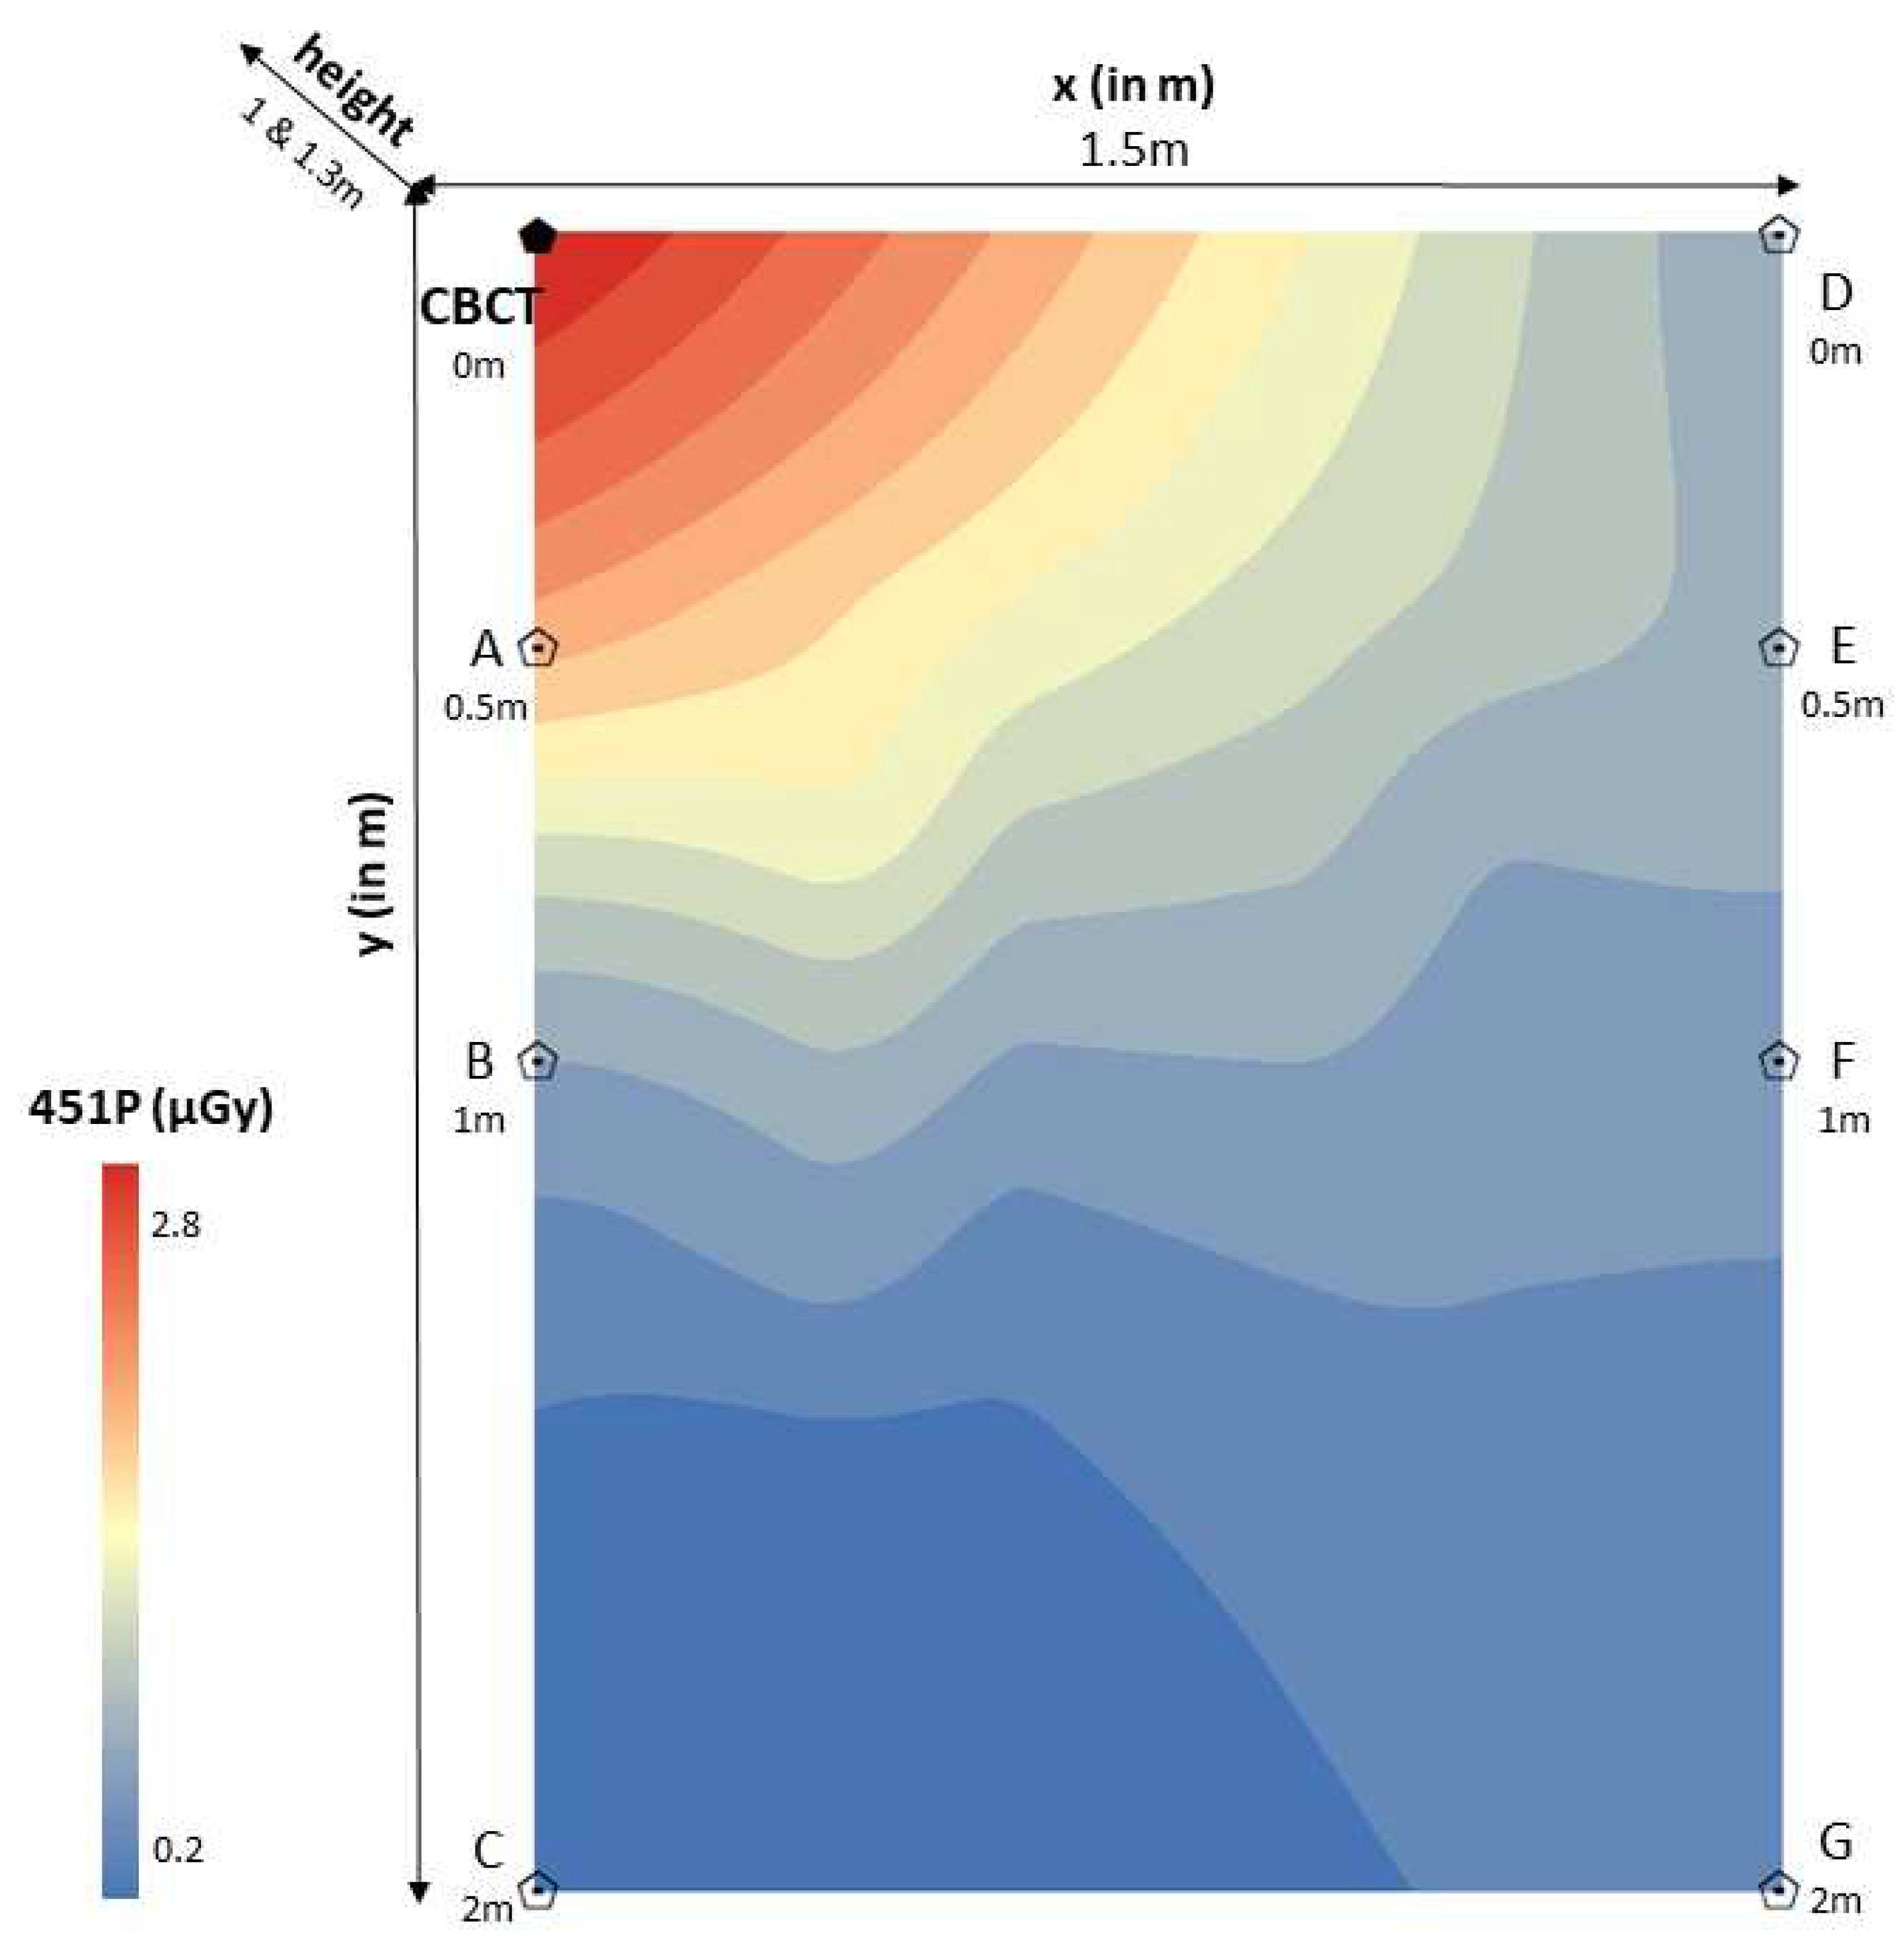
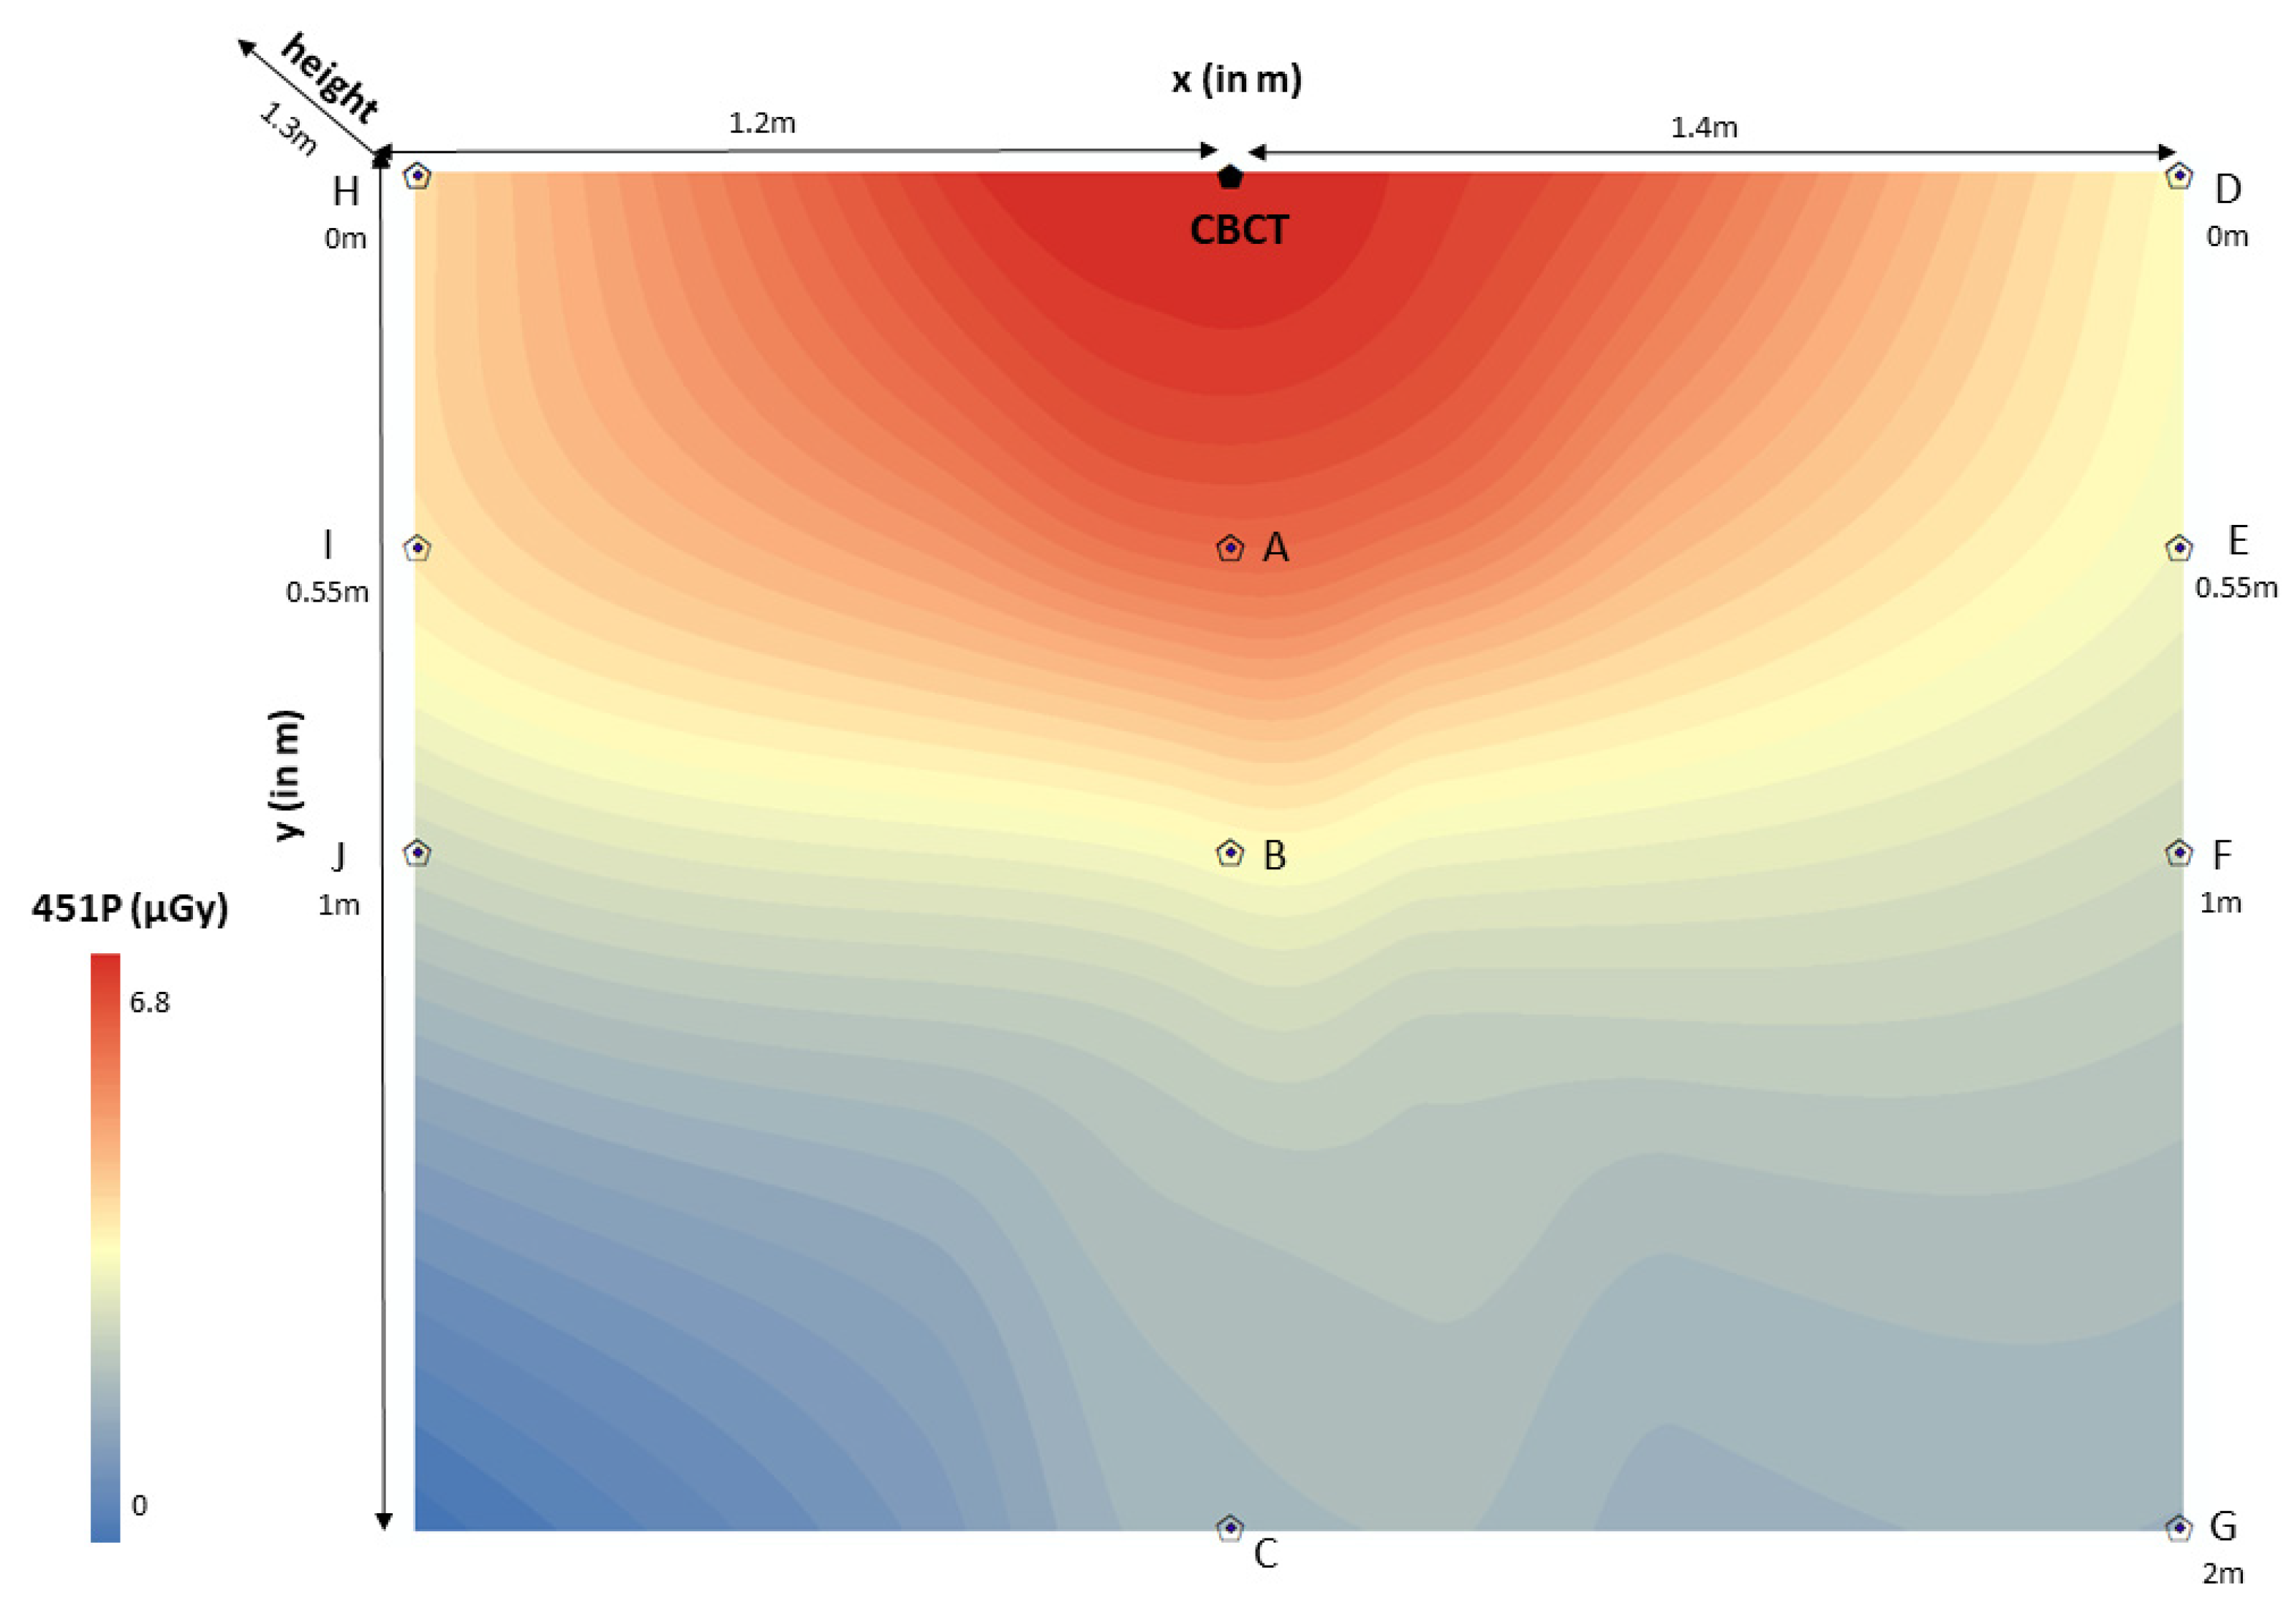
The spatial distribution of scattered radiation in 451P was estimated through rigging universal interpolation method. Color maps of dose distributions were drawn for horizontal and vertical planes. Scattered radiation dose mapping in the ionization chamber (451P) was depicted per room (CBCT1, CBCT2, CBCT3) on the scattered radiation dose distributions color maps (
Figure 3,
Figure 4 and
Figure 5). It is worth noting that color maps in rooms 1 and 2 appeared uniform (CBCT1, CBCT2), regardless of the measurement height. Measurement height did not statistically significantly differentiate the measurement of scattered radiation in the ionization chamber.
CBCT: Cone Beam Computed Tomography 1 device (CBCT1); point “0”.
x (in m):x-axis defined the distance (in m) of the ionization chamber (451P) to the right and left of the CBCT1 device (point “0”), showing sometimes positive (right) and sometimes negative (left) values. In this color map, the absolute values are displayed in order to avoid confusion [(point A – point “0” = 0.7m), (point “0” – point N = 2.10m)].
y (in m):y-axis defined the distance (in m) of the ionization chamber (451P) from the CBCT1 device in an anterior position, perpendicular to the x-axis [(point A – point D = 3m), (point N – point Q=3m)].
451P (μGy): Scattered radiation measurements (μGy) were taken with the ionization chamber Inovision model 451P Victoreen (0.04 - 8μGy). Red color means very high scattered radiation dose, while blue color means very low scattered radiation dose.
height (1 & 1.3m): The measurement carried out at a height of 1m from the floor, represented the anatomical location of the gonads. The measurement carried out at a height of 1.3m from the floor, represented the anatomical location of the thyroid gland.
CBCT: Cone Beam Computed Tomography 2 device (CBCT2); point “0”.
x (in m):x-axis defined the distance (in m) of the ionization chamber (451P) to the right of the CBCT2 device (point “0”), showing positive values (point “0” – point D=1.5m).
y (in m):y-axis defined the distance (in m) of the ionization chamber (451P) from the CBCT2 device in an anterior position, perpendicular to the x-axis [(point “0” – point C=2m), (point D – point G=2m)].
451P (μGy): Scattered radiation measurements (μGy) were taken with the ionization chamber Inovision model 451P Victoreen (0.2 – 2.8μGy). Red color means very high scattered radiation dose, while blue color means very low scattered radiation dose.
height (1 & 1.3m): The measurement carried out at a height of 1m from the floor, represented the anatomical location of the gonads. The measurement carried out at a height of 1.3m from the floor, represented the anatomical location of the thyroid gland.
CBCT: Cone Beam Computed Tomography 3 device (CBCT3); point “0”.
x (in m):x-axis defined the distance (in m) of the ionization chamber (451P) to the right and left of the CBCT3 device (point “0”), showing sometimes positive (right) and sometimes negative (left) values. In this color map, the absolute values are displayed in order to avoid confusion [(point H – point “0” = 1.2m), (point “0” – point D = 1.4m)].
y (in m):y-axis defined the distance (in m) of the ionization chamber (451P) from the CBCT3 device in an anterior position, perpendicular to the x-axis [(point H – point J = 0.55m), (point D – point G=2m)].
451P (μGy): Scattered radiation measurements (μGy) were taken with the ionization chamber Inovision model 451P Victoreen (0 – 6.8μGy). Red color means very high scattered radiation dose, while blue color means very low scattered radiation dose.
height (1.3m): The measurement carried out at a height of 1.3m from the floor, represented the anatomical location of the thyroid gland.
4. Discussion
In this research study, measurements of the scattered radiation dose were collected inside rooms with CBCT installations. The spatial distribution of scattered radiation measured with ionization chamber (451P) was estimated through rigging universal interpolation method and the safest locations of the people who by exception could be present inside the x-ray room were determined (>100cm from CBCT1, >50cm from CBCT2 and >55cm from CBCT3).
The protection against scattered radiation was a perennial concern of scientific community, even when the radiation dose is quite low, such as during intraoral radiography [
20,
22,
23]. A research study showed that occupationally exposed individuals presented a higher incidence of thyroid cancer especially at older times, when the radiation protection measurements were not as strict [
21]. A similar epidemiological study in Canada argued that repeated exposure to low doses by occupation was limited to long-term harmful effects and cancer incidence [
24]. Cewe et al. (2022) demonstrated that staff can use freestanding radiation protection shields instead of heavy aprons during intraoperative CBCT imaging, to achieve effective whole body dose reduction with improved comfort [
11].
Alcaraz et al. (2006) measured the scattered radiation at various distances from the patient, who was lying supine, 48cm from the floor. The measurements were carried out at distances of 60 – 90 – 120 – 150 – 180 cm and at an angle of 0
0 - 135
0 - 180
0. The results of this study in relation with dose reduction of intraoral dental radiography showed that the safest position for the dentist was behind and right of the x-ray beam at angle of 135
0 [
22]. These were in agreement with the results of a previous study by Rolofson et al. (1969), who studied radiation isoexposure curves of scattered radiation about a dental chair during radiography. Rolofson et al. (1969) reported that the most appropriate location with the lowest absorbed radiation dose to the gonadal anatomical region was directly behind the x-ray beam or to the side of the patient's head, opposite the x-ray beam [
23]. Yamaji et al. (2021) noticed that if a physician or staff member needs to observe the patient near the table, it would be recommended to stand in the back of the base CBCT device. With the use of a ceiling-mounted transparent lead-acryl screen and a table suspended lead curtain, the doses were reduced 45 – 92% at a direction of 210
0 degrees and a distance of 120cm [
19]. In our study, the safest positions of people who exceptionally can be found within the CBCT area were proposed to be >100cm from CBCT1 device, >50cm from CBCT2 device and >55cm from CBCT3 device. Therefore, our findings were in agreement with previous studies. A limitation of our study was that we did not use angle measurements when placing the ionization chamber (451P) in the three rooms with the CBCT devices.
An increase in the scattered radiation at a height of 100cm from the floor, at the level of the x-ray gantry, and a decrease in the absorbed dose of radiation near the gantry were observed by other researchers [
6]. Conversely, an increase in scattered radiation behind the gantry was observed during head imaging with Computed Tomography (General Electric Hi Speed Advantage CT) [
25]. Various research studies had shown that scattered radiation decreases as we move away from the x-ray beam. More specifically, at a distance of 10 and 20cm from the x-ray beam in a 3
rd generation Computed Tomography device, the scattered radiation was detected at high levels of 10 and 18mSv, while it was greatly reduced, to 2mSv, at a distance of 30cm from the x-ray beam [
26]. In the present study it was observed to a statistically significant extent that in room 1, a 1-meter increase in the distance from the CBCT device, resulted in a decrease in mean 451P by 0.047 μGy [95% C.I.: -0.057 to -0.037) μGy], adjusting for the other variables. Also, in room 2, a 1-meter increase in the distance from the CBCT device, resulted in a decrease in mean 451P by 0.036 μGy [95% C.I.: -0.062 to -0.010) μGy], taking into account the other variables. Furthermore, in room 3, a 1-meter increase in the distance from the CBCT device, resulted in a decrease in mean 451P by 0.079 μGy [95% C.I.: -0.115 to -0.043) μGy], adjusting for the other variables. There were in agreement with the results of previous studies.
Yamaji et al. (2021) measured the distribution of scattered radiation by C-arm cone beam computed tomography (CBCT) in the angiographic suite. In this study, the measurements showed the highest radiation dose over 600μGy by a single CBCT image acquisition at a distance of 60cm from the beam entry site and a height of 90cm from the floor [
19]. In the present study, the safest positions of the people who exceptionally can be found within the CBCT area were proposed to be >100cm from CBCT1 device, >50cm from CBCT2 device and >55cm from CBCT3 device. However, the values obtained from the measurements were overall much lower than 1mGy, which is defined by the radiation protection guidelines as the exposure radiation limit of the general population [
27]. A comparative advantage of our study was that the measurement of the scattered radiation was carried out in three different CBCT devices and numerous measurements of the scattered radiation were carried out at two different heights. The measurement made at a height of 1m represented the anatomical region of the gonads. The measurement carried out at a height of 1.3m represented the anatomical region of the thyroid gland. It was noted, however, that the height of the measurements did not appear to differentiate statistically significantly the measurement of the scattered radiation in the ionization chamber (451P) (
p > 0.05). In addition, due to technical difficulties, a limitation of the present study was that in the room 3 (CBCT3) all measurements were made at the same height (1.3m).
5. Conclusions
In all CBCT devices that were tested in this study the scattered radiation that an individual may be exposed to, is significantly decreased with distance. Especially, the Newtom VGi CBCT showed the greatest decrease with distance. In all instances the measured scattered radiation was below 1mGy. Nevertheless, as long as the dentist or radiology technologist or other occupationally exposed individual stand at a safe distance and position from the patient (as determined by our results), the scattered radiation is significantly reduced and the possible risk of stochastic effects on the human body is minimized.
Author Contributions
Conceptualization: S.P., E.C., C.D., P.K, A.B., E.P., C.A.; methodology: S.P., E.C., C.D.; software: S.P., E.C.; validation: S.P., E.C., C.D., P.K, A.B., E.P., C.A.; formal analysis: S.P., E.C., C.D., P.K, C.A.; investigation: S.P., E.C., C.D., P.K., A.B., E.P., C.A.; resources: S.P., E.C., C.D., C.A.; data curation: E.C., C.D., C.A.; writing—original Draft Preparation: E.C.; writing—review and editing: S.P., E.C., C.D., P.K., A.B., E.P., C.A.; visualization: S.P., E.C., C.D., E.P., C.A.; supervision: C.D., P.K, A.B., E.P., C.A.; project administration: S.P., E.C., C.D., P.K., A.B., E.P., C.A.; funding acquisition: S.P., E.C., C.D., E.P., C.A. All authors have read and agreed to the published version of the manuscript.
Funding
This research received no external funding.
Data Availability Statement
The datasets used and/or analyzed during the current study are available from the corresponding author upon reasonable request.
Conflicts of Interest
The authors of this manuscript declare no relevant conflict of interest and no relationships with any companies whose products or services may be related to the subject matter of the article.
References
- Scarfe, W.C.; Farman, A. What is Cone-Beam CT and How Does it Work? Dent Clin North Am 2008, 52, 707–730. [Google Scholar] [CrossRef] [PubMed]
- Scarfe, W.C.; Angelopoulos, C. Maxillofacial Cone Beam Computed Tomography, Principles, Techniques and Clinical Applications, 1st ed.; Springer International Publishing AG: Gewerbestrasse 11, 6330 Cham, Switzerland, 2018; pp. 43–95. [Google Scholar]
- Liao, C.W.; Lih-Jyh, F.; Yen-Wen, S.; Heng-Li, H.; ChiH-Wei, K.; Ming-Tzu, T.; Jui-Ting, H. Self-Assembled Micro-Computed Tomography for Dental Education. PloS One 2018, 13, e0209698. [Google Scholar] [CrossRef] [PubMed]
- Pauwels, R.; Beinsberger, J.; Stamatakis, H.; Tsiklakis, K.; Walker, A.; Bosmans, H.; Bogaerts, R.; Jacobs, R.; Horner, K.; SEDENTEXCT Project Consortium. Comparison of spatial and contrast resolution for cone-beam computed tomography scanners. Oral Surg Oral Med Oral Pathol Oral Radiol 2012, 114, 127–135. [Google Scholar] [CrossRef]
- Honey, O.B.; Scarfe, W.C.; Hilgers, M.J.; Klueber, K.; Silveira, A.M.; Haskell, B.S.; Farman, A.G. Accuracy of cone-beam computed tomography imaging of the temporomandibular joint: comparisons with panoramic radiology and linear tomography. Am J Orthod Dentofacial Orthop 2007, 132, 429–438. [Google Scholar] [CrossRef] [PubMed]
- Mellenberg, D.E.; Sato, Y.; Thompson, B.H.; Warnock, N.G. Personnel exposure rates during simulated biopsies with a real-time CT scanner. Acad Radiol 1999, 6, 687–690. [Google Scholar] [CrossRef]
- Siewerdsen, J.H.; Jaffray, D.A. Cone-beam computed tomography with a flat-panel imager: magnitude and effects of x-ray scatter. Med Phys 2001, 28, 220–231. [Google Scholar] [CrossRef]
- Graham, S.A.; Moseley, D.J.; Siewerdsen, J.H.; Jaffray, D.A. Compensators for dose and scatter management in cone-beam computed tomography. Med Phys 2007, 34, 2691–2703. [Google Scholar] [CrossRef]
- Thanasupsombat, C.; Thongvigitmanee, S.S.; Aootaphao, S.; Thajchayapong, P. A Simple Scatter Reduction Method in Cone-Beam Computed Tomography for Dental and Maxillofacial Applications Based on Monte Carlo Simulation. Biomed Res Int 2018, 2018, 5748281. [Google Scholar] [CrossRef]
- Gonçalves, O.D.; Boldt, S.; Nadaes, M.; Devito, K.L. Evaluating the scattered radiation intensity in CBCT, Radiation Physics and Chemistry 2018, 144, 159-164. Radiation Physics and Chemistry 2018, 144, 159–164. [Google Scholar] [CrossRef]
- Cewe, P.; Vorbau, R.; Omar, A.; Elmi-Terander, A.; Edström, E. Radiation distribution in a hybrid operating room, utilizing different X-ray imaging systems: investigations to minimize occupational exposure. J Neurointerv Surg 2022, 14, 1139–1144. [Google Scholar] [CrossRef]
- The 2007 Recommendations of the International Commission on Radiological Protection. ICRP publication 103. Ann ICRP. 2007, 37, 1–332. [Google Scholar]
- Stewart, F.A.; Akleyev, A.V.; Hauer-Jensen, M.; Hendry, J.H.; Kleiman, N.J.; Macvittie, T.J.; Aleman, B. M,. Edgar, A.B.; Mabuchi, K.; Muirhead, C.R.; Shore, R.E.; Wallace, W.H. ICRP publication 118: ICRP statement on tissue reactions and early and late effects of radiation in normal tissues and organs--threshold doses for tissue reactions in a radiation protection context. Ann ICRP 2012, 41, 1–322. [Google Scholar]
- Engel, H.P. Radiation protection in medical imaging. Radiography 2006, 12, 153–160. [Google Scholar] [CrossRef]
- Longstreth, W.T. Jr.; Dennis, L.K.; McGuire, V.M.; Drangsholt, M.T.; Koepsell, T.D. Epidemiology of intracranial meningioma. Cancer 1993, 72, 639–648. [Google Scholar] [CrossRef] [PubMed]
- Preston-Martin, S.; White, S.C. Brain and salivary gland tumors related to prior dental radiography: implications for current practice. J Am Dent Assoc 1990, 120, 151–158. [Google Scholar] [CrossRef]
- Horn-Ross, P.L.; Ljung, B.M.; Morrow, M. Environmental factors and the risk of salivary gland cancer. Epidemiology 1997, 8, 414–419. [Google Scholar] [CrossRef] [PubMed]
- Hallquist, A.; Hardell, L.; Degerman, A.; Wingren, G.; Boquist, L. Medical diagnostic and therapeutic ionizing radiation and the risk for thyroid cancer: a case-control study. Eur J Cancer Prev 1994, 3, 259–267. [Google Scholar] [CrossRef]
- Yamaji, M.; Ishiguchi, T.; Koyama, S.; Ikeda, S.; Kitagawa, A.; Hagihara, M.; Itoh, Y.; Nakamura, M.; Ota, T.; Suzuki, K. Distribution of scatter radiation by C-arm cone-beam computed tomography in angiographic suite: measurement of doses and effectiveness of protection devices. Nagoya J Med Sci 2021, 83, 277–286. [Google Scholar]
- Hoogeveen, R.C.; van Beest, D.; Berkhout, E. Ambient dose during intraoral radiography with current techniques: part 3: effect of tube voltage. Dentomaxillofac Radiol 2021, 50, 20190362. [Google Scholar] [CrossRef]
- Lope, V.; Pérez-Gómez, B.; Aragonés, N.; López-Abente, G.; Gustavsson, P.; Floderus, B.; Dosemeci, M.; Silva, A.; Pollán, M. Occupational exposure to ionizing radiation and electromagnetic fields in relation to the risk of thyroid cancer in Sweden. Scand J Work Environ Health 2006, 32, 276–84. [Google Scholar] [CrossRef]
- Alcaraz, M.; Navarro, C.; Vicente, V.; Canteras, M. Dose reduction of intraoral dental radiography in Spain. Dentomaxillofac Radiol 2006, 35, 295–298. [Google Scholar] [CrossRef] [PubMed]
- Rolofson, J.W.; Hamel, A.; Stewart, H.F. Radiation isoexposure curves about a dental chair during radiography. J Am Dent Assoc 1969, 78, 310–319. [Google Scholar] [CrossRef] [PubMed]
- Sont, W.N.; Zielinski, J.M.; Ashmore, J.P.; Jiang, H.; Krewski, D.; Fair, M.E.; Band, P.R.; Létourneau, E.G. First analysis of cancer incidence and occupational radiation exposure based on the National Dose Registry of Canada. Am J Epidemiol 2001, 153, 309–318. [Google Scholar] [CrossRef] [PubMed]
- Langer, S.G.; Gray, J.E. Radiation shielding implications of computed tomography scatter exposure to the floor. Health Phys 1998, 75, 193–196. [Google Scholar] [CrossRef]
- Chan, C.B.; Chan, L.K.; Lam, H.S. Scattered radiation level during videofluoroscopy for swallowing study. Clin Radiol 2002, 57, 614–616. [Google Scholar] [CrossRef]
- Horner, K.; Equipment HPAWPODCBCT. Guidance on the Safe Use of Dental Cone Beam CT (Computed Tomography) Equipment. 1st ed. Health Protection Agency (HPA CRCE scientific and technical report series): Chilton, Didcot, Oxfordshire, United Kingdom, England, 2010; pp 1-64.
|
Disclaimer/Publisher’s Note: The statements, opinions and data contained in all publications are solely those of the individual author(s) and contributor(s) and not of MDPI and/or the editor(s). MDPI and/or the editor(s) disclaim responsibility for any injury to people or property resulting from any ideas, methods, instructions or products referred to in the content. |
© 2023 by the authors. Licensee MDPI, Basel, Switzerland. This article is an open access article distributed under the terms and conditions of the Creative Commons Attribution (CC BY) license (http://creativecommons.org/licenses/by/4.0/).
