1. Introduction
The growth and development of the dentition and the jawbone are influenced by genetic and non-genetic environmental factors [
1,
2]. Enlow et al. reported that growth and development of the region above the base of the nasal cavity is related to growth of the cranial base, sutural growth, and development of respiratory function, whereas growth and development below the base of the nasal cavity is closely linked to mandibular function from the masticatory muscles [
3,
4,
5]. In particular, the acquisition of masticatory muscle function is thought to play a major role in the growth and development of the lower face, including the mandible, and the activity of masticatory and perioral muscles is an important factor in the growth of the lower face [
6,
7]. It has been shown that there is a relationship between abnormal function of the masticatory muscles and underdevelopment of the jawbone during the period of growth and development, suggesting that imbalance in the function of the masticatory muscles on either side may be an environmental factor causing malocclusion [
8,
9]. Dysfunction of the perioral muscles, as an environmental factor, can adversely affect oral functions such as chewing, swallowing, pronunciation, and breathing, and can cause an imbalance in perioral muscle functional pressure, which in turn affects dental morphology [
10]. Furthermore, it can inhibit normal jawbone growth and development in children, causing oral-facial morphology abnormalities [
11]. Oral myofunctional disorders are environmental factors in the development of malocclusion and also cause dental problems such as retroversion of orthodontic treatment, periodontal disease, and noncompliance with dental prosthetics [
12,
13]. Stahl et al. children with malocclusion and perioral muscle disharmony are common, with a prevalence of oral-facial dysfunction of 61.6% in children with deciduous dentition and 80.8% in children with mixed dentition [
14].
In view of this, correct adjustment of abnormal muscle function pressure is thought to promote healthy growth of the jawbone as well as the dentition, and is widely practiced as oral myofunctional therapy [
15]. Improving the function of the perioral muscles through oral myofunctional therapy is one solution to problems caused by imbalances in oral muscle functional pressure, as it creates an environment that maintains the normal morphology of the jawbone and dentition [
11]. Oral myofunctional therapy involves training individual muscles, chewing, swallowing, pronunciation, and resting lip and tongue position to eliminate laxity and overstrain of the perioral muscles and to balance and maintain functional pressure throughout the dentition [
16]. It is believed that improving oral function leads to the removal of environmental factors that establish malocclusion, and thus the dentition and occlusion are naturally guided to a normal form without the use of orthodontic appliances, and that the combination of orthodontic treatment and MFT can provide stability of the dentition after treatment The combination of orthodontic treatment and MFT is thought to provide stability of the post-treatment dentition [
12]. However, the mechanical environment regulating the homeostasis of the jawbone is complex, and further evidence based on quantitative evaluations is needed to ensure effective oral myofunctional therapy.
There have been numerous attempts to quantitatively evaluate the mechanical environment of bone, and analytical methods have been developed for bone mass and other bone morphometry [
17,
18]. In particular, since it was reported that the micro/nanostructural properties of bone are greatly reflected in bone strength, research using material engineering methods for analysis of bone quality has been carried out to accurately predict the mechanical function of bone [
19,
20,
21]. Studies have shown that the main extracellular matrix of collagen fibres and biological apatite (BAp) crystals is a major factor in resistance to stress on bony tissue, and that collagen fibres resist tensile stress, whereas BAp crystals resist compressive stress [
22,
23]. Warshaw et al. showed that the mechanical environment and anisotropy of collagen fibre orientations within the bone are important factors reflecting the mechanical function of bone in the direction of the load [
24]. On the other hand, Nakano et al. used microbeam X-ray diffraction analysis to quantitatively evaluate BAp crystal orientation in whole-body bone in experimental animals and found a high correlation between bone strength and BAp crystal orientation [
17,
18]. Since bone quality factors strongly reflect the local loading environment, it is possible to predict the mechanical function of the jawbone with a high degree of accuracy by quantitative evaluation of the histomorphology and anisotropy of the micro/nanostructure of entheses of the masticatory muscles attach.
Seok et al. reported that botulinum toxin-induced imbalance of bilateral masticatory muscle functional pressure affects mandibular growth and causes jaw deformity in growing rats [
25]. Kusaba et al. studied a model of unilateral masticatory muscle hypofunction induced by botulinum toxin, and they found histological changes and decreased bone quality at the entheses where the functional pressure had been reduced. They suggest that this structural change may be involved in deformation of the jawbone during growth and development [
26].
The objective of this study was therefore to perform a quantitative evaluation of changes in the micro/nanostructural characteristics of entheses in growing rats with reduced unilateral masticatory muscle functional pressure that was subsequently restored, with the aim of clarifying what effect correction of bilateral imbalance of masticatory muscle functional pressure that occurred during the early growth period may have on deformation of the jaw that has already developed.
2. Materials and Methods
This animal experiment was conducted in accordance with the guidelines for animal experiments of Tokyo Dental College (ethical review application no. 213105). Invasive procedures were kept to a minimum to reduce suffering in the experimental animals.
2.1. Experimental Animals
A total of 100, 4-week-old, male, Wistar rats were divided into an experimental group (BTX group, n=50), which were injected with Botulinum toxin serotype A (BoNT/A; Botox®, Allergan Pharmaceuticals, Dublin, Ireland), and a control group (CTRL group, n=50). The experimental animals were reared in plastic cages with free access to water and solid food.
2.2. Experimental Procedures
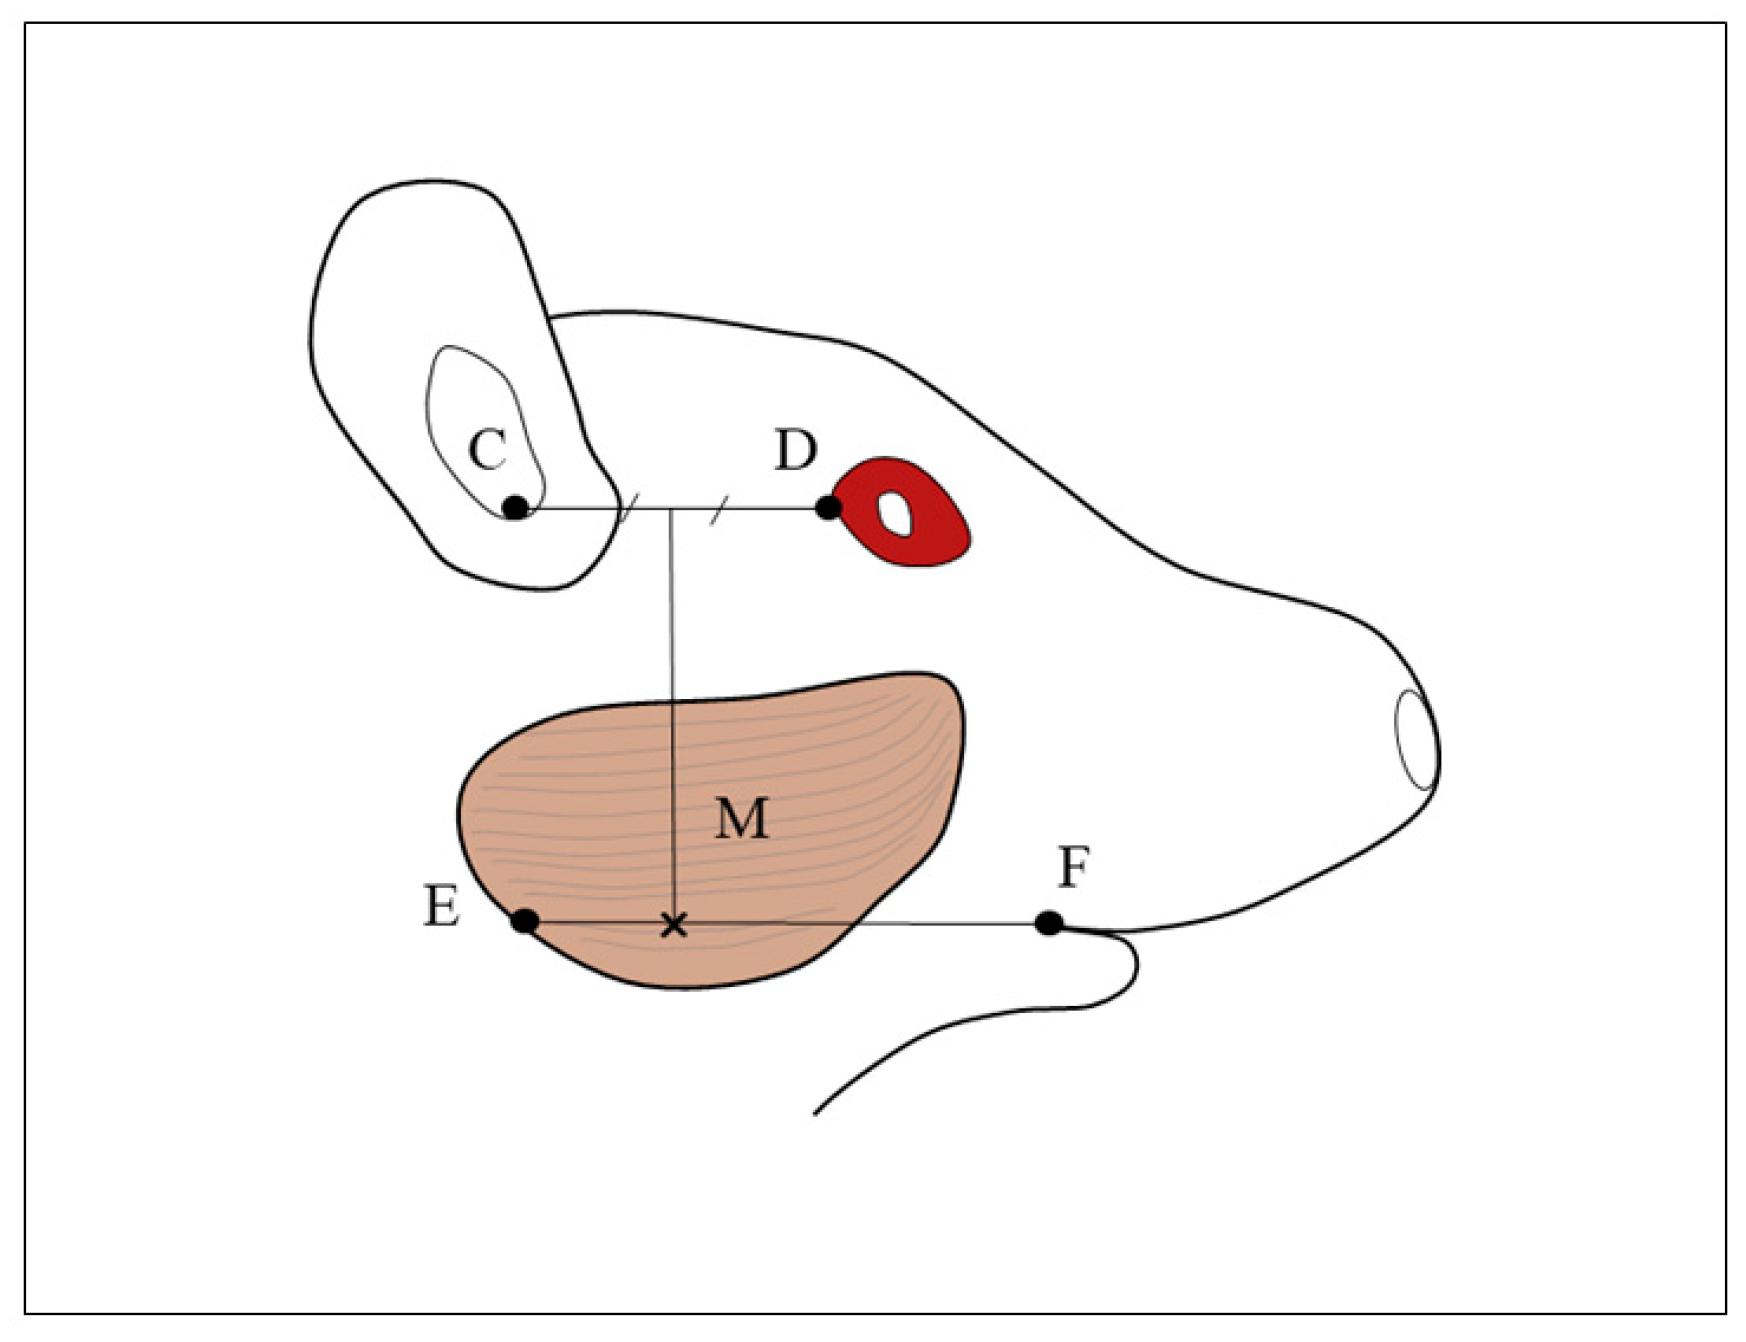
The experimental animals were given general anaesthesia by intraperitoneal administration of a combination of three anaesthetics (medetomidine hydrochloride, 0.75 mg/kg, Nippon Zenyaku Kogyo Co., Ltd., Fukushima, Japan; midazolam, 4.0 mg/kg, Sandoz K.K., Tokyo, Japan; butorphanol tartrate, 5.0 mg/kg, Meiji Seika Pharma Co., Ltd., Tokyo, Japan). Rats in the BTX group were injected in the right masseter at the angle of the mandible with 5.0 U (0.3 ml) of BoNT/A diluted with physiological saline (
Figure 1). Rats in the CTRL group were injected in the right masseter with 0.3 ml of physiological saline. The rats were reared for 6, 8, 10, 12, or 16 weeks and then euthanized under deep anaesthesia, and the mandibles were harvested for examination. Before euthanasia, the difference between the midline of the upper and lower incisors of the BTX group was measured.
2.3. Measurement of Weight
Following euthanasia, the rats were weighed, the masseter was harvested from the origin of the muscle on the zygomatic arch and the insertion on the mandible, and the muscle was weighed.
2.4. Setting the Region of Interest
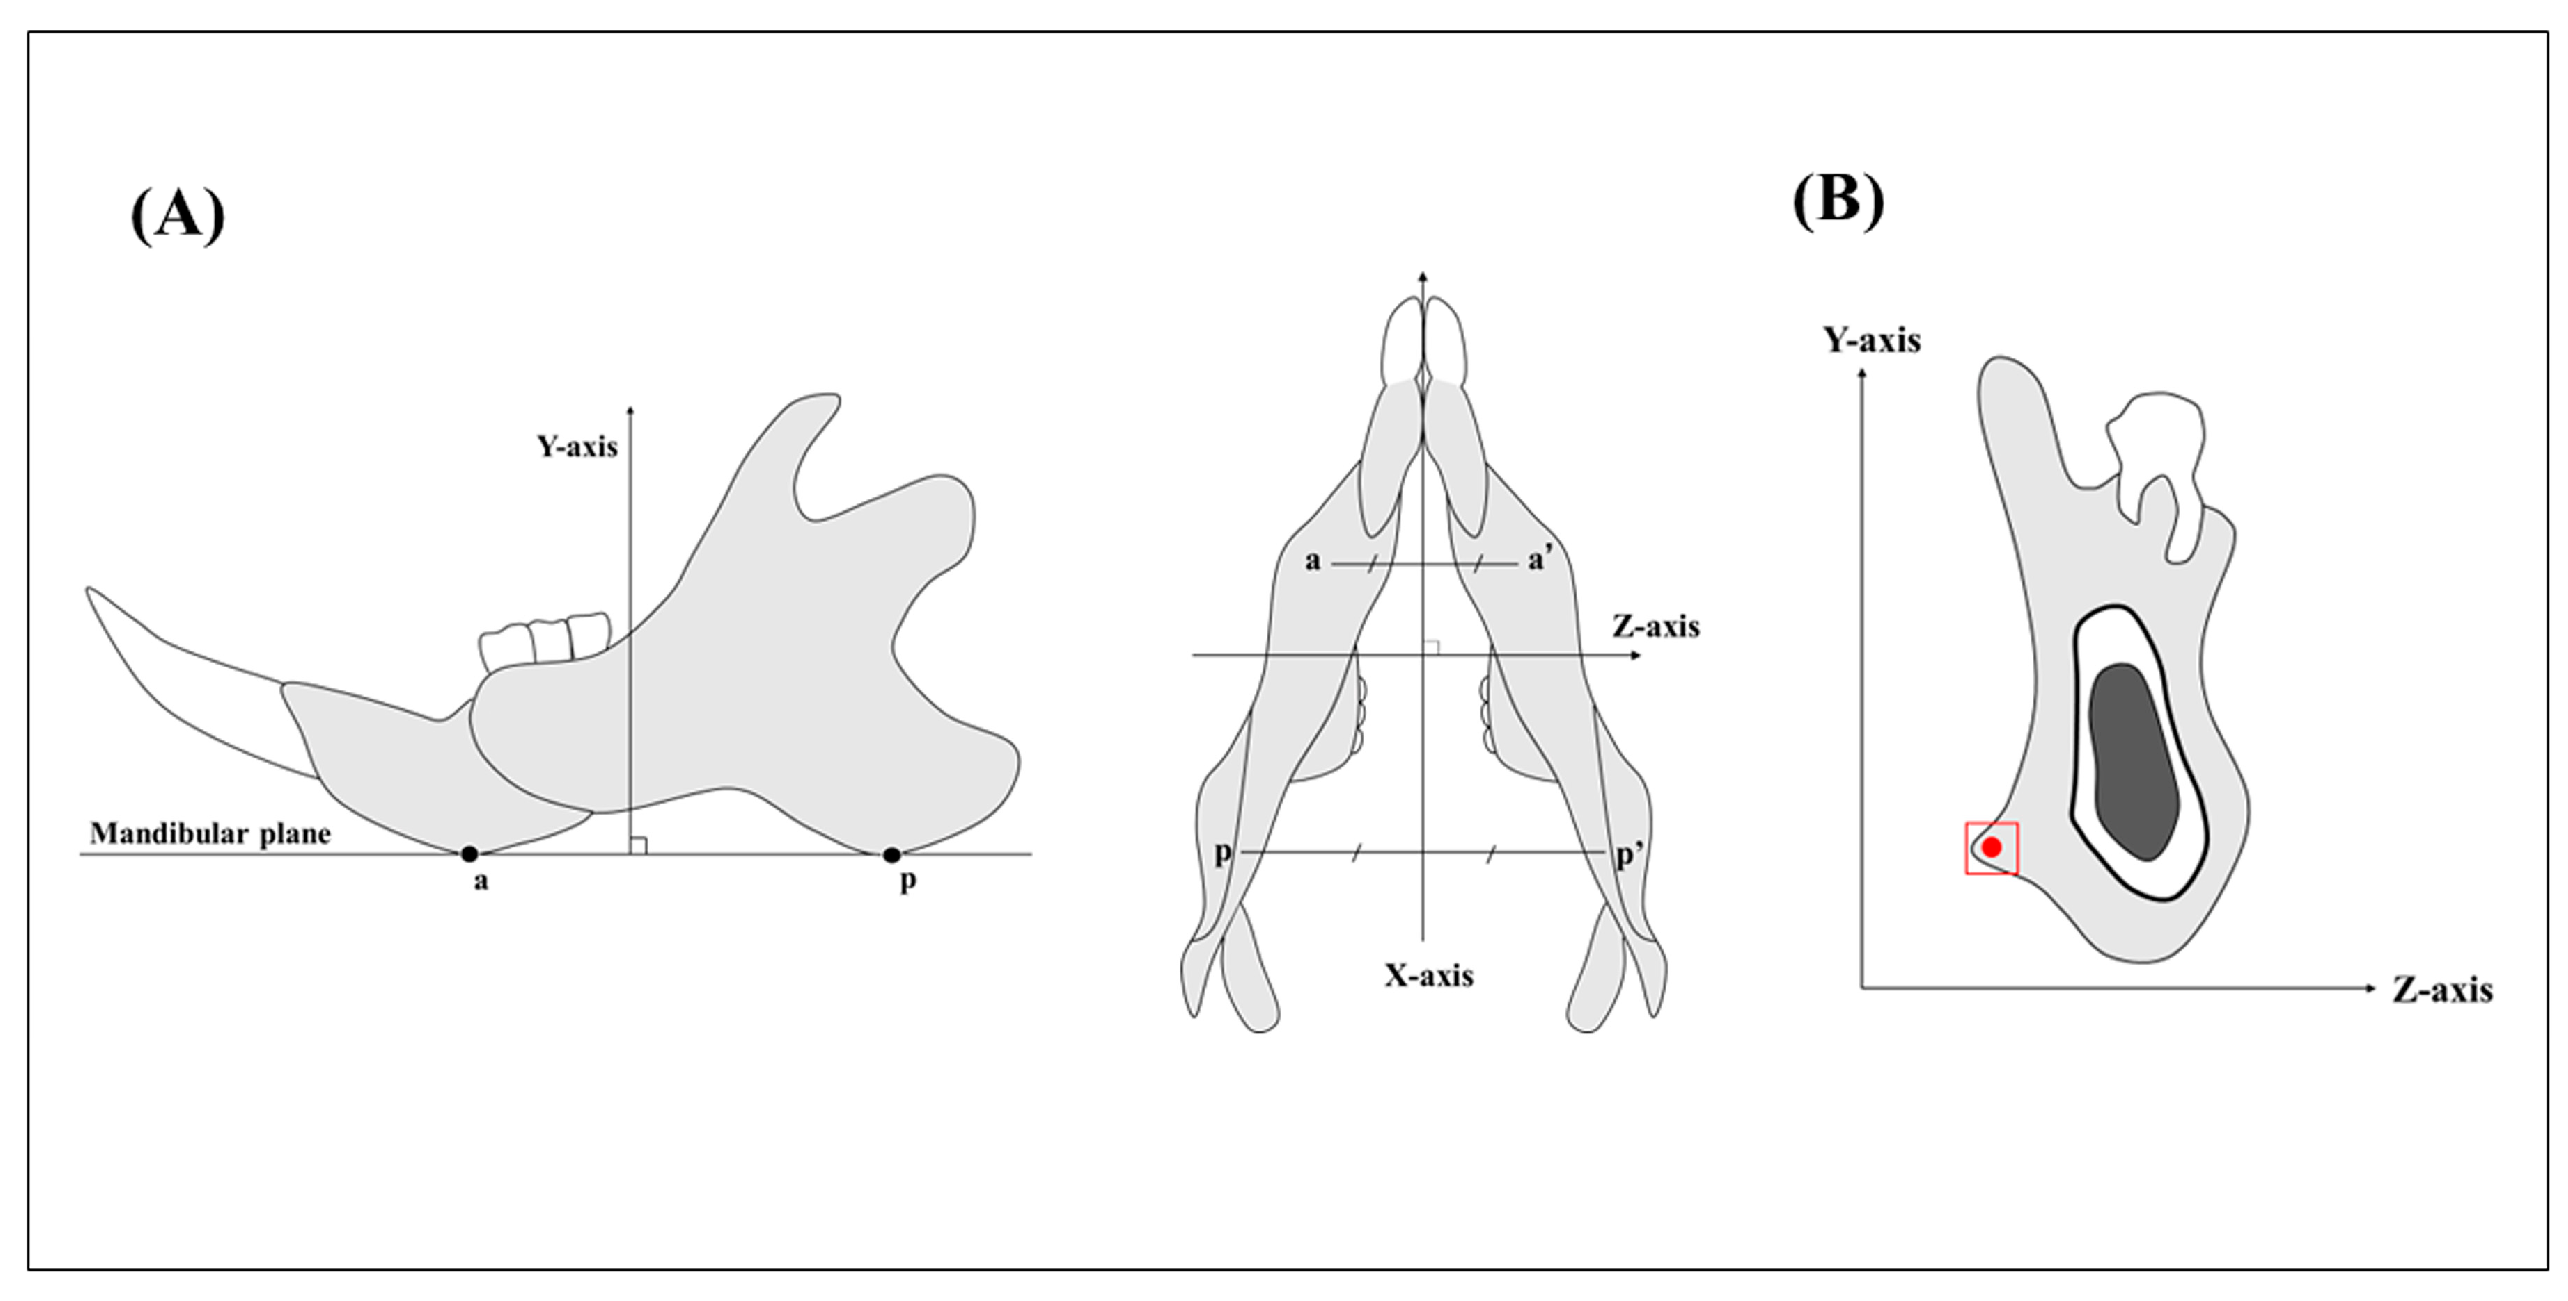
The basic axes of the mandibles were set by taking the mesiodistal direction as the X-axis, the direction perpendicular to the mandibular plane as the Y-axis, and the labiolingual direction as the Z-axis (
Figure 2A). The region of interest was set as the mandibular third molar region (
Figure 2B).
2.5. Tissue Slice Preparation
The specimens were fixed in 4% paraformaldehyde phosphate buffer solution and decalcified for 4 weeks in 10% ethylenediaminetetraacetic acid. They were then embedded in paraffin according to the usual method. Thin slices were taken along the YZ plane (frontal section), and they were then stained by Masson’s trichrome method. After staining, the thickness of the tendon at the tendon-bone margin was measured. The masseters were haematoxylin-eosin-stained, and the mean cross-sectional area of each masseter muscle fibre in an area of 500 µm2 was calculated. Specimens were also embedded in cold-curing acrylic resin (SCANDIPLEX, SCAN-DIA, Hagen, Germany) for the preparation of polished specimens. The cured blocks were sliced in the XY plane through the 3rd molar region using a saw microtome (SP1600, Leica, Wetzlar, Germany) with a blade width of 300 µm. The slices were then sanded using waterproof abrasive paper (#400, #800, and #1200) to produce polished specimens 200 µm in thickness.
2.6. Second Harmonic Generation Imaging
Second harmonic generation (SHG) images were acquired using a multiphoton confocal microscope system (LSM880 NLO, Carl Zeiss, Jena, Germany) with an excitation laser (Chameleon Vision II; wavelengths: 680-1,080 nm, repetition rate: 80 MHz, pulse width: 140 fs; Coherent Inc., Santa Clara, CA, USA) and an objective lens (Plan-Apochromat 20x/0.8 M27, Carl Zeiss). Following image acquisition, the collagen fibre bundles were quantitatively evaluated using Imaris 8.4 software (Bitplane AG, Zurich, Switzerland). Collagen fibres with thickness greater than 375 nm, which can be imaged with multiphoton excitation phase-contrast microscopy, were extracted as collagen fibre bundles. Evaluation was carried out by tracing the collagen fibre bundles within the bone in approximately 200 µm2 of the mandibular masseter muscle prominence and calculating the mean diameter [
27].
2.7. BAp Crystal Alignment
BAp crystal alignment was quantitatively evaluated using an optical curved imaging plate (IP) X-ray diffractometer (XRD; D/MAX RAPID II-CMF, Rigaku Corporation, Tokyo, Japan). Measurements were taken from the masseter muscle attachment at the third molar of 200-µm-thick, undecalcified, polished specimens. The irradiation field was irradiated with X-rays using the optical microscope (×0.6–4.8 magnification) attached to the XRD so that the incident beam was circular with a diameter of 100 µm. Measurements were made in the X-axis direction using the reflecting optical system, and in the Y- and Z-axis directions using the transmission optical system, both using Cu-Kα radiation as the beam source. The tube voltage was set to 40 kV, with the tube current at 30 mA, and the diffracted X-ray beam was detected using a curved IP. The analysis conditions were set according to the method of Nakano et al. [
18]. 2D Data Processing software (Rigaku, Japan) was used to calculate the X-ray intensity ratios of the two diffraction peaks in the 002 and 310 planes from the diffraction ring images.
2.8. Statistical Analysis
For statistical analysis, means were calculated, and one-way analysis of variance (ANOVA) and T-test were used. p <0.05 was considered statistically significant.
3. Results
3.1. Incisor Midline
In the BTX group, there was a large difference in the midline of the upper and lower incisors. The difference in the midline decreased with each passing week and was significantly smaller after 12 weeks of BoNT/A administration compared to 6, 8, and 10 weeks after Botox administration. (
Figure 3).
3.2. Body Weight
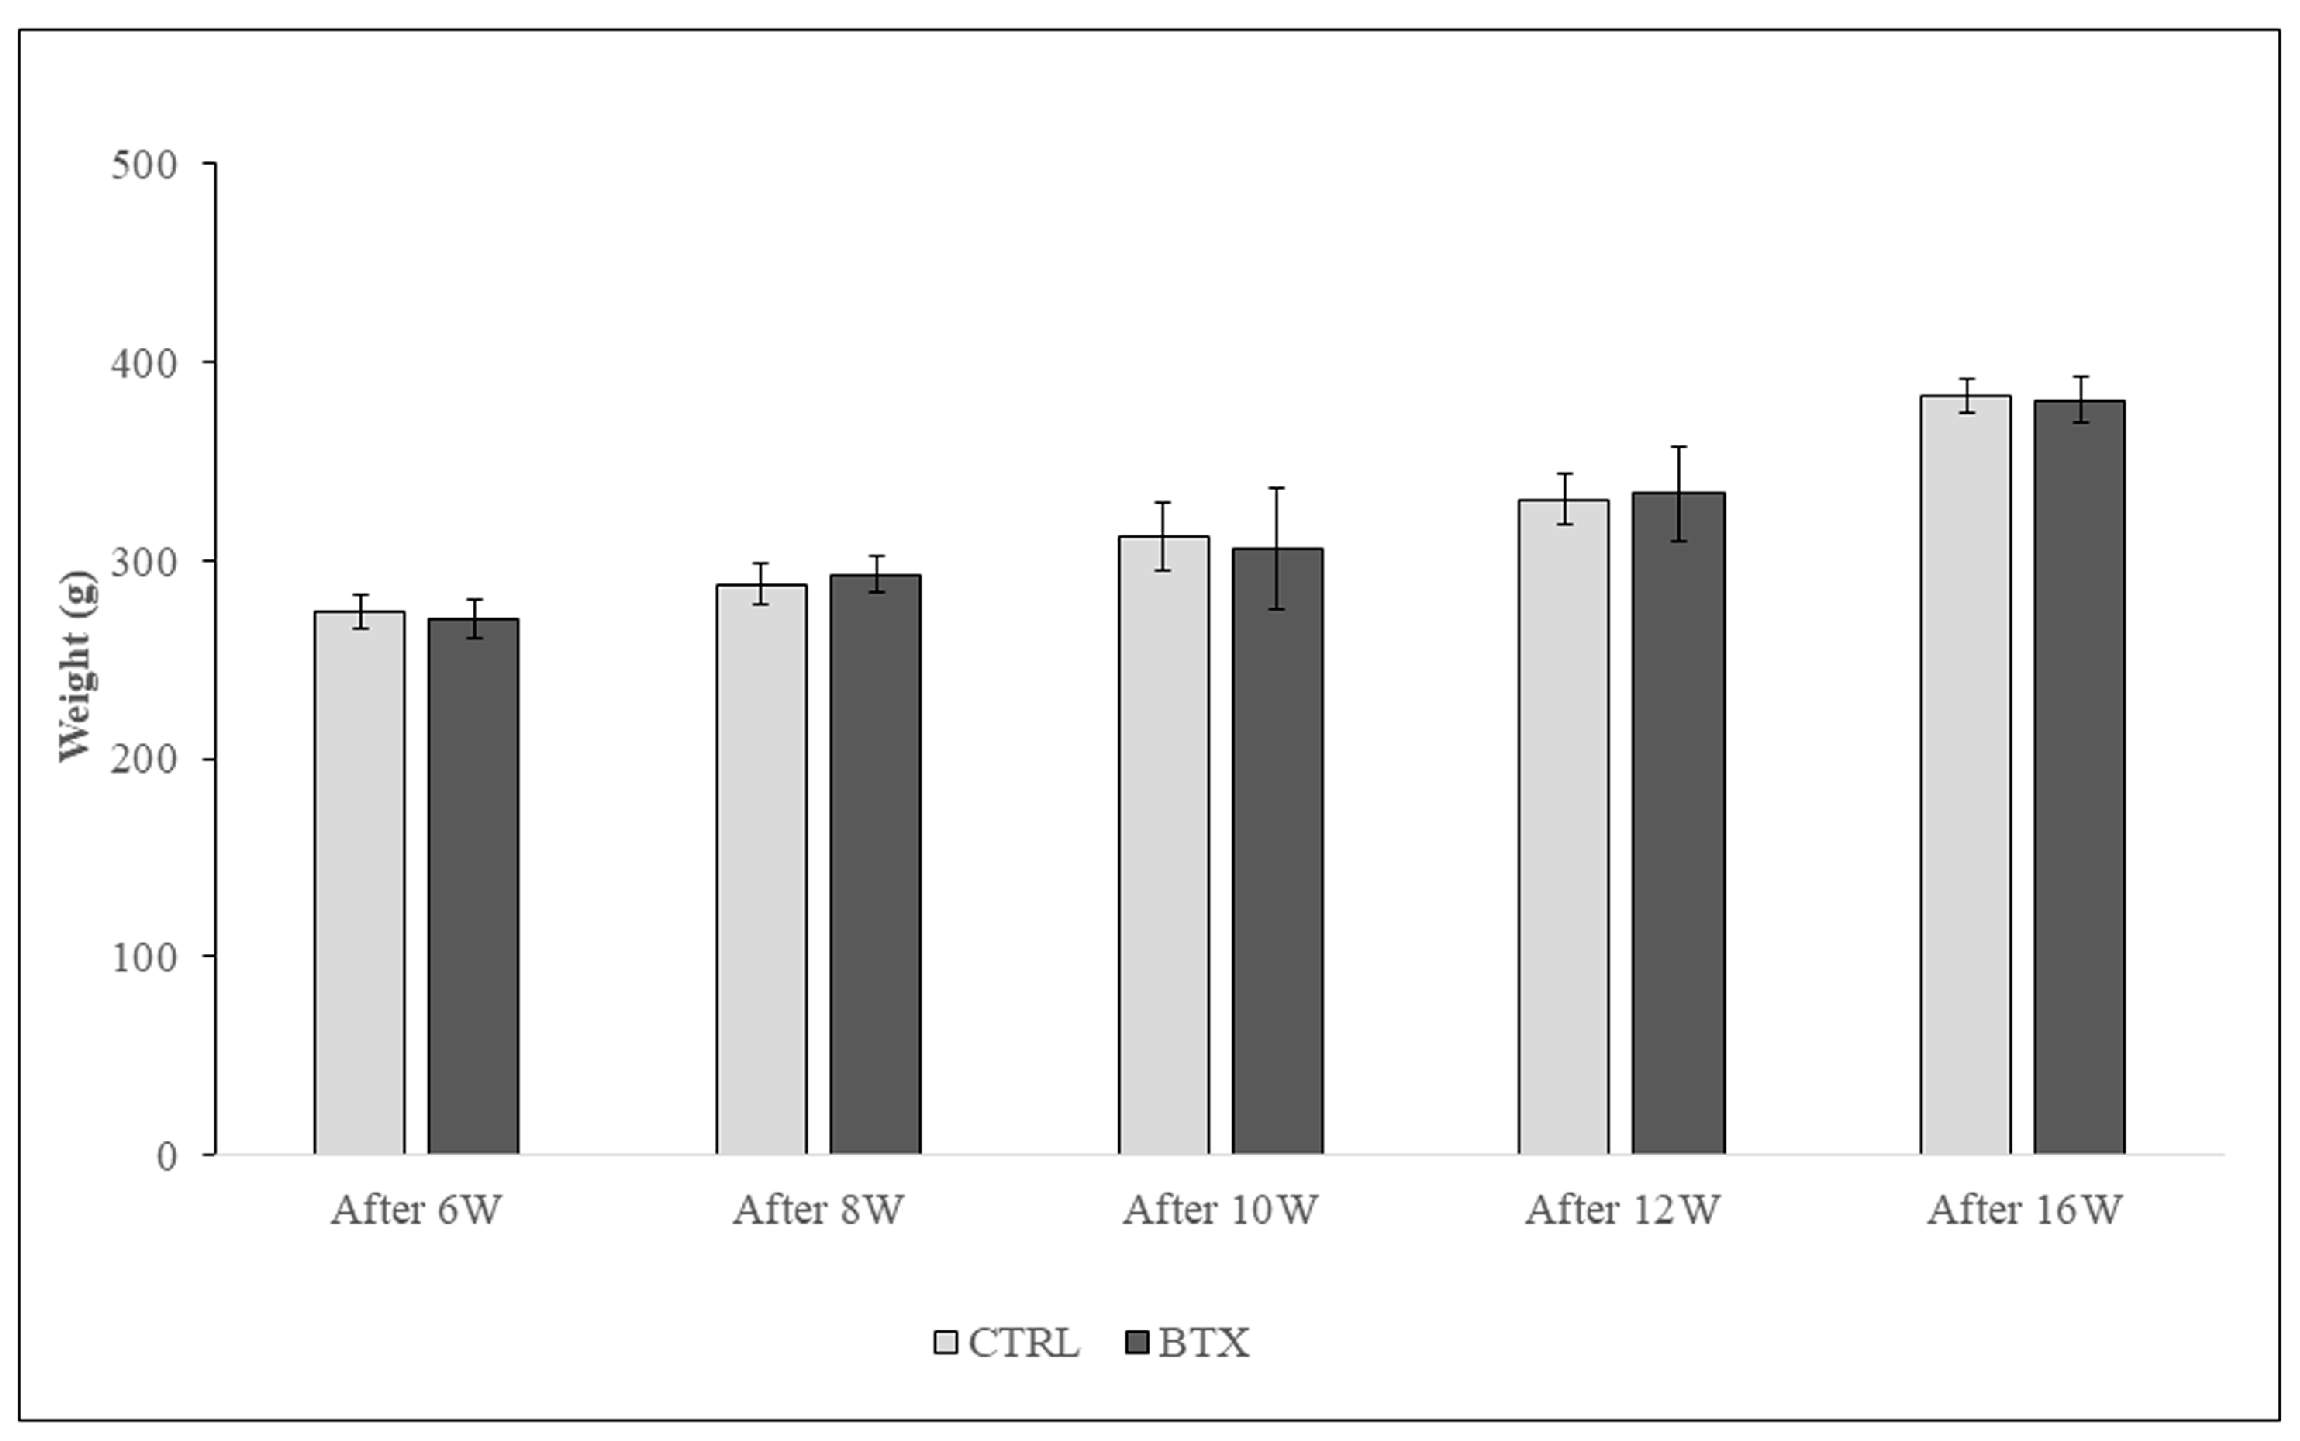
Body weight increased with the age of the rats. No significant difference in body weight was found between the BTX group and the CTRL group (
Figure 4.).
3.3. Masseter Muscle Weight
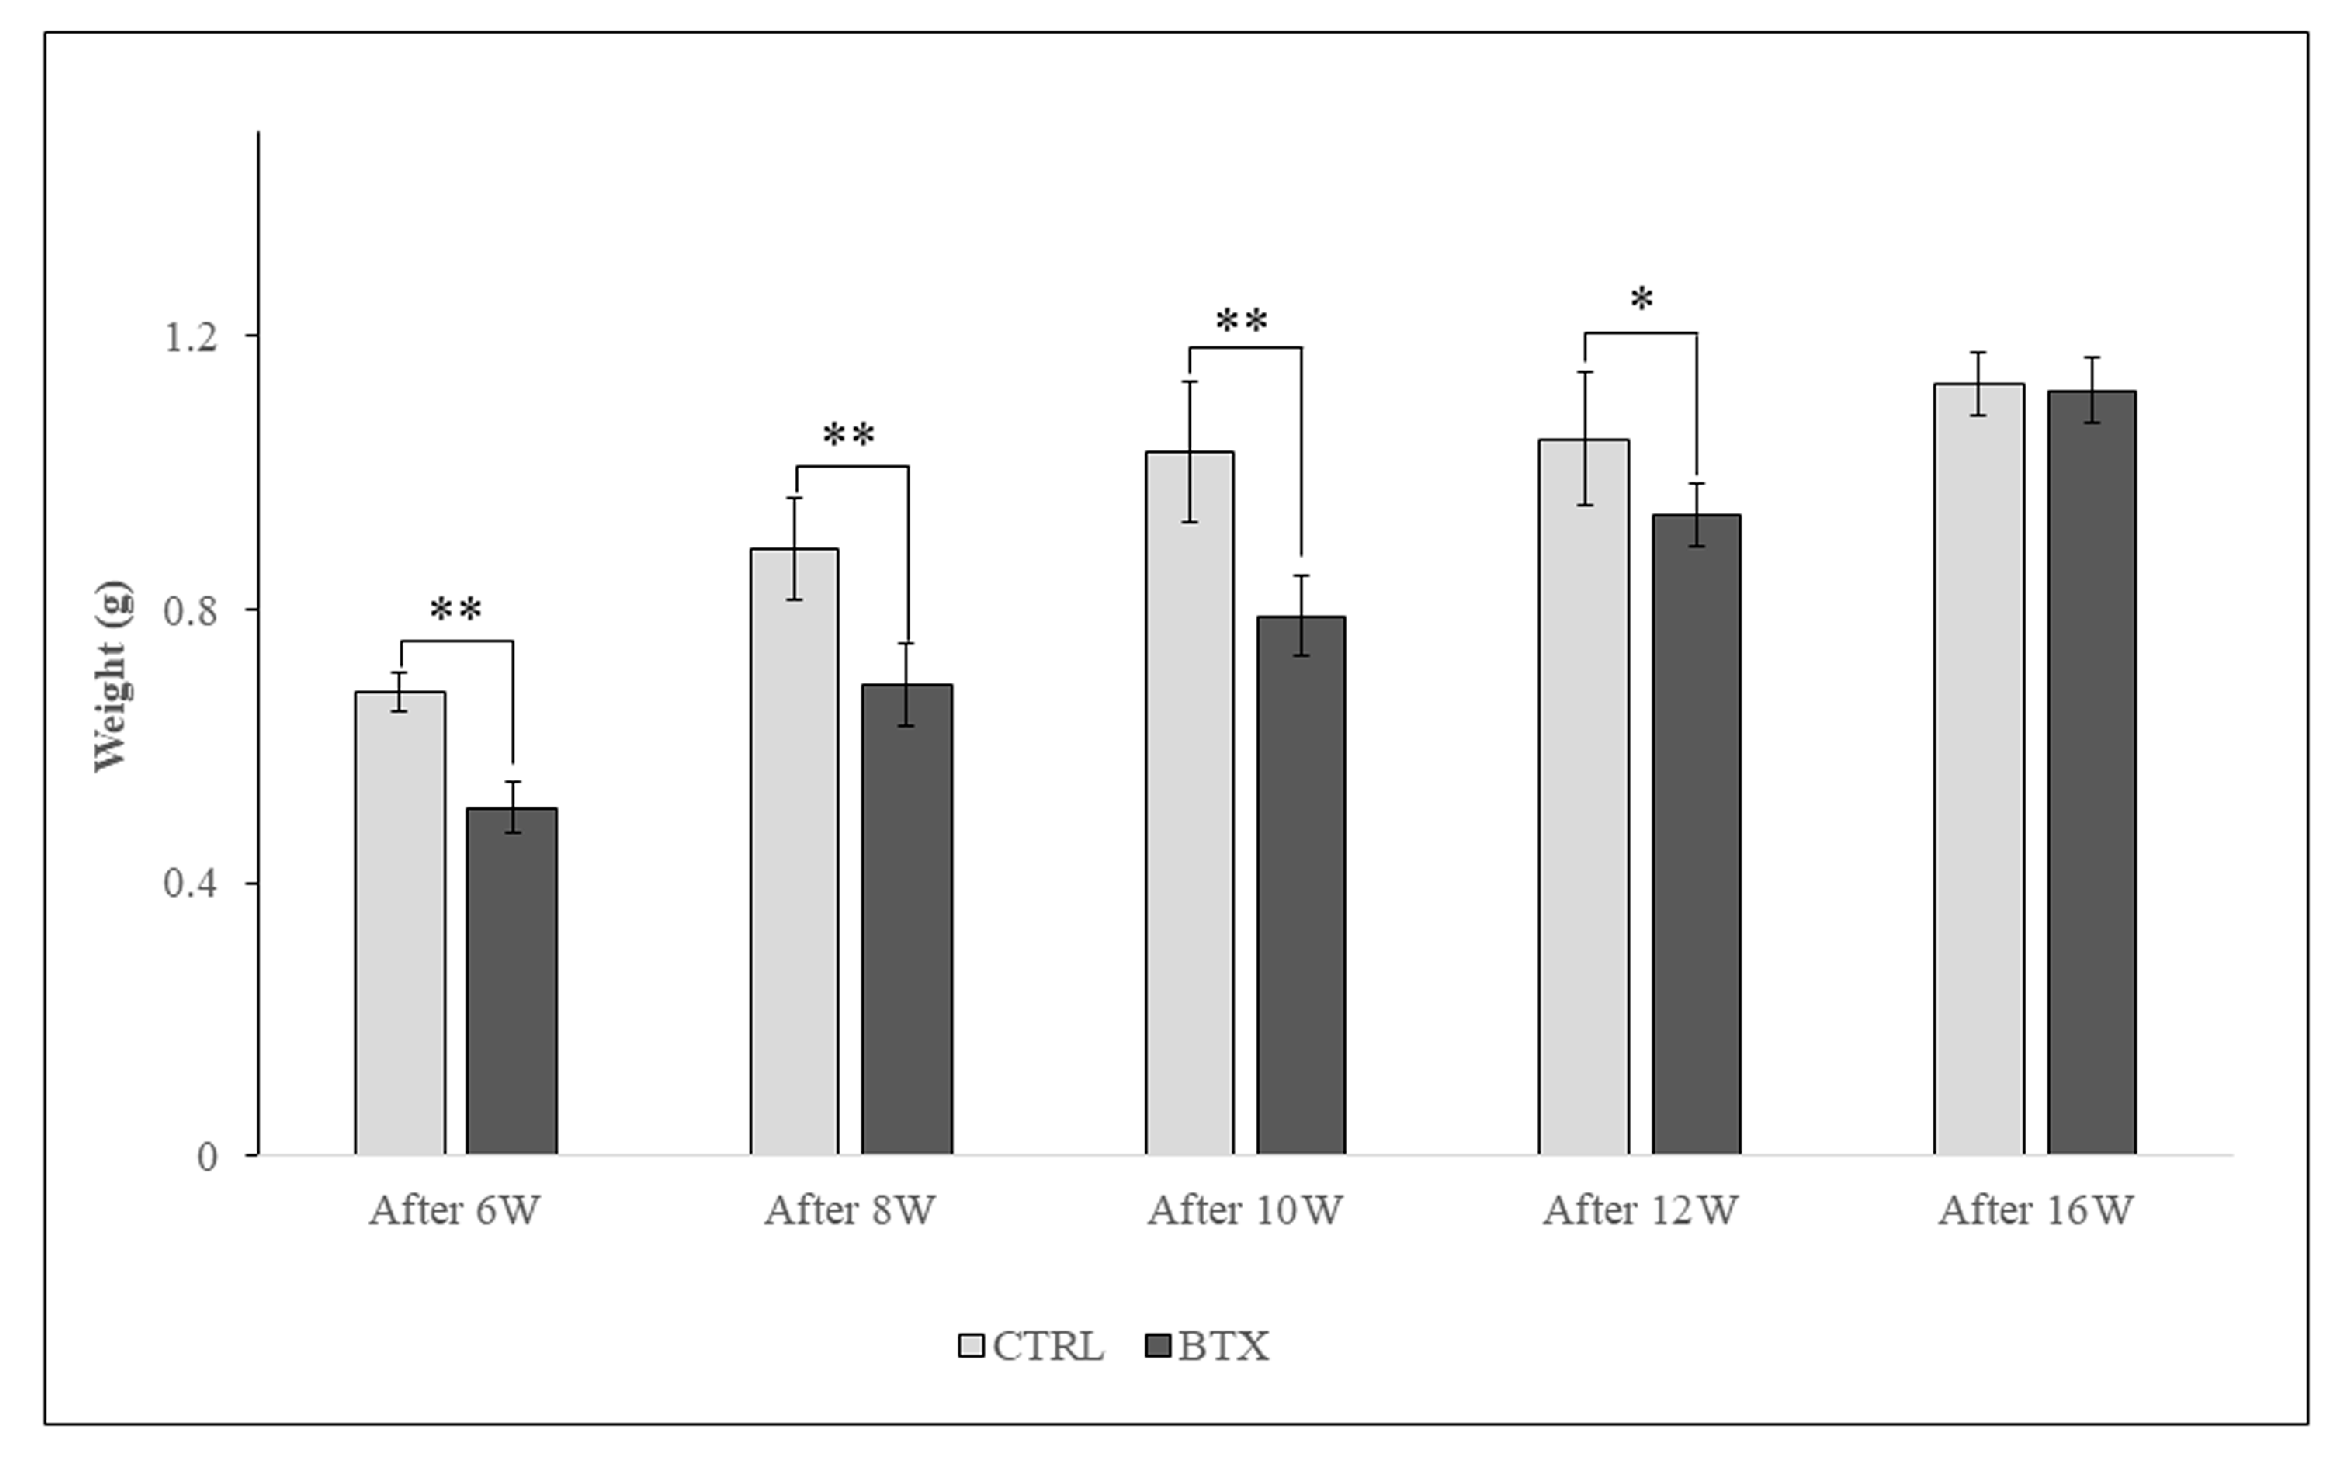
Masseter muscle weight increased with the age of the rats. From 6 weeks after BoNT/A administration to 12 weeks after administration, masseter muscle weight was significantly lower in the BTX group than in the CTRL group. At 16 weeks after administration, there was no significant difference in masseter muscle weight between the two groups (
Figure 5).
3.4. Histological Observation of Masseter Muscle Fibres
In the CTRL group, the masseter muscle fibres were closely packed with very little space between them, whereas in the BTX group, there were wide gaps between the muscle fibres and the masseter muscle fibres showed atrophy (
Figure 6A). At each age, the cross-sectional area of the masseter muscle was significantly smaller in the BTX group than in the CTRL group (
Figure 6B).
3.5. Histological Observations at the Entheses
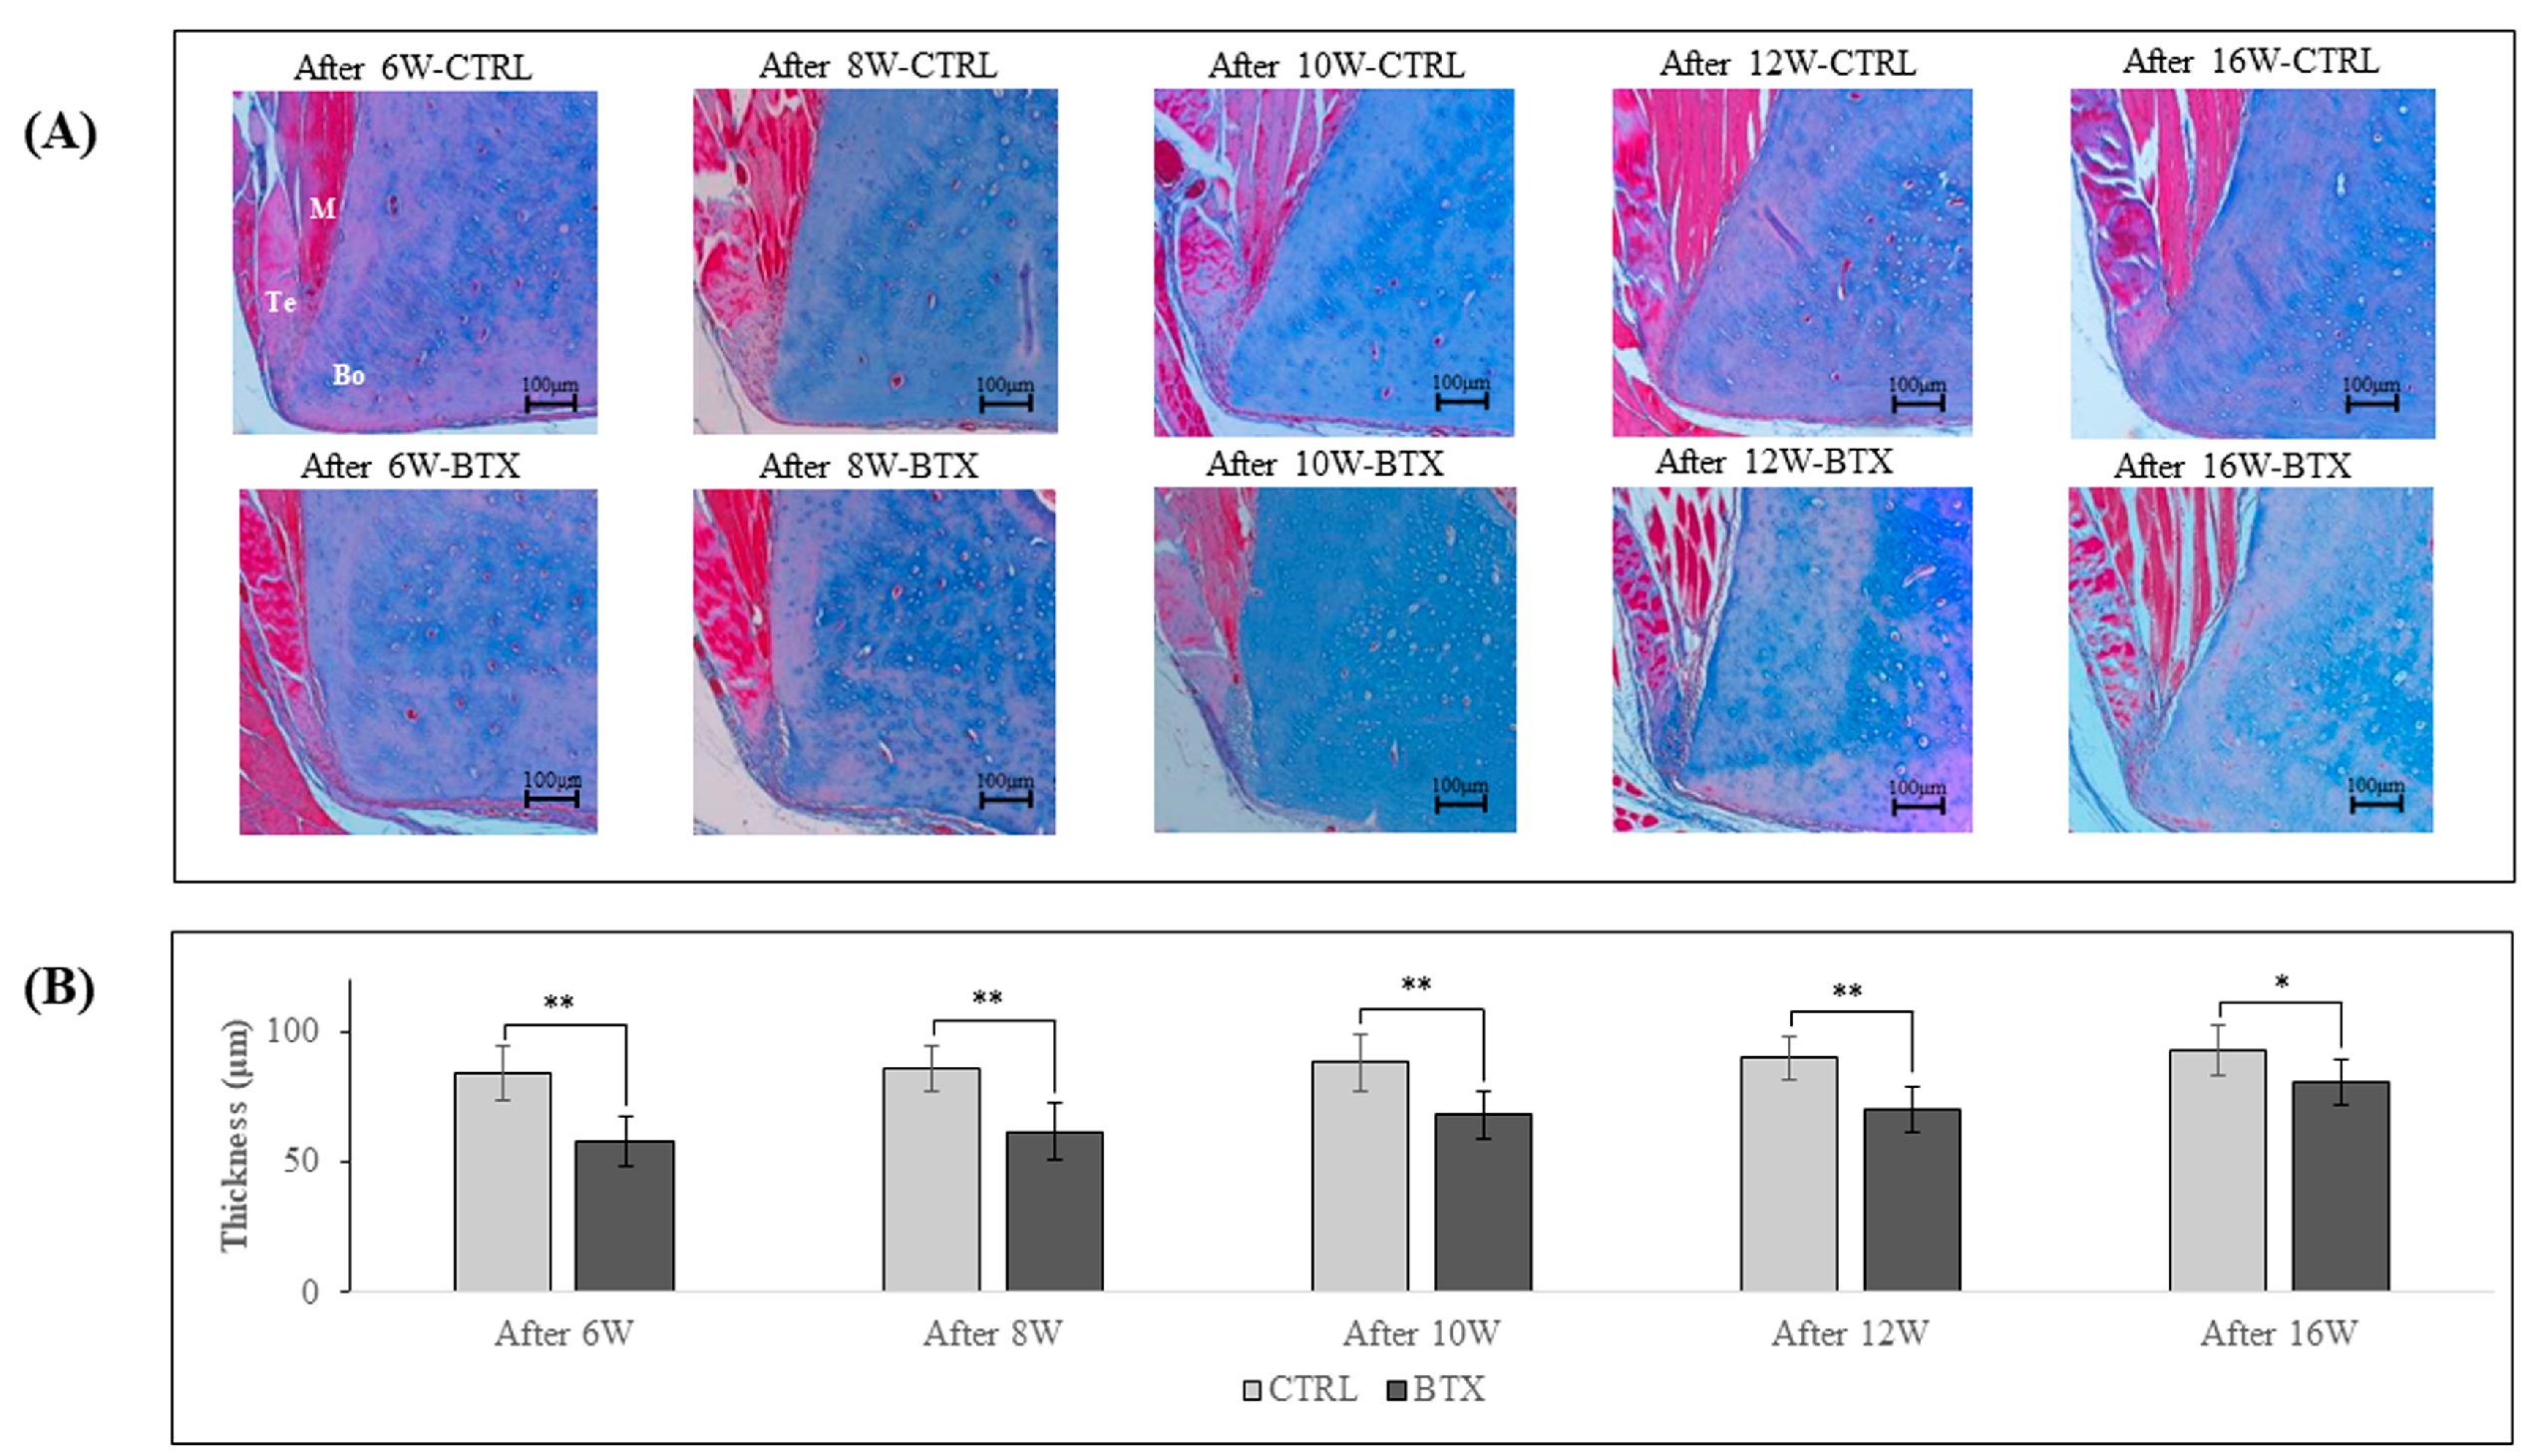
Figure 7 shows images of Masson’s trichrome staining of the third molar region of frontal sections of 6, 8, 10, 12, and 16 weeks after BoNT/A administration rats. At all ages, the masseter muscle was attached to the mandible by a tendinous insertion at the inferior margin of the masseter muscle prominence and adhered to the mandible via the periosteum at all other sites. The thickness of the ligament was significantly lower in the BTX group than in the CTRL group at all ages.
3.6. Anisotropy of Collagen Fibre Orientation
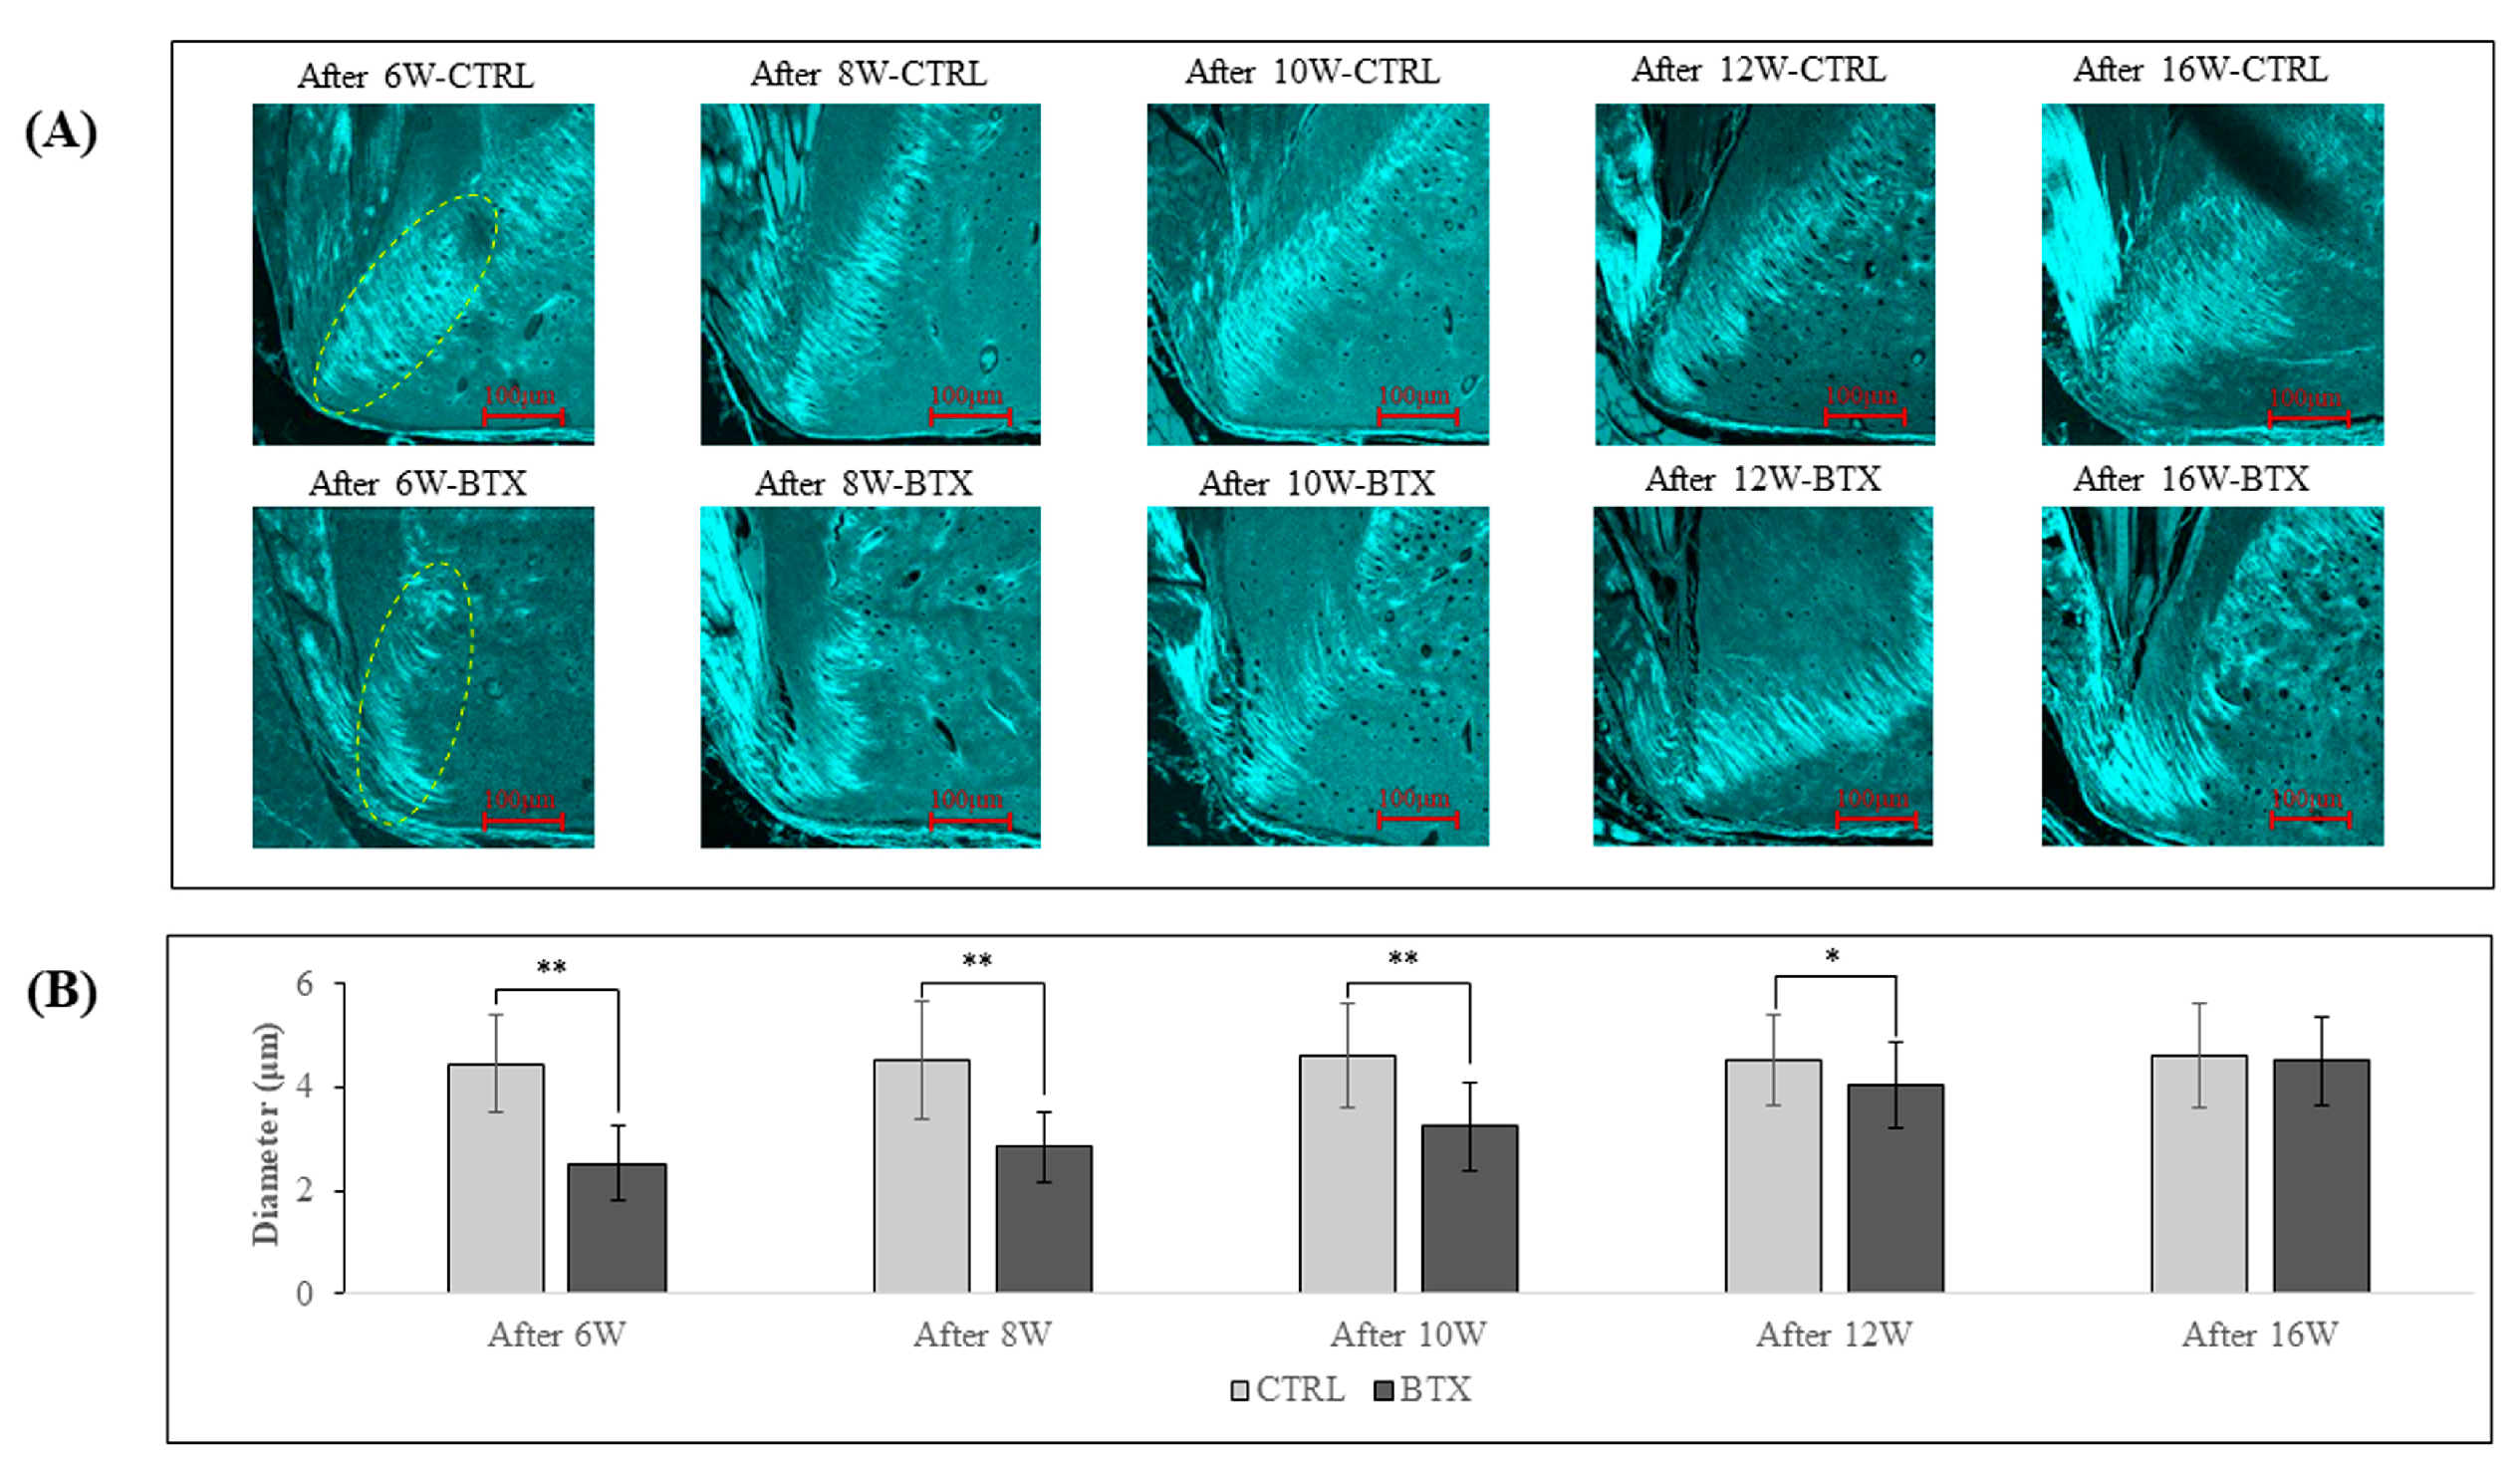
Figure 8 shows SHG imaging of the third molar region. In rats from 6 weeks after BoNT/A administration to 12 weeks after administration, the diameter of the collagen fibre bundles was significantly smaller in the BTX group than in the CTRL group. The difference between the two groups grew less with increasing age, and there was no significant difference between the groups at 16 weeks after administration.
3.7. BAp Crystal Alignment
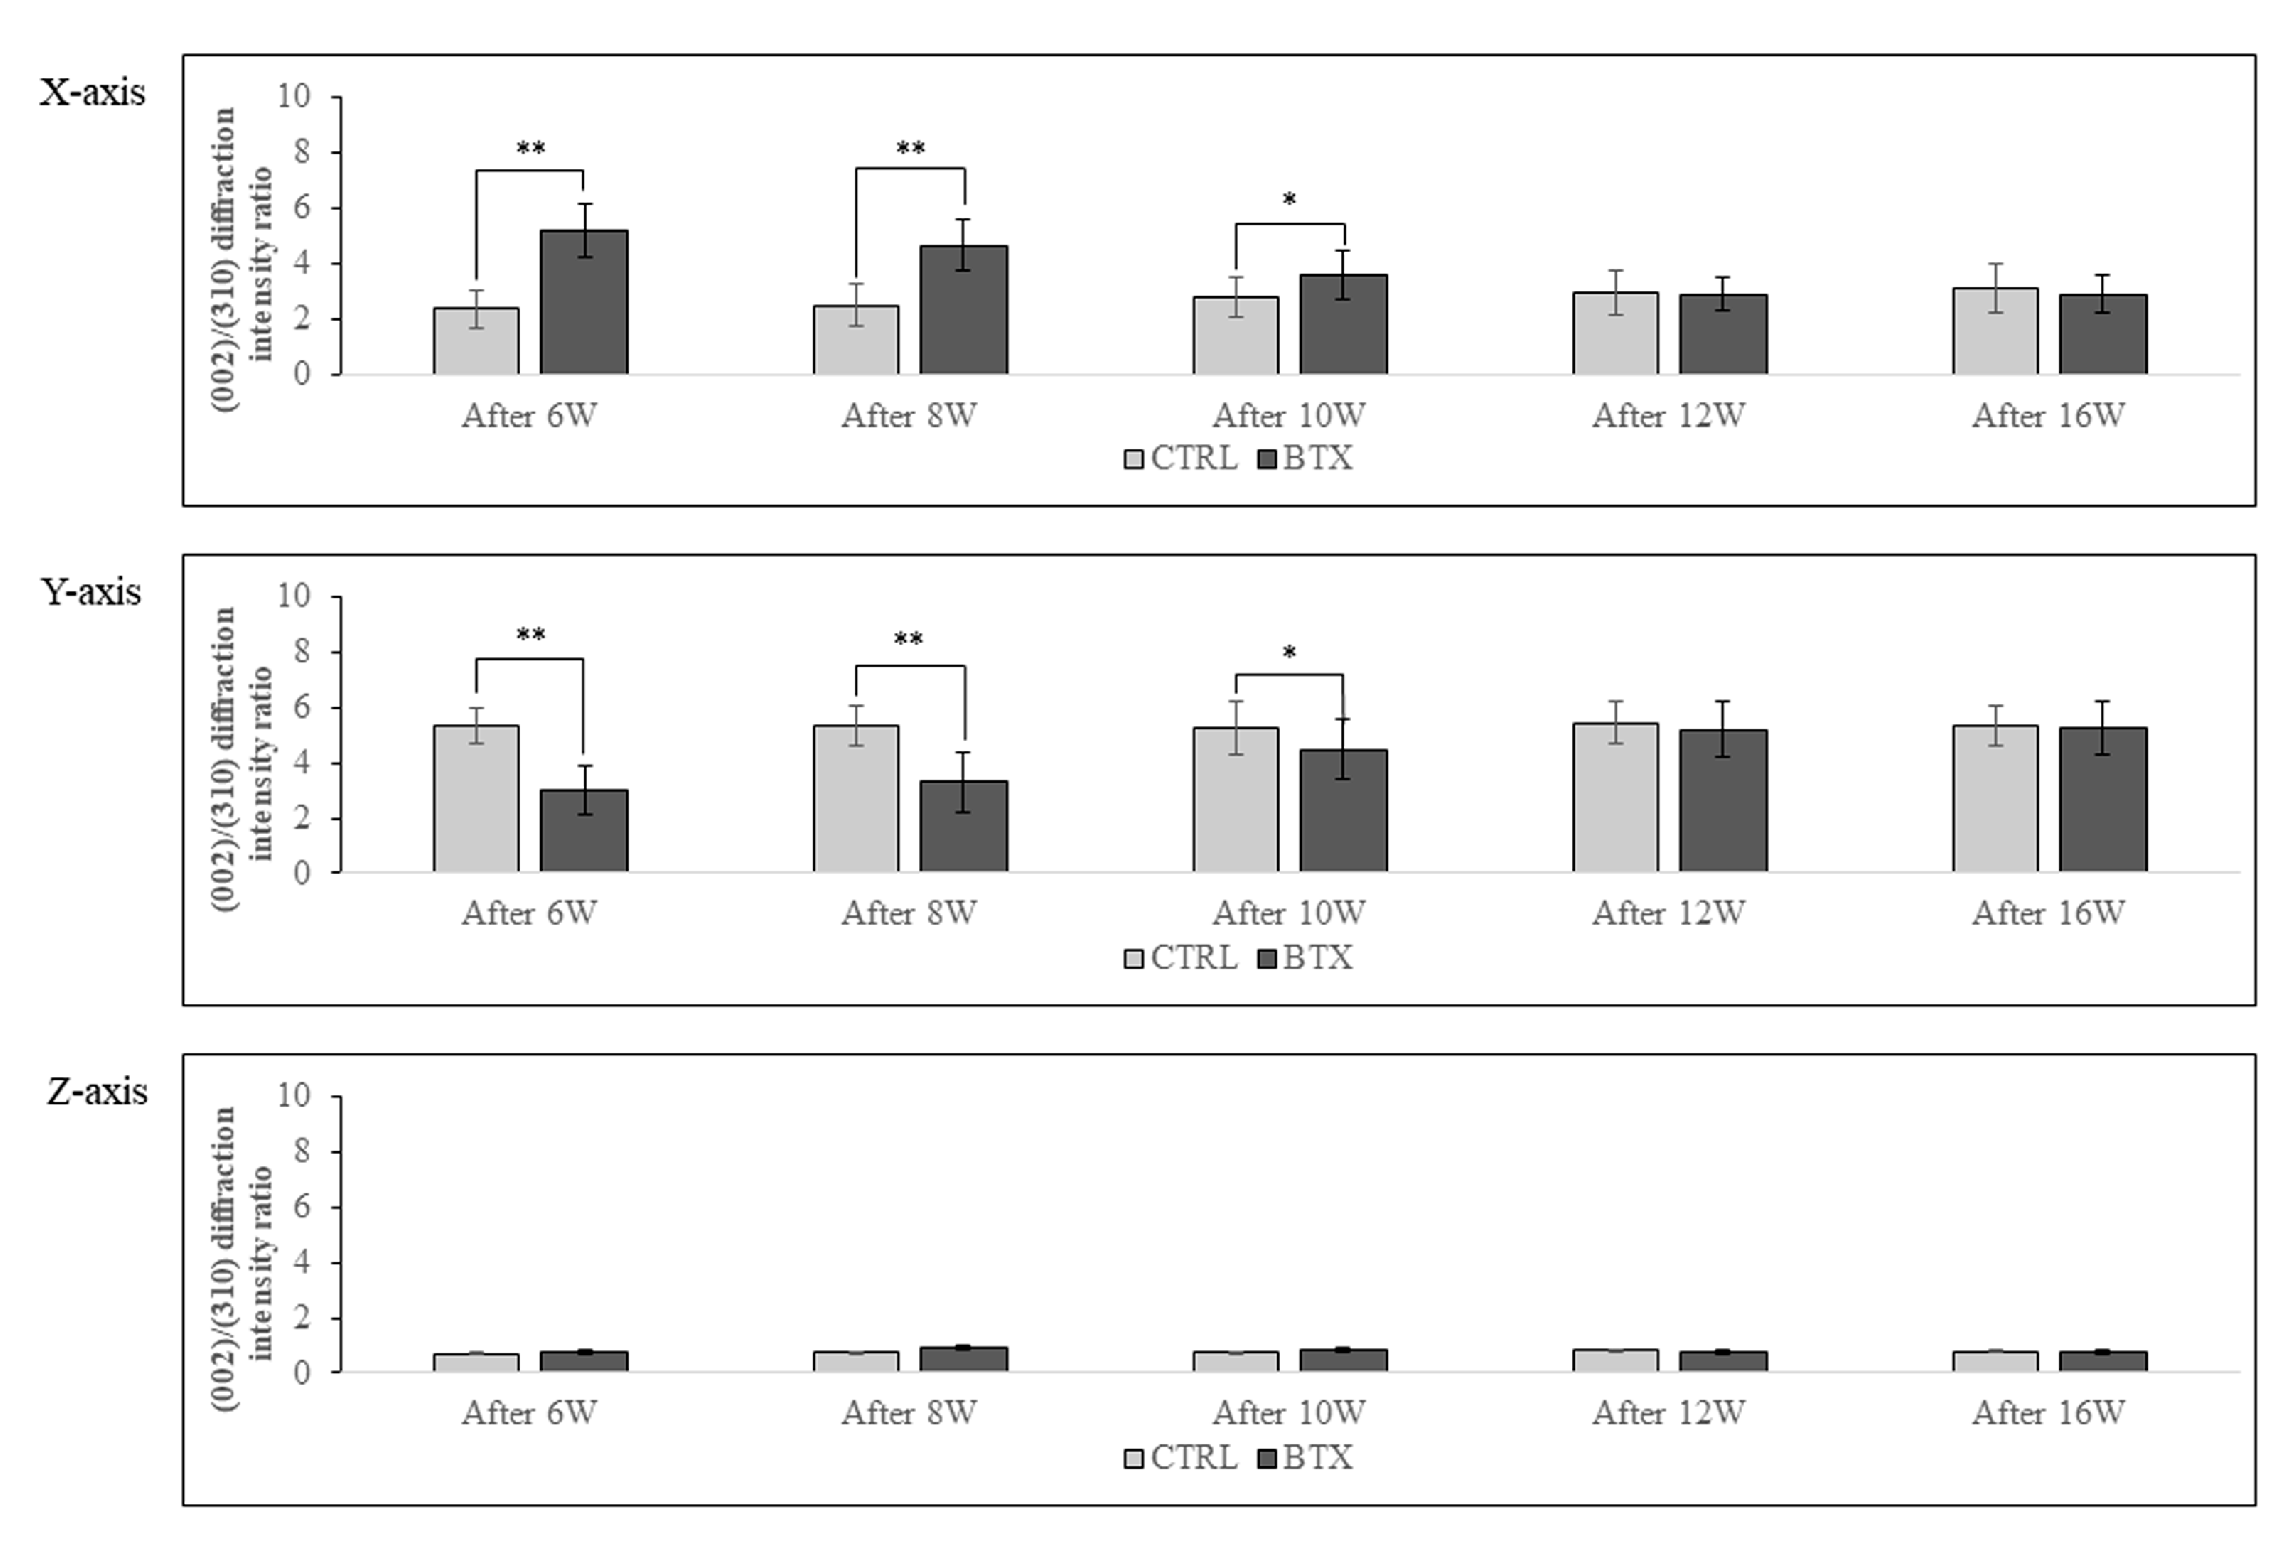
Figure 9 shows the calculated X-ray diffraction intensity ratio on the X-, Y-, and Z-axes at the entheses. The X-ray diffraction intensity ratio of hydroxyapatite powder was 1.04 with the reflecting system and 3.13 with the transmission system. On the X-axis, the X-ray diffraction intensity ratio was significantly higher in the BTX group than in the CTRL group in rats 6, 8, and 10 weeks after BoNT/A administration. On the Y-axis, the X-ray diffraction intensity ratio was significantly lower in the BTX group than in the CTRL group in rats 6, 8, and 10 weeks after administration. However, there were no significant differences between the BTX and CTRL groups on either the X- or the Y-axis at 12 or 16 weeks after administration. On the Z-axis, both groups showed extremely low values for the X-ray diffraction intensity ratio.
4. Discussion
The jawbone and dentition are constantly surrounded by muscles and are always under pressure from the muscles. Since the forces of the tongue and lips and cheeks are applied to the dentition from the inside and outside, respectively, the pressures from these perioral muscles must be balanced in order to maintain a healthy dentition and bite over the long term [
10]. Dysfunction of the perioral muscles causes problems in basic functions of the oral cavity, such as chewing, swallowing, and pronunciation. In addition, perioral muscle dysfunction inhibits the normal development of the jawbone and dentition, and is considered a cause of malocclusion [
14]. In orthodontic treatment, it is believed that oral myofunctional therapy and functional orthodontic appliances can be used to remove dysfunctions of the perioral muscles [
15]. Individual muscle training includes training for each region, such as the tongue, lips, facial expression muscle group, and masticatory muscle group, and it is believed that training appropriate to the condition of each muscle can create an environment to maintain normal morphology of the jawbone and dentition [
12]. Malta et al. suggest that orthodontic treatment with functional orthodontic appliances maintains good long-term results due to a combination of skeletal, dental, and soft tissue changes [
28]. Tulloch et al. suggest that early orthodontic treatment is effective when approaching skeletal imbalances [
29].
BoNT/A preparations are composed primarily of bacterial metalloproteinases. This proteolytic enzyme can specifically inhibit neurotransmitter release in cholinergic nerve endings, causing prolonged muscle relaxation [
30]. Tsai et al. used electromyography signals to follow the changes in masseter muscle activity following administration of BoNT/A in adult rats, and they reported a tendency for muscle function to recover [
31]. In the present study, masseter muscle weight was lower in the BTX group than in the CTRL group until 12 weeks after BoNT/A administration, but there was no significant difference between the groups at 16 weeks after administration. Masseter muscle cross-sectional area was smaller in the BTX group than in the CTRL group at all ages, but the difference between the groups decreased with increasing age. The measurement of the upper and lower incisor medians showed a large discrepancy between the upper and lower medians in the BTX group, but the difference in the median line decreased with each passing week. Tsai et al. suggested that the decrease in masseter muscle weight associated with the administration of BoNT/A reduced muscle pressure, and that this load reduction led to jawbone deformity [
31,
32,
33], and the results of this study were similar to this.
Next, the bone was analysed by examining collagen fibre bundles, which exhibit resistance to tensile stress. As reported by Chong et al. [
34], band-like collagen fibre bundles were formed in the bone with growth, and in the CTRL group, the intrabone collagen fibre bundles in the masseter muscle attachment area were thick and almost coincided with the direction of running tendon fibres. At the same time, Kusaba et al. reported that, if there is a persistent reduction in functional pressure of the masseter muscle during the period of growth and development, collagen fibre bundles are not generated in sufficient quantity or quality within the entheses [
26]. In the present study, the BTX group showed less thickness of the collagen fibre bundles than the CTRL group until 12 weeks after BoNT/A administration, and at 16 weeks after administration, there was no significant difference between the two groups in the thickness of the collagen fibre bundles. These results suggest that abundant collagen fibre bundles were again generated at the entheses as a result of restoration of masseter muscle function. The preferential alignment of BAp crystals, which exhibit resistance to compressive stress, was also examined. BAp crystals are ionic crystals with a highly anisotropic hexagonal nanostructure, and the c-axis of the crystal is preferentially aligned with the direction of loading [
35]. BAp crystals in the mandible basically show preferential, single-axis alignment along the long axis, but near the root of the tooth, the orientation in the long axis direction decreases and the crystals show preferential alignment in the direction of mastication [
17]. This suggests that BAp crystals acquire preferential alignment in cortical bone reflecting the in vivo stress distribution at the various sites within the bone. Bacon et al. reported that BAp crystals at the entheses are preferentially aligned with the running direction of the muscle [
36]. Kusaba et al. found that the orientation of BAp crystals was less closely aligned with the running direction of the muscle and tendon in the mandibles of growing rats that had been treated with Botox [
26]. In the present study as well, BAp crystal alignment with the running direction of the muscle and tendon in rat mandibles was reduced until 10 weeks after BoNT/A administration, but at 12 weeks after administration, the BAp crystals showed preferential alignment with the running direction of the muscle and tendon. These results suggest that the BAp crystal alignment that should normally have been acquired was obtained as a result of recovery of masseter muscle functional pressure.
The work of Tsai et al. suggests that a decrease in masseter muscle weight is associated with reduction in muscle functional pressure, and this reduction in load leads to deformation of the jawbone [
31,
32,
33], which is grounds for the notion that imbalance in muscle functional pressure is a factor in jaw deformity.
5. Conclusions
The results of the present study suggest that mandibular bone deformation caused by this type of load imbalance during growth could be corrected by adjustment of the function of the masseter muscle on either side, promoting healthy jawbone development and restoring mandibular symmetry during growth and development.
Author Contributions
Conceptualization, Y.N. and S.M.; methodology, S.M., N.K., M.K., Y.S., T.N., T.I. and A.H.; data curation, S.M. and S.M.; writing—original draft preparation, S.M. and S.M.; writing—review and editing, S.M. and Y.N.; visualization, S.M.; supervision, S.M., S.A., K.N. and Y.N.; project administration, S.M. All authors have read and agreed to the published version of the manuscript.
Funding
This research received no external funding.
Data Availability Statement
The datasets generated and analyzed during the current study are available from the corresponding author on reasonable request.
Acknowledgments
This study was supported by a research grant from the Japan Society for the Promotion of Science (contract grant number: 18K09643,17K11808) and was partly supported by a grant of Multidisciplinary Research Center for Jaw Disease (MRCJD): Achieving Longevity and Sustainability by Comprehensive Reconstruction of Oral and Maxillofacial Functions.
Conflicts of Interest
The authors have no conflict of interest with respect to this study.
References
- Mossey, P.A. The heritability of malocclusion: Part 1—Genetics, principles and terminology. British Journal of Orthodontics. 1999, 26, 103–113. [Google Scholar] [CrossRef]
- Mossey, P.A. The heritability of malocclusion: Part 2. The influence of genetics in malocclusion. British Journal of Orthodontics. 1999, 26, 195–203. [Google Scholar] [CrossRef] [PubMed]
- Enlow, D.H.; Harris, D.B. A study of postnatal growth of the human mandible. American Journal of Orthodontics. 1964, 50, 25–50. [Google Scholar] [CrossRef]
- Enlow, D.H.; Bang, S. Growth and remodeling of the human maxilla. American Journal of Orthodontics. 1966, 51, 446–468. [Google Scholar] [CrossRef] [PubMed]
- Enlow, D.H.; Bang, S. A morphogenetic analysis of facial growth. American Journal of Orthodontics. 1966, 52, 283–299. [Google Scholar] [CrossRef]
- Takada, K.; Lowe, A.A.; Freund, V.K. Canonical correlations between masticatory muscle orientation and dentoskeletal morphology in children. American Journal of Orthodontics. 1984, 86, 331–341. [Google Scholar] [CrossRef]
- Ingervall, B.; Helkimo, E. Masticatory muscle force and facial morphology in man. Archives of Oral Biology. 1978. 23, 203–206. [CrossRef]
- Isola, G.; Anastasi, G.P.; Matarese, G.; Williams, R.C.; Cutroneo, G.; Bracco, P.; Piancino, M.G. (2017) Functional and molecular outcomes of the human masticatory muscles. Oral Diseases. 2017, 24, 1428–1441. [Google Scholar] [CrossRef] [PubMed]
- Yamada, T.; Sugiyama, G.; Mori, Y. Masticatory muscle function affects the pathological conditions of dentofacial deformities. Japanese Dental Science Review. 2020, 56, 56–61. [Google Scholar] [CrossRef] [PubMed]
- Grabowski, R.; Stahl, F. Interrelation between occlusal findings and orofacial myofunctional status in primary and mixed dentition: Part III: Interrelation between malocclusions and orofacial dysfunctions. Journal of Orofacial Orthopedics. 2007, 68, 462–476. [Google Scholar] [CrossRef]
- Seemann, J.; Kundt, G.; Stahl de Castrillon, F. Relationship between occlusal findings and orofacial myofunctional status in primary and mixed dentition: part IV: interrelation between space conditions and orofacial dysfunctions. Journal of Orofacial Orthopedics. 2011, 72, 21–32. [Google Scholar] [CrossRef] [PubMed]
- Saccomanno, S.; Antonini, G.; D'Alatri, L.; D'Angelantonio, M.; Fiorita, A.; Deli, R. Causal relationship between malocclusion and oral muscles dysfunction: a model of approach. European Journal of Paediatric Dentistry. 2012, 13, 321–323. [Google Scholar] [PubMed]
- Lin, L.; Zhao, T.; Qin, D.; Hua, F.; He, H. The impact of mouth breathing on dentofacial development: A concise review. Frontiers in Public Health. 2022, 10, 929165. [Google Scholar] [CrossRef] [PubMed]
- Stahl, F.; Grabowski, R.; Gaebel, M.; Kundt, G. Relationship between occlusal findings and orofacial myofunctional status in primary and mixed dentition. Part II: Prevalence of orofacial dysfunctions. Journal of Orofacial Orthopedics. 2007, 68, 74–90. [Google Scholar] [CrossRef] [PubMed]
- Wishney, M.; Darendeliler, M.A.; Dalci, O. Myofunctional therapy and prefabricated functional appliances: an overview of the history and evidence. Australian Dental Journal. 2019, 64, 135–144. [Google Scholar] [CrossRef]
- Koletsi, D.; Makou, M.; Pandis, N. Effect of orthodontic management and orofacial muscle training protocols on the correction of myofunctional and myoskeletal problems in developing dentition. A systematic review and meta-analysis. Orthodontics & Craniofacial Research. 2018, 21, 202–215. [Google Scholar]
- Nakano, T.; Kaibara, K.; Tabata, Y.; Nagata, N.; Enomoto, S.; Marukawa, E.; Umakoshi, Y. Unique alignment and texture of biological apatite crystallites in typical calcified tissues analyzed by microbeam X-ray diffractometer system. Bone. 2020, 31, 479–487. [Google Scholar] [CrossRef]
- Nakano, T.; Kaibara, K.; Ishimoto, T.; Tabata, Y.; Umakoshi, Y. Biological apatite (BAp) crystallographic orientation and texture as a new index for assessing the microstructure and function of bone regenerated by tissue engineering. Bone. 2012, 51, 741–747. [Google Scholar] [CrossRef]
- NIH Consensus Development Panel on Osteoporosis Prevention Diagnosis, and Therapy Osteoporosis prevention, diagnosis, and therapy. Journal of American Medical Association. 2001, 285, 785–795.
- Yang, S.; Liu, Y.; Shi, Q.; Zou, J.; Yang, H. Characteristics of bone biochemical indices in predicting secondary osteoporotic fracture after intertrochanteric fracture in elderly women. Journal of Orthopaedic Translation. 2018, 12, 1–5. [Google Scholar] [CrossRef]
- Tao, J.; Battle, K.C.; Pan, H.; Salter, E.A.; Chien, Y.C.; Wierzbicki, A.; De Yoreo, JJ. Energetic basis for the molecular-scale organization of bone. Proceedings of the National Academy of Sciences of the United States of America. 2015, 112, 326–331. [Google Scholar] [CrossRef] [PubMed]
- Sasaki, N.; Sudoh, Y. X-ray pole figure analysis of apatite crystals and collagen molecules in bone. Calcified Tissue International. 1997, 60, 361–367. [Google Scholar] [CrossRef]
- Wang, J.; Ishimoto, T.; Nakano, T. Unloading-induced degradation of the anisotropic arrangement of collagen/apatite in rat femurs. Calcified Tissue International. 2017, 100, 87–94. [Google Scholar] [CrossRef] [PubMed]
- Warshaw, J.; Bromage, T.G.; Terranova, C.J.; Enlow, D.H. Collagen fiber orientation in primate long bones. The Anatomical Record. 2017, 300, 1189–1207. [Google Scholar] [CrossRef]
- Seok, H.; Kim, S.G.; Kim, M.K.; Jang, I.; Ahn, J. Effect of the masseter muscle injection of botulinum toxin A on the mandibular bone growth of developmental rats. Maxillofacial Plastic and Reconstructive Surgery. 2018, 40, 5. [Google Scholar] [CrossRef] [PubMed]
- Kusaba, G.; Matsunaga, S.; Kitamura, K.; Kasahara, M.; Shimoo, Y.; Abe, S.; Nakano, T.; Ishimoto, T.; Hikita, A.; Nojima, K.; Nishii, Y. Micro/nanostructural characteristic changes in the mandibles of rats after injection of botulinum neurotoxin. Journal of Hard Tissue Biology. 2021, 30, 183–192. [Google Scholar] [CrossRef]
- Liu, Y.; Keikhosravi, A.; Mehta, G.S.; Drifka, C.R.; Eliceiri, K.W. Methods for quantifying fibrillar collagen alignment. Methods in Molecular Biology. 2017, 1627, 429–451. [Google Scholar]
- Malta,LA. ; Baccetti, T.; Franchi, L.; Faltin, K Jr.; McNamara, J.A. Jr. Long-term dentoskeletal effects and facial profile changes induced by bionator therapy. The Angle Orthodontist. 2010, 80, 10–17. [Google Scholar] [CrossRef] [PubMed]
- Tulloch, J.F.; Phillips, C.; Koch, G.; Proffit, W.R. The effect of early intervention on skeletal pattern in Class II malocclusion: a randomized clinical trial. American Journal of Orthodontics and Dentofacial Orthopedics. 1997, 111, 391–400. [Google Scholar] [CrossRef] [PubMed]
- Tighe, A.P.; Schiavo, G. Botulinum neurotoxins: mechanism of action. Toxicon. 2013, 67, 87–93. [Google Scholar] [CrossRef]
- Tsai, C.Y.; Lei, Y.Y.; Yang, L.Y.; Chiu, W.C. Changes of masseter muscle activity following injection of botulinum toxin type A in adult rats. Orthodontics and Craniofacial Research. 2015, 18, 202–211. [Google Scholar] [CrossRef] [PubMed]
- Tsai, C.Y.; Chiu, W.C.; Liao, Y.H.; Tsai, CM. Effects on craniofacial growth and development of unilateral botulinum neurotoxin injection into the masseter muscle. American Journal of Orthodontics and Dentofacial Orthopedics. 2009, 135, 142, e1-e6. [Google Scholar] [CrossRef]
- Tsai, C.Y.; Shyr, Y.M.; Chiu, W.C.; Lee, C.M. Bone changes in the mandible following botulinum neurotoxin injections. European Journal of Orthodontics. 2011, 33, 132–138. [Google Scholar] [CrossRef] [PubMed]
- Chong, D.A.; Evans, C.A.; Heeley, JD. Morphology and maturation of the periosteum of the rat mandible. Archives of Oral Biology. 1982, 27, 777–785. [Google Scholar] [CrossRef] [PubMed]
- Elliot, J.C. Structure and chemistry of the apatites and other calcium orthophosphates. Elsevier Science. Amsterdam. 1994, 18, 1–389. [Google Scholar]
- Bacon, G.E.; Bacon, P.J.; Griffiths, R.K. Orientation of apatite crystals in relation to muscle attachment in the mandible. Journal of Biomechanics. 1980, 13, 725–729. [Google Scholar] [CrossRef] [PubMed]
Figure 1.
Cross mark indicate the injection site. M: masseter muscle, C: auditory meatus, D: lateral canthus, E: mandibular angle, F: outer oral commissure. The injection site in the masseter muscle is the point where the line perpendicular from the line CD at its midpoint intersects with the line EF. (Kusaba et al. 2021).
Figure 2.
(A). Point a is the lowest point in the anterior thick area of the mandible, and point p is the lowest point in the posterior thick area. The mandibular plane passes through the lines a-a’ and p-p’. The X-axis passes through the midpoints of the lines a-a’ and p-p’. The Y-axis is the axis perpendicular to the mandibular plane, and the Z-axis is the axis perpendicular to X-Y. (B). The YZ plane where it passes through the mandibular third molar. The red box shows the region of histological observation. The red dot shows the measurement point of BAp crystal alignment. The measurement point is the attachment site of the masseter muscle in the area of the mandibular third molar. (Kusaba et al. 2021).
Figure 3.
In the BTX group, there was a large difference in the midline of the upper and lower incisors. The difference in the midline decreased with each passing week and was significantly smaller after 12 weeks of Botox administration compared to 6, 8, and 10 weeks after Botox administration. The data are means ± standard deviation in independent experiments with n=5. Comparison with the CTRL group, * p<0.05, **
Figure 4.
There is no significant difference in body weight between groups at any age.The data are means ± standard deviation in independent experiments with n=10.
Figure 4.
There is no significant difference in body weight between groups at any age.The data are means ± standard deviation in independent experiments with n=10.
Figure 5.
The masseter muscle weighs significantly less in the BTX group from 6 weeks after BoNT/A administration to 12 weeks after administration, there is no significant difference between the groups. The data are means ± standard deviation in independent experiments with n=5. Comparison with the CTRL group, * p<0.05, ** p<0.01.
Figure 6.
(A). Haematoxylin-eosin-stained masseter muscle fibres. Yellow border: Masseter muscle fibres. (B). Cross-sectional area of masseter muscle fibres. Masseter muscle fibres in the BTX group show atrophy. At all ages from 6 weeks after BoNT/A administration to 16 weeks after administration, rats in the BTX group show significantly smaller cross-sectional area of masseter muscle fibres. The data are means ± standard deviation in independent experiments with n=5. Comparison with the CTRL group, * p<0.05, ** p<0.01. Scale bar: 50 μm.
Figure 7.
(A). Masson’s trichrome-stained YZ cross-sections of rat mandibles in the third molar region. M: masseter; Bo: bone (mandible); Te: tendon. The masseter muscle is attached to the mandible by a tendinous insertion at the inferior margin of the masseter muscle prominence and adheres to the mandible via the periosteum at all other sites. (B). Thickness of the tendon. The thickness of the tendon is significantly less in the BTX group at all ages than in the CTRL group. The data are means ± standard deviation in independent experiments with n=5. Comparison with the CTRL group, * p<0.05, ** p<0.01. Scale bar: 100 μm.
Figure 8.
(A). SHG images of YZ cross-sections of rat mandibles at the third molar region. The green fluorescent areas are collagen fibre bundles. (B). Diameters of collagen fibre bundles. The collagen fibre bundles show a significantly smaller diameter in the BTX group from 6 weeks after BoNT/A administration to 12 weeks after administration. There is no significant difference between the groups at 16 weeks after administration. The data are means ± standard deviation in independent experiments with n=5. Comparison with the CTRL group, * p<0.05, ** p<0.01. Scale bar: 100 μm.
Figure 9.
BAp crystal alignment is significantly different between the X-axis and the Y-axis in the BTX group from 6 weeks after BoNT/A administration to 10 weeks after administration. There is no significant difference at 12 weeks or 16 weeks after administration. The data are means ± standard deviation in independent experiments with n=5. Comparison with the CTRL group, * p<0.05, ** p<0.01.
|
Disclaimer/Publisher’s Note: The statements, opinions and data contained in all publications are solely those of the individual author(s) and contributor(s) and not of MDPI and/or the editor(s). MDPI and/or the editor(s) disclaim responsibility for any injury to people or property resulting from any ideas, methods, instructions or products referred to in the content. |
© 2023 by the authors. Licensee MDPI, Basel, Switzerland. This article is an open access article distributed under the terms and conditions of the Creative Commons Attribution (CC BY) license (http://creativecommons.org/licenses/by/4.0/).
