1. Introduction
Bioelectrical impedance analysis (BIA) is a non-invasive technique that originated in the early 1930s and 1940s [
1,
2], involving the measurement of the electrical impedance of a tissue region [
3]. Bioimpedance measurement (BIM) provides information about the physical and electrochemical processes in the tissue region and hence can be used for monitoring physiological properties and variations [
4]. BIA has been widely utilised for body composition [
5,
6,
7,
8] and developed to track pulse wave propagation [
9,
10,
11,
12] and estimate the arterial diameter change [
13,
14,
15,
16]. The fundamental principle of BIM is that a small amount of alternating current is applied through the outer pair of electrodes (current-carrying electrodes), and the voltage in response is measured through the same or a different inner pair of electrodes (pick-up electrodes). The ratio of the output voltage to the input current yields bioimpedance, which is reflective of the dielectric response of tissues under the measurement. BIA is carried out as either single-frequency BIA (SF-BIA) or multi-frequency BIA (MF-BIA). SF-BIA finds applications in impedance cardiography (ICG) [
17] and impedance plethysmography (IPG) [
18]. MF-BIA is used in electrical impedance tomography (EIT) for medical imaging diagnostics [
19,
20,
21] and bioimpedance spectroscopy (BIS) which can be used to identify the complex dielectric behaviours of human tissues [
22].
Schwan [
23] initially presented the frequency-dependent electrical parameters of tissues in terms of conductivity and permittivity. The electrical behaviours of human tissues can be divided among three dispersion regions:
-dispersion (10 Hz – 10 kHz),
-dispersion (10 kHz – 100 MHz) and
-dispersion (100 MHz – 100 GHz) regions. Human tissues exhibit complex dielectric behaviour in
-dispersion region, which is generally described through complex conductivity and permittivity. Cole and Cole [
24,
25] proposed an empirical model to represent the complex dielectric behaviour through distributed relaxation phenomenon, resulting in the Cole-Cole relation:
where
is the complex dielectric constant,
is the dielectric constant at infinite frequency,
is the dielectric constant at zero frequency.
is the angular frequency and
is a time constant.
is the coefficient of relaxation, which has a value between 0 and 1 depending on the nature of the material. The parameter becomes smaller as the width of the dispersion increases.
Another way of representing the Cole-Cole model is in the form of impedance expressed in terms of complex permittivity and complex conductance:
where
and
are the resistance at zero and infinite frequency, respectively.
has a non-linear relationship with frequency, which generates a suppressed semi-circle in the impedance plane. Equation 2 has been extensively used for single-dispersion Cole modelling in MF-BIA.
The application of MF-BIA for hemodynamic monitoring has been investigated by several previous studies using computational simulation [
26], tissue phantom experiments [
13,
27] and human subject measurement [
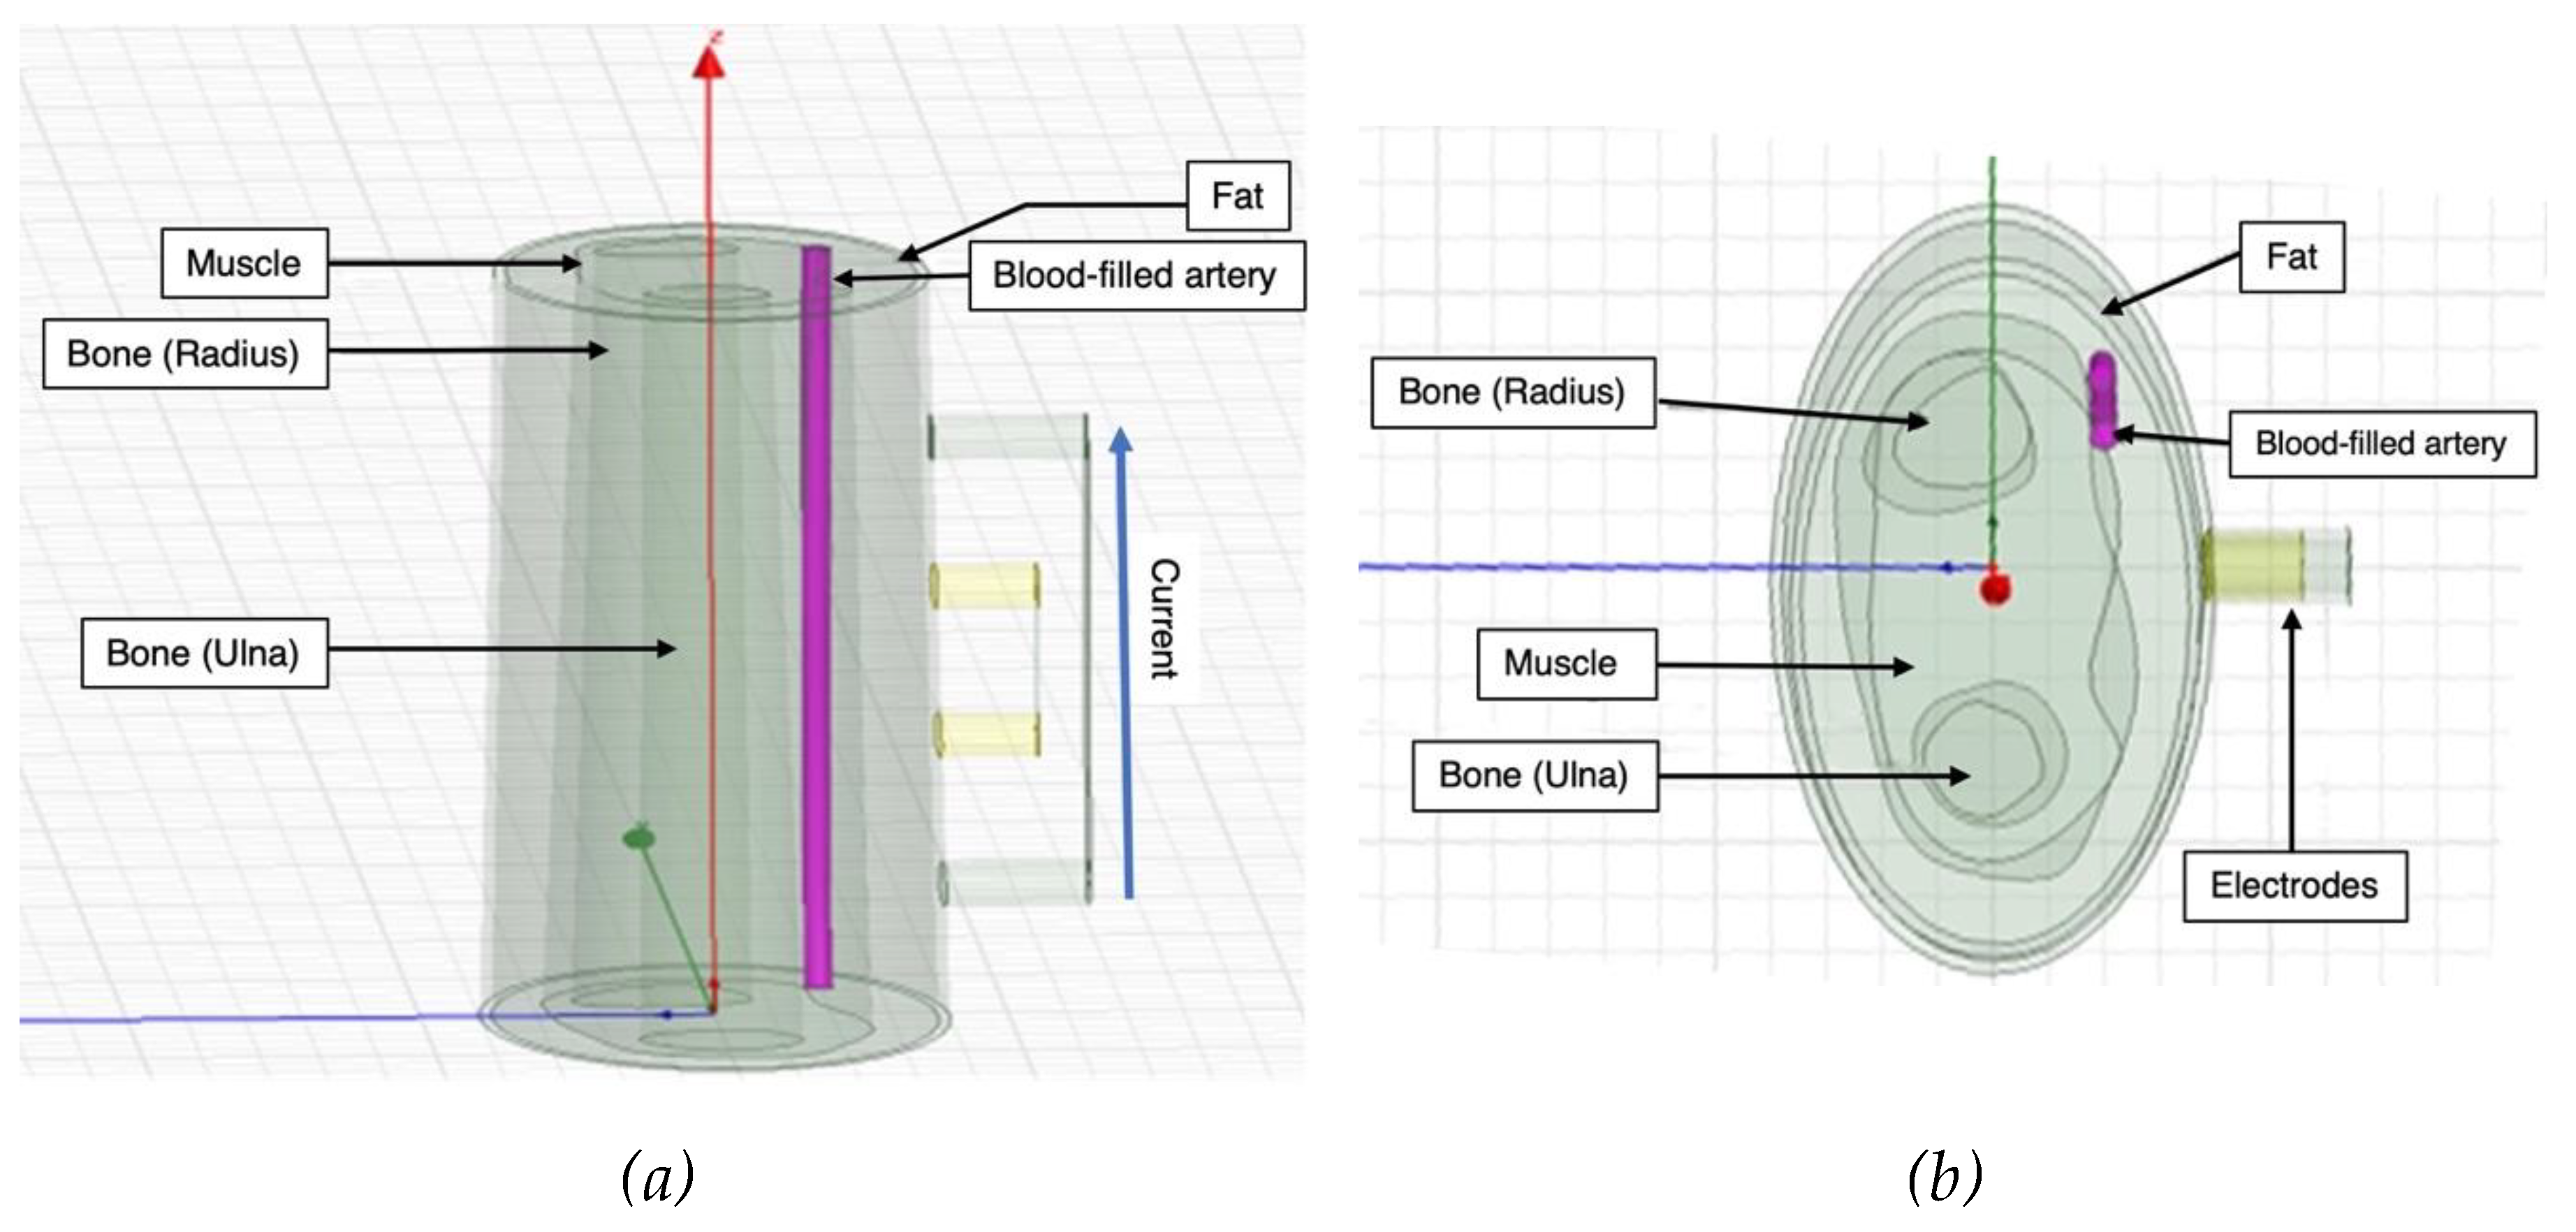
15]. The objective of this study is to present a mathematical modelling approach where the dielectric properties of forearm tissues will be identified through MF-BIA. In this study, the finite element method (FEM) was carried out to simulate a 3D human forearm model using the ANSYS HFSS with four tissue domains, including fat, muscle and blood-filled artery (radial artery) and bones (radius and ulna), aiming to evaluate the dielectric response and the electric field (E-field) distribution within individual tissues of the forearm. Moreover, pilot experimentation was implemented with two healthy human participants using MF-BIA at the forearm. Then both simulated and measured impedance values were fitted to the single-dispersion Cole model (SDCM) and the multi-dispersion Cole model (MDCM) for an overall identification of the tissue response and the dielectric relaxation of individual tissues, respectively.
2. Methodology
2.1. Computational Simulation
2.1.1. 3D Human Forearm
A 3D model of the human forearm was designed in ANSYS HFSS and FEM was applied to perform electrical simulation, as shown in
Figure 1. In this simulation, four tissue domains were modelled according to the anatomy of human forearm [
28,
29], including fat, muscle, blood and bone. Skin is a prominent contributor to the overall impedance measurements, so much so that its high impedance was expected to make it behave like an insulator in the path of the small excitation used for this work. It was not included in this simulation as this high impedance effect is expected to be reduced to negligible through wet electrodes, which are conventionally used for BIM.
The overall width of the cross-section of human forearm model was 70 mm. The fat and the muscle layers were modelled as concentric along the same axis. The dimension in terms of thickness of the fat was from 3 to 6 mm and from 10 to 15 mm from muscle. The artery section was modelled to mimic the radial artery with a diameter of 2.35 mm perfused through both the fat and the muscle domains [
30,
31,
32,
33]. The artery wall enveloped the artery along its surface and was assigned the properties of muscle while forming the interface between muscle and blood. The bone domain was subdivided into two main regions - radius, which was at the centre and thicker, and ulna, which was relatively at the periphery and smaller in cross-section.
Each tissue domain was assigned frequency-dependent material properties in the form of bulk conductivity (
) and relative permittivity (
) based on the database developed by Gabriel et al. [
34,
35,
36,
37].
2.1.2. BIM Setup
Four cylindrical electrodes were modelled to simulate the tetrapolar BIM. The outer pair of electrodes was used as a current source, while the inner pair of electrodes were used for measuring the resultant potential difference. A current excitation was applied on current-carry electrodes between 1 kHz and 1 MHz. The amplitude of the current was 1 mA in accordance with the electrical safety limits identified by IEC 60601 standards [
38]. The emphasis of this investigation was to target a part of the
-dispersion frequency range that is of interest for dielectric properties of human tissues (both resistance and reactance). The electrodes were chosen to be conductive by defining their material properties as those of copper. All electrodes were modelled to have a diameter of 8 mm with an equal spacing of 20 mm.
2.2. Pilot Experimentation
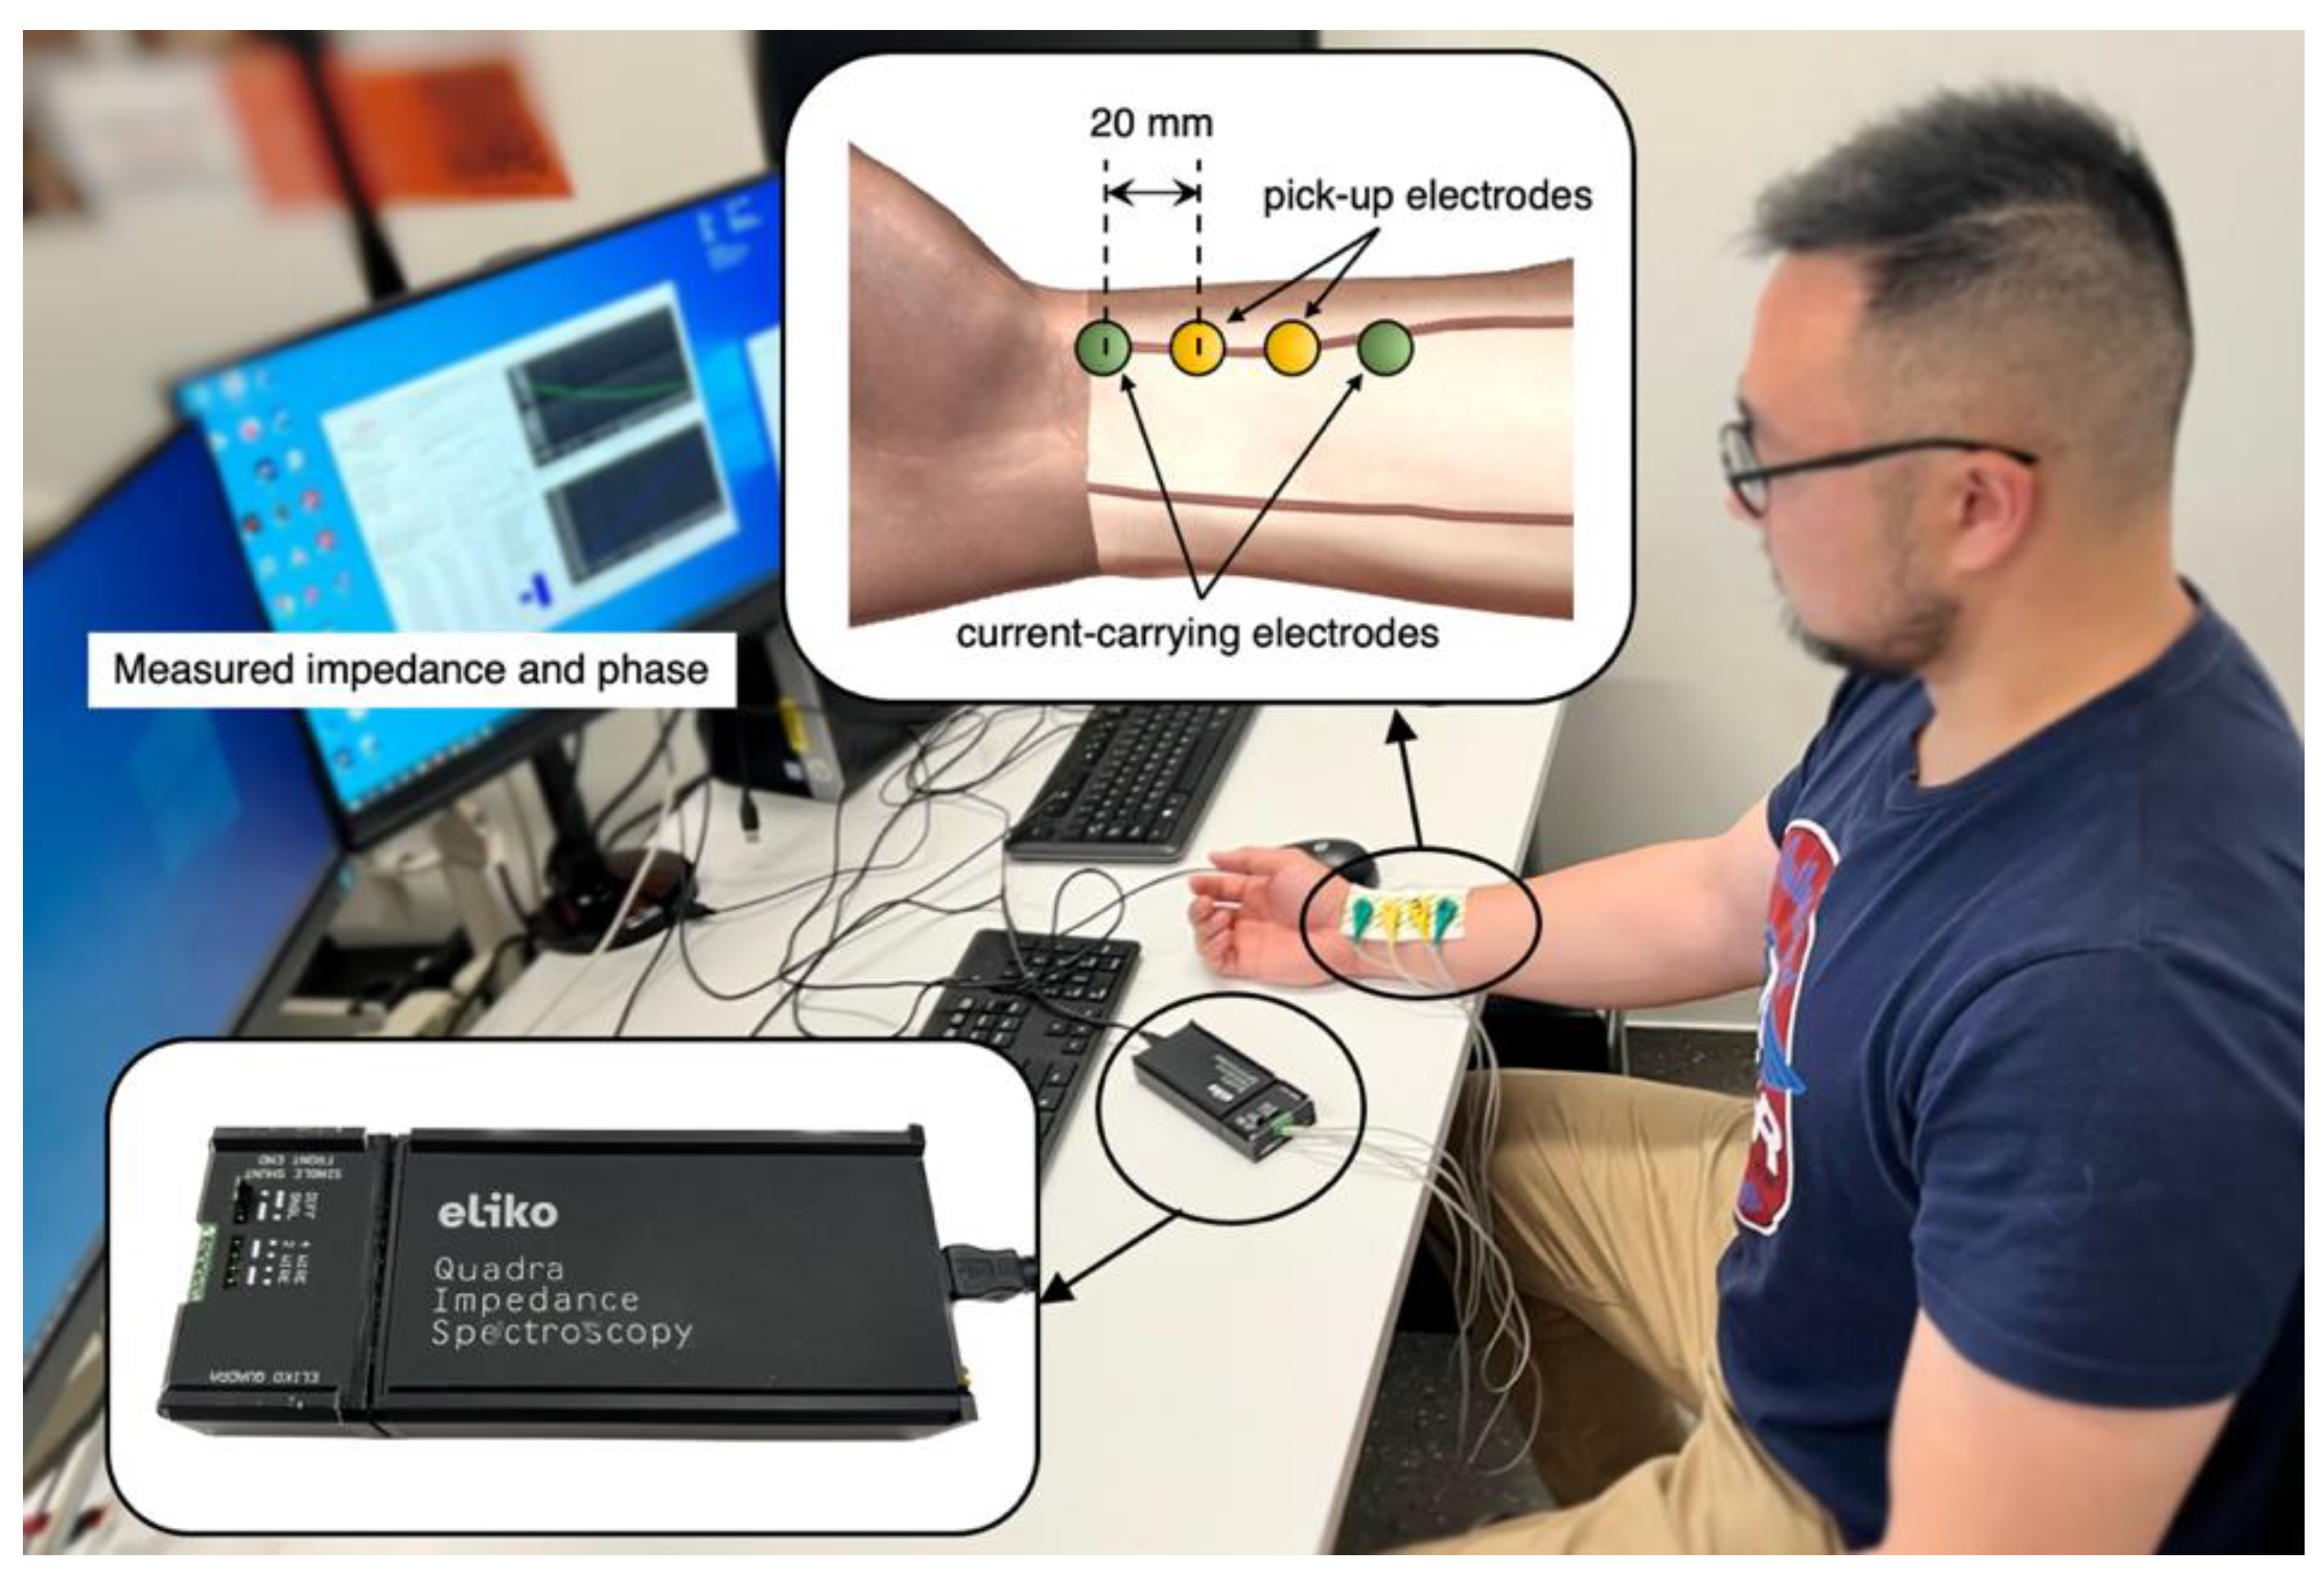
The tetrapolar BIM was implemented on two healthy subjects (one male and one female) under the resting condition who were members of this research team. After consultation with the institutional ethics committee, the scope of this investigation was deemed exempt from ethics approval. As shown in
Figure 2, four ECG gel electrodes were placed along the radial artery near the wrist of the ventral forearm. The electrode spacing was kept the same as the computational simulation at 20 mm. A commercially available Quadra® Electrical Impedance Spectroscopy device (Eliko® technologies, Estonia) [
39] was utilised for BIA at the Institute of Biomedical Technologies (IBTec), Auckland University of Technology, New Zealand.
Quadra® device can provide a state-of-the-art platform for impedance spectroscopy, offering a sampling rate of 1000 Hz while yielding impedance spectra at 15 different frequencies from 1 kHz to 349 kHz (i.e., 1 kHz, 2 kHz, 3 kHz, 7 kHz, 11 kHz, 17 kHz, 23 kHz, 31 kHz, 43 kHz, 61 kHz, 89 kHz, 127 kHz, 179 kHz, 251 kHz, and 349 kHz). Since the device offers a maximum frequency limit of 349 kHz, extrapolation was employed to generate the response between 1 kHz and 1 MHz using MATLAB (R2019a, The MathWorks, Natick, MA, USA). A single shunt front-end with a 4-wire differential mode was employed with the Quadra® device for this study. The Quadra® device interfaces via its software, which logs the impedance in terms of absolute value (
) and phase angle (
). Therefore, the real and imaginary parts of measured impedance were calculated by:
2.3. Single and Multi-Dispersion Cole Lumped-Parameter Models
Equation 2 defines the impedance magnitude as a complex quantity and can be rewritten by substituting the value of
:
The real (
) and the imaginary parts (
) of impedance can be obtained:
Equation 6 and Equation 7 can be further combined to relate
directly in terms of
so as to form an equation where
is a function of
. To aid the understanding,
can be symbolized as ‘
’ and
can be symbolised as ‘
’:
The methodology for curve fitting involved choosing a general dielectric Cole model with at-least four parameters (
,
and
) that would define the dielectric relaxation spread in the frequency range of interest (i.e., from 1 kHz to 1 MHz). Moreover, a minimization cost function was implemented based on the sum of squared errors between the curve fit and simulation data as:
where RMSE is the root mean squared error,
and
refer to the
and
curve fit data for
sample,
and
refer to the
and
simulation data for
sample and
is the number of samples. The fitting algorithms were implemented using MATLAB.
Bone exhibits an almost constant conductivity of 0.02 S/m over the frequency range of interest. Hence, the contribution of the bone tissue domains was considered to be resistive. Each of the other three tissue domains was modelled using a multi-dispersion Cole model. The final model considered to represent the electrical response of the forearm tissues was:
In Equation 9, the first term represents the resistance of the bone tissues (collectively for radius and ulna) and the second, third and fourth terms describe the dispersion spectrum for fat, muscle and blood tissue layers, respectively. The correlation between the raw impedance and fitted impedance was evaluated via correlation coefficient (R2) and RMSE. The mean difference and standard deviation (SD) were calculated to evaluate the accuracy of fitting and represented as Bland-Altman analysis.
3. Results
3.1. Computational Simulation Analysis
3.1.1. E-Field Distribution
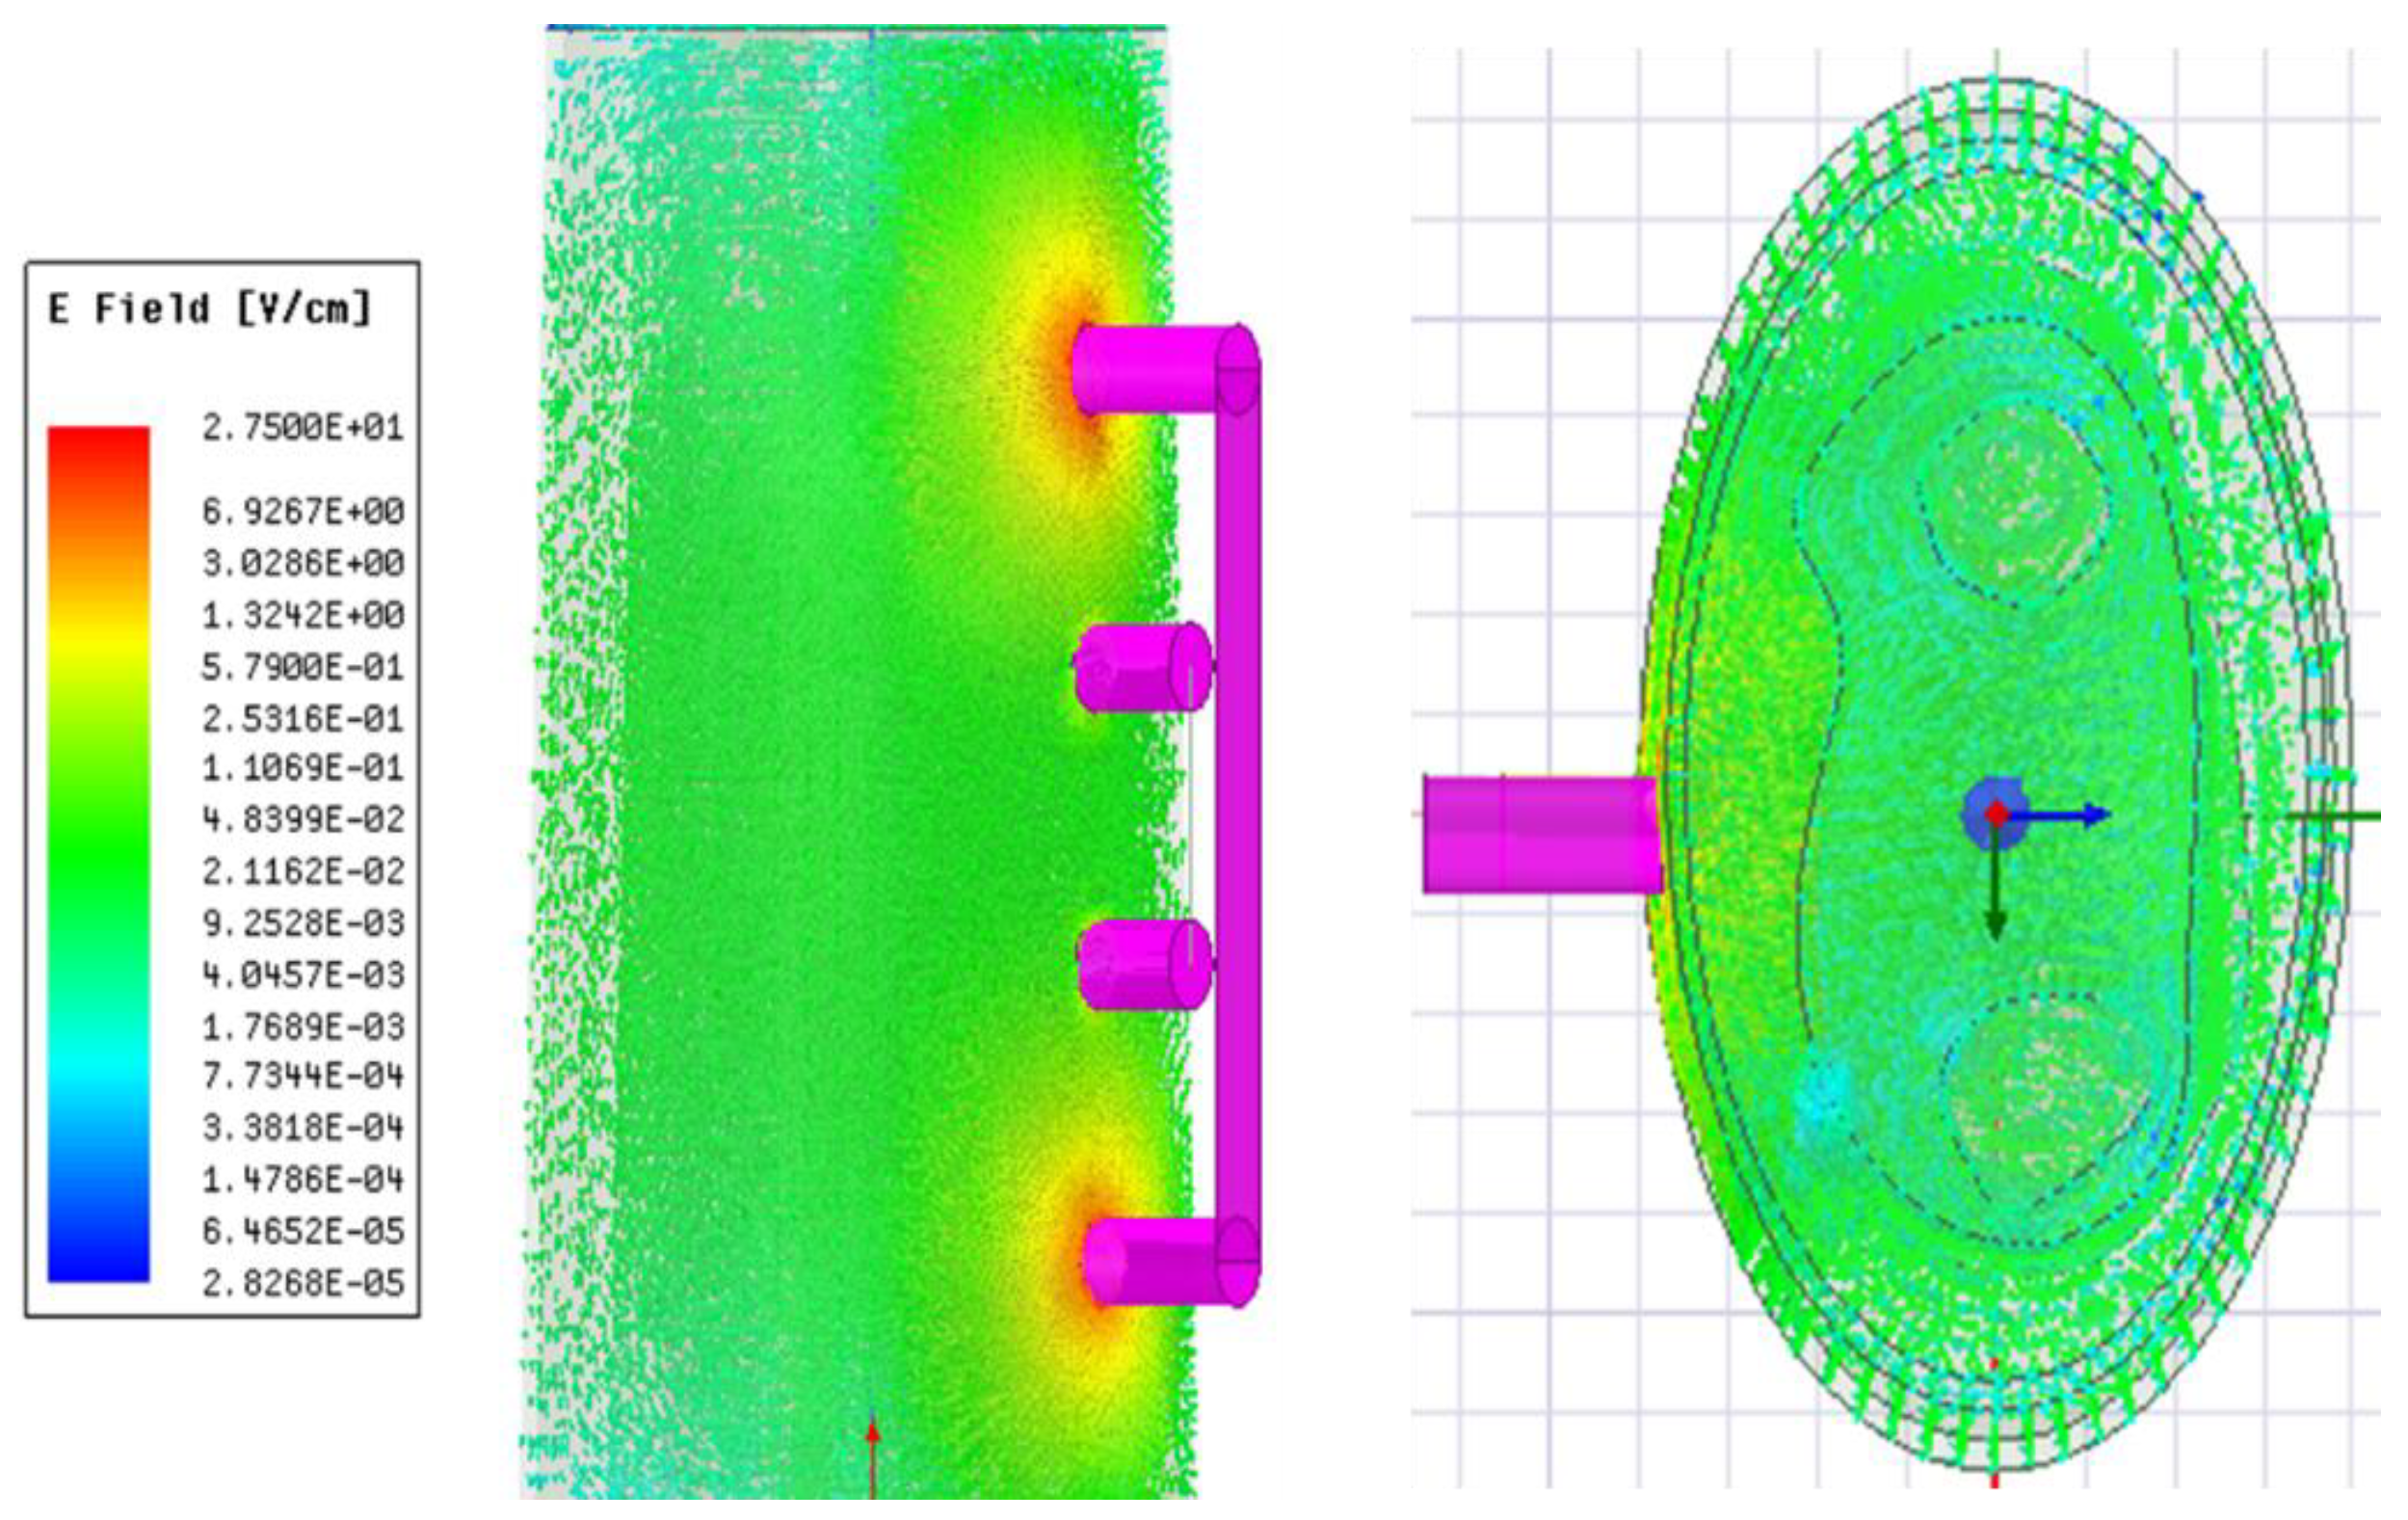
Figure 3 illustrates the simulated distribution of the E-field within the 3D model at 1 kHz. The E-field distributed throughout its volume determines the direction of current flow. The line integral of E-field along the pick-up electrodes was used to determine the corresponding voltage drop and calculate the simulated real part and imaginary part of impedance.
3.1.2. Single-Dispersion Cole Model Fitting
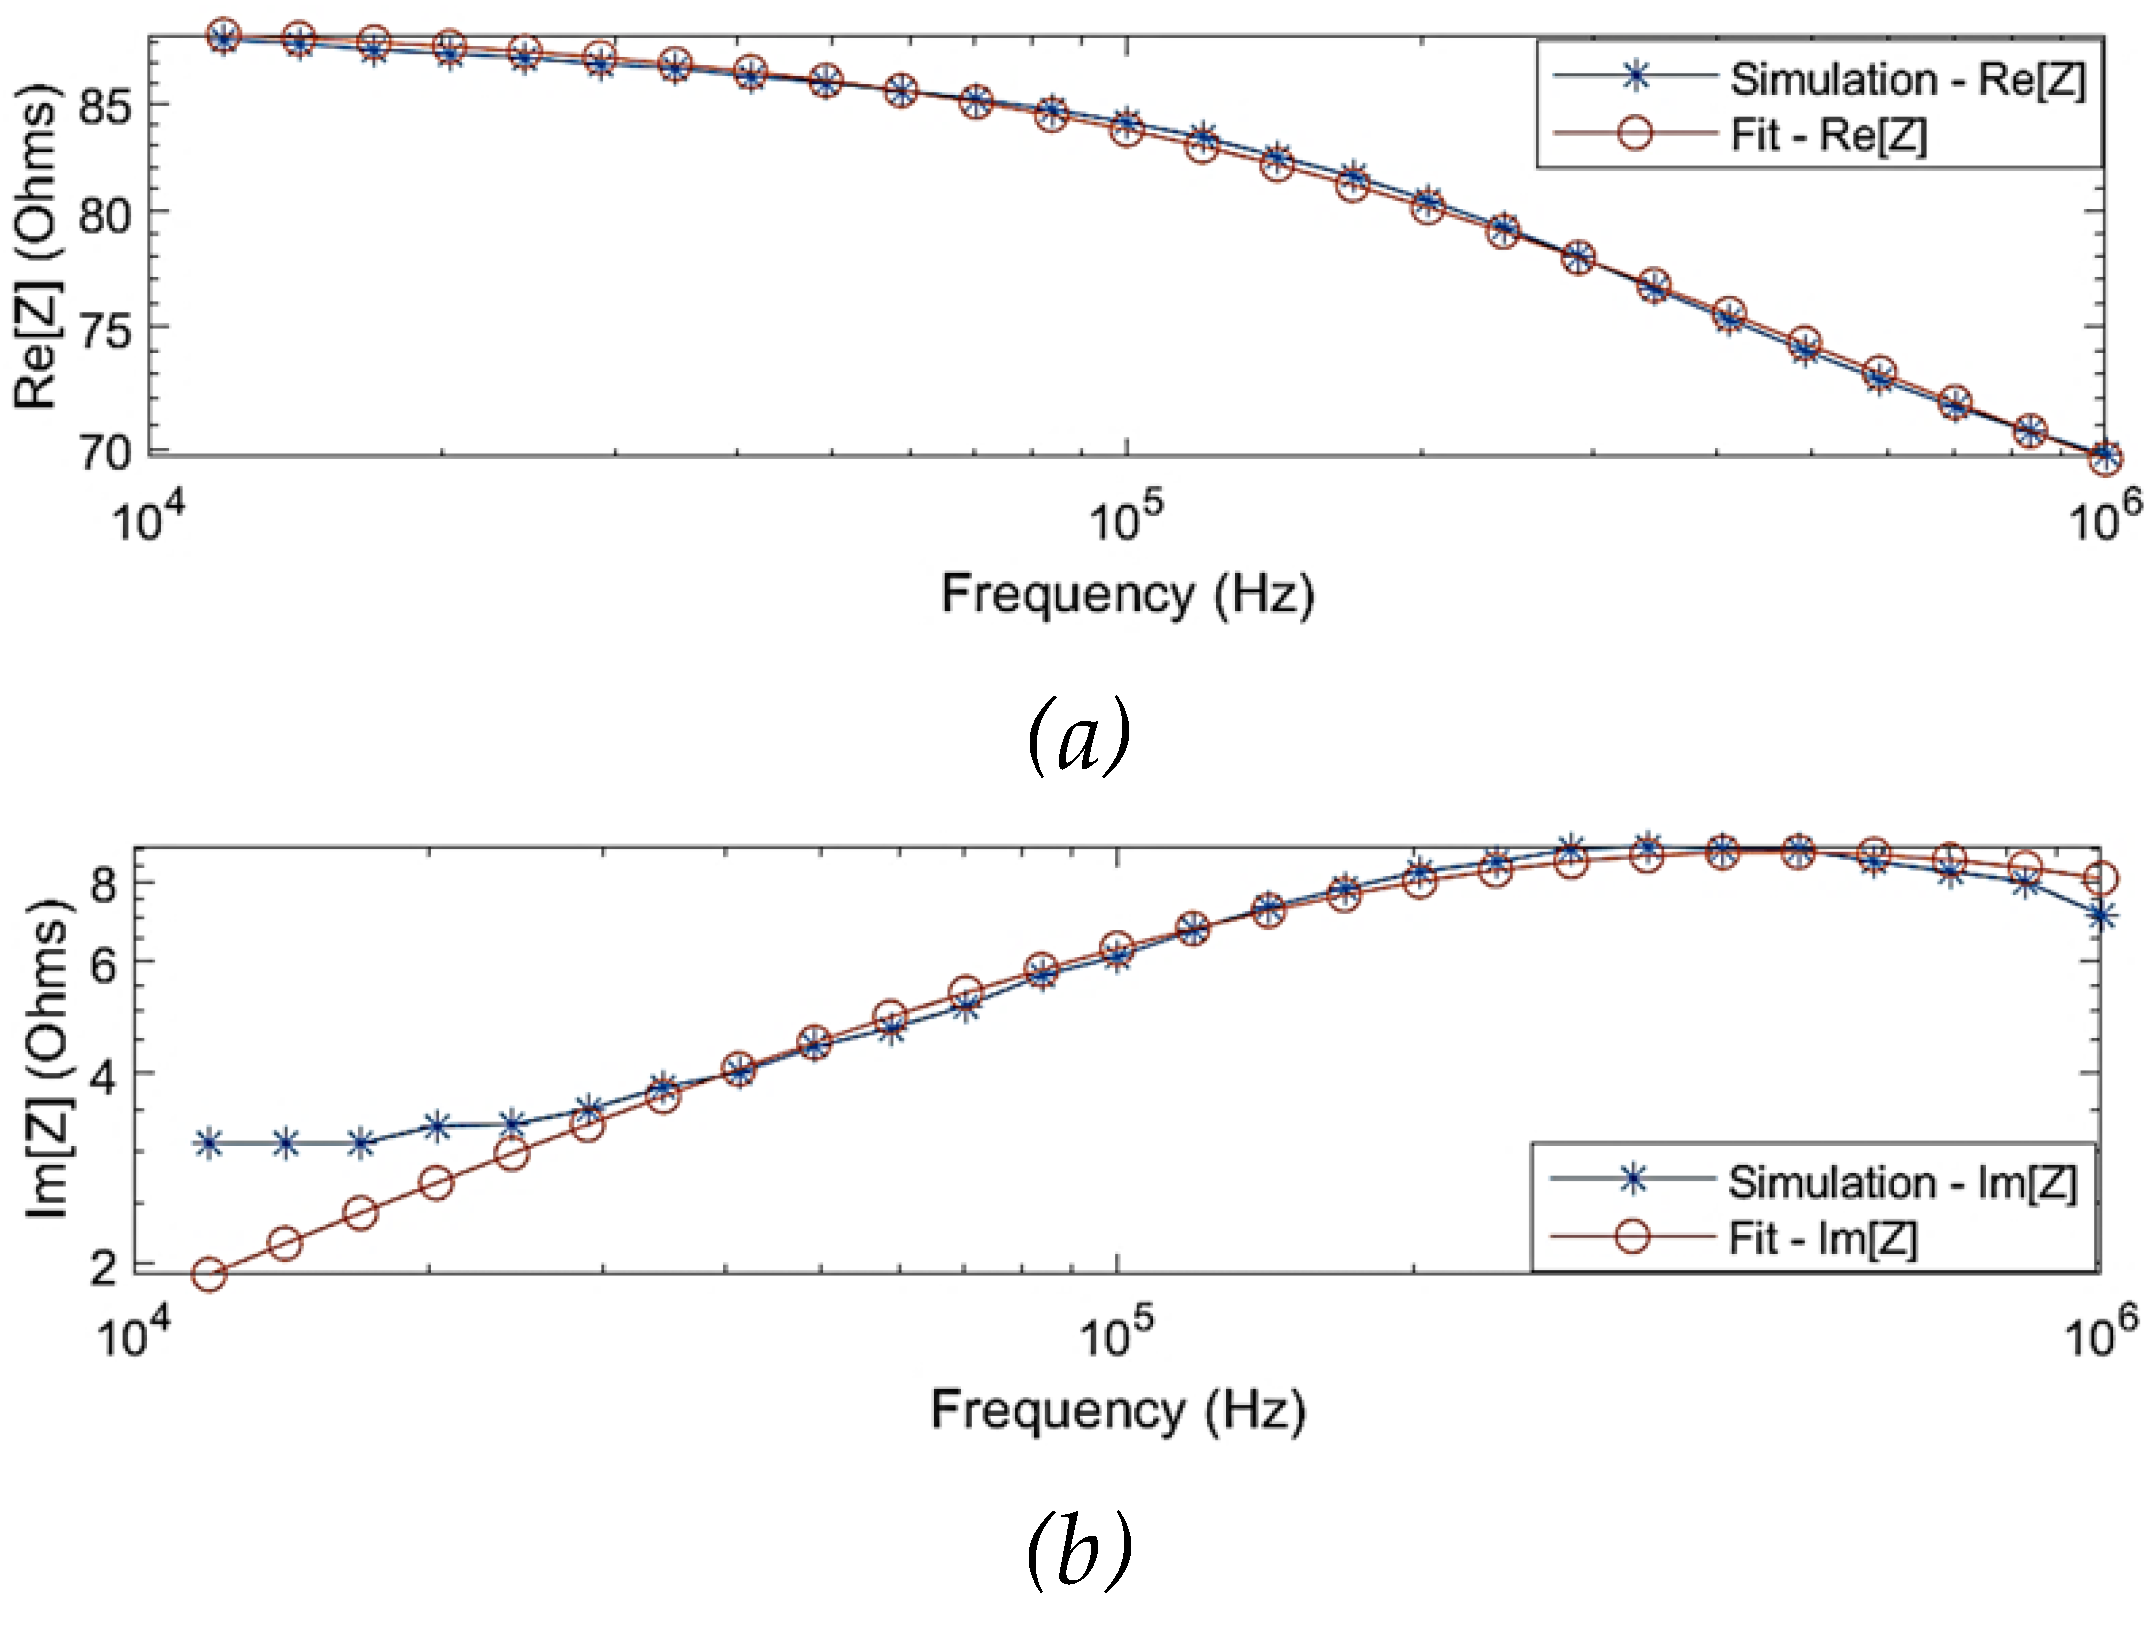
The SDCM was performed to identify the overall dielectric dispersion of the collective tissue domains.
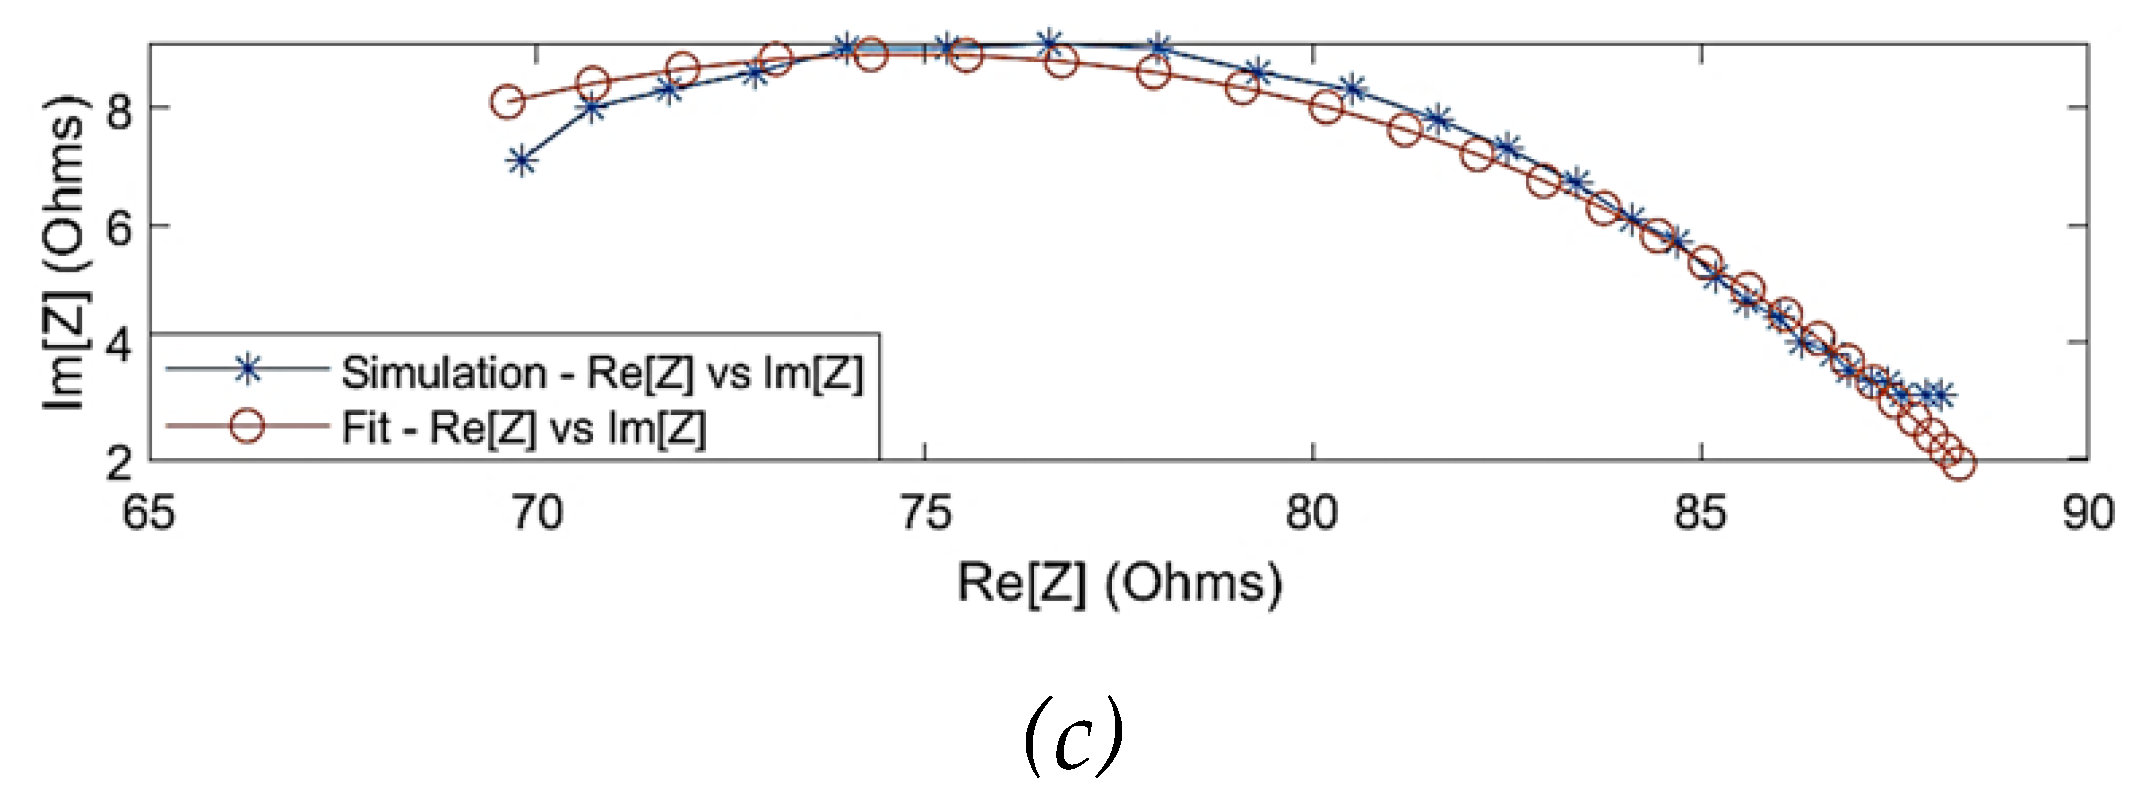
Figure 4 shows the comparison of the simulated impedance values before and after fitting. One of the observations from the simulation results was that the Cole behaviour was evident above a frequency of 10 kHz (
= 88
). The Cole parameters can be approximated by extrapolating the trend above 10 kHz to the real axis. However, the simulated impedance did not follow a Cole-type behaviour below 10 kHz, which can be explained through the overlap of
-dispersion and
-dispersion frequency regions as well as the dominantly resistive behaviour of blood. Hence, the simulation data for modelling was considered within 10 kHz and 1 MHz. The estimated Cole parameters are shown in
Table 1, and the model describing the overall dielectric behaviour can be written as follows:
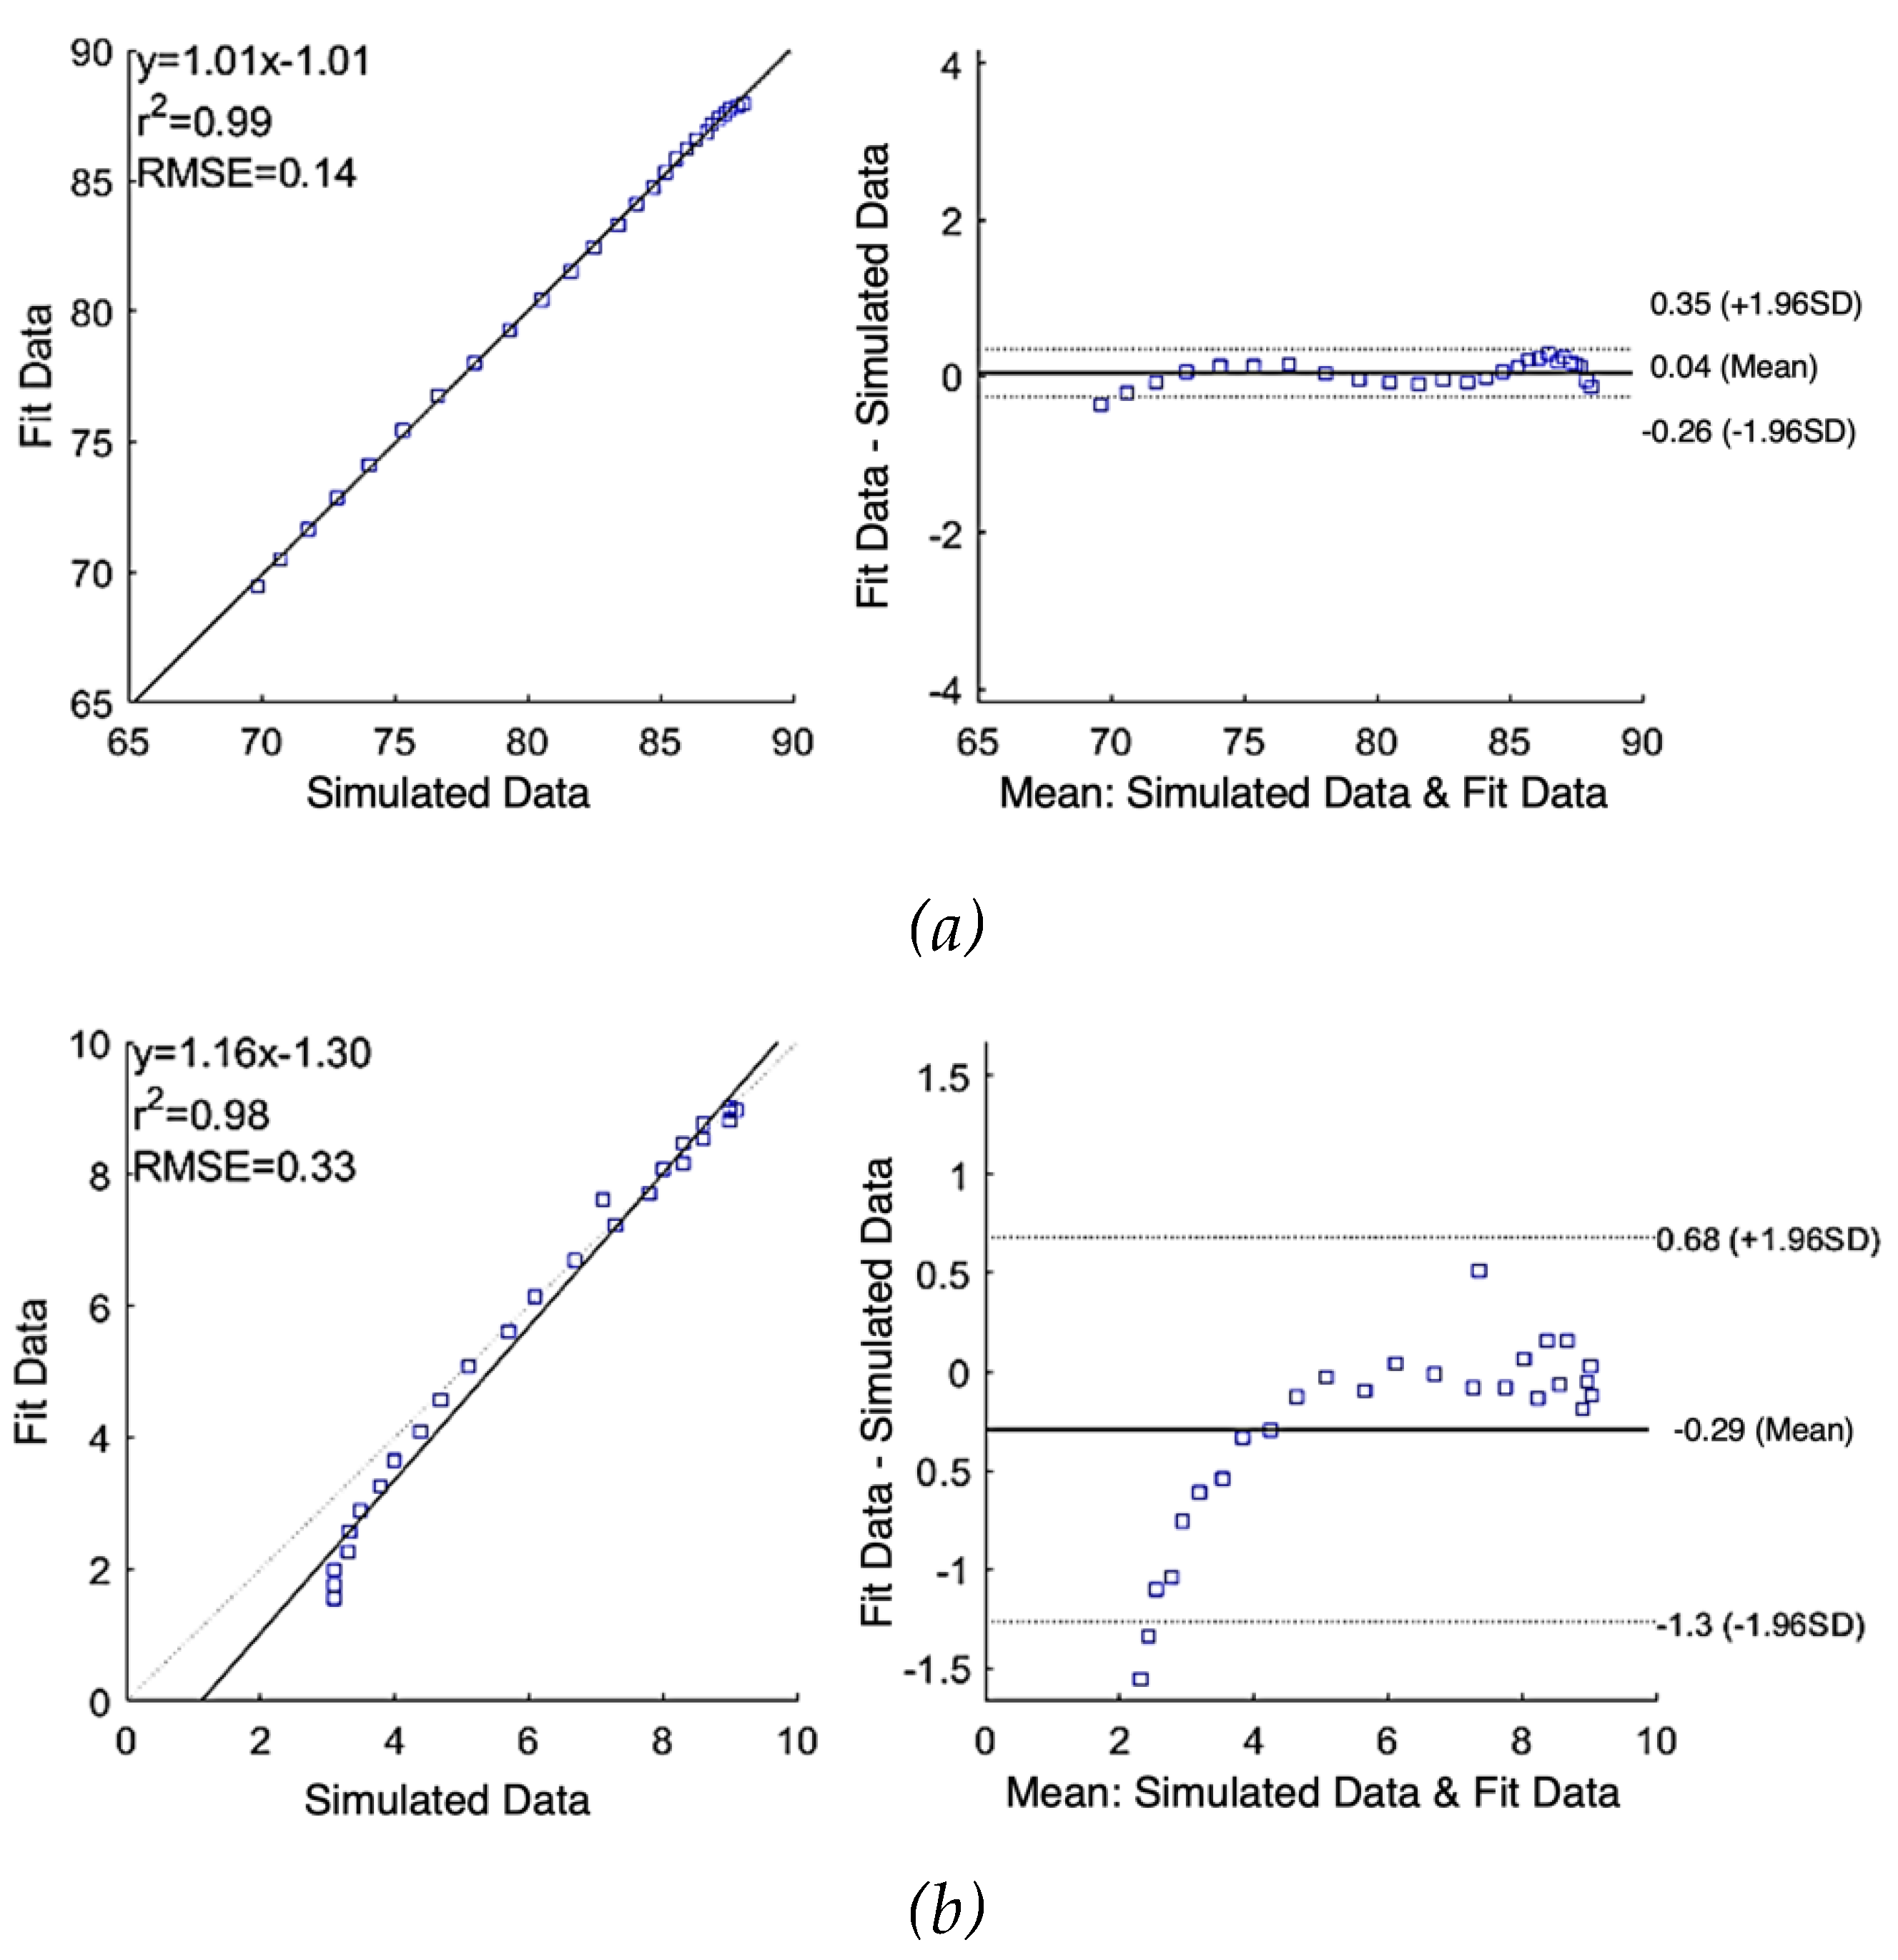
Figure 5 (a) and (b) show the correlation plot (left) and the Bland-Altman plot (right) of comparison between the raw simulated impedance and the fitted impedance after using SDCM, respectively. Pearson’s coefficients of correlation were 0.99 and 0.98, and RMSE of 0.14
and 0.33
for
and
, respectively. According to the Bland-Altman plots, the mean difference between raw data and fit data were 0.04
0.15
and -0.29
0.50
for
and
, respectively. The limits of agreement of
1.96SD represent the 95% confidence interval.
3.1.3. Multi-Dispersion Cole Model Fitting
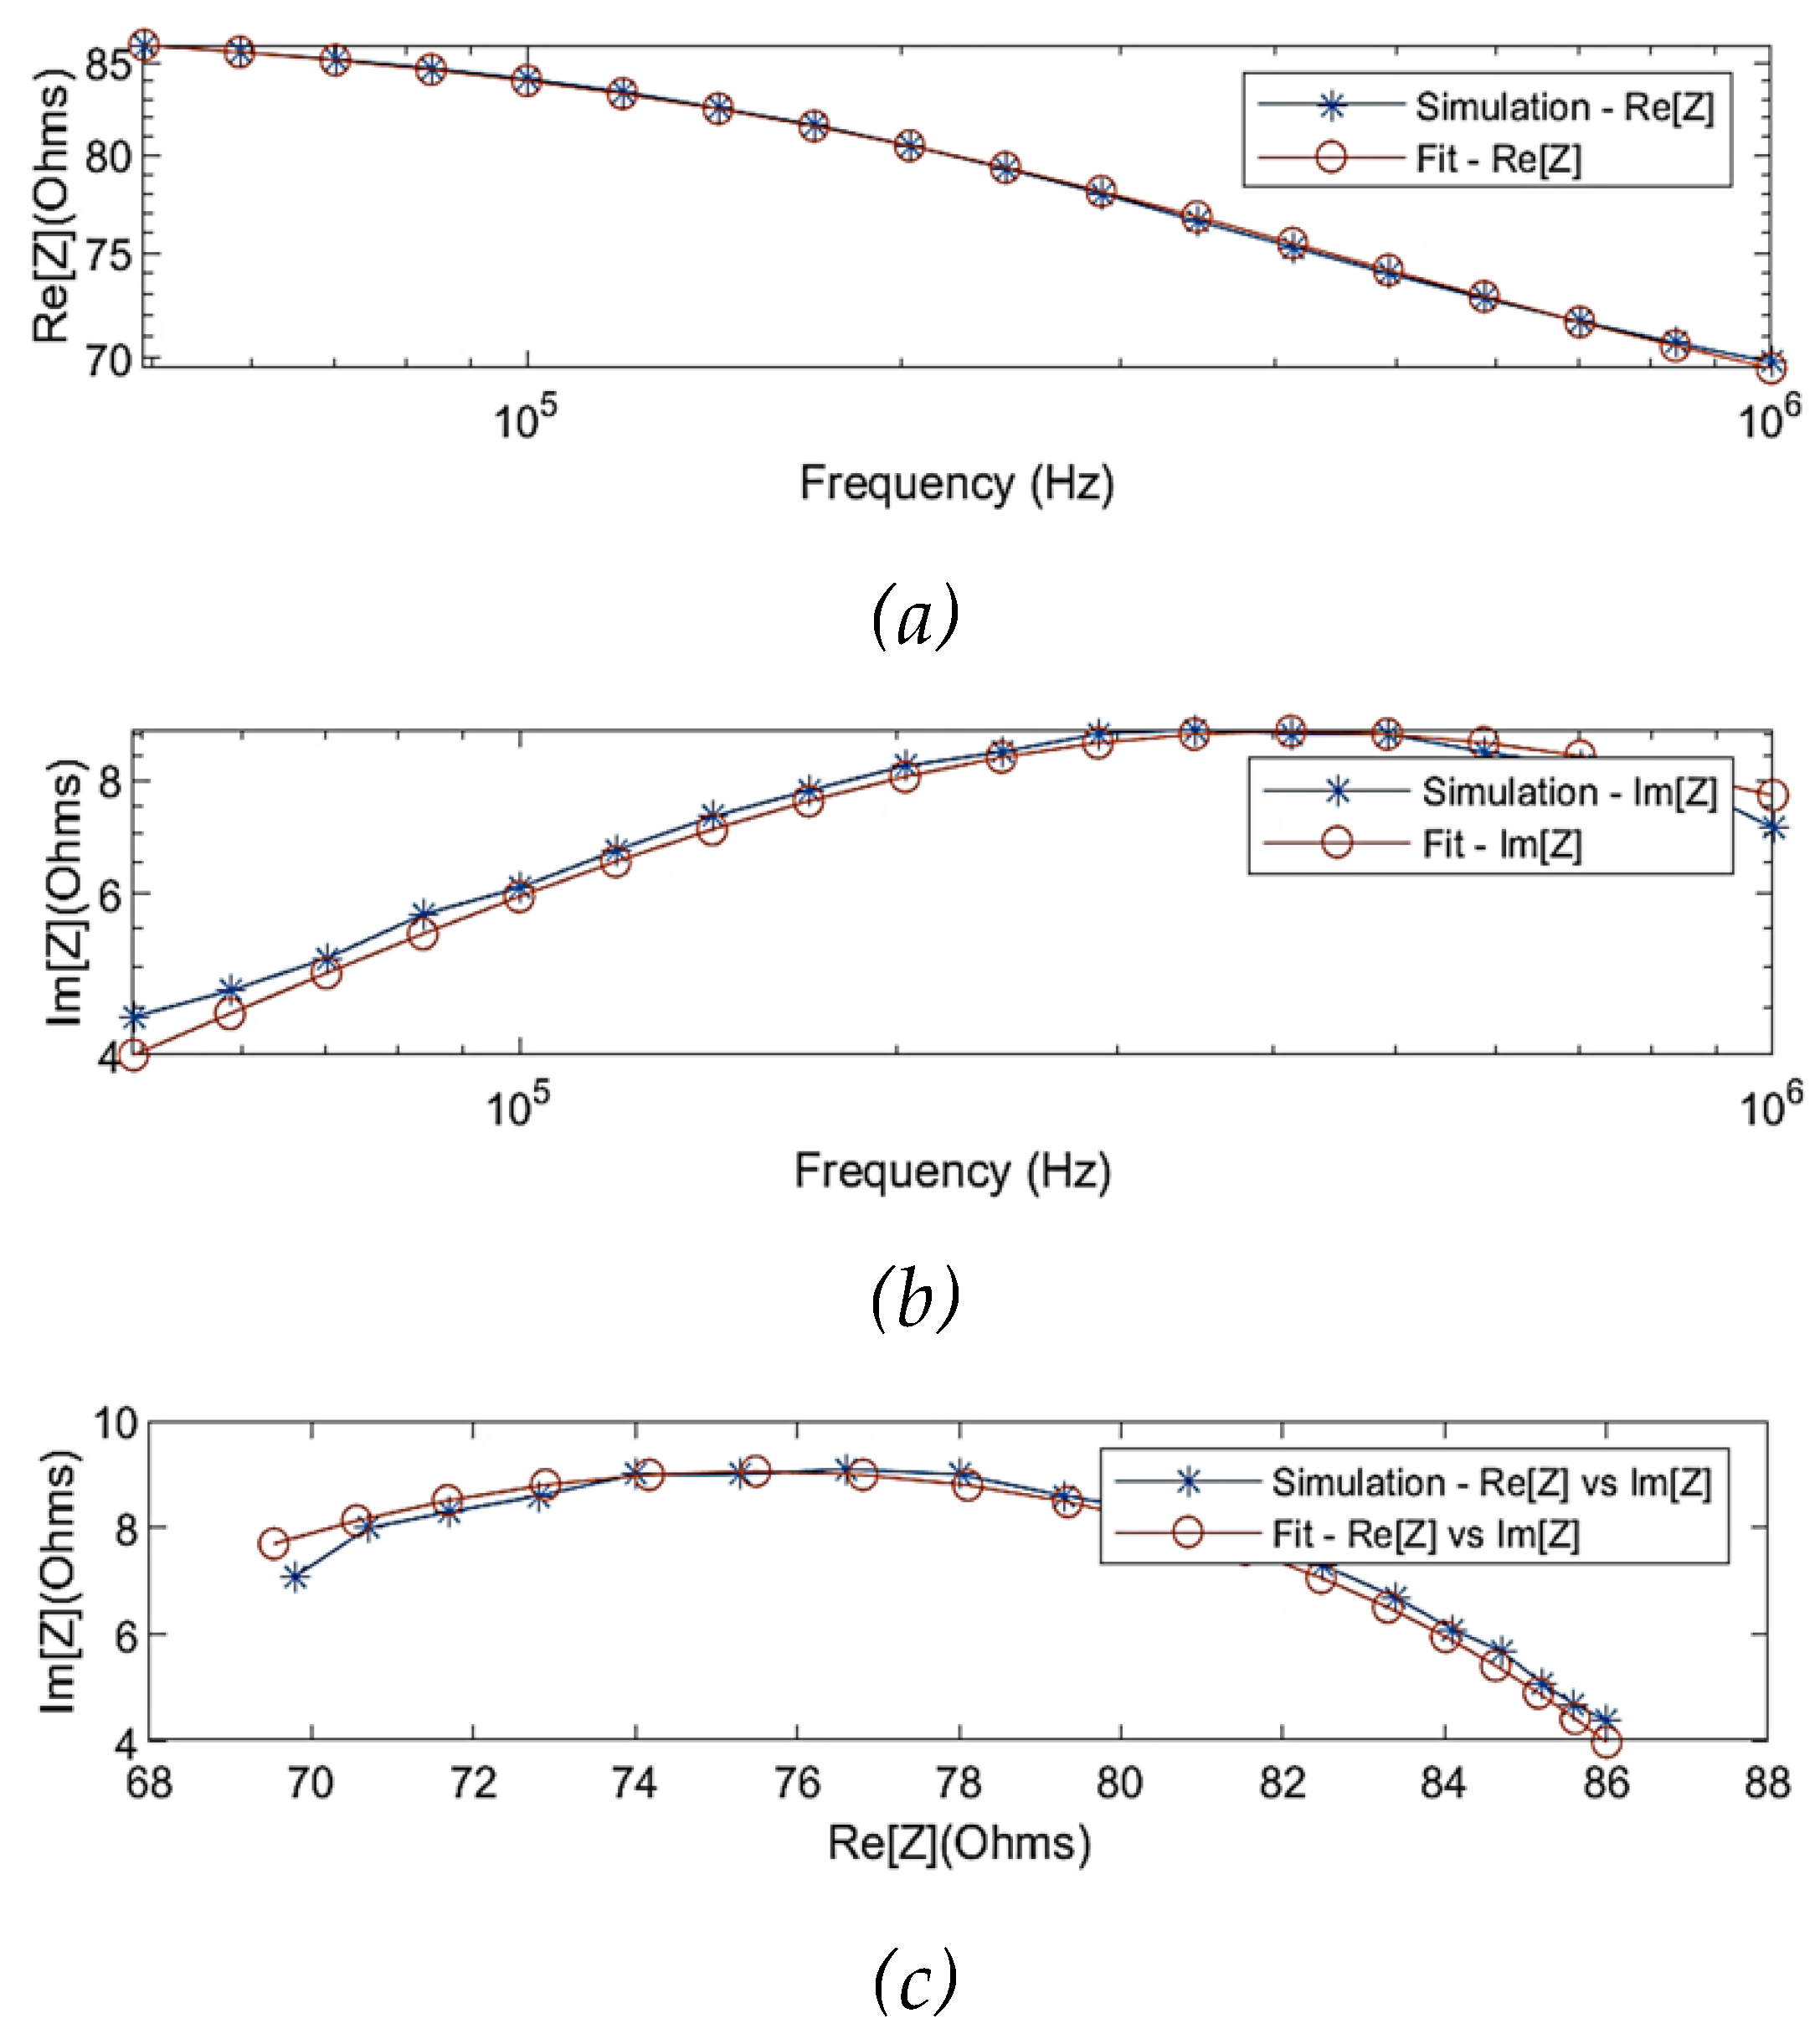
Figure 6 illustrates the simulated real part and imaginary part of impedance before and after fitting using the MDCM. The estimated Cole parameters are listed in
Table 2, and thereby Equation 9 can be defined as:
As shown in
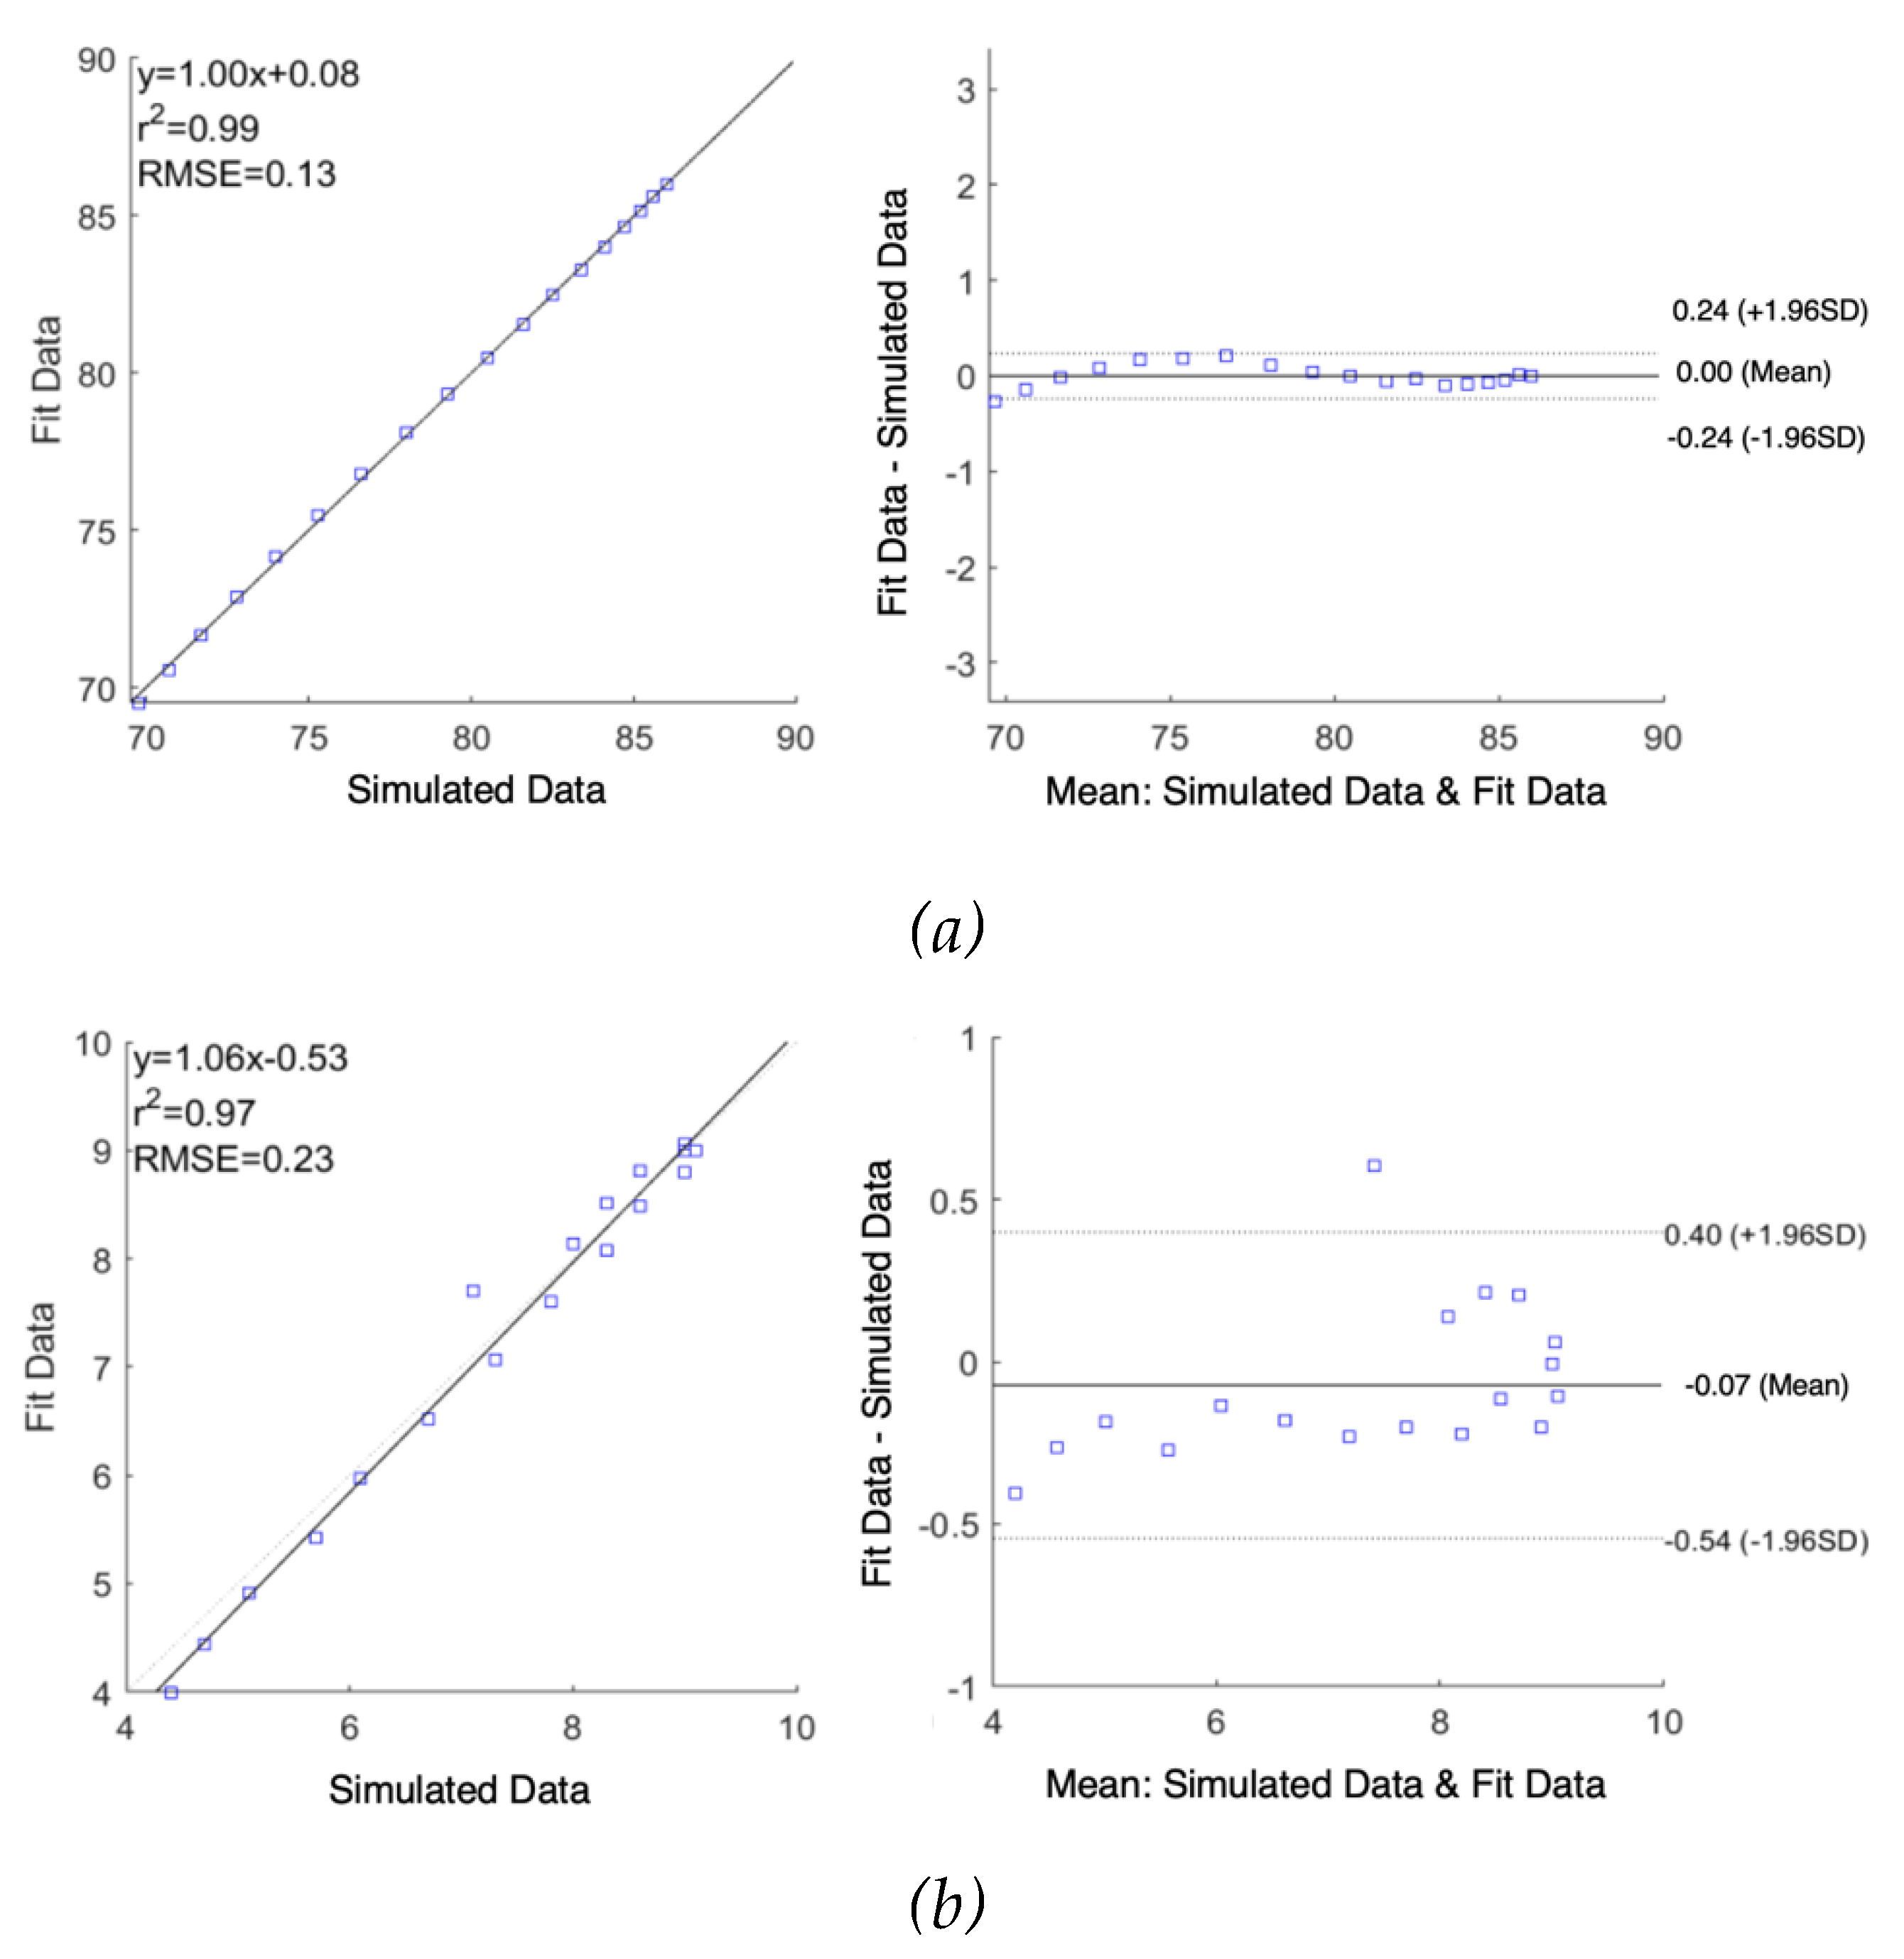
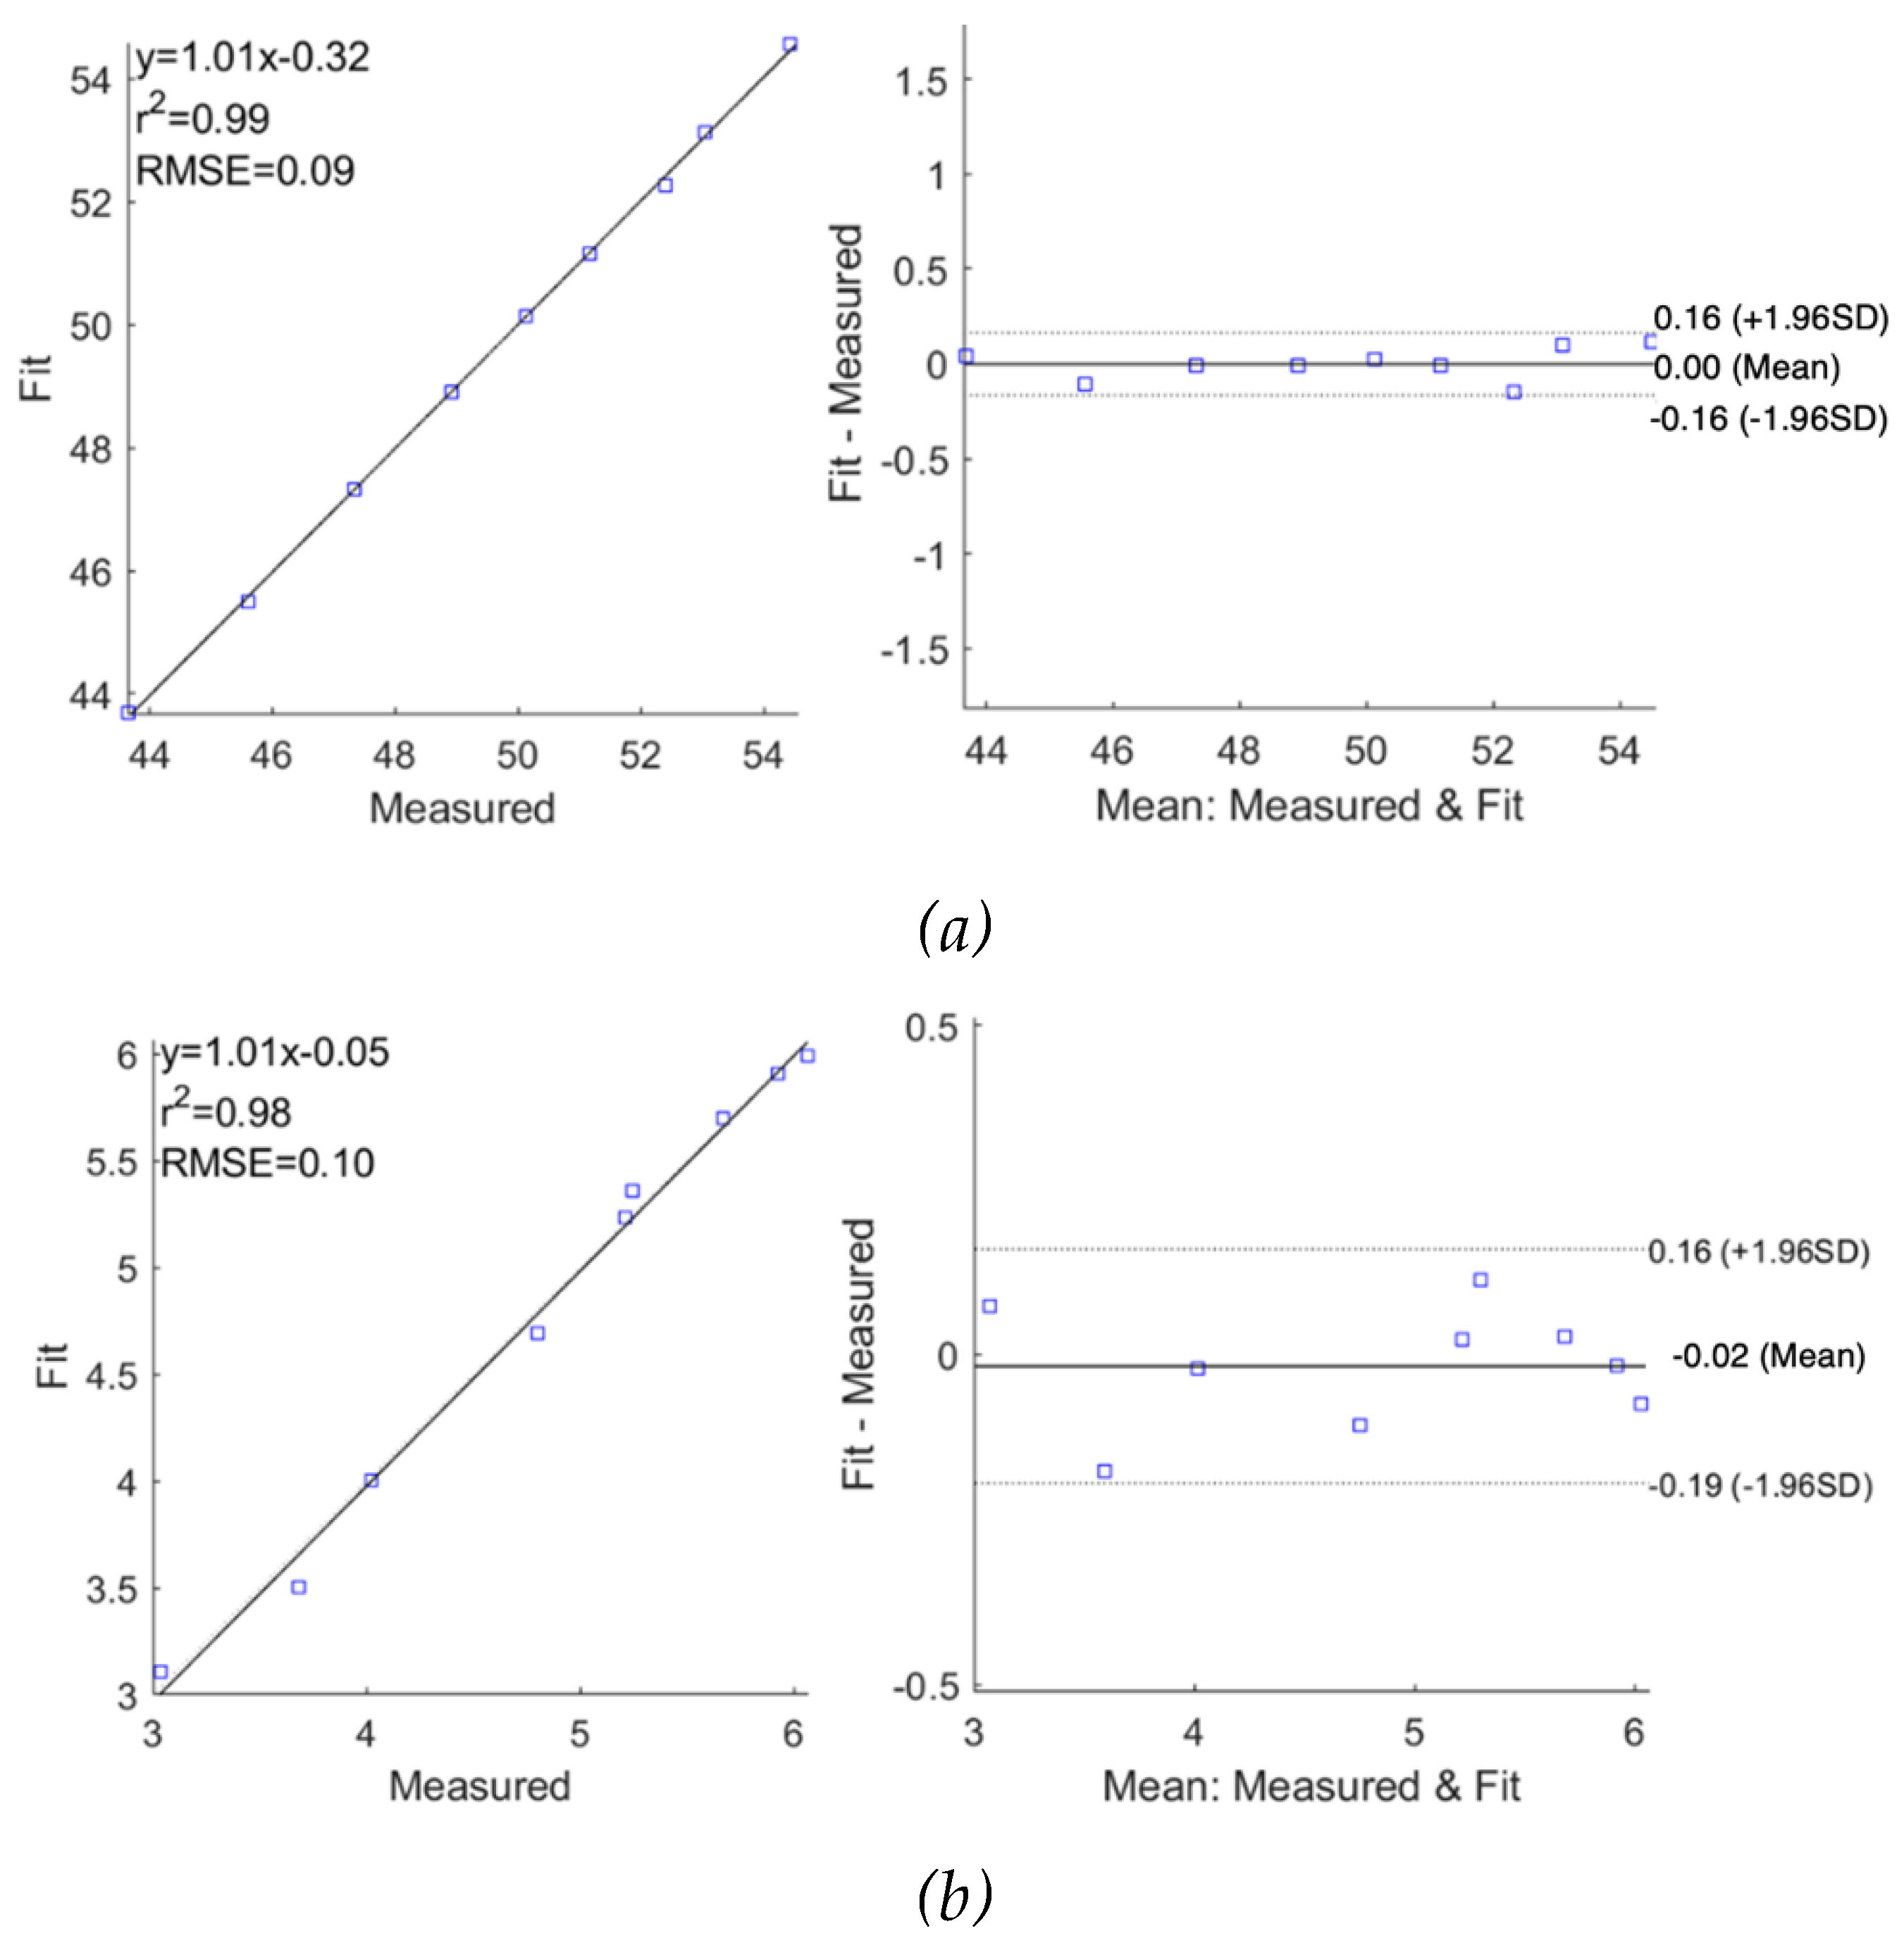
Figure 7, correlation plots demonstrate a high correlation between raw simulated impedance and fit impedance with the Pearson’s correlation coefficients of
and
were 0.99 and 0.97 along with RMSE of 0.13
and 0.23
, respectively. The difference in raw simulated impedance values and fit impedance values were evaluated by Bland-Altman plots, establishing the good quality of fitting. The mean difference between raw data and fit data were 0.00
0.12
and -0.07
0.24
for
and
, respectively.
3.2. Pilot Study
3.2.1. Measured Impedance
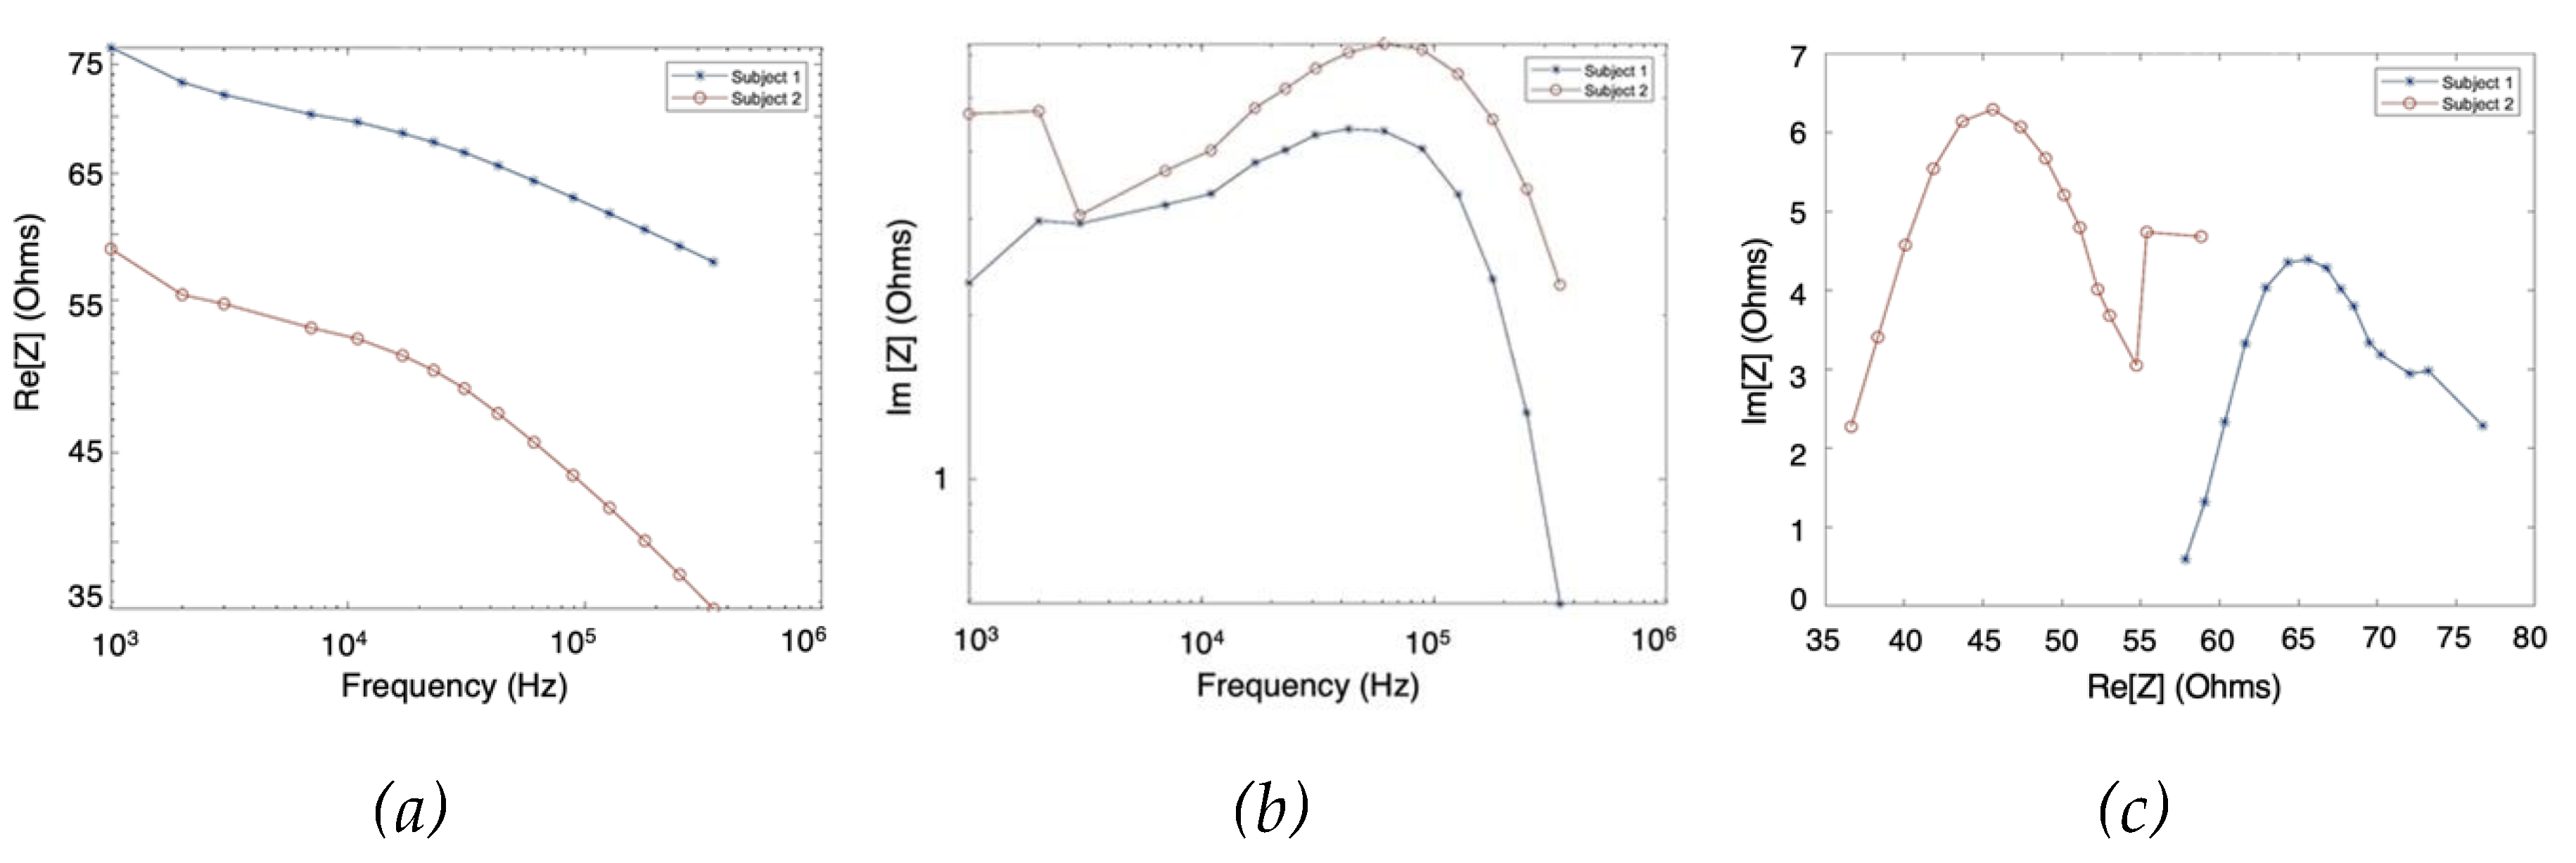
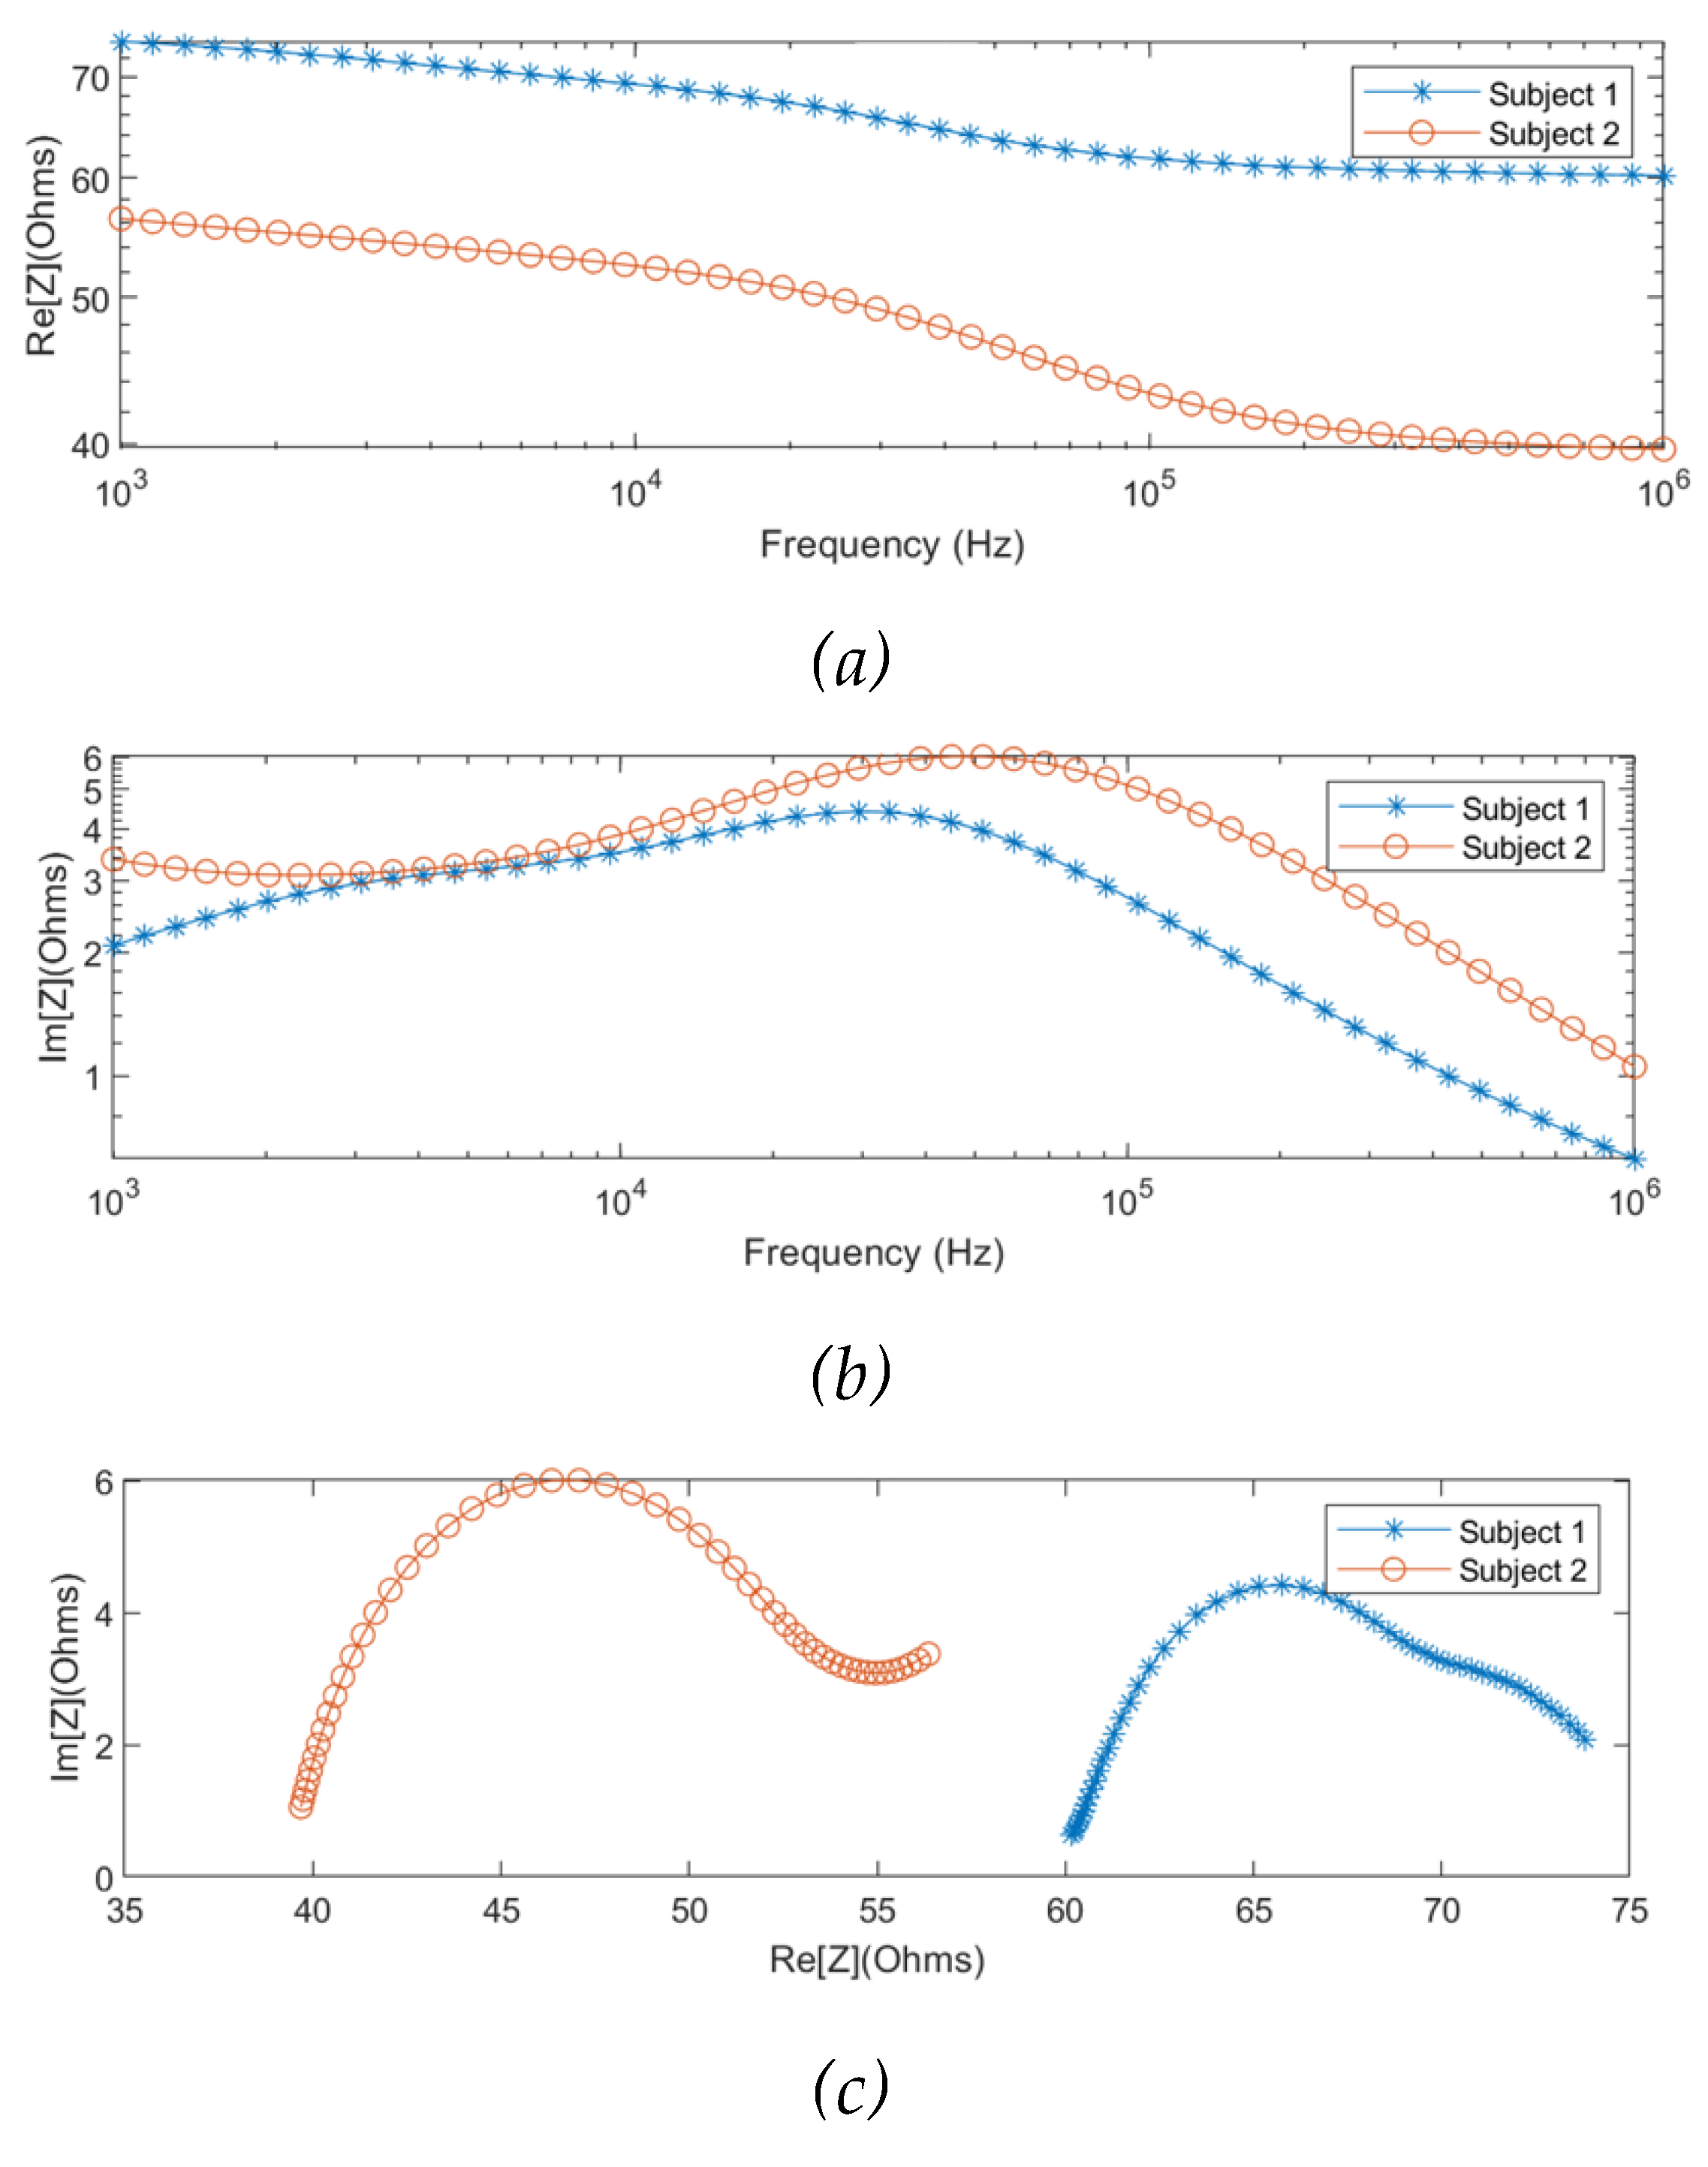
The MF-BIA was carried out on 2 healthy subjects using the Quadra® device. For each subject, measurement was taken for a period of 10 seconds to ensure the consistency of the obtained spectra. For each frequency, a period of 10 seconds resulted in 10000 samples of spectra, from which was calculated an average spectrum for each subject. As shown in
Figure 8, the two subjects exhibited similar impedance changes with frequency, while the impedance ranges were different due to different proportions of tissues between individuals.
3.2.2. Single-Dispersion Cole Modelling
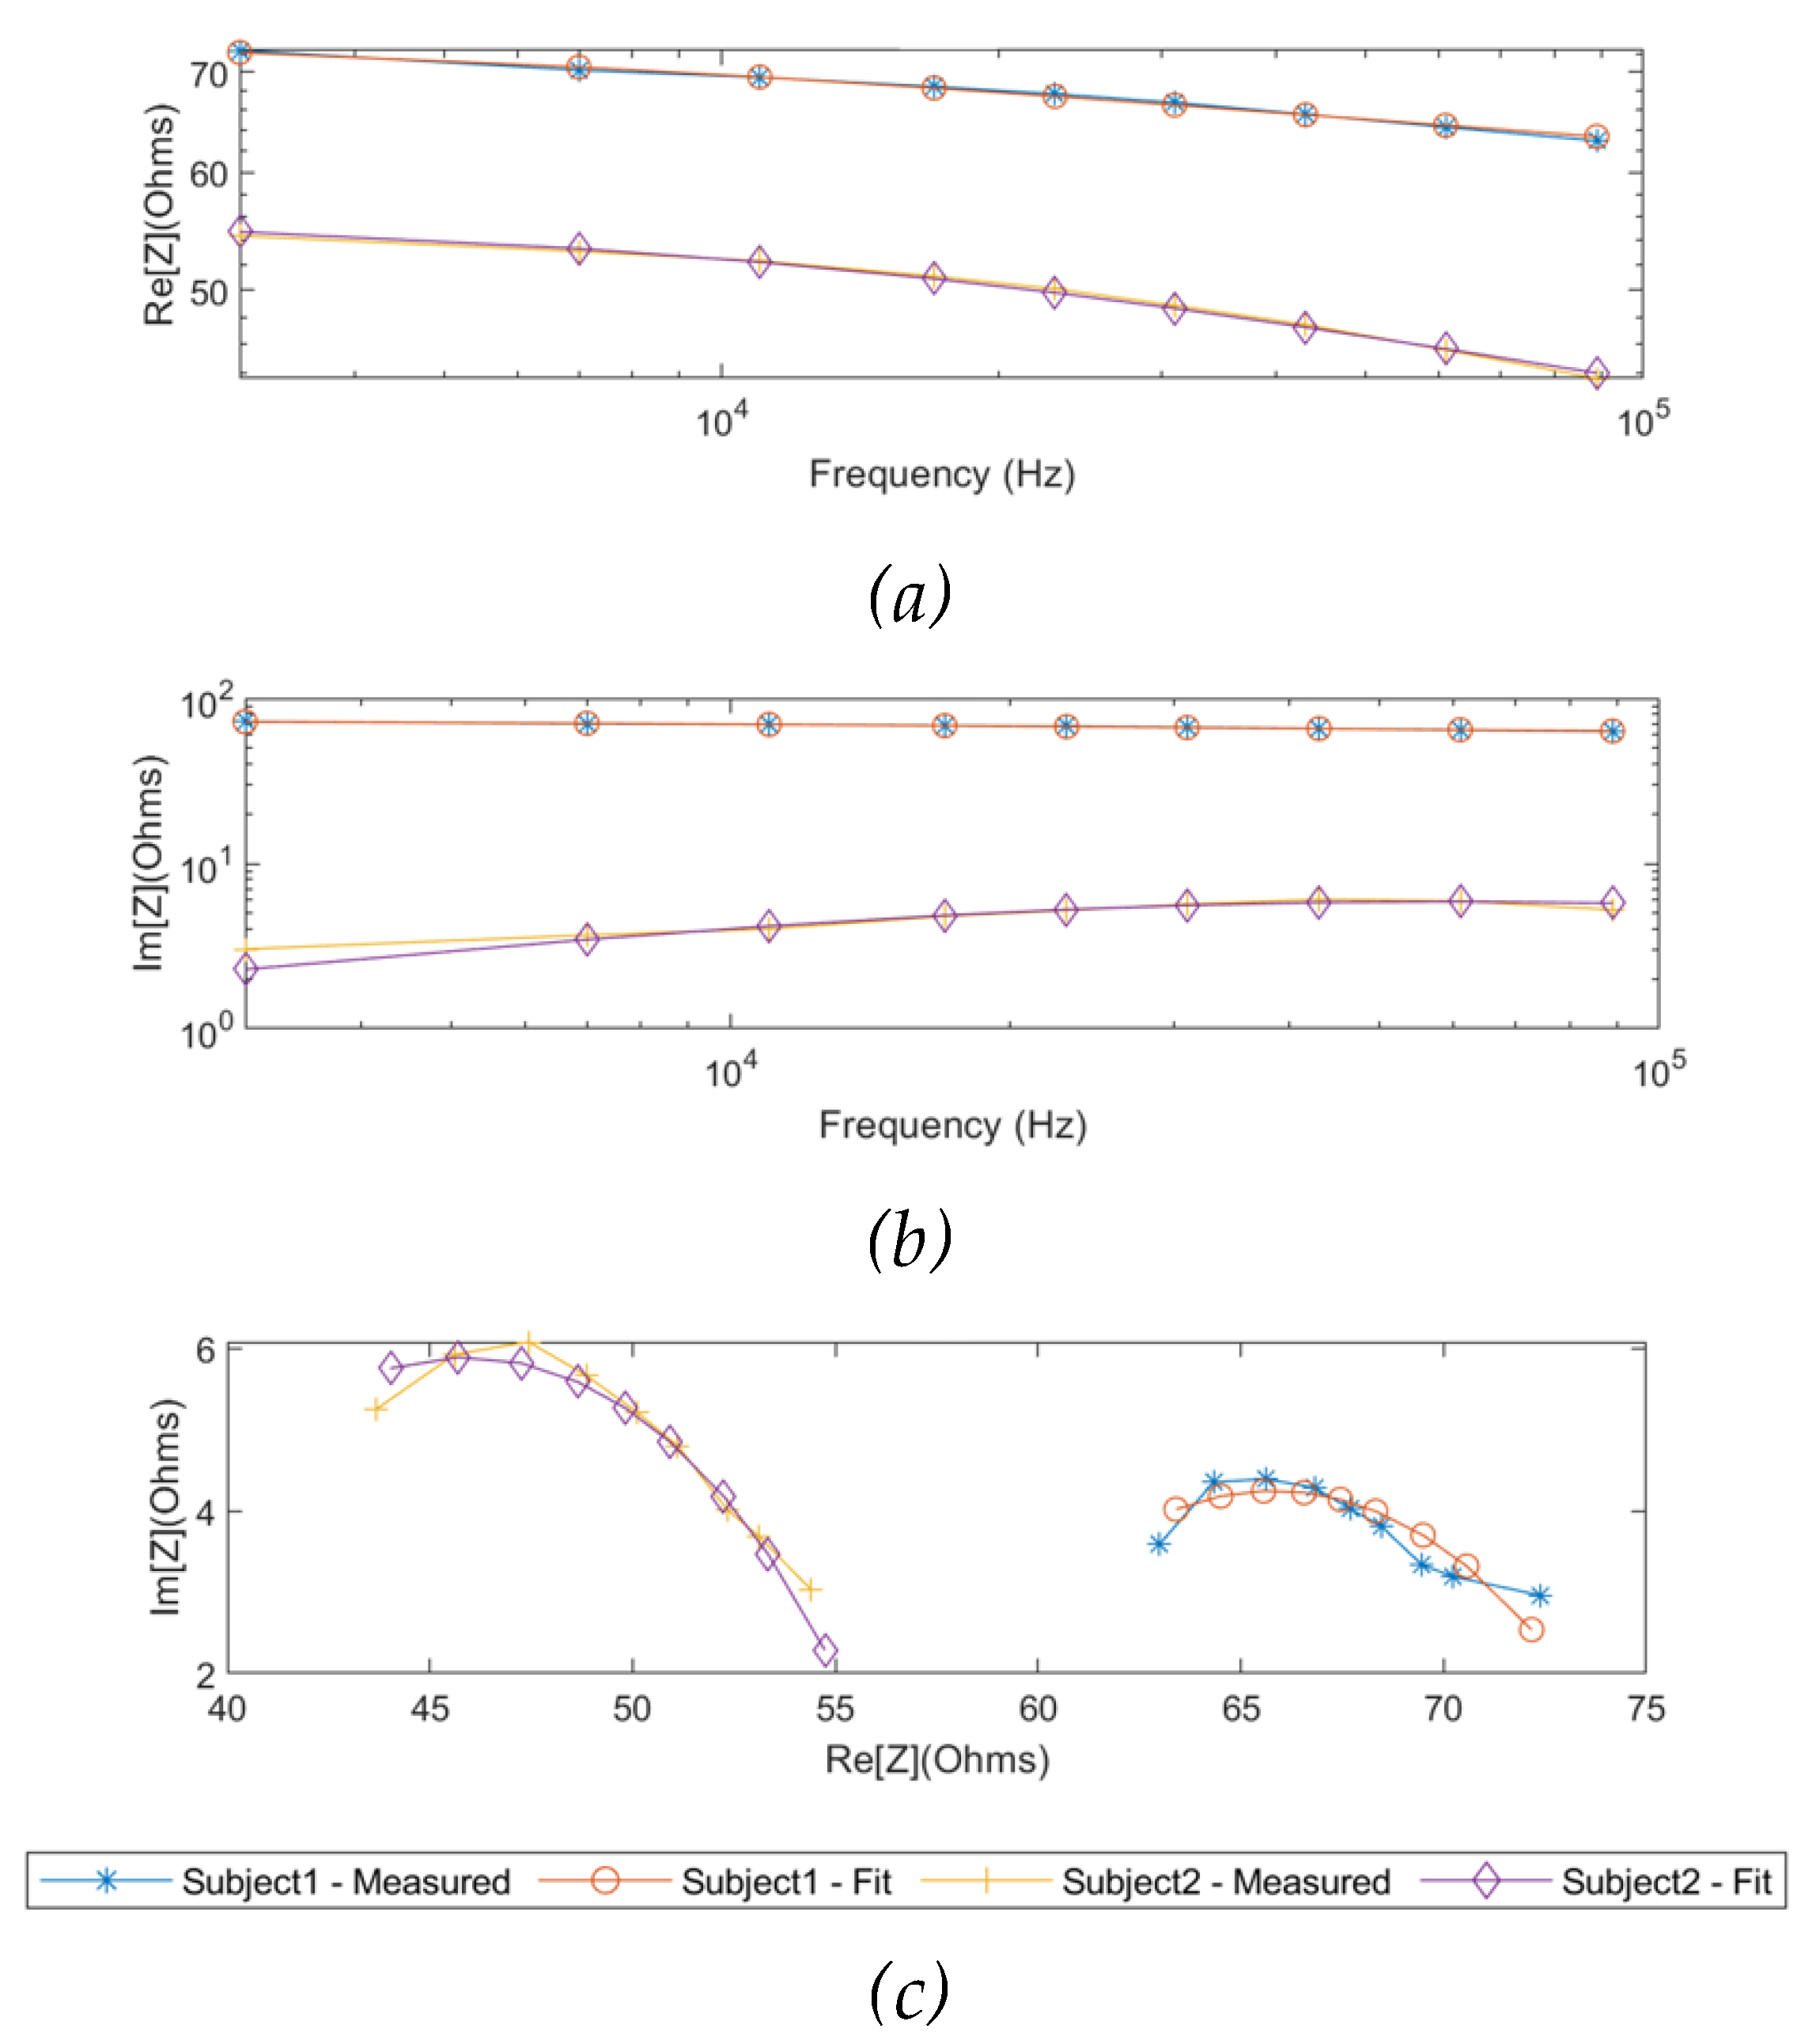
As the same as the simulation results, the measured real part and imaginary part of impedance from two subjects were fitted using the SDCM from 1 kHz to 349 kHz, as shown in
Figure 9. The Cole parameters of each subject were estimated and tabulated in
Table 3. Additionally, the overall Cole models for the two subjects were demonstrated in Equation 12 and Equation 13, respectively.
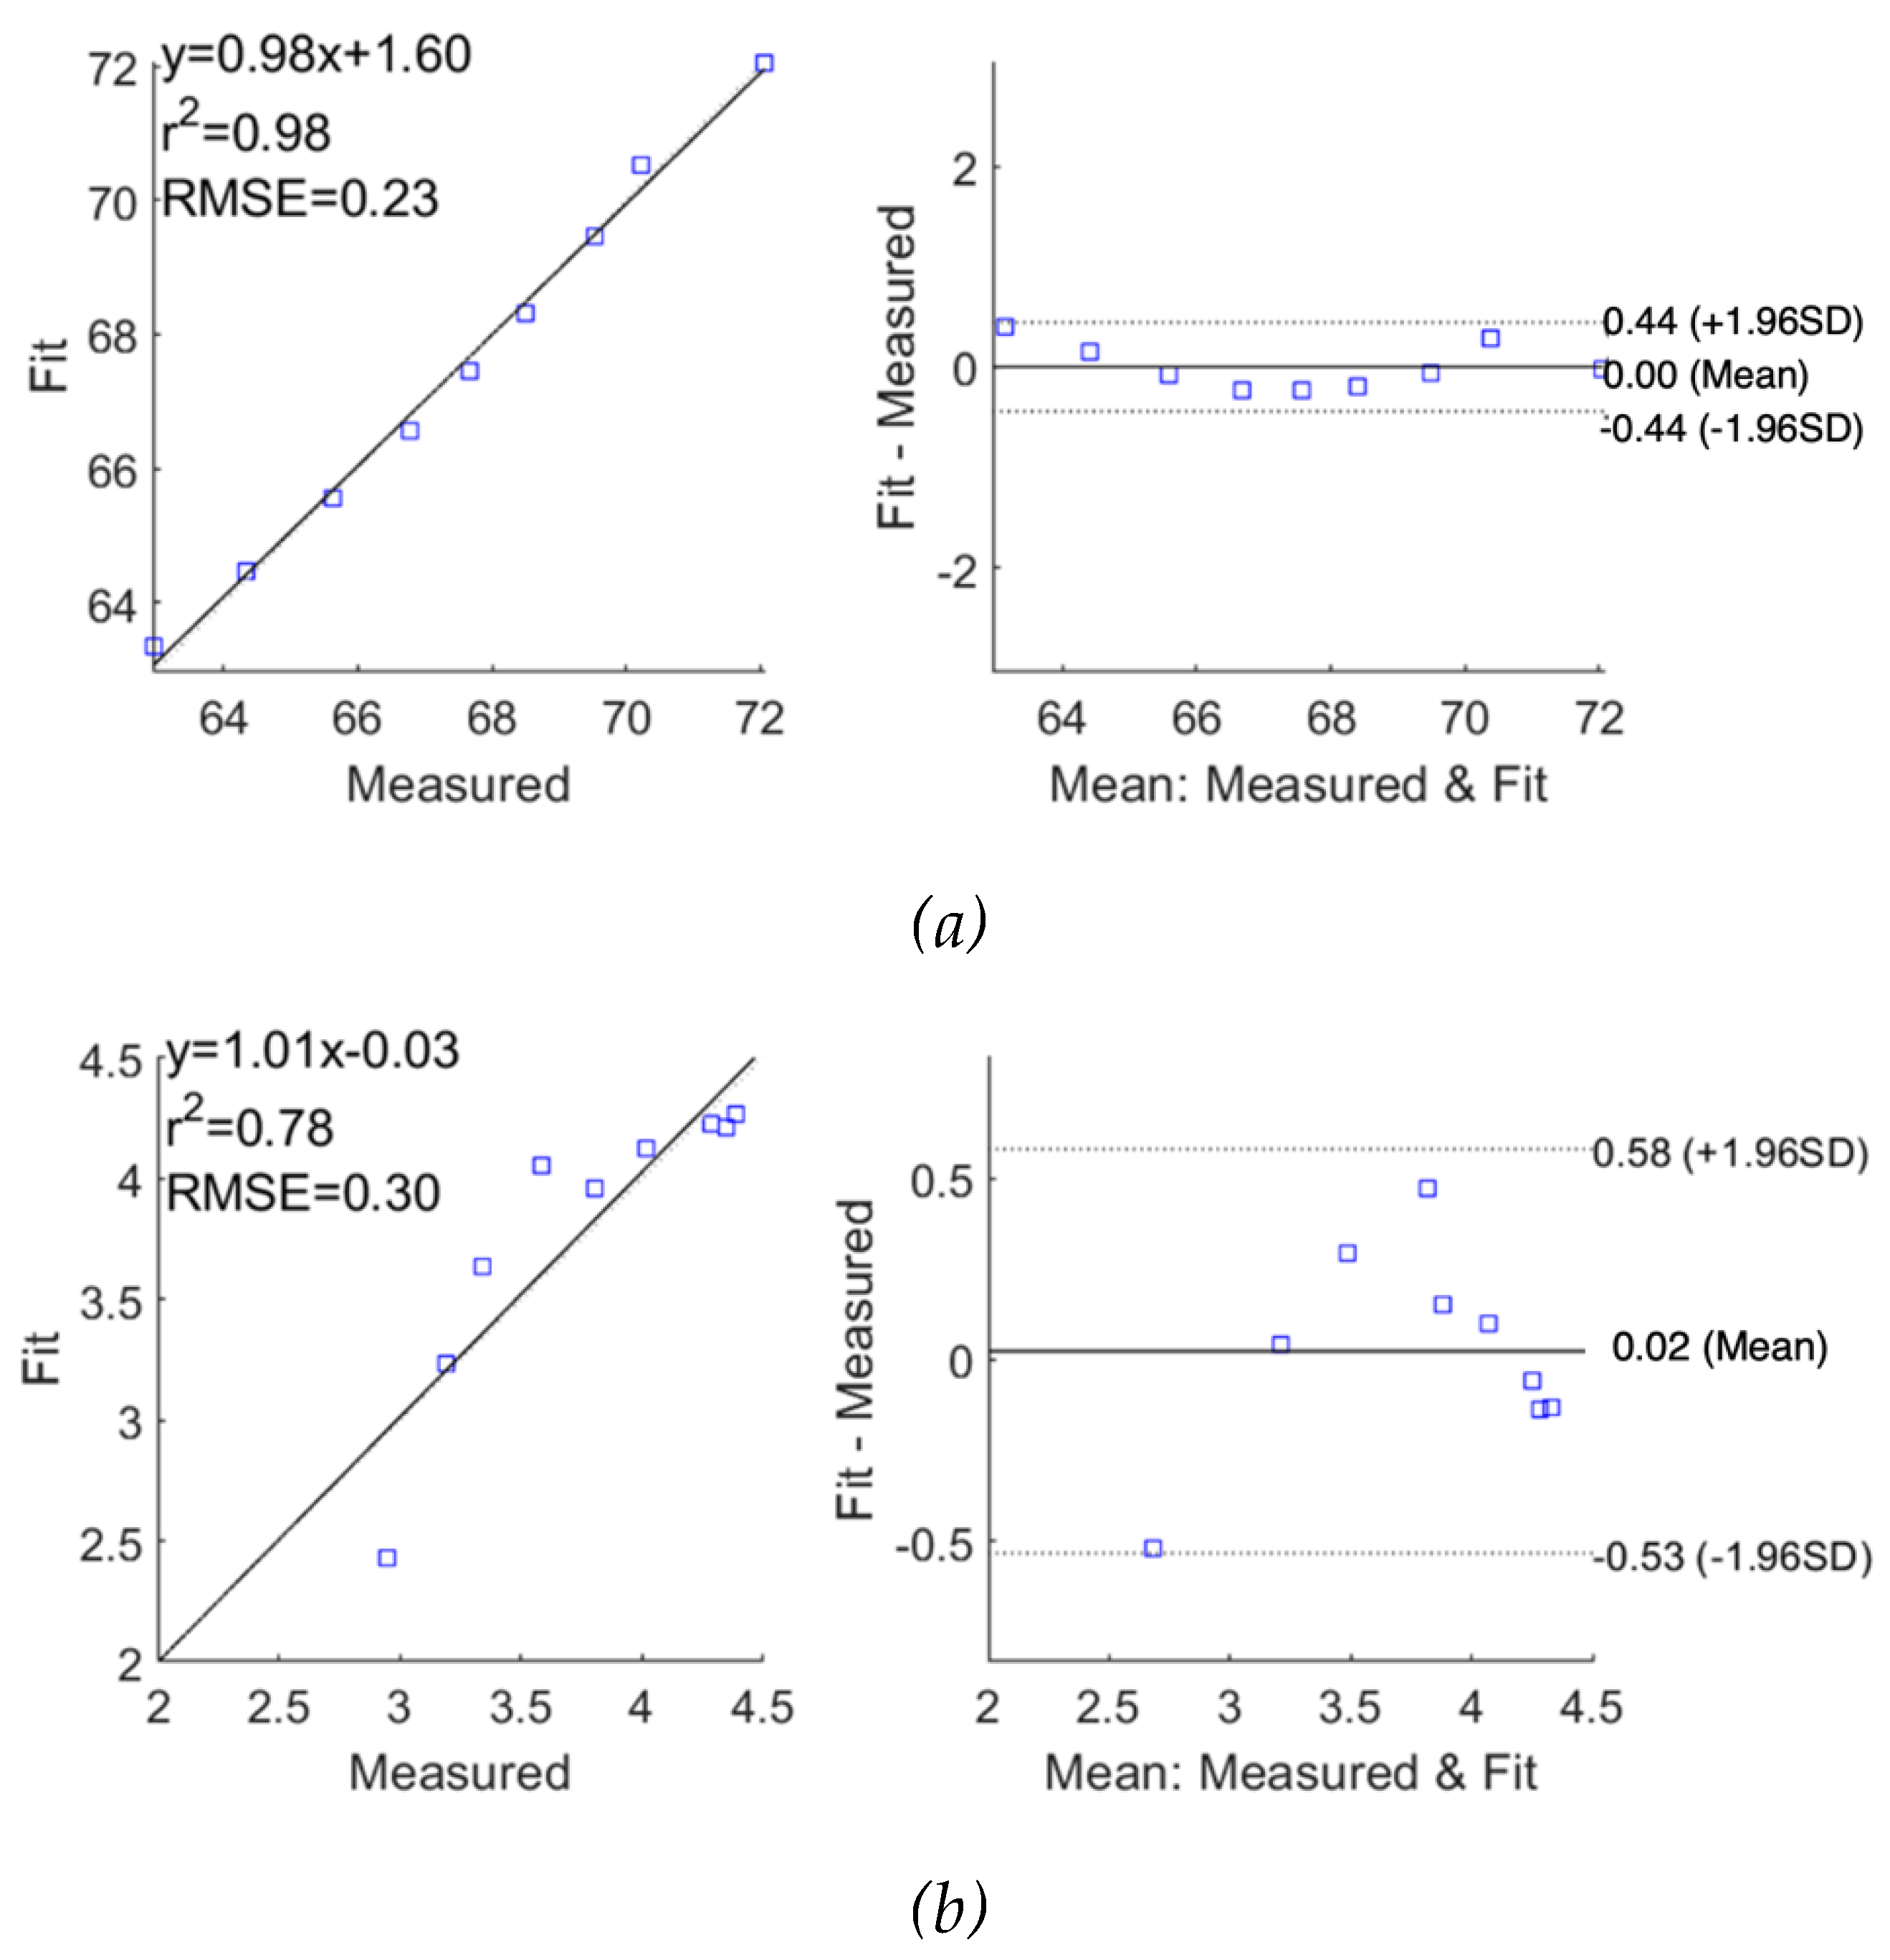
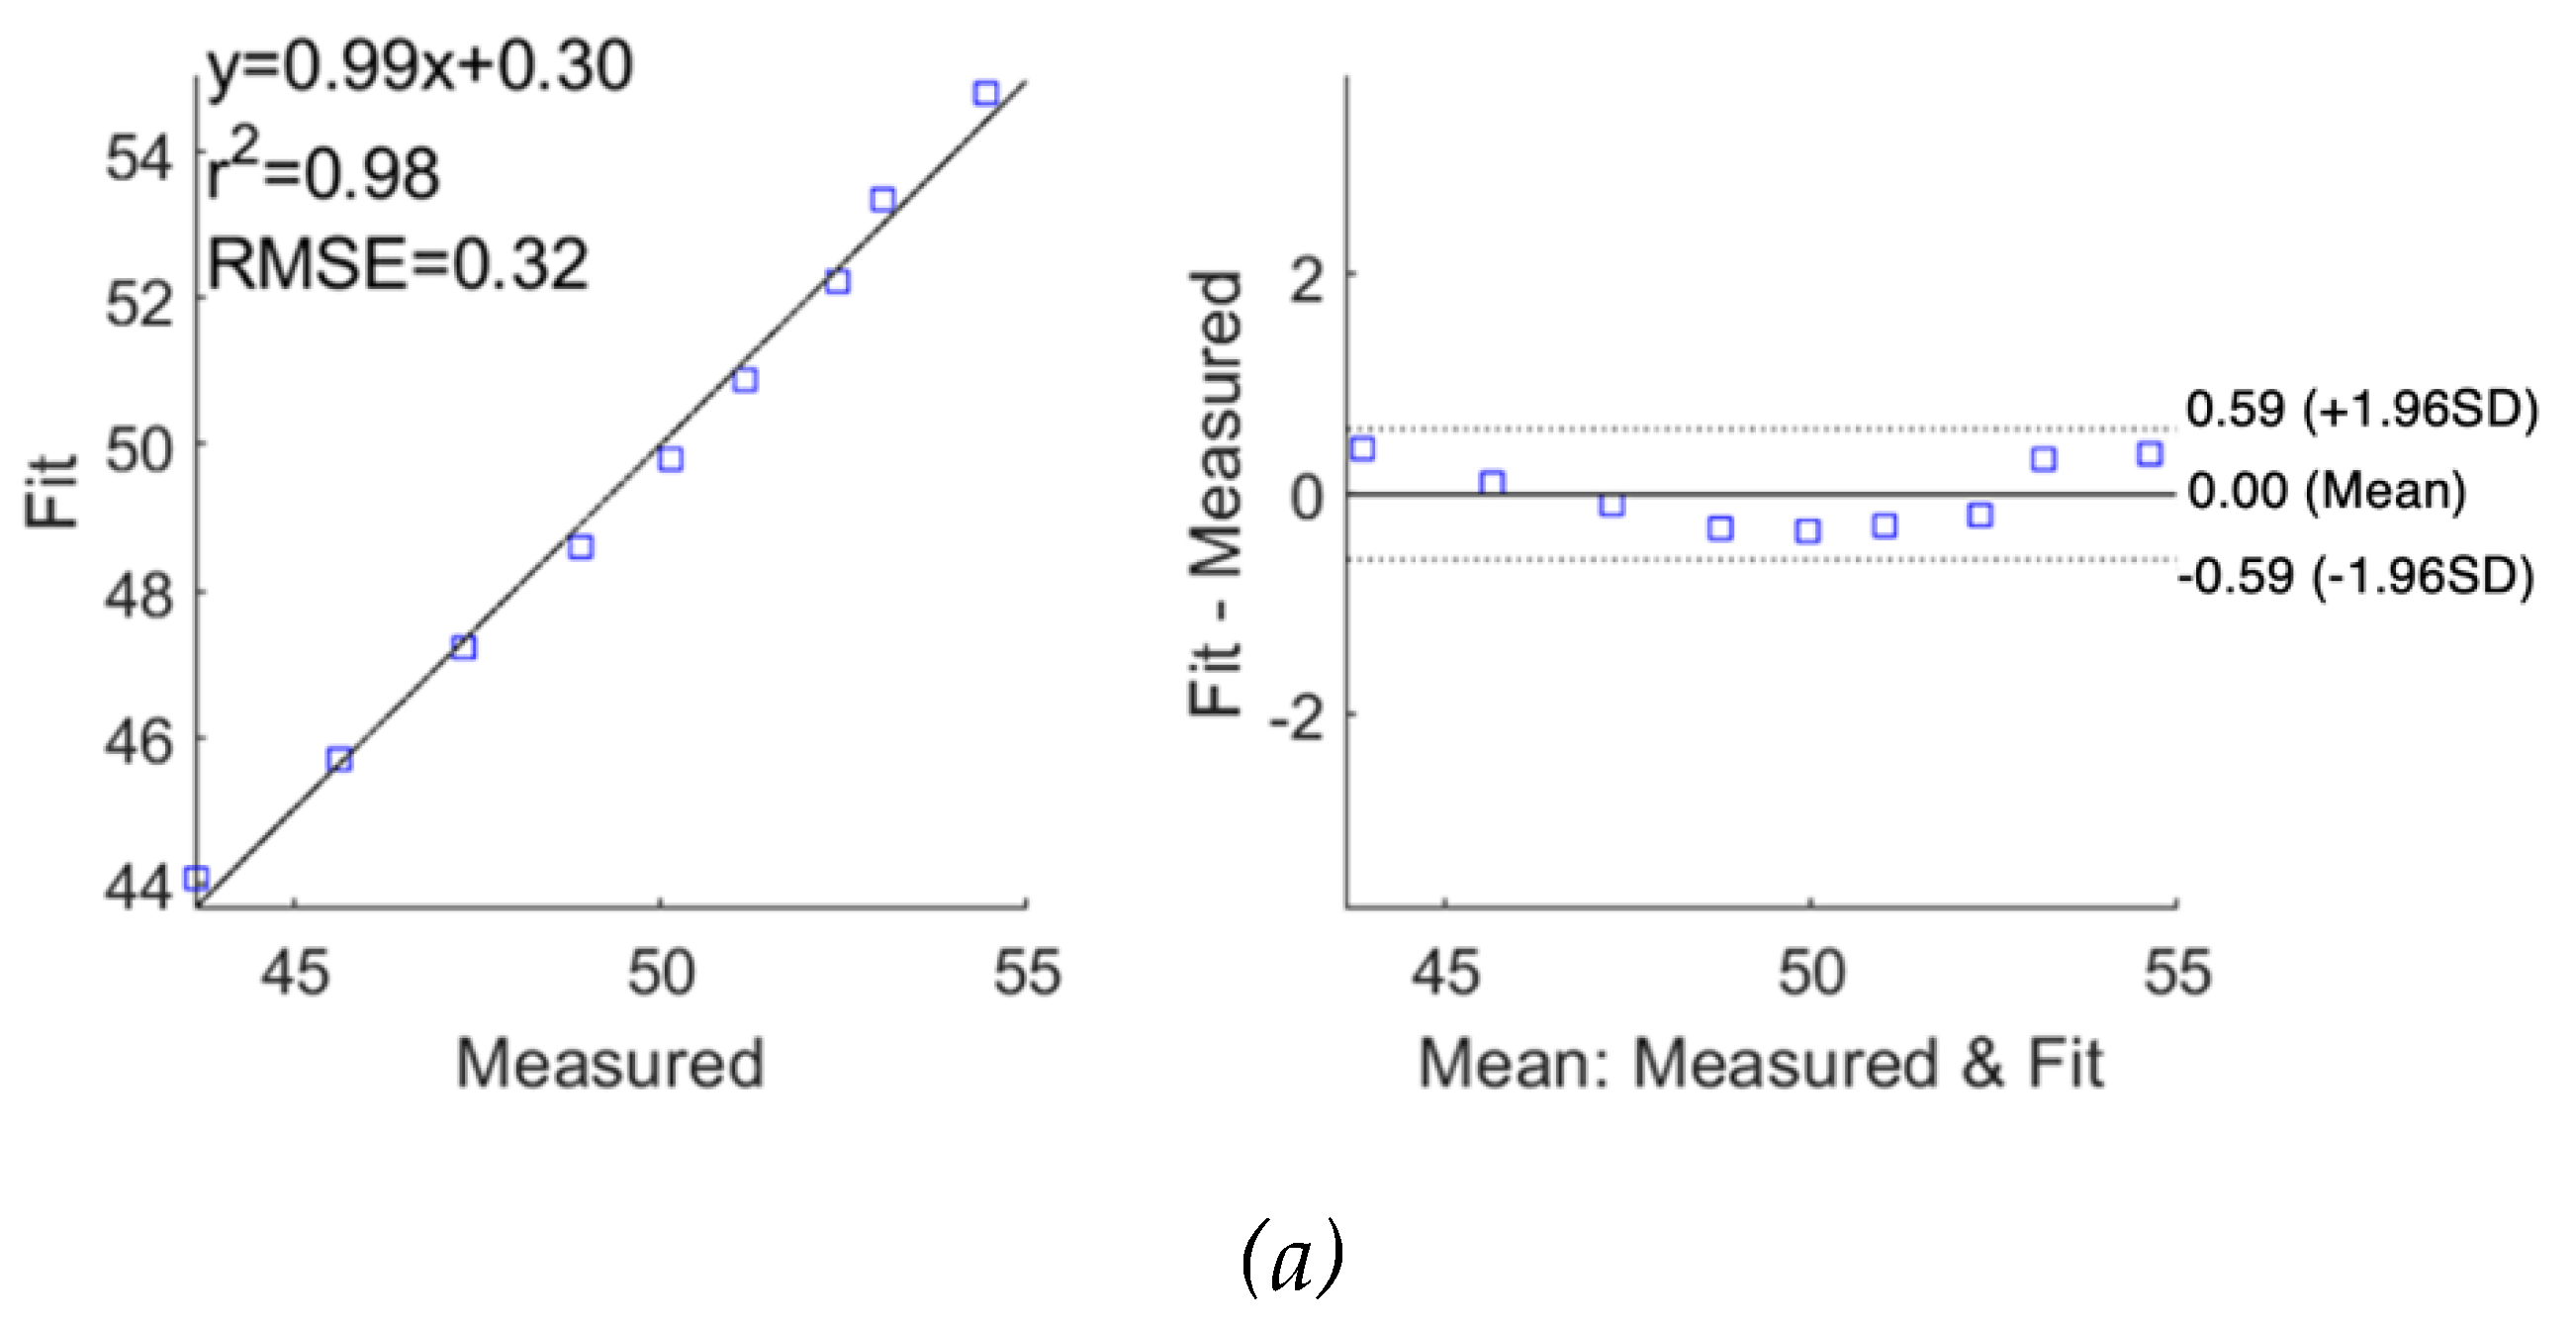
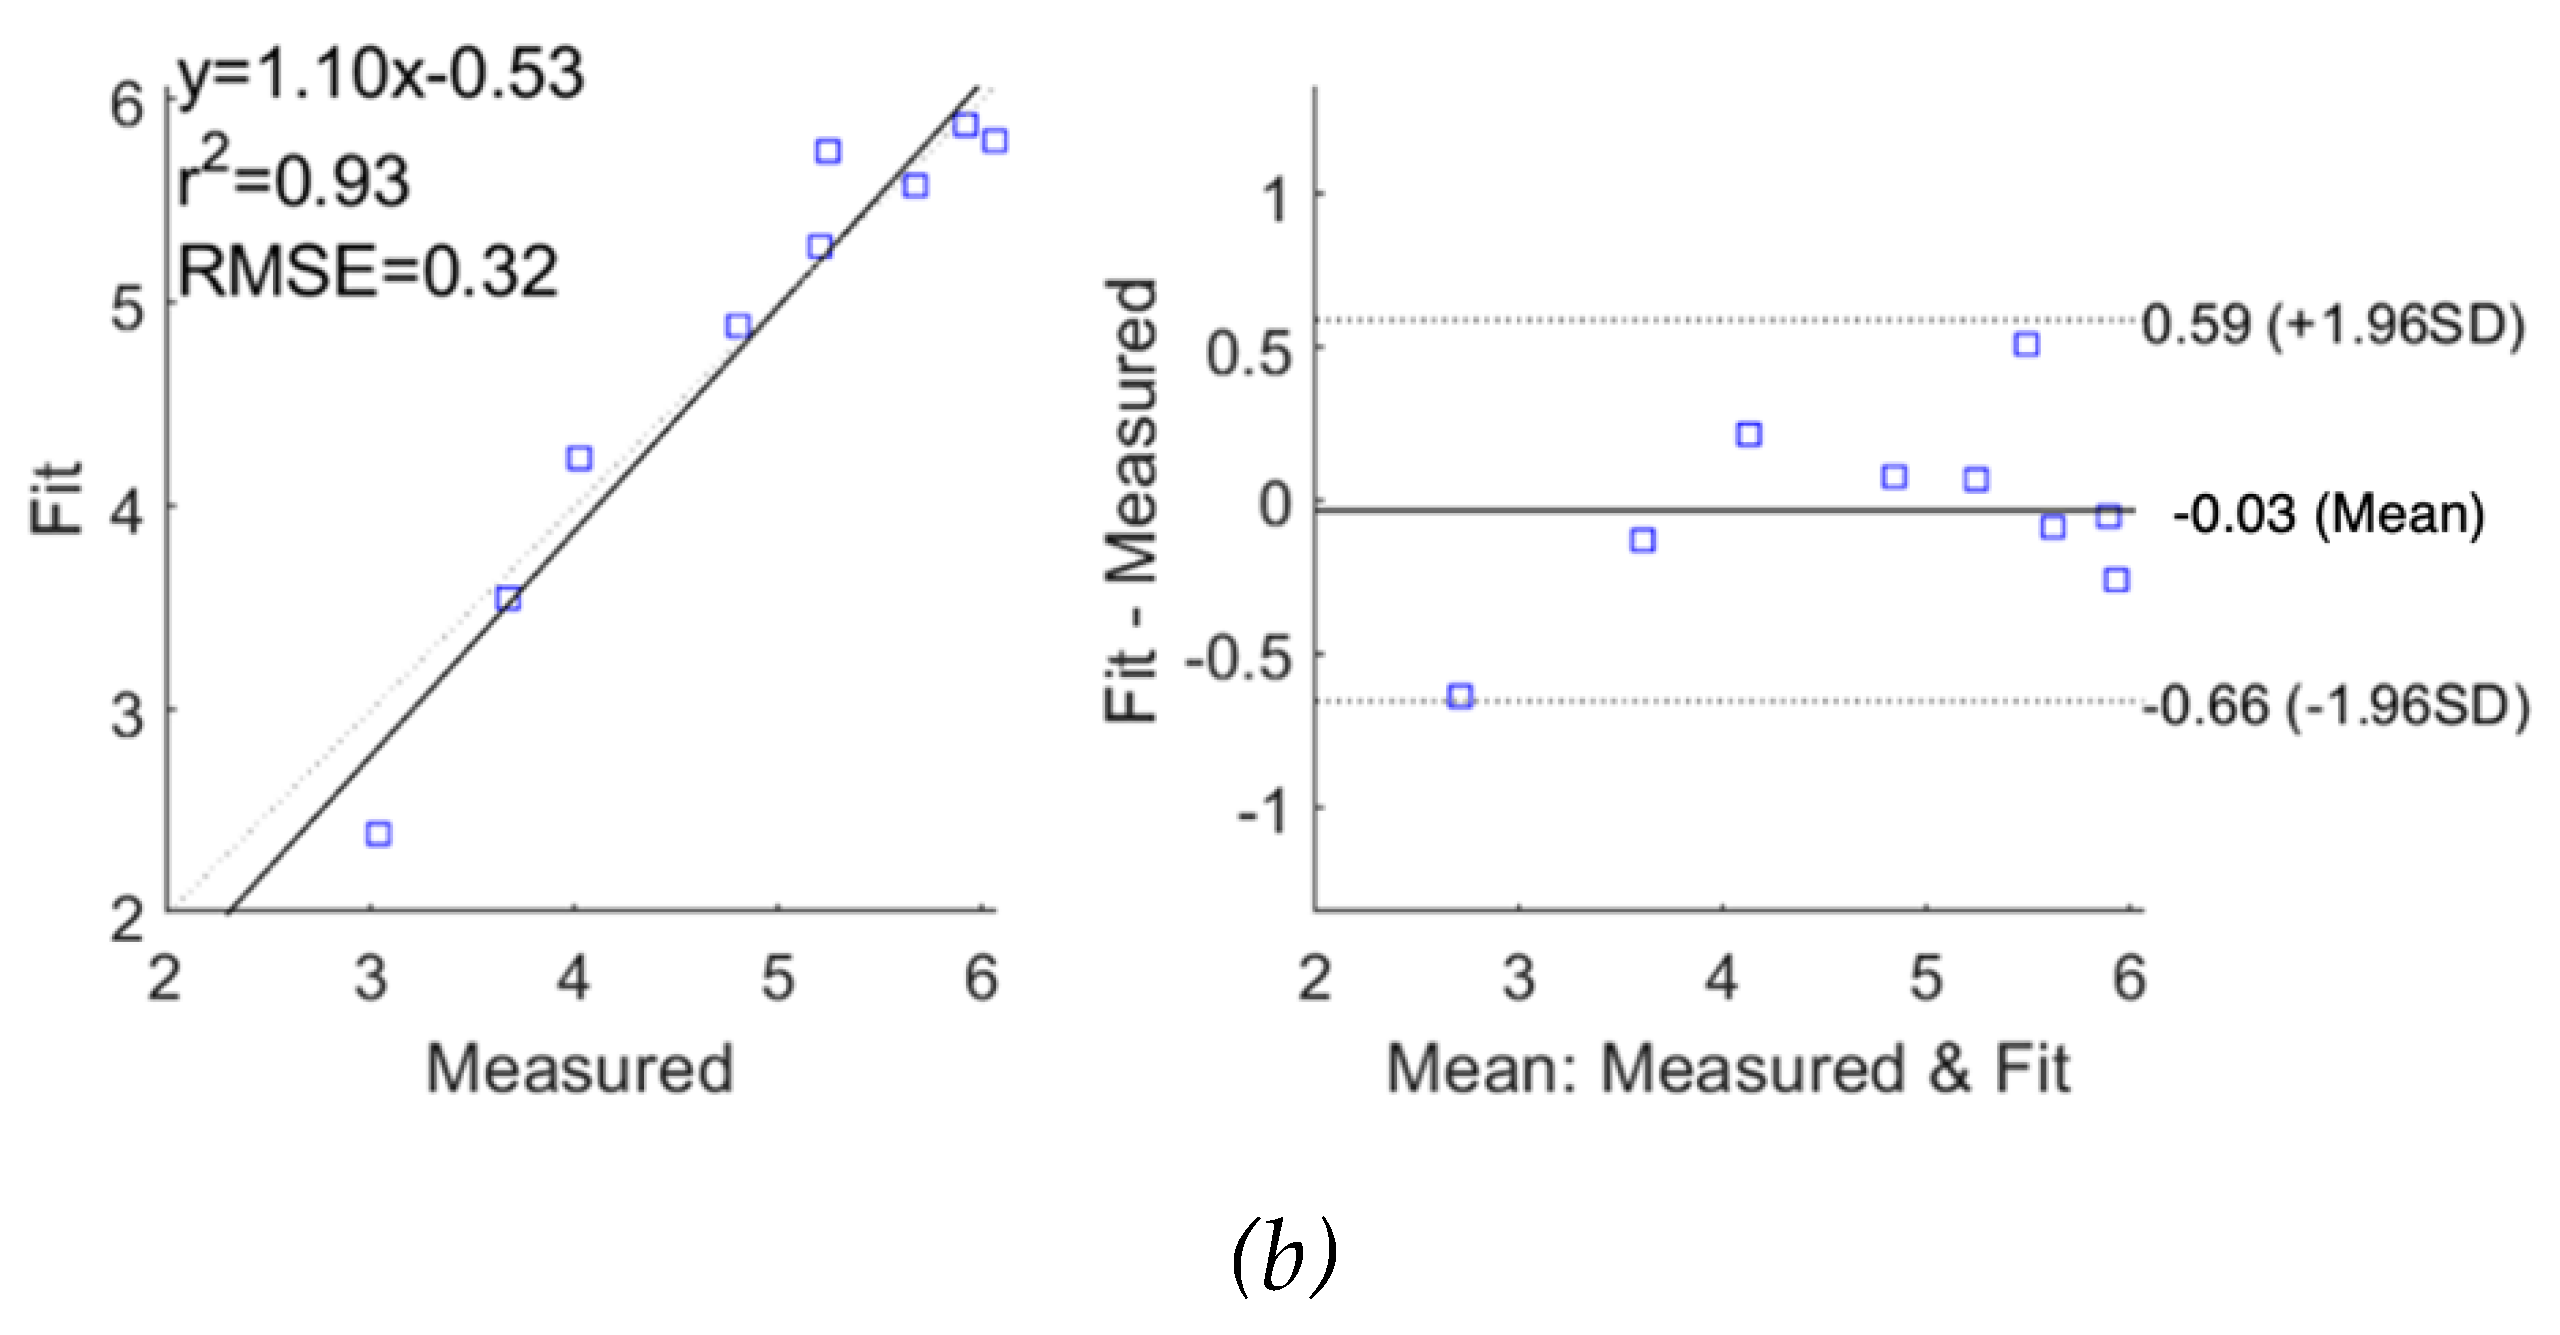
The performance of fitting was analysed and evaluated as correlation and Bland-Altman plots in
Figure 10 and
Figure 11 for subjects 1 and 2, respectively, demonstrating reasonable accuracy of applying the SDCM for both subjects. For subject 1, the correlation coefficients and the mean difference between measured raw
and fitted
were 0.98 and 0.00
0.22
, respectively. However, the
exhibited slightly lower accuracy with a lower correlation coefficient of 0.78 and a higher mean difference of 0.02
0.28
. For subject 2, a similar weaker fitting performance in the imaginary part of impedance spectra was also observed.
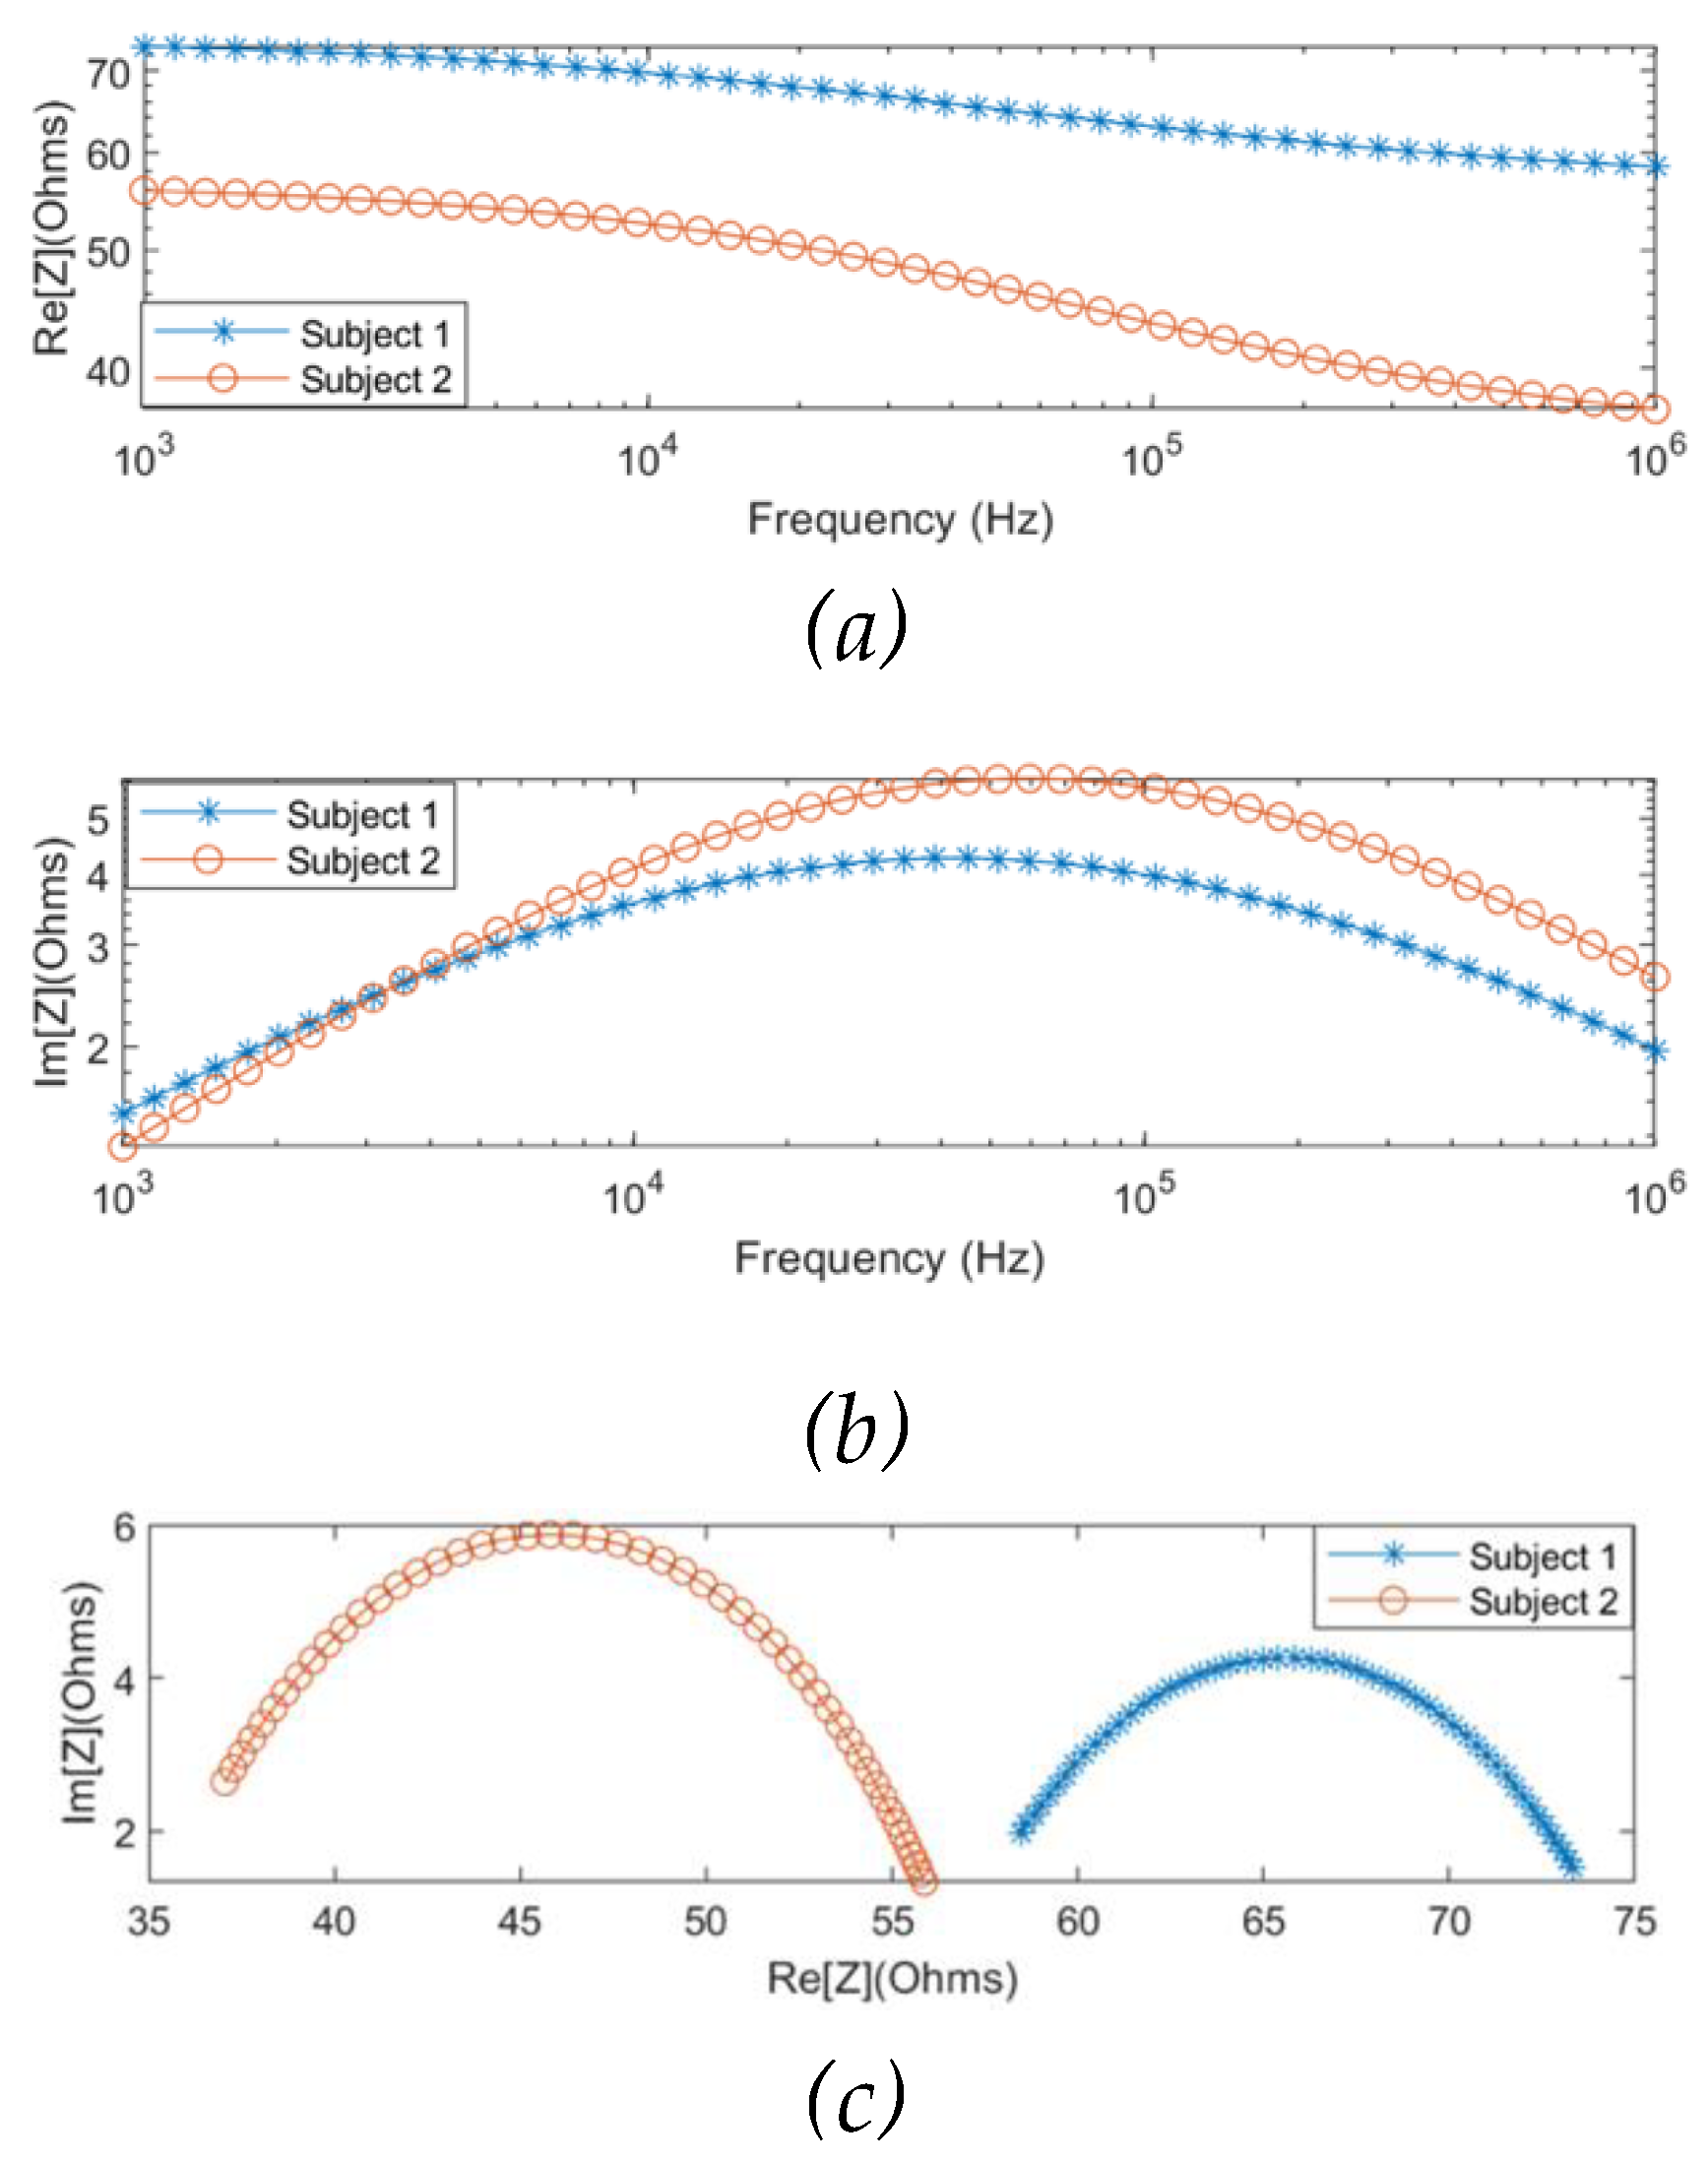
Different from the simulation setup, the measured impedance spectra were modelled and estimated through the whole frequency range of interest (1 kHz to 1 MHz) because of the limited measured frequency range of the Quadra® device (1 kHz to 349 kHz).
Figure 12 illustrates the complete Cole responses of both subjects fitted by the SDCM.
3.2.3. Multi-Dispersion Cole Modelling
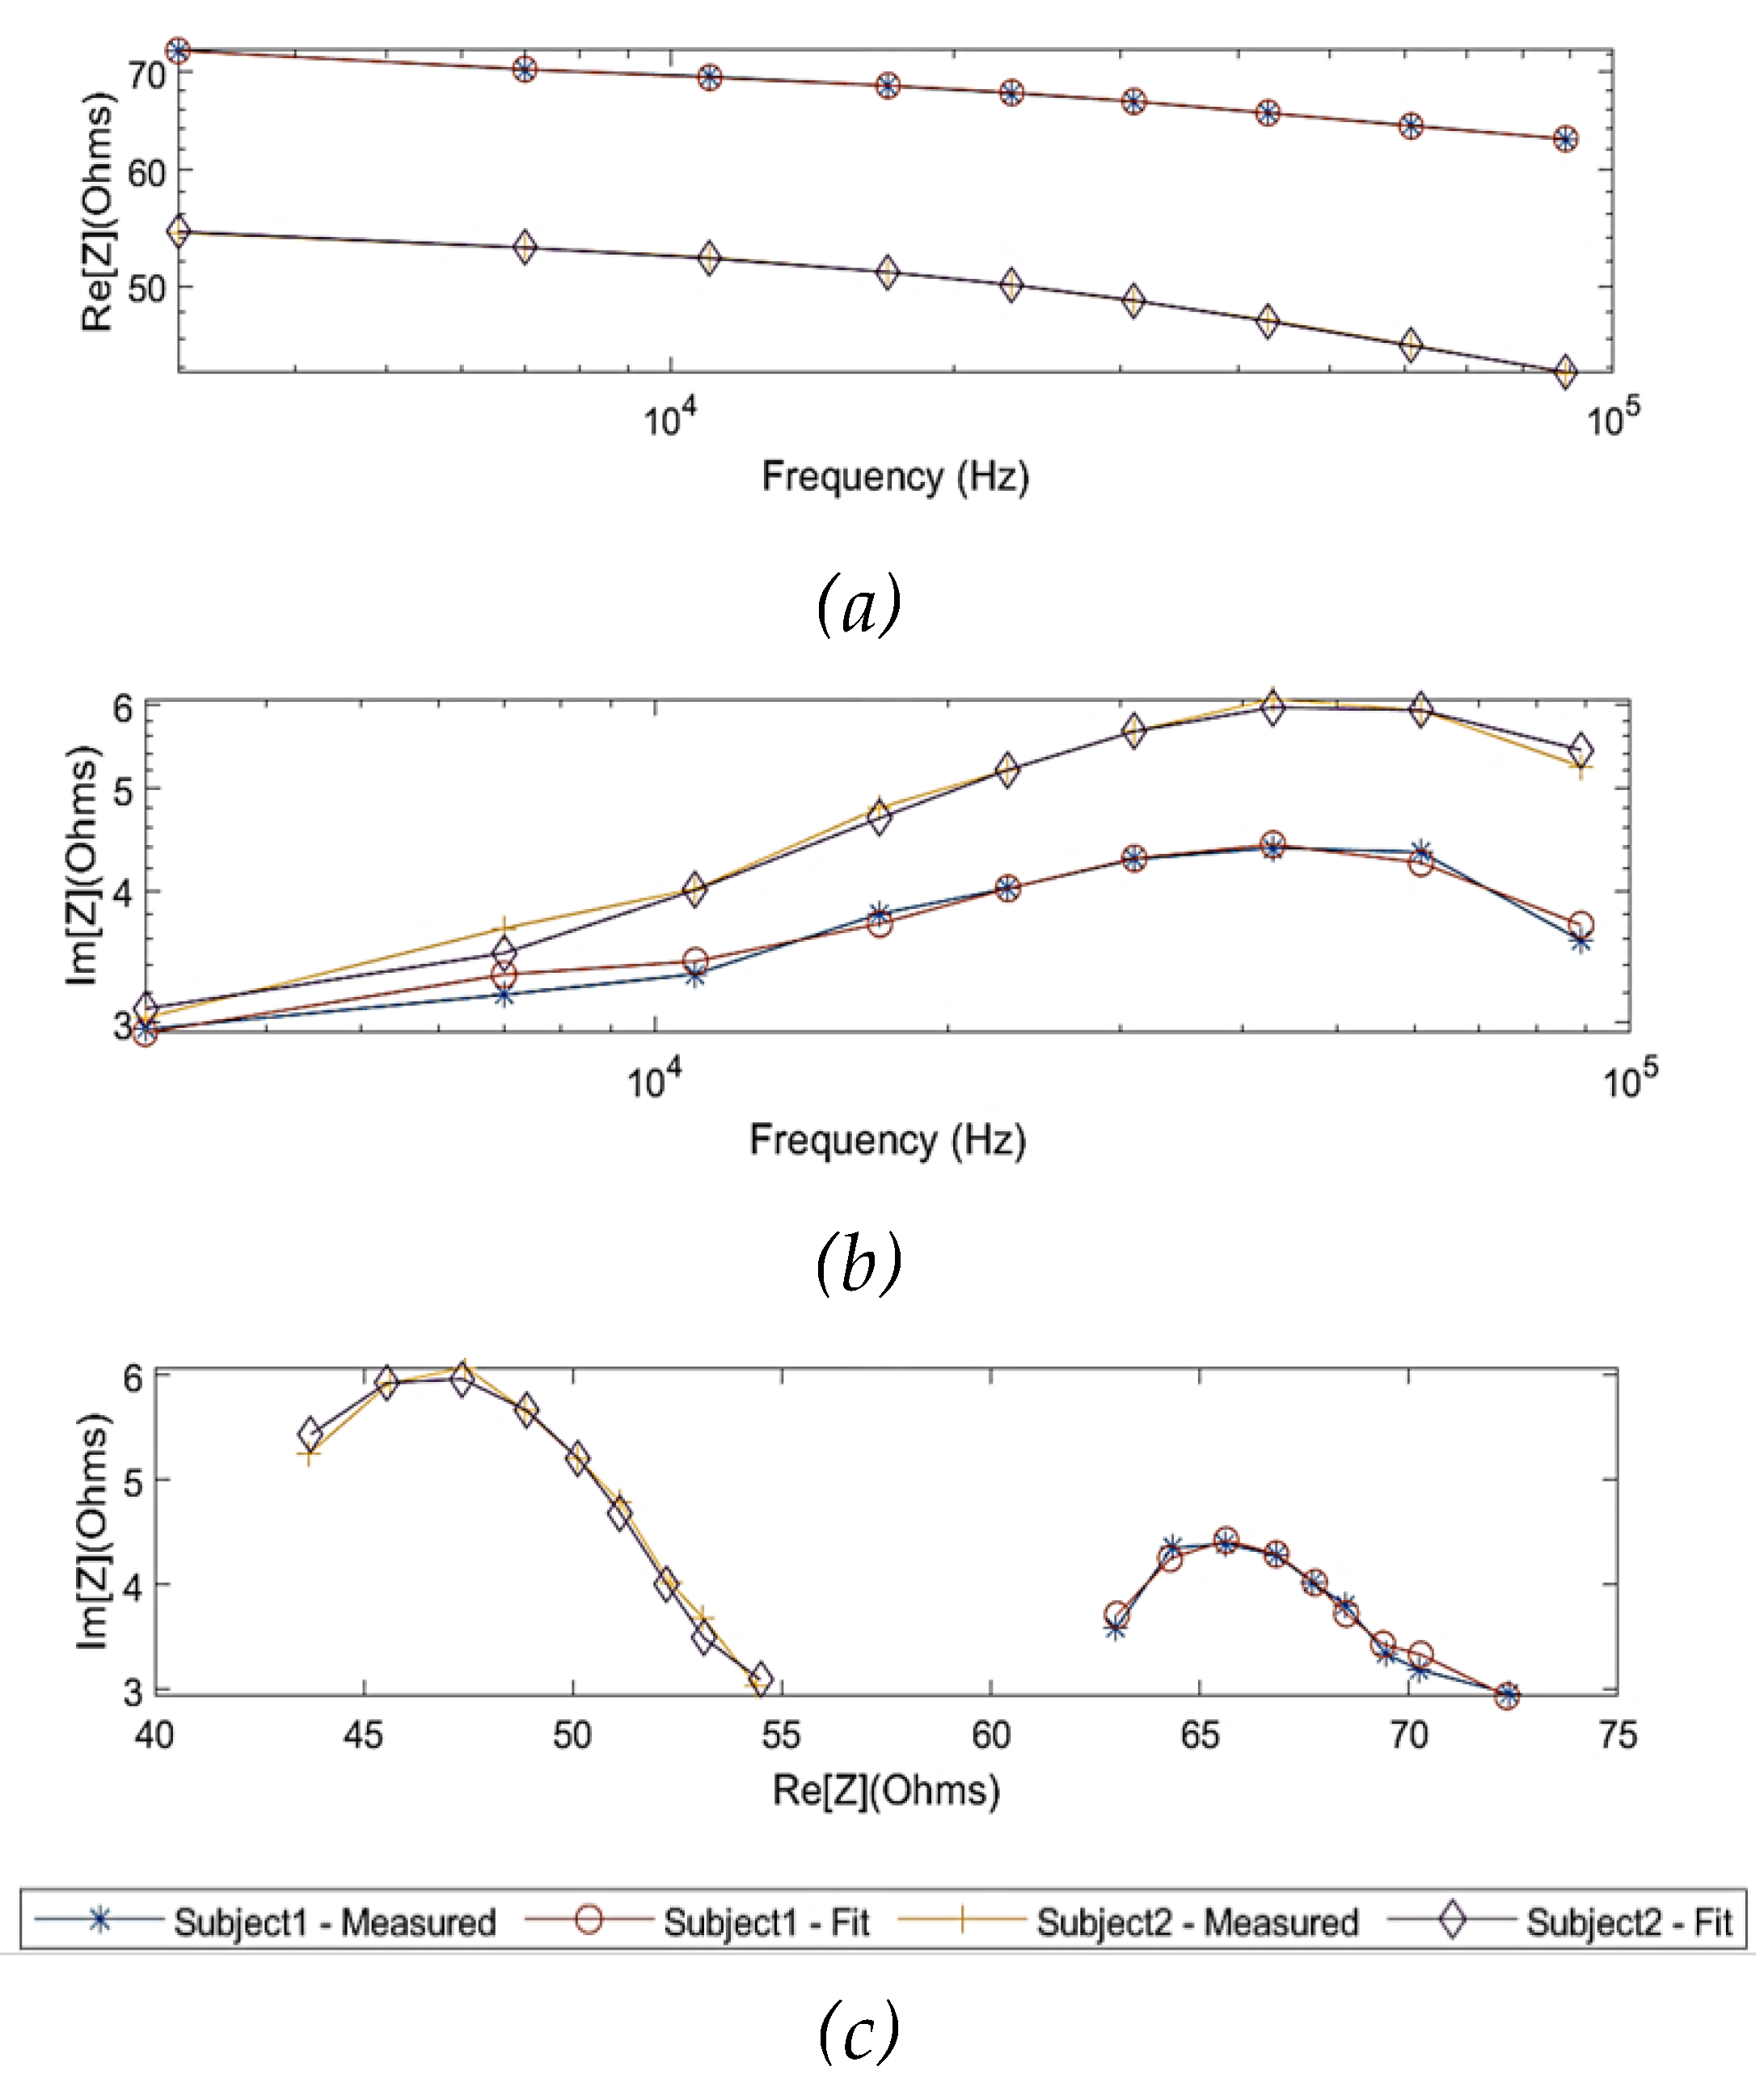
In order to model the experimental observations of both subjects in the MDCM, it was assumed that the effect of skin (skin-electrode polarization) was countered by using gel electrodes. For the remainder of the tissues, Equation 9 was used to represent other main tissue domains. The measured impedance values of the two subjects were fitted by the MDCM and plotted in
Figure 13. The estimated Cole parameters for each subject were listed in
Table 4 and substituted in Equation 9 and obtained:
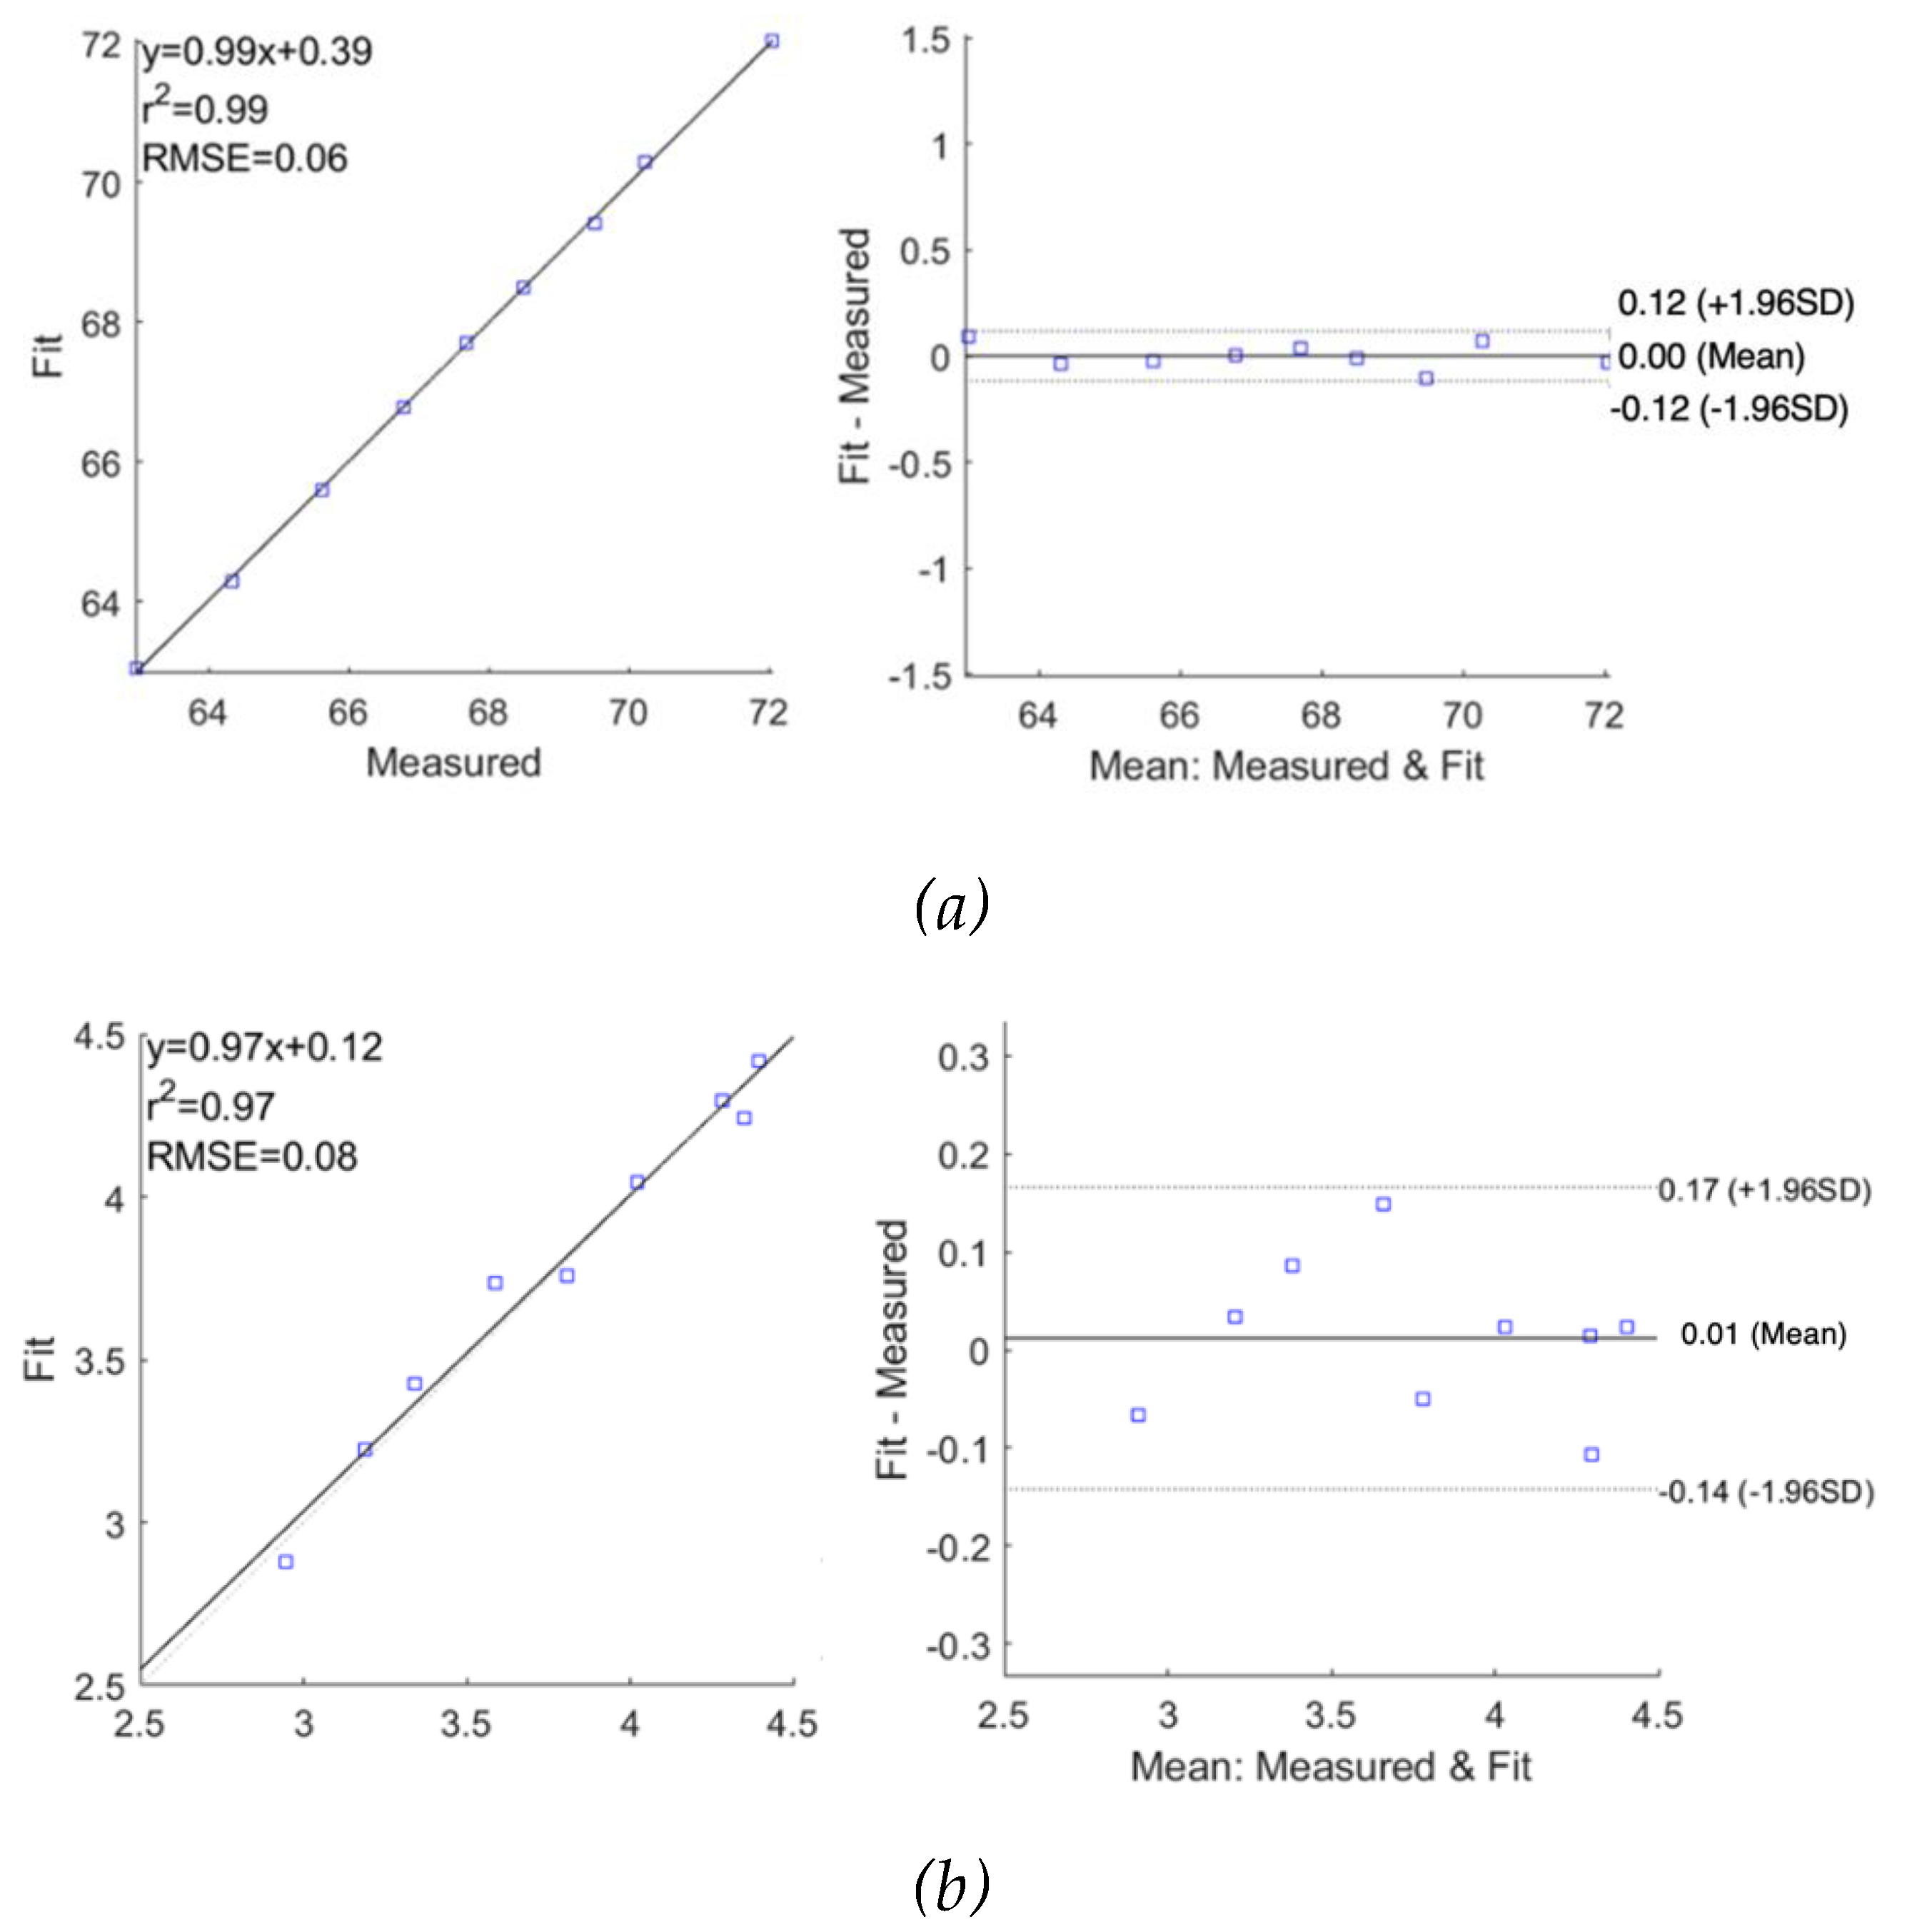
According to
Figure 14 and
Figure 15, the MDCM showed an accurate estimation for all measured impedance data from both subjects. For
, the evaluated R
2 was 0.99 for both subjects with slightly different RMSEs of 0.06
and 0.09
for subject 1 and subject 2, respectively. The Bland-Altman analysis indicated the lower mean difference between raw data and fitted data, which were 0.00
0.06
and 0.00
0.08
for subject 1 and subject 2, respectively. More importantly, the MDCM showed an improved fit performance of
compared to the single-dispersion fit.
Moreover, the overall dielectric responses of the forearm tissues between 1 kHz and 1 MHz for subjects 1 and 2 were also fitted and estimated using MDCM, which are shown in
Figure 16.
4. Discussion
4.1. Simulation Analysis
In this study, human tissues were constructed as stationary domains with bulk conductivity and relative permittivity in ANSYS HFSS. The blood-filled radial artery was modelled with an instant diameter of 2.35 mm, neglecting the arterial diameter changes induced by pulsatile blood.
Figure 3 indicates the higher E-field around the current-carrying electrodes in accordance with previous studies [
13,
26]. It was observed that the resistive effects are quite dominant within the investigated frequencies. The real part and imaginary part of simulated impedance were 93.4
and 6.3
at 1 kHz, respectively. Moreover, an overlap of the dispersion regions was noticed that the 3D forearm did not exhibit typical
-dispersion behaviours below 10 kHz, which deviated from the prototypical semi-circular Cole-Cole plot.
It is worth noting the distinction between the simulated 3D forearm and the actual anatomy. Therefore, several potential limitations need to be considered, and more efforts are desired to be addressed in the future, such as:
The skin layer was not considered in this study. This was done to reduce model complexity and under the assumption that the employment of wet electrodes mostly bypasses the effects of skin-electrode polarization.
The dynamic factors (e.g., blood flow) have not been taken into account. Blood flow or arterial hemodynamics does play a part in influencing the dielectric response of the overall human forearm. In this study, however, we focused on modelling the individual compositional response of muscle, fat, bone and blood-filled artery domains and isolating the blood contribution from the overall measurements.
4.2. Pilot Experimentation on Human Forearm
MF-BIA was also performed on two healthy subjects to validate the results in the context of those obtained from the simulation. The reliability of the measurements was an important consideration, and hence the BIM was repeated 3 times on each subject. The impedance spectra for 10 seconds were recorded with a tiny deviation of around 1%. Moreover, as specified earlier, the overall spectrum was obtained as an average of 10000 spectra logged during a span of 10 seconds, which established consistency of the measurements in relation to changing conditions with time.
The
-dispersion behaviours were observed to be the same for both subjects. Compared to the simulation, the measured magnitudes of the impedance spectra were approximately 20
to 35
lower for subject 1 and subject 2, respectively. It can be accounted for by the differences in the forearm dimensions and tissues’ proportions. The comparison between the simulation setup and actual measurements is shown in
Table 5.
4.3. Electrical Modelling
In this study, a two-stage methodology was adopted to model and analyse the MF-BIA response from the computational simulation and pilot experimentation to estimate the impedance contribution from each tissue domain. Initially, the overall BIA response was modelled as a collective, and the SDCM verified the collective behaviour of the tissues. Following that, the simulated/measured impedance values were modelled through the MDCM, where each dispersion addressed a specific tissue domain. The objective was to attain a good quality fit which can give insights about not only the resistance contribution of each tissue but also the other Cole dispersion parameters.
The simulated impedance was stepwise fitted to the SDCM and the MDCM, exhibiting excellent correlation between raw and fitted data for both the real part and imaginary part of impedance. However, for the imaginary part of impedance, the SDCM showed a larger mean difference (-0.290.50 ), while it was improved by using the MDCM. Moreover, both modelling was repeated on the experimental results measured from subjects 1 and 2, between 1 kHz and 349 kHz. The quality of fit obtained from the SDCM for both the subjects was good for the real part of impedance, but not as good for the imaginary part. However, this improved significantly with the MDCM for both subjects. Afterwards, the complete response was estimated to overcome the limitation of measured frequency range of the Quadra® device, providing insight and a full understanding of the dielectric behaviours of the human forearm from 1 kHz to 1 MHz.
Table 6 and
Table 7 summarize the overall performance of the two models for all investigations in this study. The MDCM showed significantly higher performance than the SDCM for both simulated and measured impedance values, demonstrating the MDCM is more appropriate for representing the dielectric properties of multiple tissues. Every tissue domain experiences a different dispersion phenomenon and hence may not be accurately described using the SDCM. More importantly, the MDCM can describe and estimate the Cole parameters of each tissue, thereby isolating the behaviour of a single tissue of interest from the overall MF-BIA measurements. Even though both models showed more accurate estimation and fitting on the real part of impedance than the imaginary part of impedance, the overall performance was promising, which can be helpful in physiologically monitoring an organ or a section of the human body through MF-BIA applications, such as electrical impedance tomography (EIT). Furthermore, it can help improve the accuracy of existing methods, like impedance cardiography (ICG) for hemodynamic monitoring by filtering out the impedance contributions from the surrounding tissues to blood flow-induced impedance variations.
5. Conclusion
In this study, the FEM was utilized to simulate a 3D human forearm model using the ANSYS HFSS with four tissue domains, including fat, muscle, blood and bone. Moreover, a pilot investigation was implemented with two healthy human subjects using MF-BIA at the forearm. Both simulated and measured impedance values were fitted to the SDCM and the MDCM for an overall identification of the tissue response and the dielectric relaxation of individual tissues, respectively. MDCM exhibited more accurate fitting and estimation of both the real part and imaginary part of impedance for both simulation and human measurement. Future work may be directed towards a more distributed tissue model to mimic the actual tissue interaction in the forearm more closely. More extensive validation under varying physiological conditions will be required to direct the outcome of this study towards a practical system. Nevertheless, further analysis and improvements can help realise the benefits of MF-BIA methodology over existing BIA techniques and help standardise its current applications.
Acknowledgements
This work was funded by the Institute of Biomedical Technology at Auckland University of Technology.
References
- E. Atzler and G. Lehmann, Anatomie und physiologie der arbeit, vol. 1. C. Marhold, 1930.
- J. Nyboer, S. Bango, A. Barnett, and R. H. Halsey, “Radiocardiograms: Electrical impedance changes of the heart in relation to electrocardiograms and heart sounds,” J Clin Invest, vol. 19, p. 963, 1940.
- S. Grimnes and O. G. Martinsen, Bioimpedance and Bioelectricity Basics. Academic Press, 2014.
- G. Anand, Y. Yu, A. Lowe, and A. Kalra, “Bioimpedance analysis as a tool for hemodynamic monitoring: overview, methods and challenges,” Physiol. Meas., vol. 42, no. 3, p. 03TR01, Mar. 2021. [CrossRef]
- H. D. McCarthy, T. J. Cole, T. Fry, S. A. Jebb, and A. M. Prentice, “Body fat reference curves for children,” Int. J. Obes., vol. 30, no. 4, pp. 598–602, 2006.
- S. A. Jebb, M. Siervo, P. R. Murgatroyd, S. Evans, G. Frühbeck, and A. M. Prentice, “Validity of the leg-to-leg bioimpedance to estimate changes in body fat during weight loss and regain in overweight women: a comparison with multi-compartment models,” Int. J. Obes., vol. 31, no. 5, pp. 756–762, 2007.
- F. R. Faria et al., “Body Fat Equations and Electrical Bioimpedance Values in Prediction of Cardiovascular Risk Factors in Eutrophic and Overweight Adolescents,” Int. J. Endocrinol., vol. 2013, p. e501638, 2013. [CrossRef]
- V. Garr Barry, S. L. Martin, P. Chandler-Laney, E. B. Carter, and C. S. Worthington, “A Comparison of Bioimpedance Analysis vs. Dual X-ray Absorptiometry for Body Composition Assessment in Postpartum Women and Non-Postpartum Controls,” Int. J. Environ. Res. Public. Health, vol. 19, no. 20, p. 13636, Oct. 2022. [CrossRef]
- S. Bang, C. S. Bang, C. Lee, J. Park, M.-C. Cho, Y.-G. Yoon, and S. Cho, “A pulse transit time measurement method based on electrocardiography and bioimpedance,” in 2009 IEEE Biomedical Circuits and Systems Conference, Beijing, China, Nov. 2009, pp. 153–156. [CrossRef]
- S. Aria et al., “Measuring Blood Pulse Wave Velocity with Bioimpedance in Different Age Groups,” Sensors, vol. 19, no. 4, p. 850, Feb. 2019. [CrossRef]
- T. H. Huynh, R. Jafari, and W.-Y. Chung, “Non-invasive Cuffless Blood Pressure Estimation Using Pulse Transit Time and Impedance Plethysmography,” IEEE Trans. Biomed. Eng., pp. 1–1, 2018. [CrossRef]
- B. Ibrahim, A. Akbari, and R. Jafari, “A novel method for pulse transit time estimation using wrist bio-impedance sensing based on a regression model,” in 2017 IEEE Biomedical Circuits and Systems Conference (BioCAS), Torino, Oct. 2017, pp. 1–4. [CrossRef]
- Y. Yu, G. Anand, A. Lowe, H. Zhang, and A. Kalra, “Towards Estimating Arterial Diameter Using Bioimpedance Spectroscopy: A Computational Simulation and Tissue Phantom Analysis,” Sensors, vol. 22, no. 13, p. 4736, Jun. 2022. [CrossRef]
- M. Al-harosh, M. Yangirov, D. Kolesnikov, and S. Shchukin, “Bio-Impedance Sensor for Real-Time Artery Diameter Waveform Assessment,” Sensors, vol. 21, no. 24, p. 8438, Dec. 2021. [CrossRef]
- G. Anand and A. Lowe, “Investigating Electrical Impedance Spectroscopy for Estimating Blood Flow-Induced Variations in Human Forearm,” Sensors, vol. 20, no. 18, p. 5333, Sep. 2020. [CrossRef]
- Mugeb and A. Larvushkin, “Model-based Assessment of Brachial Artery Diameter From Electrical Impedance Measurement,” in 2021 Ural Symposium on Biomedical Engineering, Radioelectronics and Information Technology (USBEREIT), Yekaterinburg, Russia, May 2021, pp. 0098–0101. [CrossRef]
- S. Mansouri, T. Alhadidi, S. Chabchoub, and R. B. Salah, “Impedance cardiography: recent applications and developments,” Biomed. Res., vol. 29, no. 19, 2018. [CrossRef]
- T. K. Bera, “Bioelectrical Impedance Methods for Noninvasive Health Monitoring: A Review,” J. Med. Eng., vol. 2014, pp. 1–28, 2014. [CrossRef]
- T. K. Bera and N. Jampana, “A multi-frequency constant current source suitable for Electrical Impedance Tomography (EIT),” in 2010 International Conference on Systems in Medicine and Biology, Kharagpur, India, Dec. 2010, pp. 278–283. [CrossRef]
- Brown, “Electrical impedance tomography (EIT): a review,” J. Med. Eng. Technol., vol. 27, no. 3, pp. 97–108, Jan. 2003. [CrossRef]
- N. Goren et al., “Multi-frequency electrical impedance tomography and neuroimaging data in stroke patients,” Sci. Data, vol. 5, no. 1, p. 180112, Dec. 2018. [CrossRef]
- D. Stupin et al., “Bioimpedance Spectroscopy: Basics and Applications,” ACS Biomater. Sci. Eng., vol. 7, no. 6, pp. 1962–1986, Jun. 2021. [CrossRef]
- H. P. Schwan, “Electrical properties of tissue and cell suspensions.,” Adv. Biol. Med. Phys., vol. 5, p. 147, 1957.
- K. S. Cole, “Permeability and impermeability of cell membranes for ions,” in Cold Spring Harbor Symposia on Quantitative Biology, 1940, vol. 8, pp. 110–122. Accessed: Jul. 12, 2014. [Online]. Available: http://symposium.cshlp.org/content/8/110.short.
- K. S. Cole and R. H. Cole, “Dispersion and absorption in dielectrics I. Alternating current characteristics,” J. Chem. Phys., vol. 9, no. 4, pp. 341–351, 1941.
- G. Anand, A. Lowe, and A. M. Al-Jumaily, “Simulation of impedance measurements at human forearm within 1 kHz to 2 MHz,” J. Electr. Bioimpedance, vol. 7, no. 1, p. 20, May 2016. 20 May. [CrossRef]
- G. Anand, A. Lowe, and A. Al-Jumaily, “Tissue phantoms to mimic the dielectric properties of human forearm section for multi-frequency bioimpedance analysis at low frequencies,” Mater. Sci. Eng. C, vol. 96, pp. 496–508, Mar. 2019. [CrossRef]
- R. J. Maughan, J. S. Watson, and J. Weir, “The relative proportions of fat, muscle and bone in the normal human forearm as determined by computed tomography,” Clin. Sci., vol. 66, no. 6, pp. 683–689, Jun. 1984. [CrossRef]
- G. A. Toomayan, F. Robertson, N. M. Major, and B. E. Brigman, “Upper extremity compartmental anatomy: clinical relevance to radiologists,” Skeletal Radiol., vol. 35, no. 4, pp. 195–201, Apr. 2006. [CrossRef]
- V. Mooser et al., “Non-invasive measurement of internal diameter of peripheral arteries during the cardiac cycle,” J. Hypertens., vol. 6, no. 4, Dec. 1988.
- S. Trazzi, S. Omboni, C. Santucciu, G. Parati, and G. Mancia, “Variability in arterial diameter and compliance: compliance modulation reserve,” J. Hypertens., Aug. 1992.
- T. Ashraf, Z. Panhwar, S. Habib, M. A. Memon, F. Shamsi, and J. Arif, “Size of radial and ulnar artery in local population,” vol. 60, no. 10, p. 3, 2010.
- S. Dharma, S. Kedev, T. Patel, S. V. Rao, O. F. Bertrand, and I. C. Gilchrist, “Radial artery diameter does not correlate with body mass index: A duplex ultrasound analysis of 1706 patients undergoing trans-radial catheterization at three experienced radial centers,” Int. J. Cardiol., vol. 228, pp. 169–172, Feb. 2017. [CrossRef]
- Gabriel, S. Gabriel, and E. Corthout, “The dielectric properties of biological tissues: I. Literature survey,” Phys. Med. Biol., vol. 41, no. 11, p. 2231, 1996.
- S. Gabriel, R. W. Lau, and C. Gabriel, “The dielectric properties of biological tissues: II. Measurements in the frequency range 10 Hz to 20 GHz,” Phys. Med. Biol., vol. 41, no. 11, pp. 2251–2269, Nov. 1996. [CrossRef]
- S. Gabriel, R. W. Lau, and C. Gabriel, “The dielectric properties of biological tissues: III. Parametric models for the dielectric spectrum of tissues,” Phys. Med. Biol., vol. 41, no. 11, p. 2271, 1996. [CrossRef]
- C. Gabriel, “Compilation of the Dielectric Properties of Body Tissues at RF and Microwave Frequencies.,” DTIC Document, 1996. Accessed: Nov. 30, 2015. [Online]. Available: http://oai.dtic.mil/oai/oai?verb=getRecord&metadataPrefix=html&identifier=ADA309764.
- “IEC 60601,” Wikipedia, the free encyclopedia. Oct. 16, 2015. Accessed: Dec. 05, 2015. [Online]. Available: https://en.wikipedia.org/w/index.php?title=IEC_60601&oldid=685994304.
- “Compact and Fast Impedance Spectroscopy Platform - Quadra,” Eliko. https://www.eliko.ee/products/quadra-impedance-spectroscopy/ (accessed Jul. 24, 2018).
Figure 1.
Simulated 3D human forearm in ANSYS HFSS: (a) longitudinal view; (b) top view.
Figure 1.
Simulated 3D human forearm in ANSYS HFSS: (a) longitudinal view; (b) top view.
Figure 2.
Experimental setup for BIA.
Figure 2.
Experimental setup for BIA.
Figure 3.
Electric field distribution throughout the 3D human forearm at 1 kHz.
Figure 3.
Electric field distribution throughout the 3D human forearm at 1 kHz.
Figure 4.
Comparison between the simulated raw data and fitted data using single-dispersion Cole model: (a) simulated real part of impedance; (b) simulated imaginary part of impedance; (c) Nyquist plot (Cole plot).
Figure 4.
Comparison between the simulated raw data and fitted data using single-dispersion Cole model: (a) simulated real part of impedance; (b) simulated imaginary part of impedance; (c) Nyquist plot (Cole plot).
Figure 5.
Correlation and Bland-Altman plots for simulated impedance using single-dispersion Cole model: (a) real part of impedance; (b) imaginary part of impedance.
Figure 5.
Correlation and Bland-Altman plots for simulated impedance using single-dispersion Cole model: (a) real part of impedance; (b) imaginary part of impedance.
Figure 6.
Comparison between the simulated raw data and fitted data using multi-dispersion Cole model: (a) simulated real part of impedance; (b) simulated imaginary part of impedance; (c) Nyquist plot (Cole plot).
Figure 6.
Comparison between the simulated raw data and fitted data using multi-dispersion Cole model: (a) simulated real part of impedance; (b) simulated imaginary part of impedance; (c) Nyquist plot (Cole plot).
Figure 7.
Correlation and Bland-Altman plots for simulated impedance using multi-dispersion Cole model: (a) real part of impedance; (b) imaginary part of impedance.
Figure 7.
Correlation and Bland-Altman plots for simulated impedance using multi-dispersion Cole model: (a) real part of impedance; (b) imaginary part of impedance.
Figure 8.
MF-BIA results of two subjects using Quadra® device: (a) real part of impedance; (b) imaginary part of impedance; (c) Nyquist plot (Cole plot).
Figure 8.
MF-BIA results of two subjects using Quadra® device: (a) real part of impedance; (b) imaginary part of impedance; (c) Nyquist plot (Cole plot).
Figure 9.
Comparison between the measured raw data and fitted data using single-dispersion Cole model: (a) measured real part of impedance; (b) measured imaginary part of impedance; (c) Nyquist plot (Cole plot).
Figure 9.
Comparison between the measured raw data and fitted data using single-dispersion Cole model: (a) measured real part of impedance; (b) measured imaginary part of impedance; (c) Nyquist plot (Cole plot).
Figure 10.
Correlation and Bland-Altman plots for measured impedance using single-dispersion Cole model for subject 1: (a) real part of impedance; (b) imaginary part of impedance.
Figure 10.
Correlation and Bland-Altman plots for measured impedance using single-dispersion Cole model for subject 1: (a) real part of impedance; (b) imaginary part of impedance.
Figure 11.
Correlation and Bland-Altman plots for measured impedance using single-dispersion Cole model for subject 2: (a) real part of impedance; (b) imaginary part of impedance.
Figure 11.
Correlation and Bland-Altman plots for measured impedance using single-dispersion Cole model for subject 2: (a) real part of impedance; (b) imaginary part of impedance.
Figure 12.
Complete response from 1 kHz to 1 MHz fitted by single-dispersion Cole model for subjects 1 and 2: (a) real part of impedance; (b) imaginary part of impedance; (c) Nyquist plot (Cole plot).
Figure 12.
Complete response from 1 kHz to 1 MHz fitted by single-dispersion Cole model for subjects 1 and 2: (a) real part of impedance; (b) imaginary part of impedance; (c) Nyquist plot (Cole plot).
Figure 13.
Comparison between the measured raw data and fitted data using multi-dispersion Cole model: (a) measured real part of impedance; (b) measured imaginary part of impedance; (c) Nyquist plot (Cole plot).
Figure 13.
Comparison between the measured raw data and fitted data using multi-dispersion Cole model: (a) measured real part of impedance; (b) measured imaginary part of impedance; (c) Nyquist plot (Cole plot).
Figure 14.
Correlation and Bland-Altman plots for measured impedance using multi-dispersion Cole model for subject 1: (a) real part of impedance; (b) imaginary part of impedance.
Figure 14.
Correlation and Bland-Altman plots for measured impedance using multi-dispersion Cole model for subject 1: (a) real part of impedance; (b) imaginary part of impedance.
Figure 15.
Correlation and Bland-Altman plots for measured impedance using multi-dispersion Cole model for subject 2: (a) real part of impedance; (b) imaginary part of impedance.
Figure 15.
Correlation and Bland-Altman plots for measured impedance using multi-dispersion Cole model for subject 2: (a) real part of impedance; (b) imaginary part of impedance.
Figure 16.
Complete response from 1 kHz to 1 MHz fitted by multi-dispersion Cole model for subjects 1 and 2: (a) real part of impedance; (b) imaginary part of impedance; (c) Nyquist plot (Cole plot).
Figure 16.
Complete response from 1 kHz to 1 MHz fitted by multi-dispersion Cole model for subjects 1 and 2: (a) real part of impedance; (b) imaginary part of impedance; (c) Nyquist plot (Cole plot).
Table 1.
Estimated Cole parameters from the fit of simulation data using the single-dispersion Cole model.
Table 1.
Estimated Cole parameters from the fit of simulation data using the single-dispersion Cole model.
|
|
|
|
| 89.50 |
60.02 |
0.6923 |
3.4510-7
|
Table 2.
Estimated Cole parameters from the fit of simulation data using the multi-dispersion Cole model.
Table 2.
Estimated Cole parameters from the fit of simulation data using the multi-dispersion Cole model.
|
|
|
|
|
|
|
|
|
|
|
|
|
| 49.72 |
19.72 |
2.43 |
0.34 |
1.4810-9
|
21.44 |
0.98 |
0.83 |
4.0810-7
|
4.04 |
0.54 |
0.26 |
1.0510-4
|
Table 3.
Estimated Cole parameters from the fit of experimental data using the single-dispersion Cole model.
Table 3.
Estimated Cole parameters from the fit of experimental data using the single-dispersion Cole model.
| |
|
|
|
|
| Subject 1 |
75.29 |
56.32 |
0.54 |
4.0010-6
|
| Subject 2 |
56.59 |
35.18 |
0.64 |
2.73 10-6 |
Table 4.
Estimated Cole parameters from the fit of experimental data using the multi-dispersion Cole model.
Table 4.
Estimated Cole parameters from the fit of experimental data using the multi-dispersion Cole model.
| |
|
|
|
|
|
|
|
|
|
|
|
|
|
| Subject 1 |
57.98 |
25.51 |
16.09 |
0.65 |
10-5
|
24.50 |
15.82 |
0.67 |
10-5
|
3.54 |
0.62 |
0.62 |
10-4
|
| Subject 2 |
38.83 |
25.59 |
12.30 |
0.72 |
10-4
|
26.80 |
14.59 |
0.88 |
10-5
|
2.86 |
0.53 |
0.66 |
10-4
|
Table 5.
Comparison between simulation and forearm measurements.
Table 5.
Comparison between simulation and forearm measurements.
| |
Computational simulation |
Pilot study |
| Skin-electrode contact interface |
No contribution of the electrode interface (polarization) was considered in the overall measurements. |
The measurement device and the gel electrodes provided an appropriate compensation for the skin-electrode interface. |
| Size of electrodes |
The electrodes had smaller cross-sectional contact dimensions (diameter = 8 mm). |
The gel electrolyte between Ag/AgCl electrode and the skin provided a larger contact area. |
| Tissues |
Only four tissues were constructed (i.e., fat, muscle, bone and blood). All modelled tissue domains were relatively uniform with bulk dielectric properties. |
The anatomy of the forearm (dimension and proportion) was different between each subject. Other tissues contributed to the overall BIM, such as tender, vein, nerve and etc. |
Table 6.
Summary of statistical analysis of proposed electrical models for the real part of impedance.
Table 6.
Summary of statistical analysis of proposed electrical models for the real part of impedance.
| |
Correlation analysis |
Bland-Altman analysis |
| R2
|
] |
] |
] |
| Simulation |
SDCM |
0.99 |
0.14 |
0.04 |
0.15 |
| MDCM |
0.99 |
0.13 |
0.00 |
0.12 |
Pilot
Study |
Subject 1 |
SDCM |
0.98 |
0.23 |
0.00 |
0.22 |
| MDCM |
0.99 |
0.06 |
0.00 |
0.06 |
| Subject 2 |
SDCM |
0.98 |
0.32 |
0.00 |
0.30 |
| MDCM |
0.99 |
0.09 |
0.00 |
0.08 |
| Mean of all SDCM |
0.98 |
0.23 |
0.01 |
0.22 |
| Mean of all MDCM |
0.99 |
0.09 |
0.00 |
0.09 |
| Overall mean value |
0.98 |
0.16 |
0.01 |
0.16 |
Table 7.
Summary of statistical analysis of proposed electrical models for the imaginary part of impedance.
Table 7.
Summary of statistical analysis of proposed electrical models for the imaginary part of impedance.
| |
Correlation analysis |
Bland-Altman analysis |
| R2
|
] |
] |
|
| Simulation |
SDCM |
0.98 |
0.33 |
-0.29 |
0.50 |
| MDCM |
0.97 |
0.23 |
-0.07 |
0.24 |
| PilotStudy |
Subject 1 |
SDCM |
0.78 |
0.30 |
0.02 |
0.28 |
| MDCM |
0.97 |
0.08 |
0.01 |
0.08 |
| Subject 2 |
SDCM |
0.93 |
0.32 |
-0.03 |
0.32 |
| MDCM |
0.98 |
0.10 |
-0.02 |
0.09 |
| Mean of all SDCM |
0.89 |
0.32 |
-0.10 |
0.37 |
| Mean of all MDCM |
0.97 |
0.14 |
-0.03 |
0.14 |
| Overall mean value |
0.93 |
0.23 |
-0.06 |
0.25 |
|
Disclaimer/Publisher’s Note: The statements, opinions and data contained in all publications are solely those of the individual author(s) and contributor(s) and not of MDPI and/or the editor(s). MDPI and/or the editor(s) disclaim responsibility for any injury to people or property resulting from any ideas, methods, instructions or products referred to in the content. |
© 2023 by the authors. Licensee MDPI, Basel, Switzerland. This article is an open access article distributed under the terms and conditions of the Creative Commons Attribution (CC BY) license (http://creativecommons.org/licenses/by/4.0/).
