Submitted:
20 July 2023
Posted:
24 July 2023
You are already at the latest version
Abstract
In recent years discrete element method (DEM) has gradually been applied to the traditional fluidization simulation of fine particles in micro fluidized bed (MFB). The application of DEM in simulating fast fluidization of fine particles in MFB has not yet received attention. This article presents a drag model that relies on the surrounding environment of particles, namely particle circumstance-dependent drag modle or PCDD model. Fast fluidization in MFB of fine particles is simulated using DEM based on the PCDD model. It is found that the gas-solid two-phase flow in MFB meets the common law of fast fluidization in circulating fluidized bed (CFB) to a certain extent, and also presents a special law that is significantly different from that in CFB. Simulations indicate that the local structure in MFB exhibits particle aggregation which is a natural property of fast fluidized, forming a structure where continuous dilute phase and dispersed concentrated phase coexist. The formation and fragmentation of particle clusters in different local regions of the bed have time synchronization. There exists strong effect of solid back-mixing in MFB, leading to relatively low outlet solid flux. The gas back-mixing effect is, however, not so distinct. The axial porosity shows a monotonically increasing distribution with the bed height, but does not strictly follow the single exponential distribution. The solid volume fraction at the bottom of the bed is significantly lower than the correlated value in CFB. The axial heterogeneous distribution of the cross-sectional average porosity in the lower half of the bed is also weakened. The radial porosity shows a distribution pattern of higher in the central region and lower in the sidewall region. Compared with the correlation results in CFB, the porosity near the central region in MFB is relatively low, while the porosity near the sidewall region is relatively high. The geometric size of the container, especially the radial size, is much smaller than that of a CFB. The relative area of contact between the MFB wall and particles is larger, and the wall friction factor becomes more significant. This may be the main reason for the time synchronization of particle agglomeration, severe particle back-mixing, low outlet solid flux, monotonically increasing axial porosity and weak core-annular structure of radial porosity.
Keywords:
fluidized bed
; DEM
; numerical simulation
; heterogeneous structure
; cluster
; gas-solid backmixing
1. Introduction
Gas-solid fluidized beds are widely used in environmental, energy, chemical and other process engineering fields. Numerical simulation has become an indispensable means of studying gas-solid two-phase fluid dynamics for cognition of fluidized bed. Discrete element method [2,3,4,5] or DEM [2,3,4,5] providing particle-level information has been a tool needed to guide process design and operation in the field of fluidization engineering. The particle and device sizes simulated by DEM show a wide range. With the development of computer technology, high-performance algorithms and modeling capabilities, DEM has been able to simulate laboratory-scale coarse particle reactor. This method is gradually recognized by the industry and will inevitably be widely used [6]. On the other hand, with the improvement of the model and the calculation accuracy, the particle size used in DEM simulation gradually turns refined. Yu’s research group once simulated and analyzed different fluidization types of particle systems with with particles as small as 30 μm [7].
In order to distinguish the particles in the gas-solid system with practical significance, Geldart [8] divided the particles into four classes: A, B, C and D. This is a widely accepted particle classification method in academia. Class C particles or ultra-fine particles are usually considered difficult to be fluidized; Class D particles or ultra-coarse particles have been used in numerous DEM simulation studies, but are limited to less operations such as spout and slugging in practice; Class B particles are fluidized materials with relatively small size in previous DEM simulation, but still classified as coarse particles; Class A particles or fine particles have more smaller size (30-100 μm) and density (less than 1400 kg/m3). Fine particles are rarely used in DEM simulation, but they are widely used in engineering. For example, the catalytic cracking catalyst (FCC) particles, as A typical fine fluidized material, show advantages and characteristics different from other types of particles, such as high gas-solid mass transfer rate, high bed expansion ratio and high heat transfer rate; They significantly expand before bubbling; Moreover, their cohesion is stronger, and van der Waals force should not be ignored in many cases.
Ye al. [9] modeled the fluidization of class A particles using DEM in 2004. Next year Potic et al. [10] from the same study group proposed the concept of micro fluidized bed (MFB) which is far small than experimental circulating fluidzed bed (CFB). They also studied the micro fluidized bed experimentally and theoretically. Han et al. [11] indicated that MFB has the advantages of convenience, safety, low cost and high efficiency. As an ideal isothermal reactor, it can be used for the reaction analyzer. As a small high selectivity module reactor, it can be used to produce high-value fine chemicals. Since only a few coarse particles side by side can fill the whole bed diameter, it is inevitable to abandon the use of class D particles or even class B particles. One has to choose class A particles as fluidized materials in MFB experiment and DEM simulation. Therefore, DEM simulation of class A particle fluidization in MFB may become a hot research field. At present, the tracking of fine particles does not constitute a serious problem. However, the existing DEM simulation results are mainly limited to fixed, uniform expansion, bubbling, slugging and turbulence fluidized beds. It is imperative to carry out the DEM simulation study of unconventional fast fluidization in MFB.
The authors started to study the DEM simulation of fast fluidization of class A particles two years ago. One difficult problem is how to reasonably simulate the flow structures especially the macroscopic structure in MFB. In our previous works [18,19,20], the local flow structure of particle agglomeration can be well simulated. However, the gas-solid back-mixing behavior cannot be reasonably simulated, which leads to the macroscopic structure not satisfactory. Can DEM reasonably simulate the fast fluidization of fine particles in MFB? Looking at the problem, this paper proposes a drag force model considering the particle surrounding environment, and tries to solve the problem by reasonably calculating the drag force.
2. Drag model
The drag model formally adopts the drag formula of single particle in the particle group
where is the particle diameter, is the apparent drag coefficient of the particle group around particle , is the gas density, is the local gas velocity, is the local gas velocity and is the local porosity. A gird-independent calculation method for is given in the following.
A neighborhood of the target particle is firstly determined to consider the influence of each surrounding particle in the neighborhood on the target particle. The influence of each surrounding particle is distinguished according to the different distances from the surrounding particle. This grid-independent calculation method is similar to the kernel approximation method in smooth particle dynamics (SPH) [21]. In this way, Xu et al. [22] calculated as
where is the number of particles in the neighborhood, is the characteristic radius or smooth length of the neighborhood, is the distance between particle and , and is the normalized kernel function which is calculated as
However, the anomalies close to the boundary has been addressed for the above equations (2) and (3). The local porosity close to the boundary is effectively improved by adding boundary virtual particles in a previous study [23]. Figure 1 shows the diagram of the neighborhood, real particles and virtual particles in the kernel approximation method.
In [23] is set to be 2.5. In fact, the accurate tune is difficult even in SPH simulations. On the other hand, in equation (2) the contribution of each particle for the local solid volume fraction of particle is . However, the contribution should not be fixed for different particle systems. This problem is solved by introducing a solid volume fraction multiplier as
In order to avoid parameter testing, is determined by the following equation as
where is the particle filling ratio of the bed, is the total number of real particles which are randomly distributed throughout the bed.
Combined with the apparent drag coefficient proposed by Wen & Yu [24] and the single-particle drag coefficient proposed by Schiller & Naumann [25], the apparent drag coefficient is calculated as
where is calculated according to equation (4). Thus the particle circumstance-dependent drag (PCDD) model is constructed according to equations (1) and (6).
3. Simulation method
The Navier-Stokes equations of the gas phase motion are expressed as equations (7) and (8),
where is the mean porosity, is the pressure, is the gas velocity, is the time, is the stress tensor, and is the momentum exchange source term. is calculated as
where is the number of particles that overlap with grid , is the particle disc area, is the overlap area of particle with grid , and is the grid volume which is calculated as if the grid had a thickness of .
The exact area fraction model is used [26] to calculate the 2-D porosity and the following conversion formula [3] is used to convert to the 3-D porosity as
The finite volume method is used for discretizing the Navier-Stokes equations, using the consistent velocity inlet, pressure outlet and wall impenetrable conditions as boundary conditions and the SIMPLER method [27] to solving the discretized algebraic equations.
The particle translation is described according to the Newton’s Second Law as
where is the contact force, is the van der Waals force, is the volume of the particle, is the local pressure. The soft sphere method is used to handle the particle-particle and particle-wall collision. The mass of the wall is infinite. The drag force is calculated by use of the PCDD model. The van der Waals force between particles is calculated as
where is the Hamaker constant, is the unit vector from particle to particle , and is the distance between particle and particle . The van der Waals force of the wall applied to particle is calculated as
where is the unit vector from the particle to the wall, and is the distance between the particle and the wall. Moreover, to calculate the non-contact van der Waals force according to equations (12) and (13), one needs to set the cutoff distance , i.e., the lower bound of and . The current simulations take =0.4 nm.
The particle rotation is described as
where is the
particle angular velocity, is the inertia of
the particle, and is the torque of the collision.
In the present two-dimensional simulations, the size of the micro riser is D×H =2.5 mm × 40 mm. The number of grids discretizing the corresponding flow field is 10×160. The maximal particle number used is 11452. Initially 8230 real particles are set static and randomly distributed throughout the whole bed, which determines =0.948 according to equation (5). The particle feed way follows the import-and-export balance. Table 1 shows the other fixed parameters of the gas-solid phases in the simulations.
3. Results and discussion
3.1. Particle agglomeration
The transient particle and porosity distribution are given in Figure 2. The coexisting structures of the dilute phase as disperse particles and the dense phase as granular aggregates are consistently presented in the MFB. Kuipers et al. [28] recommended to use the porosity of 0.85 as a standard to distinguish the emulsion phase and the bubble phase in a bubbling fluidized bed. Figure 2 also uses this standard to distinguish the dense phase and the dilute phase. As can be seen from the porosity distribution, the dilute phase is continuous while the dense phase is dispersed. In different areas of the bed, the boundaries of the two phases are sometimes blurred, and sometimes clear. With the change of time and space, clusters show the dynamic behaviors of continuous formation and fragmentation, and vary in shape and size. The figure also shows that in different areas of the whole bed, clusters almost form and break at the same time. When clusters tend to form, there are more of them existing in the bed. When clusters tend to break, the number is less. The temporal synchronization of the clusters’ dynamic behaviors is an interesting phenomenon, which has not been reported in CFB researches. Whether it is true in MFB needs to be verified in future experimental studies. Overall, since DEM achieves single particle tracking, a complete description of the heterogeneous structures within any volume in the flow field can be obtained by tracking the details of the interaction between each particle and the fluid.
3.2. Gas-solid back-mixing
Figure 3 presents the instantaneous distribution of the particle velocity within the 0.01m height range in the bed. As is shown in the figure, there is a serious back-mixing effect of the particles. The large cluster form near the wall and then move down along the wall. The radial velocity of the particles inside the cluster is small and the axial velocity is large. Where the cluster passes, a strong tail vortex is formed to attract the tail particles to follow down. At the same time, a part of the peripheral particles begin to break away from the cluster due to the large radial velocity. Eventually the cluster disintegrates due to the penetration of the fluid. At the bottom of the bed, the newly entering particles not been fully accelerated and the upper particles are in frequent contact. This results in low radial and axial velocity of the particles in this area, and also in disorder orientation. In addition to the concentrated phase area, the particle velocity near the wall is relatively small, while the velocity in the central area is relatively large. Moreover, for the particles in the central area, whether the disperse particles or particle groups, the axial velocity is mainly upward. As is also indicated in Figure 3, the positive and negative velocity might be detected in almost all radial and axial positions.
Figure 4 shows the instantaneous distribution of the gas velocity in the 0.01m height range, which corresponds in time to Figure 3. The gas tends to bypass the large cluster, around which the gas has a high radial velocity. In the interior of the cluster, both the radial and axial gas velocity are greatly reduced. Although the orientation of the radial velocity become chaotic, the larger part of the axial velocity is negative. Only in this area, the gas shows a sign of back-mixing. This proves that the back-mixing of the gas phase is mainly caused by the back-mixing of particles, i.e., the solid phase flow dominates. Except for the dense phase area, the gas velocity tends to be evenly distributed. Gas flow is mainly axially upward, and the radial velocity is small. That is to say, the dilute phase area is generally dominated by the gas upward flow. Thus most of the dispersed particles can be continuously transported upward.
Figure 5 shows the outlet solid flux over time. After about 0.2 s, the two-phase flow within the MFB reaches a relatively stable state. In the relatively stable state, the outlet solid flux still has large fluctuations. The average value is about 7.8 kg/(m2·s) and it is much smaller than in the literature [20] which is 90~110 kg/(m2·s). This significant difference indicates that the particle back-mixing effect is more serious in the current simulations.
The saturated entrainment rate of the particles can be calculated by the following correlation formula of Bai & Kato [29] as
where is the Frodes number and is the Archimedes number. When the operating gas velocity is 1.52 m/s, the correlated is 16.18 kg/(m2·s). The experimental result given by Li & Kwauk [30] and the simulation result presented by Yang et al. [31] are both approximately 14.3 kg / (m2·s), indicating that the correlation formula has good predictive power. The correlation value at the current gas operating velocity 1.7 m/s is 19.9 kg / (m2· S). Therefore, due to the failure to reasonably simulate the back-mixing behavior of particles, the outlet solid flux is overestimated in [20], even much higher than the saturation entrainment rate of particles. The currently selected gas-solid properties are basically the same as those in Yang et al. In this work the operating gas velocity is slightly higher, and the particle filling ratio is slightly lower. However, the simulated average outlet solid flux is much lower than the simulated and correlated values in CFB. The authors speculate that the most direct reason might be the geometry effect. In MFB compared with CFB, the bed diameter is very small. Thus for the wall the relative area of contact with particles significantly enlarges. The strong wall friction force causes that the particles near the wall cannot be transported upward, which through particle collisions gradually passed to the surrounding particles and even central area. And the gas phase needs to consume a lot of energy or pressure drop for suspended particles, which seriously hindered the transport of the particles.
3.3. Axial structure
Figure 6 shows the distribution of the mean porosity at the bottom and top sections of the bed. It shows that the top of the bed is a dilute phase area, and the fluctuation range of the mean porosity is small or even close to 1. At the bottom of the bed, the porosity is greatly reduced, and the fluctuation range is large. The lowest value can descent to below 0.8, which indicates that the dense phase can continuously forms in different radial positions of the bottom.
Figure 7 shows the instantaneous and time averaging cross-sectional porosity between 0.2-0.5 s, with the height 0.000125 m, 0.005125 m, 0.015125 m, 0.025125 m, 0.035125 m and 0.039875 m, respectively. In CFB, the axial porosity distribution of fast fluidized bed is usually a monotonically increasing exponential distribution unless the outlet solid flux reaches the saturated entrainment rate of the particles. The current simulated axial distribution, although a monotonically increasing function of height, does not strictly obey the simple exponential distribution. It appears to have an inflection point between 0.015125 m and 0.025125 m. Because the parameters of the simple exponential function given by the vast majority of experimental studies are not uniform, it is difficult to compare the current simulated distribution of axial porosity with the results of the literature. Consider the solid phase volume fraction at the bottom of the bed . As < , the correlation formula of Bai & Kato [29] is used as
where represents the terminal velocity of the particles. In the moderate Reynolds number condition, use the formula of Lewis et al. [32] to calculate . From (16) the correlated is 0.22, while the presently simulated value is 0.136. The simulated value is far below the correlated value. The possible reasons for such a deviation include the following. The two-dimensional simulation cannot reach the reality of the three-dimensional simulation; The simple set import and export boundary conditions cannot simulate the real complex import and export effects; Besides, it should be more inclined to think that the relative area of wall-particle contacts increases significantly in the MFB, resulting in a large decrease of the outlet solid flux. It is not difficult to analyze according to formula (16), decreases with the decrease of the outlet solid flux. Due to the low level of , the heterogeneous distribution of cross-sectional porosity in the bottom area of the bed is weakened. This may be the main reason why the simulated axial voidage does not strictly obey the simple exponential distribution.
3.4. Radial structure
Figure 8 shows the porosity at the right wall and the central with the height 0.015125 m. Let be the dimensionless radius of the bed. The average porosity in the right wall area at =0.95 is significantly lower than in the central area at =0.05. The difference rates from negative to 1 − , indicating that the formation and fragmentation of clusters has spatial and temporal dynamic characteristics. In the center there exists the sigh of clusters, while in close the wall clusters are easy to break and transfer.
Figure 9 shows the porosity of the left wall area (=−0.95) and the central area (=−0.05) at the height of 0.015125 m. Compared with Figure 8, there is a large difference in the distribution of the porosity between the left and the right at the same time, indicating a severe asymmetry in the instantaneous radial structure in the MFB. In addition, both the total time-mean values and the instantaneous values in the central are all symmetrical. The symmetry of the time-averaged distribution indicates good particle mixing and gas-solid contact performance in the MFB. Thus, further discussion of the radial structure in the following selects only the results from the right of the MFB.
Figure 10 shows the radial distribution of the porosity at the height 0.015125 m. The radial flow law of gas-solid phases in the fast fluidized bed is extremely important. The results of extensive experimental analysis show that as long as the cross-sectional porosity is determined, the radial distribution of the porosity is only a function of the radial position, i.e., the dimensionless radius, regardless of the operating conditions. According to Figure 7, the cross-sectional porosity at the height 0.015125 m is 0.912. Use the correlation formula of Patience & Chaouki [33] as the following.
The correlation result of the radial porosity in CFB is then obtained. The simulation results and the correlation results both show the high porosity in the central and the low porosity in close the wall, which follows the typical core-annulus distribution in the trend. The difference between the correlated and the simulated lies in the relatively low porosity in the central and the relatively high porosity in close the wall in the simulated results, indicating a weak core-annulus effect. This significant difference lies in the amplification effect of wall friction in the MFB. The narrow bed diameter itself is easy to cause material slug, which can easily fill most of the bed diameter. As has also been stated, there exists the trace of clusters in the central of the bed. Therefore, the heterogeneity of the radial distribution is also weakened.
5. Conclusion
In this paper, we give a drag model considering the particle environment which is heterogeneous and complex. This model is implanted into DEM for simulation of fast fluidization in the MFB of fine particles. Simulations show that gas-solid two-phase flow in the MFB satisfies the common law of fast fluidization to some extent. Because the geometric size of the container is much smaller than that of a CFB, the relative area of the wall-particle contact is large. The wall friction factor thus becomes very significant and thus simulations exhibit a special rule of large difference with those in CFB. The specific conclusions are drawn as follows:
1) The local structure in the MFB satisfies the natural property of fast fluidized particle agglomeration, forming disperse dilute phase and continuous dense phase. The formation and fragmentation of clusters in different local regions are time-synchronized.
2) There is serious gas-solid back-mixing in the MFB, and the dense phase is the main area of gas-solid back-mixing. The wall friction factor aggravates the particle remixing effect, resulting in a relatively low outlet solid flux.
3) The axial porosity presents an increasing distribution with the bed height, but does not strictly satisfy the monotonic exponential distribution. The solid volume fraction at the bottom of the bed is much lower than the correlated results for a CFB.
4) The radial porosity exhibit a weak core-annulus structure with higher central region and lower side region. Compared with the correlated results for a CFB, the central region in the MFB is relatively dense while the side region is relatively dilute.
Author Contributions
Conceptualization, G.W.; methodology, G.W. and Q.L.; software, G.W.; validation, G.W. and Z.Z.; formal analysis, G.W.; investigation, G.W.; resources, G.W.; data curation, G.W.; writing—original draft preparation, G.W.; writing—review and editing, G.W.; visualization, Z.Z. and Q.L.; supervision, Q.L.; and project administration, Q.L.. All authors have read and agreed to the published version of the manuscript.
Funding
This research received fundings supported by the Natural Science Foundation of Chongqing (CSTB2023NSCQ-MSX0974, CSTB2022NSCQ-MSX0290) and the National Natural Science Foundation of China (12226352).
Data Availability Statement
The data presented in this study are available upon request from the corresponding author.
Conflicts of Interest
The authors declare no conflict of interest. The funders had no role in the design of the study; in the collection, analyses, or interpretation of data; in the writing of the manuscript, or in the decision to publish the results.
Nomenclature
| A | area,m2 |
| Ar | Archimedes number |
| C | drag coefficient |
| D | bed wide, m |
| d | particle diameter or distance between particles, m |
| e | unit vector |
| F | force on particle, and N |
| Fr | Fred number |
| G | outlet solid flux,kg·m−2·s−1 |
| g | gravity acceleration, m·s−2 |
| h | smooth length, m |
| H | height of bed,m |
| Ha | Hamaker constant, N·m |
| H0 | Truncation distance, m |
| I | inertia moment of particle as spherical, kg·m2 |
| i, j, k | particle or grid index |
| N | number of particles |
| p | pressure,Pa |
| r | particle position vector |
| r | dimensionless radius |
| Sp | momentum exchange source term |
| T | torque,N·m |
| t | time,s |
| u0 | inlet gas velocity, m·s−1 |
| u | gas velocity, m·s−1 |
| ut | particle terminal speed |
| V | volume,m3 |
| v | particle velocity, m·s−1 |
| porosity | |
| cross-sectional porosity | |
| solid volume fraction at bottom of bed | |
| stiffness coefficient, N·m−1 | |
| solid volume fraction multiplier | |
| viscosity, N · s · m−2 | |
| density, kg· m−3 | |
| viscocous stress tensor, Pa | |
| particle angular velocity, s−1 | |
| restitution coefficient | |
| subscript | |
| 2D | two dimension |
| 3D | three dimension |
| c | contact |
| d | drag |
| g | gas |
| i, j, k | particle or grid index |
| mf | minimal fluidized state |
| p | particle |
| s | solid |
| t | total |
| v | van der Waals |
| w | bed wall |
References
- Jin, Y.; Zhu, J.X.; Wang, Z.W.; Yu, Z.Q. Fluidization engineering principles; Tsinghua University Press: Beijing, China, 2001. [Google Scholar]
- Tsuji, Y.; Kawaguchi, T.; Tanake, T. Discrete particle simulation of two-dimensional fluidized bed. Powder Technol. 1993, 77, 79–87. [Google Scholar] [CrossRef]
- Hoomans, B.P.B.; Kuipers, J.A.M.; Briels, W.J.; Van Swaaij, W.P.M. Discrete particle simulation of bubble and slug formation in a two-dimensional gas-fluidised bed: A hard-sphere approach. Chem. Eng. Sci. 1996, 51, 99–108. [Google Scholar] [CrossRef]
- Xu, B.H.; Yu, A.B. Numerical simulation of the gas-solid flow in a fluidized bed by combing discrete particle method with computational fluid dynamics. Chem. Eng. Sci. 1997, 52, 2785–2809. [Google Scholar] [CrossRef]
- Ouyang, J.; Li, J.H. Particle-motion-resolved discrete model for simulating gas-solid fluidization. Chem. Eng. Sci. 1999, 54, 2077–2083. [Google Scholar] [CrossRef]
- Zhou, C.L.; Zhao, Y.Z. Discrete element method and its applications in fluidizatio. CIESC Journal 2014, 65, 2520–2534. [Google Scholar]
- Yu, A.B.; Xu, B.H. Particle-scale modelling of gas–solid flow in fluidisation. J. Chem. Technol. Biotechnol. 2003, 78, 111–121. [Google Scholar] [CrossRef]
- Geldart, D. Types of gas fluidization. Powder Technol. 1973, 7, 285–292. [Google Scholar] [CrossRef]
- Ye, M.; van der Hoef, M.; Kuipers, J. A numerical study of fluidization behavior of Geldart A particles using a discrete particle model. Powder Technol. 2004, 139, 129–139. [Google Scholar] [CrossRef]
- Potic, B.; Kersten, S.R.A.; Ye, M.; van der Hoef, M.A.; Kuipers, J.A.M.; van Swaaij, W.P.M. Fluidization with hot compressed water in micro-reactors. Chem. Eng. Sci. 2005, 54, 5982–5990. [Google Scholar] [CrossRef]
- Han, Z.; Yue, J.; Geng, S.; Hu, D.; Liu, X.; Bello Suleiman, S.; Cui, Y.; Bai, D.; Xu, G. State-of-the-art hydrodynamics of gas-Solid micro fluidized beds. Chem. Eng. Sci. 2021, 232, 116345. [Google Scholar] [CrossRef]
- Ye, M.; van der Hoef, M.A.; Kuipers, J.A.M. The effects of particle and gas properties on the fluidization of Geldart A particles. Chem. Engi. Sci. 2005, 60, 4567–4580. [Google Scholar] [CrossRef]
- Wang, J.W.; van der Hoef, M.A.; Kuipers, J.A.M. CFD study of the minimum bubbling velocity of Geldart A particles in gas-fluidized beds. Chem. Eng. Sci. 2010, 65, 3772–3785. [Google Scholar] [CrossRef]
- Hou, Q.F.; Zhou, Z.Y.; Yu, A.B. Micromechanical modeling and analysis of different flow regimes in gas fluidization. Chem. Eng. Sci. 2012, 84, 449–468. [Google Scholar] [CrossRef]
- Wang, J.W.; van der Hoef, M.A.; Kuipers, J.A.M. Why the two-fluid model fails to predict the bed expansion characteristics of Geldart A particles in gas-fluidized beds: A tentative answer. Chem. Eng. Sci. 2009, 64, 622–625. [Google Scholar] [CrossRef]
- Li, T.; Rabha, S.; Verma, V.; Dietiker, J.F.; Xu, Y.; Lu, L.; Rogers, W.; Gopalan, B.; Breault, G.; Tucker, J.; Panday, R. Experimental study and discrete element method simulation of Geldart Group A particles in a small-scale fluidized bed. Adv. Powder Technol. 2017, 28, 2961–2973. [Google Scholar] [CrossRef]
- Li, S.; Zhao, P.; Xu, J.; Zhang, L.; Wang, J. Direct comparison of CFD-DEM simulation and experimental measurement of Geldart A particles in a micro-fluidized bed. Chem. Eng. Sci. 2021, 64, 622–625. [Google Scholar] [CrossRef]
- Wu, G.R.; Li, Y.G. DPM simulations of A-Type FCC particles’ fast fluidization by use of structure-dependent nonlinear d rag force. Processes 2021, 9, 1574–1588. [Google Scholar] [CrossRef]
- Wu, G.R.; Zuo, Z.F.; Li, Y.G. Selection of relative DEM time step for m odelling fast fluidized bed of A-Type FCC particles. Symmetry 2023, 15, 488–502. [Google Scholar] [CrossRef]
- Wu, G.R.; Zuo, Z.F.; Li, Y.G.; Israr, M. Improvement of relative DEM time step range in fast fluidization simulation of Type-A FCC particles. Processes 2023, 11, 1155–1172. [Google Scholar] [CrossRef]
- Lucy, L.B. Numerical approach to testing the fission hypothesis. Astronomy Journal 1977, 82, 1013–1024. [Google Scholar] [CrossRef]
- Xu, M.; Ge, W.; Li, J.H. A discrete particle model for particle–fluid flow with considerations of sub-grid structures. Chem. Eng. Sci. 2007, 62, 2303–2308. [Google Scholar] [CrossRef]
- Wu, G.R.; Ouyang, J.; Li, Q. Revised drag calculation method for coarse grid Lagrangian-Eulerian simulation of gas-solid bubbling fluidized bed. Powder Technol. 2013, 235, 959–967. [Google Scholar] [CrossRef]
- Wen, C.Y.; Yu, Y.H. Mechanics of fluidization. Chem. Eng. Progr. Symp. Ser. 1966, 62, 100–111. [Google Scholar]
- Schiller, V.L.; Naumann, A. Uber die grundlegenden berechnungen bei der schwerkraftaufbereitung. Z. Ver. Dtsch. Ing. 1993, 77, 318–320. [Google Scholar]
- Wu, G.R.; Ouyang, J. Fine grid DEM simulation of bed layer height in bubbling fluidized-bed. CIESC Journal 2014, 65, 2092–2097. [Google Scholar]
- Patankar, T.V. Numerical heat transfer and fluid flow; Hemisphere Publishing Corporation: New York, 1980. [Google Scholar]
- Kuipers, J.A.M.; van Uuin, K.J.; van Beckum, F.P.H.; van Swaaij, W.P.M. A numerical model of gas-fluidized beds. Chem. Eng. Sci. 1992, 47, 1913–1924. [Google Scholar] [CrossRef]
- Bai, D.; Kato, K. Generalized correlations of solids holdups at dense and dilute regions of circulating fluidized beds. In Proceedings of the 7th SCEJ Symp. on CFB, Tokyo; 1994; pp. 137–144. [Google Scholar]
- Li, J.; Kwauk, M. Particle-fluid two-phase flow: The energy-minimization multi-scale method; Metallurgical Industry Press: Beijing, 1994. [Google Scholar]
- Yang, N.; Wang, W.; Ge, W.; Li, J.H. CFD simulation of concurrent-up gas-fluid flow in circulating fluidized beds with structure-dependent drag coefficient. Chem. Eng. Sci. 2003, 96, 71–80. [Google Scholar] [CrossRef]
- Lewis, W.K.; Gilliland, E.R.; Bauer, W.C. Characteristics of fluidized particles. Ind. Eng. Chem. 1949, 41, 1104–1117. [Google Scholar] [CrossRef]
- Patience, G.S.; Chaouki, J. Solids hydrodynamics in the fully developed region of CFB riser, 4th ed.; Large, J.F., Laguerie, C., Eds.; Engineering Foundation: New York, 1996. [Google Scholar]
Figure 1.
Neighboring area, real particle and virtual particle in kernel estimator method.
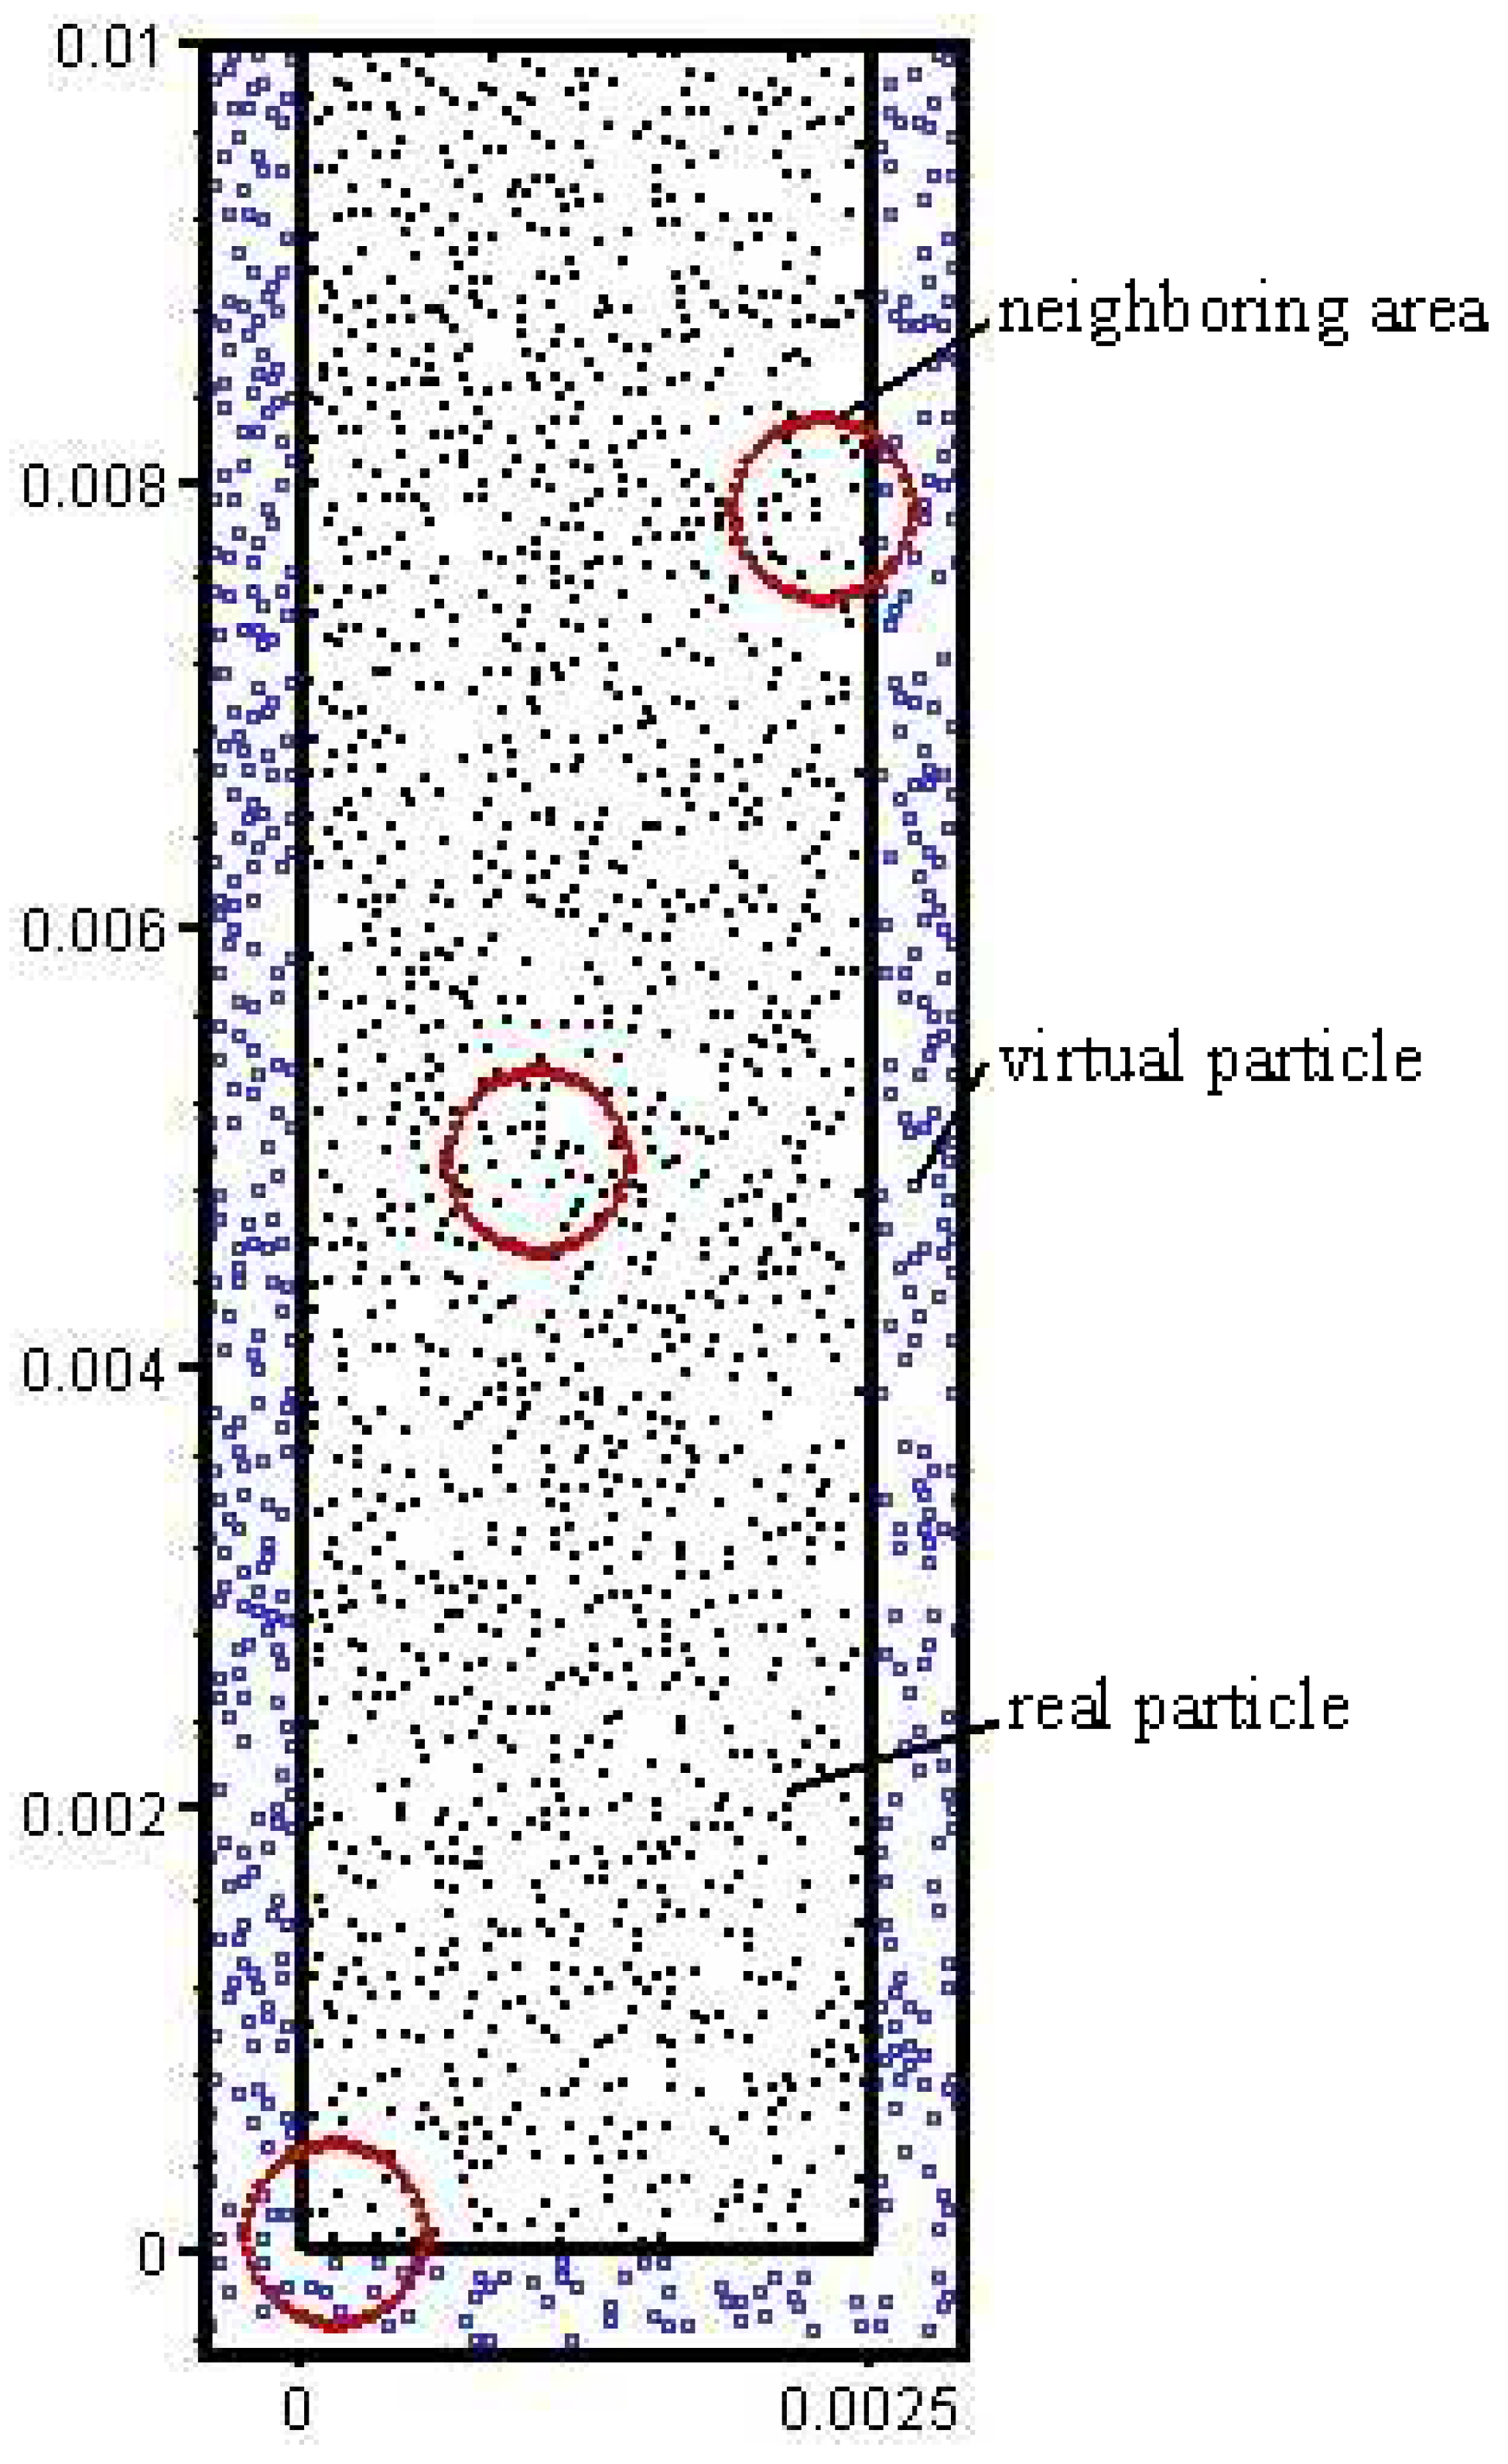
Figure 2.
Particle and porosity distribution.
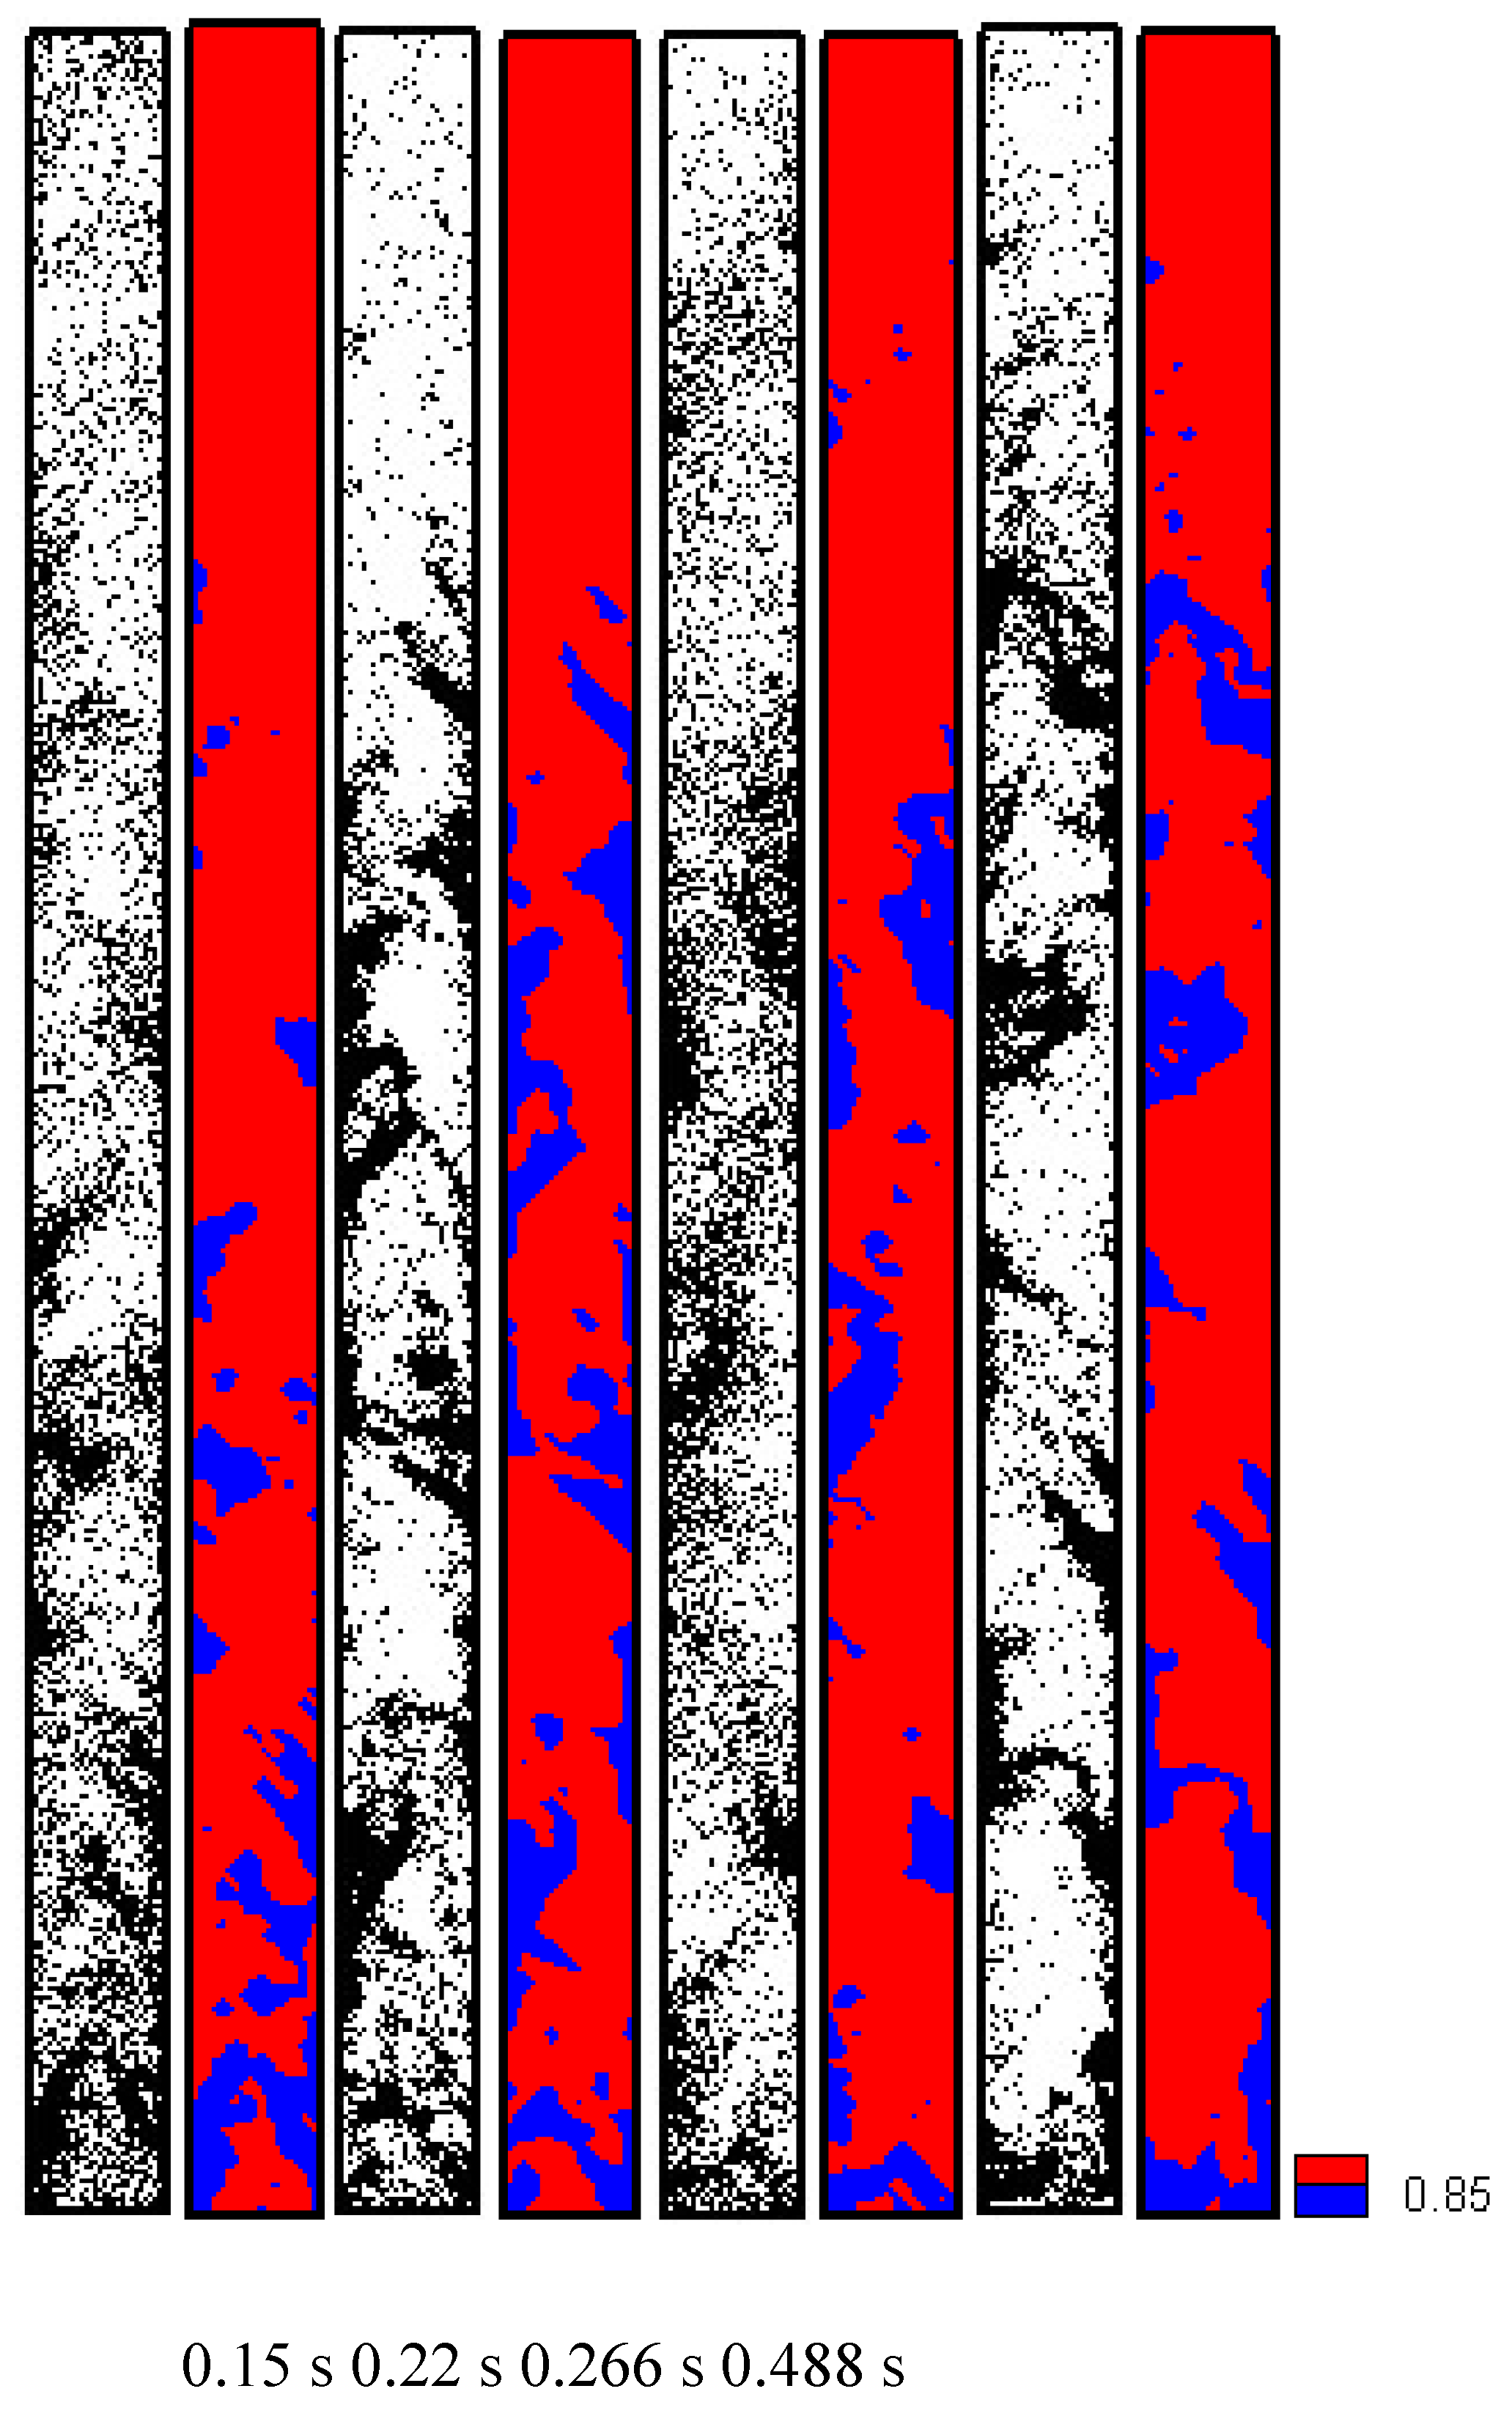
Figure 3.
Particle velocity distribution below 0.01 m.
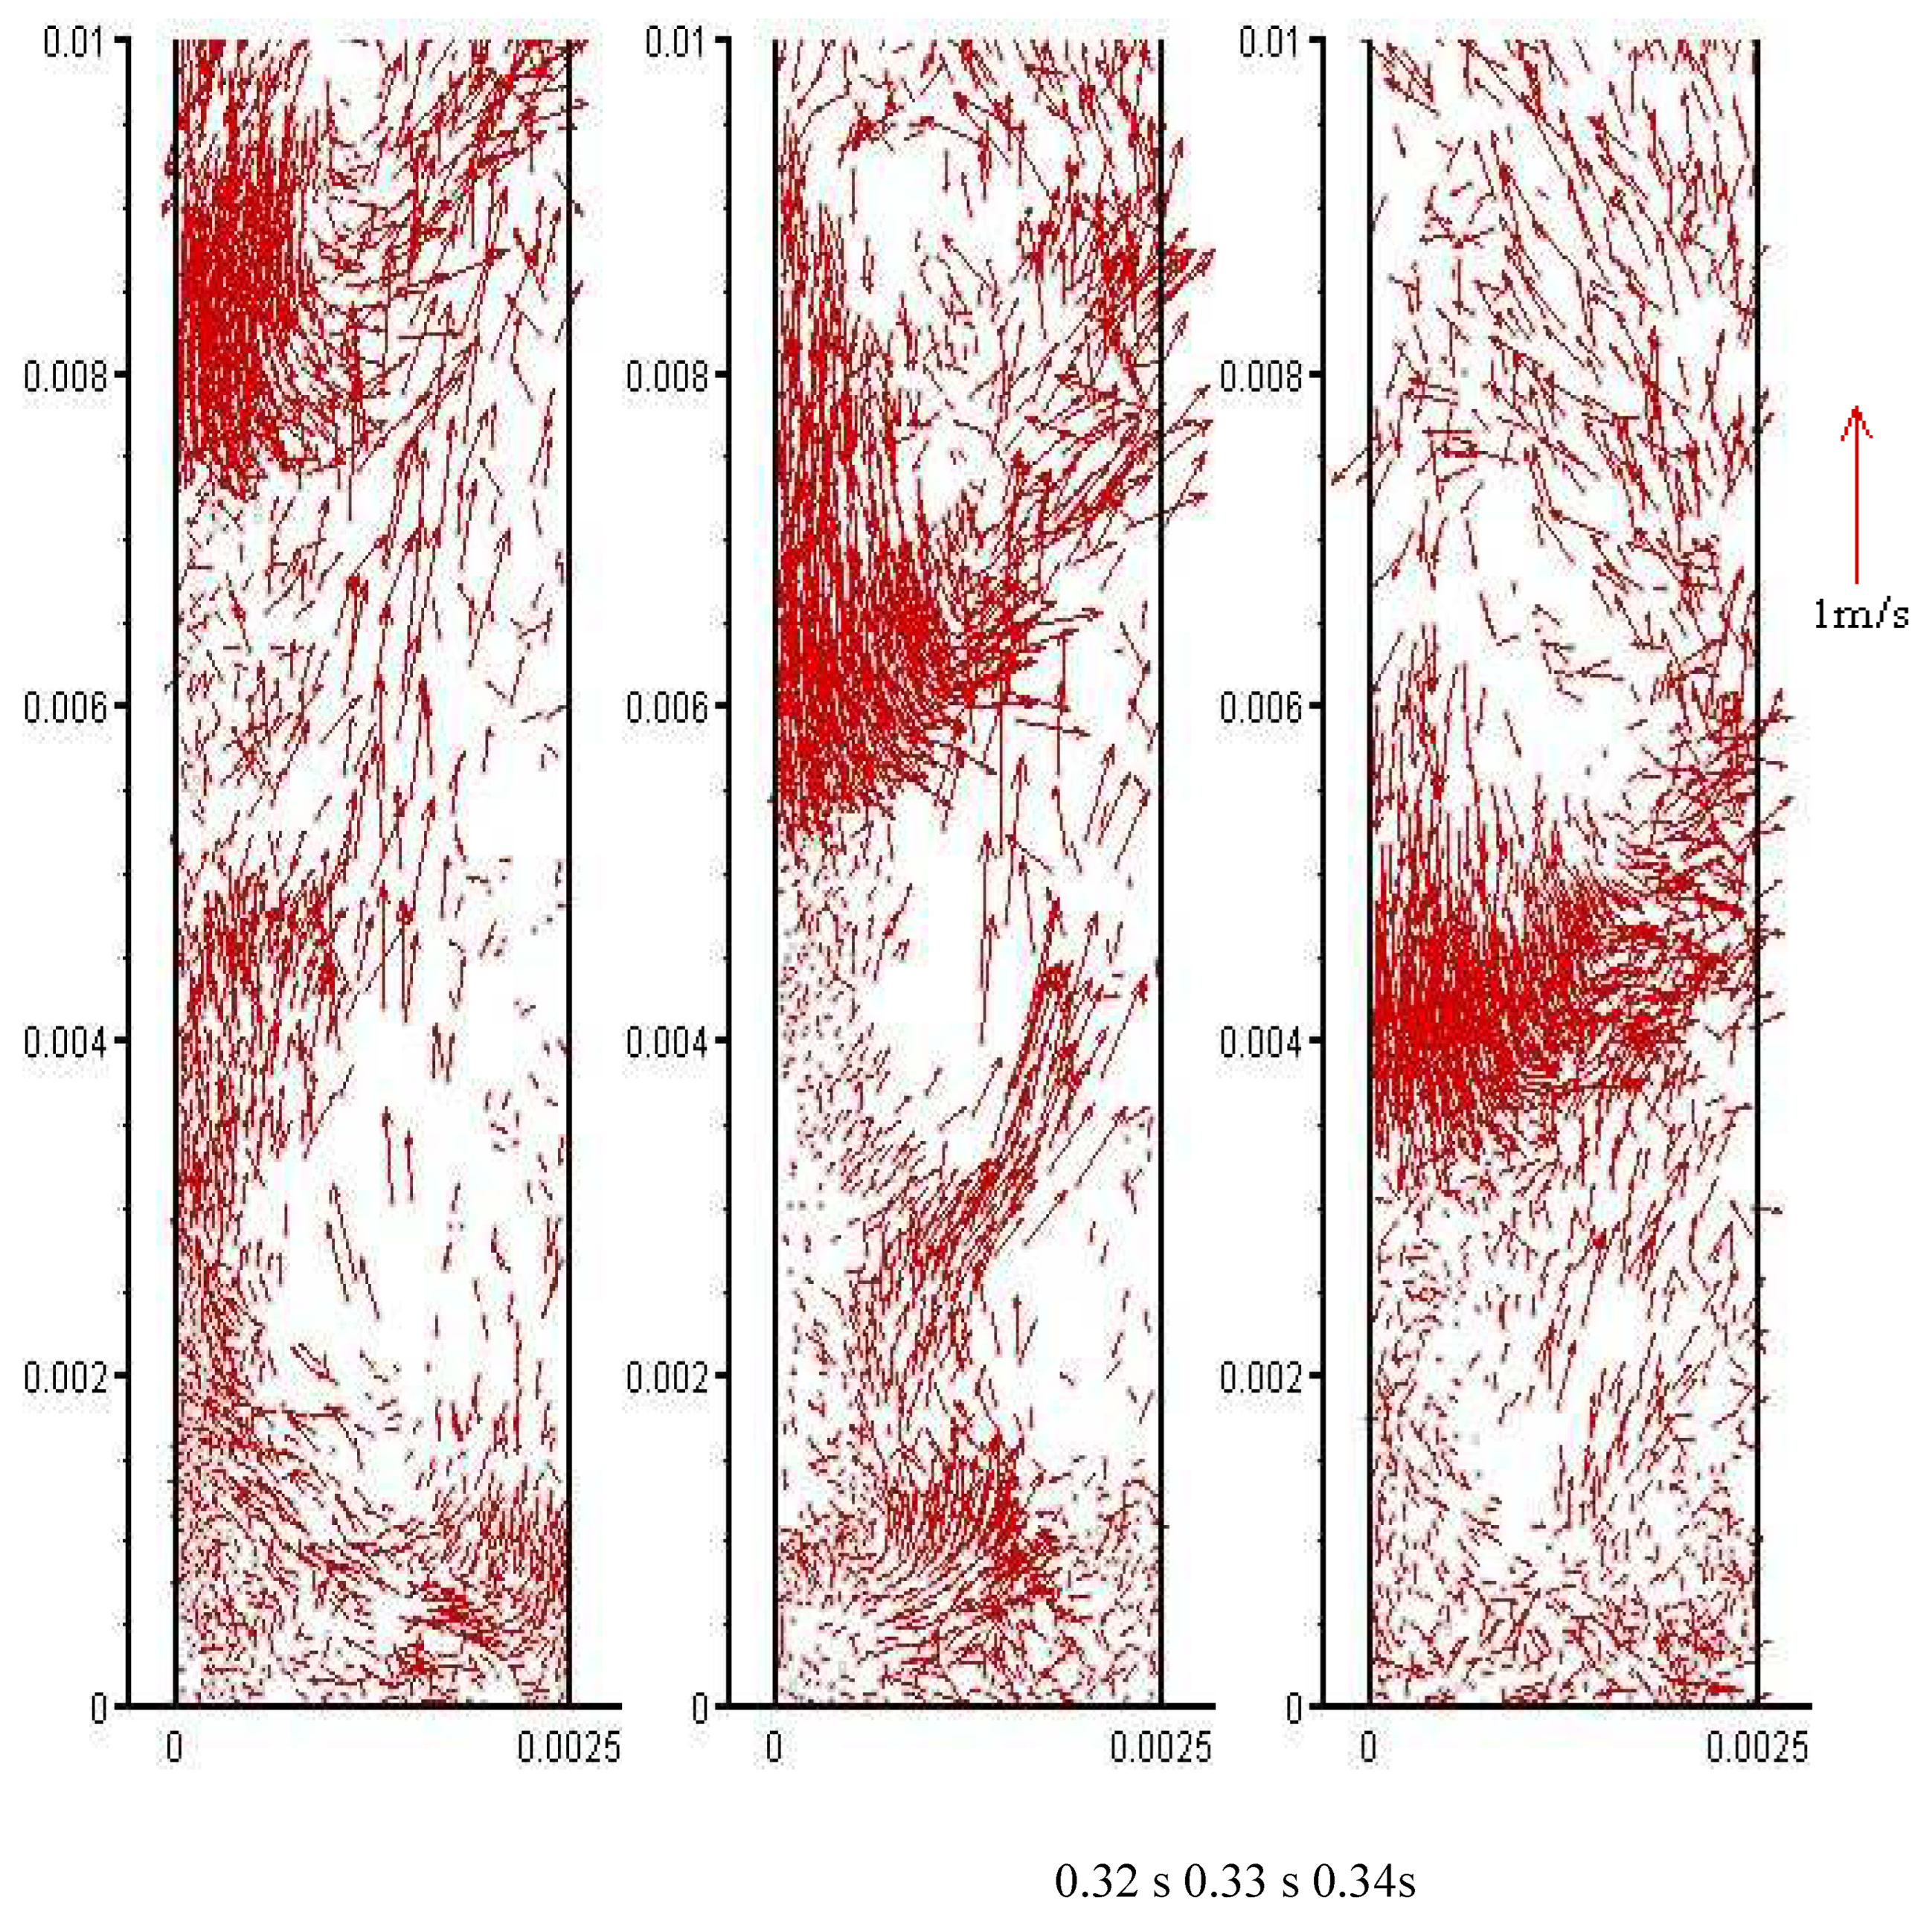
Figure 4.
Gas velocity distribution below 0.01 m.
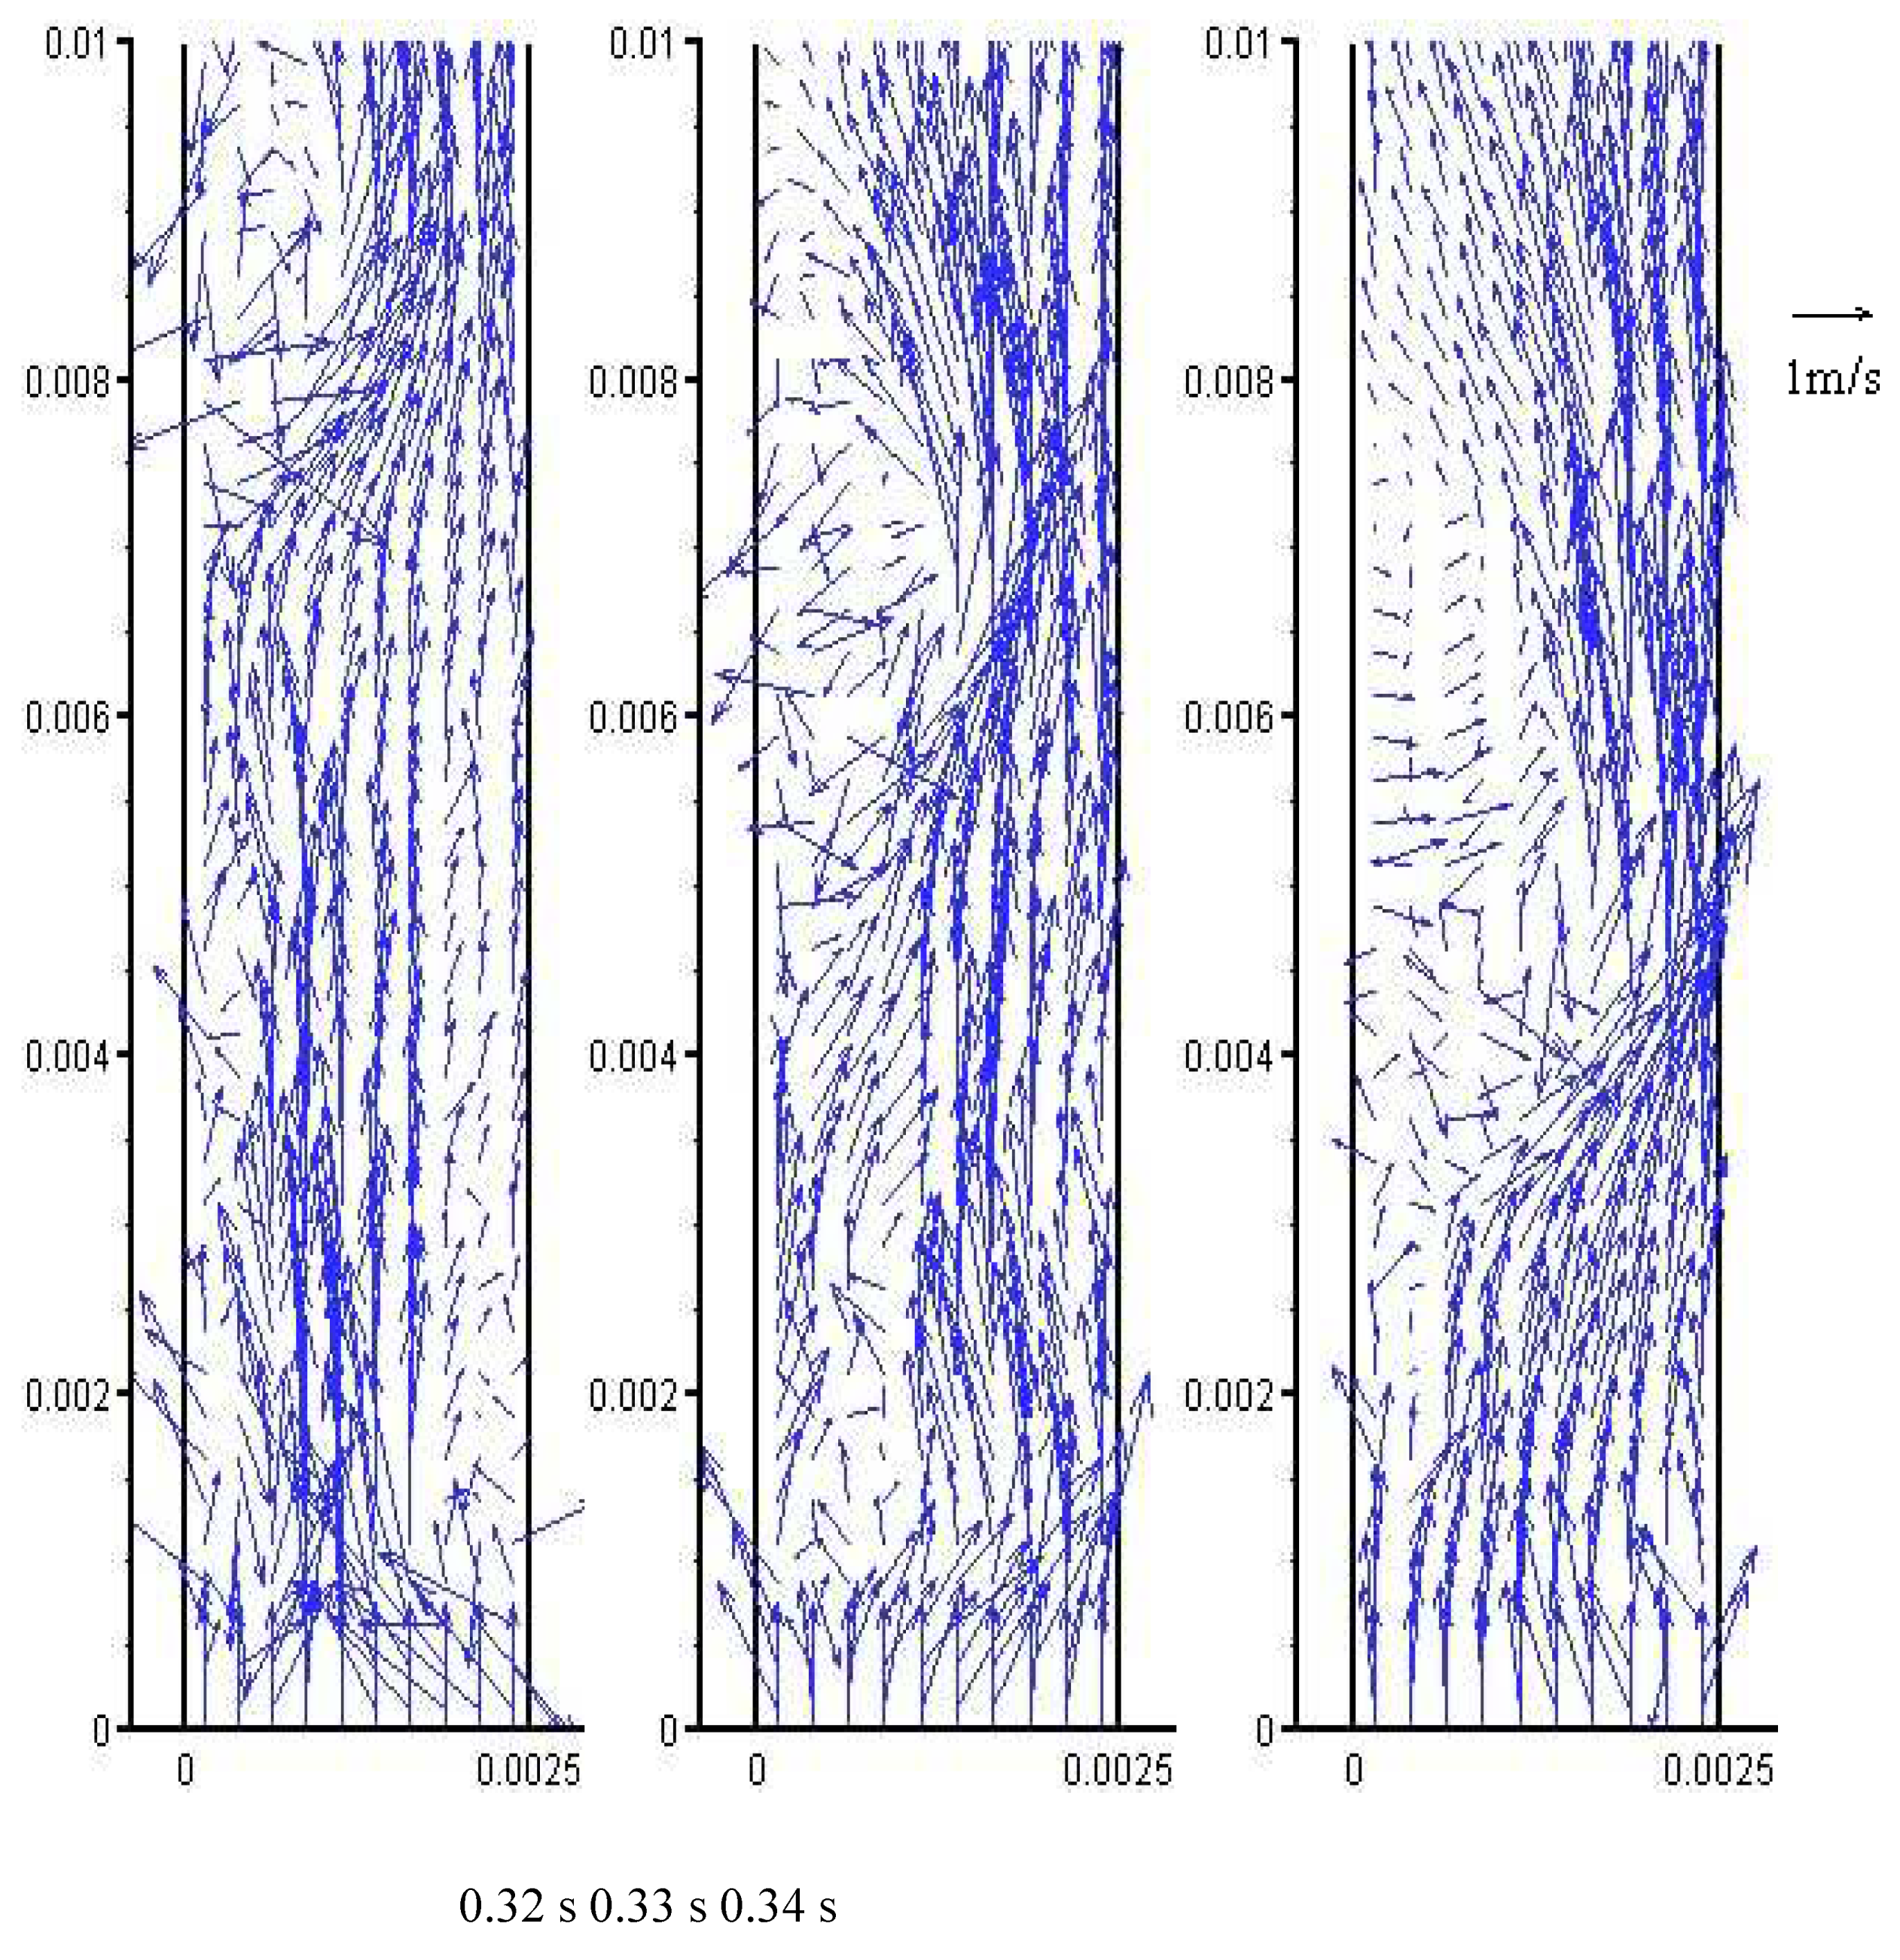
Figure 5.
Outlet solid flux.
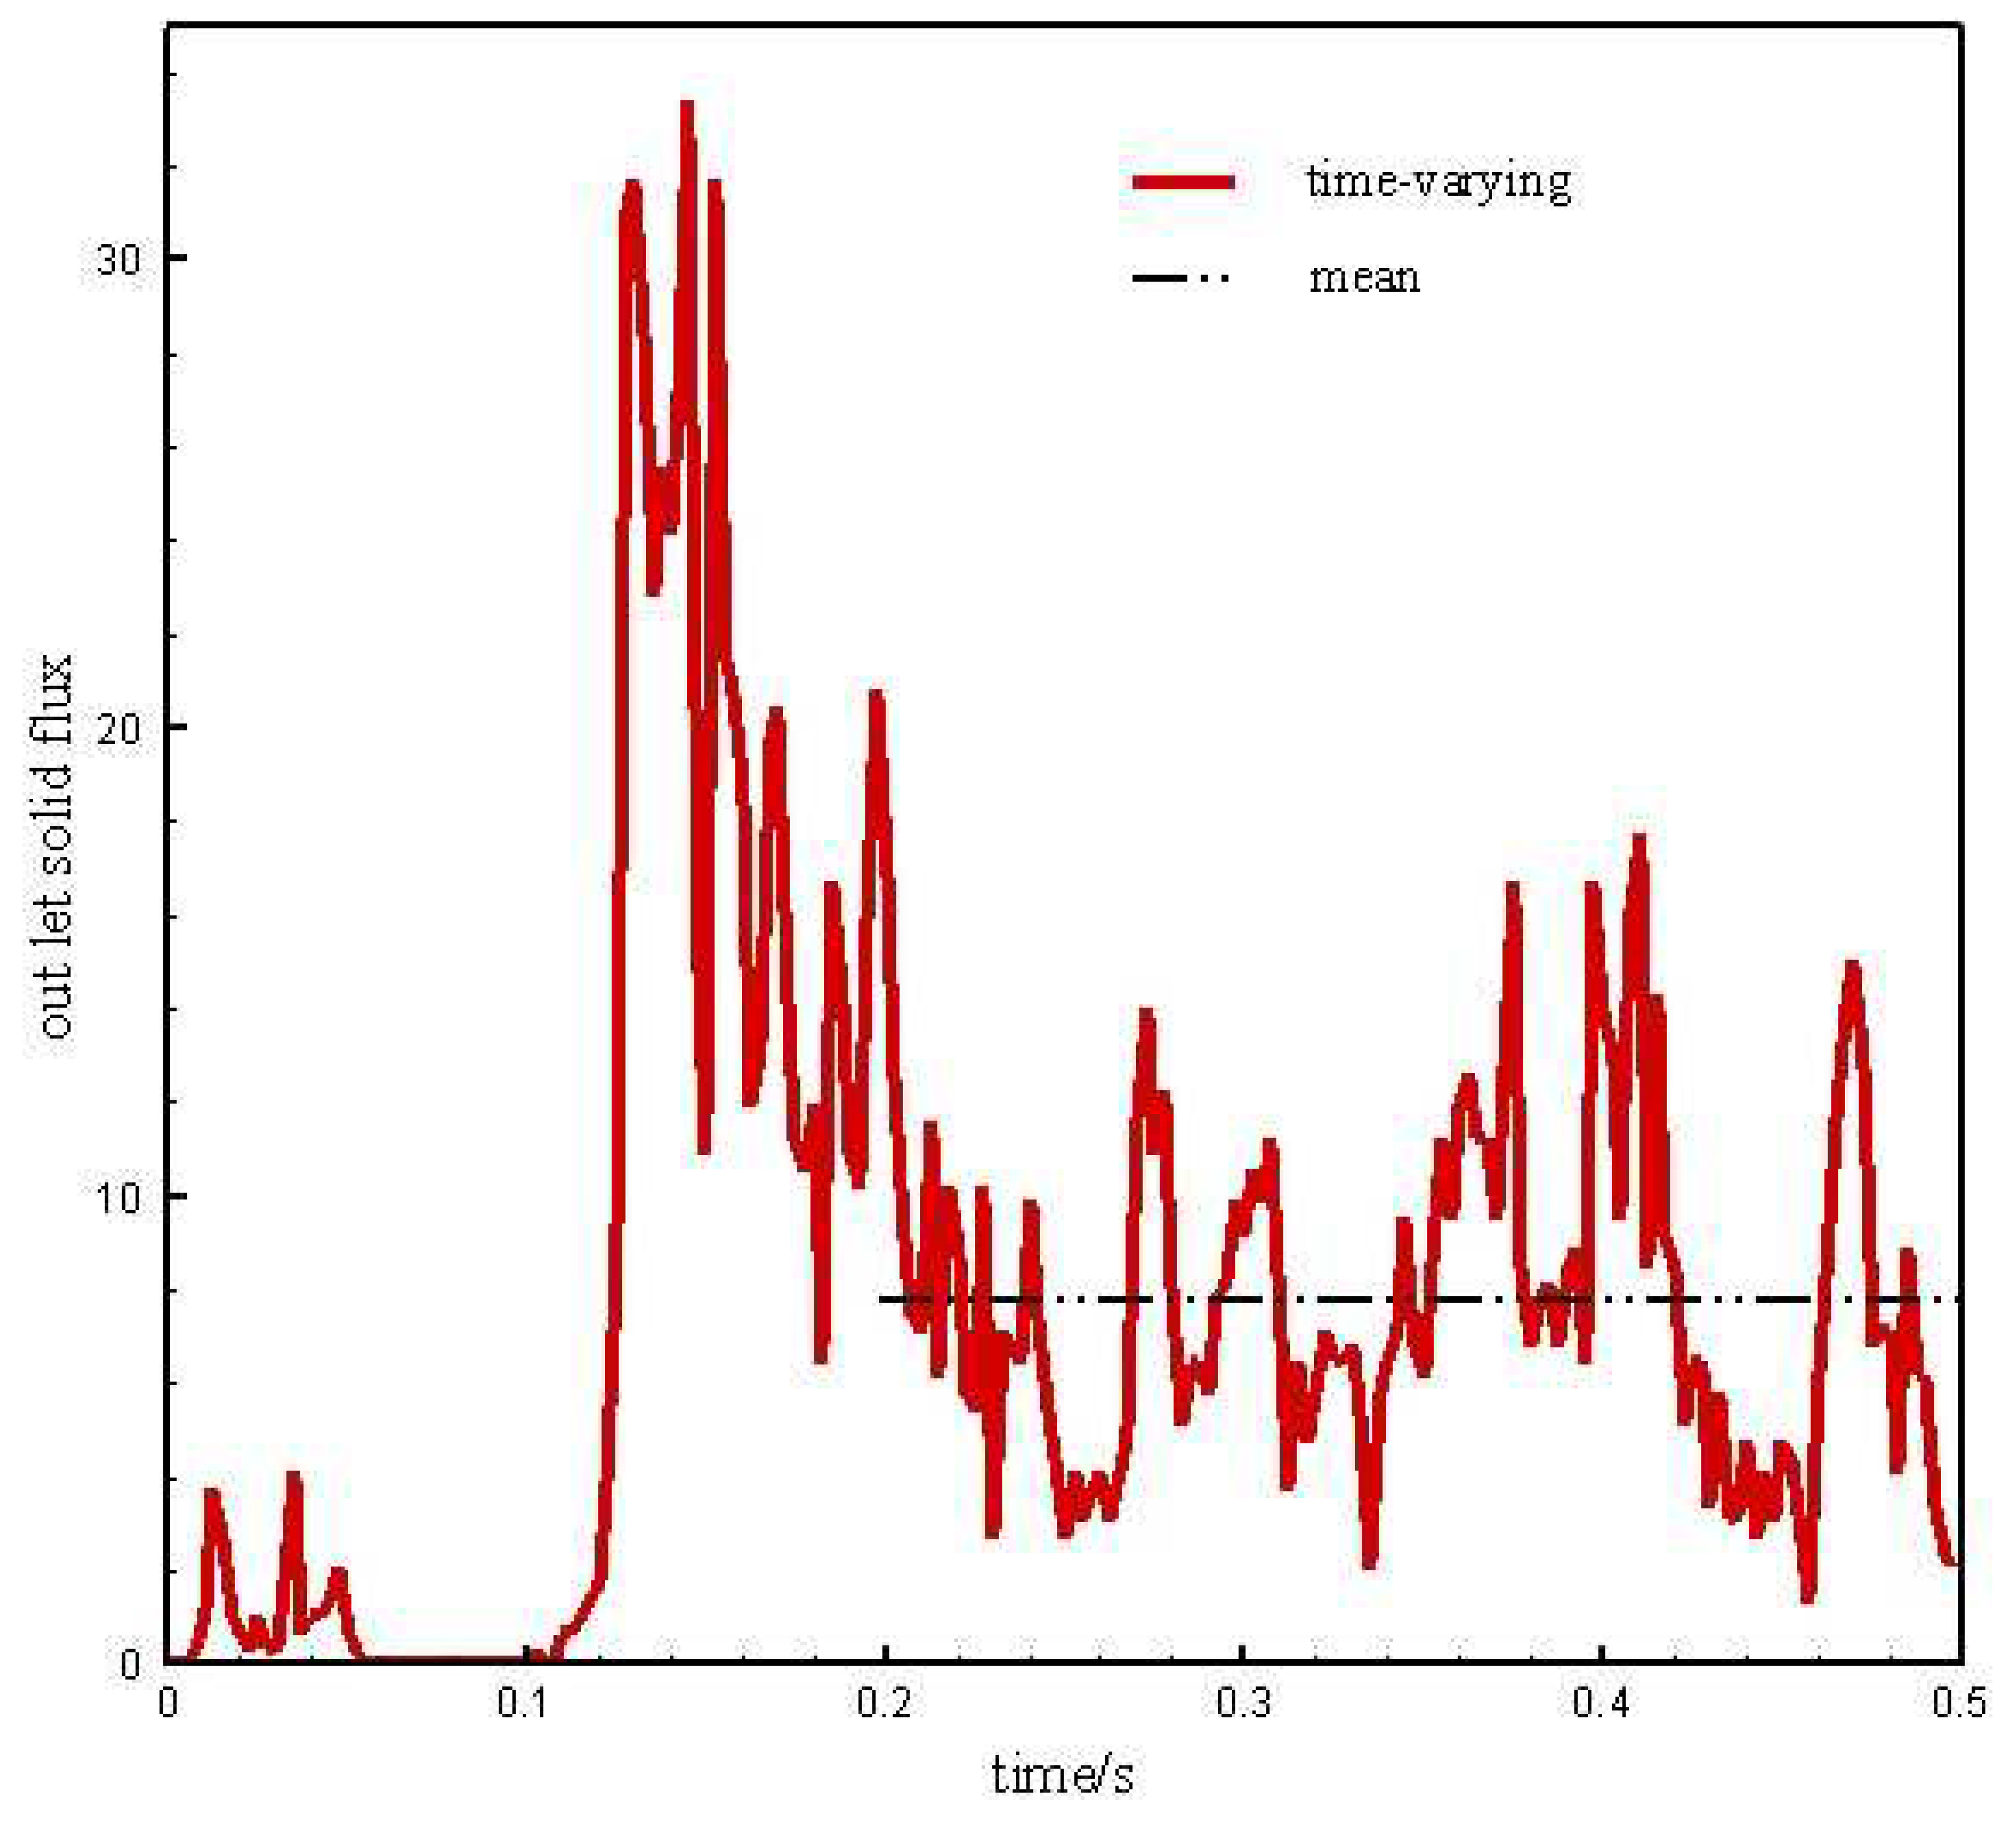
Figure 6.
Cross-sectional porosity at bottom and top.

Figure 7.
Axial distribution of cross-sectional porosity.
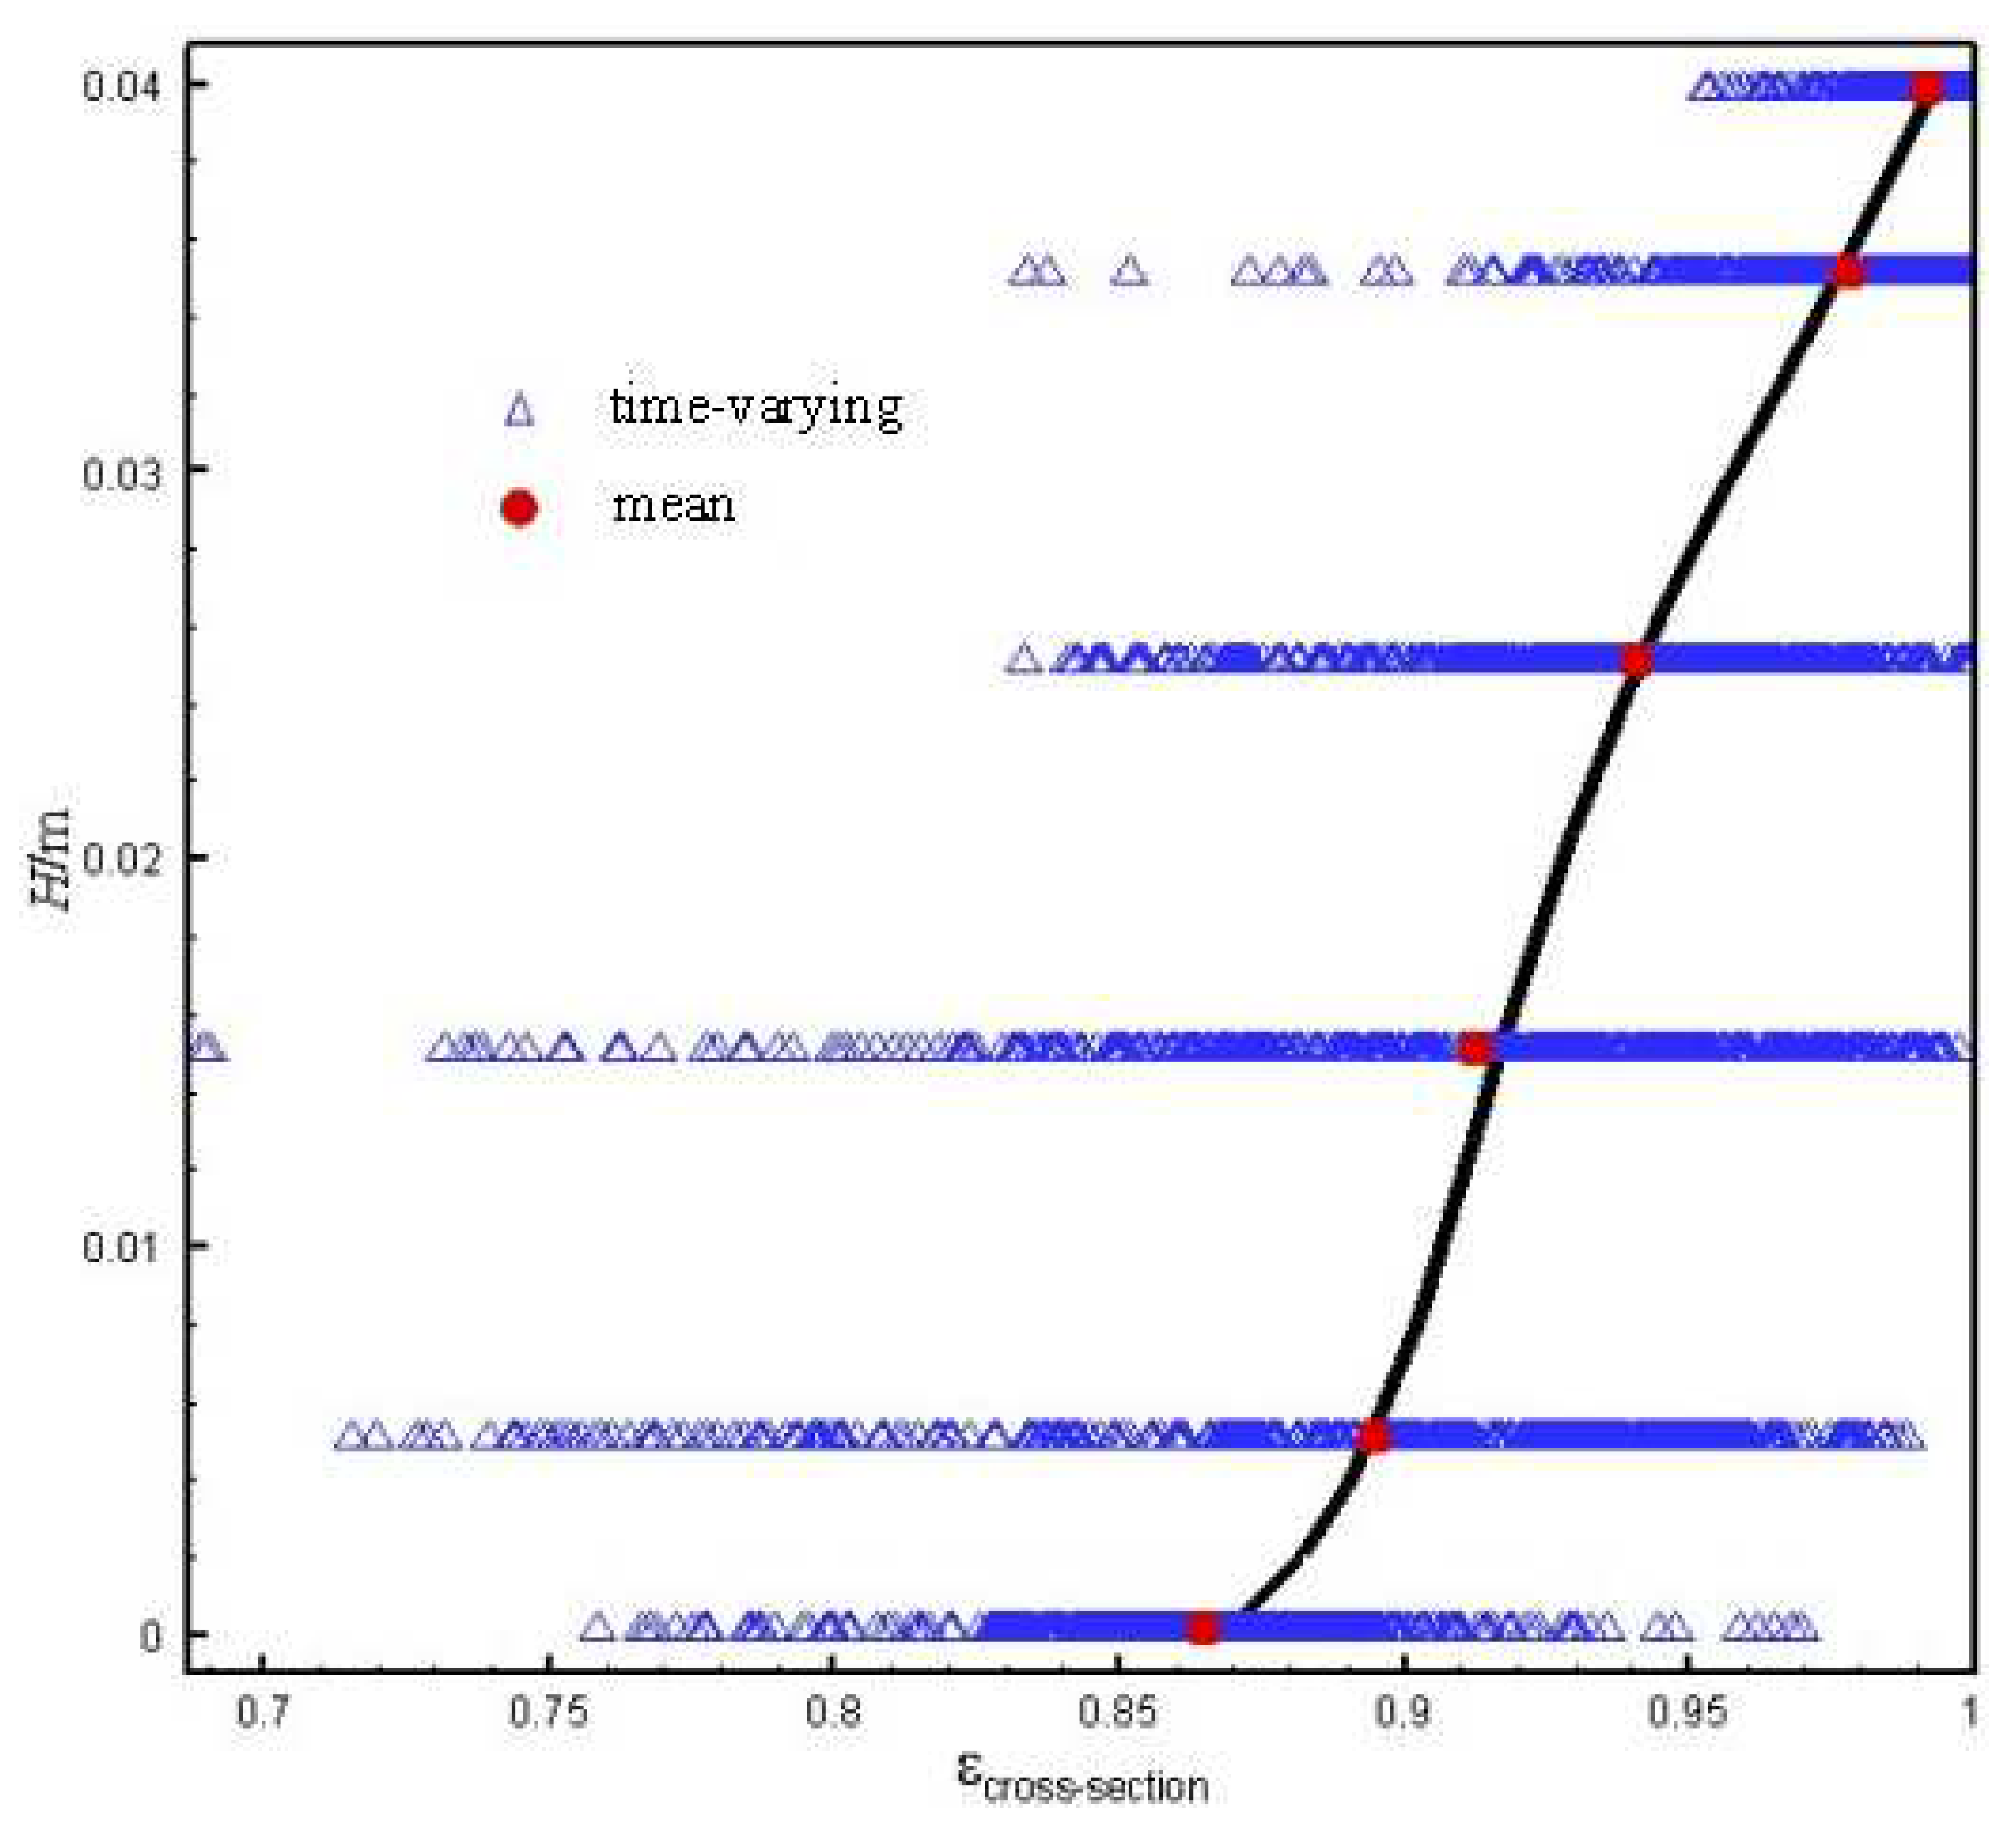
Figure 8.
Porosity at right side and central.
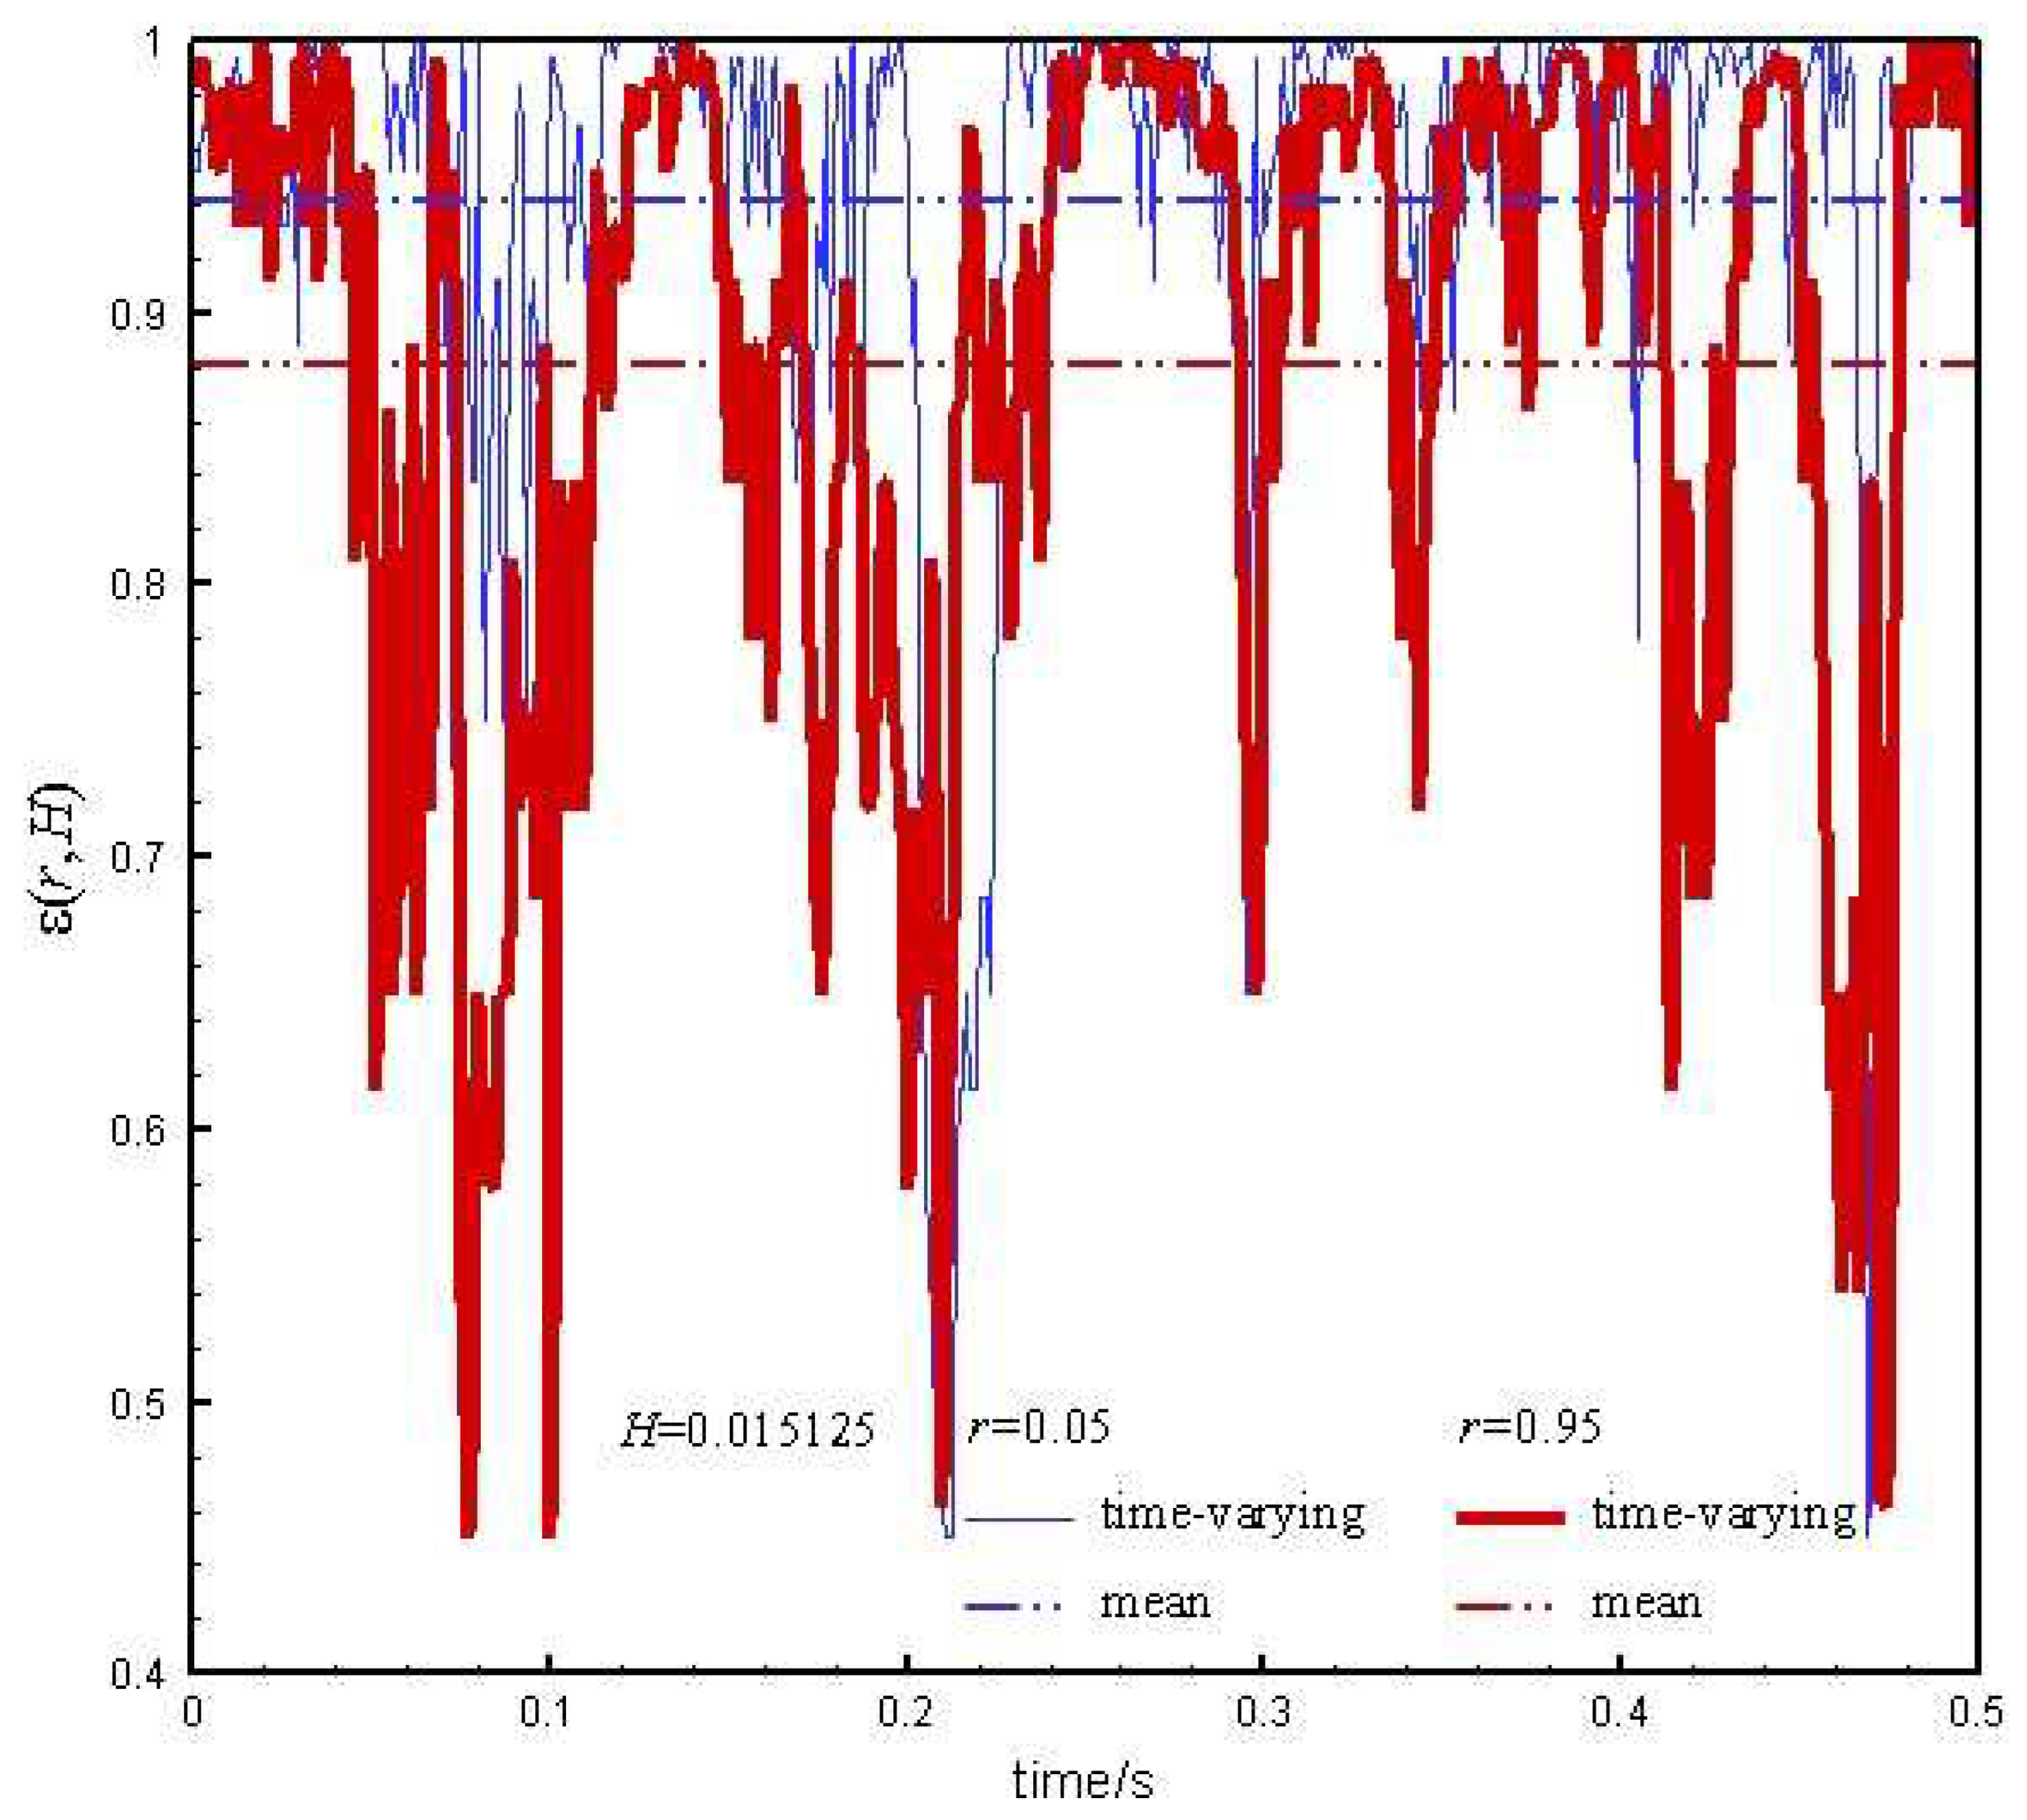
Figure 9.
Porosity at left side and central.
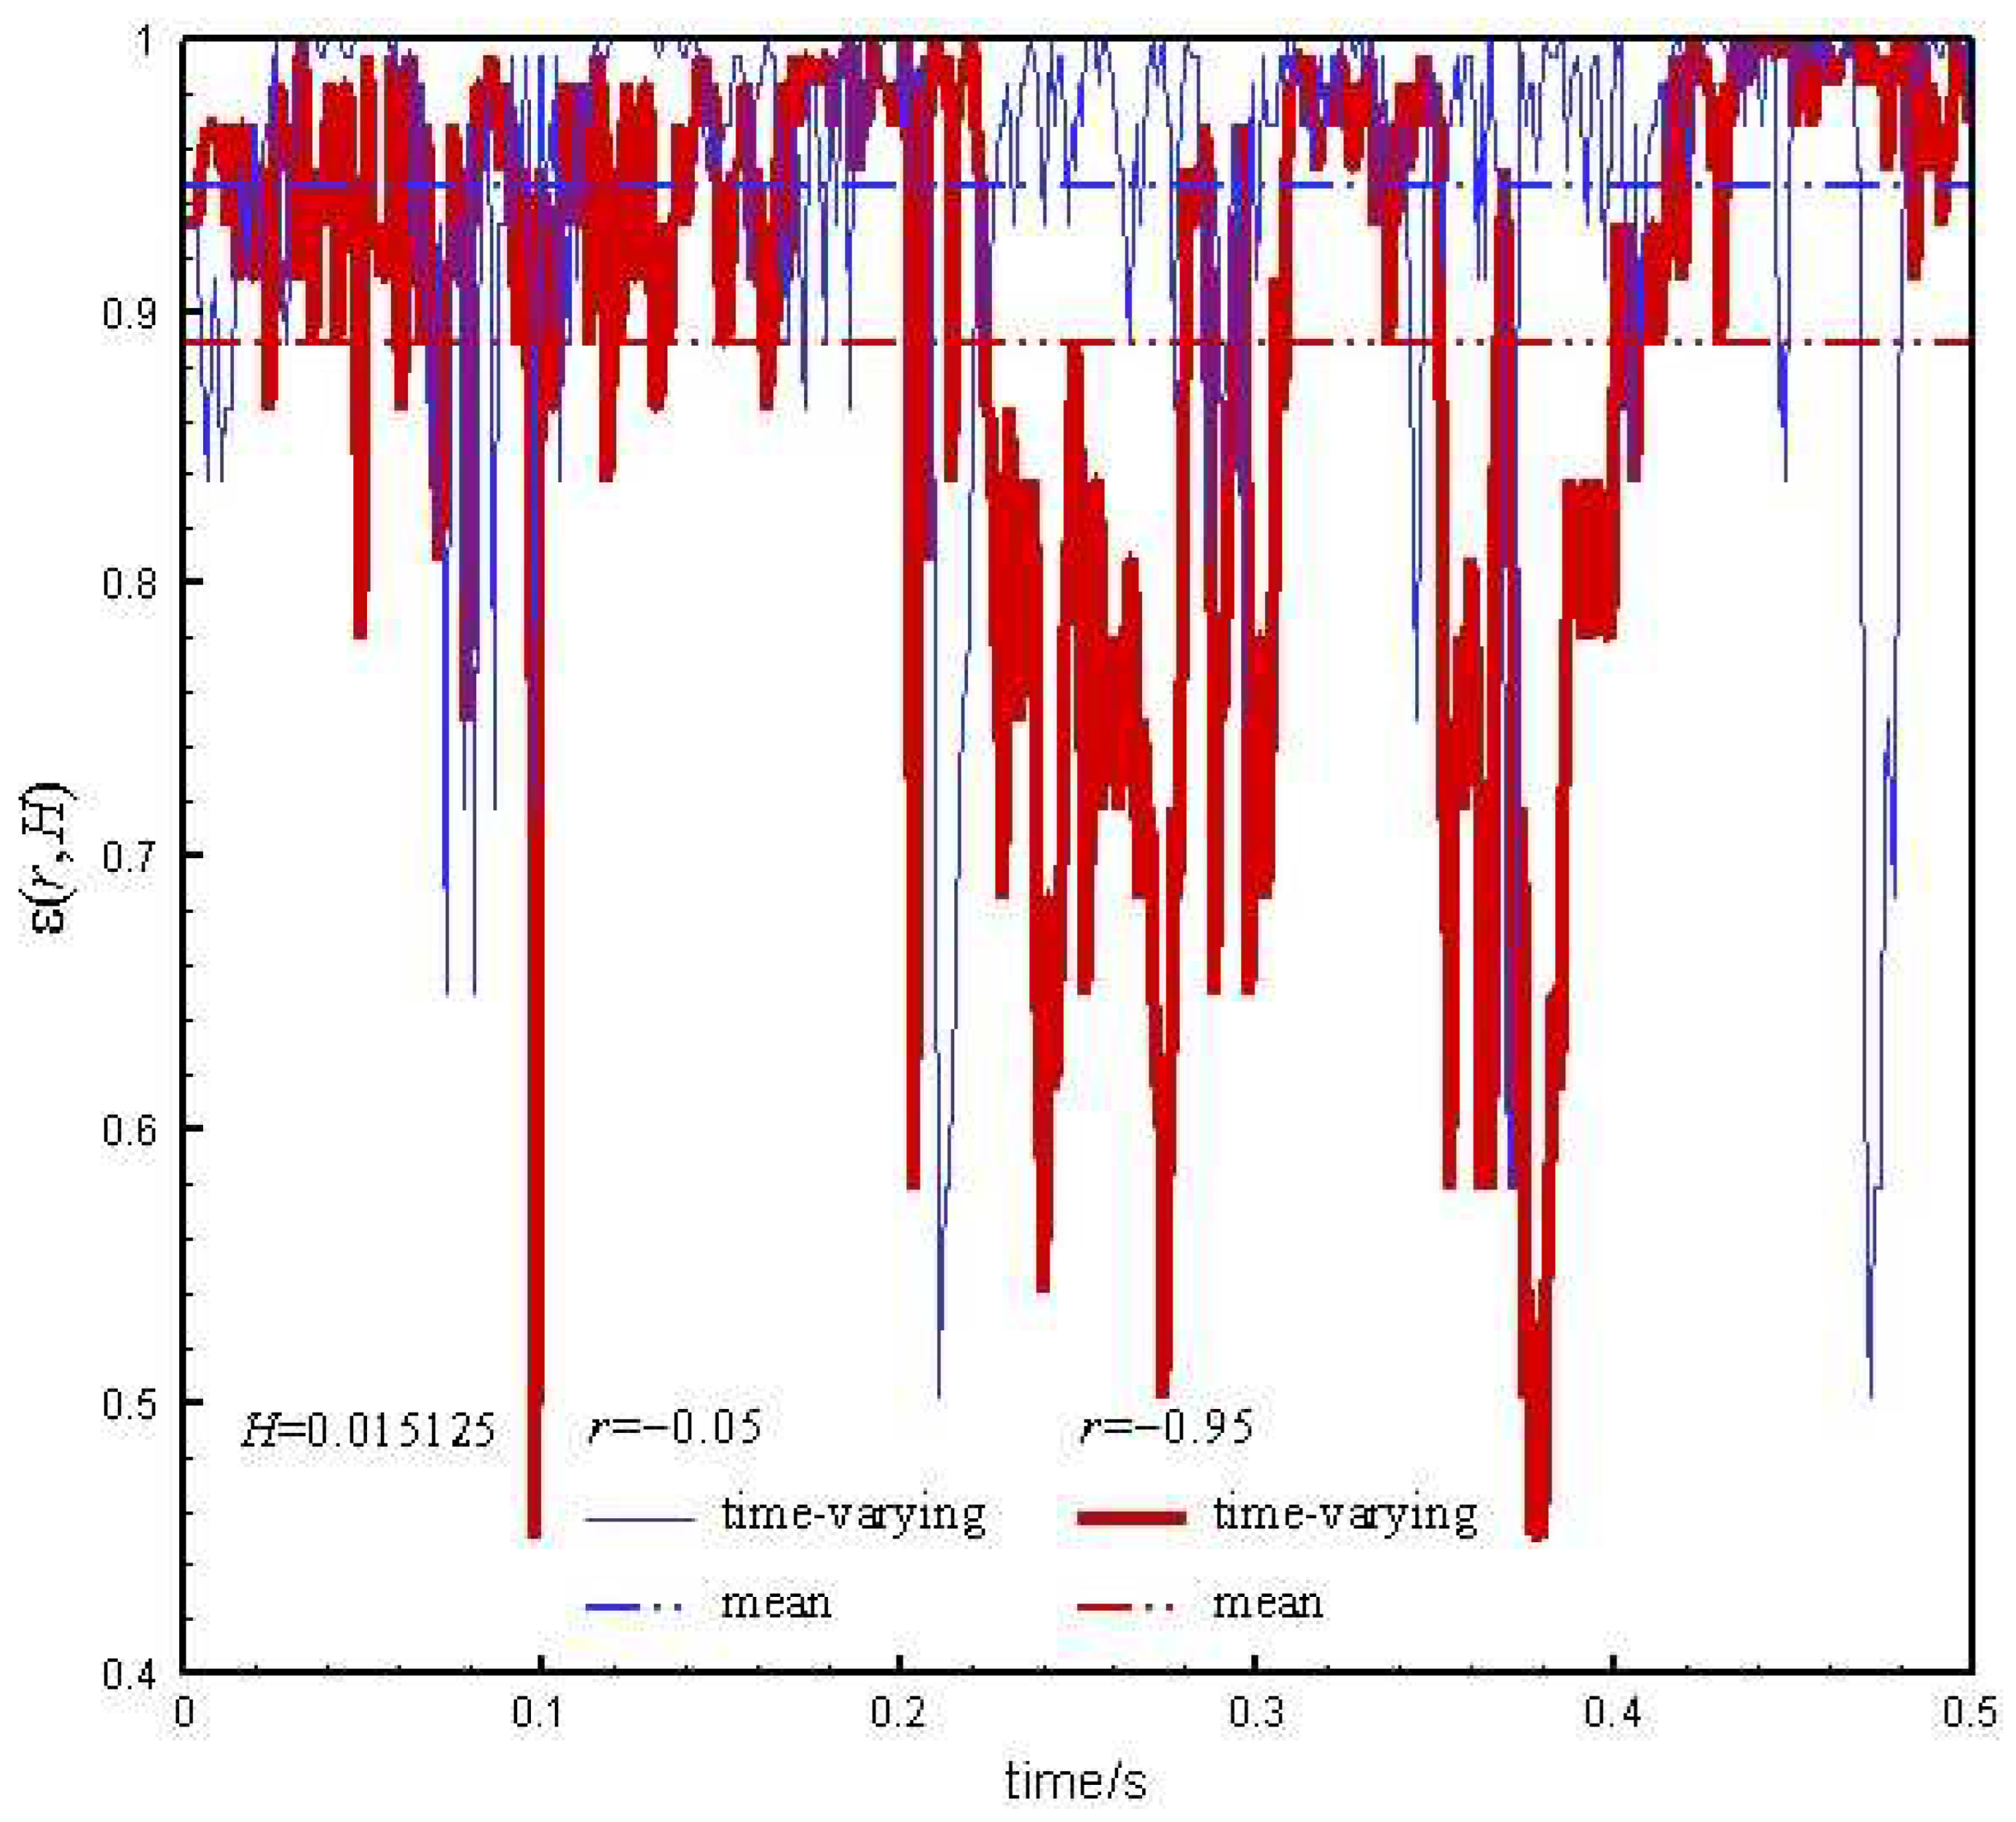
Figure 10.
Radial voidage distribution.
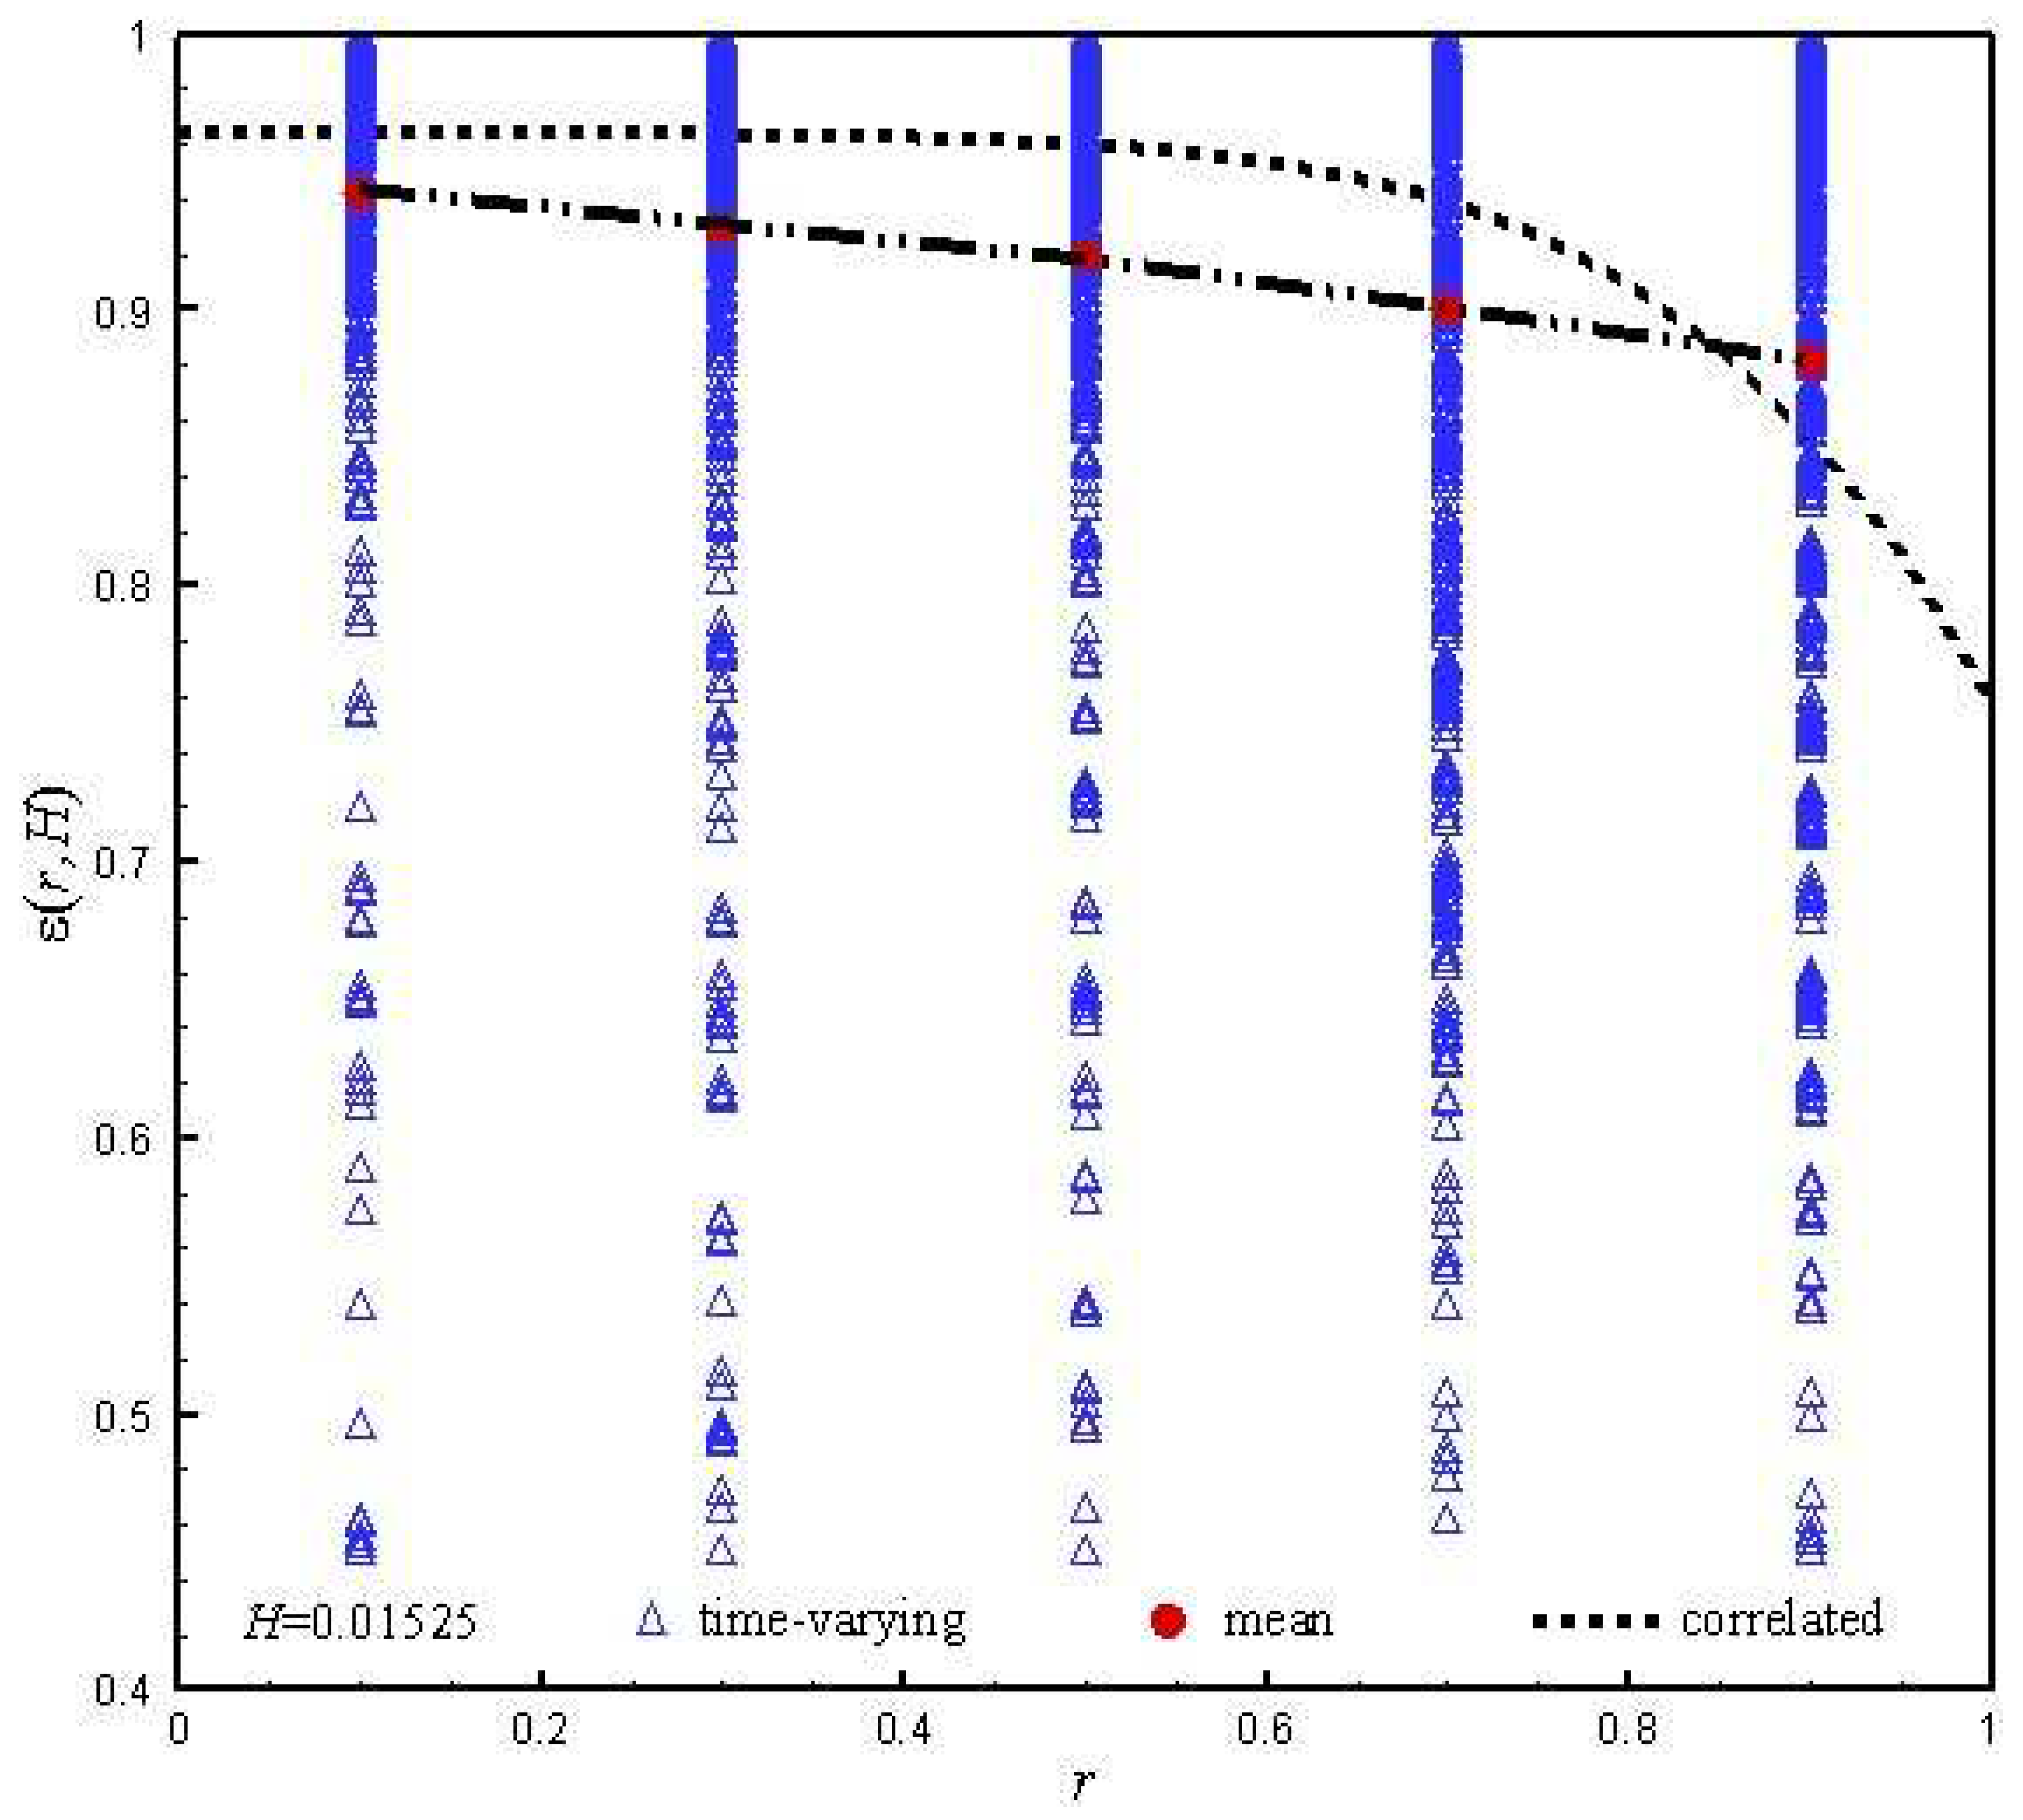

Table 1.
Fixed parameters for particle and gas.
| Particle | Gas |
|---|---|
| Density ρp= 930 kg·m−3 | Viscosity μg= 1.7 × 10⁻⁵N·s·m−2 |
| Particle diameter dp= 54 μm | Density ρg= 1.28 kg·m−3 |
| Porosity at minimum fluidization εmf= 0.45 | Inlet gas velocity u0= 1.7 m·s−1 |
| Stiffness Coef. ҝ =10 N·m−1 | CFD time step Δ tg= 2 × 10⁻⁶ s |
| Restitution Coef. ξ = 0.9 | |
| DEM time step Δ tp= 2.5 × 10⁻⁷ s |
Disclaimer/Publisher’s Note: The statements, opinions and data contained in all publications are solely those of the individual author(s) and contributor(s) and not of MDPI and/or the editor(s). MDPI and/or the editor(s) disclaim responsibility for any injury to people or property resulting from any ideas, methods, instructions or products referred to in the content. |
© 2023 by the authors. Licensee MDPI, Basel, Switzerland. This article is an open access article distributed under the terms and conditions of the Creative Commons Attribution (CC BY) license (http://creativecommons.org/licenses/by/4.0/).
Copyright: This open access article is published under a Creative Commons CC BY 4.0 license, which permit the free download, distribution, and reuse, provided that the author and preprint are cited in any reuse.


