
Submitted:
20 July 2023
Posted:
24 July 2023
You are already at the latest version
Abstract
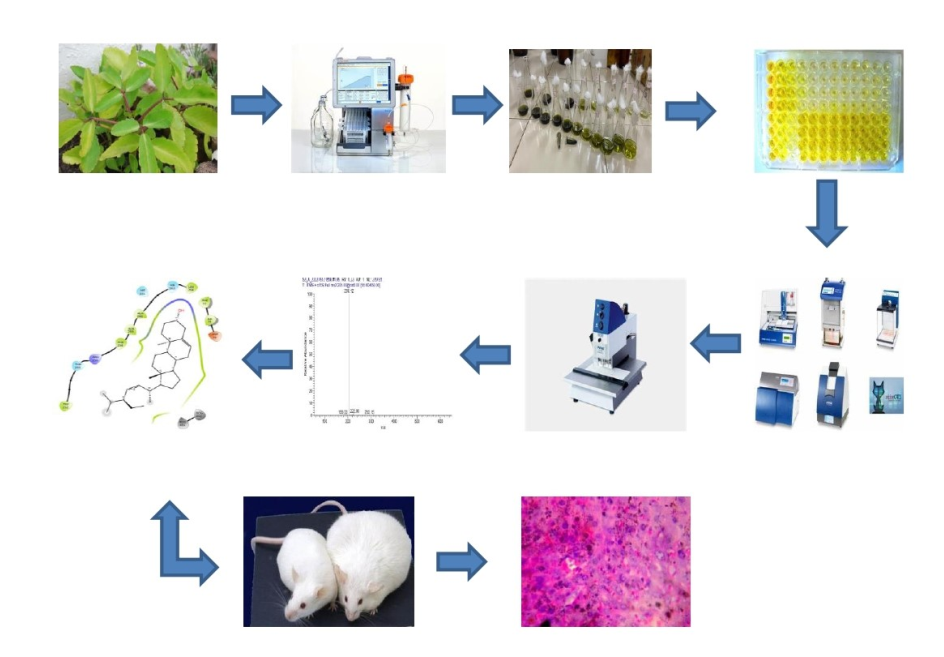
Bioactive fractions were isolated from the leaves extract of Kalanchoe pinnata and subjected to scrutiny for their prospective anti-obesity properties. An array of in vitro phytochemical, antioxidant, and enzyme inhibition assays were executed, which dis-cerned fractions F1 and F2 as the most effective fractions. These fractions were sub-sequently studied through in vivo experiments, affirming that F2 as the most potent fraction. Further characterization of F2 was conducted via HPTLC MS-MSn tech-niques. The outcomes demonstrated that F2 produced a notable anti-obesity effect in obese mice, reducing their body weight and lipid metrics, and leading to advanta-geous changes in their organs. An analytical examination of F2 revealed the existence of four principal compounds, which were subsequently subjected to in silco molecular docking and dynamic analysis, confirming their aptitude for binding to selected pro-teins. These findings imply that the utilization of Kalanchoe pinnata leaves could pro-vide a promising therapeutic strategy for the treatment of obesity.
Keywords:
anti‐obesity
; bio‐active fractions
; Kalanchoe pinnata
; HPTLC MS‐MSn
; in silico
; in vitro and in vivo studies
1. Introduction
The Ayurvedic herb Kalanchoe pinnata (Synonym- Bryophyllum pinnatum), also known as the life plant, magic leaf, and cathedral bells, is recognized for its wide range of therapeutic properties [1]. Natural resources, including medicinal plants, have gained increasing attention in healthcare as potential solutions for various ailments [2]. Phytotherapy, utilizing plant-based treatments, has shown promising outcomes in numerous diseases, contributing to its growing popularity [3].
Kalanchoe pinnata exhibits a wide range of pharmacological activities documented in scientific literature. It demonstrates potent anti-inflammatory properties by inhibiting inflammatory mediators and modulating key signaling pathways involved in the inflammatory response. It has also been established for its antioxidant, antileishmanial, hepatoprotective, nephroprotective, antimutagenic, antiulcer and antibacterial activities. Additionally, it shows promising analgesic and antinociceptive effects, potentially providing relief from pain and discomfort [4,5]
Within the context of the growing global predicament of obesity caused by factors such as excessive caloric intake and sedentary lifestyles, conventional interventions like anti-obesity pharmaceuticals face limitations and safety concerns [6]. Consequently, exploring natural compounds with potential anti-obesity effects becomes imperative. Kalanchoe pinnata, with its captivating attributes and untapped potential in combating obesity, presents a compelling avenue for investigation as it has not been studied for its anti-obesity potential till date.
Oxidative stress, closely linked to the development of ailments such as cancer, cardiovascular disease, and neurological disorders, can be mitigated through the deployment of antioxidant defense mechanisms encompassing both enzymatic and non-enzymatic antioxidants. Furthermore, the association between utilizing antioxidative traits derived from natural sources and the prevention of non-communicable diseases, including diabetes and obesity, has spurred interest in herbal medicines as potential therapeutics [7,8,9,10]
Given the existing evidence on phytochemicals, it is imperative to explore the potential of Kalanchoe pinnata in combating obesity, an underexplored area of research. To address the gaps in this field, a hypothesis was formulated prior to the study’s design, aiming to explore all possible avenues. An optimized method of extraction and isolation was developed, followed by the selection of a potent fraction through a series of in vitro investigations, which will be further examined through in vivo experiments. Additionally, the most potent fraction will be identified and characterized using HPTLC MS/MS analysis, and the identified compounds will undergo in silico testing via molecular docking with specific proteins [11,12].
2. Results and Discussion
2.1. Bioactive Guided Fractionation and Their TLC Analysis
A total of eight bioactive fractions were obtained through flash chromatography, meticulously designated as fraction F1 to F8, which underwent subsequent rigorous examination via TLC analysis for further in-vitro investigations. The optimal solvent composition of a 6:4 ratio of toluene and ethyl acetate was precisely determined to yield optimal results in the TLC experiments. Notably, among the eight fractions, namely F1, F2, F3, and F4, a pronounced and distinct separation of compounds was prominently observed, underscoring their potential. Conversely, fractions F5, F6, F7, and F8 exhibited minimal to negligible separation of compounds. Based on the discernible separation of compounds, fractions F1-F4 were meticulously selected for subsequent in-vitro studies, recognizing their promise for further exploration and evaluation.
2.2. Phytochemical Assessment
In order to determine quantitative analysis of the fractions, three parameters namely total steroidal content, total phenolic content and total flavonoid content were used. Quantitative content values were determined individually for each fraction. Specifically, fractions F1, F2, F3, and F4 evinced flavonoid content of 78.79, 59.74, 31.68, and 39.71 QE mg/gm, respectively. Notably, the total phenolic content of fractions F1, F2, F3, and F4 was observed to be 61.58, 49.08, 18.21, and 11.28 GAE mg/gm, correspondingly. Additionally, the total steroidal content of fractions F1, F2, F3, and F4 was discerned to be 78.21, 59.27, 27.37, and 28.89 BSE mg/gm, respectively.
2.3. Antioxidant Assays
Different bioactive fractions derived from Kalanchoe pinnata leaves extract were assessed for their antioxidant activity using DPPH, nitric oxide, hydrogen peroxide, and ABTS assays to calculate their IC50 values. The results demonstrated that fractions F1 and F2 exhibited the most potent scavenging activity in all the assays. Specifically, the ABTS assay revealed that fraction F1 had an IC50 value of 1.41±0.25 µg/ml, while fraction F2 had an IC50value of 1.11±0.26 µg/ml, which were significantly more potent than fractions F3 and F4. Similarly, in the Nitric oxide assay, fractions F1 and F2 showed the significant scavenging activity, with IC50 values of 1.47±0.21 and 1.38±0.03 µg/ml, respectively, compared to fractions F3 and F4 with IC50 values of 3.08±0.28 and 2.58±0.25 µg/ml. Additionally, fractions F1 and F2 exhibited the most potent scavenging activity in the Hydrogen peroxide assay with IC50 values of 1.61±0.25 and 1.37±0.23 µg/ml, respectively, compared to the other fractions. Similarly, in the DPPH scavenging assay, fractions F1 and F2 demonstrated the potent scavenging activity, with IC50 values of 1.17±0.08 and 1.84±0.05 µg/ml, respectively, compared to fractions F3 and F4 (shown in Table 1). In summary, the results indicate that fractions F1 and F2 possess remarkable antioxidant properties and exhibit potent scavenging activity in all assays. These findings suggest the potential use of Kalanchoe pinnata leaves extract fractions as natural antioxidants to combat obesity.
2.4. Enzyme Inhibition Assay
The enzymatic properties of four fractions (F1, F2, F3, and F4) of Kalanchoe pinnata leaf extracts were studied to evaluate their enzyme inhibition activity using pancreatic lipase, alpha amylase, and glucosidase assays. The results of the experiments demonstrated that F1 and F2 exhibited the most potent enzyme inhibition activity compared to fraction F3 and F4. Notably, F1 and F2 demonstrated remarkable enzyme inhibition activity in the pancreatic lipase assay, with IC50 values of 2.20±0.23 and 1.23±0.08 µg/ml, respectively compared to F3 and F4 with IC50 values of 4.07±0.28 and 2.12±0.17 µg/ml, respectively. Furthermore, F1 and F2 demonstrated significant activity in the alpha amylase assay, with IC50 values of 1.24±0.03 and 1.87±0.02 µg/ml, respectively, while F3 and F4 exhibited lower activity. The glucosidase assay produced similar results, with F1 and F2 demonstrating potent enzyme inhibition activity with IC50values of 1.12±0.25 and 1.17±0.37 µg/ml, respectively. These observations suggest that the F1 and F2 fractions of Kalanchoe pinnata leaf extracts possess potent enzyme inhibition abilities and have the potential to be developed into therapeutic agents for metabolic disorders (as shown in Table 2).
2.5. Effect of Potent Bioactive Fractions on Body Weight
In the course of the study, it was observed that the corpulent mice exhibited a noteworthy augmentation in their body mass in contrast to the normal mice. However, selected optimized fraction of Kalanchoe pinnata was administered at a dosage of 80 mg/kg, denoted as F1 and F2, respectively. The treatment with F1 and F2 fractions resulted in a marked mitigation of the escalating body weight, as compared to the control group. Interestingly, the fraction F2 demonstrated a more pronounced effect, displaying a significant decrease in the weight gain when compared to fraction F1, as illustrated in Table 3. This finding highlights the potential of selected fractions in tackling obesity-related concerns.
2.6. Effect of Potent Bioactive Fractions Waist-Hip Ratio
Throughout the course of the experiment, there was a remarkable enhancement in the Waist Hip Ratio (WHR) across all treatment groups. Interestingly, a notable escalation in WHR was observed in obese mice when compared to their normal counterparts. However, the administration of selected fractions (F1 & F2) at a dosage of 80 mg/kg proved to be immensely effective in reducing WHR in comparison to the control group. In fact, the outcome was found to be similar to orlistat, a widely used standard drug. These findings are of immense significance as they demonstrate the therapeutic potential of Kalanchoe pinnata fractions in the management of obesity (Table 4).
2.7. Effect of Potent Bioactive Fractions on Biochemical Parameters
The study evaluated the impact of different fractions on various biochemical parameters in obese mice. The findings indicate that all treated groups exhibited significant reductions in total cholesterol, triglycerides, low-density lipoprotein (LDL), and very-low-density lipoprotein (VLDL) levels when compared to the obese control group.
Furthermore, the results of the overall biochemical analysis revealed that fraction F2 demonstrated the most potent activity as compared to fraction F1. It is worth noting that the specific compositions of these fractions were not disclosed and the precise mode of action that led to the observed effects remains unclear. Nonetheless, the findings suggest that Fraction F2 may have therapeutic potential in the management of obesity-related metabolic disorders.
This study demonstrates that the assessed fractions exerted beneficial effects on several biochemical parameters in obese mice, including reduced total cholesterol, triglycerides, LDL and VLDL levels. Additionally, the findings highlight the most potent activity of fraction F2 in comparison to fraction F1, indicating a potential avenue for further research and development of new therapeutic agents (as shown in Table 5).
2.8. Histopathological Analysis
A meticulous histopathological examination was conducted to scrutinize plausible modifications and perturbations in the adipose tissue, liver, and kidney of different groups of animals. Examination of liver histology in the normal control group revealed a typical architectural composition and thriving hepatocytes, whereas the obese group evinced a profound state of steatosis characterized by an increased quantity of lipid droplets. Analysis of liver sections from mice treated with the conventional therapeutic drug (orlistat) demonstrated a reduction in the incidence of normative liver steatosis, ascertained by a decline in the count of lipid droplets (Figure 1c). Upon comparison with the obese control group (Figure 1b), the bioactive fractions (F1 and F2) were shown to exert a substantial effect on liver steatosis leading to a diminished number of lipid droplets, as explicitly depicted in (Figure 1d,e). Adipose tissue histology showed that the obese control group had an accumulation of enlarged adipocytes (Figure 2b). However, enlarged adipocytes were reduced and almost restored to normal in the standard and F2 treatment groups, as shown in (Figure 2e). The bioactive fractions treated group F1 also showed smaller adipocytes than the obese group (Figure 2d). The kidney tissue’s histology of mice in the normal group showed normal and healthy glomeruli, proximal and distal tubules (Figure 3a), whereas the MSG- HFD (Monosodium glutamate- High fat diet) treated group showed distorted proximal and distal tubules along with shrunk glomeruli, as shown in (Figure 3b). The test (Figure 3c) and fraction F2-treated groups (Figure 3e) had more repaired and healthy glomeruli and healthy proximal and distal tubules compared to obese treated group.
The overall investigation demonstrated that standard and fraction F2 and F1 treatment had a better effect on repairing liver, kidney, and adipose tissue. Fraction F1 also demonstrated a better effect than the obese control group, but the most potent activity was observed in the fraction F2-treated group.
2.9. HPTLC and HPTLC-ESI MS/MSn (Retro Diels-Alder Fragmentation)
The cutting-edge CAMAG TLC Visualizers 2 have proven to be a valuable tool in separating and analyzing compounds based on their Rf values. In this study, four compounds in the most potent fraction F2 were separated and further examined using mass spectroscopy. Through careful analysis of the resulting data, four of these compounds were tentatively identified as Quercetin (found m/z- 301, Rf- 0.24 and abundance -38.59), Stigmasterol (found m/z- 395, Rf-0.58 and abundance- 19.21), Sitosterol (found m/z-397, Rf- 0.71 and abundance- 12.21), and Thiamine (found m/z-266, Rf- 0.39 and abundance- 27.48), which were confirmed through retro Diels-Alder fragmentation data as shown in Figure 4 and Table 6. However, these compounds have already been established earlier. These findings were further validated by cross-referencing the obtained spectral data with Chemspider, a trusted reference source from the royal society of chemistry. The retro Diels-Alder fragmentation data and their corresponding peaks have been conveniently compiled and provided as Supplementary Files (Figures S1–S4).
2.10. Insilco Molecular Docking Analysis
All the ligands under study displayed good binding affinities with all the proteins under study. The detailed binding affinities and the interactions have been presented in Table 7.
2.10.1. Interaction Analysis of the Ligands in the Active Site of Protein 1LPB
The identified compounds β-sitosterol, stigmasterol, quercetin and Thiamine were docked with pancreatic lipase (PDB ID- 1LPB). The result section of the study discusses the crucial role of various amino acid residues in the efficient catalysis of human pancreatic lipase. Asp79 and Phe77 were found to play a critical role in stabilizing the oxyanion hole and orienting the substrate within the active site, respectively, through hydrogen bonding interactions. Meanwhile, hydrophobic residues, including Ala260, Ala259, Phe258, Leu264, Trp252, and Ile78, were found to create a hydrophobic environment within the active site, stabilizing the substrate and oxyanion intermediate during catalysis. The hydrophobic residues were also found to anchor the hydrophobic tails of the triglyceride substrate and stabilize the oxyanion intermediate during catalysis. These findings shed light on the complex molecular interactions that occur within the active site of human pancreatic lipase and provide a deeper understanding of the mechanisms behind lipid digestion and metabolism. The three-dimensional image of the highest-ranked molecule for this protein has been presented in Figure 5.
2.10.2. Interaction Analysis of the Ligands in the Active Site of Protein 4W93
The identified compounds β-sitosterol, stigmasterol, quercetin and Thiamine were docked with alpha amylase (PDB ID- 4W93). The active site pocket of the carbonic anhydrase enzyme contains several residues, including rp59, Asp197, His201, Ile235, Glu233, and Asp197, that form hydrogen bonds with ligands, playing important roles in substrate or inhibitor binding and catalysis. Asp197 is particularly important in forming hydrogen bonds with the ligand, as it is often conserved in the active site of carbonic anhydrase enzymes and helps to orient the ligand in the correct conformation for catalysis. His201 and Ile235 also participate in hydrogen bonding interactions and stabilize the ligand within the active site. Trp59 and other hydrophobic residues anchor the ligand within the active site, while Glu233 acts as a proton acceptor in catalysis. These hydrogen bonding interactions are critical in stabilizing the ligand-enzyme complex and ensuring proper orientation and positioning of the ligand for efficient catalysis or inhibition. The three-dimensional image of the highest-ranked molecule for this protein has been presented in Figure 5.
2.10.3. Interaction Analysis of the Ligands in the Active Site of Protein 7K9N
The identified compounds β-sitosterol, stigmasterol, quercetin and Thiamine were docked with co-crystal structure of alpha glucosidase (PDB ID- 7K9N) which binds to the active site of the protein and forms several hydrogen bonds with specific amino acid residues, including Asp640, His700, and Asp427. These hydrogen bonding interactions are critical in stabilizing the ligand-protein complex and determining the specificity and affinity of the interaction. Asp640, His700, and Asp427 are conserved residues that play essential roles in coordinating the binding of the ligand, positioning it for catalysis, and facilitating the enzymatic activity of PP1. Hydrophobic residues, such as Pro469, Leu701, Trp525, Trp423, Phe360, Phe673, Phe674, Ala429, Phe468, Trp562, Trp637, Ile452, Met565, Phe307, Phe571, Tyr675, Tyr676, and Val687, also play crucial roles in substrate binding, catalysis, and protein stability in the protein with PDB 7K9N. Overall, the hydrogen bonding interactions and hydrophobic residues in the active site of PP1 are essential for the enzymatic function of PP1. The three-dimensional image of the highest-ranked molecule for this protein has been presented in Figure 5.
2.10.4. Molecular Dynamics Simulations Analysis
Molecular dynamics simulations were conducted for three protein-ligand complexes: Quercetin bound to pancreatic lipase (complex a), Quercetin bound to Human pancreatic alpha-amylase (complex b), and Thiamine bound to alpha glucosidase (complex c). The Root Mean Square Deviation (RMSD) was used to assess ligand binding to the active site. The RMSD analysis indicated stable complexes, with acceptable fluctuations within the range of 1-3Å for all the protein-ligand systems. Complex a showed significant RMSD values of 1.8Å-3.5Å, while complexes b and c exhibited values ranging from 1.0Å to 1.6Å (Figure 6). RMSF analysis revealed minor fluctuations throughout the simulation, with green bars indicating protein residues involved in ligand interactions (Figure 7). Hydrogen bond interactions were most prominent in complex b, with a higher number of H-bonds established compared to complexes a and c. The simulations demonstrated hydrophobic contacts, ionic interactions, and water-mediated linkages in all complexes, suggesting their stability (Figure 8). The protein-ligand contacts timeline representation illustrated increased interactions between the ligands and proteins (Figure 9). All the PLCs revealed good ligand atomic interactions (Figure 10).
3. Experimental
3.1. Collection of Plant materials
During the middle of August 2022, fresh leaves of Kalanchoe pinnata were collected from the medicinal garden of Birla Institute of Technology Mesra Ranchi, India, and identified by the Central National Herbarium at Kolkata, Howrah, India (Ministry of Environment, Govt. of India) with reference number CNH/Tech.II/2022/14b.
3.2. Preparation of the Extract
The leaves were kept in the sunlight for a period of 20 days prior to being crushed into coarse powder to be used for further extraction. As a starting material, 5 kg of crushed leaves powder was placed in a flask with a mixture of methanol, water, and formic acid in the ratio of 90:9:1 as a solvent for the extraction process by cold maceration method. In the incubator shaker, the flask containing the solvent extract mixture was kept for 72 hours while it was being mechanically shaken properly. A Whattman filter paper was used to filter the extracts and the filtrate was then evaporated at 40° C by a Rota evaporator [13]. By using the separation method, fats, lipids, proteins, and other unwanted materials were removed from the filtrated extract using hexane and pet-ether solvents. It was then lyophilized at -56° C and final powdered extract was collected and stored in the refrigerator at -4° C for further experimental studies [14].
3.3. Preparation of the Bioactive Guided Fractions
In order to isolate bioactive fractions, 5gm of the leaves extract were subjected to pre packed silica column of flash chromatography (Agela Technologies). At a pressure of 200 psi, flow rate of 10 ml/min, the fractions were collected 30 ml per tube. For further study, eight bioactive fractions were isolated which were re-evaporated, lyophilized and stored at - 4° C [15,16].
3.4. TLC Analysis
A TLC analysis was performed on collected bioactive fractions of K. Pinnata. Different solvent mixtures were used to select the optimal separation of compounds from the isolated fractions on the TLC plate.
3.5. In-Vitro Phytochemical Assessment
3.5.1. Total Phenolic Content
The total phenolic content of the fractions was determined using the highly sensitive Folin-Ciocalteu assay which is based on electron transfer and measures the reducing capacity of the fractions [17]. The choice of solvent for extraction plays a crucial role in the yield produced and the amount of phenol in plant extracts. To calibrate the assay, gallic acid was used as an external standard at different concentrations ranging from 0.05 to 1 mM. The experimental procedure involved mixing 200 mL of the fraction with 2.0 mL of Solution A (2% Na2CO3, 0.1 mL CuSO4, and 0.1 mL sodium and potassium tartrate), followed by the addition of 0.4 mL of 0.5 M sodium hydroxide four minutes later. After 10 minutes, the Folin-Ciocalteu reagent (diluted 1:1 v/v with water) was added. The solution was left to stand for 30 minutes before measuring its absorbance using a UV-VIS spectrophotometer at 750 nm. By using the gallic acid calibration curve, we calculated the total phenolic content as mM gallic acid equivalent (mM GAE).
3.5.2. Total Flavonoid Content
Using the aluminum chloride colorimetric method, the total flavonoid content of fractions was determined as described in Shraim. et al 2021 [17]. The different fractions of crude extract (3 mg/mL) were diluted to 1 mL with methanol, followed by adding 4 mL of distilled water and 0.3 mL with 5% NaNO2 solution. Further 0.3 mL of 10% AlCl3 was added after 5 minutes, and the mixture was allowed to stand for 6 minutes. Afterward, 2 mL of 1 mol/L NaOH solution were added, and distilled water was mixed to attain the final volume of the mixture to 10 ml. Afterward, the mixture was kept for 15 minutes, and at 510 nm absorbance was measured using UV Spectrometer.
3.5.3. Total Steroidal Content
For the total steroidal content assay, Ferric chloride colorimetric method was used Jaradat et al. 2015 [18]. 2ml of sulphuric acid (4N) and 2ml ferric chloride (0.5%) were mixed with 10 mg of each fraction. After that, 0.5 ml of the sample was mixed with 0.5 ml of potassium hexacyanoferrate (0.5% w/v) and heated for 30 minutes in a water bath (70° C) the sample’s absorbance was measured at 780 nm using a UV Spectrophotometer.
3.6. Invitro Antioxidant Assay
3.6.1. Trolox Equivalent Antioxidant Capacity Assay (ABTS)
An ABTS assay was used to measure the relative antioxidant capacity using the method of (Chaves et al. 2020) [19] for scavenging ABTS produced in the aqueous sample. According to the method, 7 mM of ABTS was prepared and mixed with 2.45 mM of potassium persulfate. The samples were kept at room temperature for 12-16 hours. In order to maintain a consistent volume for the sample, methanol was added to the sample to bring it to 10 ml. The fractions were diluted individually in 4 ml of ABTS sample and different concentrations were made (100, 250, and 500 μg/ml). 250 µl from each concentration were loaded into a micro plate and allowed to incubate at 40° C for 30 minutes, finally the absorbance was measured at 734 nm using micro plate reader.
3.6.2. Nitric Oxide Radical Scavenging Assay
This study utilized the Nitric oxide radical scavenging assay method for determining the quantitative levels of nitrate and nitrite in aqueous test samples as described by Hazra et al. 2008 [20]. As part of the experiment, sodium nitroprusside (10 mM) was mixed with different concentrations of 100, 250, and 500 µg/ml of individual fractions and incubated at 40° C for 150 minutes, followed by the addition of Griess reagent. At the end of the experiment, an absorbance measurement at 546nm with a micro plate reader was performed.
3.6.3. Hydrogen Peroxide Assay
According to Ozyurek et al. 2008 [21], the hydrogen peroxide scavenging activity of individual fractions were evaluated by measuring the disappearance of H2O2 at 230 nm wavelengths. Each fraction sample were taken in a volume of 0.1ml and then the volume was adjusted with phosphate buffer until the volume was adjusted to 0.4ml. In order to prepare the sample solution, 0.6 ml of the hydrogen peroxide (2 mM) was added to the different concentrations (100, 250, and 500 µg/ml) of the sample solution, mixed by vortex and kept at room temperature for 10 minutes. As a final step, the absorbance of the sample was measured using a micro plate reader at 230 nm.
3.6.4. DPPH (2,2-diphenyl-1-picrylhydrazyl) Scavenging Assay
According to the method described by (Sridhar et al. 2022) [22], the free radical scavenging activity of different concentrations (100, 250, and 500 µg/ml) of each fraction were measured. Specifically, 2ml of the test sample dissolved in methanol were mixed with 2ml of a solution containing 0.04 mg/ml 2,2-diphenyl-1-picrylhydrazyl solution. A micro plate reader was used to measure the absorbance at 515 nm of the samples after they had been incubated at room temperature for 30 minutes in dark conditions.
3.7. Invitro Enzyme Inhibitory Assay
3.7.1. Pancreatic Lipase Assay
The inhibition of pancreatic lipase activity in all fractions was evaluated using the methods described by (Rahman et al. 2017) [23]. The 0.1 mg/ml enzyme solution was prepared by mixed with 0.1 M tris HCl buffer at a pH of 8.0. A mixture of 30 µl of different concentrations (0.5, 1, 1.5 mg/ml) of each test sample was mixed with 180 µl of enzyme buffer and then incubated at room temperature for 15 minutes. Then 5 µl of 10 mM PNPB was added to the samples and incubated at 37° C for another 15 minutes. UV spectrometer was used to measure the absorbance at 405 nm of each concentration of samples and standard (orlistat) using a microplate reader.
3.7.2. Alpha Amylase Assay
The alpha amylase assay is a laboratory technique used to determine the activity of the enzyme alpha-amylase in a sample [24]. The procedure involves several steps that must be performed in order. A solution of soluble starch was prepared in a sodium phosphate buffer solution. Next, the fractions at different concentration (0.5, 1, 1.5 mg/ml) were diluted in buffer solution so that its concentration is in the range of the expected activity. A control was also prepared without the sample or enzyme solution to determine the background activity of the starch solution. The diluted sample or enzyme solutions were then mixed with the substrate solution in a microplate well. The ratio of sample to substrate can vary depending on the concentration of the sample and the desired sensitivity of the assay. The mixtures were then incubated for a certain amount of time, typically 10-30 minutes. The reaction is stopped by adding a solution of DNS reagent that will react with the remaining starch in the solution to give a colored product that can be measured spectrophotometrically. The absorbance of the mixture was measured at a specific wavelength of 620 nm, using a spectrophotometer or microplate reader. Finally, the absorbance values of the sample are compared to the control and the activity of the alpha-amylase in the sample is calculated based on the change in absorbance over time.
3.7.3. Alpha Glucosidase Assay
The alpha-glycosidase assay is a laboratory method used to determine the activity of the enzyme alpha-glycosidase in bioactive fractions as described by (Chaturvedi and Gupta 2021. and Rahman et al. 2017) [23,24]. To perform the assay, several steps must be followed in a specific order to obtain reliable results. The first step involves preparing the substrate, which is typically a solution of p-nitrophenyl-alpha-D-glucopyranoside (pNPG) in a sodium phosphate buffer solution. The concentration of the pNPG solution should be adjusted based on the expected activity of the bioactive fractions being tested. The next step involves diluting the bioactive fraction in buffer solution to bring its concentration within the expected activity range (0.5, 1, 1.5 mg/ml). A control sample was also prepared without the bioactive fraction to determine the background activity of the pNPG solution. Once the bioactive fraction has been diluted, it is mixed with the pNPG substrate solution in a test tube or microplate well. The mixtures were then incubated for a specific period, typically 10-30 minutes, to allow the alpha-glycosidase enzyme to act on the pNPG substrate. To stop the enzymatic reaction, a solution of sodium hydroxide was added to raise the pH and halt the reaction. The absorbance of the mixtures was then measured at a specific at 410 nm, using a microplate reader.
Finally, the absorbance values of the bioactive fractions were compared to the control and the activity of the alpha-glycosidase in the bioactive fraction was calculated based on the change in absorbance over time.
3.8. Invivo Assay
3.8.1. Animals
Swiss albino mice aged six to eight weeks were used in the experiments for breeding. The mice were obtained from the Department of Pharmaceutical Sciences & Technology, Birla Institute of Technology, Mesra (IAEC approval number: 1972/PH/BIT/108/20/IAEC) and housed in separate cages with light and dark cycles of 14:10 hours with a controlled environment of temperature and humidity. Food and water were made available to the mice under standard environmental conditions throughout the experiment.
3.8.2. Obesity Model Induced by Diet and Chemicals
MSG (Monosodium glutamate) was administered to pups on day 2nd 4th 6th 8th postpartum and allowed till weaning period of 25 days. After completion of weaning period the MSG induced animals were allowed a variety of diets for 5 months to induce obesity and they are as follow (a) casein -173.4 grams, (b) lard-186 grams, (c) butter oil-114 grams, (d) 1-Cysteine-1.99 grams, (e) corn starch-124.3 grams, (f) sucrose-54.3 grams, (g) dextrose-69 grams, and (h) cellulose-30 grams [25].
3.8.3. Experimental Design
Each cage contained six mice of similar ages and sexes (Male). A normal dry pellet diet consists of grains and cereals along with water were provided to control mice for 6 months and throughout the experiment, while MSG (Monosodium glutamate) and a HFD (high-fat diet) were provided to develop obesity in mice. Five groups were made and they are as follow (Group A) normal control group, (Group B) MSG HFD induced obese control group, (Group C) MSG HFD induced standard treated group (Group D & E) MSG HFD induced Fractions F1 and F2 treated groups for 28 days, Orlistat was given at a dose of 50 mg/kg while 80 mg/kg of selected potent bioactive fractions (F1 & F2) were administered to (Group D & E). The HFD was administered to the treatment group during and throughout the experiment. Animal’s weights and waist hip ratio were measured at 0, 7, 14 and 28 days.
3.8.4. Biochemical Parameters Estimation:
The following is a detailed procedure for the estimation of biochemical parameters, including TG, TC, LDL, VLDL, HDL, and insulin tolerance using the kit from Span Diagnostics, Ltd, Surat [26].
Sample preparation- With the use of aseptic techniques, blood samples were collected retero-orbitally from the mice and then separated into serum by centrifugation at a speed of 2000-3000 rpm for 10-15 minutes. The clear supernatant serum was used for the analysis.
Triglycerides estimation- 10 μl of serum was taken and added with 1 ml of the provided reagent in the kit, mix thoroughly and then incubate at a temperature of 37° C for 5 minutes. The sample absorbance was then measured at 540 nm using a spectrophotometer and the TG concentration was determined using the formula provided in the kit.
Total Cholesterol (TC) Estimation: Using duplicate samples of 10 μl of serum, add 1 ml of the kit’s reagent, mix thoroughly and then incubate at a temperature of 37° C for 5 minutes. The sample absorbance was then measured at 500 nm using a spectrophotometer and the TC concentration was determined using the formula provided in the kit.
LDL, VLDL, and HDL Cholesterol Estimation: To estimate LDL, VDL, and HDL cholesterol, 0.3 ml of serum was added to 1.7 ml of the provided buffer solution. The serum/buffer mixture is incubated at room temperature for 10 minutes and then centrifuged at a speed of 2000-3000 rpm for 10-15 minutes. The supernatant was transferred to eppendorf tubes and the instructions provided in the kit were followed to estimate LDL, VLDL, and HDL cholesterol.
3.8.5. Measurement of Body Weight and Waist Hip Ratio
The weight of each animals were measured using a weighing scale. To measure the waist circumference, the mice was placed on a flat surface in a prone position and the narrowest part of the torso was identified. A flexible measuring tape was used to measure the waist circumference. For hip circumference, the widest part of the pelvic region was identified and the circumference was measured using a flexible measuring tape. The waist-hip ratio was then calculated by dividing the waist circumference by the hip circumference in centimeters. The measurements were repeated at regular intervals as required by the experimental protocol and accurate documentation was maintained for future reference. It is important to handle the mice with care and minimize the stress during the measurement. The measurement process should be standardized to ensure accuracy and reproducibility of the results [26,27].
3.8.6. Histopathological Examination
On the 28th day, mice were sacrificed as per institutional animal ethics guidelines. To conduct histopathology of adipose tissue, kidney and liver of the mice, the organs were dissected and immediately fixed with 10% neutral buffered formalin for 24 hours. After fixation, the tissues were dehydrated using graded ethanol solutions then cleared in xylene and embedded in paraffin wax. The paraffin-embedded tissues were then sliced into 5 μm-thick sections using a microtome, mounted on glass slides and left to dry overnight at 37° C. The tissue sections were then stained with hematoxylin and eosin (H&E), deparaffinized in xylene, rehydrated in graded ethanol solutions then stained with hematoxylin and eosin, further dehydrated again, cleared in xylene and finally the organ’s section was dipped in 1N HCl and Scott’s water for one minute, and then covered with small rectangular slides mounted with a cover slip. The stained sections were examined under a Leica microscope to assess the Histopathological changes [28].
3.9. HPTLC and HPTLC-ESI MS/MSn (Retro Diels-Alder Fragmentation)
Silica gel plates 10 × 10 cm of 60 F254 coated with aluminum was used for separation of compounds from bioactive fractions. To conduct HPTLC and HPTLC-ESI MS/MSn (retro Diels-Alder fragmentation), first solutions of the bioactive fractions were prepared, then a uniform layer of the stationary phase was applied to the HPTLC plate using a suitable solvent. The sample solution was then carefully applied to the HPTLC plate using an automatic sample applicator (CAMAG) and the plate was developed using a developed mobile phase system (Toluene: ethyl acetate – 7:3) until the spots were adequately separated. Once the plate was dried, a derivatization process using anisaldehyde solvent was carried out and the spots were visualized after spraying of anisaldehyde reagents under TLC fluorescence scanner (CAMAG). The spots were then scrapped from the HPTLC plate and eluted in a suitable solvent for HPTLC-ESI MS/MSn analysis. The eluents were then analyzed by HPTLC-ESI MS/MSn using mass spectrometer (CAMAG TLC-MS Interface 2, Thermo Scientific, LTQ-XL) and the fragmentation pattern of the bioactive fractions were analyzed using the retro Diels-Alder fragmentation method. Identification of the bioactive constituent were achieved by comparing the fragmentation pattern with available spectral libraries. Finally, the results were interpreted and conclusions about the bioactive constituents of the sample were drawn [29,30].
3.10. Insilco Molecular Docking
After tentatively identifying the compounds from HPTLC MS/MS analysis, their efficacy in binding to specific protein receptors 1LPB, 4W93, and 7K9N were investigated via molecular docking. PDB 1LPB corresponds to the protein structure of human pancreatic lipase, while 4W93 denotes the protein Human pancreatic alpha-amylase (HPA), and 7K9N pertains to the Co-crystal structure of alpha-glucosidase. Utilizing the Schrödinger software (Version 2022-1, Schrodinger) on an HP workstation operating with Ubuntu 22.04, molecular docking studies were conducted, and the targeted ligands were acquired from the Drug Bank database. The docking results were subsequently analyzed using XP Visualiser [31].
3.10.1. Ligand Preparation
To undertake the docking investigation, ligands were procured from the Drug Bank repository and primed for bond alignment. Subsequently, these ligands were incorporated into the workstation and subjected to energy minimization using the OPLS3e force field in Ligprep (Version 2022-1, Schrödinger). This procedure facilitated the identification of bond orders, introduction of hydrogen to the ligands, and conversion of 2D structures to 3D structures which are essential for the docking analysis. The resultant output file, encompassing the most favorable ligand conformations, was utilized for further docking research.
3.10.2. Protein Preparation
The proteins were rendered using the protein preparation wizard (Version 2022-1, Schrödinger), whereby hydrogen atoms were affixed to them and their charges were allocated. The Het states generated were procured using Epik, operating at a pH of 7.0 ± 2.0. Subsequently, the protein underwent preprocessing and refining, followed by scrutiny of its workspace. Water molecules and other heteroatoms were assessed and atoms deemed insignificant were eliminated from the protein’s crystal structure. Finally, the protein underwent minimization utilizing the OPLS3e force field. A grid was constructed, taking into account the co-crystallized ligand found in the active site of the chosen proteins.
3.10.3. Receptor Grid Generation
To generate receptor grid, the discriminating ligand (whose X-ray pose in the protein is established) was chosen. The ligand’s centroid served as the basis for framing a grid box, wherein the receptor atoms’ Vander Waals radius were adjusted to 1.00 Å, while carrying a partial atomic charge of 0.25.
3.10.4. Docking Studies
Conducting the docking study of ligands with utmost precision, we employed the Glide module in Schrödinger, executing all docking calculations in Extra Precision (XP) mode. With a scaling factor of 0.8 and a partial atomic charge of less than 0.15 assigned to the protein atoms, we determined the best-docked conformation by evaluating the Glide docking score of the output. To further scrutinize the docked conformations, we employed the XP visualizer to study their interactions.
3.10.5. Molecular Dynamics
The simulation experiments were conducted on a DELL workstation operating Ubuntu 22.04 LTS with a 64-bit operating system, an Intel® Core™ i5-12400 CPU@2.30 GHz processor, 16 GB RAM, and an 8 GB GPU (Nvidia GeForce RTX 3050). Molecular dynamics simulations (MDS) were carried out using the Desmond module of the Schrodinger Suite, which was developed by the D.E Shaw research group and operated under an academic license. The ligand structure was sketched using ChemOffice Suite v15. The co-crystallized protein structures were obtained from the Protein Data Bank (PDB); (i) 1LPB: Structure of Pancreatic Lipase Colipase in complex with C11 Alkyl Phosphonate (ii) 4W93: Structure of Human pancreatic alpha-amylase in complex with montbretin A, (iii) 7K9N: Co-crystal structure of alpha glucosidase with compound 2 (Schrödinger Release 2022).
3.10.6. Molecular Dynamics Simulation Study
Molecular dynamics simulation (MDS) is a computational method that provides insights into the stability and flexibility of protein-ligand complexes (PLCs) and the thermodynamics of their interactions. In this study, MDS using the Desmond module of the Schrodinger Suite was performed to investigate the stability and ligand-binding constancy of the complexes. The simulation box was prepared using the orthorhombic geometry and the Simple Point-Charge (SPC) explicit water model. The protein-ligand complex was solvated with cubic SPC water model, neutralized with counter ions and physiological salt, and designated with the OPLS AA force field. The system was energy-minimized using a hybrid algorithm. During the 100ns MD simulation, a constant temperature of 310.15 K and a pressure of 1.0 bar were maintained using the Reversible reference System Propagator Algorithms (RESPA) integrator, the Nose-Hoover chain thermostat, and the Martyna-Tobias-Klein barostat. The Isothermal-Isobaric ensemble was used to keep the number of particles, temperature, and pressure constant. Trajectory files were written, and the _out.cms file was imported for analysis. The simulation Interaction Diagram (SID) analysis tab was used to generate data. The complex’s stability was assessed by aligning protein backbone frames to the initial frame, and the simulated interaction diagram was analyzed using Root Mean Square Deviation (RMSD) [32,33].
3.10.11. Calculation of IC50 Value and Statistical Analysis
A triplicate calculation was performed for all the experiment except the total phenol, flavonoid, and steroid content. A one-way ANOVA with Dunnett’s test was used to determine the statistical significance of the data using GraphPad Prism 8.3.1 software. The data are expressed as mean ± standard error mean (SEM). Probability (P) values of <0.05 were considered significant: P < 0.05, *P < 0.01 and ***P < 0.001; ns, not significant.
4. Conclusion
This study explores the anti-obesity potential of bioactive fractions of Kalanchoe pinnata using in vitro and in vivo screening. Phytochemical analysis revealed that fractions F1 and F2 had the highest phytoconstituents. In vitro studies confirmed the potent inhibitory activity of fractions F1 and F2 through antioxidant and enzyme inhibition assays. In vivo studies using the MSG HFD (Monosodium glutamate- High fat diet) mice model showed that fraction F2 exhibited the most potent activity compared to other fractions. HPTLC MS/MS identified four major compounds present in the most potent fraction (F2). In silico findings also revealed good binding affinities with all the proteins under study. Overall, MDS analysis revealed that the PLCs remained highly stable throughout the simulation, with more interactions observed than expected. The study adds to the growing evidence supporting the use of plant-based health products for managing obesity and related conditions. Further research is necessary to identify the molecular pathways responsible for the anti-obesity effects of Kalanchoe pinnata.
Supplementary Materials
The following supporting information can be downloaded at the website of this paper posted on Preprints.org.
Funding
N/A.
Institutional Review Board Statement
The animals used in the experiment were approved by institutional animal ethical committee of Birla institute of technology, Mesra, Ranchi with the approval number of- PROV/BIT/PH/24/2016. The selected plant was identified by Central National Herbarium, Botanical Survey of India, which is a part of the Ministry of Environment & Forests and Government of India situated in Howrah, West Bengal with authentication number of CNH/Tech.II/2016/55.
Acknowledgments
In this section, you can acknowledge any support given which is not covered by the author contribution or funding sections. This may include administrative and technical support, or donations in kind (e.g., materials used for experiments).
Conflicts of Interest
“The authors declare no conflict of interest.”
References
- Anjoo, K.; Kumar, S.A. Microscopical and Preliminary Phytochemical Studies on Aerial Part (Leaves and Stem) of Bryophyllum Pinnotum Kurz. Pharmacogn J. 2010, 2, 254–259. [Google Scholar] [CrossRef]
- Roh, C.; Jung, U. Screening of Crude Plant Extracts with Anti-Obesity Activity. Int J Mol Sci 2012, 1710–1719. [Google Scholar] [CrossRef]
- Gamboa-gómez, C.I.; Rocha-guzmán, N.E.; Gallegos-infante, J.A.; Jimenez, M.R.M.; Vázquez-Cabral, B.D.; González-Laredo, R.F. Plants with potential use on obesity and its complications. Excil. J. 2015, 809–831. [Google Scholar]
- Pandhare, R.B.; Shende, R.R.; Avhad, M.S.; Deshmukh, V.K.; Mohite, P.B.; Sangameswaram B and Daude, R.B. Anti-urolithiatic activity of Bryophyllum pinnatum Lam . hydroalcoholic extract in sodium oxalate-induced urolithiasis in rats. J Tradit Chinese Med Sci. 2021, 11, 545–551. [Google Scholar] [CrossRef] [PubMed]
- Kamboj, A.; Saluja, A.K. HPTLC Finger Print Profile of Extracts from Dried Aerial Parts of Bryophyllum Pinnatum in Different Solvents. Pharmacogn J. 2010, 2, 24–31. [Google Scholar] [CrossRef]
- Solo, M.; Hui, T.; Saari, N.; Razid, S. Food Bioscience A review: Resistant starch, a promising prebiotic for obesity and weight management. Food Biosci. 2022, 50, 101965. [Google Scholar] [CrossRef]
- Salami, E.O.; Ozolua, R.I.; Okpo, S.O.; Eze, G.I.; Uwaya, D.O. Studies on the anti-asthmatic and antitussive properties of aqueous leaf extract of Bryophyllum pinnatum in rodent species. Asian Pac J Trop Med. 2013, 6, 421–425. [Google Scholar] [CrossRef]
- Kaviraj, M.; Pradeep, M.A.; Satheesh, D. In-vitro investigation on antiurolithiatic activity and phytochemical examination of Aerva lanata and Bryophyllum pinnatum : A comparative study. J Indian Chem Soc. 2022, 99, 100487. [Google Scholar] [CrossRef]
- Yemitan, O.K.; Salahdeen, H.M. Neurosedative and muscle relaxant activities of aqueous extract of Bryophyllum pinnatum. Fitoterapia 2005, 76, 187–193. [Google Scholar] [CrossRef]
- Fernandes, J.M.; Cunha, L.M.; Azevedo, E.P.; Fernandes-pedrosa, M.F.; Zucolotto, S.M. Kalanchoe laciniata and Bryophyllum pinnatum : An updated review about ethnopharmacology phytochemistry. pharmacology and toxicology 2019, 29, 529–558. [Google Scholar]
- Toniolo, C.; Nicoletti, M.; Maggi F, & Venditti, A. HPTLC determination of chemical composition variability in raw materials used in botanicals. Nat. Prod. Res. 2014, 28, 119–126. [Google Scholar] [CrossRef]
- Kamboj, A.; Saluja, A.K. Development of validated HPTLC method for quantification of stigmasterol from leaf and stem of Bryophyllum pinnatum. Arab J Chem. 2017, 10, S2644–S2650. [Google Scholar] [CrossRef]
- Gori, A.; Boucherle, B.; Rey, A.; Rome, M.; Fuzzati, N.; Peuchmaur, M. Development of an innovative maceration technique to optimize extraction and phase partition of natural products. Fitoterapia. 2021, 148. [Google Scholar] [CrossRef] [PubMed]
- Zannou, O.; Pashazadeh, H.; Ibrahim, S.A.; Koca, I.; Galanakis, C.M. Green and highly extraction of phenolic compounds and antioxidant capacity from kinkeliba (Combretum micranthum G. Don) by natural deep eutectic solvents (NADESs) using maceration, ultrasound-assisted extraction and homogenate-assisted extraction. Arab J Chem. 2022, 15, 103752. [Google Scholar] [CrossRef]
- Hertzog, J.; Garnier, C.; Mase, C.; Maariette, S.; Serve, O.; Roux, M.H.; Afonso, C.; Giusti, P.; Mangote, C.B. Fractionation by flash chromatography and molecular characterization of bio-oil by ultra-high-resolution mass spectrometry and NMR spectroscopy. J Anal Appl Pyrolysis. 2022, 166, 1–8. [Google Scholar] [CrossRef]
- Fernando, G.S.N.; Sergeeva, N.N.; Frutos, M.J.; Marshall, L.J.; Boesch, C. Novel approach for purification of major betalains using flash chromatography and comparison of radical scavenging and antioxidant activities. Food Chem. 2022, 385, 132632. [Google Scholar] [CrossRef]
- Shraim, A.M.; Ahmed, T.A.; Rahman, M.; Hijji, Y.M. Determination of total flavonoid content by aluminum chloride assay : A critical evaluation. LWT. 2021, 150, 111932. [Google Scholar] [CrossRef]
- Jaradat, N.; Hussen, F.; Ali, A. Preliminary phytochemical screening, quantitative estimation of total flavonoids, total phenols and antioxidant activity of Ephedra alata decne. J. of Materials and Environ. Sci 2015, 6, 1771–1778. [Google Scholar]
- Chaves, N.; Santiago, A.; Alías, J.C. Quantification of the antioxidant activity of plant extracts: Analysis of sensitivity and hierarchization based on the method used. Antioxidants 2020, 9, 76. [Google Scholar] [CrossRef]
- Hazra, B.; Biswas, S.; Mandal, N. Antioxidant and free radical scavenging activity of Spondias pinnata. BMC Compl. & Alt. Med 2008, 10, 1–10. [Google Scholar] [CrossRef]
- Özyürek, M.; Bektaşoğlu, B.; Güçlü, K.; Reşat, A. Hydroxyl radical scavenging assay of phenolics and flavonoids with a modified cupric reducing antioxidant capacity (CUPRAC) method using catalase for hydrogen peroxide degradation. Analytica Chimica Acta 2008, 616, 196–206. [Google Scholar] [CrossRef]
- Sridhar, S.N.C.; Palawat, S.; Paul, A.T. Design, synthesis, biological evaluation and molecular modelling studies of indole glyoxylamides as a new class of potential pancreatic lipase inhibitors. Bioorganic chemistry 2019, 85, 373–381. [Google Scholar] [CrossRef] [PubMed]
- Rahman, R.N.Z.; Mohd, S.M.A.; Thean, C.L.; Norsyuhada, A. Anti-obesity Potential of Selected Tropical Plants via Pancreatic Lipase Inhibition. Advances in Obesity, Weight Management & Control 2017, 6. [Google Scholar]
- Chaturvedi, S.; Gupta, P. Functional components in extracts of Beta vulgaris (Chukandar) parts for antioxidant effect and antiobesity potential with lipase inhibition. Food Biosci. 2021, 41, 100983. [Google Scholar] [CrossRef]
- Moon, J.; Do, H.; Yoen, O.; Shin, M. Antiobesity effects of quercetin-rich onion peel extract on the differentiation of 3T3-L1 preadipocytes and the adipogenesis in high fat-fed rats. Food Chem Toxicol. 2013, 58, 347–354. [Google Scholar] [CrossRef]
- Birari, R.; Javia, V.; Bhutani, K.K. Antiobesity and lipid lowering effects of Murraya koenigii (L.) Spreng leaves extracts and mahanimbine on high fat diet induced obese rats. Fitoterapia 2010, 81, 1129–1133. [Google Scholar] [CrossRef]
- Fang, J.; Huang, T.; Chen, W.; Aljuffali, I.A. Rhubarb hydroxyanthraquinones act as antiobesity agents to inhibit adipogenesis and enhance lipolysis. Biomed Pharmacother. 2022, 146, 112497. [Google Scholar] [CrossRef]
- Mohanty, S.; Pattnaik, A. Scientific evaluation of anti-obesity potential of methanolic leaves extract of ocimum sanctum (Linn.) in monosodium glutamate-high fat diet induced obese mice. Indian Jou. of Pharm. Edu. and Res. 2021, 55, S535–S543. [Google Scholar] [CrossRef]
- Ibragic, S.; Barbini, S.; Timotheus, J.; Potthast, A.; Rosenau, T.; Stefan, B. Antioxidant properties and qualitative analysis of phenolic constituents in Ephedra spp. by HPTLC together with injection port derivatization GC–MS. Journal of Chromatography B 2021, 1180, 122877. [Google Scholar] [CrossRef]
- Singh, R.P.; Pattnaik, A.K. Anti-obesity potential of bioactive guided fractions of Annona squamosa linn. leaves extract: A combination of in-vitro, in-vivo and in-silico studies along with profiling of lead compounds by HPTLC MS-MSn method. 3 Biotech 2023, 13, 171. [Google Scholar] [CrossRef]
- Schrödinger Release 2022-1: Desmond Molecular Dynamics System, D. E. Shaw Research, New York, NY, 2021. Maestro-Desmond Interoperability Tools, Schrödinger, New York.
- Hospital, A.; Goñi, J.R.; Orozco, M.; Gelpí, J.L. Molecular dynamics simulations: Advances and applications. Advances and Applications in Bioinformatics and Chemistry 2015, 8, 37–47. [Google Scholar] [CrossRef] [PubMed]
- Mark, P.; Nilsson, L. Structure and dynamics of the TIP3P, SPC, and SPC/E water models at 298 K. Journal of Physical Chemistry A 2001, 105, 9954–9960. [Google Scholar] [CrossRef]
Figure 1.
Histopathology investigation of liver carried out at 40 x magnification with hematoxylin-eosin’s staining. The red arrows on the images represent the lipid droplets whereas the black arrows are representing the hepatocytes. Normal group mice liver section (a) showing normal hepatocytes with no presence of lipid droplets. Obese control group (b) showing enlarged and damaged hepatocytes along with large lipid droplets formation on liver. treated group at Standard treated group (c) and test treated group (e) pathological condition is almost back to normal and showed normal condition whereas fraction 80 mg/kg. (d) is also showing normal and healthy observations as compared to obese control group.
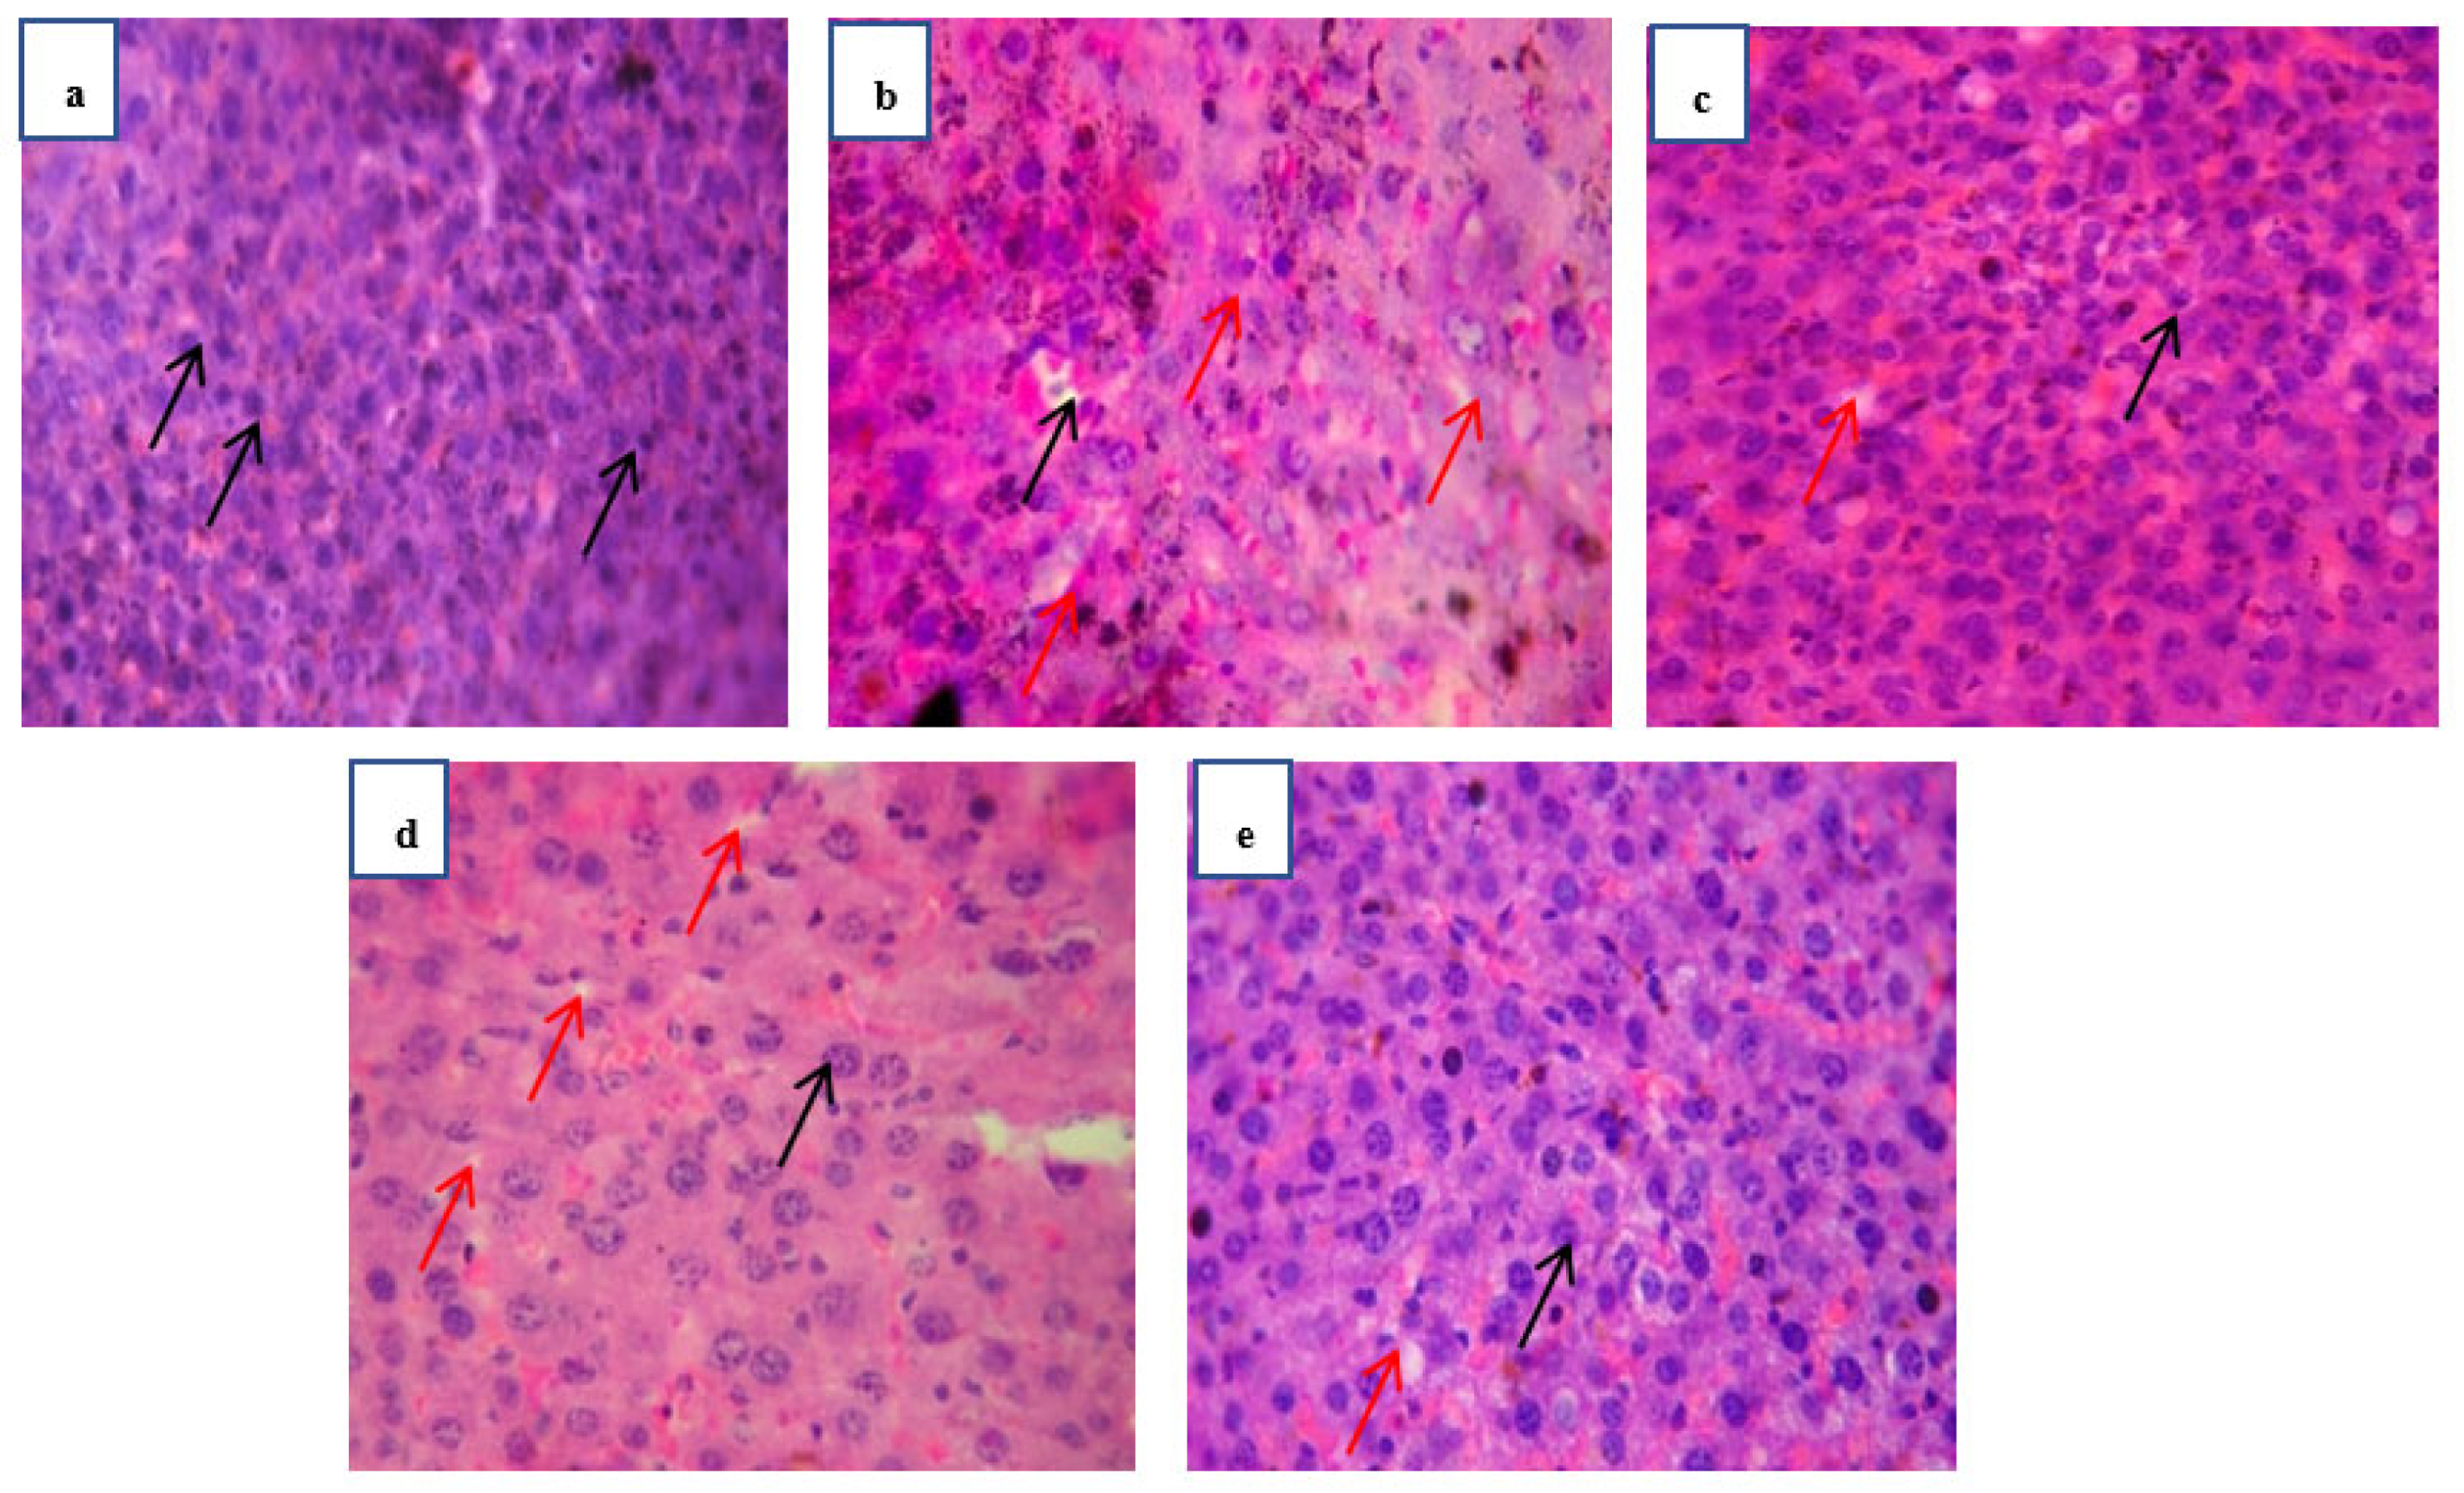
Figure 2.
Histopathology investigation of adipose tissue carried out at 40 x magnification with hematoxylin-eosin’s staining. The black arrows on the images are representing the size of lipid droplets (adipocytes). Normal group mice adipose section (a) showing normal and smaller adipocytes. Obese control group (b) showing a prominent and large size of lipid droplets. Standard (c) and test treated group (e) are showing normal and lesser no of lipid droplets as compared to obese control whereas test group (d) is also showing smaller number of droplets as compared to obese control group.
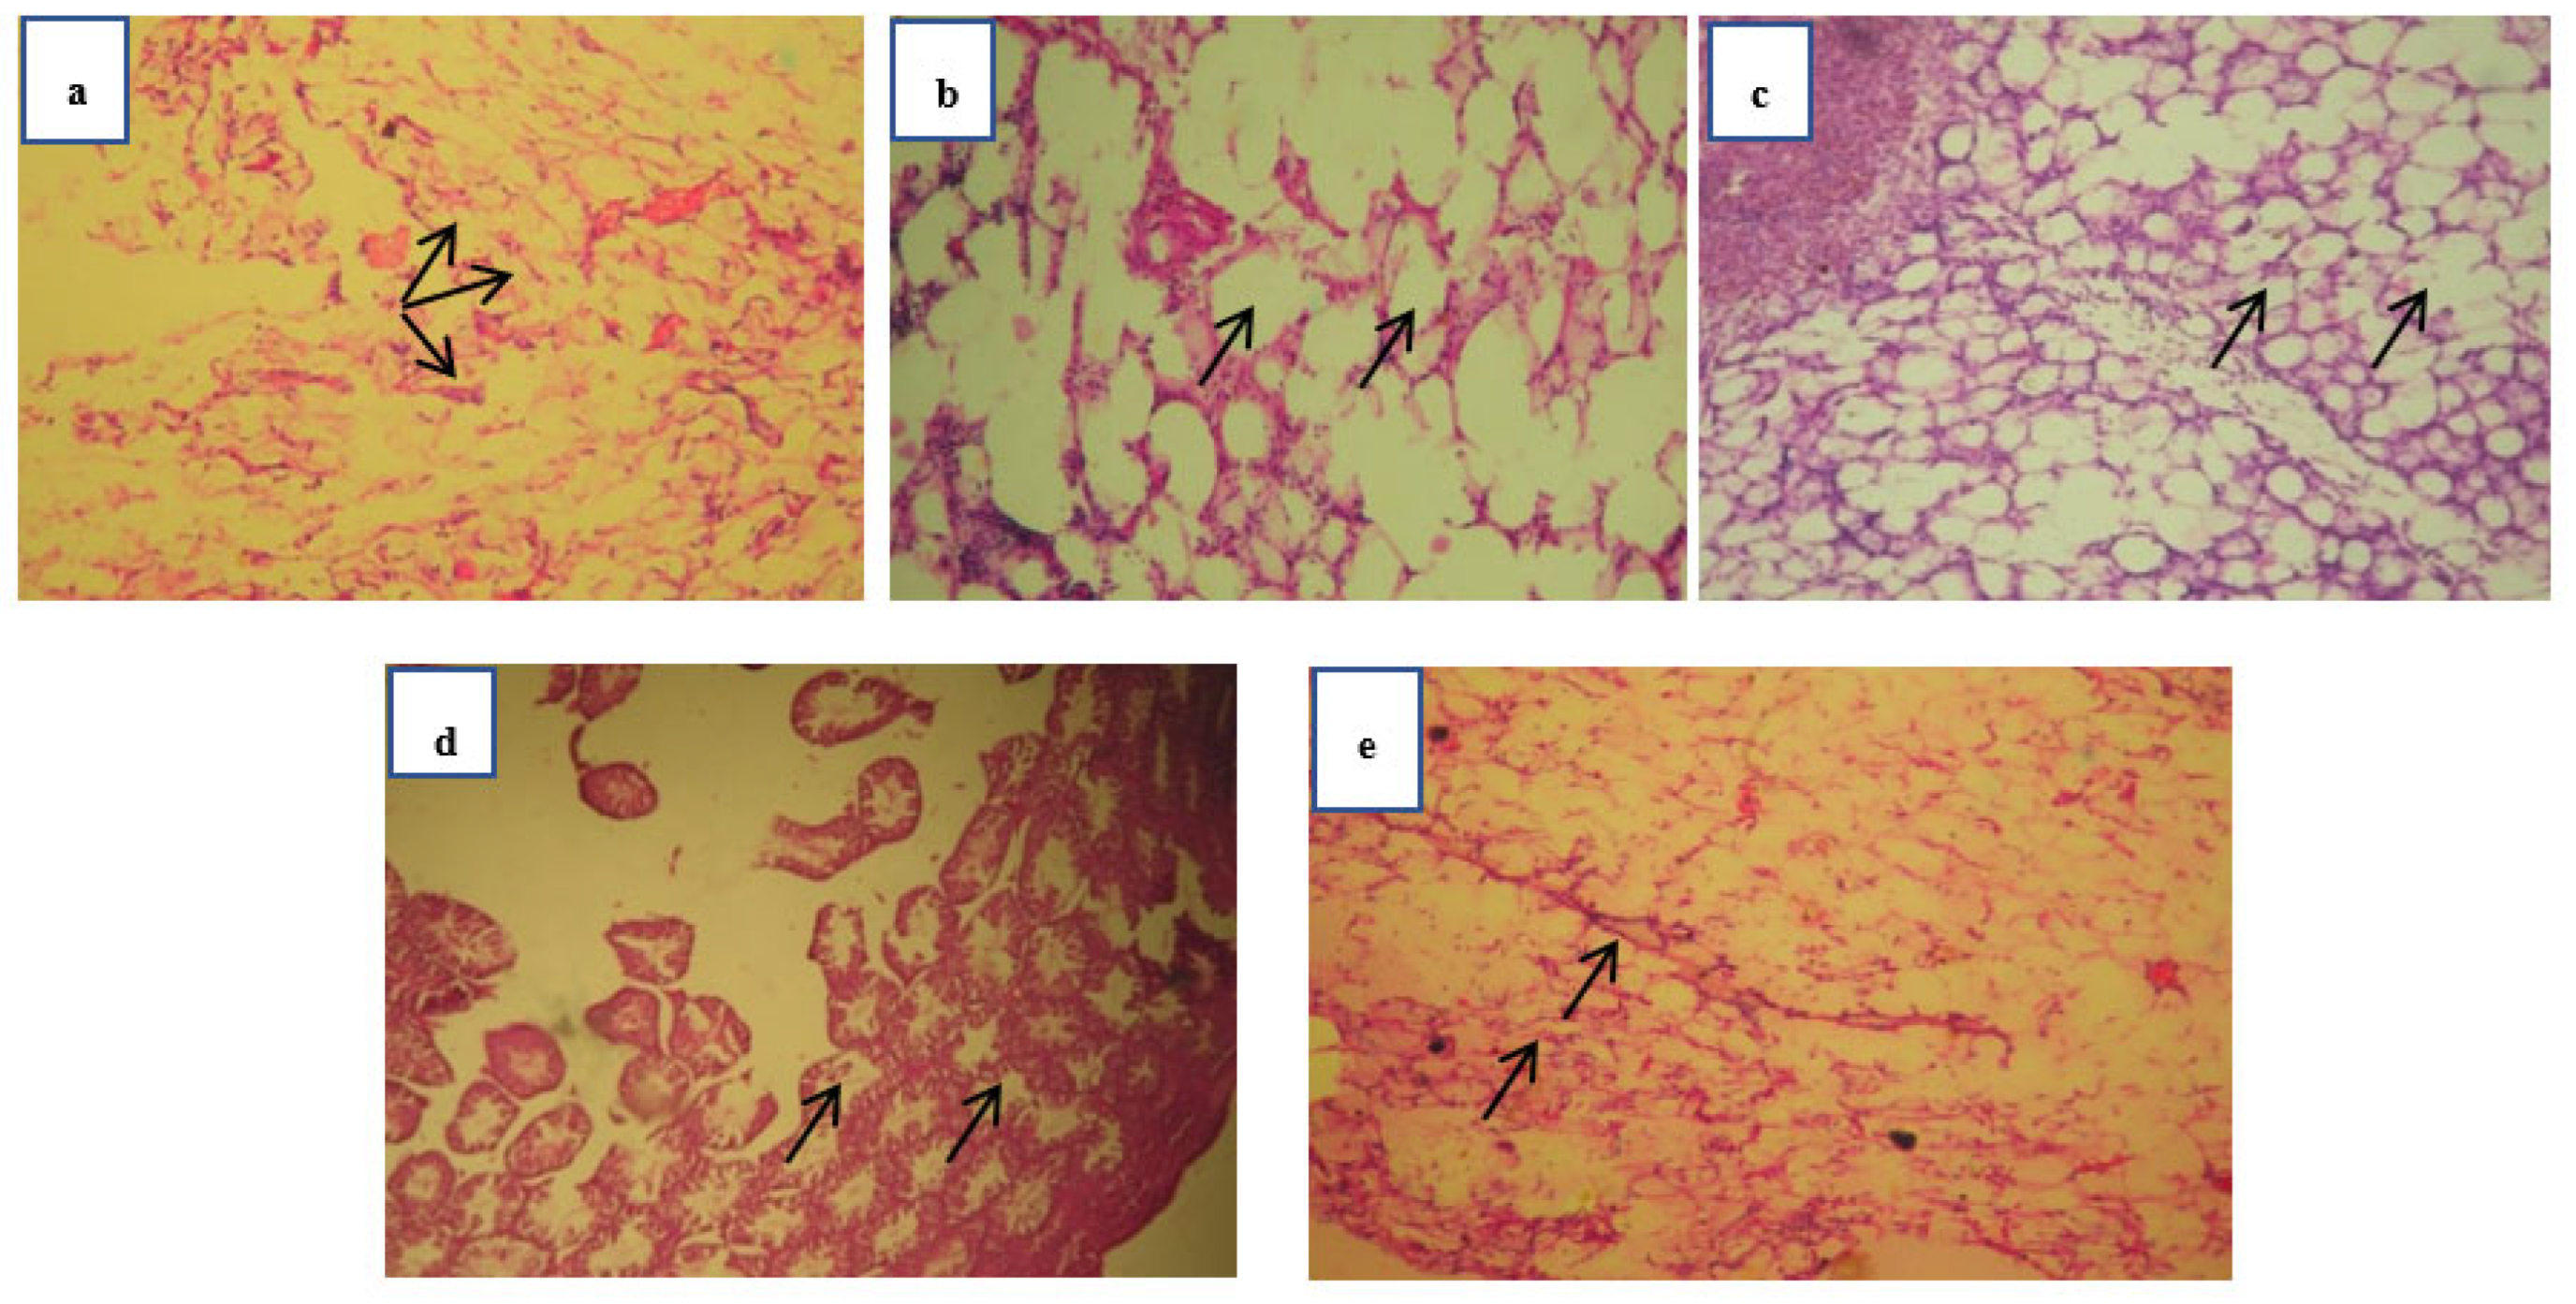
Figure 3.
Histopathology investigation of kidney carried out at 40 x magnification with hematoxylin-eosin’s staining. The red arrows on the images represent the proximal tubules (PT) whereas the black arrows are representing the glomerulus (G) and blue arrow heads are showing distal tubules (DT). Normal group mice kidney section (a) showing normal and healthy G, PT and DT. Obese control group (b) showing distorted PT and DT along with shrunken G. Standard treated group (c) and test treated group (d & e) pathological condition showed healthy and normal condition.
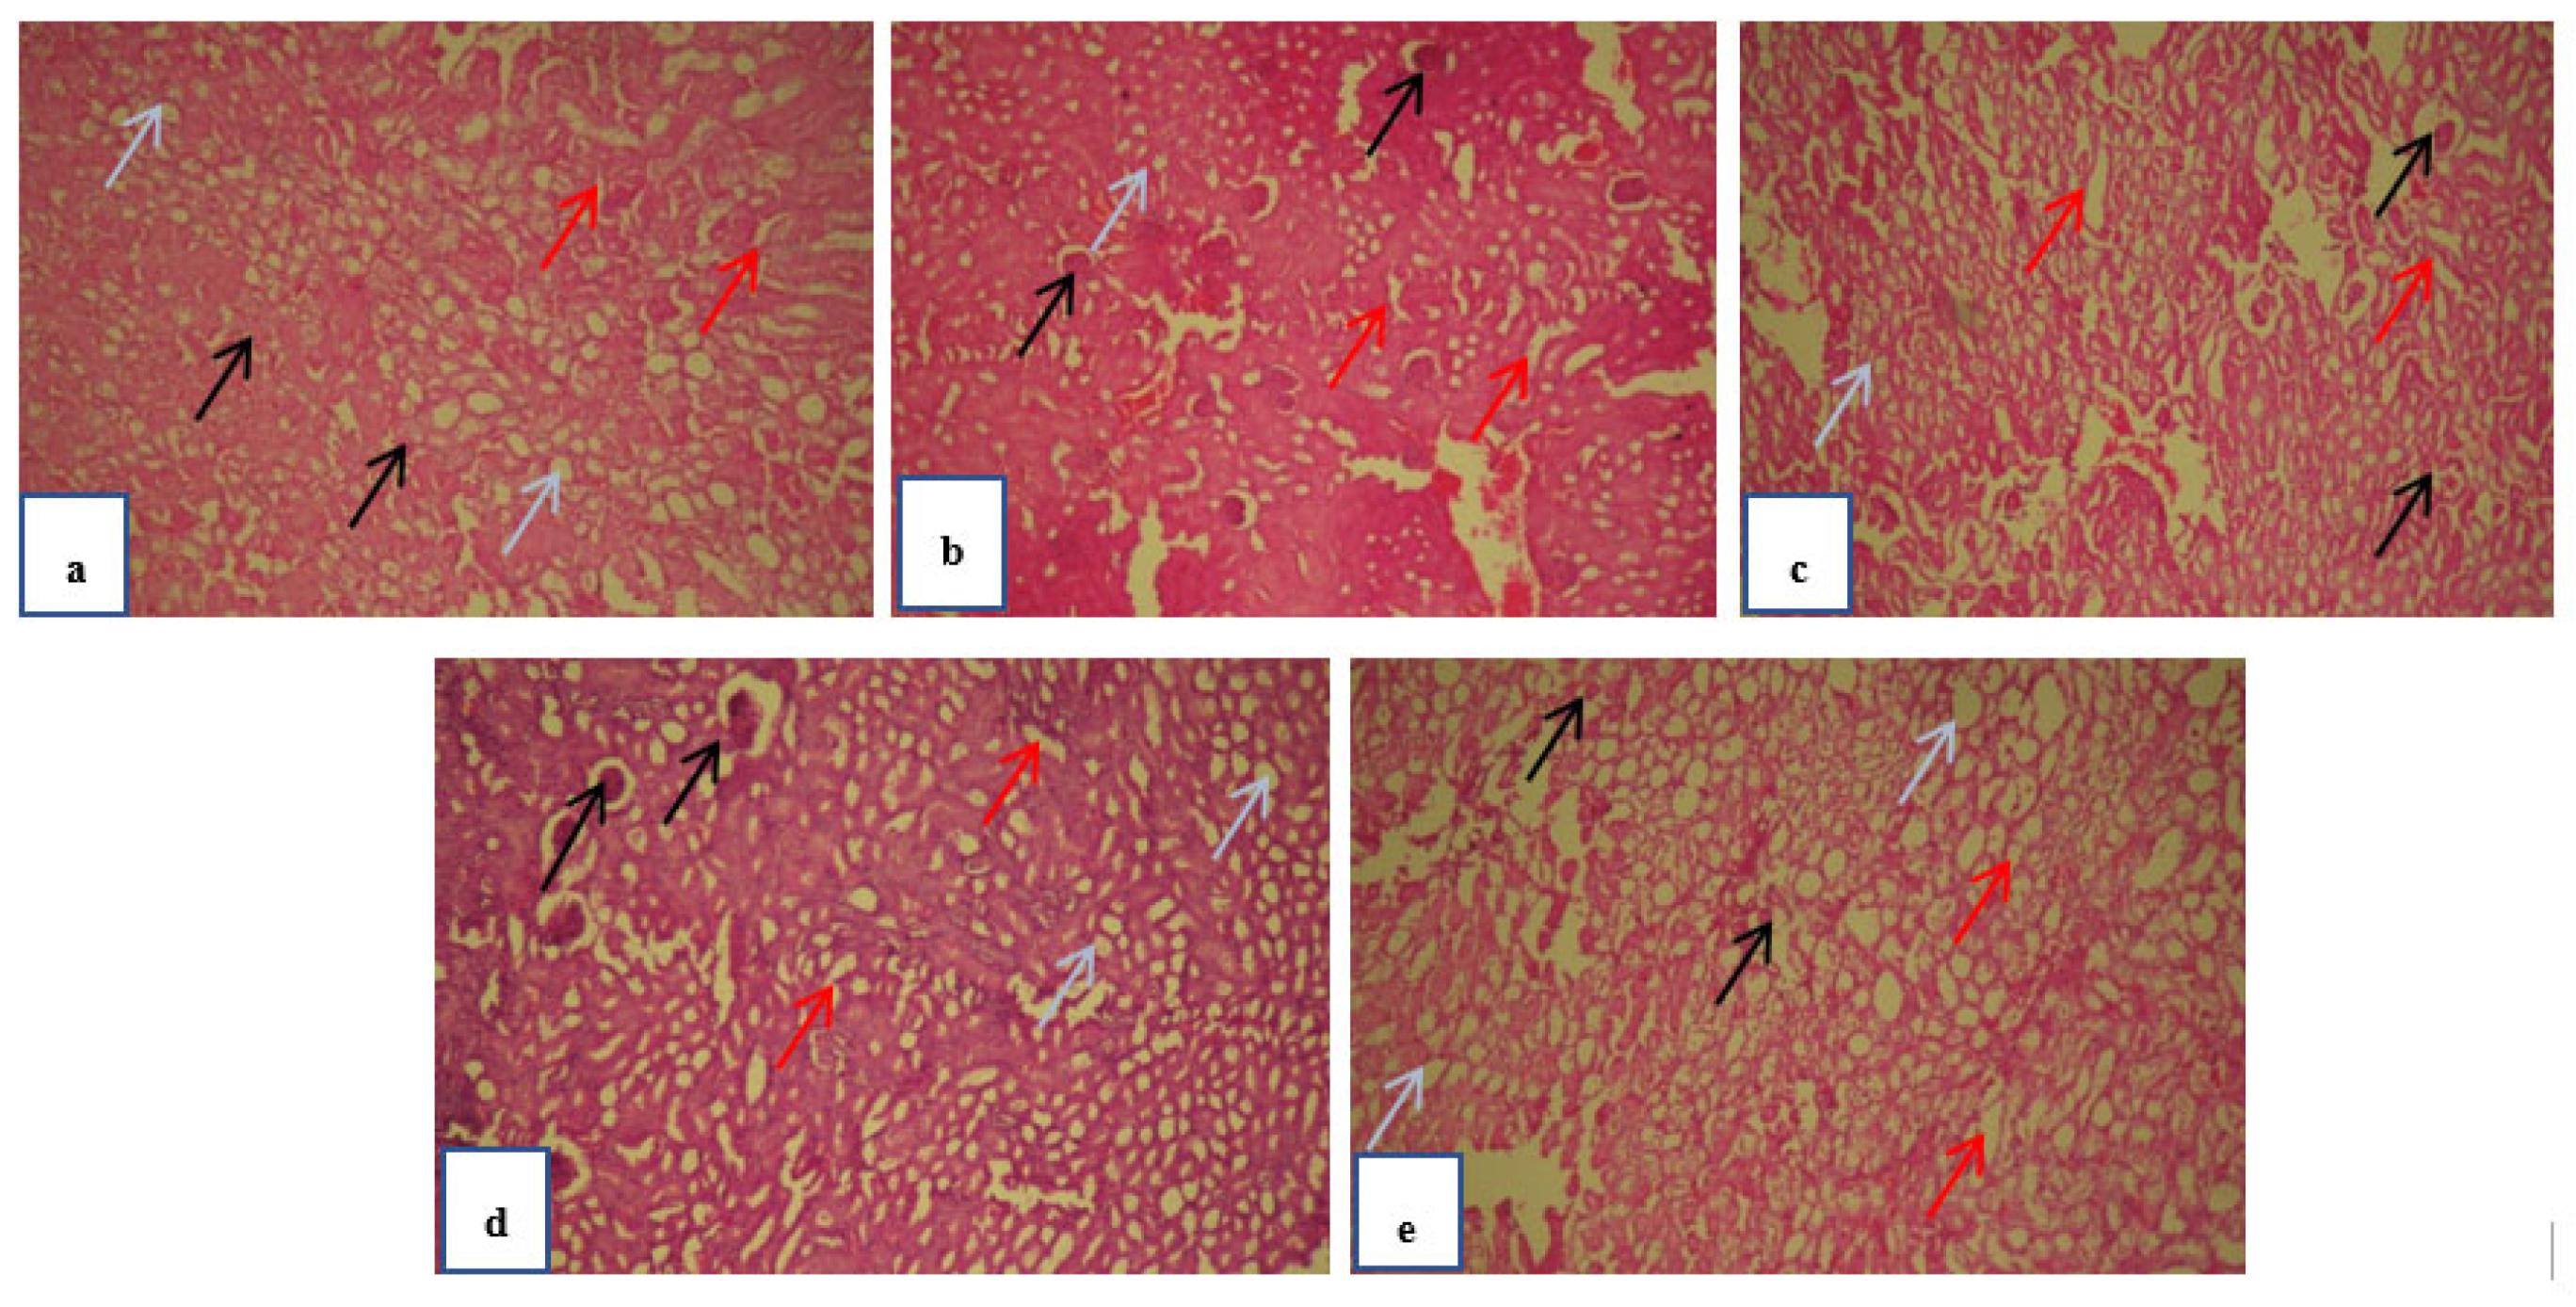
Figure 4.
(A) Chromatograms of compounds in fractions (F2) with their RF value on HPTLC F254 plates at 254 nm developed with selected solvent mixtures of ethyl acetate: toluene in the ratio of 6:4 in prep HPTLC. (B) Densitogram of compounds in fractions (F2).
Figure 4.
(A) Chromatograms of compounds in fractions (F2) with their RF value on HPTLC F254 plates at 254 nm developed with selected solvent mixtures of ethyl acetate: toluene in the ratio of 6:4 in prep HPTLC. (B) Densitogram of compounds in fractions (F2).
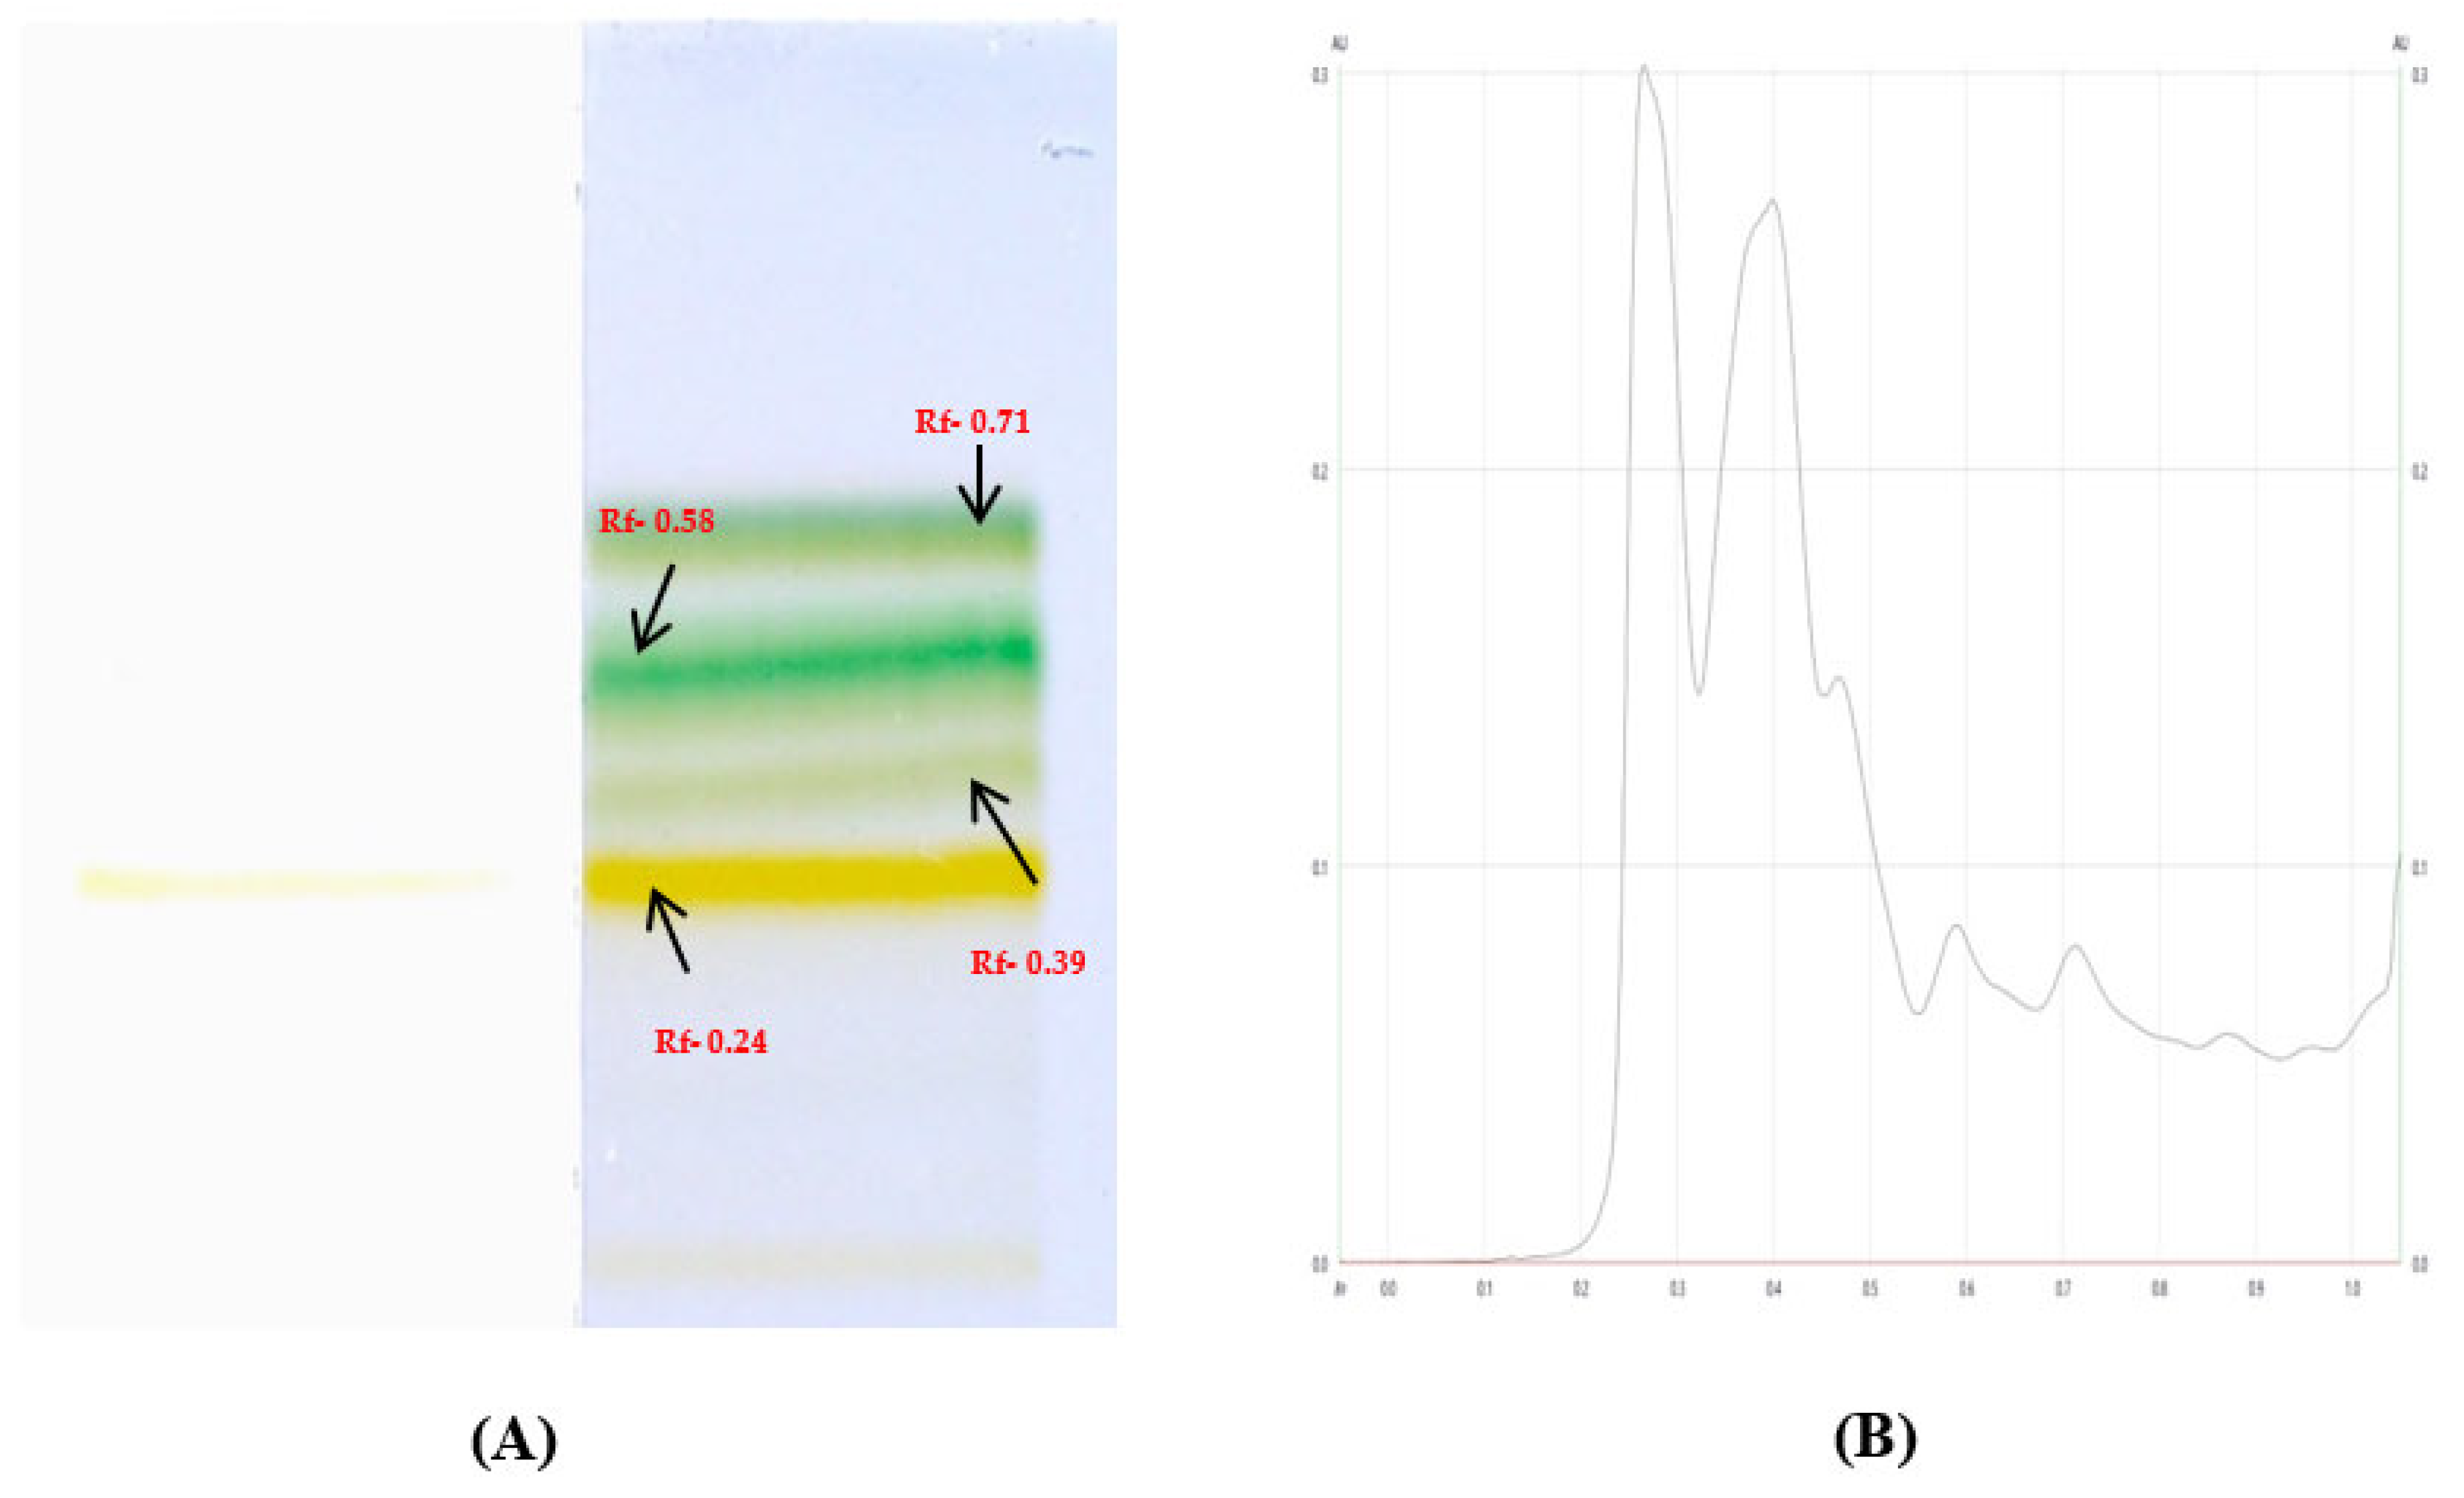
Figure 5.
2D and 3D representation of the highest-ranked molecule in docking analysis, where a and b represent interaction of thiamine with alpha-glucosidase, c and d represents interaction of quercetin with pancreatic lipase and e and f represents interaction of quercetin with alpha amylase.
Figure 5.
2D and 3D representation of the highest-ranked molecule in docking analysis, where a and b represent interaction of thiamine with alpha-glucosidase, c and d represents interaction of quercetin with pancreatic lipase and e and f represents interaction of quercetin with alpha amylase.
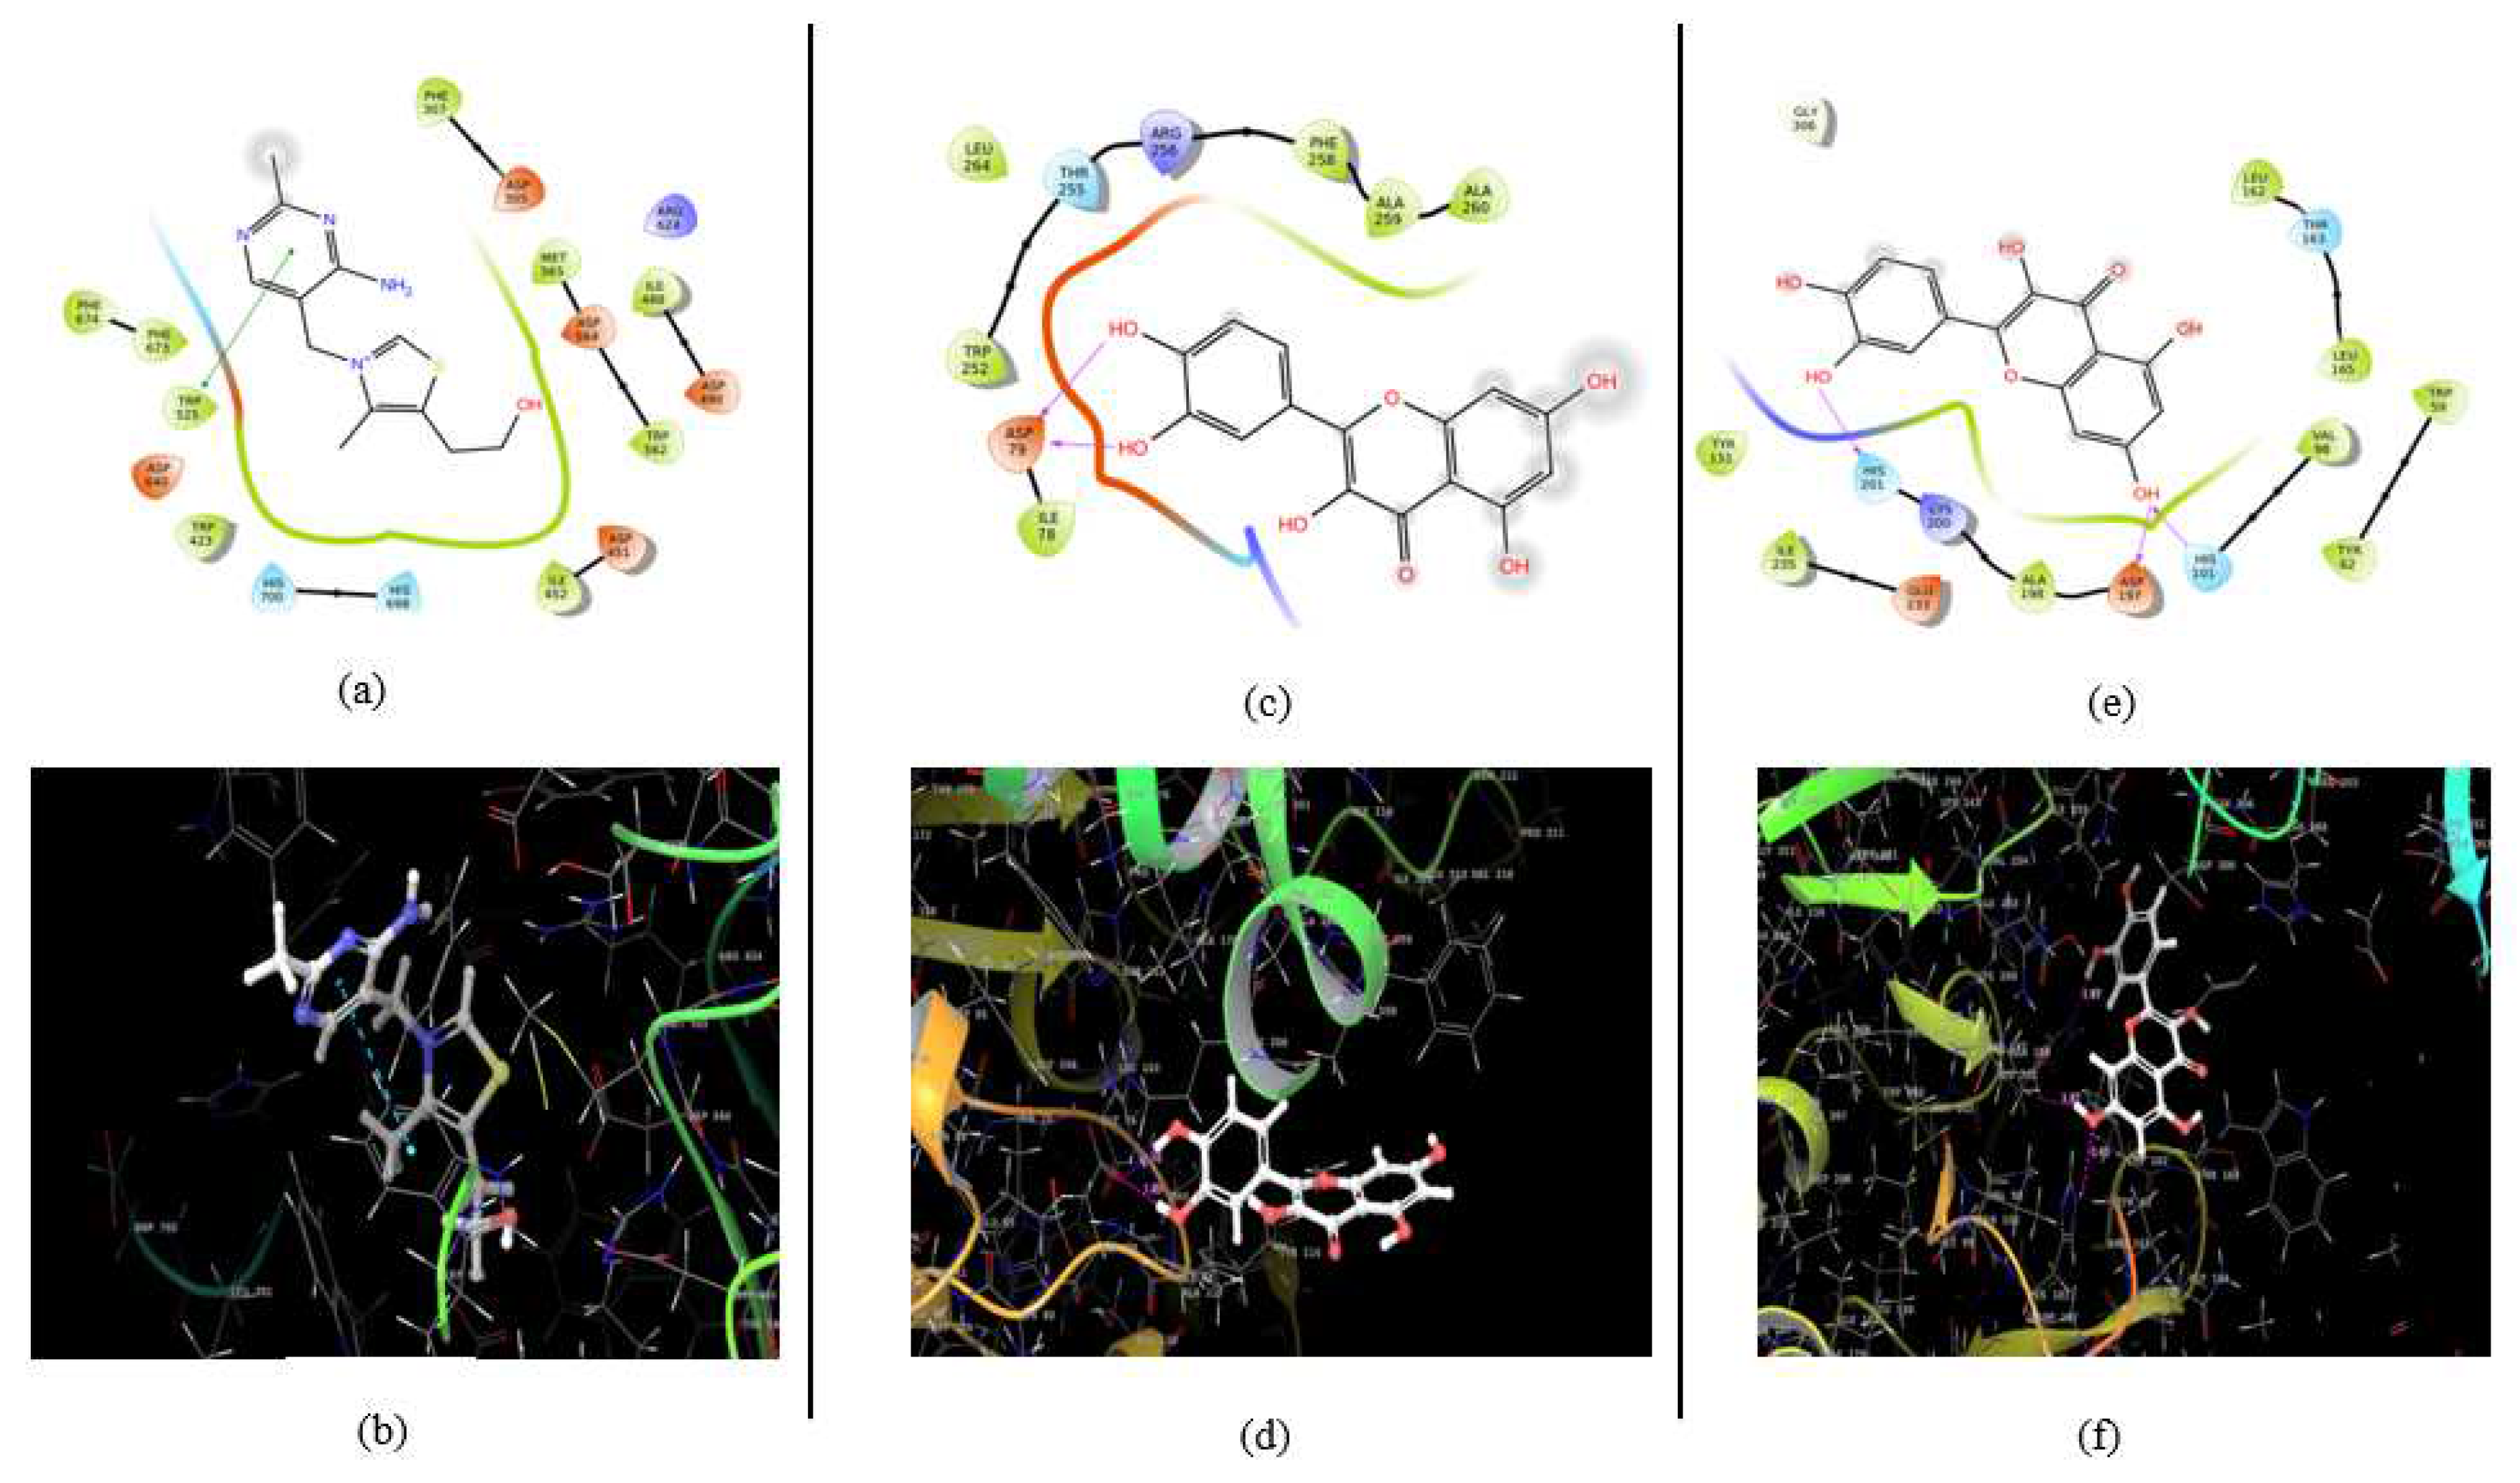
Figure 6.
Root Mean Square Deviation (RMSD) graph of (a) Quercetin-pancreatic lipase (complex a), (b) Quercetin-Human pancreatic alpha-amylase (complex b), and (c) Thiamine-alpha glucosidase (complex c).
Figure 6.
Root Mean Square Deviation (RMSD) graph of (a) Quercetin-pancreatic lipase (complex a), (b) Quercetin-Human pancreatic alpha-amylase (complex b), and (c) Thiamine-alpha glucosidase (complex c).
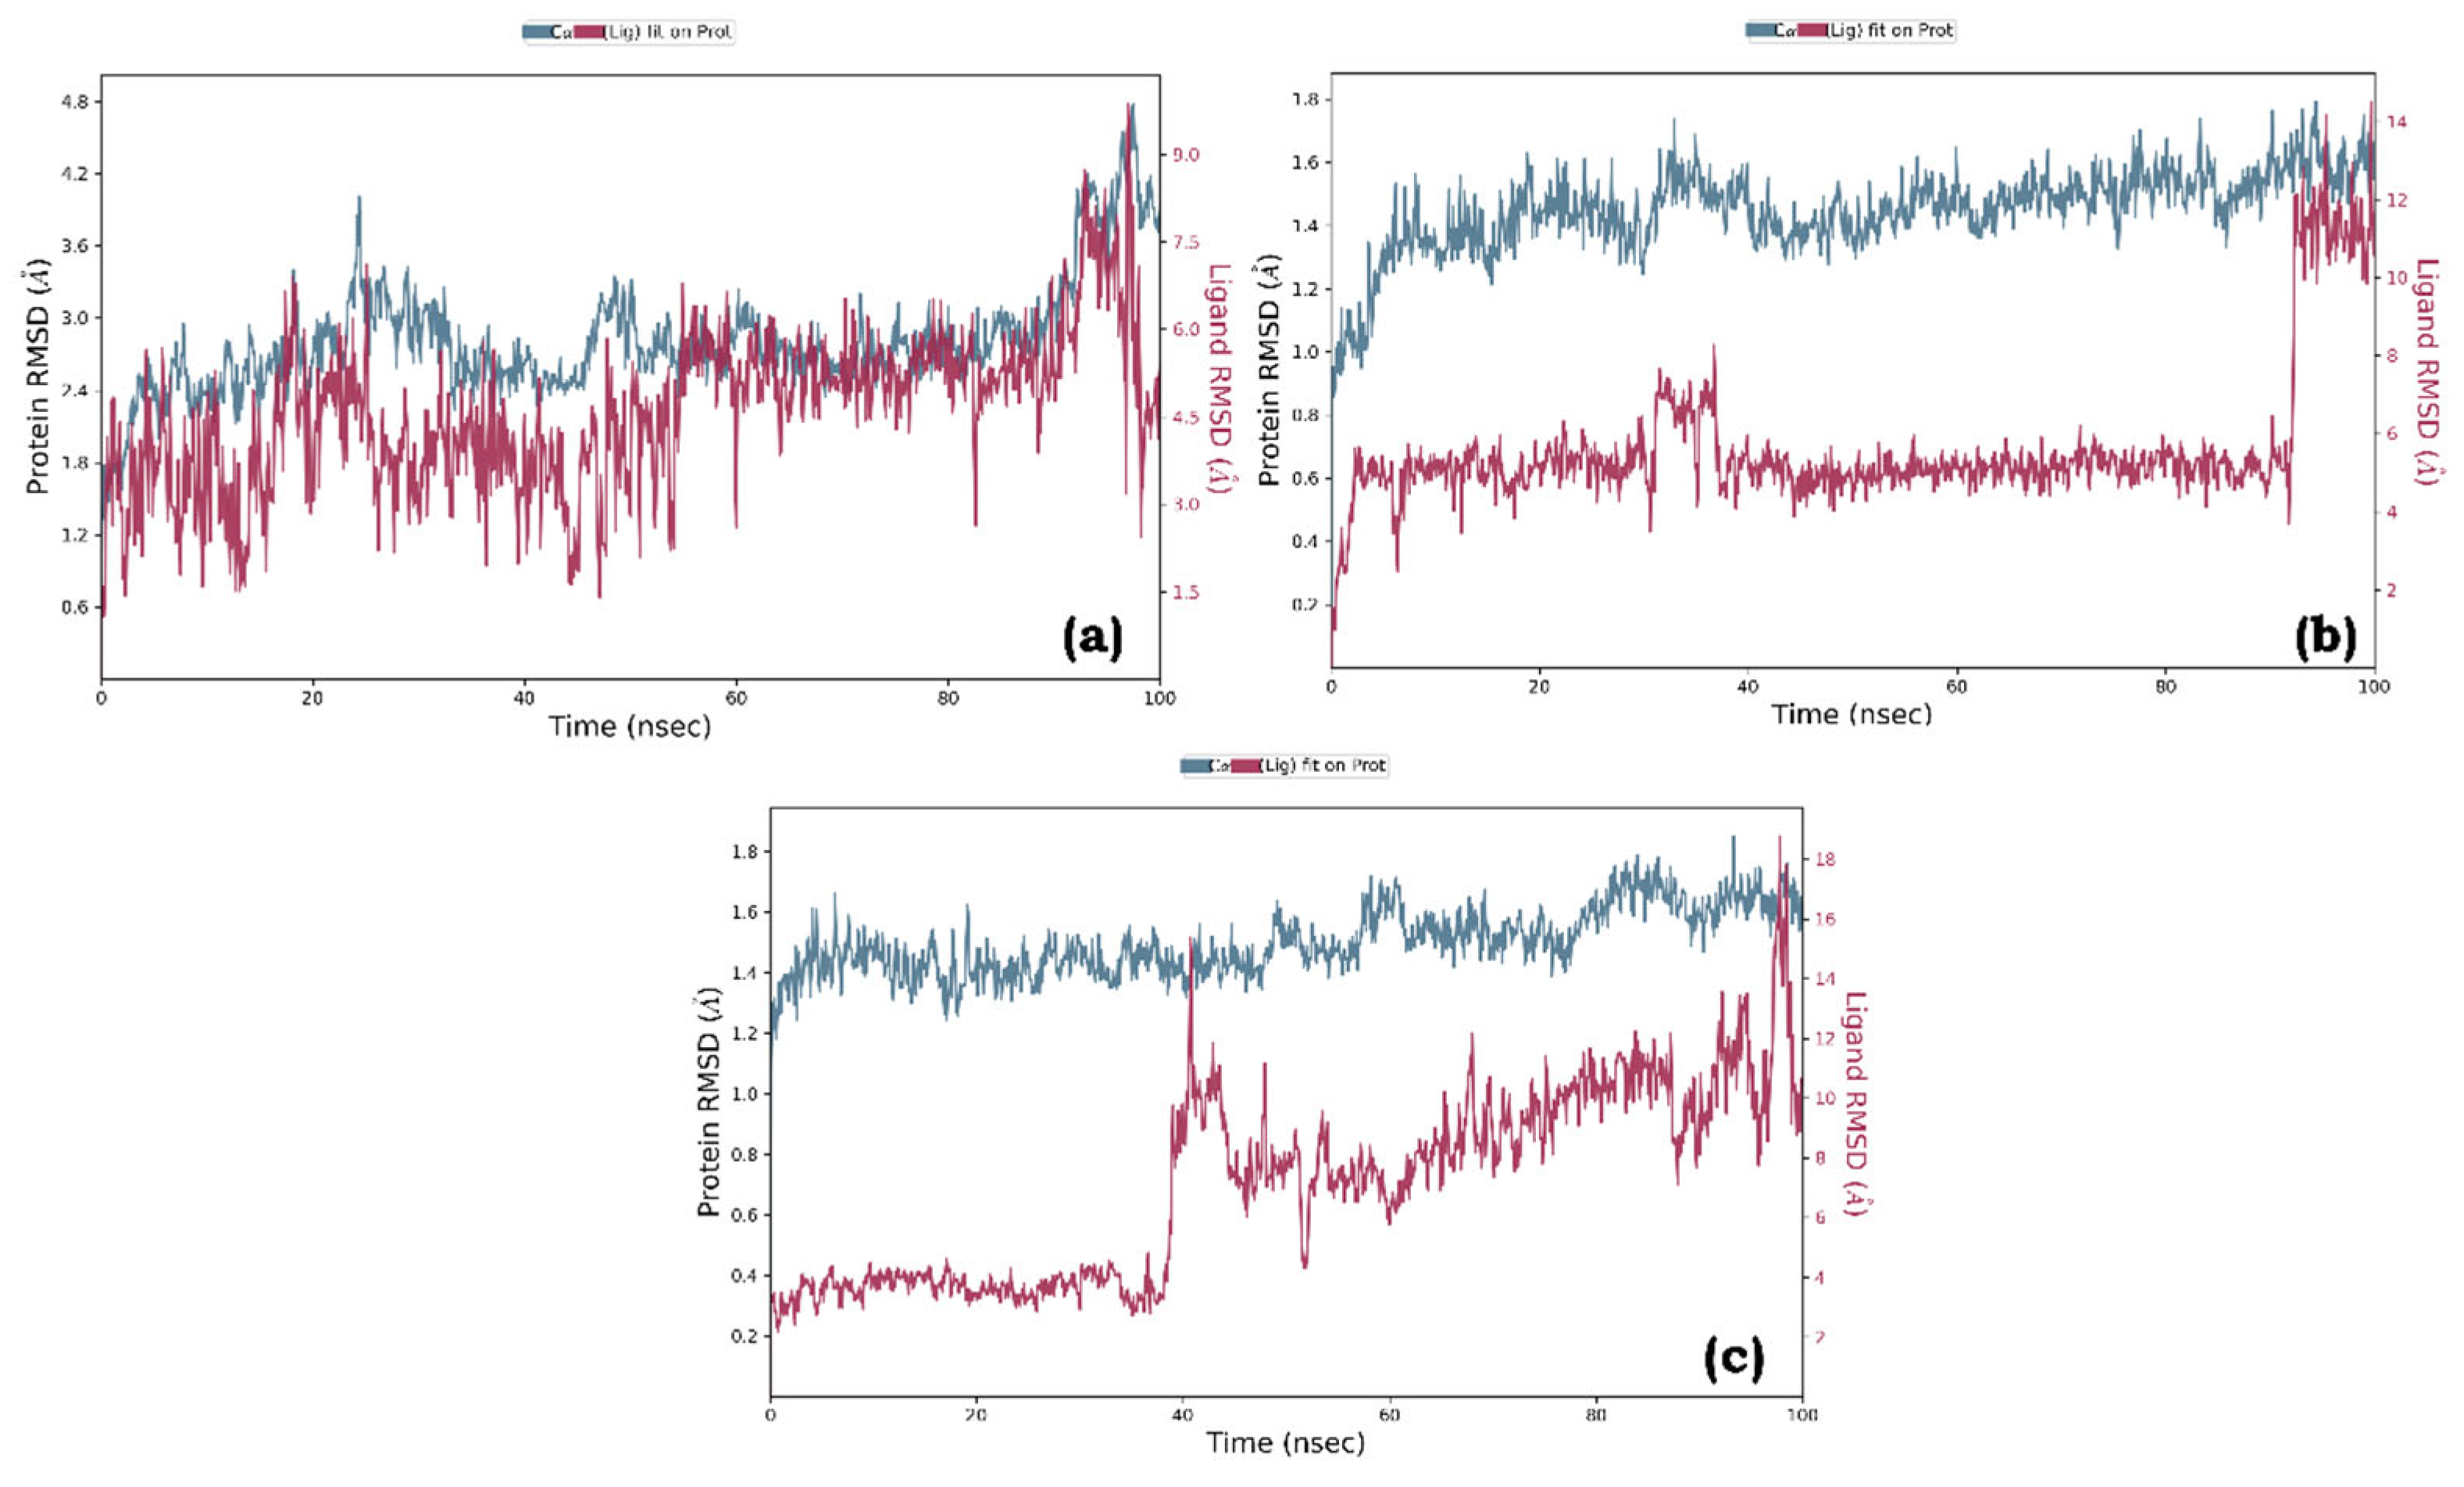
Figure 7.
Root Mean Square Fluctuation (RMSF) graph of graph of (a) Quercetin-pancreatic lipase (complex a), (b) Quercetin-Human pancreatic alpha-amylase (complex b), and (c) Thiamine-alpha glucosidase (complex c).
Figure 7.
Root Mean Square Fluctuation (RMSF) graph of graph of (a) Quercetin-pancreatic lipase (complex a), (b) Quercetin-Human pancreatic alpha-amylase (complex b), and (c) Thiamine-alpha glucosidase (complex c).
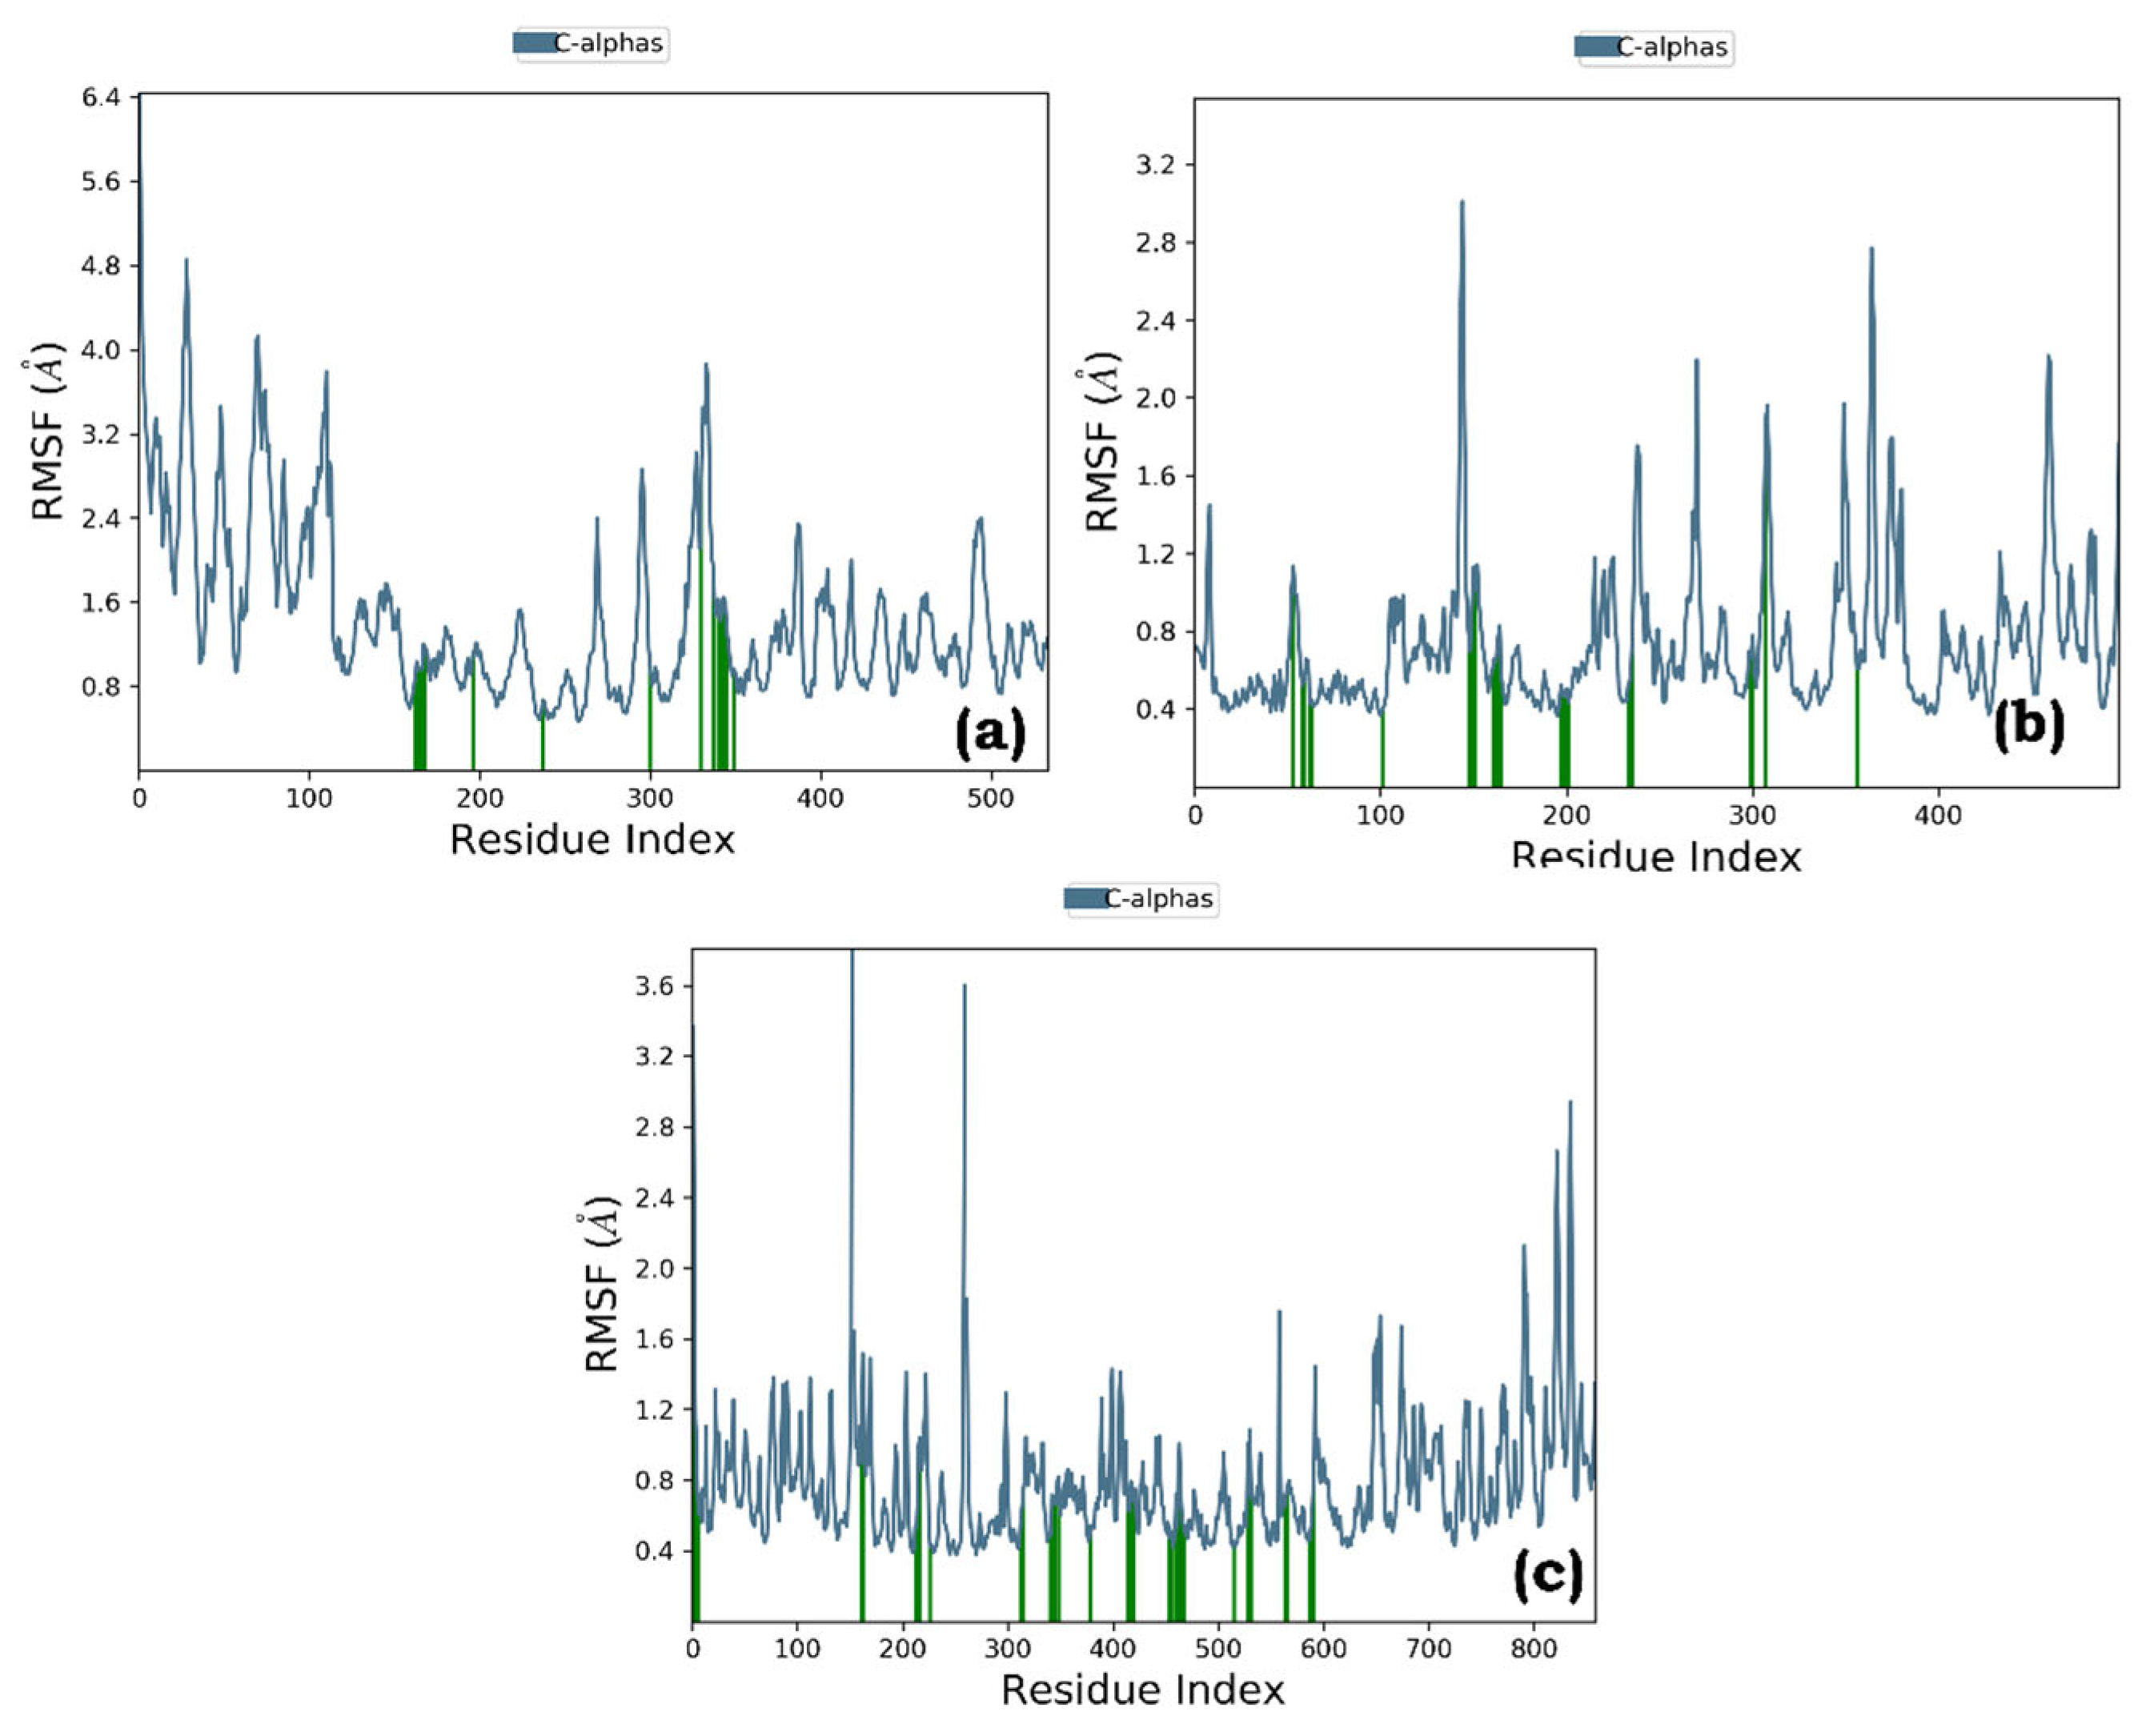
Figure 8.
Plot (stacked bar charts) of protein interactions with the ligand supervised throughout Molecular dynamics simulation of graph of (a) Quercetin-pancreatic lipase (complex a), (b) Quercetin-Human pancreatic alpha-amylase (complex b), and (c) Thiamine-alpha glucosidase (complex c).
Figure 8.
Plot (stacked bar charts) of protein interactions with the ligand supervised throughout Molecular dynamics simulation of graph of (a) Quercetin-pancreatic lipase (complex a), (b) Quercetin-Human pancreatic alpha-amylase (complex b), and (c) Thiamine-alpha glucosidase (complex c).
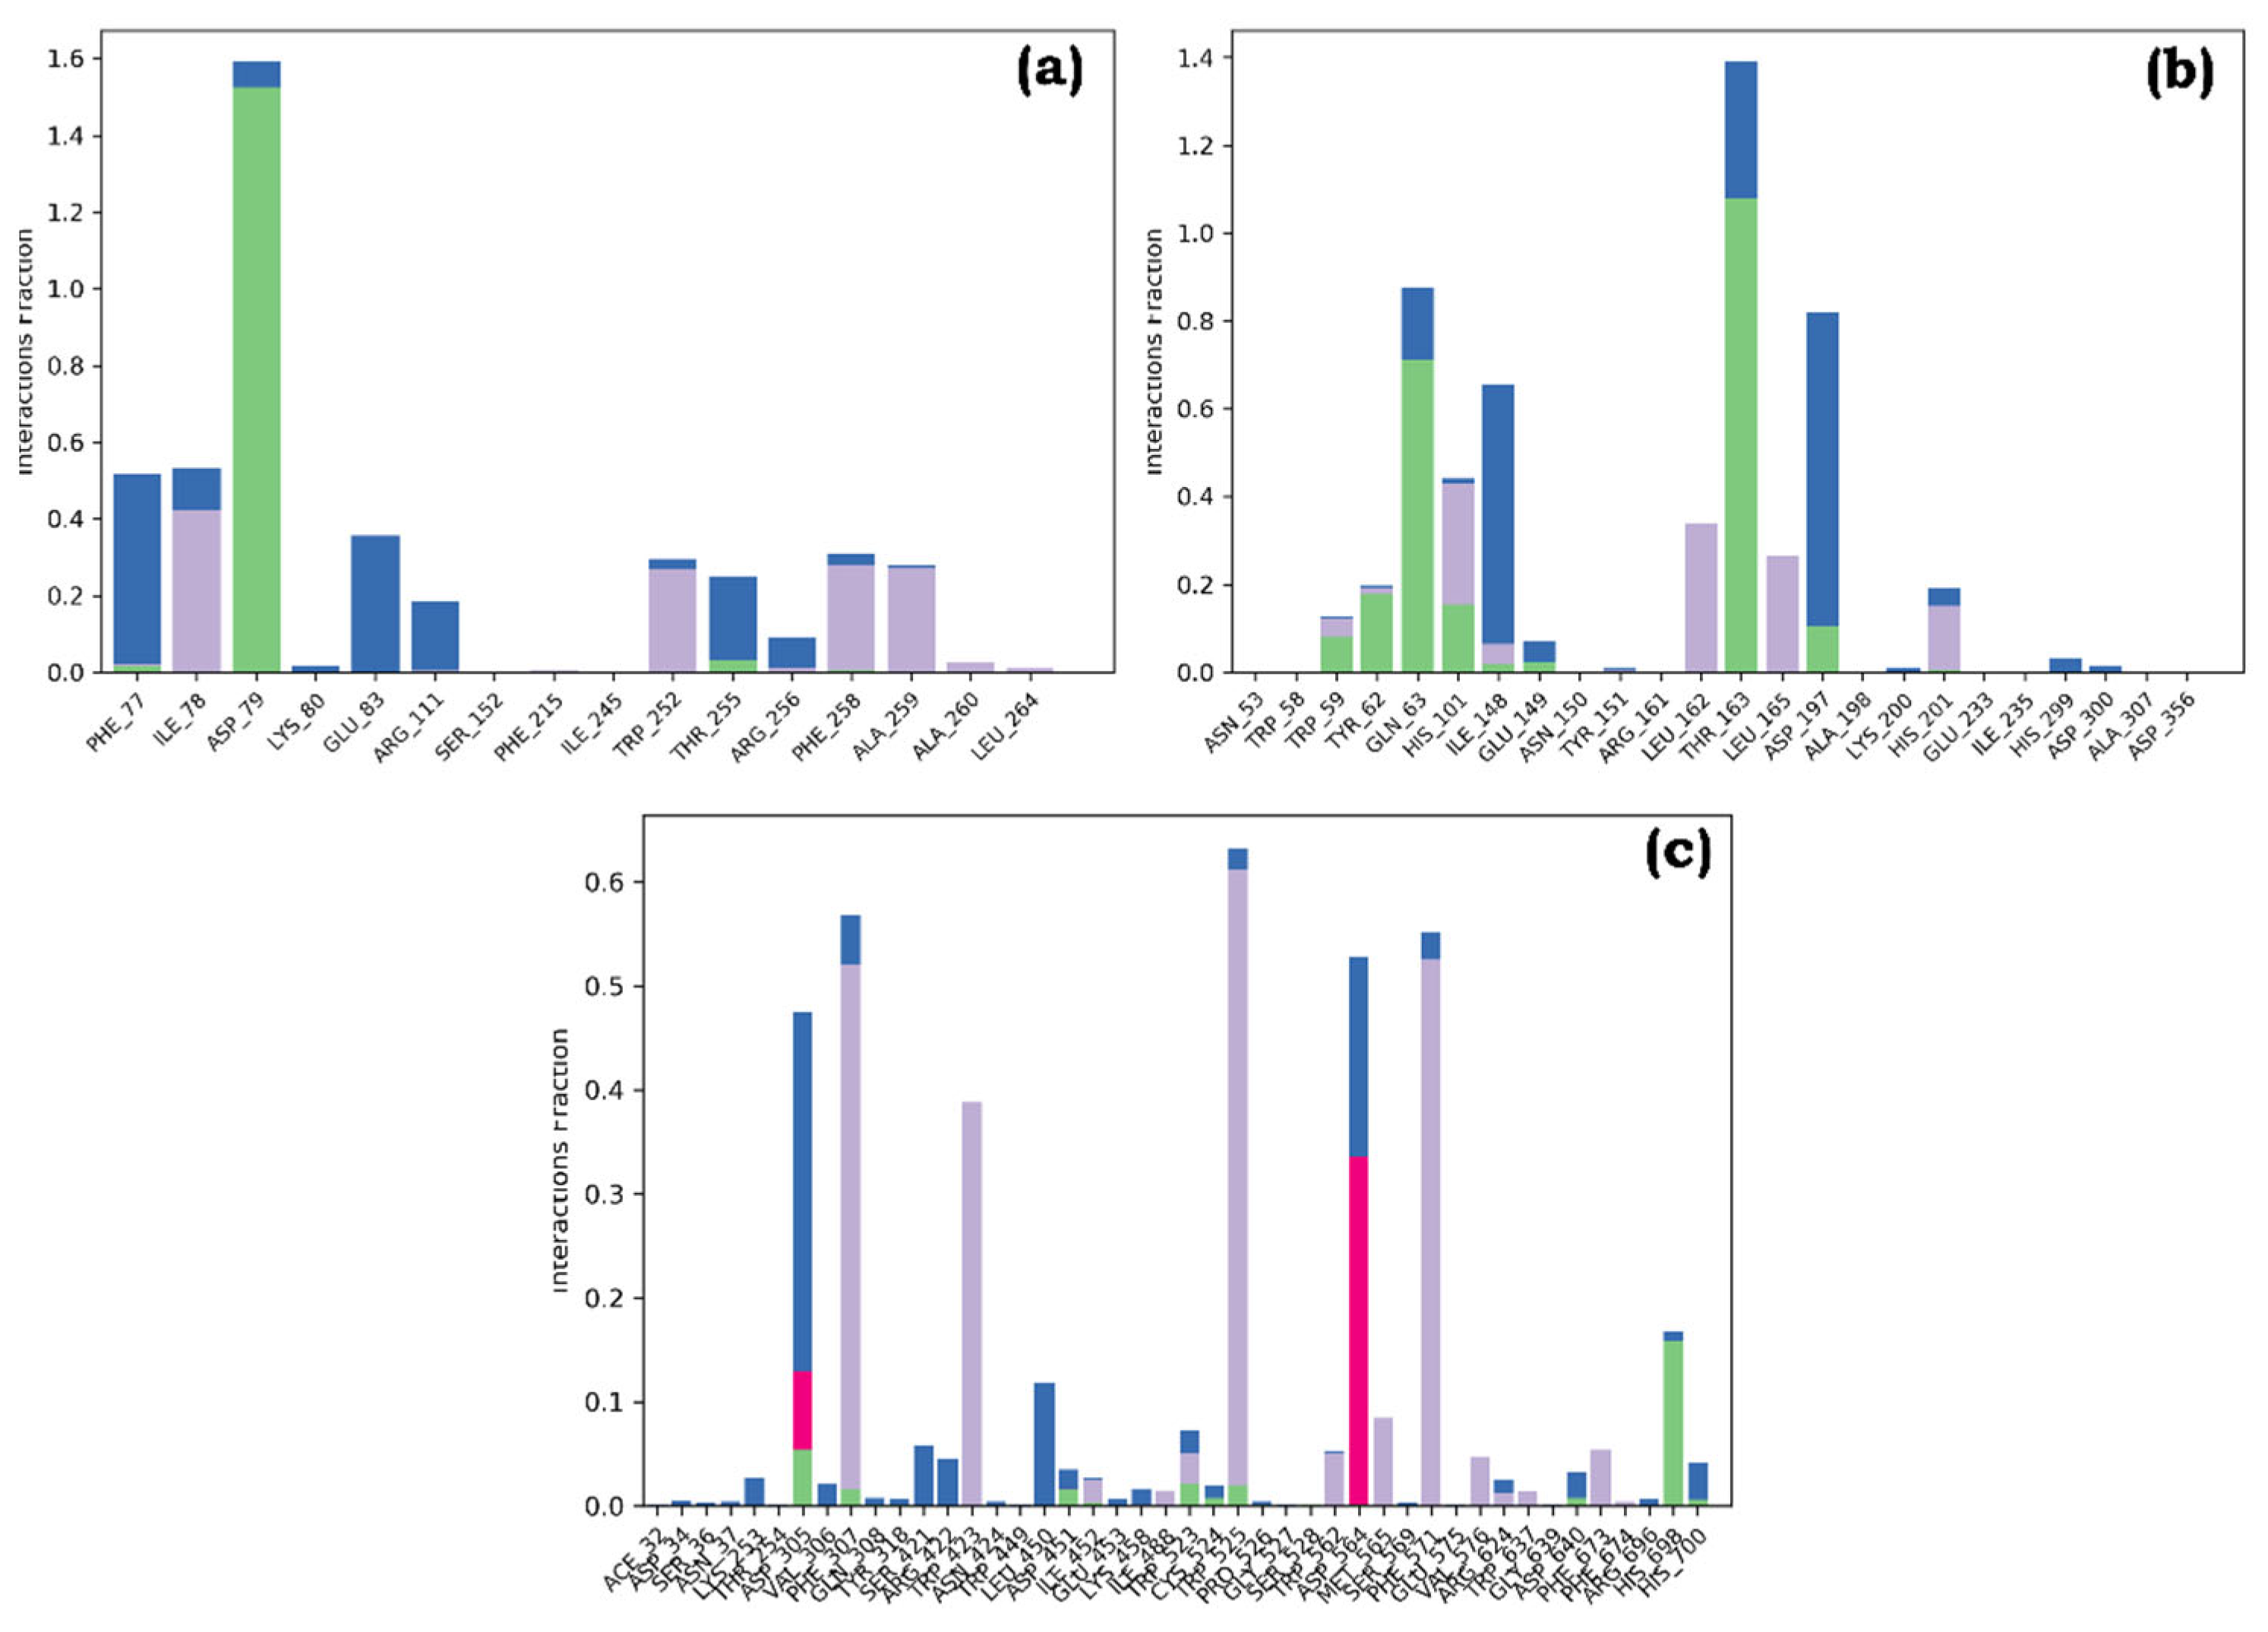
Figure 9.
Specific contacts made by the Protein with the graph of (a) Quercetin bound to the active site of pancreatic lipase (complex a), (b) Quercetin-Human pancreatic alpha-amylase (complex b), and (c) Thiamine-alpha glucosidase (complex c).
Figure 9.
Specific contacts made by the Protein with the graph of (a) Quercetin bound to the active site of pancreatic lipase (complex a), (b) Quercetin-Human pancreatic alpha-amylase (complex b), and (c) Thiamine-alpha glucosidase (complex c).
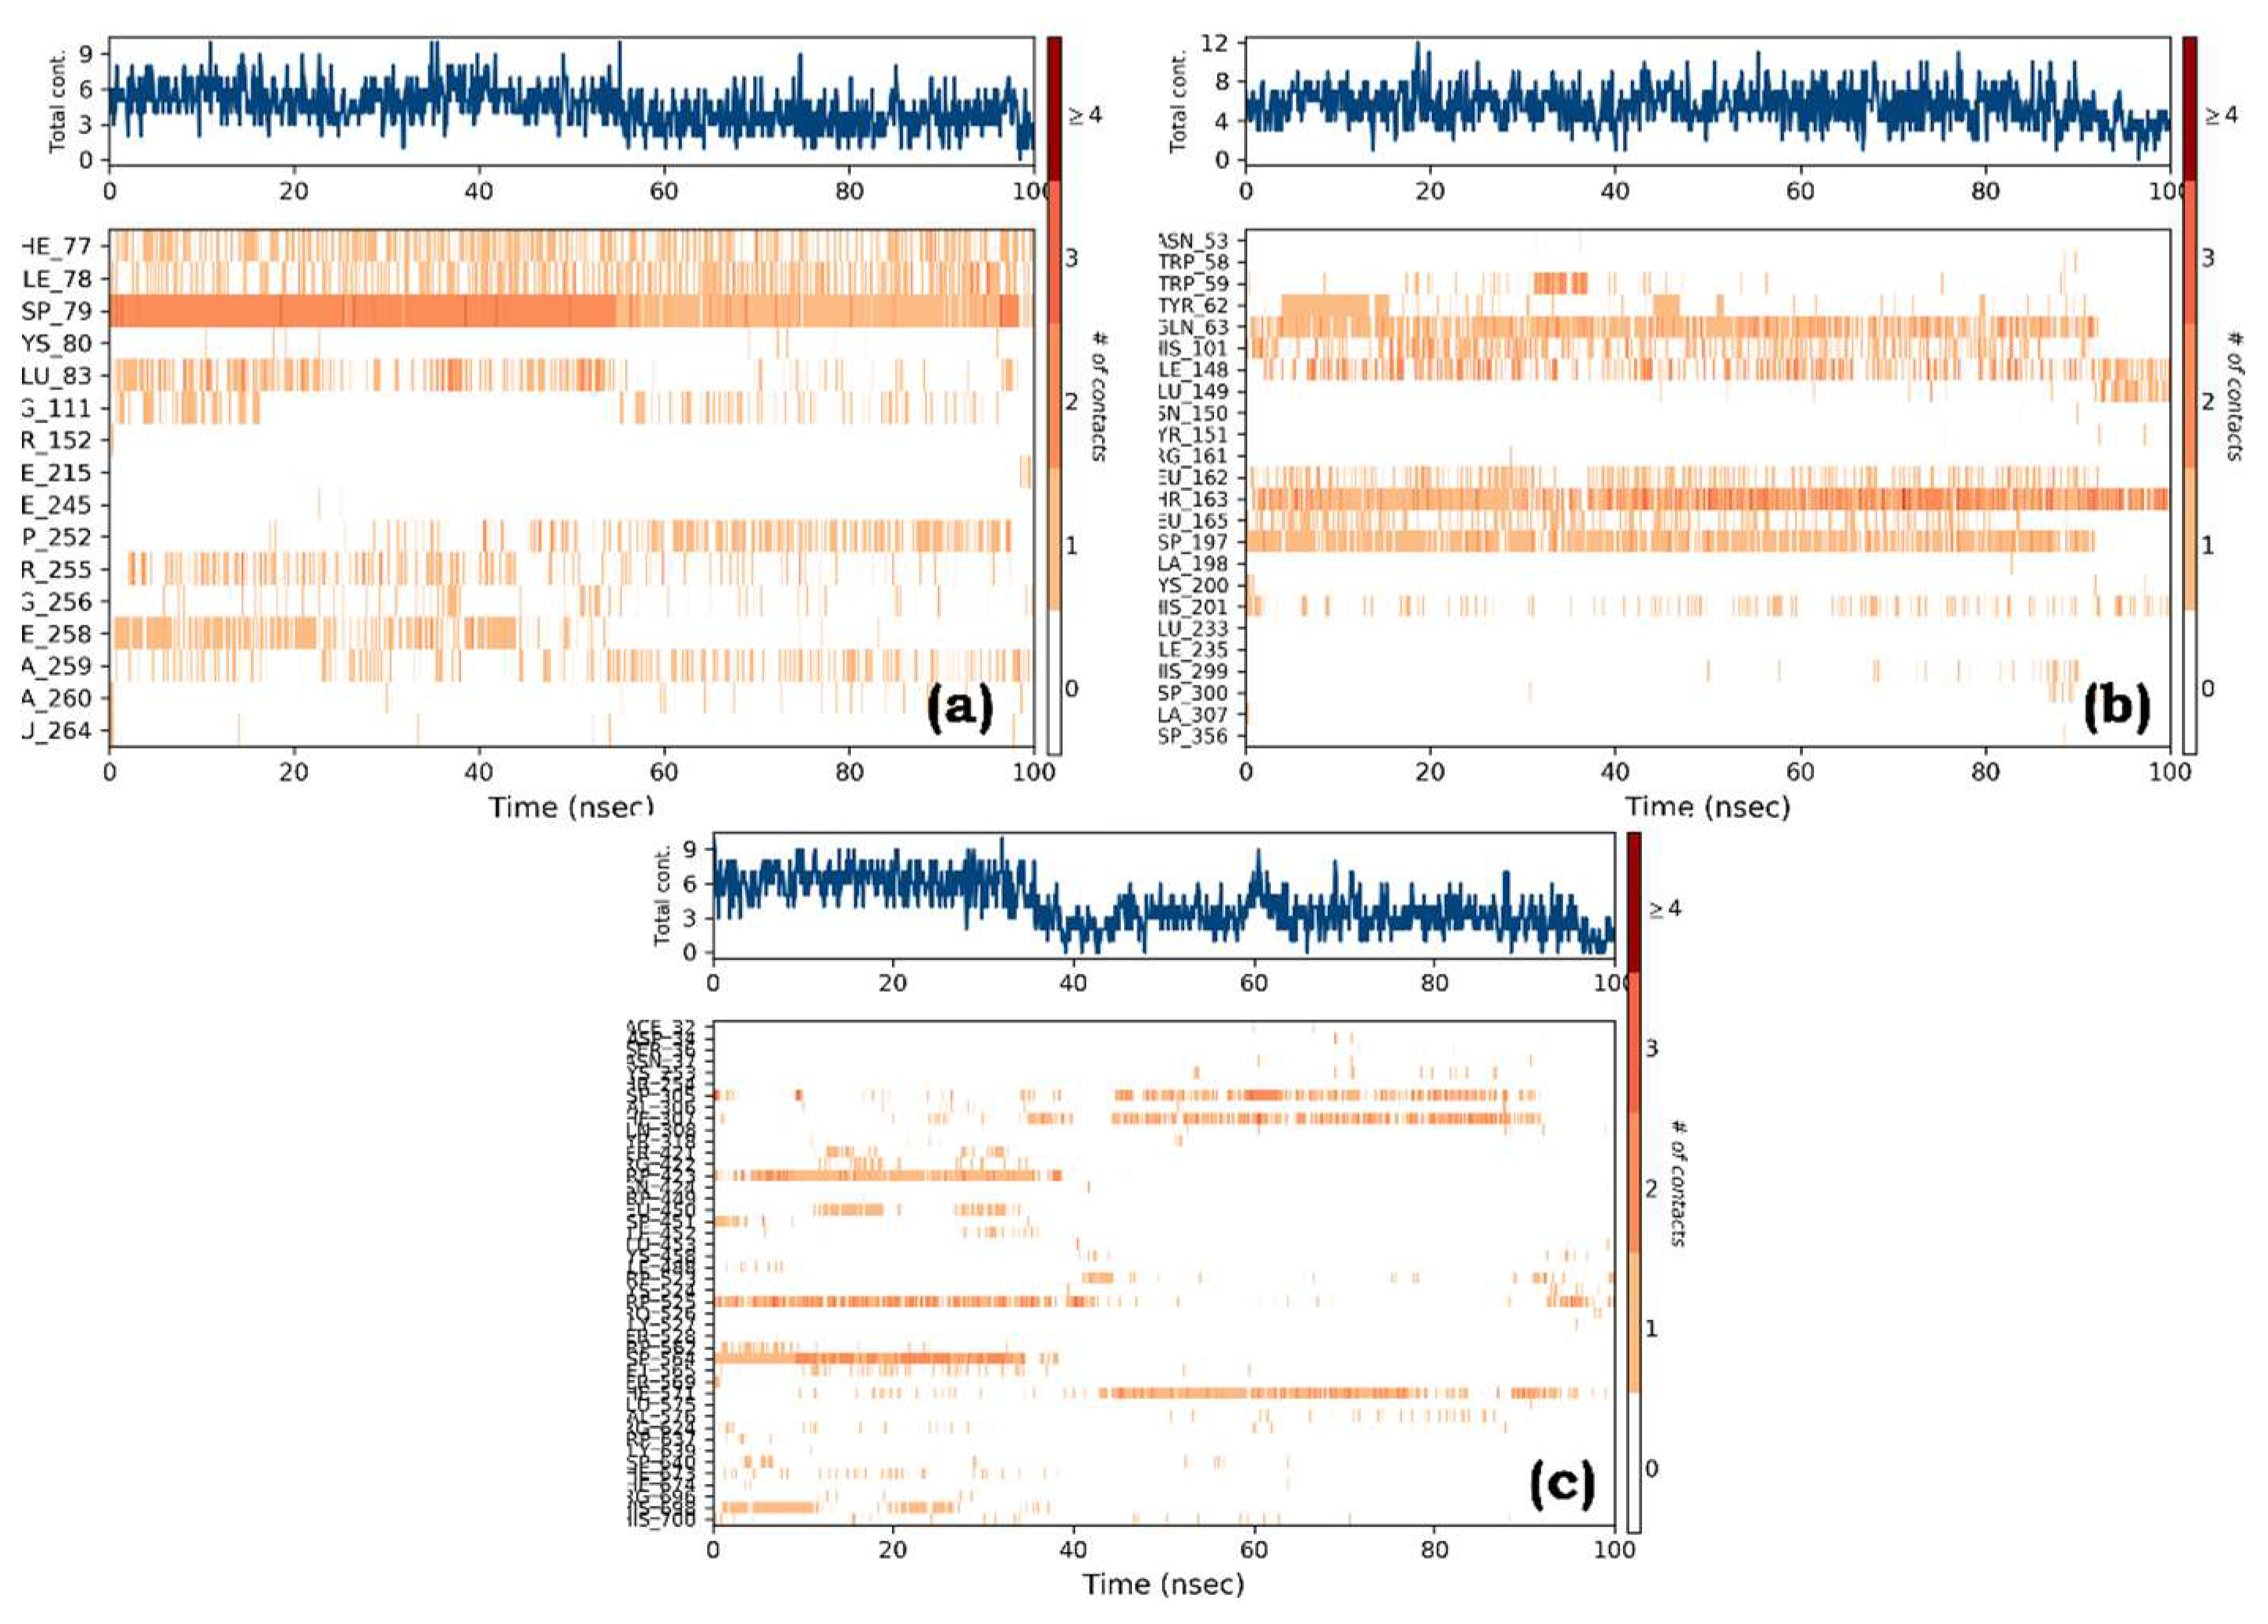
Figure 10.
A schematic representation of detailed ligand atom interactions graph of (a) Quercetin-pancreatic lipase (complex a), (b) Quercetin-Human pancreatic alpha-amylase (complex b), and (c) Thiamine-alpha glucosidase (complex c).
Figure 10.
A schematic representation of detailed ligand atom interactions graph of (a) Quercetin-pancreatic lipase (complex a), (b) Quercetin-Human pancreatic alpha-amylase (complex b), and (c) Thiamine-alpha glucosidase (complex c).
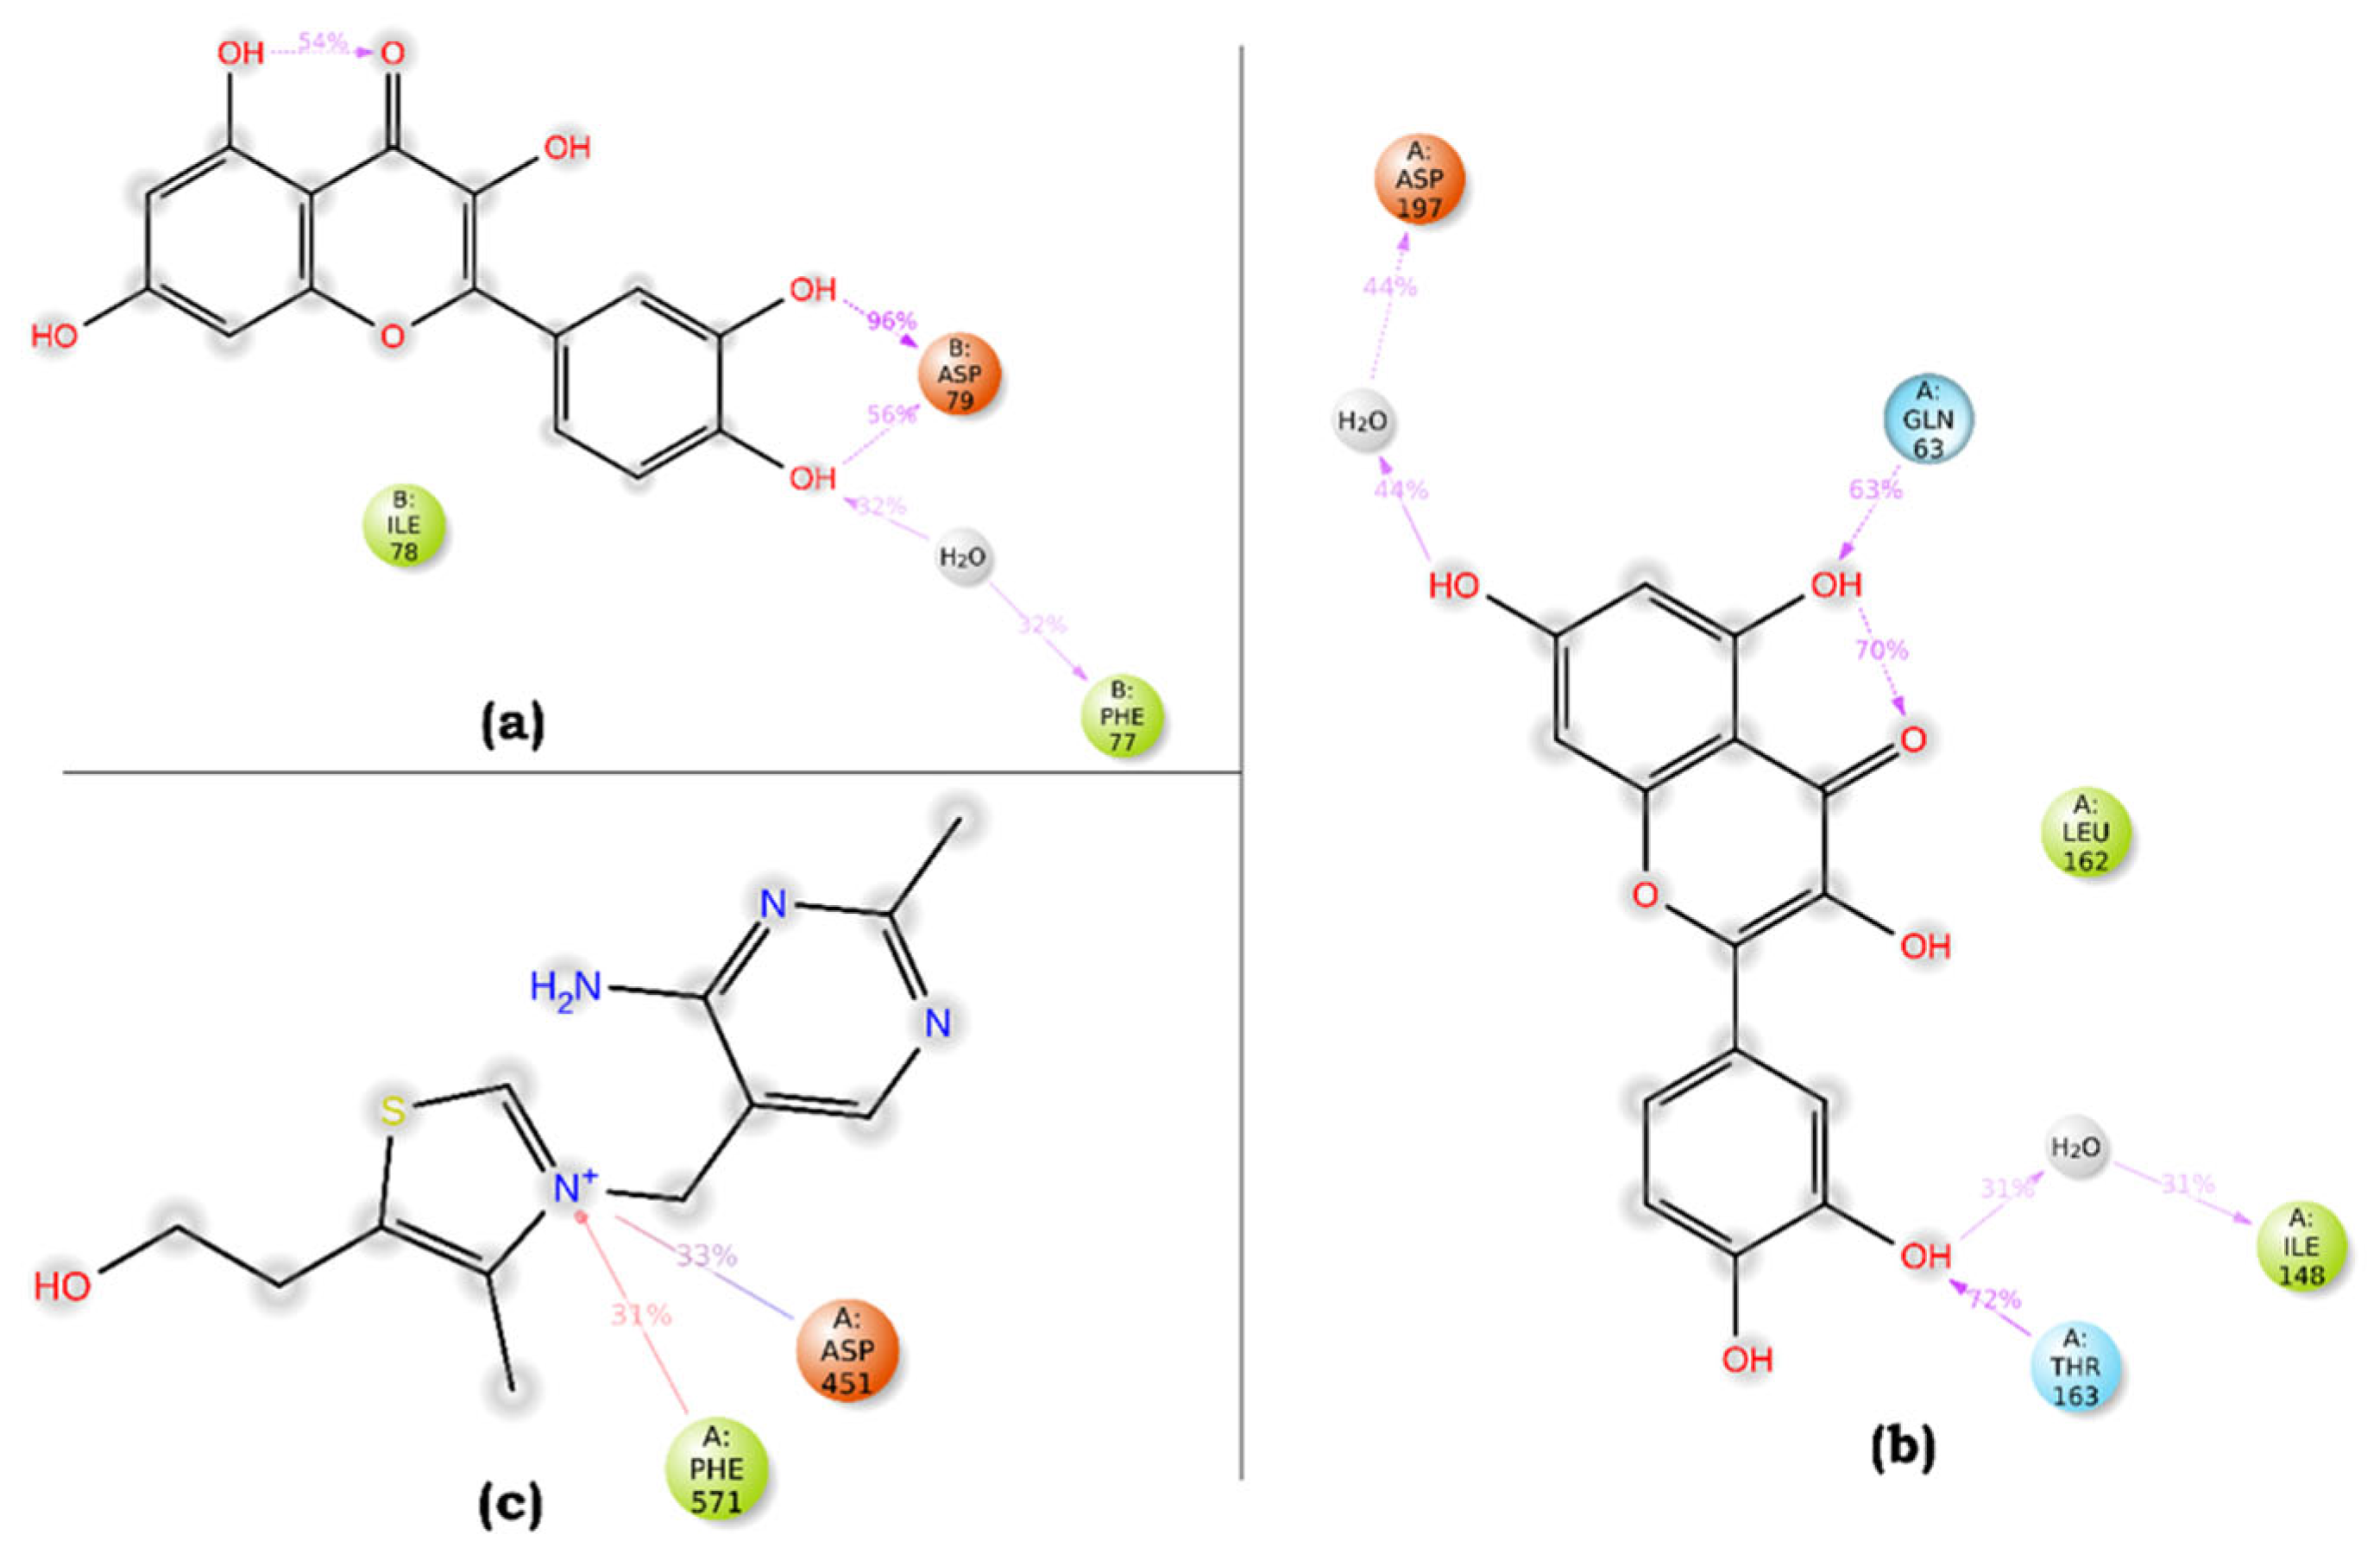

Table 1.
The IC50 value of antioxidant activity of the different bioactive fractions using Nitric oxide assay, ABTS assay, DPPH assay and Hydrogen peroxide assay.
Table 1.
The IC50 value of antioxidant activity of the different bioactive fractions using Nitric oxide assay, ABTS assay, DPPH assay and Hydrogen peroxide assay.
| Samples | ABTS Assay |
DPPH Assay |
Hydrogen peroxide Assay | Nitric oxide Assay |
| Fraction1 | 1.41±0.25 | 1.17±0.08 | 1.61±0.25 | 1.47±0.21 |
| Fraction 2 | 1.11±0.26 | 1.84±0.05 | 1.37±0.23 | 1.38±0.03 |
| Fraction 3 | 3.19±0.22 | 2.8±0.15 | 3.99±0.22 | 3.08±0.28 |
| Fraction 4 | 2.21±0.31 | 3.57±0.13 | 4.92±0.21 | 2.58±0.25 |
| Ascorbic acid | 1.05±0.12 | 0.97±0.21 | 1.59±0.25 | 0.76±0.29 |
Enzyme inhibition assay (IC50 µg/ml) of bioactive guided fractions were represented as mean± SEM (n=3).
Table 2.
Enzyme inhibition assay of the different bioactive fractions using pancreatic lipase, Alpha glucosidase and Alpha amylase activity.
Table 2.
Enzyme inhibition assay of the different bioactive fractions using pancreatic lipase, Alpha glucosidase and Alpha amylase activity.
| Samples | Pancreatic Lipase assay |
Alpha amylase assay |
Alpha glucosidase assay |
| Fraction 1 | 2.20±0.23 | 1.24±0.03 | 1.12±0.25 |
| Fraction 2 | 1.23±0.08 | 1.87±0.02 | 1.17±0.37 |
| Fraction 3 | 4.07±0.28 | 4.25±0.12 | 4.21±0.13 |
| Fraction 4 | 3.99±0.26 | 3.89±0.21 | 4.01±0.28 |
| Orlistat | 2.12±0.17 | ---------- | -------- |
| Acarbose | ------- | 0.68±0.17 | 0.92±0.17 |
Enzyme inhibition assay (IC50 µg/ml) of bioactive guided fractions were represented as mean± SEM (n=3).
Table 3.
Effect of fraction F2 and F3 on changes in Body weight of different groups of mice.
| Days | Normal group (Weight in grams) |
Obese group (Weight in grams) |
Standard (orlistat) (Weight in grams) |
(Fraction 1) 80 mg/kg/bw (Weight in grams) |
(Fraction 2) 80 mg/kg/bw (Weight in grams) |
| 1st | 25.21±0.26 | 55.65±0.18*** | 54.15±0.2 | 55.12±0.03 | 54.12±0.21 |
| 7th | 26.23±0.26 | 57.12±0.16*** | 48.32±0.3 a | 49.14±0.02 | 48.21±0.12 |
| 14th | 25.38±0.57 | 56.23±0.18*** | 46.54±0.06 b | 45.21±0.03 | 42.07±0.19 |
| 21st | 26.93±0.26 | 55.74±0.16*** | 39.00±0.23 c | 420.03±0.08 | 35.09±0.12 |
| 28th | 28.21±0.18 | 55.00±0.23*** | 31.21±0.32c | 38.02±0.06 | 31.17±0.22 |
All values are expressed in Mean±SEM; n=5. *p<0.05, **p<0.01, ***p<0.001 when obese control group compared to normal control group whereas All values are expressed in Mean±SEM; n=5. (a) p<0.05, (b) p<0.01, (c) p<0.001 when compared to obese control group with test and standard treated groups. (one-way ANOVA followed by Dunnett’s test).
Table 4.
Effect of fraction F2 and F3 on changes in Waist hip ratio in different groups of mice.
| Days | Normal group | Obese group | Standard | (Fraction 1) 80 mg/kg/bw |
(Fraction 2) 80 mg/kg/bw |
| 1st | 0.4 ± 0.02 | 1.4 ±0.05** | 1.4 ±0.011 | 1.4 ±0.023 | 1.4 ±0.012 |
| 7th | 0.5.±0.05 | 1.3 ±0.020** | 1.3 ±0.010 | 1.3 ±0.003 | 1.2 ±0.009 |
| 14th | 0.4.±0.04 | 1.4 ±0.03** | 1.2 ±0.003 a | 1.1 ±0.016 | 1.2 ±0.012 a |
| 21st | 0.5.±0.08 | 1.3 ±0.01** | 0.9 ±0.080 a | 1.0 ±0.020 a | 0.9 ±0.003 b |
| 28th | 0.4 ±0.07 | 1.4 ±0.05** | 0.7 ±0.030 b | 0.8 ±0.240 b | 0.8 ±0.011 c |
All values are expressed in Mean±SEM; n=5. *p<0.05, **p<0.01, ***p<0.001 when obese control group compared to normal control group whereas All values are expressed in Mean±SEM; n=5. (a) p<0.05, (b) p<0.01, (c) p<0.001 when compared to obese control group with test and standard treated groups. (one-way ANOVA followed by Dunnett’s test).
Table 5.
Effect of fraction F1 and F2 on biochemical parameters of different groups of mice.
| Parameters measured | Normal group | Obese group | Standard | (Fraction 1) 80 mg/kg/bw |
(Fraction 2) 80 mg/kg/bw |
| Serum cholesterol (mg/dl) |
87±0.06 | 208±0.16 *** | 115±0.10c | 131±0.06 b | 113±0.01 c |
| Serum triglyceride (m mol/L) |
47±0.03 | 121±0.21*** | 95±0.14 b | 107±0.03 | 95±0.02 b |
| HDL Cholesterol (mg/dl) | 68±0.02 | 48±0.14*** | 51±0.11 c | 61±0.01 c | 59±0.03 c |
| VLDL cholesterol (mg/dl) | 8.1±0.06 | 28±0.13** | 16.21±0.08a | 21.01±0.09 | 20.2±0.07 a |
| LDL Cholesterol (mg/dl) | 14±0.03 | 65±0.21*** | 35.08±0.06 b | 51.27±0.06 | 39.27±0.01 b |
| Cholesterol/HDL ratio (mg/dl) |
1.27±0.01 | 4.33±0.02* | 2.25±0.1 a | 2.14±0.03 a | 1.91 ±0.03 |
| LDL/HDL ratio (mg/dl) |
0.20±0.01 | 1.35±0.1 *** | 0.68±0.02 b | 0.83±0.01 a | 0.66±0.01 b |
(All values are expressed in Mean±SEM; n=5. *p<0.05, **p<0.01, ***p<0.001 when obese control group compared to normal control group whereas All values are expressed in Mean±SEM; n=5. (a) p<0.05, (b) p<0.01, (c) p<0.001 when compared to obese control group with test and standard treated groups. (one-way ANOVA followed by Dunnett’s test).
Table 6.
Compounds tentatively identified in fraction 2 with their (m/z) peak and Retro Diels-Alder fragmentation (ESI- MS-MS) analysis.
Table 6.
Compounds tentatively identified in fraction 2 with their (m/z) peak and Retro Diels-Alder fragmentation (ESI- MS-MS) analysis.
| Compounds | Molecular mass | Found ion (m/z+) | Found ion (m/z-) | Found ion [m/z- H2O] | RF value |
| β-sitosterol | 414 | MS1-397;MS2-265:243:203;MS3-187:147:135 and MS4-144:130:109 | 0.71 | ||
| Stigmasterol | 412 | MS1-395; MS2-297:267:255;MS3-241:201:187:149;MS4-173 and MS5-158 |
0.58 | ||
| Thiamine | 265 | MS1-266 MS2 -156:144:121:1090. |
0.39 | ||
| Quercetin | 302 | MS1-301; MS2-179:151 and MS3-150 | 0.24 |
Table 7.
Tabular representation of binding affinities of the ligands with the selected proteins(receptors) under study.
Table 7.
Tabular representation of binding affinities of the ligands with the selected proteins(receptors) under study.
| Pancreatic lipase (PDB ID- 1LPB) | Alpha amylase (PDB ID- 4W93) | Alpha glucosidase (PDB ID- 7K9N) | ||||
| Compounds | Glide score (Kcal/mol) | Glide Energy | Glide score (Kcal/mol) | Glide Energy | Glide score (Kcal/mol) | Glide Energy |
| Quercetin | -4.96 | -29.26 | -8.15 | -40.55 | -3.83 | -25.13 |
| Stigmasterol | -4.86 | -20.95 | -4.29 | -29.83 | -5.42 | -15.30 |
| Sitosterol | -3.80 | -19.62 | -4.05 | -27.64 | -5.78 | -22.08 |
| Thiamine | -3.80 | -27.99 | -4.76 | 53 | -7.17 | -31.53 |
Disclaimer/Publisher’s Note: The statements, opinions and data contained in all publications are solely those of the individual author(s) and contributor(s) and not of MDPI and/or the editor(s). MDPI and/or the editor(s) disclaim responsibility for any injury to people or property resulting from any ideas, methods, instructions or products referred to in the content. |
© 2023 by the authors. Licensee MDPI, Basel, Switzerland. This article is an open access article distributed under the terms and conditions of the Creative Commons Attribution (CC BY) license (http://creativecommons.org/licenses/by/4.0/).
Copyright: This open access article is published under a Creative Commons CC BY 4.0 license, which permit the free download, distribution, and reuse, provided that the author and preprint are cited in any reuse.


