Submitted:
20 July 2023
Posted:
21 July 2023
You are already at the latest version
Abstract
Keywords:
1. Introduction
2. Materials and Methods
2.1. Materials
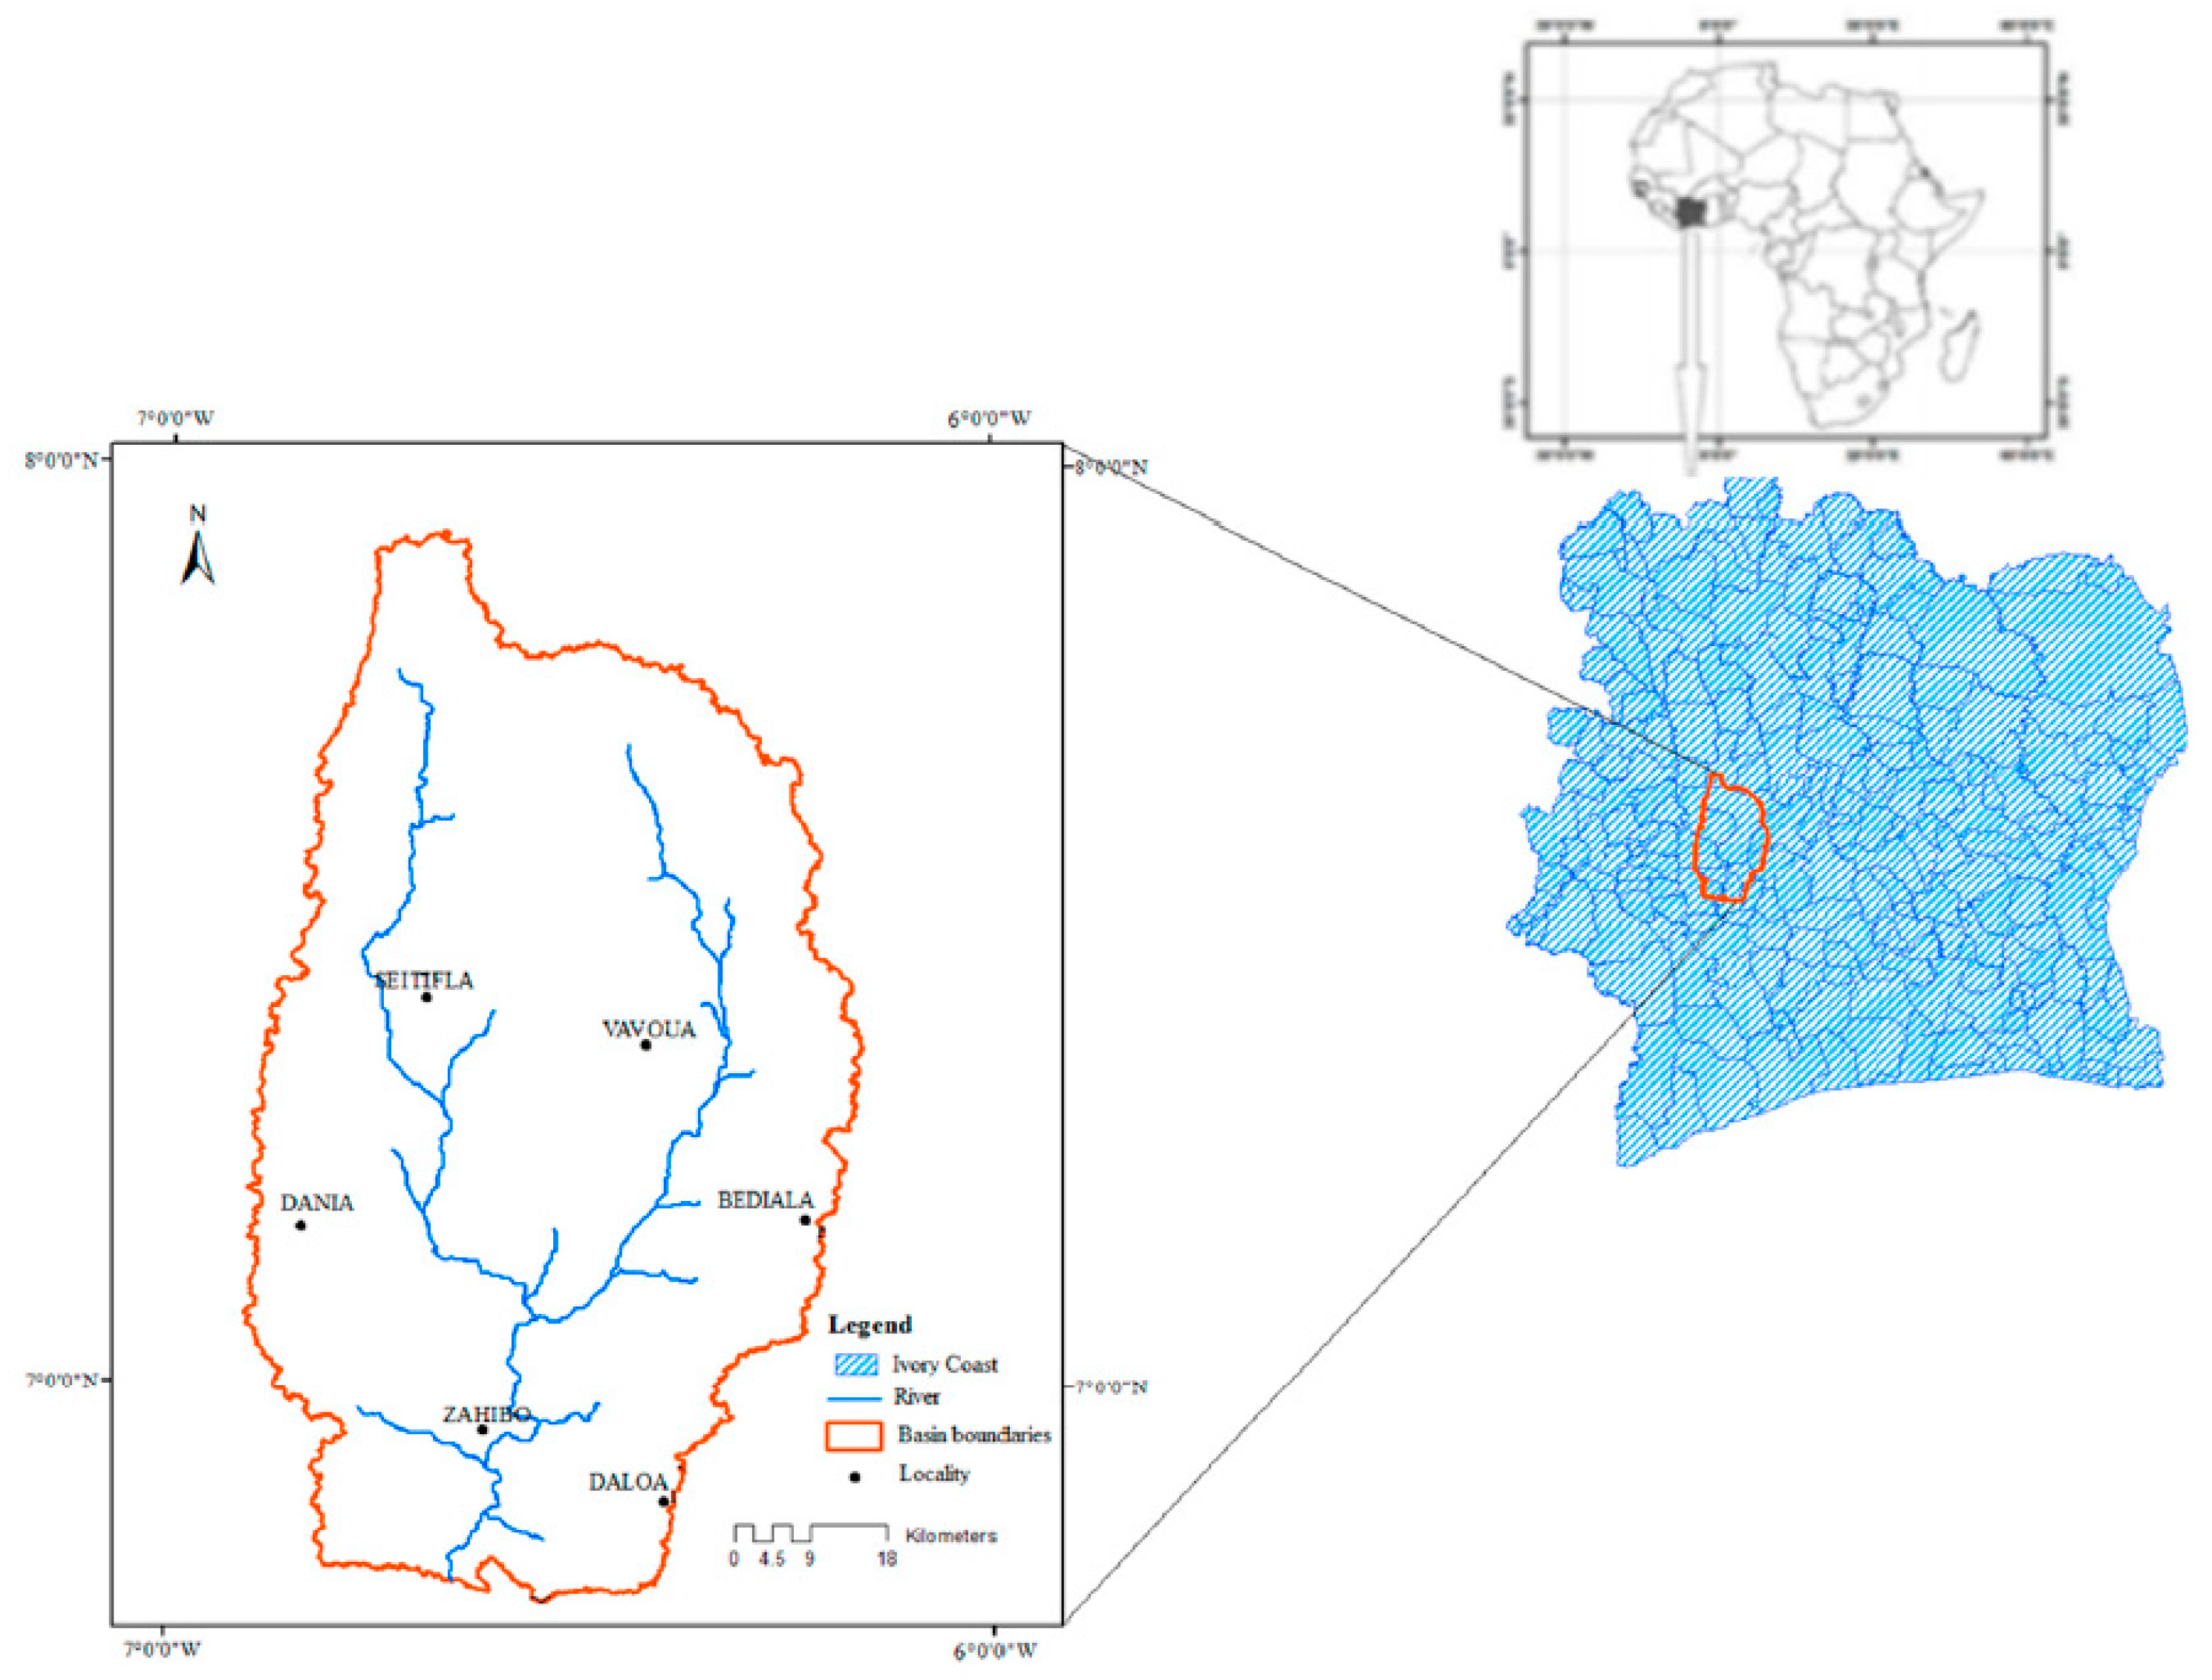
2.1.1. Study area
2.1.2. Data
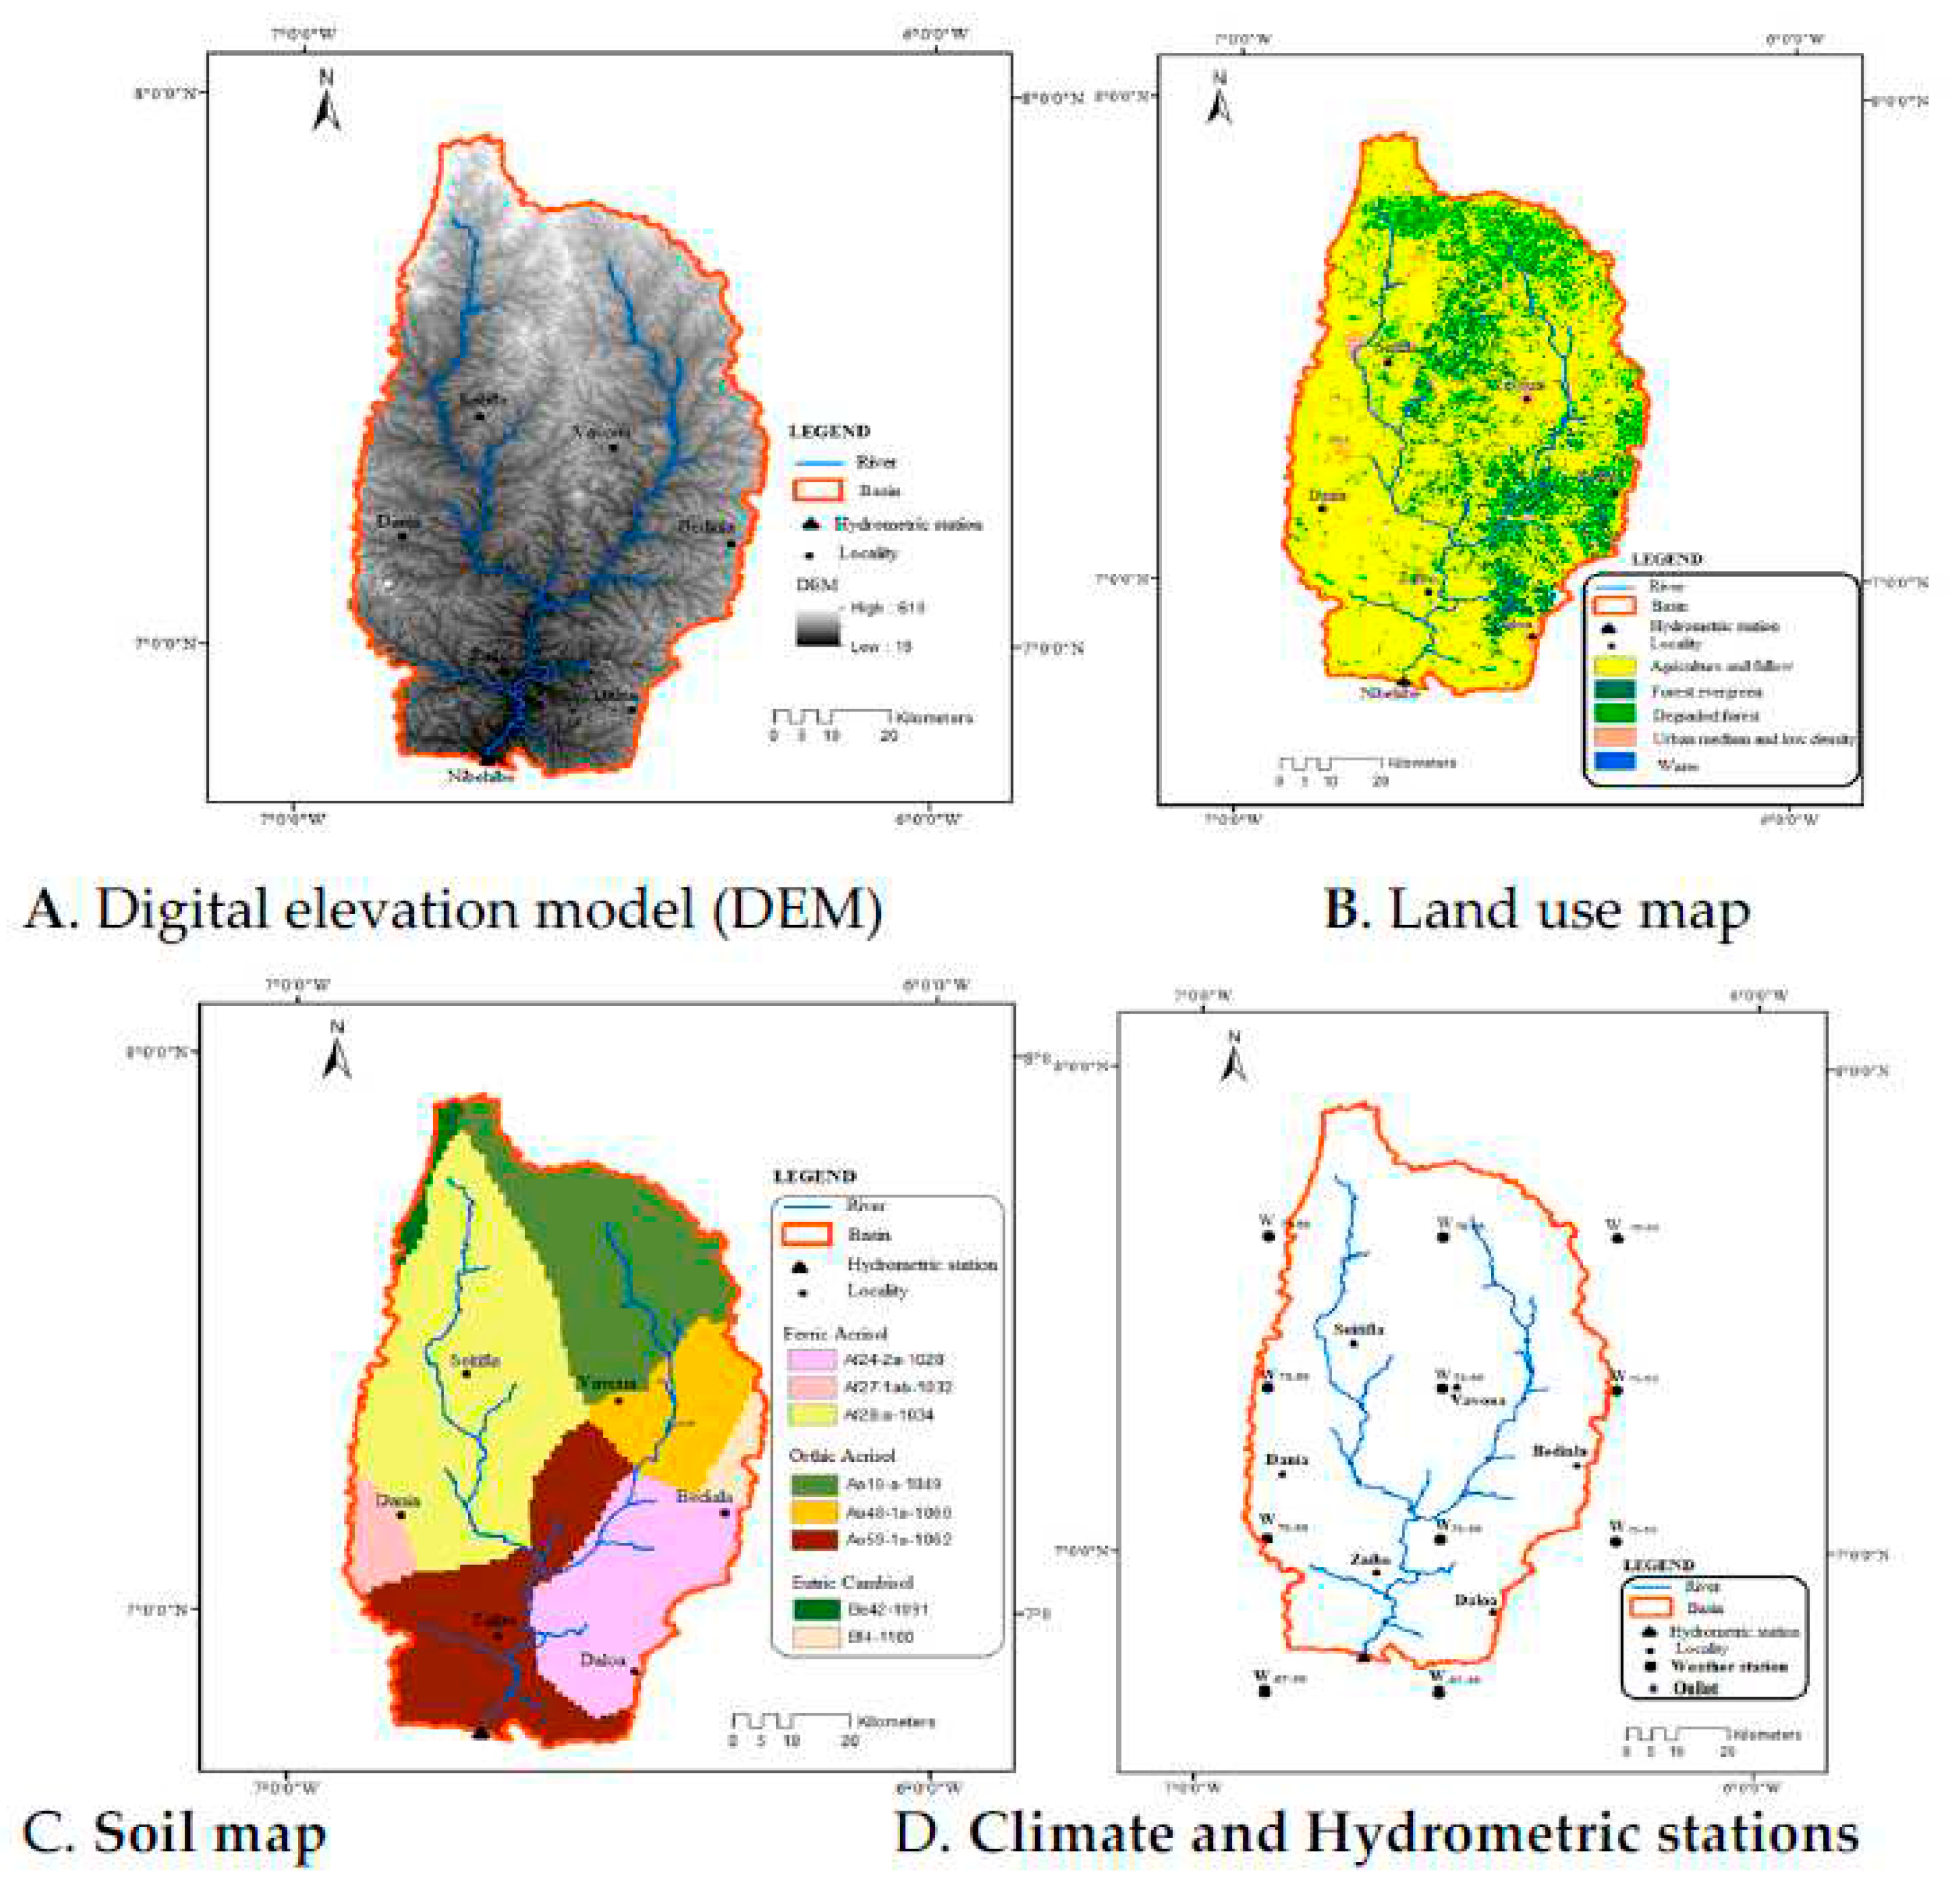
Digital Elevation Model (DEM)
Land use map
Soil data
Hydro-climate data
Agronomic data
2.1.3. Computer software
2.2. Methods
2.2.1. Flow calibration
Model and software description SWAT Model description
SWAT-CUP and SUFI-2 algorithm
Global sensitivity analysis
Uncertainty analysis
Calibration analysis
Model setup
Streamflow calibration process
2.2.2. Nutrient loads estimation
3. Results
3.1. Streamflow parameter global sensitivity
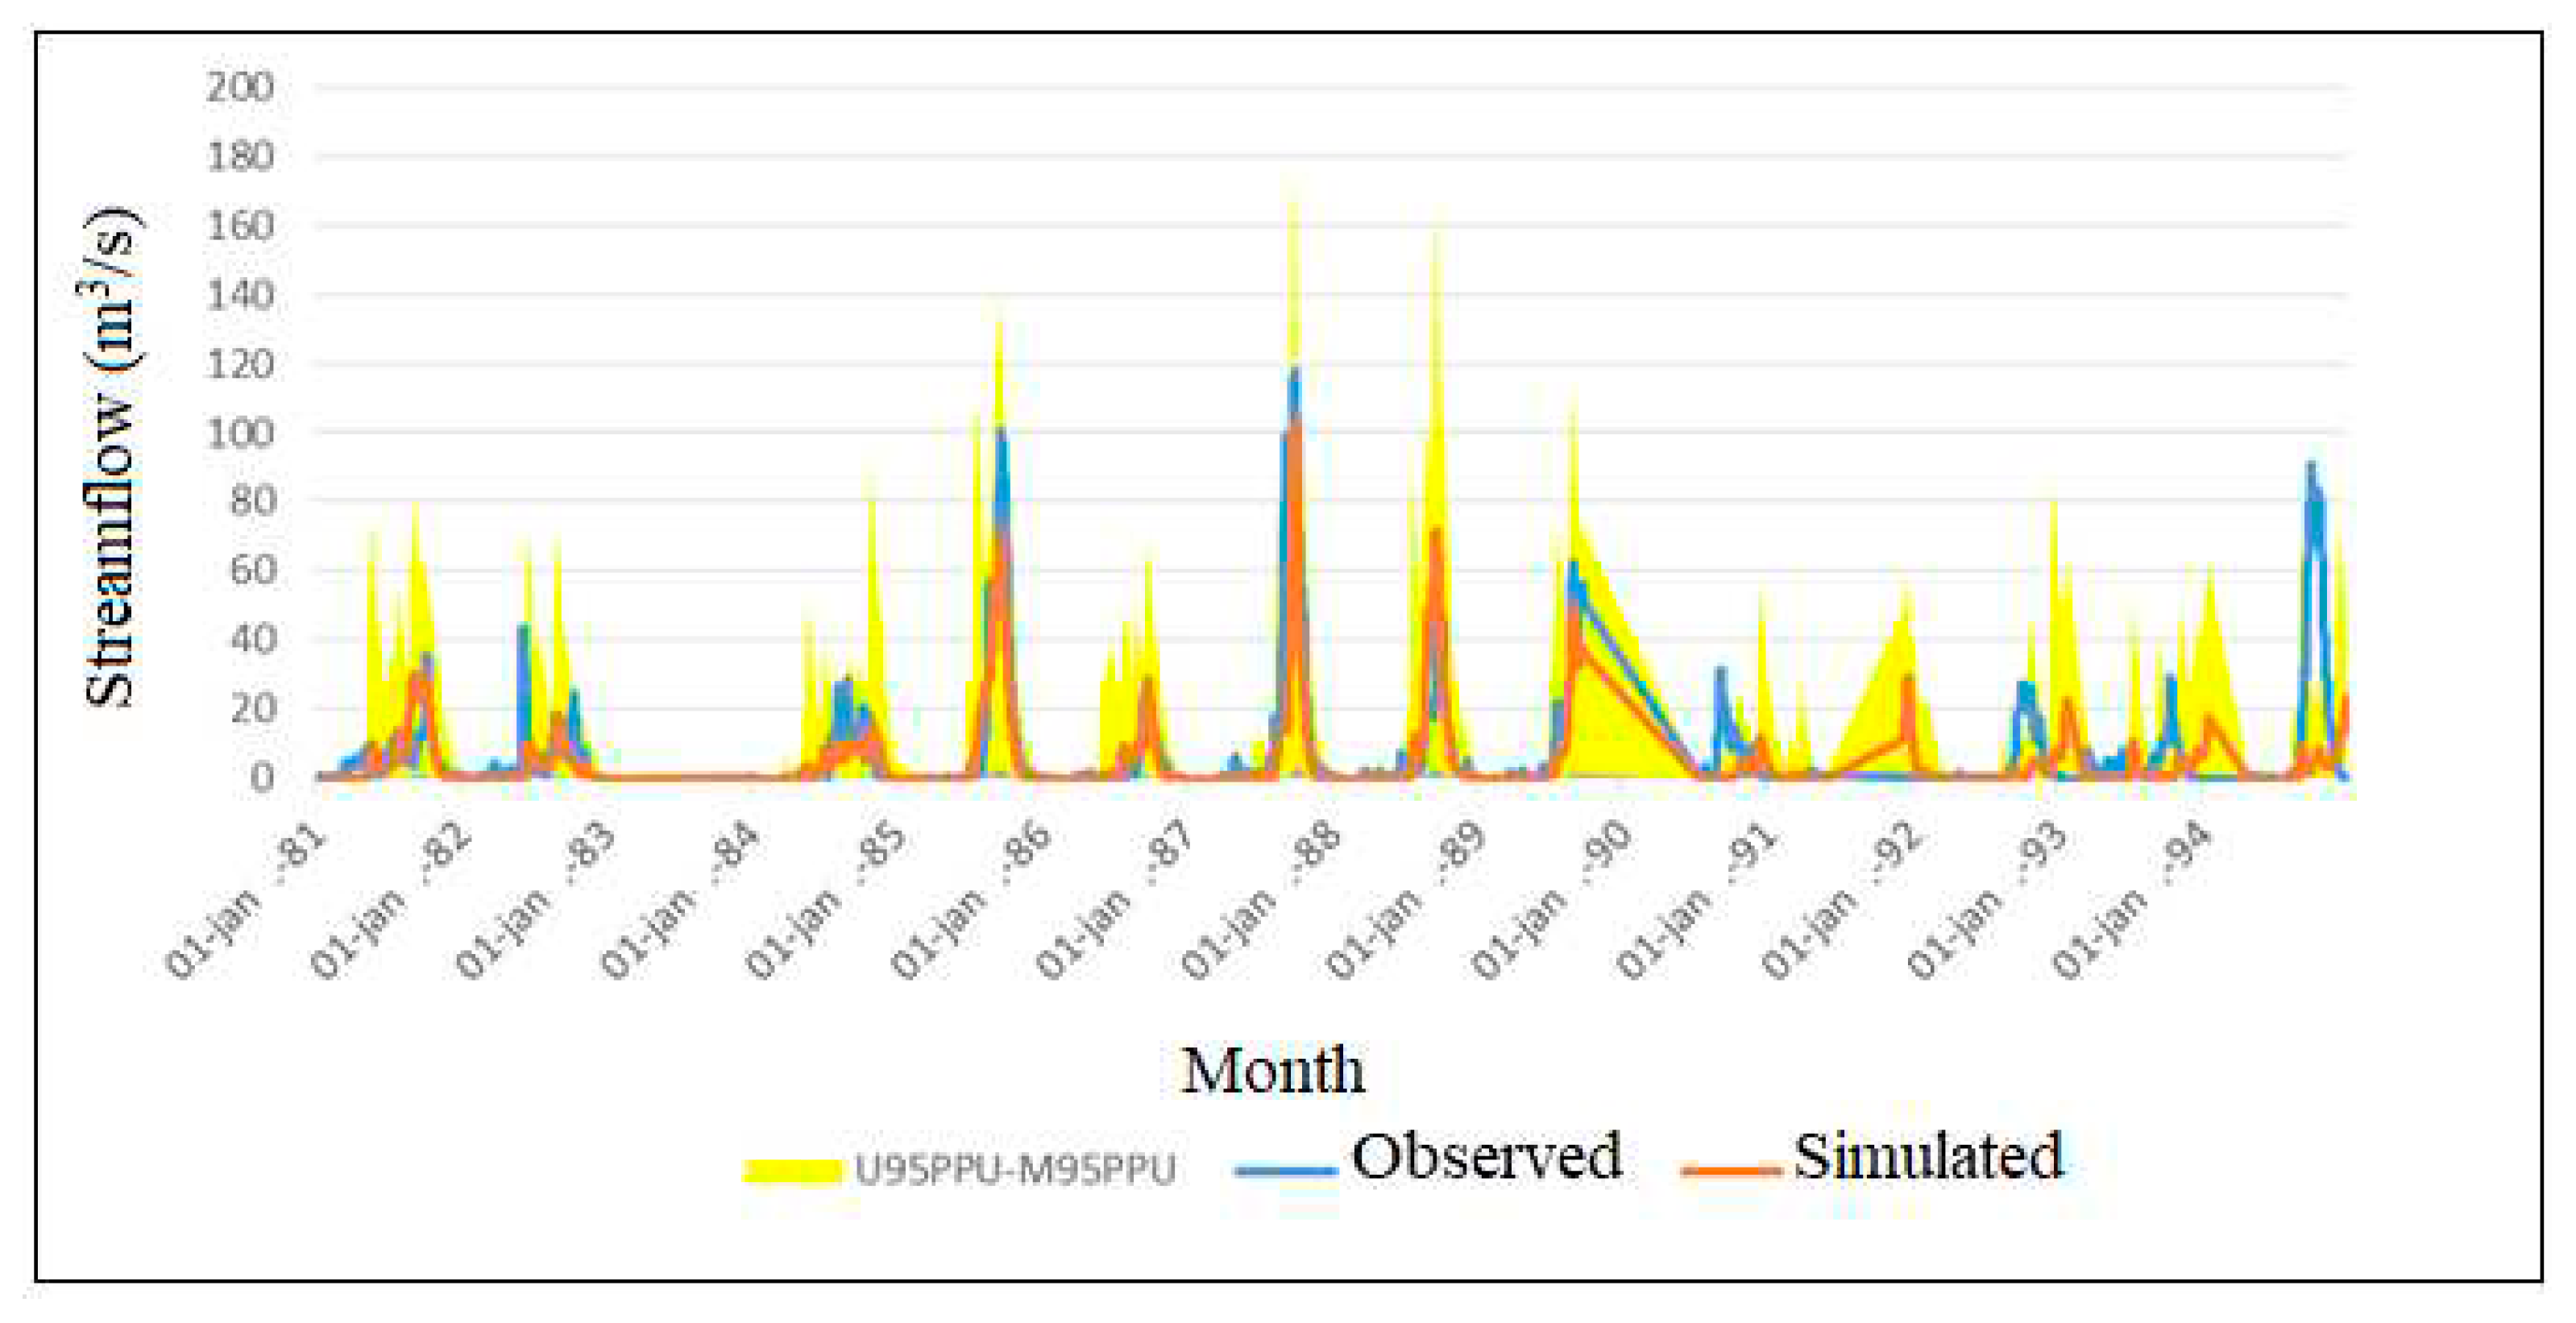
3.2. Streamflow calibration and uncertainty
3.3. Nutrients fluxes
3.3.1. Nutrients requirements for crops
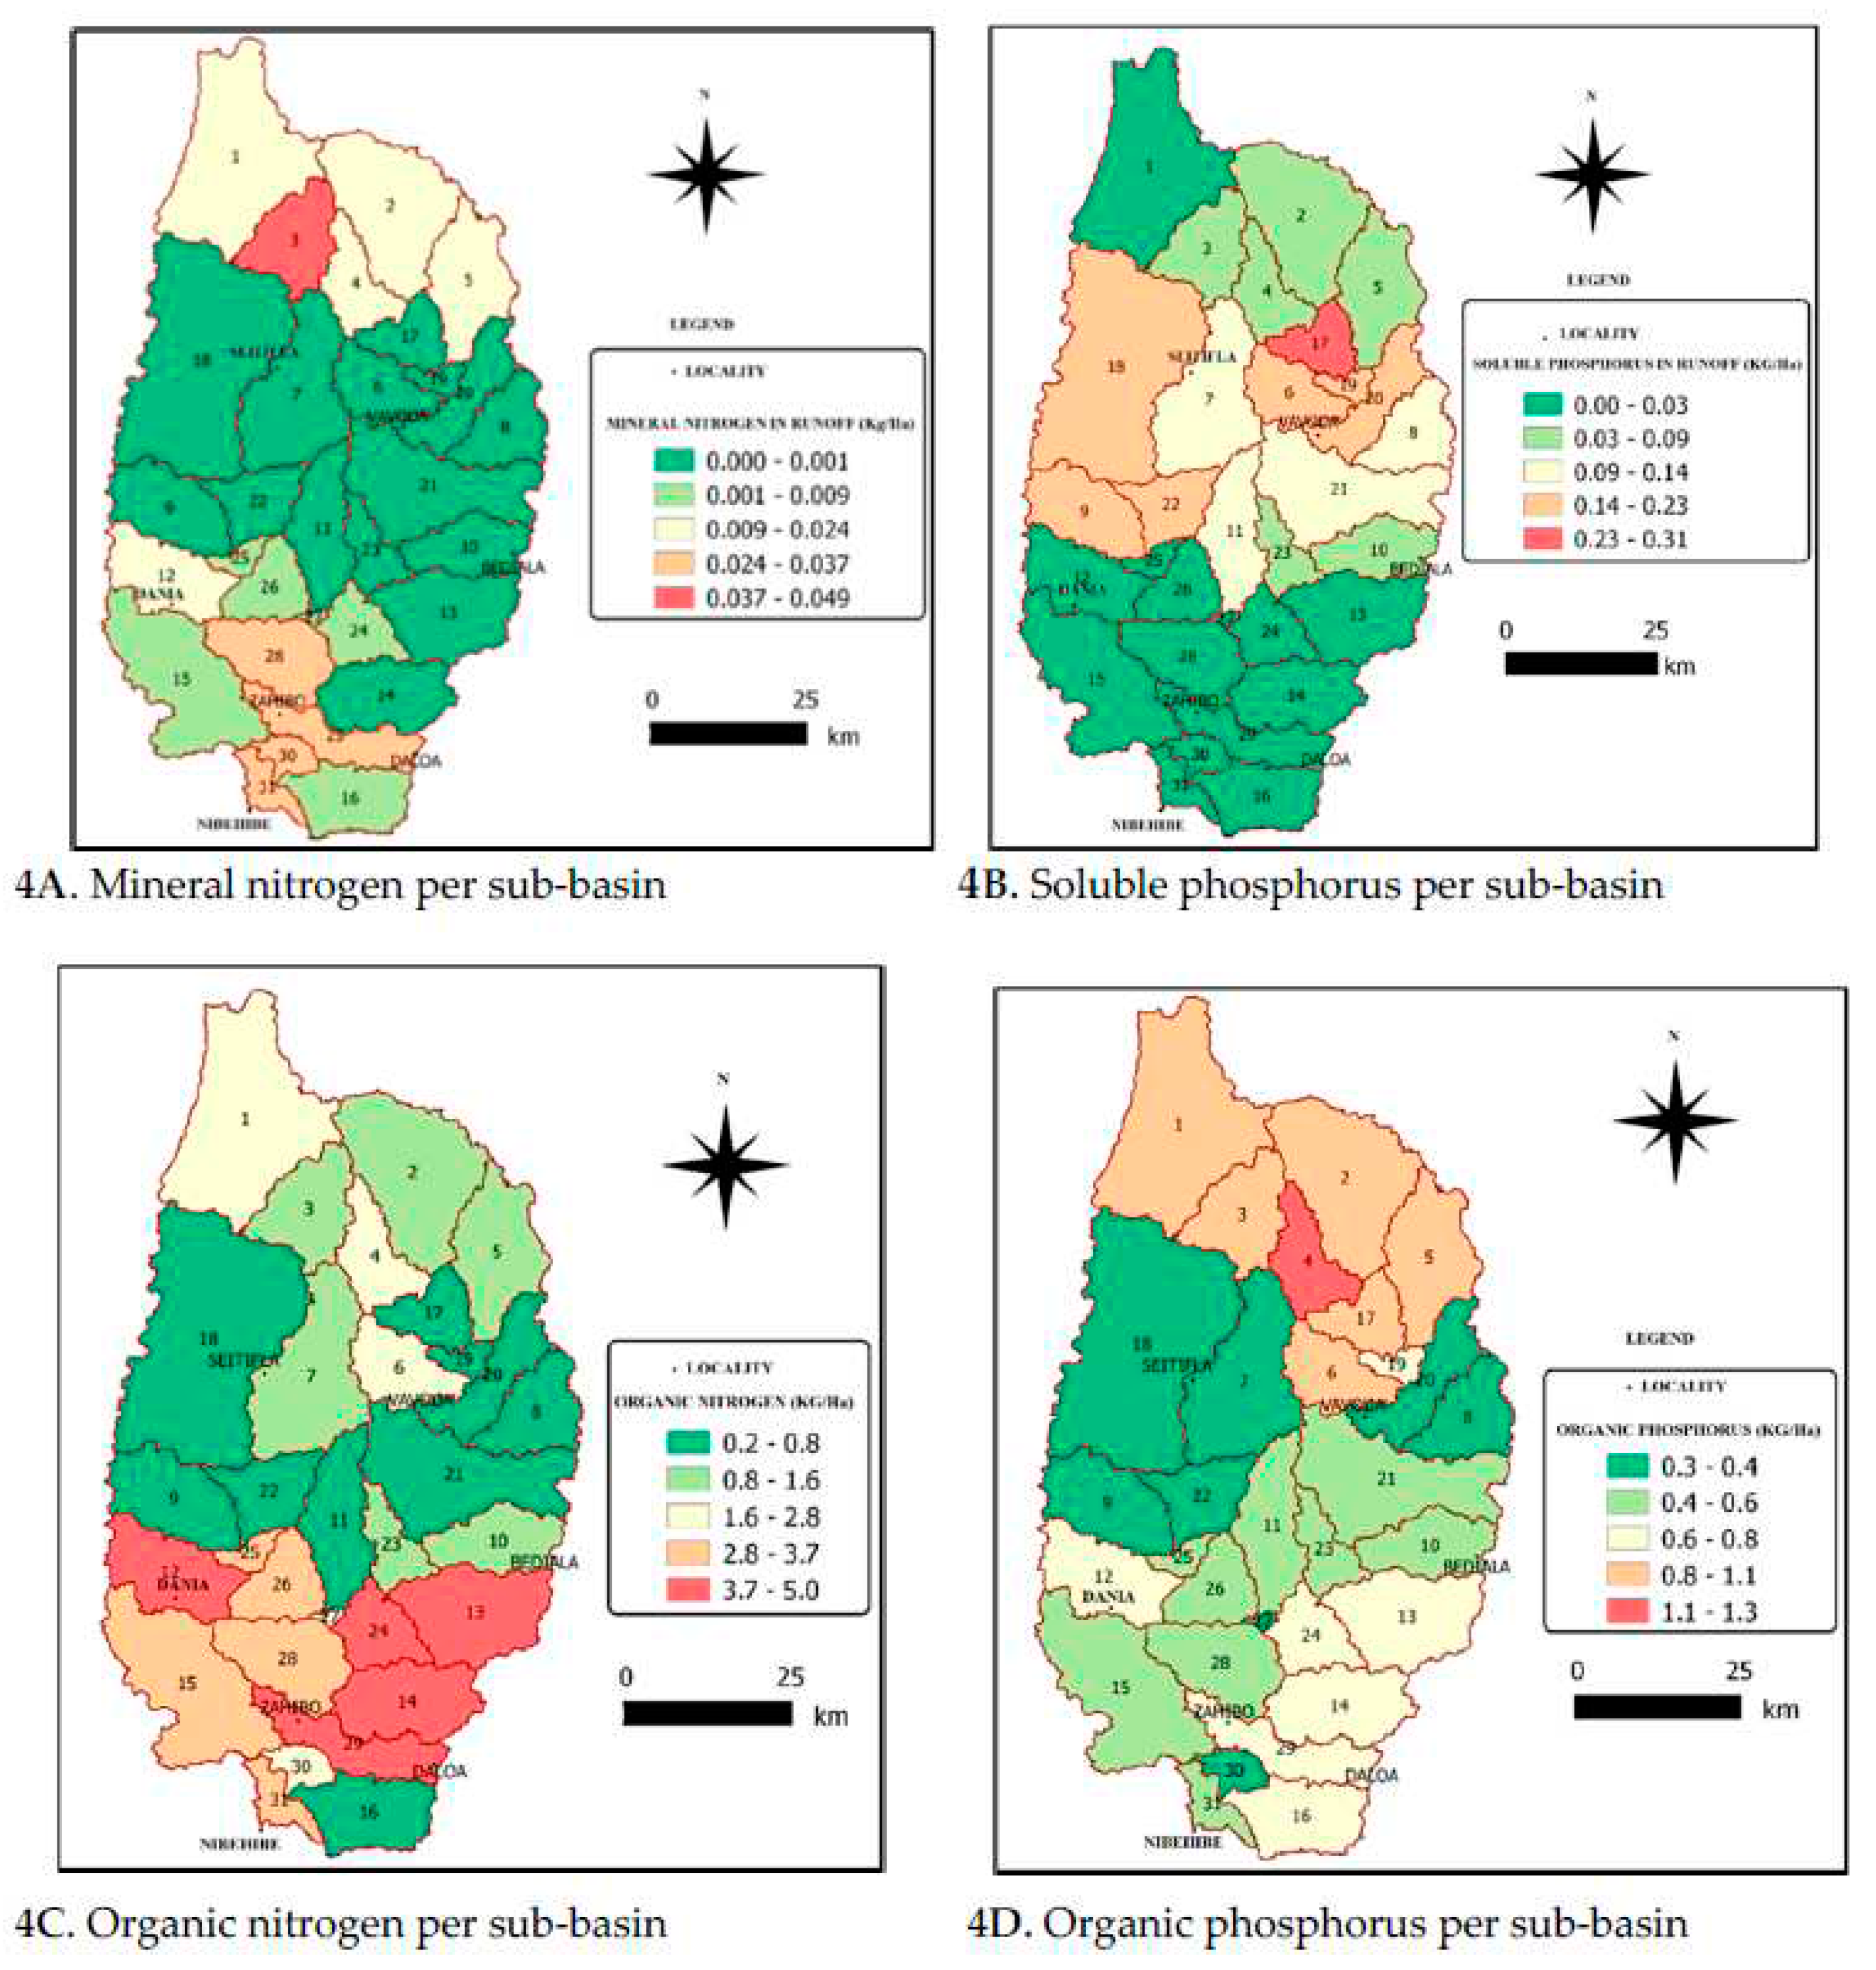
3.3.2. Mineral nitrogen and soluble phosphorus transferred per sub-basin
3.3.3. Organic Nitrogen and organic phosphorus transferred per sub-basin
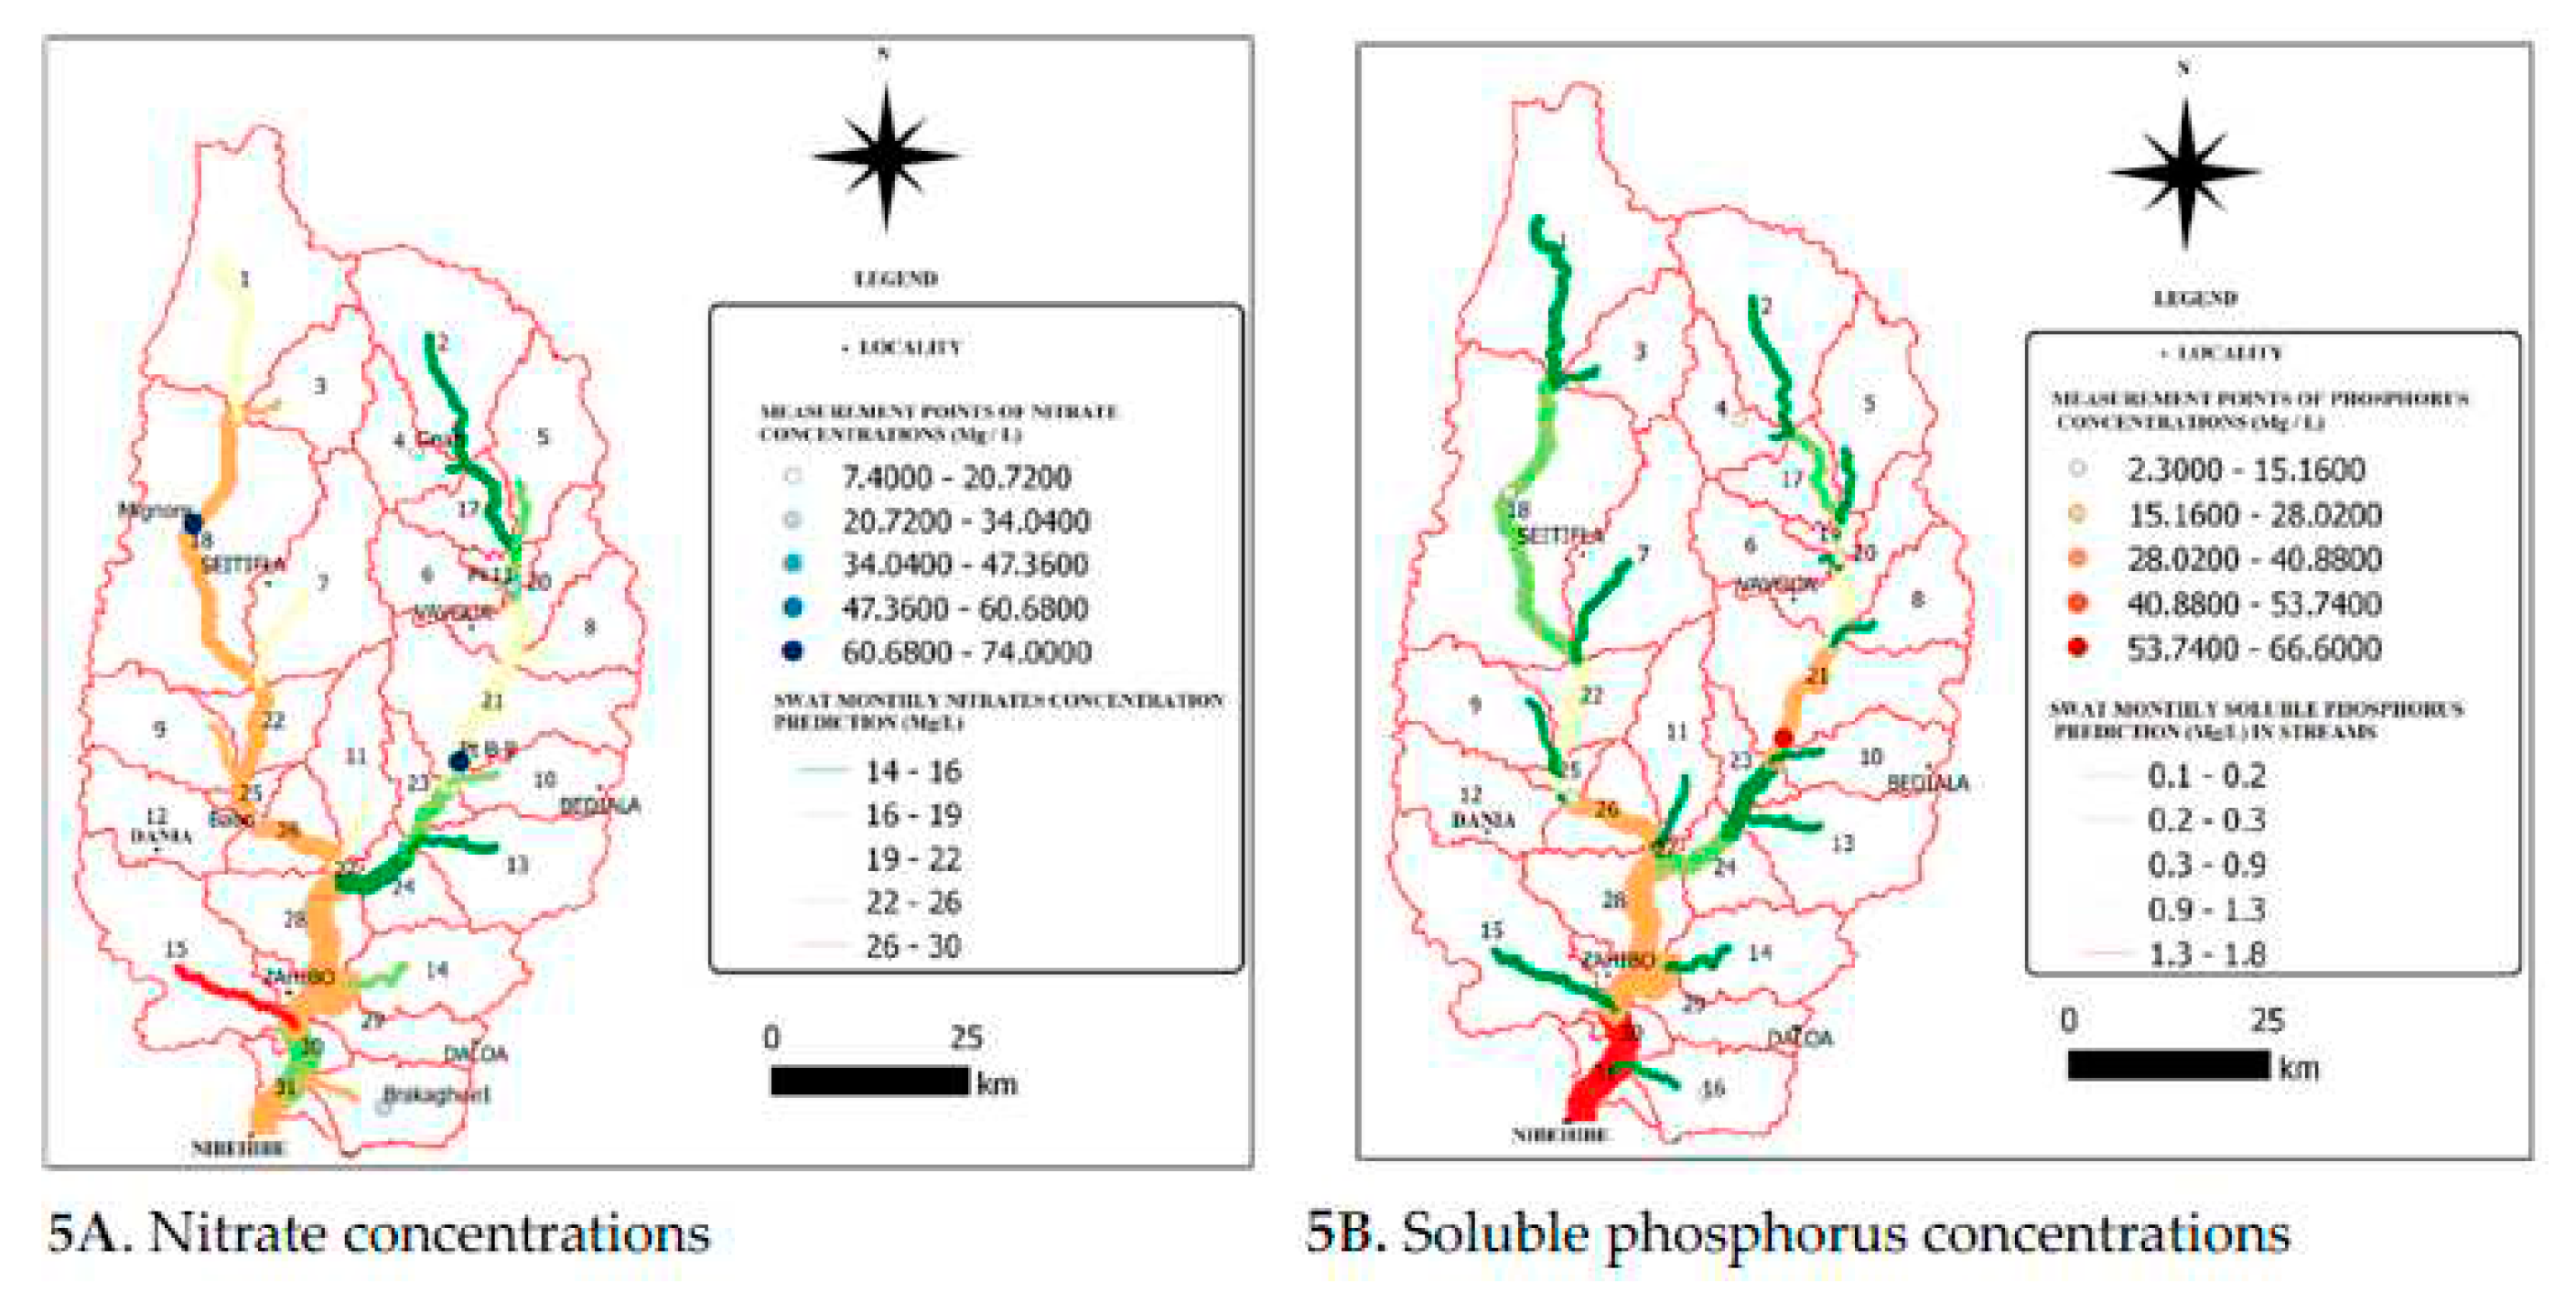
3.3.4. Nitrates and soluble phosphorus concentrations in streams
4. Discussion
5. Conclusions
Author Contributions
Funding
Institutional Review Board Statement
Informed Consent Statement
Data Availability Statement
Acknowledgments
Conflicts of Interest
References
- Economic Research Service, U.S. Department of Agriculture. Available online: https://www.ers.usda.gov/topics/international-markets-u-s-trade/u-s-agricultural-trade/ (accessed on 20 January 2023).
- Komelan, Y. Eutrophisation des réservoirs d'eau en Côte d'Ivoire et gestion de leur bassin versant : cas de Lobo à Daloa. Master thesis, EIER, Ouagadougou, 1999.
- Maïga, A.; Denyigba, K.; Allorent, J. Eutrophisation des petites retenues d'eau en Afrique de l'Ouest : Causes et conséquences : cas de la retenue d'eau de la Lobo en Côte d'Ivoire. Sud Sciences & Technologies 2001, 7, 16–29. [Google Scholar]
- Dié. Renforcement de l'alimentation en eau potable de la ville de Daloa à partir du barrage de Buyo en Côte d'Ivoire. Master thesis, EIER, Ouagadougou, 2006.
- Ohou-Yao, M.; Séka, A.; Mambo, V.; Yapo, O.; Konan, K.; Houénou, P. Contamination des eaux de puits traditionnels par les nitrates sur le bassin versant de la Lobo (Buyo, sud-ouest de la Côte d’Ivoire). J. Appl. Biosci. 2014, 78, 6654–6665. [Google Scholar] [CrossRef]
- Chocat, B. Amenagement urbain et hydrologie. La Houille Blanche 1997, 7, 12–19. [Google Scholar] [CrossRef]
- Refsgaard, J.C. Parameterization, calibration, and validation of distributed hydrological models. J. Hydrol. 1997, 198, 69–97. [Google Scholar] [CrossRef]
- Refsgaard, J.C.; Storm, B. Construction, calibration, and validation of hydrological models. In Distributed Hydrologic Modeling, 2nd ed.; Abbot, M. B, Ed.; Kluwer Academic Publishers: Dordrecht, Netherlands, 1996; pp. 41–54. [Google Scholar]
- Wischmeier, W. H.; Smith D. D. Predicting Rainfall Erosion Losses. Agriculture Handbook 537, United States Department of Agriculture, Science and Education Administration, 1978; 58 p.
- Perrin, C.; Michel, C.; Andréassian, V. Improvement of a parsimonious model for streamflow simulation. Journal of Hydrology 2003, 279, 275–289. [Google Scholar] [CrossRef]
- Avenard, J. M. Aspect géomorphologique. In L’Environnement naturel de Côte d'Ivoire, 2nd ed.; Avenard, J.M., Eldin, M., Girard, G., Sircoulon, J., Touchebeuf, P., Guillaumet, J.L., Adjanohoun, Perraud A., Eds.; ORSTOM: Paris, France, 1971; pp. 11–72. [Google Scholar]
- Yao, A.B.; Goula, B.T.A.; Kouadio, Z.A.; Kouakou, K.E.; Kane, A.; Sambou, S. Analyse de la variabilité climatique et quantification des ressources en eau en zone tropicale humide : cas du bassin versant de la Lobo au Centre-ouest de la Côte d’Ivoire. Rev. Ivoir. Sci. Technol 2012, 19, 136–157. [Google Scholar]
- Brou, Y.T. Climat, mutations socio-économiques et paysages en Côte d’Ivoire. Mémoire de synthèse des activités scientifiques présenté en vue de l’obtention de l’Habilitation à Diriger des Recherches, Université des Sciences et Techniques de Lille, France, 2005.
- Koua, T.J.-J.; Dhanesh, Y.; Jeong, J.; Srinivasan, R.; Anoh, K.A. Implementation of the Semi-Distributed SWAT (Soil and Water Assessment Tool) Model Capacity in the Lobo Watershed at Nibéhibé (Center-West of Côte D’Ivoire). Journal of Geoscience and Environment Protection 2021, 9, 21–38. [Google Scholar] [CrossRef]
- Harmonized world soil database version1.1. Available online: http://www.fao.org/fileadmin/templates/nr/documents/HWSD/HWSD_Documentation.pdf (Accessed on September 2012).
- Mbungu, W.B; Kashaigili, J.J. Assessing the Hydroology of a Data-Scarce Tropical Watershed Using the Soil and Water Assessment Tool: Case of the Little Ruaha River Watershed in Iringa, Tanzania. Open Journal of Modern Hydrology 2017, 7, 65–89. [Google Scholar] [CrossRef]
- Arnold, J.G.; Srinivasan, R.; Muttiah, R.; Williams, J.R. Large area hydrologic modeling and assessment. Part I: Model development. J. Am. Water Res. Assoc. 1998, 34, 73–89. [Google Scholar] [CrossRef]
- Neitsch, S.L.; Arnold, J.G.; Kiniry, J.R.; Williams, R. Soil and Water Assessment Tool. Theoretical Documentation, Version 2005. Agricultural Research Service, Grassland, Soil and Water Research Laboratory, Temple, USA, 2005.
- Refsgaard, J.C.; Van der Sluijs, J.P.; Højberg, A.L.; Vanrolleghem, P. A. Uncertainty in the environmental modelling process – a framework and guidance. Environmental Modelling & Software 2007, 22, 1543–1556. [Google Scholar]
- Schuol, J.; Abbaspour, K.C.; Srinivasan, R.; Yang, H. Modeling blue and green water availability in Africa. Water Resources Research, 2008, 44, 1–18. [Google Scholar] [CrossRef]
- Bastin, L.; Cornford, D.; Jones, R.; Heuvlink, G.; Pebesma, E.; Stasch, C.; Nativi, S.; Mazzetti, P.; Williams, M. Managing uncertainty in integrated environmental modelling: The UncertWeb framework. Environmental Modelling & Software 2013, 39, 116–134. [Google Scholar]
- Abbaspour, K.C.; Johnson, C.A.; Van Genuchten, M.T. Estimating uncertain flow and transport parameters using a sequential uncertainty fitting procedure. Vadose Zone Journal 2004, 3, 1340–1352. [Google Scholar] [CrossRef]
- Abbaspour, K.C.; Yang, J.; Maximov, I.; Siber, R.; Bogner, K.; Mieleitner, J.; Zobrist, J.; Srinivasan, R. Modelling hydrology and water quality in the pre-alpine/alpine Thur watershed using SWAT. J. Hydrol. 2007, 333, 413–430. [Google Scholar] [CrossRef]
- Beven, K.; Binley, A. The future of distributed models – model calibration and uncertainty prediction. Hydrological Processes 1992, 6, 279–298. [Google Scholar] [CrossRef]
- Eberhart, R.C.; Kennedy, J. A new optimizer using particle swarm theory. In Proceedings of the sixth international symposium on micro machine and human science. Nagoya, Japan, 4-6 October 1995. [Google Scholar]
- Van Griensven, A.; Meixner, T. Methods to quantify and identify the sources of uncertainty for river basin water quality models. Water Sci. Technol. 2006, 53(1), 51–59. [Google Scholar] [CrossRef]
- Kuczera, G.; Parent, E. Monte Carlo assessment of parameter uncertainty in conceptual catchment models: the Metropolis algorithm. J. Hydrol. 1998, 211, 69–85. [Google Scholar] [CrossRef]
- Yang, J.; Reichert, P.; Abbaspour, K.C.; Xia, J.; Yang, H. Comparing uncertainty analysis techniques for a SWAT application to Chaohe Basin in China. J. Hydrol. 2008, 358, 1–23. [Google Scholar] [CrossRef]
- Abbaspour, K.C. SWAT calibration and uncertainty programs – a user manual. Swiss Federal Institute of Aquatic Science and Technology, EAWAG, Duebendorf, Switzerland, 2015.
- Gupta, H.V.; Sorooshian, S.; Yapo, P.O. Status of automatic calibration for hydrologic models: Comparison with multilevel expert calibration. J. Hydrologic Eng. 1999, 4(2), 135–143. [Google Scholar] [CrossRef]
- Coffey, M.E.; Workman, S.R.; Taraba, J.L.; Fogle, A.W. Statistical procedures for evaluating daily and monthly hydrologic model predictions. Transaction of the ASABE. 2004, 47, 59–68. [Google Scholar] [CrossRef]
- Santhi, C.; Arnold, J.G.; Williams, J.R.; Dugas, W. A.; Srinivasan, R. Validation of the SWAT model on a large river basin with point and nonpoint sources. JAWRA. 2001, 37(5), 1169–1188. [Google Scholar]
- Chu, T.W.; Shirmohammadi, A.; Montas, H.; Sadeghi, A. Evaluation of the SWAT model’s sediment and nutrient components in the piedmont physiographic region of Maryland. ASABE. 2004, 47(5), 1523–1538. [Google Scholar] [CrossRef]
- Gassman, P.W.; Reyes, M.R.; Green, C.H.; Arnold, J.G. The soil and water assessment tool: historical development, applications, and future research directions. Transactions of the ASABE. 2007, 50(4), 1211–1250. [Google Scholar] [CrossRef]
- Moriasi, D.N.; Arnold, J.G.; Van Liew, M.W.; Bingner, R.L.; Harmel, R.D.; Veith, T.L. Model evaluation guidelines for systematic quantification of accuracy in watershed simulations. Transactions of the ASABE 2007, 50, 885–900. [Google Scholar] [CrossRef]
- Schuol, J.; Abbaspour, K.C.; Srinivasan, R.; Yang, H. Estimation of freshwater availability in the West African sub-continent using the SWAT hydrologic model. J. Hydrol. 352, 30–49. [CrossRef]
- Sintondji, L.O.; Awoye, H. R.; Agbossou, K. E. Modélisation du bilan hydrologique du bassin versant du Klou au Centre-Bénin : Contribution à la gestion durable des ressources en eau. Bulletin de la recherche agronomique du Bénin 2008, 59, 35–48. [Google Scholar]
- Rollo, N. Modélisation des dynamiques de pollution diffuse dans le bassin versant de la rivière d’Auray : quantification, caractérisation et gestion des apports nutritifs terrigènes. Thèse de Doctorat, Université de Nantes, 2012.
- Vilaysane, B.; Takara, K.; Luo, P.; Akkharath, I.; Duan, W. Hydrological stream flow modelling for calibration and uncertainty analysis using SWAT model in the Xedone river basin, Lao PDR. Procedia Environ. Sci. 2015, 28, 380–390. [Google Scholar] [CrossRef]
- Aouissi, J.; Benabdallah, S.; Chabaâne, Z.; Cudennec, C. Evaluation of potential evapotranspiration assessment methods for hydrological modelling with SWAT-application in data-scarce rural Tunisia. Agric. Water Manag. 2016, 174, 39–51. [Google Scholar] [CrossRef]
- Havrylenko, S.B.; Bodoque, J.M.; Srinivasan, R.; Zucarelli, G.V.; Mercuri, P. Assessment of the soil water content in the Pampas region using SWAT. Catena 2016, 137, 298–309. [Google Scholar] [CrossRef]
- Maliehe, M.; Mulungu, D.M. Assessment of water availability for competing uses using SWAT and WEAP in South Phuthiatsana catchment, Lesotho. Physics and Chemistry of the Earth, 2017, Parts A/B/C.
- Molina-Navarro, E.; Anderson, H.; Nielsen, A.; Thodsen, H.; Trolle, D. The impact of the objective function in multi-site and multi-variable calibration of the SWAT model. Environ. Model. Softw. 2017, 93, 255–267. [Google Scholar] [CrossRef]
- Tolson, B.A.; Shoemaker, C.A. Watershed modeling of the Cannonsville Basin using SWAT 2000, Model development, calibration and validation for the prediction of the flow, sediment and phosphorus transport to the Cannonsville reservoir. Technical Report, School of Civil and Environmental Engineering, Cornell University, Ithaca, New York, 2004.
- Koua, T.J.; Kouassi, K.H.; Anoh, K.A. Analysis of the SWAT (Soil and Water Assessment Tool) Semi-distributed Model Input Data for the Hydrological Simulation of the Lobo Water Reservoir (Central West of Côte d'Ivoire). Journal of Geography, Environment and Earth Science International 2019, 23, 1–20. [Google Scholar] [CrossRef]
- Jenson, S.; Domingue, J. Extracting Topographic Structure from Digital Elevation Data for Geographic Information System Analysis. Photogramm. Eng. Remote Sensing 1998, 54, 1593–1600. [Google Scholar]
- Abbaspour, K.C. Swat-Cup2: SWAT Calibration and Uncertainty Programs Manual. Version 2.: Swiss Federal Institute of Aquatic Science and Technology, EAWAG, Duebendorf, Switzerland, 2011.
- Neitsch, S.L.; Arnold, J.G.; Kiniry, J.R.; Williams, J.R. Soil and water assessment tool theoretical documentation, version 2005. Grassland, Soil and Water Research Laboratory – Agricultural Research Service. Blackland Research Center – Texas Agricultural Experiment Station. Texas Water Resources Institute, College Station, 2011.
- McElroy, A.D.; Chu, S.Y.; Nebgen, J.W.; Aleti, A.; Bennett, F.W. Loading functions for assessment of water pollution from nonpoint sources. Environ. Prot. Tech. Serv. 1976, 76–151. [Google Scholar]
- Williams, J.R.; Hann, R.W. Optimal operation of large agricultural watersheds with water quality constraints. Texas Water Resources Institute, Texas A & M Univ., 1978.
- Menzel, R.G. Enrichment ratios for water quality modeling. In CREAMS: A Field Scale Model for Chemicals, Runoff, and Erosion from Agricultural Management Systems, 2nd ed Knisel, W.G., Eds; U.S. Dept. Agric. Conserv. Res., USA, 1980, pp. 486-492.
- Alemayehu, T.; Gupta, H.V.; van Griensven, A.; Bauwens, W. On the Calibration of Spatially Distributed Hydrologic Models for Poorly Gauged Basins: Exploiting Information from Streamflow Signatures and Remote Sensing-Based Evapotranspiration Data. Water 2022, 14, 1252. [Google Scholar] [CrossRef]
- Anoh, K.; Koua, T.; Eblin, S.; Kouamé, K.; Jourda, J. Modelling Freshwater Availability Using SWAT Model at a Catchment-Scale in Ivory Coast. Journal of Geoscience and Environment Protection 2017, 5, 70–83. [Google Scholar] [CrossRef]
- Dakhlalla, A.O.; Parajuli, B.P. Assessing model parameters sensitivity and uncertainty of streamflow, sediment, and nutrient transport using SWAT. Inf. Process. Agric. 2019, 6, 61–72. [Google Scholar] [CrossRef]
- Xu, H.; Taylor, R. G.; Kingston, D. G.; Jiang, T.; Thompson, J. R.; Todd, M. C. Hydrological modeling of River Xiangxi using SWAT2005: a comparison of model parameterizations using station and gridded meteorological observations. Quat. Int. 2010, 226, 54–59. [Google Scholar] [CrossRef]
- Strauch, M.; Bernhofer, C.; Koide, S.; Volk, M.; Lorz, C.; Makeschin, F. Using precipitation data ensemble for uncertainty analysis in SWAT streamflow simulation. J. Hydrol 2012, 414-415, 413–424. [Google Scholar] [CrossRef]
- Vu, M.T.; Srinivasan, R.; Liong, S.Y. SWAT use of gridded observations for simulating runoff – a Vietnam river basin study. Hydrol. Earth Syst. Sci. 2012, 16, 2801–2811. [Google Scholar] [CrossRef]
- Tuo, Y.; Duan, Z.; Disse, M.; Chiogna, G. Evaluation of precipitation input for SWAT modeling in Alpine catchment: A case study in the Adige river basin (Italy). Sci. Total Environ 2016, 573, 668–82. [Google Scholar] [CrossRef]
- Shen, Z.; Chen, L.; Liao, Q.; Liu, R.; Hong, Q. Impact of spatial rainfall variability on hydrology and nonpoint source pollution modeling. J. Hydrol 2012, 472–473, 205–215. [Google Scholar] [CrossRef]
- Abbaspour, K.C.; Rouholahnejad, E.; Vaghefi, S.; Srinivasan, R.; Yang, H.; Kløve, B.A. Continental-scale hydrology and water quality model for Europe: calibration and uncertainty of a high-resolution large-scale SWAT model. J. Hydrol. 2015, 524, 733–752. [Google Scholar] [CrossRef]
- Anoh, K.; Koua, T.; Kouamé, K.; Jourda, J.; Laurent, F. Modelling water flow in a complex watershed in humid a tropical area using SWAT: a case study of Taabo watershed in Ivory Coast. Int. J. River Basin Manag. 2018, 16(2), 157–167. [Google Scholar] [CrossRef]
- Dosso, M. Etude de la consommation d'engrais en Côte d'Ivoire. Rept. 2015, 29 p.
- Bioteau, T.; Bordenave, P.; Laurent, F.; Ruelland, D. Evaluation des risques de pollution diffuse par l'azote d'origine agricole à l'échelle de bassins versants : intérêts d'une approche par modélisation avec SWAT. Ingénieries-EAT 2002, 32, 3–13. [Google Scholar]
- Laurent, F.; Ruelland, D.; Chapdelaine, M. Simulation de l’effet de changements de pratiques agricoles sur la qualité des eaux avec le modèle SWAT. Journal of Water Science 2007, 20, 395–408. [Google Scholar] [CrossRef]
- Maliki, R.; Bernard, M.; Padonou, E.; Englehart, C.; Sinsin, B. A.; Aho, N. Effet combiné de NPK et de trois différents mulchs d’origine végétale sur la production maïsicole et la fertilité des sols au Sud-Bénin. BRAB 2017, 10–26. [Google Scholar]
- Wetzel, R.G. Limnology: Lake and River Ecosystems. 3rd Ed.; Academic Press, San Diego, 2001, 1006 p.
- Koua, T. Apport de la modélisation hydrologique et des Systèmes d’Information Géographique (SIG) dans l’étude du transfert des polluants et des impacts climatiques sur les ressources en eau : cas du bassin versant du lac de Buyo (Sud-ouest de la Côte d'Ivoire). PhD Thesis, Felix Houphouet Boigny University of Cocody, Abidjan, Cote d’Ivoire, 11 December 2014. [Google Scholar]
- Koukougnon, W.G. Milieu urbain et accès à l’eau potable : Cas de Daloa (Centre-Ouestde la Cote d’Ivoire). PhD Thesis, Felix Houphouet Boigny University of Cocody, Abidjan, Cote d’Ivoire, 2012. [Google Scholar]
- OECD, Organization for Economic Co-Operation and Development. Eutrophication of Waters. Monitoring, Assessment and Control, 1982, 154 p.
- Dassi, C.; Mosi, L.; Narh, C. A.; Quaye, C. Distribution and Risk of Mycolactone-Producing Mycobacteria Transmission within Buruli Ulcer Endemic Communities in Côte d’Ivoire. Trop. Med. Infect. Dis. 2017, 2, 2–17. [Google Scholar] [CrossRef] [PubMed]
| Algorithm | Description |
|---|---|
| SUFI-2 | In SUFI 2, it is considered that the uncertainty on the simulations is observed in a uniform way. The sources of uncertainties are the driving variables, the conceptual model, parameters and measured data. |
| GLUE | In this method, once the general probability has been defined, all the parameters are randomly sampled from the previous distribution. The parameters are thus grouped either into a behavioral set, or into a non-behavioral set by comparing them to a given threshold probability. The parameters are then weighted according to their behavior. Finally, the uncertainty is predicted. |
| PSO | Here, the uncertainty prediction method is based on stochastic population optimization. The optimization is done from random sampling of parameters. |
| PARASOL | During PARASOL method, a global optimization criterion (GOC) is first fixed. The method seeks to minimize the objective functions (OF) or GOC from the Shuffle Complex algorithm (SCE-UA). |
| MCMC | MCMC proceeds with a random sampling which adapts to the posterior distribution. |
| Global sensitivity rank | Parameter | Parameter description | Fitted value | Minimum value | Maximum value |
|---|---|---|---|---|---|
| 1 | v__GW_REVAP | Groundwater revaporation coefficient | 0.1649 | 0.02 | 0.2 |
| 2 | a__GWQMN | Threshold depth of water in the shallow aquifer required for return flow to occur (mm) | -162 | -1000 | 1000 |
| 3 | a__RCHRG_DP | Deep aquifer percolation fraction | -0.0205 | -0.05 | 0.05 |
| 4 | v__ESCO | Soil evaporation compensation factor | 0.5465 | 0.5 | 0.8 |
| 5 | r__CN2 | SCS runoff curve number fonction | 0.081 | -0.1 | 0.1 |
| 6 | a__GW_DELAY | Groundwater delay (days) | -28.83 | -30 | 60 |
| 7 | a__REVAPMN | Threshold depth of water in the shallow aquifer for "revap" to occur (mm) | 370.50 | -750 | 750 |
| 8 | v__ALPHA_BF | Baseflow alpha factor (days) | 0.945 | 0.00 | 1.00 |
| 9 | r__SOL_AWC | Available water capacity of the soil layer | -0.0143 | -0.05 | 0.05 |
| 10 | v__CANMX | Maximum canopy storage | 14.1749 | 0.00 | 15.00 |
| Parameter | simulated |
|---|---|
| R2 | 0.63 |
| NSE | 0.62 |
| PBIAS | -8.1 |
| P_factor | 0.48 |
| R_factor | 0.52 |
| Crop | Fertilizer (NPK) | Quantity (Kg/Ha) | N quantity (Kg/Ha) | P quantity (Kg/Ha) |
|---|---|---|---|---|
| Cotton | 15-15-15 | 200 | 30 | 13.2 |
| Cocoa tree | 0-23-19 | 500 | 00 | 50.6 |
| Coffee | 12-06-20 | 784 | 94.08 | 79.34 |
| Cashew | 11-22-16 | 81.6 | 8.2 | 9.69 |
| Rice | 12-24-18 | 200 | 24 | 21.12 |
| Banana | 25-04-23 | 200 | 50 | 4.224 |
| Corn | 15-15-15 | 250 | 37.5 | 16.5 |
| Observed mean (CNRA) | 41 Kg/Ha | 28 Kg/Ha | ||
| SWAT | 47.24 Kg/Ha | 21.25 Kg/Ha | ||
Disclaimer/Publisher’s Note: The statements, opinions and data contained in all publications are solely those of the individual author(s) and contributor(s) and not of MDPI and/or the editor(s). MDPI and/or the editor(s) disclaim responsibility for any injury to people or property resulting from any ideas, methods, instructions or products referred to in the content. |
© 2023 by the authors. Licensee MDPI, Basel, Switzerland. This article is an open access article distributed under the terms and conditions of the Creative Commons Attribution (CC BY) license (http://creativecommons.org/licenses/by/4.0/).


