1. Introduction
Brachytherapy is a type of radiation therapy that is beneficial in the treatment of many cancers as it allows for a higher radiation dose to be directed to tumors and lowers the external radiation exposure to the surrounding tissues. Compared to external irradiation, brachytherapy has a very steep dose distribution near the source, and because irradiation is performed locally from the vicinity of the tumor, the dose to normal tissues can be suppressed. Conventional brachytherapy treatments include a high dose rate (HDR) treatment, which involves delivering a high dose of radiation directly to the tumor through seed implantation. In brachytherapy, treatment plans are determined before initiating treatment. The radiation dose for HDR treatment is determined according to the TG-43U1 protocol [
1]. Therefore, the source-specific data used in this protocol are critical for determining the exposure dose. Iridium (
192Ir) is a typical source of radiation used in HDR brachytherapy. Since the actual dose in the vicinity of the radiation source is difficult, Monte Carlo (MC) simulations are performed to investigate the properties of the
192Ir source. Numerous studies have been conducted to clinically validate the TG-43U1 protocol for determining source models using
192Ir sources [1-14]. One such
192Ir source is the microSelectron HDR afterloader system model (Nucletron, Elekta AB, Stockholm, Sweden), which has been modified slightly since it was first reported by Daskalov et al. [
7] after 2010. This modified version was named “mHDR-v2r (revised model mHDR-v2),” whereas the previous model was referred to as “mHDR-v2” by Granero et al. [
9]. mHDR-v2 is no longer manufactured. On the other hand, mHDR-v2r is currently widely used and now called mHDR-v2. Thus, for proper distinction, “mHDR-v2r (revised model mHDR-v2)” in the study by Granero et al. is hereafter referred to as “mHDR-v2r” and “mHDR-v2” in the study by Granero et al. is hereafter referred to as “mHDR-v2.” The HDR
192Ir brachytherapy sources of mHDR-v2 and mHDR-v2r were compared by Granero et al. using MC simulations, including source electrons for dosimetry near the source. Granero et al. concluded that the dosimetric differences arising from dimensional changes between the mHDR-v2 and mHDR-v2r designs were negligible at almost all locations in the vicinity of the source, and a comparison of these results with prior MC studies typically showed agreement within 0.5% for
r ≥0.25 cm.
Granero et al. state that there is little difference between mHDR-v2 and mHDR-v2r, but this conclusion is contradictory. As shown in
Figure 1, the length and diameter of the Ir source of mHDR-v2r are 0.1 mm and 0.05 mm shorter than those of mHDR-v2. These differences are not small, especially when compared with the overall source length or diameter.
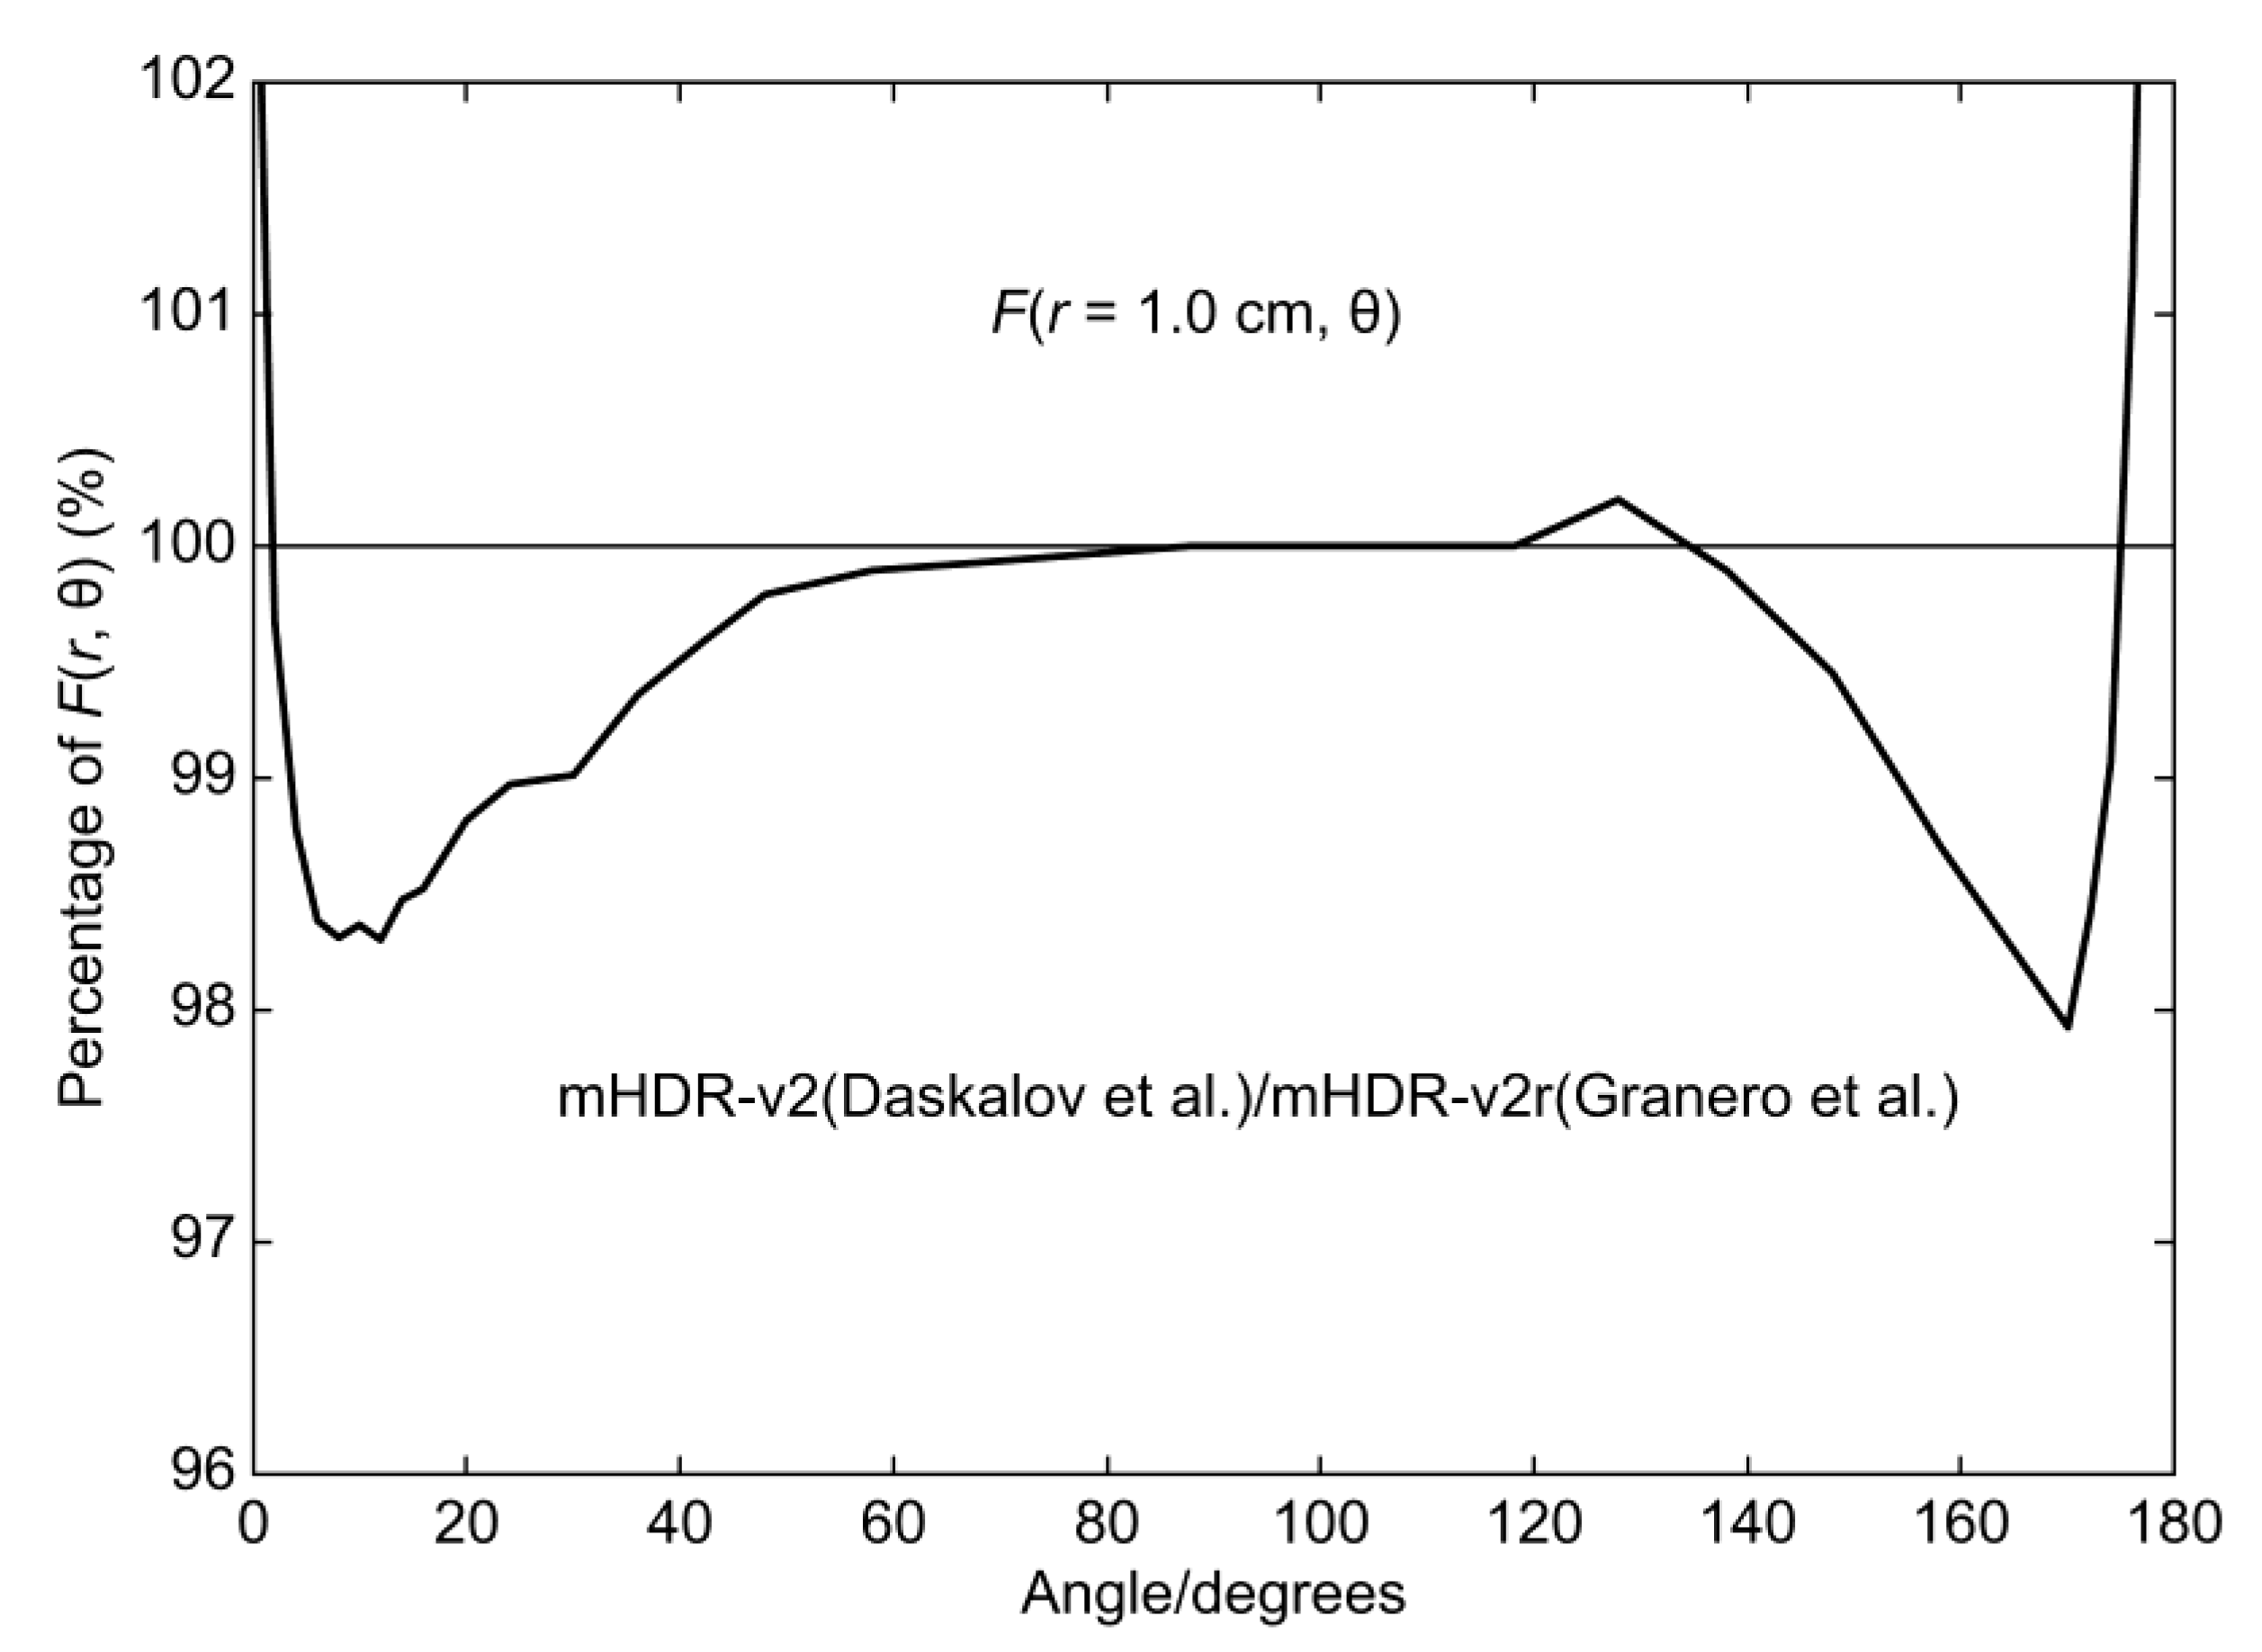
Figure 2 compares the two-dimensional (2D) anisotropy functions at 1.0 cm mHDR-v2r, as analyzed by Granero et al., and mHDR-v2, as analyzed by Daskalov et al. The mHDR-v2 value was 1.7% lower at 12° and 2.1% lower at 170° than that of mHDR-v2r, contradicting Granero’s conclusion of <0.5% difference. Currently, mHDR-v2 is not available, but if Granero's conclusions are to be believed, it is possible to use mHDR-v2 data in treatment planning and deliver with mHDR-v2r. In this case, the patient will be exposed to 2% more than planned. Therefore, it is very important to assess the dosimetric differences between mHDR-v2 and mHDR-v2r sources.
The purpose of our study is to examine the mHDR-v2 and mHDR-v2r sources more comprehensively and assess the dosimetric differences between these two sources.
MC simulations were used to investigate the dosimetry differences between mHDR-v2 and mHDR-v2r. The simulation code was implemented using Electron-Gamma Shower 5 (EGS5) code system [
15]. Of clinical importance, for accurate irradiation in the immediate vicinity of the tumor, the influence of source electrons cannot be ignored in MC simulations. Generally, if the charged-particle equilibrium holds, the collision kerma and absorbed dose are considered equal. In addition, collision kerma can be converted from the energy fluence and mass-energy absorption coefficients. However, in order to accurately investigate the behavior of photons and electrons in the extreme vicinity, this MC simulation does not use approximations using energy fluences and mass-energy absorption coefficients. The absorbed dose or air kerma rate summarizes the energy deposit, or kinetic energy, of each particle emitted from a source. All MC simulation results were obtained stochastically. Based on the calculation results, we evaluate the dosimetry differences between the two sources and present more detailed dosimetry results that are clinically useful. This study is crucial for creating more accurate treatment plans in brachytherapy applications and increasing patient safety.
2. Materials and Methods
2.1. Description of source materials
The dimensions of the mHDR-v2 source used in the simulation were obtained from the studies by Daskalov et al. [
7] (
Figure 1(b)) and Perez-Calatayud et al. [
10] (
Figure 3). The dimensions of the mHDR-v2r source were obtained from the study by Granero et al. [
9] (
Figure 1). The radius of curvature of the head of the source capsules and the edge of the iridium (Ir) source of the mHDR-v2 model were accurately reproduced and described in detail in the EGS5 combinatorial geometry (CG) subprogram. According to the previous studies by Daskalov et al. and Granero et al., the composition weight ratios of the capsule and cable were 2% Mn, 1% Si, 17% Cr, 12% Ni, and 68% Fe. The length of the source cable was 2 mm. The densities of the capsules and cables were set to 8.02 gcm
−3 and 4.81 gcm
−3, respectively. In the mHDR-v2r model, the gap between the Ir source and capsule was dry air (0% humidity).
2.2. Photon and electron spectra
The
192Ir photon spectrum produced by the National Nuclear Data Center [
16,
17], which was subsequently quoted by Rivard et al. [
8], was input into the MC simulations (total photon spectra = 2.2992 photons/Bq, with energy exceeding 10 keV). The electron spectrum included β-decay, and internal conversion electrons were also used in the MC simulation, as recommended by the International Commission on Radiological Protection [
18,
19]. The sum of the continuous spectra of β decay at an energy value greater than 10 keV was 0.9192 electrons/Bq (energy bin width × differential spectrum), whereas that of the internal conversion electrons at energy values exceeding 10 keV was 0.1531 electrons/Bq. The total summation was 1.0723 electrons/Bq. This value differs from that obtained by Granero et al. (1.113 electrons/Bq). The total of our electron spectra is 3.7% lower than that of Granero et al.
2.3. Coordinate system of MC and description of the detected volume
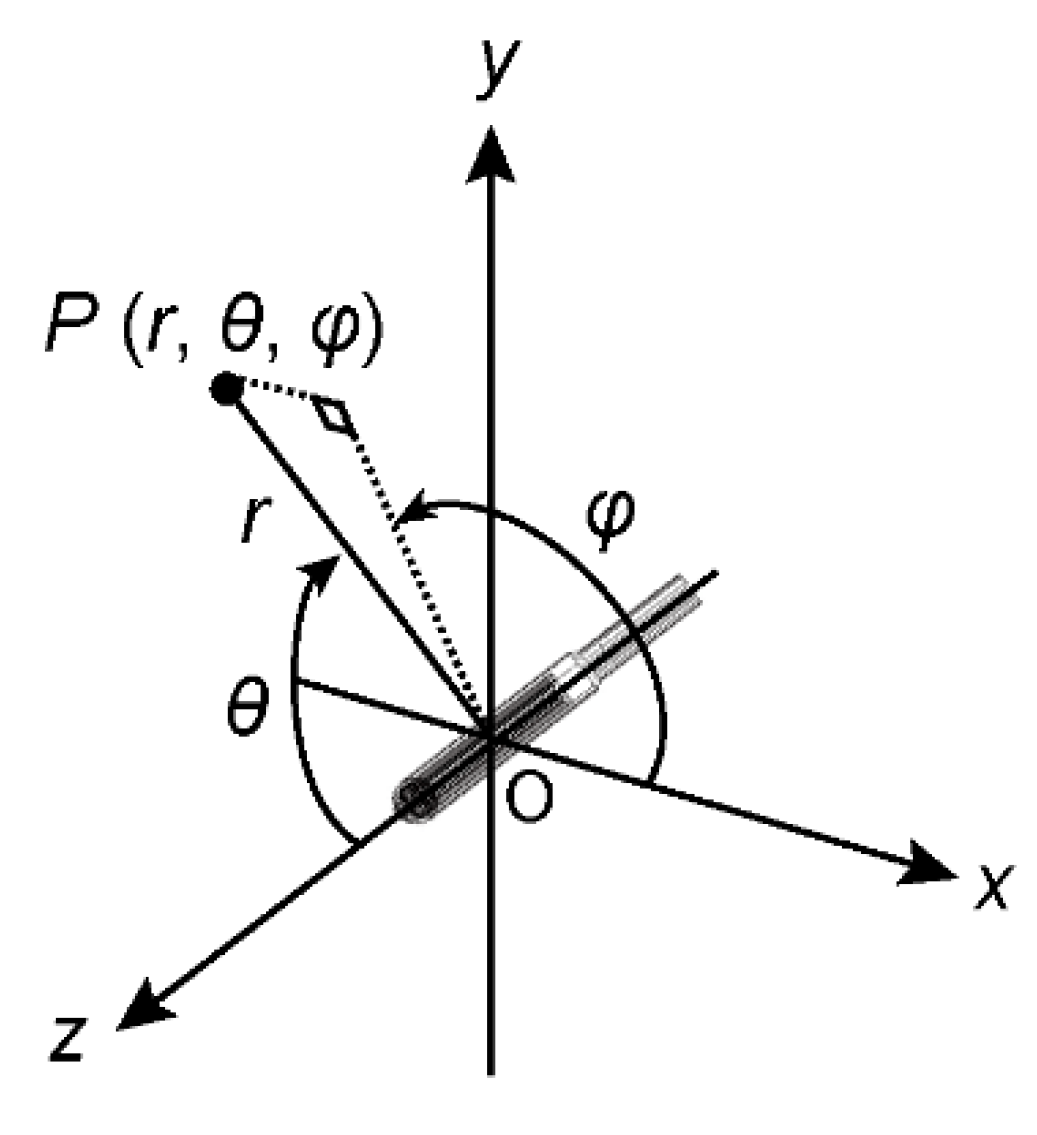
As shown in
Figure 3, the coordinates are the longitudinal axis of the radiation source along the
z-axis, and the tip direction of the radiation source from the cable is positive. The center of the source is the origin of the coordinates. In the polar coordinate system,
r, θ, and φ represent the radius, polar angle, and azimuthal angle of the point of interest,
P, respectively. The volume
V(
P) of the peripheral area of
P(
r, θ, φ) was aggregated from
r − ∆
r to
r + ∆
r and θ − ∆θ to θ + ∆θ.
2.4. Common MC methods
The hardware used for the MC simulations consisted of two computer clusters [
20] connected by dozens of single-board computers and two personal computers with 8- and 4-core central processing units. All computers performed the calculations in parallel using the message-passing interface (MPI) technique. The simulation code used was MPI for EGS5, that is, EGS5MPI [
21]. The energy deposit or the kinetic energy of the electrons aggregated in the target area. Notably, these physical quantities included scattering from the other target areas. The following parameters were adopted in various regions or media: sampling of the angular distributions of photoelectrons, K- and L-edge fluorescent photons, K and L Auger electrons, Rayleigh scattering, linearly polarized photon scattering, incoherent scattering, and Doppler broadening of the Compton scattering energies. The transport cut-off energy (denoting the kinetic energies for electrons) level was defined as 10 keV for both electrons and photons.
2.5. MC methods of dose rate
The photons and electrons were independently simulated as particles from the radiation source with cut-off energies of 10 keV. To obtain the absorbed dose
D, the energy deposit was aggregated and divided by a small mass in the region of the point of interest,
P. The absorbed dose rate,
D˙, is calculated for any
D by considering the number of source photons and electrons, along with the emission rate of the radiation source. The
D of
P was tabulated from 0.05–20 cm. The aggregation width, ∆
r, was 0.0025 cm from 0.05–1.5 cm and 0.025 cm from 2–20 cm. The angles were summed from 0° to 180° at increments of 1°. For 0◦< θ < 180◦, the aggregation width was ∆θ = 0.1◦ (0.001745 rad), whereas that for θ = 0◦ or 180◦ was ∆θ = 0.5◦ (0.08727 rad). The diameter of the water-sphere phantom was set to 40 cm. Pure water, without gas, was used for the phantom, as recommended by TG-43U1 [
1], with a density of 0.998 gcm
−3. We calculated 1.0 × 10
11 events for photons and electrons for each source, such that the standard error of the absorbed dose at
r = 1 cm and θ = 90° was ≤0.2%. Two of the single-board computer clusters and two personal computers were used to calculate
D. As a typical calculation time example, 5.63 days CPU time per 1.0 × 10
10 events were required to calculate the photons emitted from the mHDR-v2r source when using an 8-core personal computer.
2.6. MC methods of air kerma strength
To obtain the air kerma,
K(
r), for the
r of transverse-axis distances, the kinetic energy, which was transferred to the electrons by photons in a small region of the target air, was aggregated using the MC simulation and divided by the volume mass of that region. The air kerma rate,
K˙(
r), was calculated for
K(
r) by considering the number of photons and emission rate of the radiation source. The air kerma strength,
SK, was calculated using a linear function fit from
K˙ (
r) ·
r2 for each
r. Spherical shell phantoms of various radii were used to calculate
K. These radii were located at 10 cm intervals (from 10–120 cm) from the center of the source. The thickness of the air layers was 1 mm, and the remaining space was a vacuum. For each
r, the aggregation width was ∆
r = 0.05 cm and ∆θ = 1° (0.01745 rad) at θ = 90°. The air was dry (0% humidity), as recommended by the AAPM 229 Report [
10]. The weight composition ratios were N = 75.5%, O = 23.2%, and Ar = 1.3%. The density was 0.00120 gcm
−3. Only photons with a cut-off energy of 10 keV were generated from the source. The number of events was 1.0 × 10
12, such that the standard error was ≤0.3% at
r = 10 cm. The calculations were performed on two single-board computer clusters. It took 2.51 days and 3.63 days CPU time for the mHDR-v2r and mHDR-v2 sources, respectively, per 5.0 × 10
10 events.
3. Results
The results of the study by Granero et al. mentioned in the present study are those of the mHDR-v2r source examined at PENE-LOPE2008. The other experimental results are those for the mHDR-v2 source.
3.1. Contribution of source electron and gamma of each source
For each source, the contributions of the source electrons and photons toward the dose rates near the source were compared. These contributions, along with the results of Granero et al. [
9], are shown in
Figure 4 and
Figure 5. From
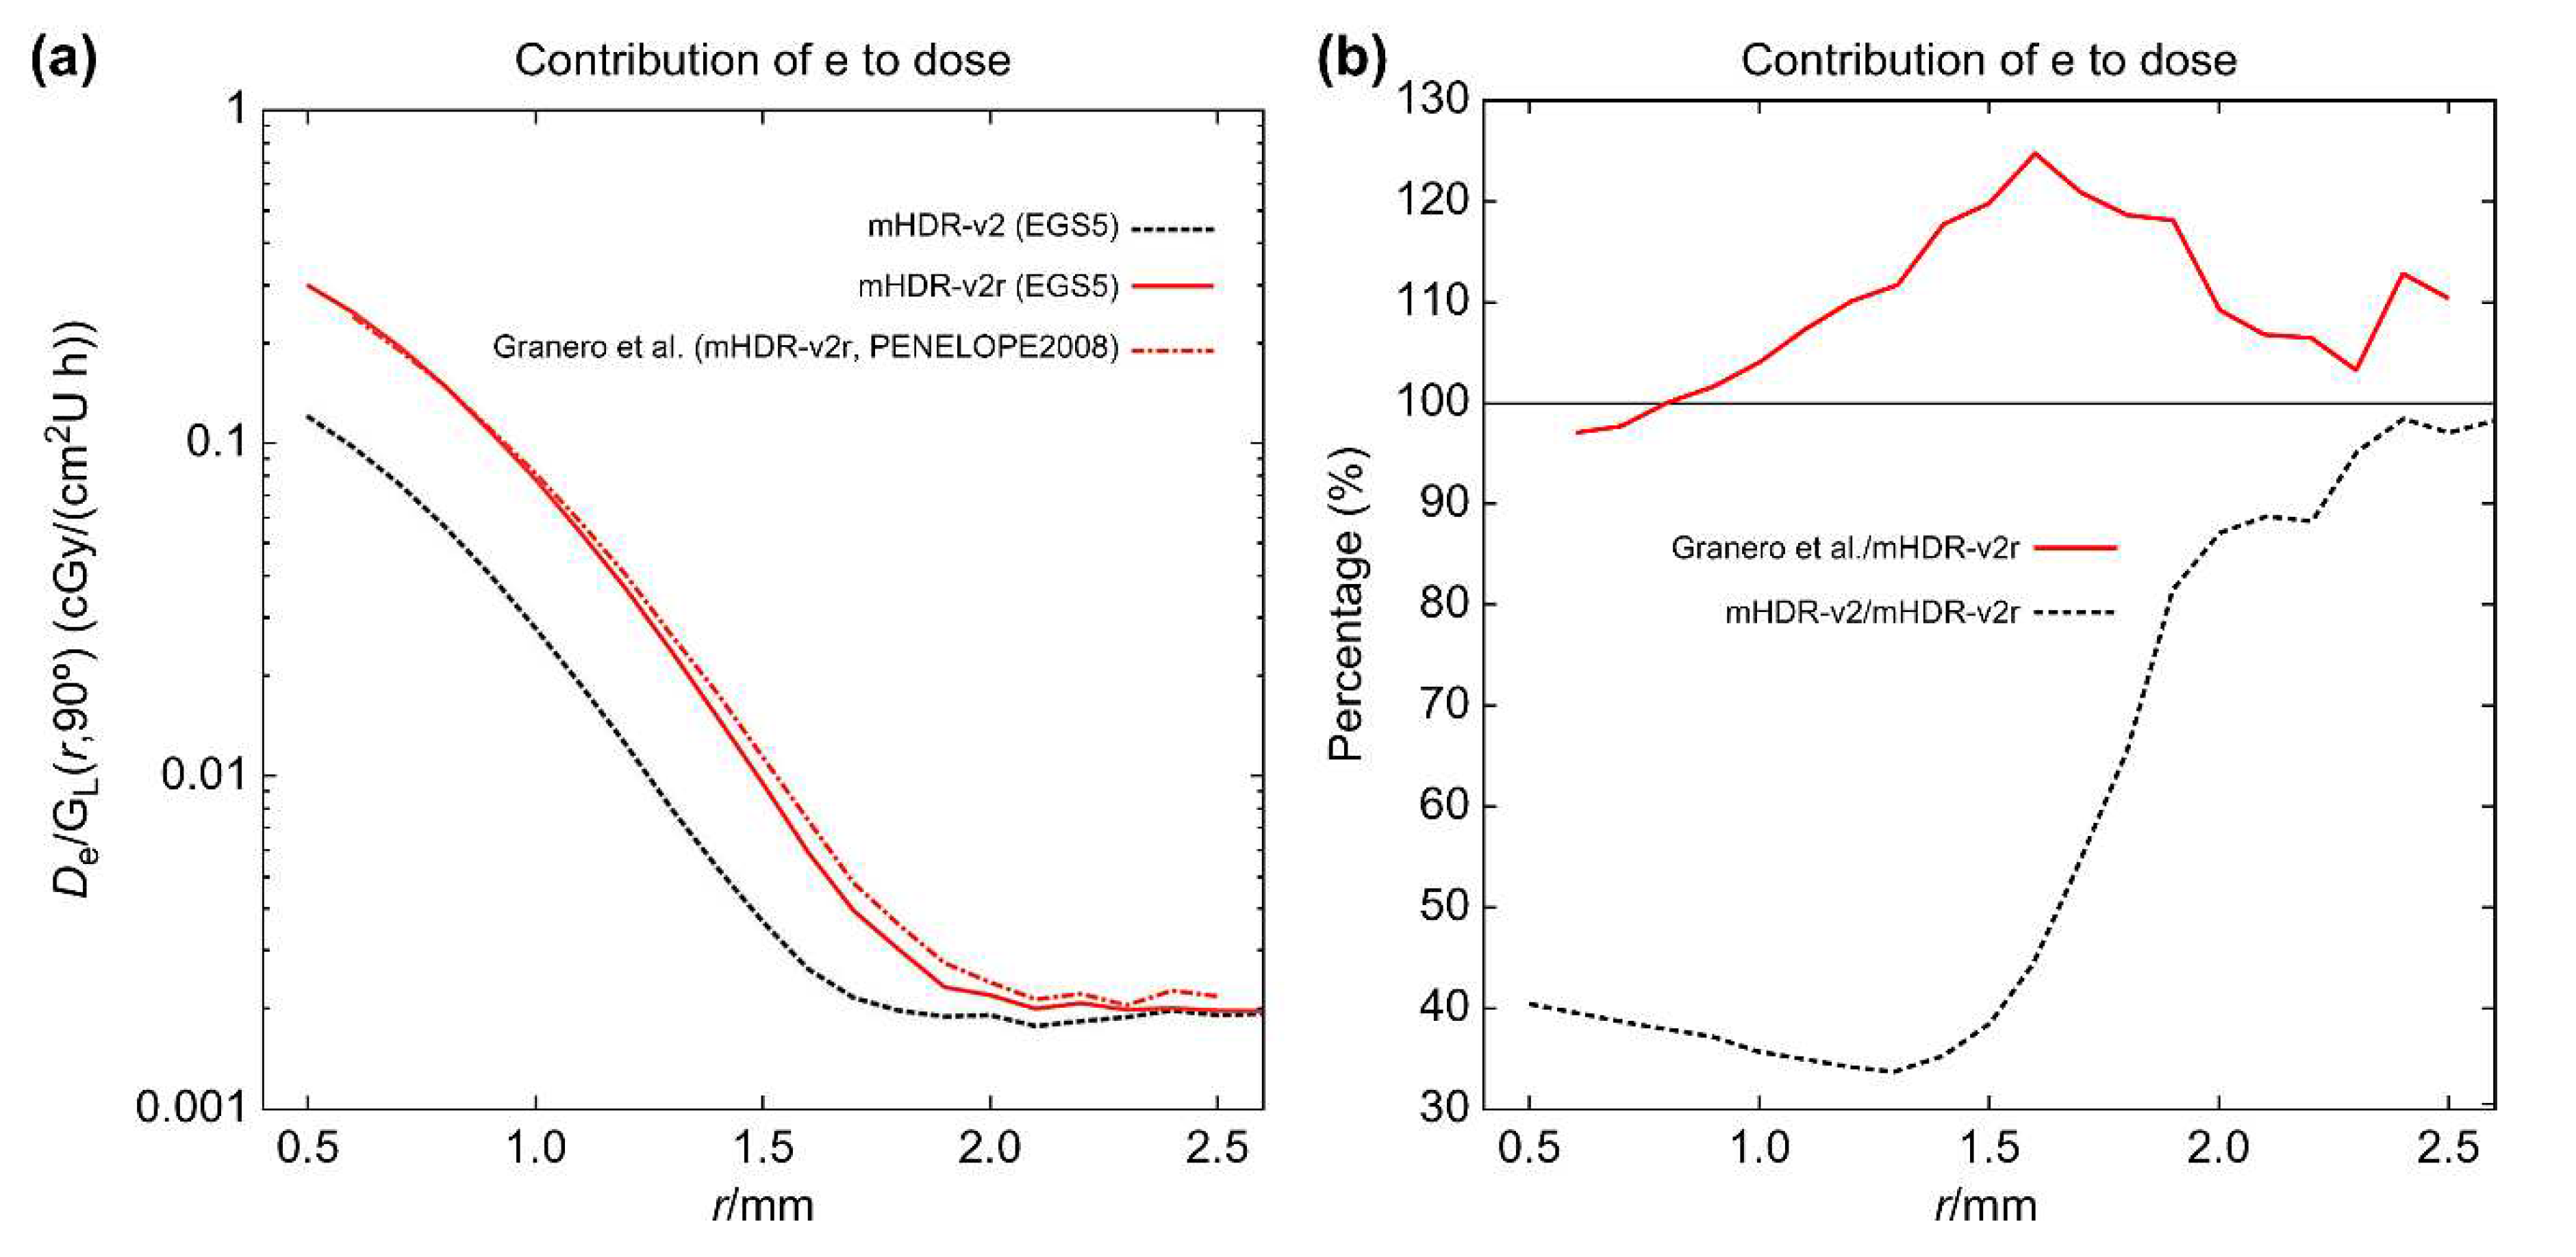
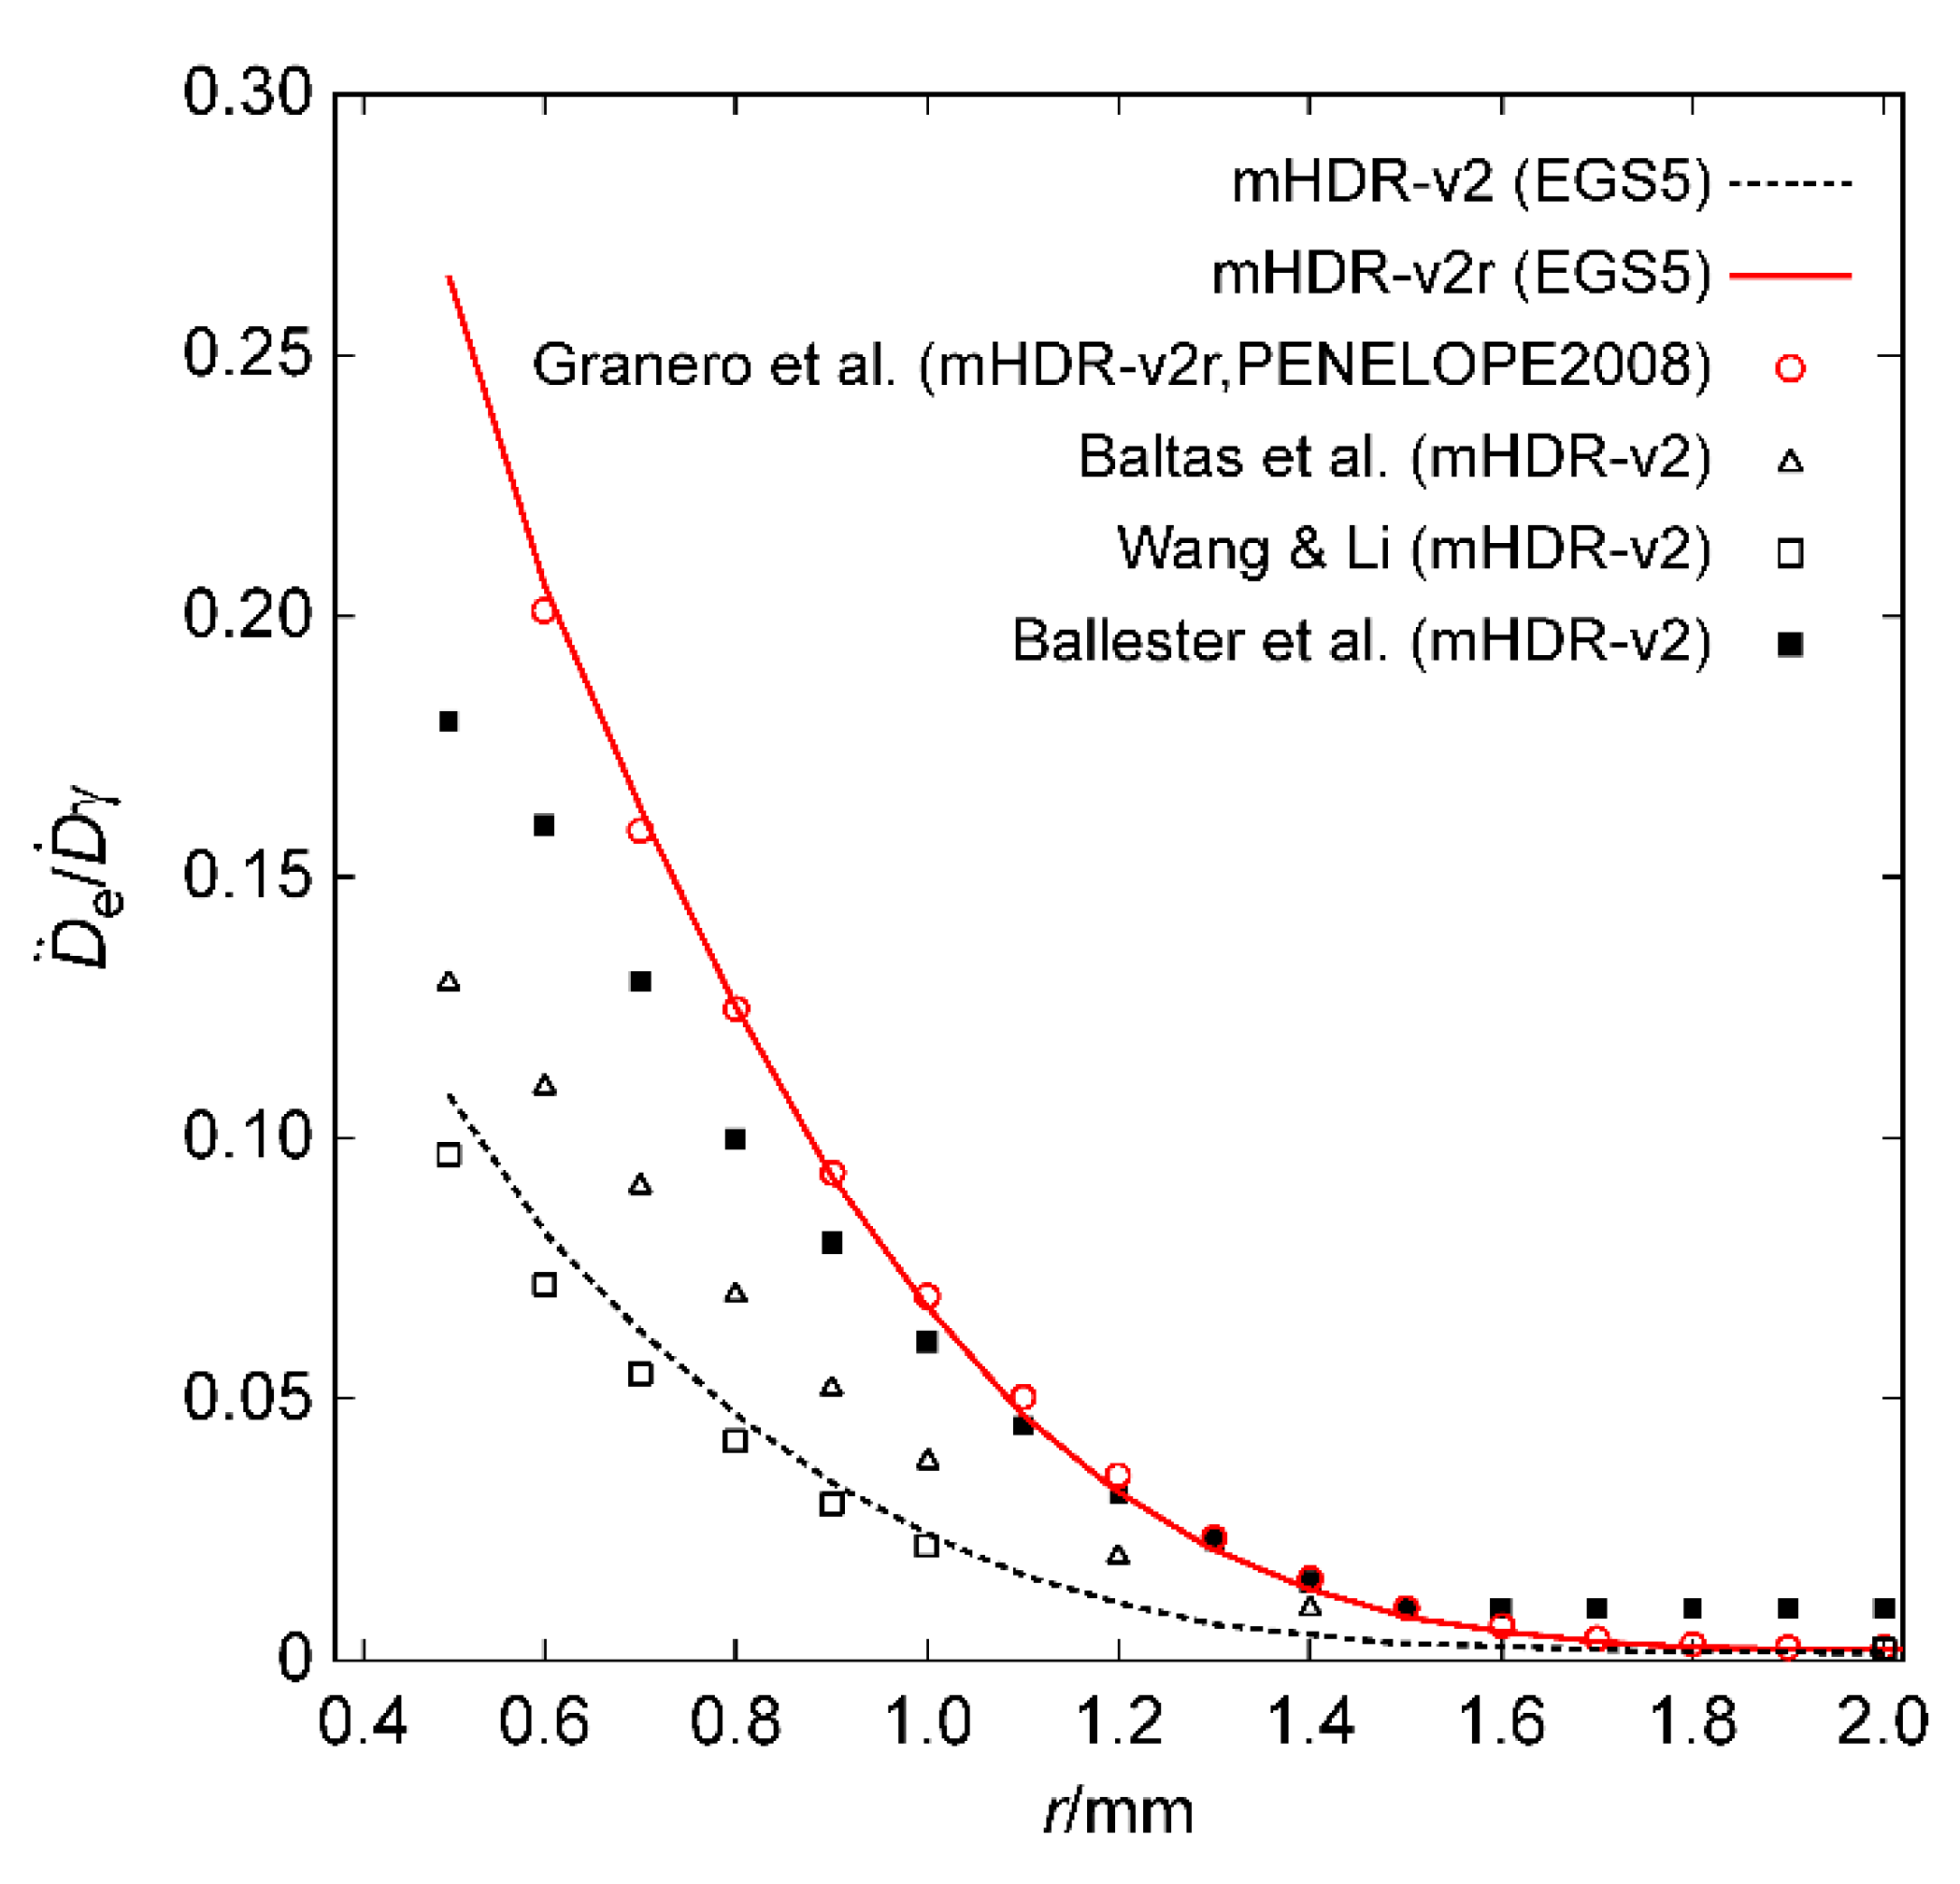
Figure 4 (a), the results of the source electron in the mHDR-v2r source appear to be consistent with those of Granero et al.; however,
Figure 4 (b) shows a difference of ≥20% around 1.5 mm. The results of the mHDR-v2 source deviate from those of the mHDR-v2r source, up to a distance of 2 mm, with a difference of >60%. From
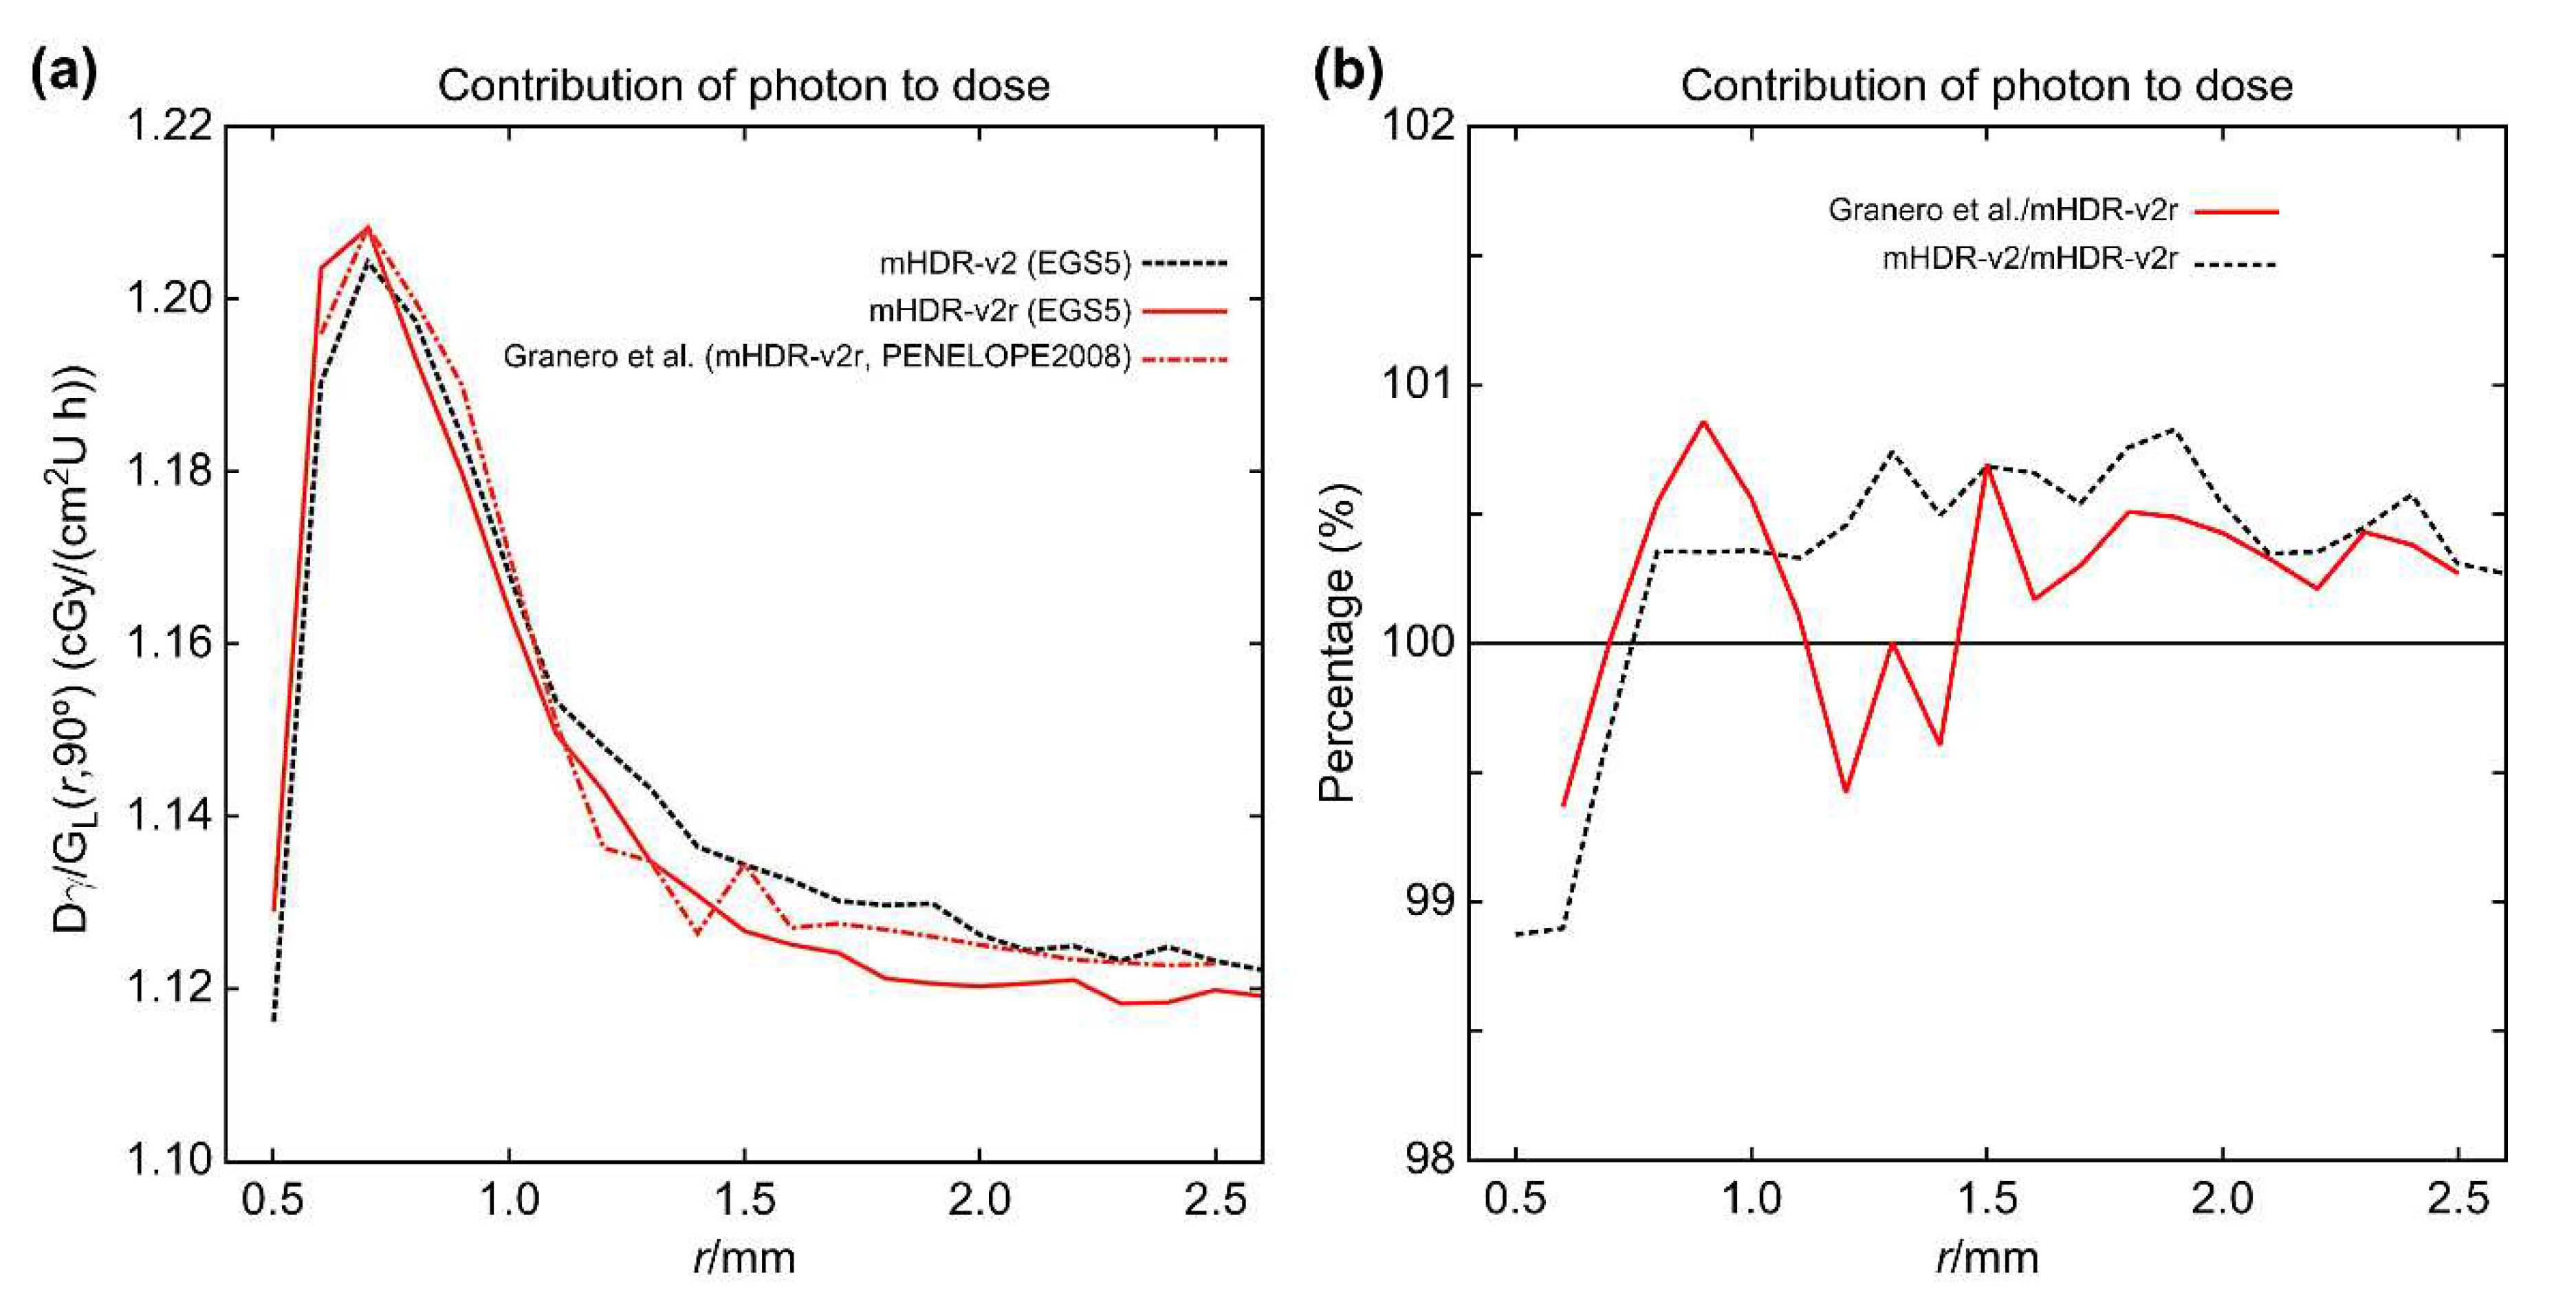
Figure 5, the results of the source photon in the mHDR-v2r and mHDR-v2 sources and those of Granero et al. fluctuate in the 1% range and are consistent. The ratio of the absorbed dose of the source electrons to that of the source photons near the radiation source is shown in
Figure 6, along with the results of other experimental groups [
9,
11,
12,
13]. The results of Granero et al. were inconsistent with those of other experimental groups; however, our mHDR-v2r results were consistent with those of Granero et al. In addition, the results for the mHDR-v2 source were inconsistent with those for the mHDR-v2r source.
3.2. TG-43U1 dataset: Dose rate constants for the model mHDR-v2r and mHDR-v2 sources
The air kerma strength, SK (per 1 s and 1 Bq), obtained from the measurement of the air kerma rate, K˙, at 12 points from 10 to 120 cm of the mHDR-v2r source was 2.7303 ± 0.0056 µGym2 (Bqs)−1. Based on the absorbed dose rate at r = 1 cm and θ = 90°, the dose rate constant Λ for the mHDR-v2r source can be calculated as follows:
Λ=(1.1186 ± 0.0031) cGyh−1 U−1 (mHDR-v2r)
Similarly, the mHDR-v2 dose rate constant, Λ, can be calculated as follows:
Λ = (1.1151 ± 0.0026) cGy h−1 U−1 (mHDR-v2)
The value of the dose-rate constant for the mHDR-v2r source was 0.3% higher than that for the mHDR-v2 source. Granero et al. reported a value of (1.1121 ± 0.0008) cGyh
−1U
−1 for the mHDR-v2r source, whereas the consensus value for the mHDR-v2 source is (1.109 ± 0.012) cGy
−1U
−1 [
10]. Our observations were slightly higher than the consensus value for the mHDR-v2 source but were within the margin of error.
3.3. TG-43U1 dataset: Radial dose function for the model mHDR-v2 and mHDR-v2r source
The results of the radial dose function
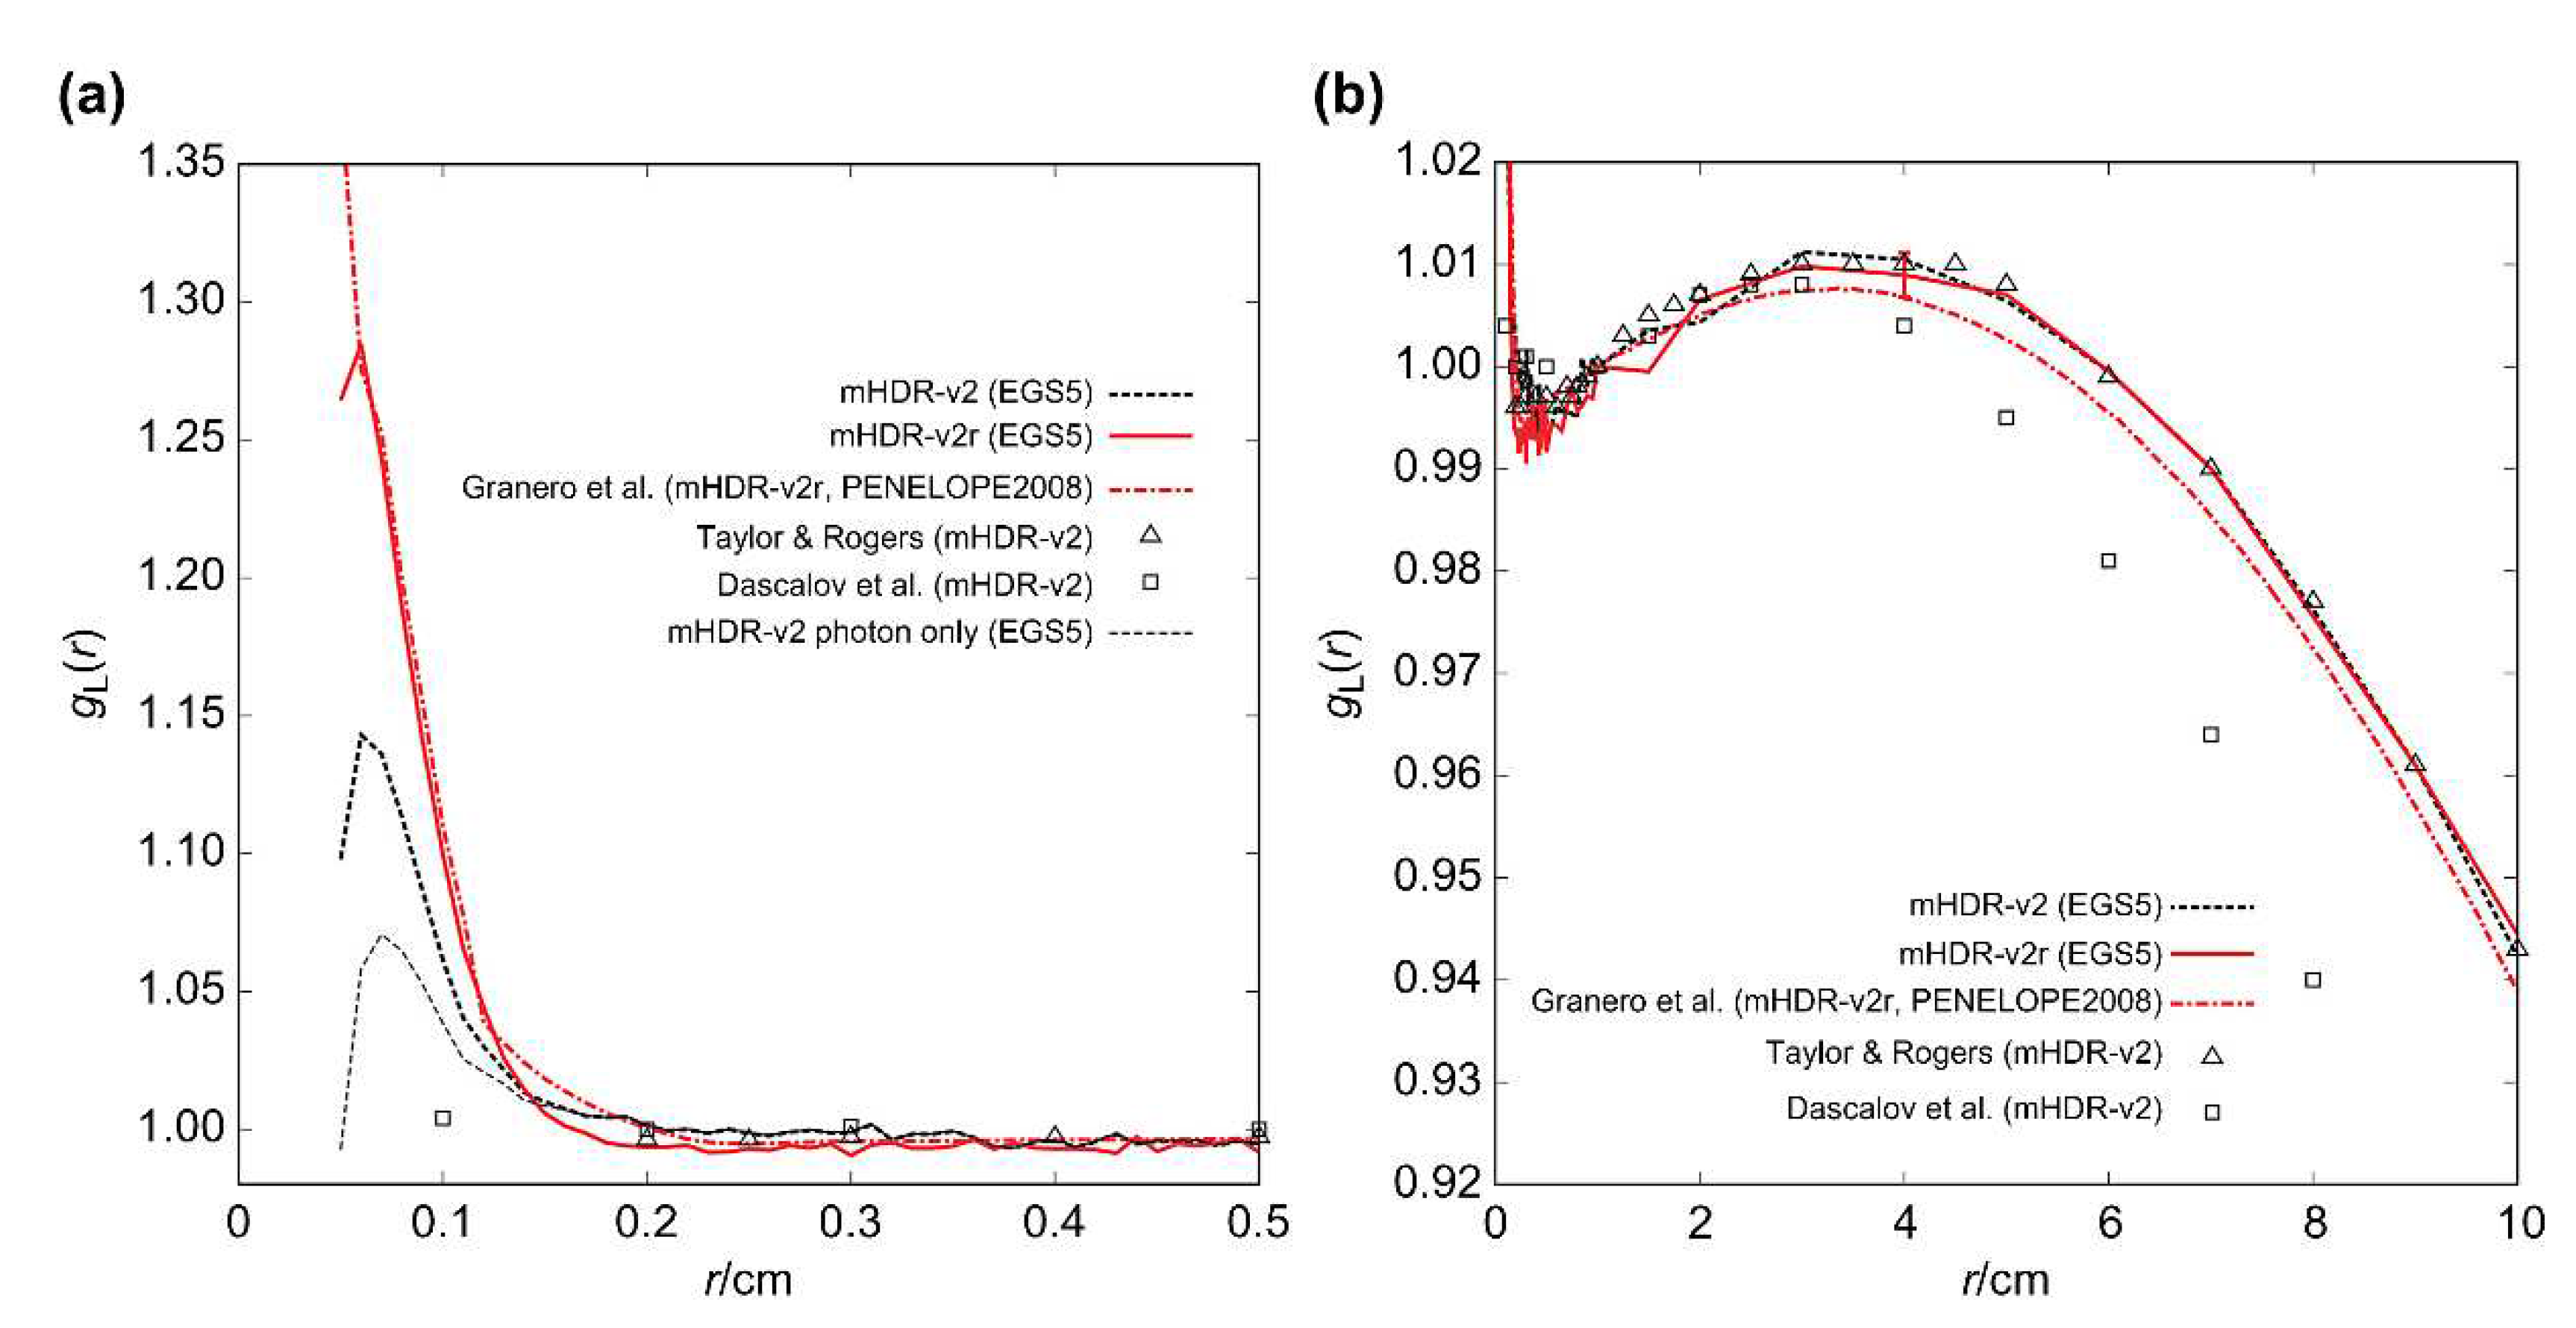
gL(r) are shown in
Figure 7, along with those of the other experimental groups [
7,
9,
14]. According to Granero et al., the vicinity of the mHDR-v2r source exhibited a sharp peak, which is inconsistent with the observations of other experimental results. Our mHDR-v2r results were consistent with those of Granero et al. (
Figure 7 (a)). A comparison of the mHDR-v2 and mHDR-v2r sources showed that there was a difference depending on the vicinity. In addition, considering only the photons emitted from the mHDR-v2 source, there was a slight peak in g
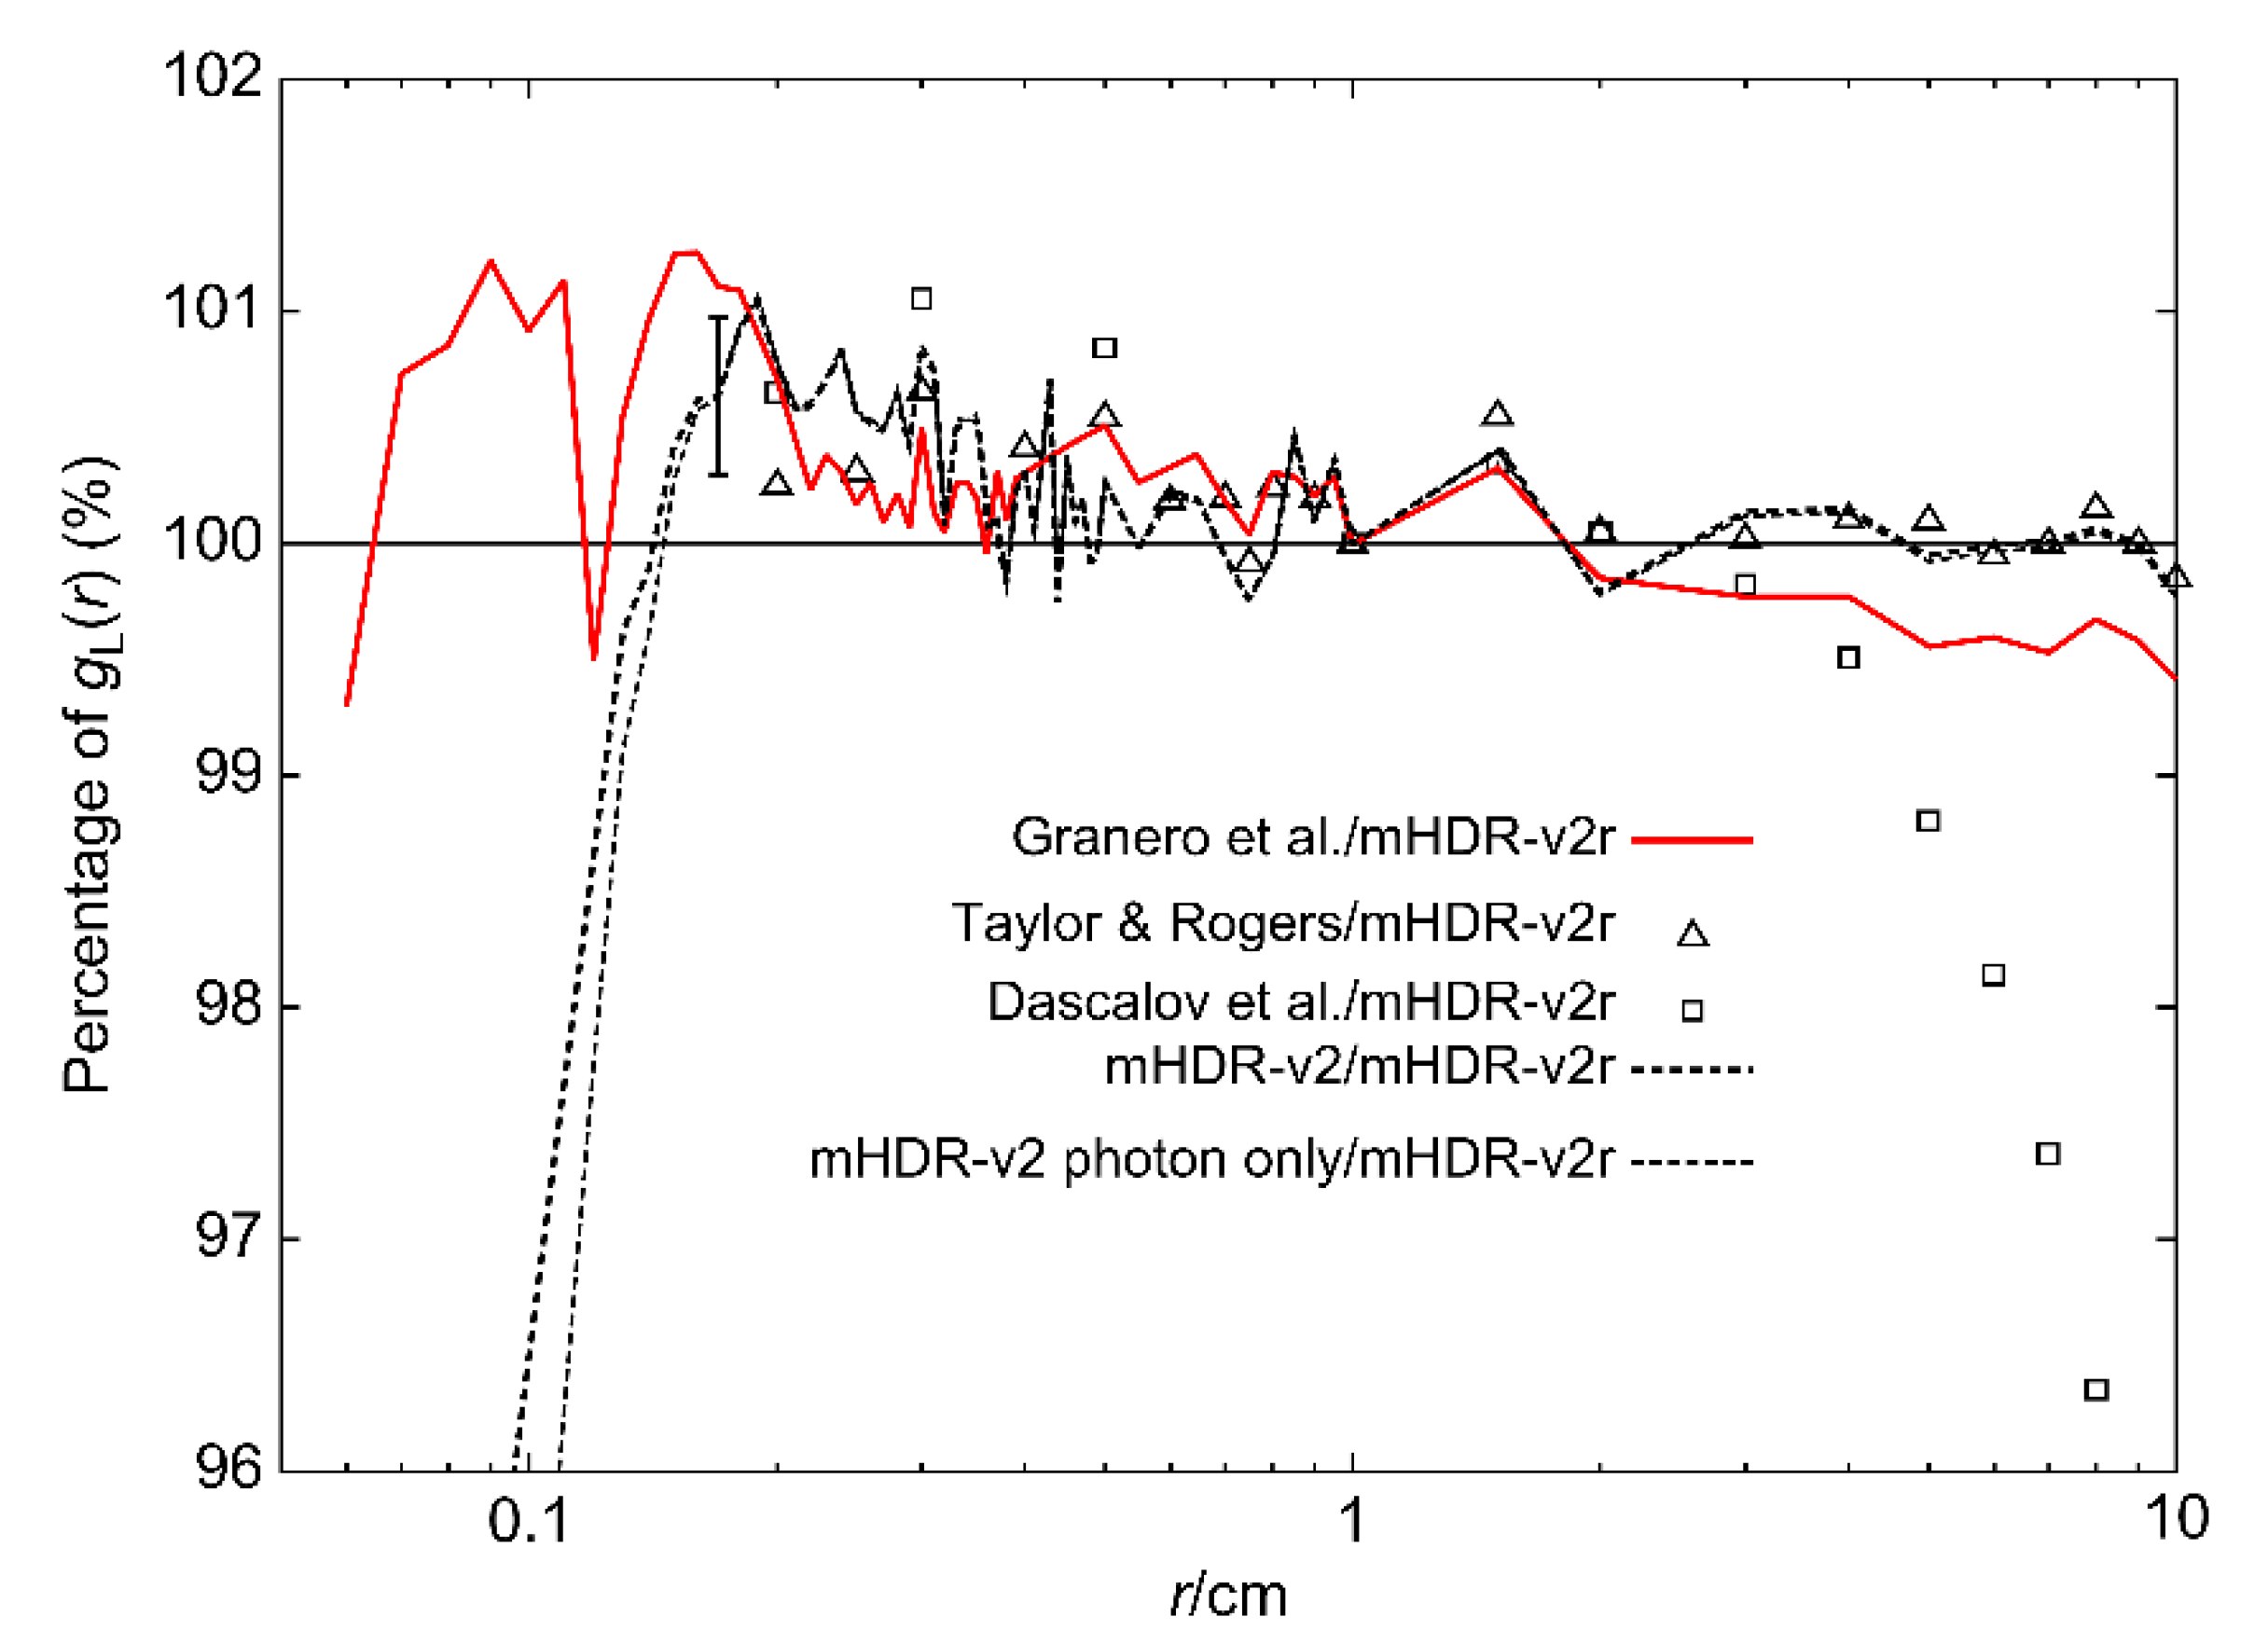
L(r), which differed from the results of Daskalov et al. The ratio of each result to the mHDR-v2r of
gL(r) is shown in
Figure 8. The difference between our results and those of Granero et al. was >1% in some places (<0.2 cm), but it was generally <1%. Our results and those of the other experiments were consistent within 1.1% (0.2−4 cm).
3.4. TG-43U1 dataset: 2D anisotropy function for the model mHDR-v2 and mHDR-v2r sources
The results of the 2D anisotropy function,
F(
r, θ), are shown in Figures 9−12, along with those of a previous experimental group [
7,
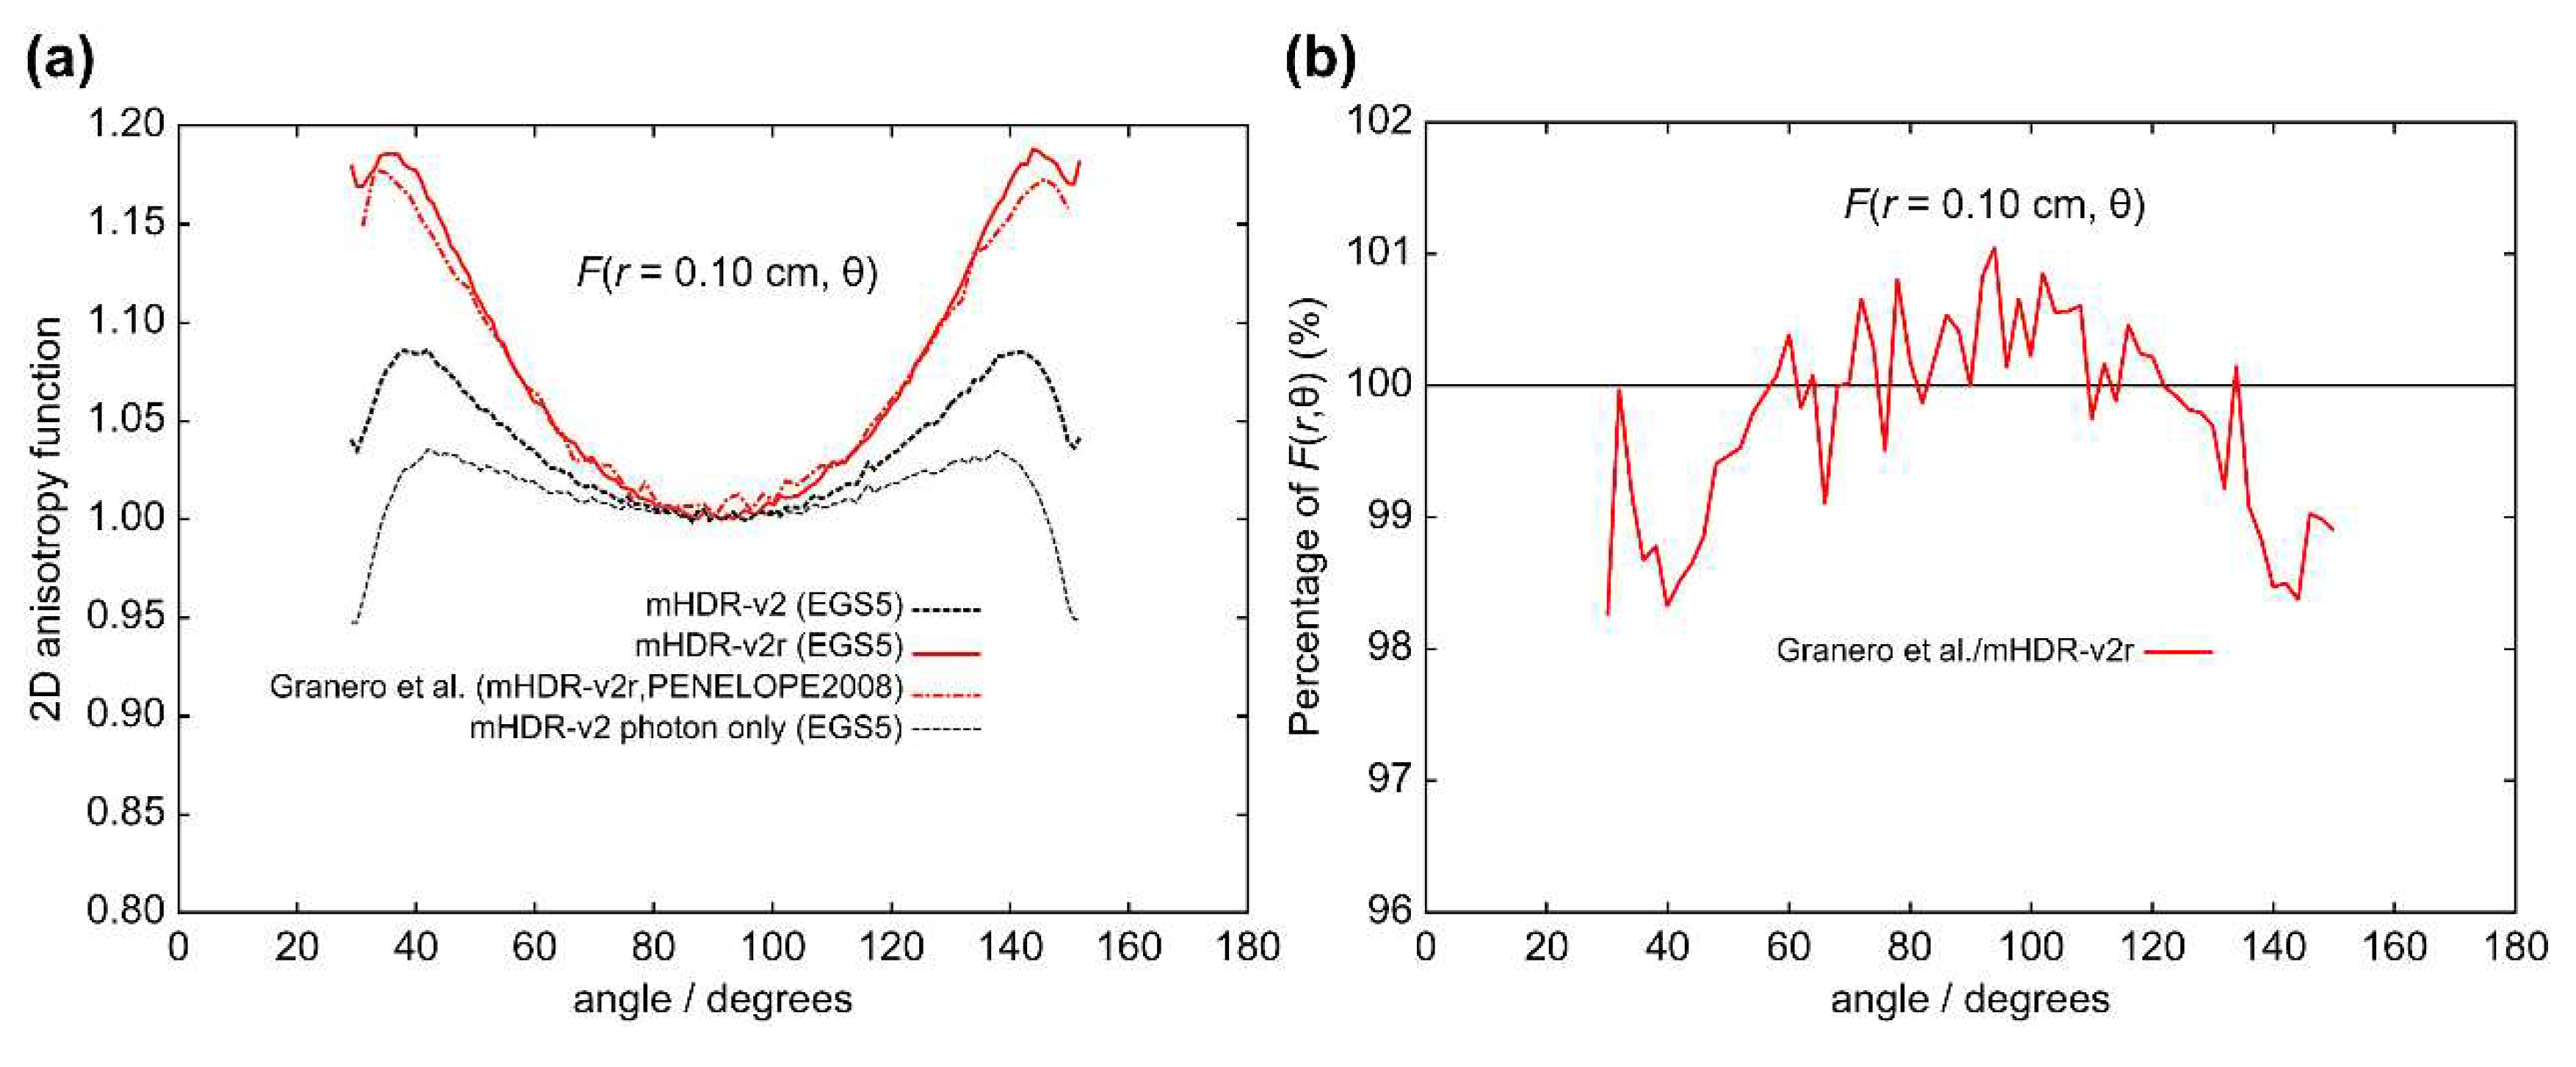
9]. In each figure, (a) shows the 2D anisotropy function value, and (b) shows the ratio of the 2D anisotropy function in each experiment to mHDR-v2r. From
Figure 9 (
r = 0.10 cm), the results of Granero et al. and those of our mHDR-v2r source appear to be consistent. However, the results of Granero et al. deviate from our results by −1.7% at 40°, +1.1% at 94°, and −1.6% at 144°.
From
Figure 10 (
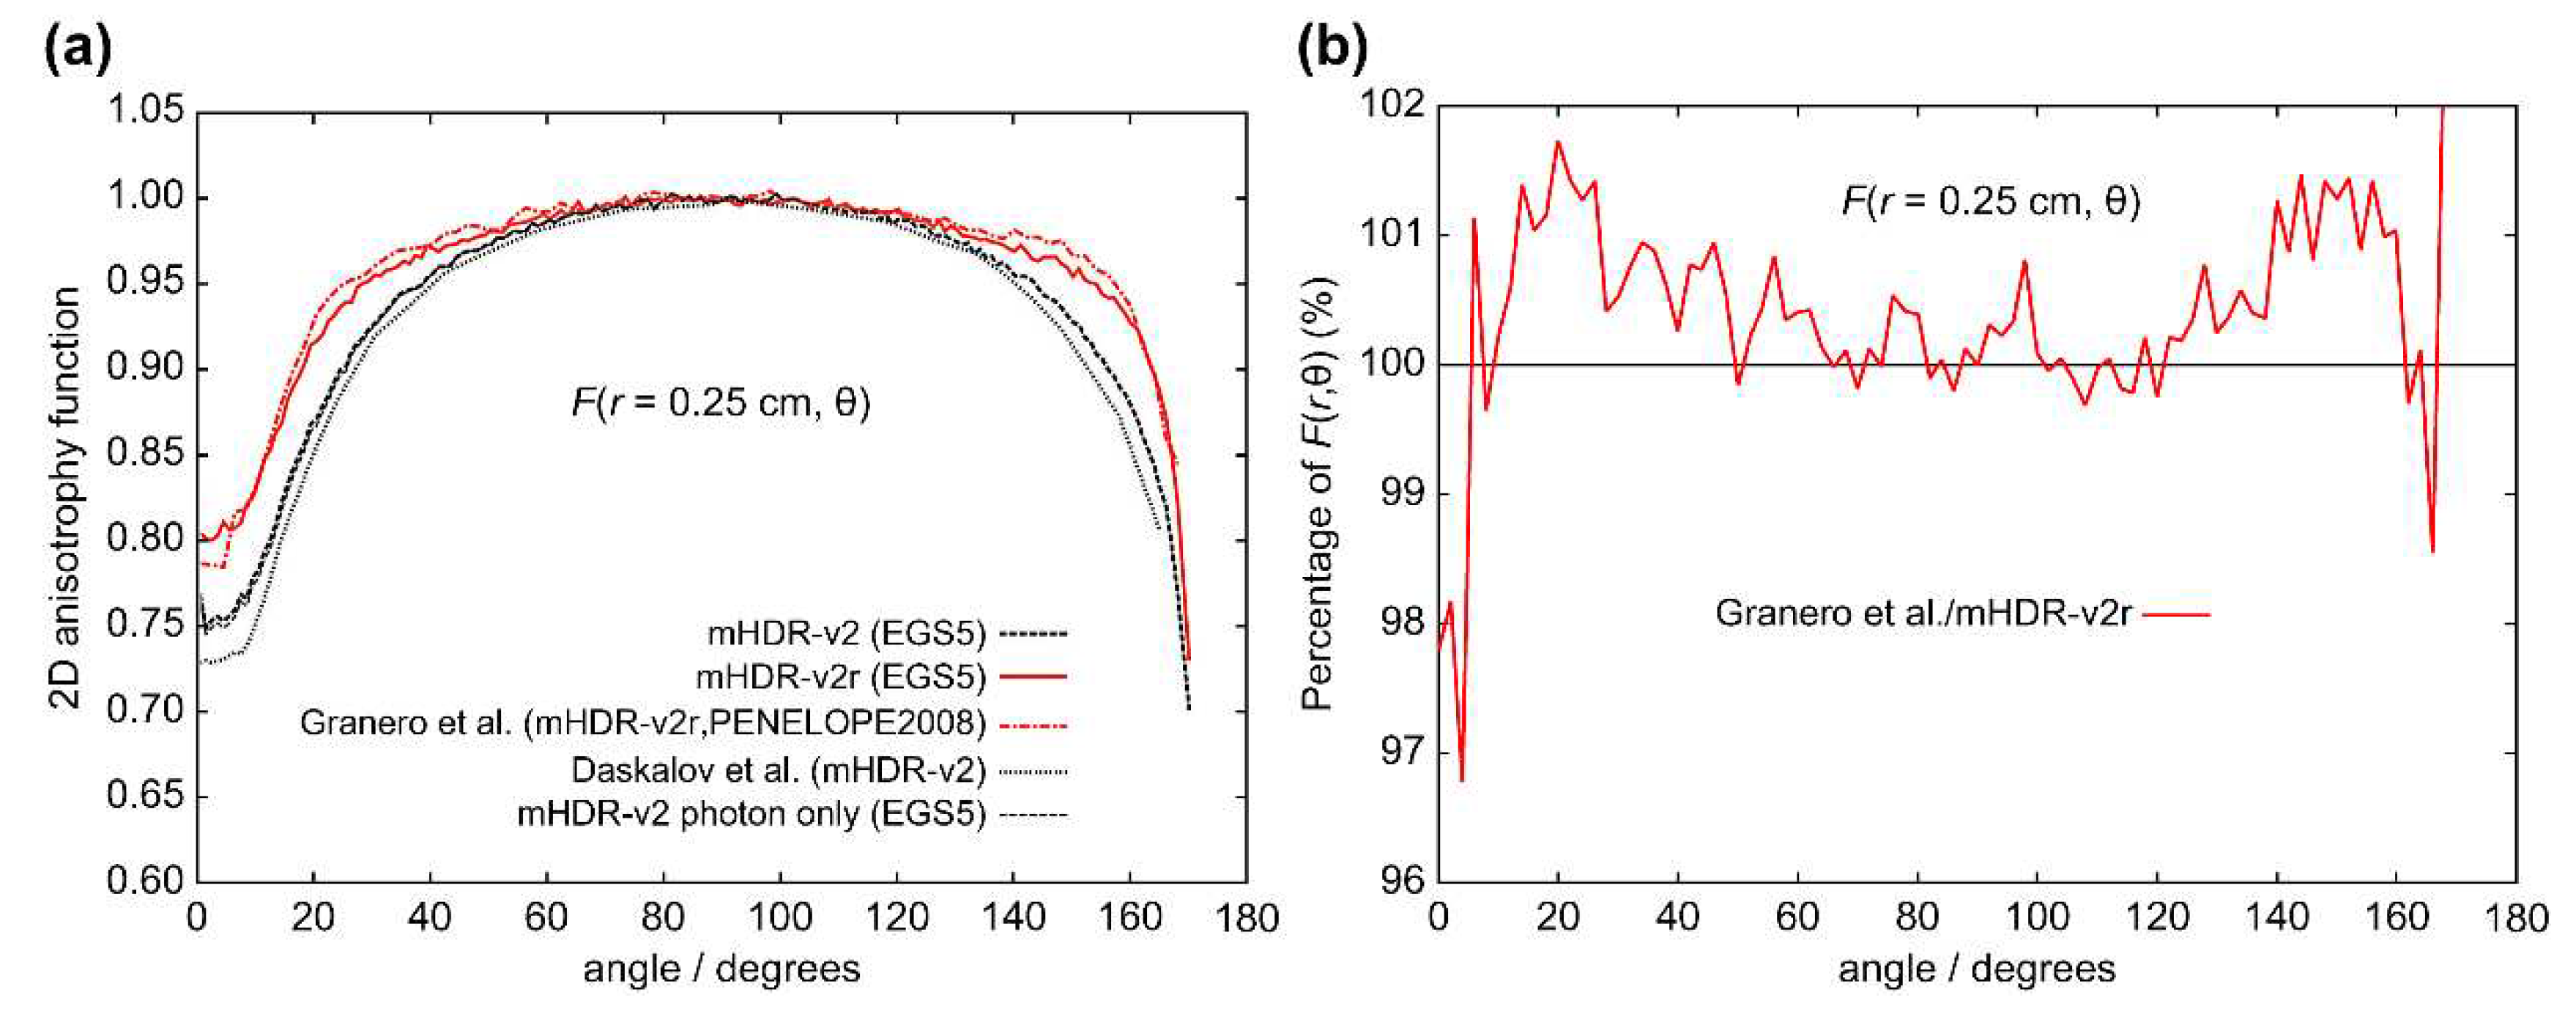
r = 0.25 cm), the results of Granero et al. deviate from ours by +1.7% at 20° and +1.5% at 144°. From
Figure 11 (
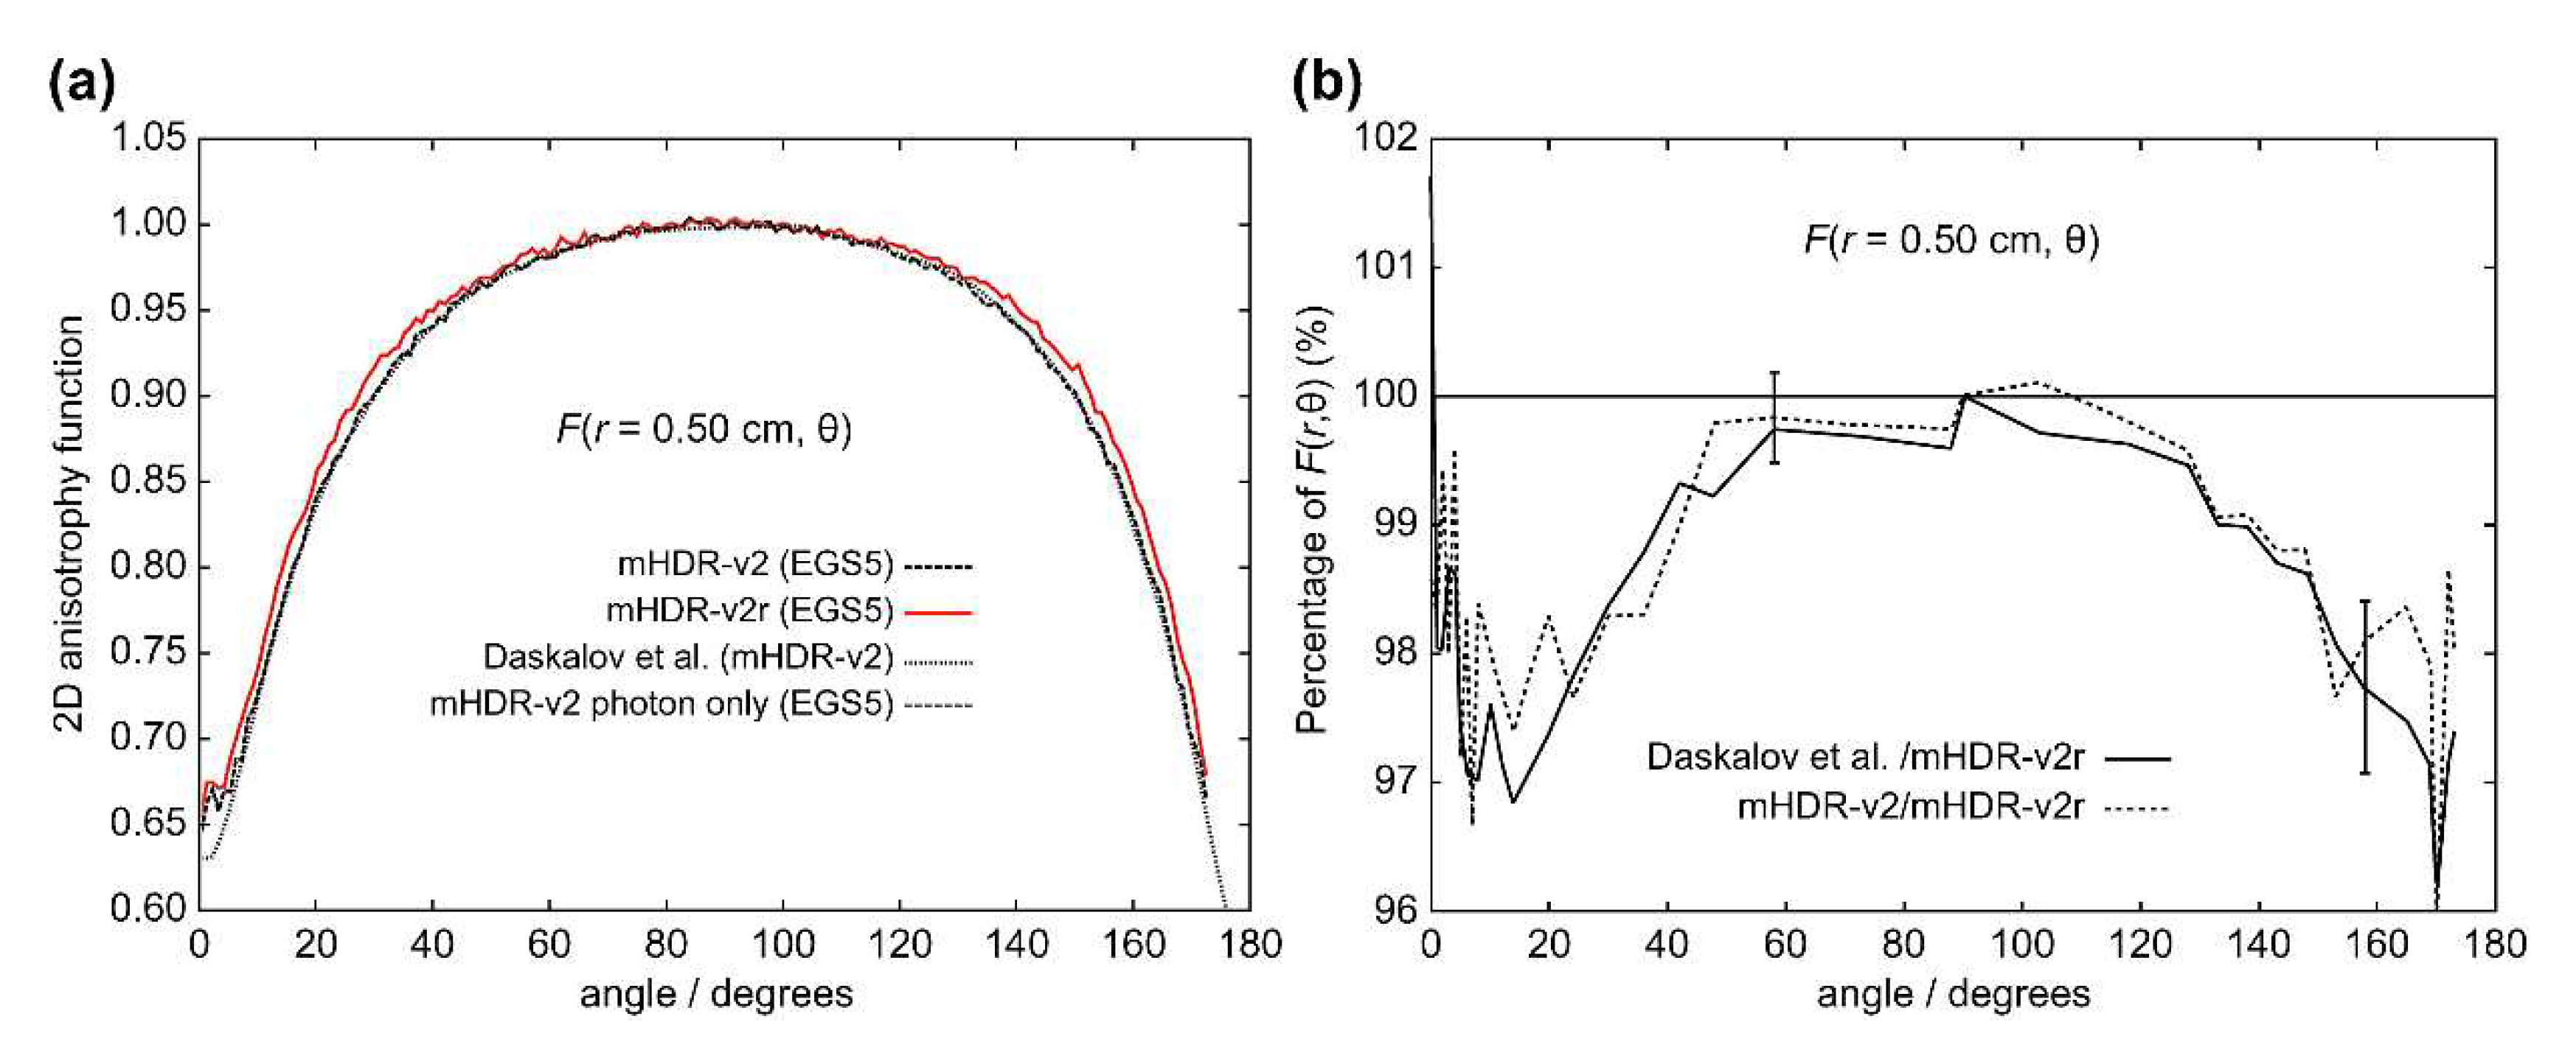
r = 0.50 cm), the difference between the mHDR-v2r and mHDR-v2 sources was −3.2% at 14°, and the results of mHDR-v2r are inconsistent with the results of mHDR-v2 and Daskalov et al. However, the results of mHDR-v2 and Daskalov et al. are in good agreement. From
Figure 12 (
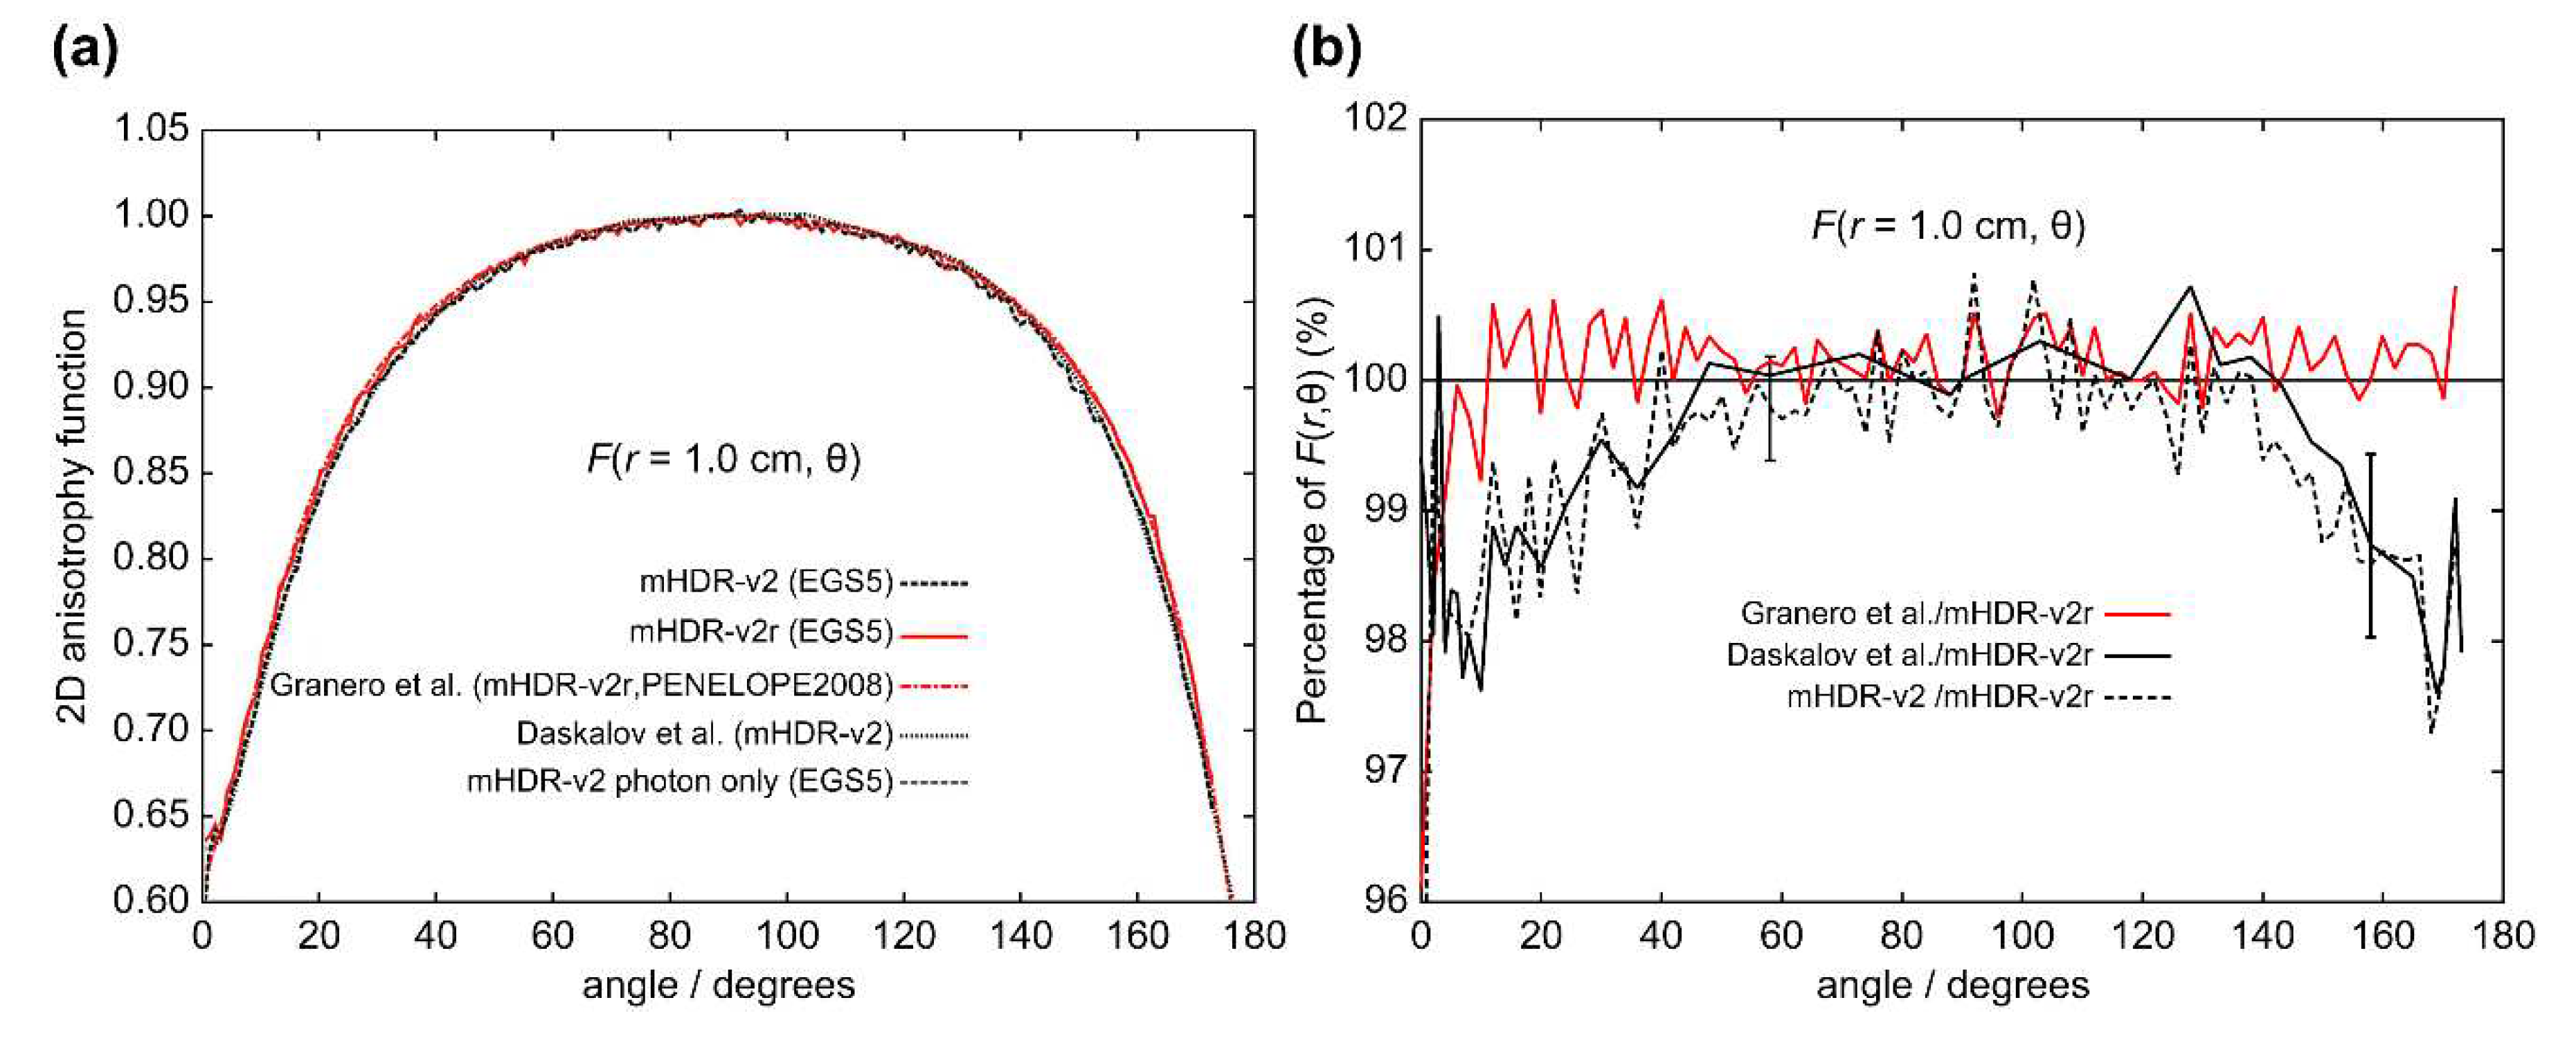
r = 1.0 cm), the results for the mHDR-v2r source were consistent with those of Granero et al. The difference between the mHDR-v2r and mHDR-v2 sources was −2.0% at 8°. The error bars in
Figure 11 and
Figure 12 are for mHDR-v2r and mHDR-v2 at 58° and for mHDR-v2r and Daskalov et al. at 158°, respectively. These
F(
r,
θ) differences are given in % in
Table 1.
3.5. Uncertainties of typical D˙ (0.10 cm, 90◦), D˙ (1.0 cm, 90◦), and K˙ (10 cm)
For the uncertainty of the source geometry, capsule geometry, dynamic source design,
192Ir photon spectrum, and MC physics, please refer to the studies by Granero et al. [
9] and Rivard et al. [
8]. The uncertainty of the
192Ir electron spectrum is 0.03% from nuclear decay data for dosimetry calculation (DECDC2) [
19]. The uncertainty of volume averaging represents the difference between the median extrapolated from the volume-averaged distance and the value aggregated in the bin. The uncertainties of volume averaging at
D˙ (1.0 cm, 90◦) and
K˙ (10 cm) were <0.002%. The total statistics depended on the number of events aggregated in the bin. There was almost no difference between the mHDR-v2r and mHDR-v2 sources. The uncertainties are presented in
Table 2. The total uncertainties of
D˙ (0.10 cm, 90◦),
D˙ (1.0 cm, 90◦), and
K˙ (10 cm) were 4.15%, 1.19%, and 1.14%, respectively. When the comparison was performed using MC simulation, the uncertainties of the source geometry, capsule geometry, and dynamic source design generated in the manufacturing process were excluded. In this case, the uncertainties of
D˙ (0.10 cm, 90◦),
D˙ (1.0 cm, 90◦), and
K˙ (10 cm) were 1.01%, 1.02%, and 1.05%, respectively.
4. Discussion
4.1. Applicability of results
We performed dosimetry of the mHDR-v2r and mHDR-v2 sources using full MC simulation. In MC simulations, the difference in the results may be attributed to the differences in the radiological physics models used in the coding systems.
Figure 11 and
Figure 12 show the overwhelming agreement between the results of Daskalov et al. and our mHDR-v2 source results. It uses similar radiological physics models, although the MC simulation code is different and warrants the validity of the EGS5 simulation code. We also investigated the contribution of source photons and/or source electrons to the mHDR-v2r and mHDR-v2 sources. A difference of more than 60% in the absorbed dose rate of the source electrons between the mHDR-v2r and mHDR-v2 sources was found. If the difference in the source design mentioned by Granello et al. is negligible, the black-dotted and red solid lines shown in
Figure 4 and
Figure 6 should overlap when comparing only our results. This implies that the design difference between mHDR-v2r and mHDR-v2 in the vicinity of the source cannot be ignored. Further,
Figure 12 in the 2D anisotropy function shows that: (i) our results were consistent with the results of Granero et al. when comparing mHDR-v2r sources at a distance of 1 cm, (ii) our results were consistent with the results of Daskalov et al., who compared mHDR-v2 sources at a distance of 1 cm, (iii) from (i) and (ii), the 2D anisotropy functions of the mHDR-v2r and mHDR-v2 sources do not match even at a distance of 1 cm. These results are consistent with the difference in the 2D anisotropy function at 1 cm between mHDR-v2r (the results of Granero et al.) and mHDR-v2 (the results of Daskalov et al.) mentioned earlier (
Figure 2). This is entirely due to the design differences between the mHDR-v2 and mHDR-v2r sources. Therefore, the effect of design differences between the mHDR-v2r and mHDR-v2 sources cannot be ignored even at a distance of 1 cm from the source. In clinical practice, mHDR-v2 data should not be used for treatment planning when using the mHDR-v2r source. As a result, the patient risks receiving more than 3% of the radiation he receives.
A comparison between the results of Granero et al. and our mHDR-v2r source results also showed differences in the source electron contribution (
Figure 4) and in the 2D anisotropy function within 0.25 cm (
Figure 10 and
Figure 11). One of the reasons for this difference seems to be the difference in treatment in the region where the charged particle equilibrium does not hold. As mentioned above, our MC simulation aggregates the energy deposit or kinetic energy for each particle emitted from the source. Although there are many source particles in the MC simulation to obtain statistical data, this method makes it irrelevant whether it is in the region of charged-particle equilibrium. At clinical sites, polyamide implant tubes with an outer diameter of 1.7 mm are prepared for brachytherapy. This was required for treatment very close to the source. Due to the commercialization of such tubes, accurate treatment planning in the vicinity of the radiation source is required. Our results are also very useful in such clinical settings.
4.2. Computation time and accuracy
The total computing time for these data was approximately 1 year. To increase the accuracy of our current data by a factor of 10, we must increase the number of events used by a factor of 100. In order to improve statistical accuracy, the MC methods require a large number of events to generate results. Our research results are obtained using 4-core and 8-core personal computers and two 8-core single-board computer clusters, totaling 4 computers. Naturally, the actual computation time can be reduced by increasing the number of computers. Currently, even CPUs that are commonly available have 24 cores. It is possible to calculate in a shorter time than our calculation time just by using these. Furthermore, the use of supercomputers is expected to dramatically reduce computation time.
4.3. Statistical data and error margins
From
Table 2, "Dynamic source design” occupies the largest proportion of the total uncertainty of
D˙ (0.10 cm, 90◦). This results from lateral shifts in the manufacturing process of the source. The maximum lateral displacement is estimated to be 0.02 mm [
9]. So this value means "maximum" rather than standard error. Excluding this, the uncertainties are around 1%. The 1% uncertainty is also due to the "192Ir photon spectrum". If the equivalent photon spectrum is used, the comparison of results between MC simulations is performed with sufficiently high accuracy and can be used as basic data in clinical practice. However, in clinical practice, whether or not brachytherapy in the vicinity of the radiation source can be performed with sufficient accuracy depends on the accuracy of the radiation source manufacturing process.
4.4. MC simulations and limitations
We performed full MC simulations instead of approximations using energy fluences and mass-energy absorption coefficients. This is because it is important not to use approximations in order to obtain accurate results regardless of whether the charged-particle equilibrium holds. Granero et al. published the first dosimetry results including electrons. However, if accurate dosimetry is desired, it seems natural to consider not only photons but also electrons. If MC simulations are performed and analyzed, approximations should not be used, even if they take a long time. Various elements should be included in the simulation with reality. Of course, it takes time to incorporate various elements and perform detailed simulations. This is the limit of MC simulation, but the accuracy at that time should be estimated according to the situation, and MC simulation should be executed according to that accuracy.
5. Conclusions
The absorbed dose rate and air kerma rate of the mHDR-v2r and mHDR-v2 sources were examined using EGS5 with full MC simulations. After comparing the mHDR-v2r and mHDR-v2 sources, it was found that the difference in the absorbed dose was caused by the electron and structure. The TG-43U1 dataset was obtained by MC simulation. For the dose-rate constant values, both mHDR-v2r and mHDR-v2 were greater than those reported by Granero et al., and the consensus values were within the margin of error. For the radial dose function, the mHDR-v2r source and those of Granero et al. were generally consistent, within 1%, while the mHDR-v2r and mHDR-v2 sources were consistent at distances >0.2 mm. A comparison of the mHDR-v2r and mHDR-v2 sources for the 2D anisotropy function revealed a difference of −3.2% at 0.50 cm and a difference of −2.0% at 1.0 cm. These differences indicate that when using the mHDR-v2r source, its accuracy is not sufficient to use the TG-43U1 dataset of the previous mHDR-v2 source, even at distances greater than 0.5 cm. Also, for the mHDR-v2r source, there was a difference of −1.7% to +1.1% at a distance of 0.10 cm and a difference of +1.7% at a distance of 0.25 cm when compared with that of Granero et al. Thus, the results of Granero et al. and our mHDR-v2r sources are inconsistent. The results of this study may provide valuable insight into the treatment planning of HDR brachytherapy.
Supplementary Materials
The following supporting information can be downloaded at:
www.mdpi.com/xxx/s1, Supplementary Data: Dose data for mHDR-v2 and mHDR-v2r.
Author Contributions
Conceptualization, S.T., N.N. and M.O.; methodology, S.T., N.N. and M.O.; software, S.T., Y.N. and H.H.; validation, all authors; formal analysis, S.T.; investigation, S.T.; resources, S.T, Y.N. and H.H.; data curation, S.T.; writing—original draft preparation, S.T.; writing—review and editing, all authors; visualization, S.T.; supervision, S.T.; project administration, S.T. All authors have read and agreed to the published version of the manuscript.
Funding
This research received no external funding.
Institutional Review Board Statement
Not applicable.
Informed Consent Statement
Not applicable.
Data Availability Statement
The data that supports the findings of this study are available in the supplementary material of this article. The supplementary material contains detailed dosimetric data, such as source structures, absorbed dose rates, TG-43U1 datasets, and air kerma rates associated with the dose rate constants.
Acknowledgments
We would like to thank Editage (
www.editage.com) for the English language editing.
Conflicts of Interest
The authors declare no conflict of interest.
References
- Rivard, M.J.; Coursey, B.M.; DeWerd, L.A.; Hanson, W.F.; Huq, M.S.; Ibbott, G.S.; Mitch, M.G.; Nath, R.; Williamson, J.F. Update of AAPM Task Group No. 43 Report: A revised AAPM protocol for brachytherapy dose calculations. Med Phys. 2004, 31, 633–674. [Google Scholar] [CrossRef] [PubMed]
- Rossi, G.; Gainey, M.; Thomann, B.; Kollefrath, M.; Würfel, J.; Allgaier, B.; Baltas, D. Monte Carlo and experimental high dose rate 192Ir brachytherapy dosimetry with microDiamond detectors. Z Med Phys. 2019, 29, 272–281. [Google Scholar] [CrossRef] [PubMed]
- Rossi, G.; Failing, T.; Gainey, M.; Kollefrath, M.; Hensley, F.; Zink, K.; Baltas, D. Determination of the dose rate around a HDR 192Ir brachytherapy source with the microDiamond and the microSilicon detector. Z Med Phys. 2022. [Google Scholar] [CrossRef] [PubMed]
- Rostami, A.; Hoseini, M.; Ghorbani, M.; Knaup, C. Dosimetric investigation of a new high dose rate 192Ir brachytherapy source, IRAsource, by Monte Carlo method. Rep Pract Oncol Radiother. 2020, 25, 139–145. [Google Scholar] [CrossRef]
- Geraldo, J.M.; Andrade, L.M.; Nogueira, L.B.; Grundmann, C.T.; Fonseca, T.C.F.; Gomes, B.G.S.; Leite, M.T.T.; Mafra, A.; Gonçalves, K.B.; Furtado, C.A.; et al. Monte Carlo simulation and dosimetry measurements of an experimental approach for in vitro HDR brachytherapy irradiation. Appl Radiat Isot. 2021, 172, 109666. [Google Scholar] [CrossRef] [PubMed]
- Otani, Y.; Shimamoto, S.; Sumida, I.; Takahashi, Y.; Tani, S.; Oshima, T.; Onosaka, S.; Isohashi, F.; Tamari, K.; Ogawa, K. Impact of different Ir-192 source models on dose calculations in high-dose-rate brachytherapy. Phys Imaging Radiat Oncol. 2018, 7, 23–26. [Google Scholar] [CrossRef] [PubMed]
- Daskalov, G.M.; Löffler, E.; Williamson, J.F. Monte Carlo-aided dosimetry of a new high dose-rate brachytherapy source. Med Phys. 1998, 25, 2200–2208. [Google Scholar] [CrossRef] [PubMed]
- Rivard, M.J.; Granero, D.; Perez-Calatayud, J.; Ballester, F. Influence of photon energy spectra from brachytherapy sources on Monte Carlo simulations of kerma and dose rates in water and air. Med Phys. 2010, 37, 869–876. [Google Scholar] [CrossRef] [PubMed]
- Granero, D.; Vijande, J.; Ballester, F.; Rivard, M.J. Dosimetry revisited for the HDR 192Ir brachytherapy source model mHDR-v2. Med Phys. 2011, 38, 487–494. [Google Scholar] [CrossRef] [PubMed]
- 10. Perez-Calatayud, J.; Ballester, F.; Das, R.K.; Dewerd, L.A.; Ibbott, G.S.; Meigooni, A.S.; Ouhib, Z.; Rivard, M.J.; Sloboda, R.S.; Williamson, J.F. Dose calculation for photon-emitting brachytherapy sources with average energy higher than 50 keV: report of the AAPM and ESTRO. Med Phys. 2012, 39, 2904–2929. [Google Scholar]
- Baltas, D.; Karaiskos, P.; Papagiannis, P.; Sakelliou, L.; Loeffler, E.; Zamboglou, N. Beta versus gamma dosimetry close to Ir-192 brachytherapy sources. Med Phys. 2001, 28, 1875–1882. [Google Scholar] [CrossRef] [PubMed]
- Wang, R.; Li, X.A. Dose characterization in the near-source region for two high dose rate brachytherapy sources. Med Phys. 2002, 29, 1678–1686. [Google Scholar] [CrossRef]
- Ballester, F.; Granero, D.; Pérez-Calatayud, J.; Melhus, C.S.; Rivard, M.J. Evaluation of high-energy brachytherapy source electronic disequilibrium and dose from emitted electrons. Med Phys. 2009, 36, 4250–4256. [Google Scholar] [CrossRef] [PubMed]
- Taylor, R.E.; Rogers, D.W. EGSnrc Monte Carlo calculated dosimetry parameters for 192Ir and 169Yb brachytherapy sources. Med Phys. 2008, 35, 4933–4944. [Google Scholar] [CrossRef] [PubMed]
- Hirayama, H.; Namito, Y.; Bielajew, A.F.; Wilderman, S.J.; Nelson, W.R. The EGS5 Code System. SLAC-R-730 and K.E.K. Report; Department of Energy: United States, 2005. [Google Scholar]
- NUDAT 3.0. National nuclear data center, Brookhaven National Laboratory. 2000. Available online: http://www.nndc.bnl.gov/nudat3/ (accessed on 24 February 2022).
- Baglin, C.M. Nuclear Data Sheets for A = 192. Nucl Data Sheets. 2012, 113, 1871–2111. [Google Scholar] [CrossRef]
- Endo, A.; Yamaguchi, Y.; Eckerman, K.F. Nuclear decay data for dosimetry calculation. Revised data of ICRP Publication 38. JAERI. 2005, 1347. [Google Scholar] [CrossRef]
- Endo, A.; Eckerman, K.F. Nuclear decay data for dosimetry calculation. Data for radionuclides with half-lives less than 10 minutes. JAEA-Data. Code. 2007, 021. [Google Scholar] [CrossRef]
- Tsuji, S. Developing a Single-Board Computer Cluster: A Parallel Integrated System. Kawasaki Igakkaishi Liberal Arts & Sciences Course, 2019; Vol. 45, pp. 83–96.
- Shimizu, M.; EGS5-MPI. AIST. 2017. Available online: https://unit.aist.go.jp/rima/ioniz- rad/egs5mpi/index eng.html. (accessed on 24 February 2022).
Figure 1.
Schematic designs of
192Ir sources. Dimensions are given in mm. (a) mHDR-v2 source. Shapes and dimensions are according to Daskalov et al. [
7] (
Figure 1(b)) and Perez-Calatayud et al. [
10] (
Figure 3). (b) mHDR-v2r source. Shapes and dimensions are according to Granero et al. [
9] (
Figure 1).
Figure 2.
Ratio of 2D anisotropy function of the mHDR-v2 source (Daskalov et al.) to the mHDR-v2r source (Granero et al.) at 1.0 cm.
Figure 2.
Ratio of 2D anisotropy function of the mHDR-v2 source (Daskalov et al.) to the mHDR-v2r source (Granero et al.) at 1.0 cm.
Figure 3.
MC coordinate system. r, θ, and φ of P are assumed, as shown in the figure.
Figure 3.
MC coordinate system. r, θ, and φ of P are assumed, as shown in the figure.
Figure 4.
(a) Absorbed dose rate contributed by source electrons near the source. (b) The ratio of the absorbed dose rate to mHDR-v2r source contributed by source electrons near the source. The absorbed dose rate is normalized by the unit of air kerma strength and the geometry function.
Figure 4.
(a) Absorbed dose rate contributed by source electrons near the source. (b) The ratio of the absorbed dose rate to mHDR-v2r source contributed by source electrons near the source. The absorbed dose rate is normalized by the unit of air kerma strength and the geometry function.
Figure 5.
(a) Absorbed dose rate contributed by source photons near the source. (b) The ratio of the absorbed dose rate to mHDR-v2r source contributed by source photons near the source. The absorbed dose rate is normalized by the unit of air kerma strength and the geometry function.
Figure 5.
(a) Absorbed dose rate contributed by source photons near the source. (b) The ratio of the absorbed dose rate to mHDR-v2r source contributed by source photons near the source. The absorbed dose rate is normalized by the unit of air kerma strength and the geometry function.
Figure 6.
The ratio of absorbed dose source electrons to that of source photons near the radiation source.
Figure 6.
The ratio of absorbed dose source electrons to that of source photons near the radiation source.
Figure 7.
Comparison of the radial dose functions. (a) 0 cm ≤ r ≤ 0.5 cm. (b) 0 cm ≤ r ≤ 10 cm. The standard error is added at r = 4 cm.
Figure 7.
Comparison of the radial dose functions. (a) 0 cm ≤ r ≤ 0.5 cm. (b) 0 cm ≤ r ≤ 10 cm. The standard error is added at r = 4 cm.
Figure 8.
The ratio of the radial dose functions to the mHDR-v2r source.
Figure 8.
The ratio of the radial dose functions to the mHDR-v2r source.
Figure 9.
(a) Comparison of 2D anisotropy functions at distances of 0.10 cm. (b) The ratio of 2D anisotropy functions to mHDR-v2r source at 0.10 cm.
Figure 9.
(a) Comparison of 2D anisotropy functions at distances of 0.10 cm. (b) The ratio of 2D anisotropy functions to mHDR-v2r source at 0.10 cm.
Figure 10.
(a) Comparison of 2D anisotropy functions at distances of 0.25 cm. (b) The ratio of 2D anisotropy functions to mHDR-v2r source at 0.25 cm.
Figure 10.
(a) Comparison of 2D anisotropy functions at distances of 0.25 cm. (b) The ratio of 2D anisotropy functions to mHDR-v2r source at 0.25 cm.
Figure 11.
(a) Comparison of 2D anisotropy functions at distances of 0.50 cm. (b) The ratio of 2D anisotropy functions to mHDR-v2r source at 0.50 cm. The error bar at 58◦ is derived from the relationship between mHDR-v2r and mHDR-v2, while the error bar at 158◦ is derived from the relationship between mHDR-v2r and Daskalov et al.
Figure 12.
(a) Comparison of 2D anisotropy functions at distances of 1.0 cm. (b) The ratio of 2D anisotropy functions to mHDR-v2r source at 1.0 cm. The error bar at 58◦ is derived from the relationship between mHDR-v2r and mHDR-v2, while the error bar at 158◦ is derived from the relationship between mHDR-v2r and Daskalov et al.
Table 1.
The difference of F(r, θ) given in %.
Table 1.
The difference of F(r, θ) given in %.
| |
F(r=0.1cm) |
F(r=0.25cm) |
F(r=0.50cm) |
F(r=1.0cm) |
| θ |
40° |
94° |
144° |
20° |
144° |
14° |
8° |
12° |
170° |
| Graneno et al./mHDR-v2r |
-1.7 |
+1.1 |
−1.6 |
+1.7 |
+1.5 |
- |
- |
- |
- |
| mHDR-v2/mHDR-v2r |
- |
- |
- |
- |
- |
−3.2 |
−2.0 |
- |
- |
| Daskalov.et al./Granero et al. |
- |
- |
- |
- |
- |
- |
- |
−1.7 |
−2.1 |
Table 2.
Uncertainty analysis for the mHDR-v2 and mHDR-v2r 192Ir brachytherapy sources based on MC simulations. Types A and B uncertainty components are categorized based on stochastic and systematic effects, respectively.
Table 2.
Uncertainty analysis for the mHDR-v2 and mHDR-v2r 192Ir brachytherapy sources based on MC simulations. Types A and B uncertainty components are categorized based on stochastic and systematic effects, respectively.
| |
D˙(0.10 cm, 90°)
|
D˙ (1.0 cm, 90°) |
K˙ (10 cm) |
| Component |
Type A |
Type B |
Type A |
Type B |
Type A |
Type B |
| Source geometry |
|
0.46% |
|
0.46% |
|
0.46% |
| Capsule geometry |
|
0.01% |
|
0.01% |
|
0.01% |
| Dynamic source design |
|
4% |
|
0.4% |
|
0.04% |
| 192Ir photon spectrum |
|
1% |
|
1% |
|
1% |
| 192Ir electron spectrum |
|
0.03% |
|
0.03% |
|
0.03% |
| MC physics |
|
0.05% |
|
0.05% |
|
0.05% |
| Tally volume averaging |
|
0.03% |
|
- |
|
- |
| Tally statistics |
0.14% |
|
0.19% |
|
0.30% |
|
| Total (k = 1) uncertainty |
4.15% |
1.19% |
1.14% |
|
Disclaimer/Publisher’s Note: The statements, opinions and data contained in all publications are solely those of the individual author(s) and contributor(s) and not of MDPI and/or the editor(s). MDPI and/or the editor(s) disclaim responsibility for any injury to people or property resulting from any ideas, methods, instructions or products referred to in the content. |
© 2023 by the authors. Licensee MDPI, Basel, Switzerland. This article is an open access article distributed under the terms and conditions of the Creative Commons Attribution (CC BY) license (http://creativecommons.org/licenses/by/4.0/).

