1. Introduction
Fluorescent thermometry is an effective way to display the temperature in the analyzed objects. The main advantage of luminescent thermometry is possibility of contactless temperature measurement [
1,
2,
3,
4,
5]. This approach efficiently apply in medicine, biology, detecting catalytic reactions and another areas, where contact measurement is inconvenient or inapplicable [
6,
7,
8,
9].
Temperature measuring using REE luminescence [
10] based on two main approaches such as luminescence intensity from the one type of ion [
11,
12] or two or more ions doping one matrix [
13,
14,
15]. The first approach is based on the dependence of the ratio of populations and, consequently, luminescence intensities, thermally related levels on temperature. The energy gap between the thermal bound levels is so small that, according to Boltzmann's law, an increase in temperature can lead to an increase in the population of the overlying state. In the luminescence spectrum, an increase in the shorter-wavelength peak will be observed. The second approach was proposed by Sekiyama et al. [
16] and is based on a matrix doped with three ions of rare earth elements. One of them (Yb) acts as a donor, absorbs exciting radiation and transmits it to two other acceptor ions. Acceptor ions are selected in such a way that one of the energy transfers is resonant (for example, Yb
→ Er), its probability does not depend on temperature and this signal is used as a reference. The second transfer is non-resonant (for example, Yb
→ Ho) and with increasing temperature its probability increases (phonon assisted Energy transfer). This approach allows thermometry in the short-wave IR region.
The most express approach is to determine the ratio of the intensities of two luminescence bands, one of which is thermally bound, and the second is thermally independent. Such luminescence bands are known for Ho
3+ and Er
3+, which are realized when the matrix is so-doped with Yb
3+ ions, due to resonant and phonon-assisted energy transfers. When measuring the thermal response in the near IR range (SWIR), pumping is carried out into the absorption band Yb
3+ (
7F
7/2→
5F
5/2), followed by energy redistribution between Ho
3+ and Er
3+ ions as a result of non-radiative energy transfer. In this case, the energy transfer of Yb
3+ → Ho
3+ is non-resonant, as a result of which the luminescence intensity of Ho
3+ ions at the transition
5I
6→
5I
8 will depend on temperature, and the energy transfer of Yb
3+ → Er
3+ is resonant, as a result of which the luminescence of Er
3+ ions at the transition
4I
13/2→
4I
15/2 depends on temperature weakly [
17]. This makes it possible to measure the relative coefficient of temperature sensitivity by the ratio of the integral intensities of the luminescence bands. For the visible range, measurements are carried out by the ratio of the red and green bands of erbium luminescence.
Using thermally coupled levels, taking into account resonant and non-resonant energy transfer channels from the sensitizer, it is possible to expand the range of wavelengths in which thermometry can be performed.
Fluoride matrices such as NaYF
4 [
18], NaGdF
4 [
15], MF
2, where M = Ca, Sr, Ba [
19], have proven to be effective photonics materials [
20]. It is known that weighting of matrix leads to a decrease in multi-phonon relaxation and increasing the luminescence energy yield. In this connection, the purpose of the study is search for new "heavy" matrices based on fluorides and recognize their spectral and luminescent characteristics for luminescent nanothermometers. As part of the study, a method was developed for the synthesis of a new "heavy" matrix Ba
0.5Gd
0.5-xNa
xF
2.5-x (x = 0.05) and phosphors based on it for testing as a dual-band luminescent thermometer.
2. Materials and Methods
2.1. Synthesis of Luminophores
We synthesized the samples by crystallization from a solution in a sodium nitrate melt according to the method [
21]. Sodium fluoride (Reagent grade, Chimmed) was used as a fluorinating agent, and sodium nitrate (Reagent grade, Chimmed) was used as a solvent. The reagents were used without additional purification steps.
The synthesis is described by the following reaction equation:
there x = 0.33, 0.40. The samples of barium nitrate (specialty grade 10-2, Reachem) and nitrate hydrates of rare earth elements (99.99% purity in terms of cation impurity, Lanhit) were homogenized in an agate mortar, and then added to the samples of fluoride and sodium nitrate. After homogenization, the mixture was transferred to a porcelain glazed crucible and annealed at a temperature of 500 °C for 1 hour. After natural cooling, the sinter was removed from the crucible and washed with bidistilled water until a negative reaction of a solution of diphenylamine in sulfuric acid to nitrate anions. The samples were dried under an IR lamp at a temperature of 40-60 °C for 6 hours.
2.2. Characterizasion of Luminophores
The samples were characterized by X-ray phase analysis (XRD) (Bruker, D8 Advance with CuKa-irradiation), scanning electron microscopy (SEM) (Carl Zeiss, NVision 40), energy dispersion analysis (EDX) (Oxford Instruments, X-Max 80 mm2), differential scanning calorimetry (DSC) (Netzsch, STA 449 F3 Jupiter).
2.3. Temperature-Dependent Luminescence Spectra Measurements
Luminescent spectroscopy of the samples was performed on an installation consisting of a laser with a wavelength of 974 nm, a spectrometer (StellarNet, DWARF-Star) in the SWIR range of 1000-1700 nm, a spectrometer (BIOSPEC, LESA-01-BIOSPEC) in the visible range of 300-900 nm and a thermal infrared camera (CEDIP, JADE MWIR SC7300M) for temperature measurements in the range from 24 to 44 °C [
20]. Heating was carried out using a Primelab PL-R-basic H heated magnetic stirrer (Primelab, Russia) with 0.1 °C temperature heating sampling
. Luminescence intensity ratio (LIR) was used to quantify the dependence of luminescence spectra on temperature in the SWIR range:
The relative coefficient of temperature sensitivity (
Sr) was calculated using the following formula:
3. Results
In the course of our work, we synthesized samples in the BaF
2-GdF
3 system doped with Yb, Ho, Er. The nominal composition and composition determined according to the EDX data of the samples obtained, as well as the practical yield of the synthesis reaction are shown in
Table 1. EDX results show that the crystal lattice of synthesized samples contains sodium in an amount of up to 8 mol.%, regardless of the content of the rare earth element. Apparently, this value corresponds to the limit of solubility of sodium in this solid solution. The content of rare earth elements was overestimated compared to the initial charge, and the content of barium was underestimated.
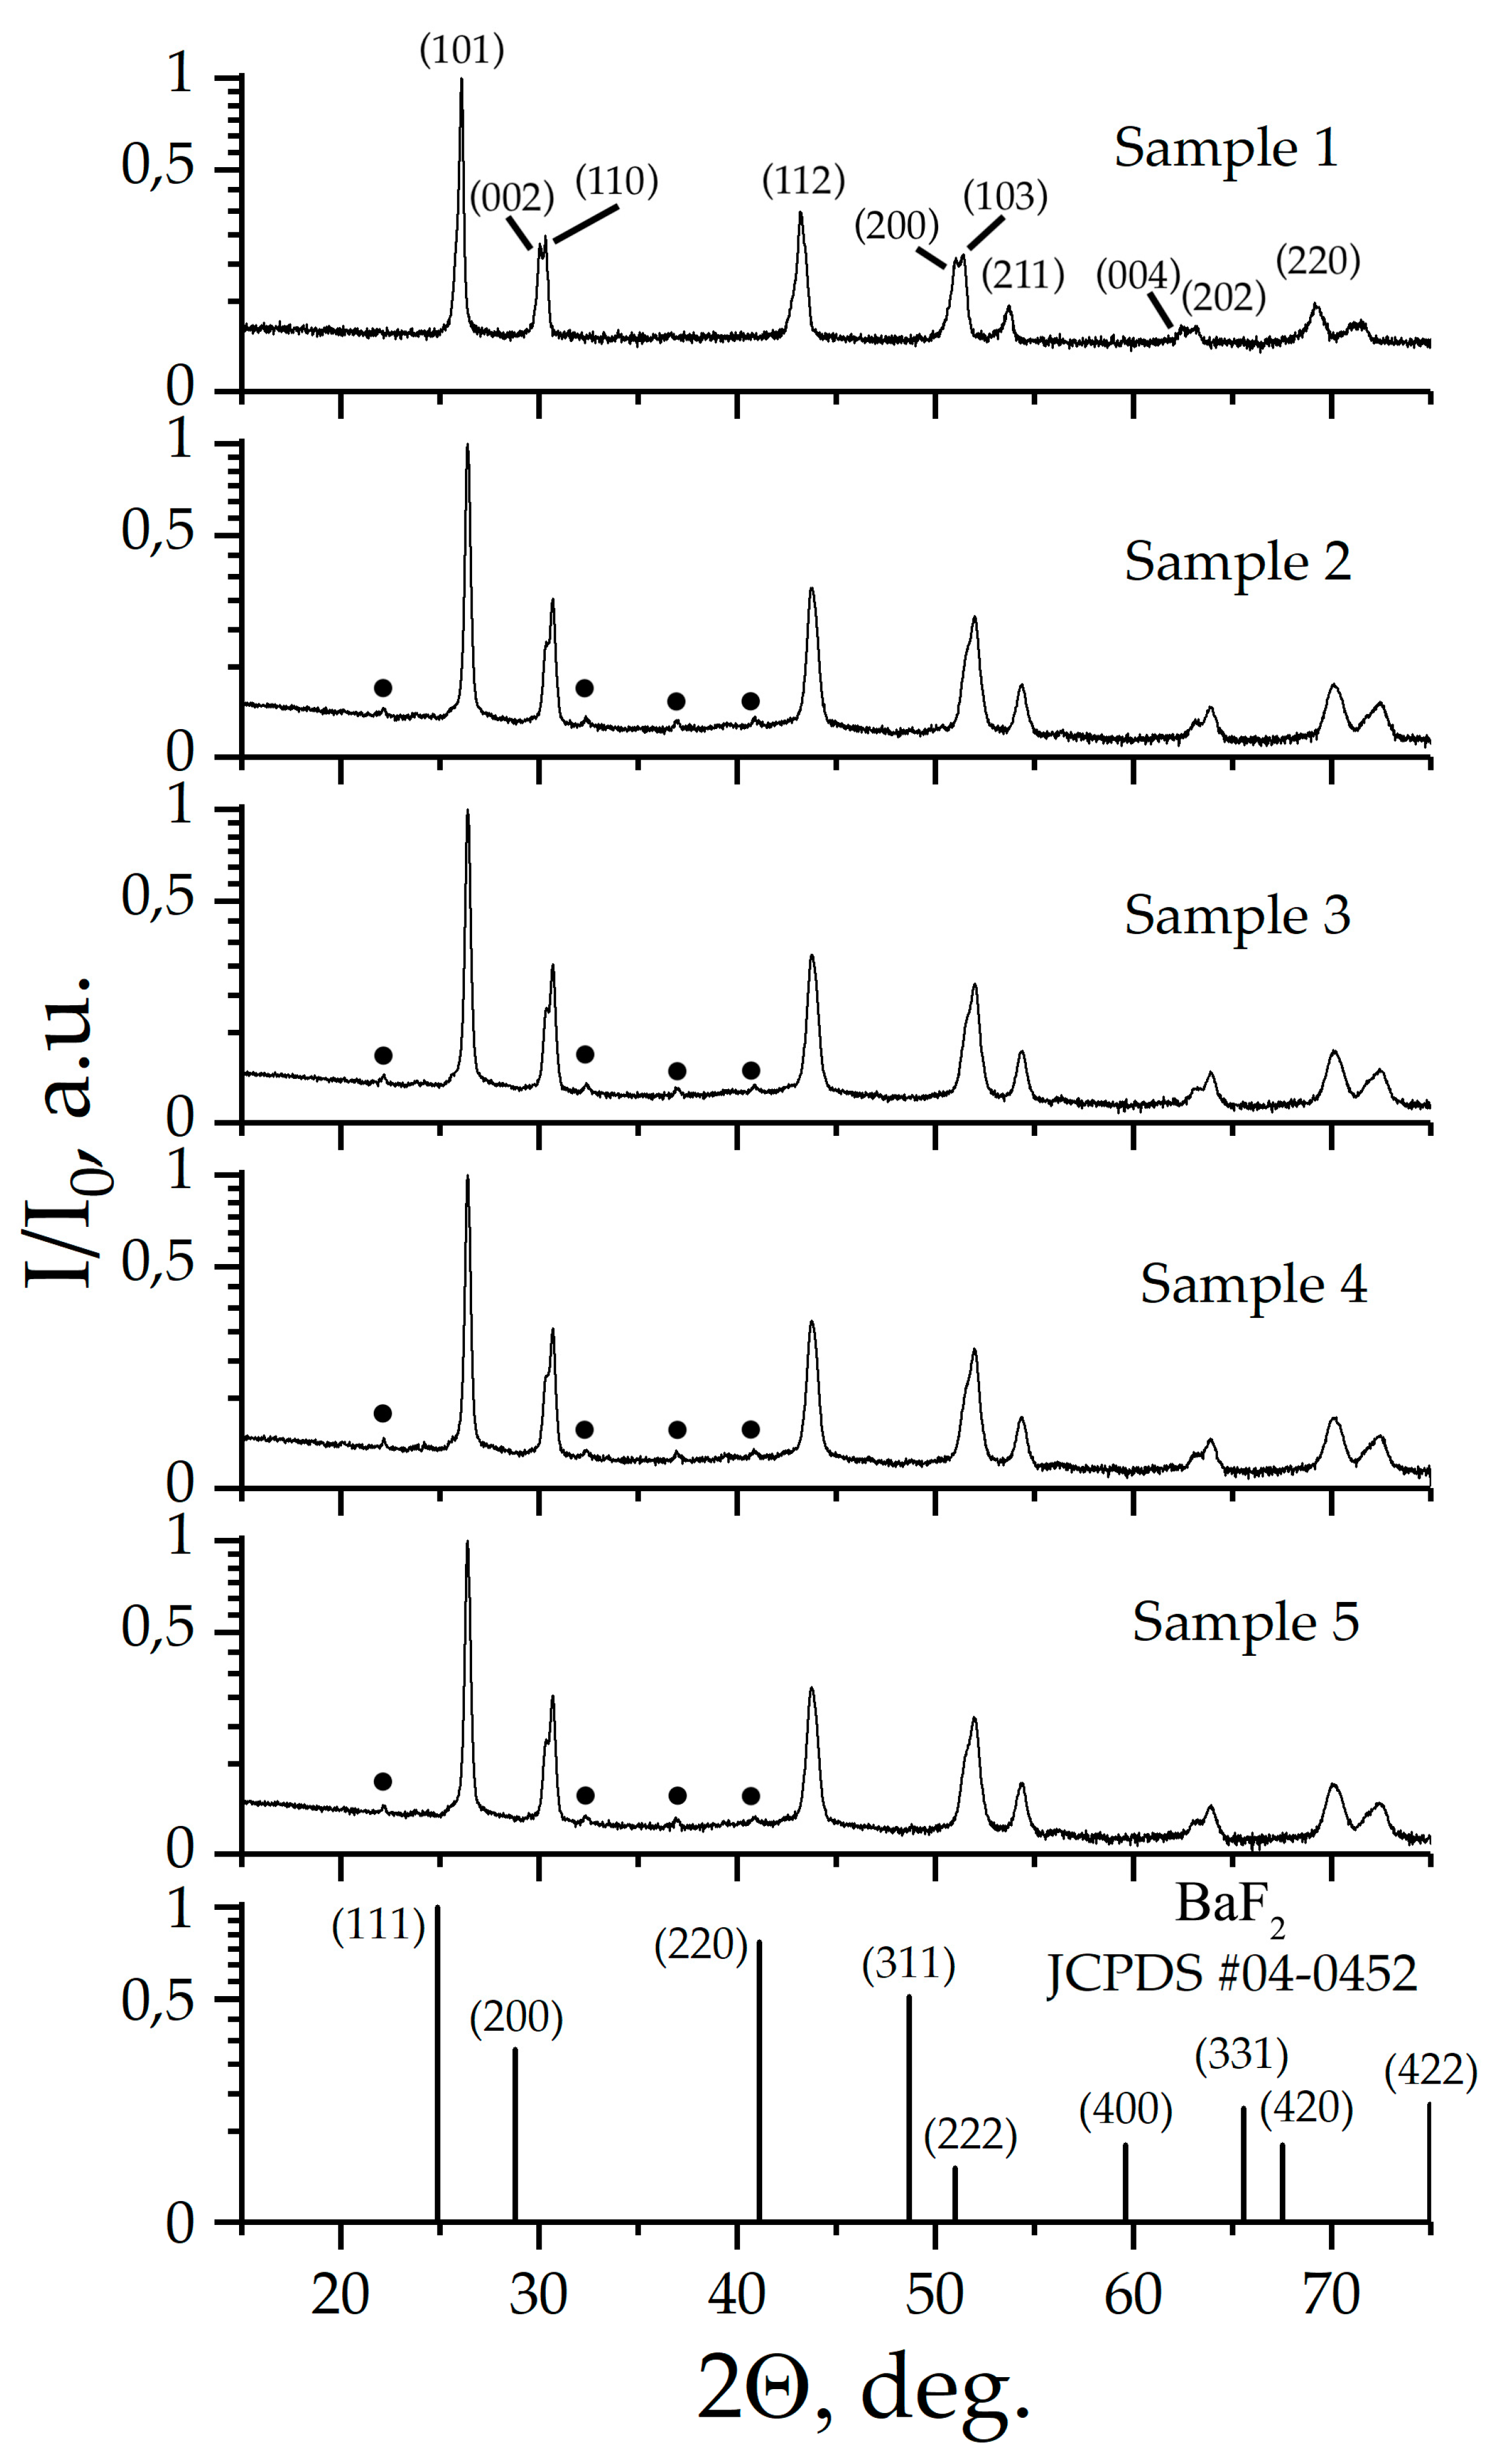
Figure 1 shows X-ray diffraction patterns of prepared samples.
According to X-ray diffraction patterns, Samples 1-5 are single phase, and have a structure derived from the fluorite structure in which BaF
2 crystallizes. The X-ray pattern of Sample 1 is characterized by a fine splitting of the main X-ray diffraction reflexes, and is indicated in tetragonal crystallographic system, space symmetry group (SSG)
I4. X-ray pattern of Samples 2-5 also indexed in SSG
I4. It is worth noting that X-ray diffraction patters of Samples 2-5 contains superstructural peaks, which are well described when the crystal lattice parameter "
c" is increased three times. The
Supplementary Materials,
Tables S1–S5, shows the results of indexing of X-ray patterns. For all samples, the estimated values of the coherent scattering regions D were more than 100 nm. The lattice parameters of Samples 1-5 and the calculated X-ray density (Dx) values are given in
Table 2.
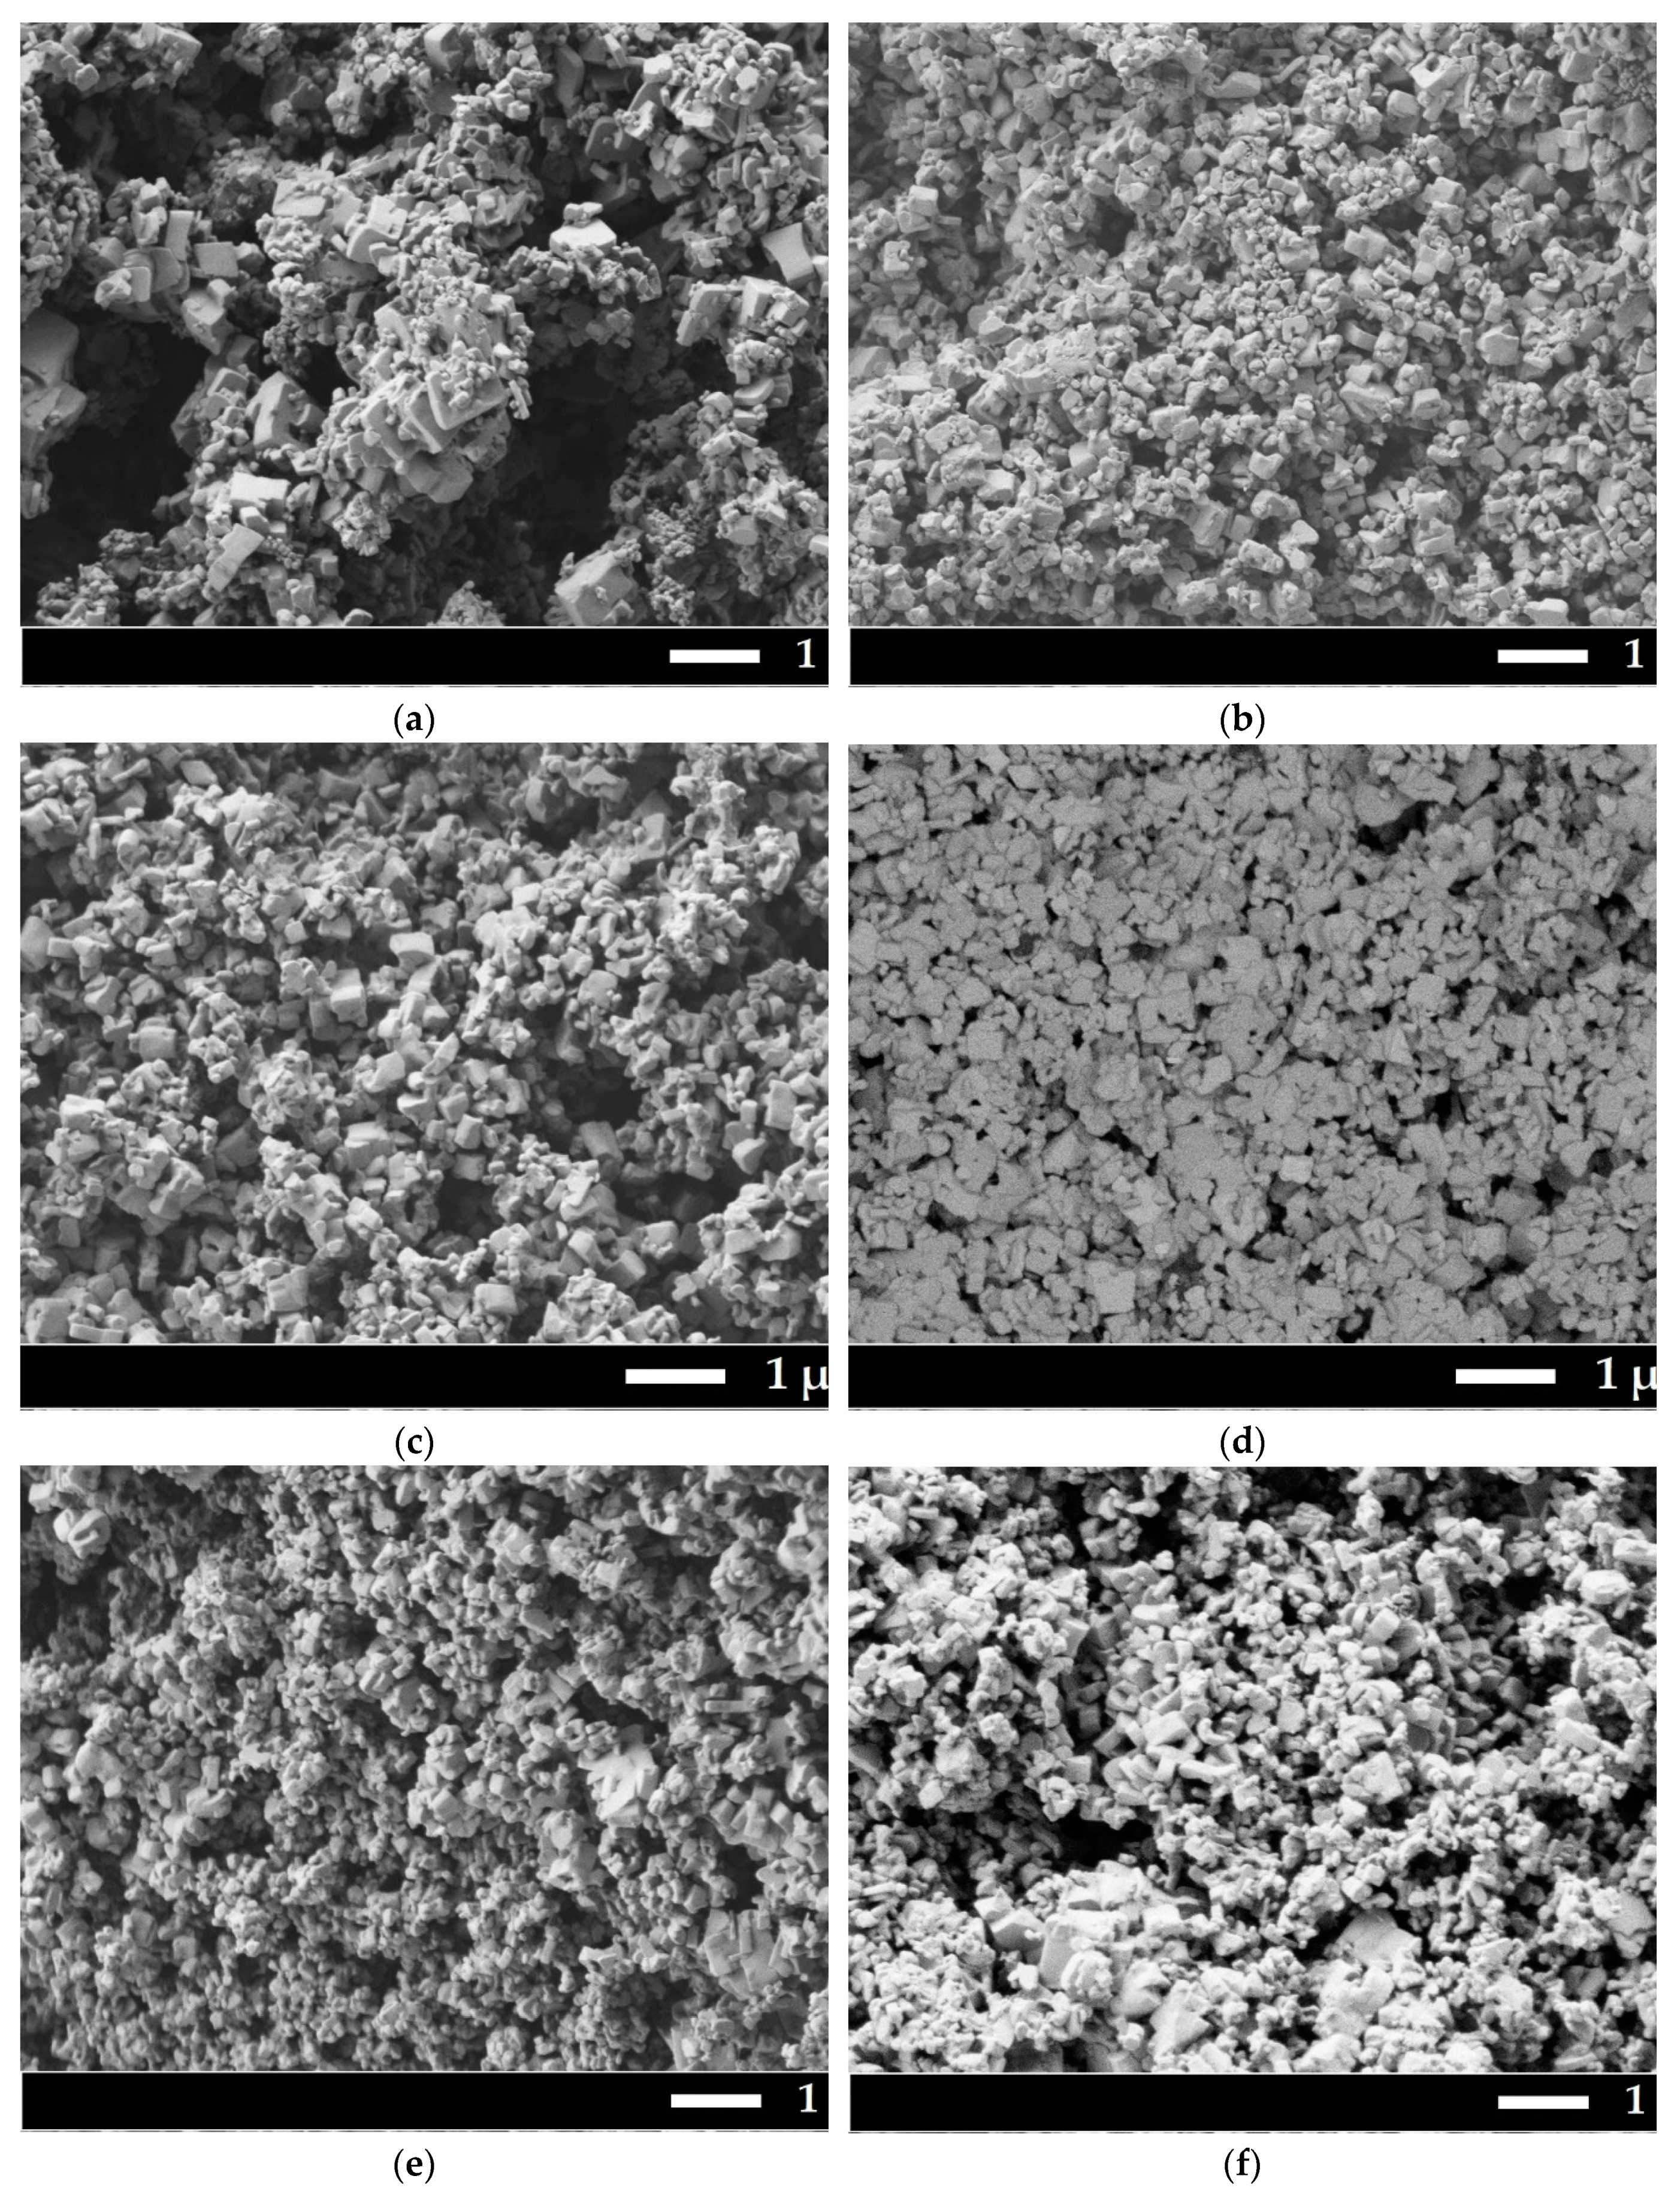
SEM micrographs were obtained for all samples (
Figure 2).
All powders have submicron sizes with a bimodal particle size distribution. The first maximum is about 200 nm, the second about 700 nm. Histograms of particle size distribution one can find in
Supplementary Materials,
Figure S1. Detection of backscattered electrons showed that the particles in Sample 3 are homogeneous in composition, there is no contrast in microphotographs.
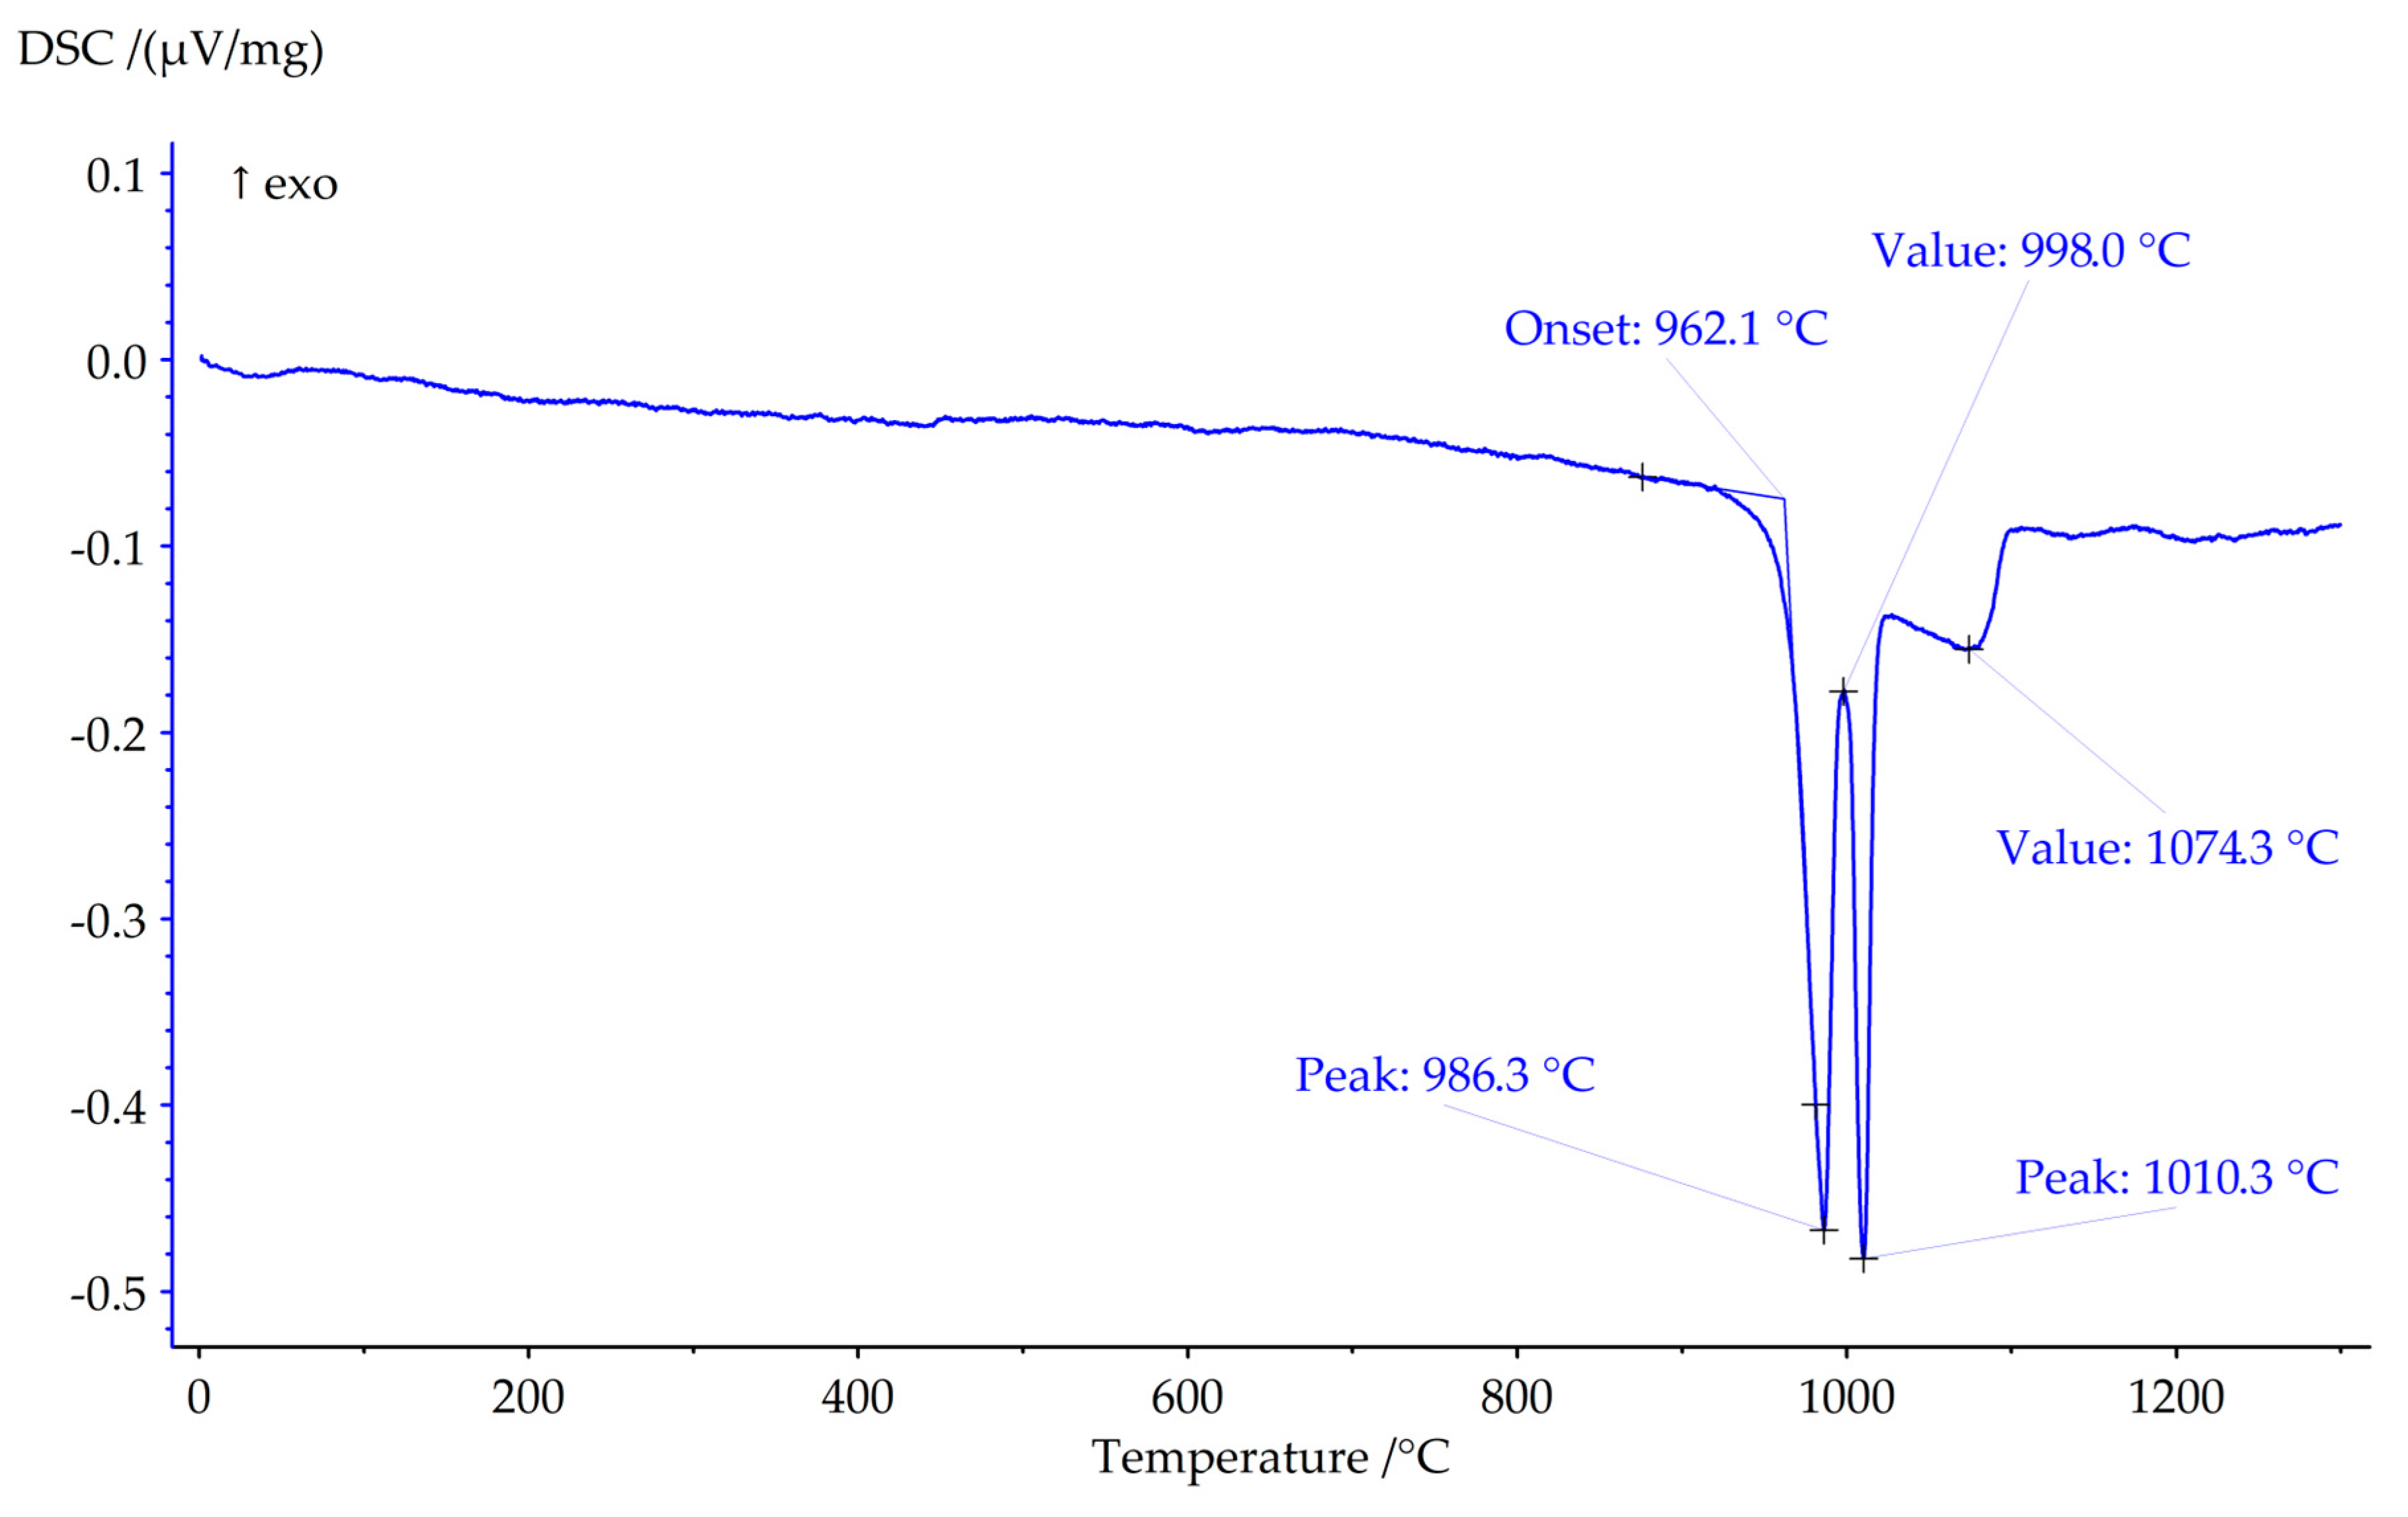
The results of thermal analysis are shown in
Figure 3. Peaks with maximums at 986 °C and 1010 °C correspond to phase reactions, the effect with a maximum at 1074 °C corresponds to the end of melting of the sample (liquidus point). DSC data show that Sample 3 stable in flow of argon until 962.5 °C.
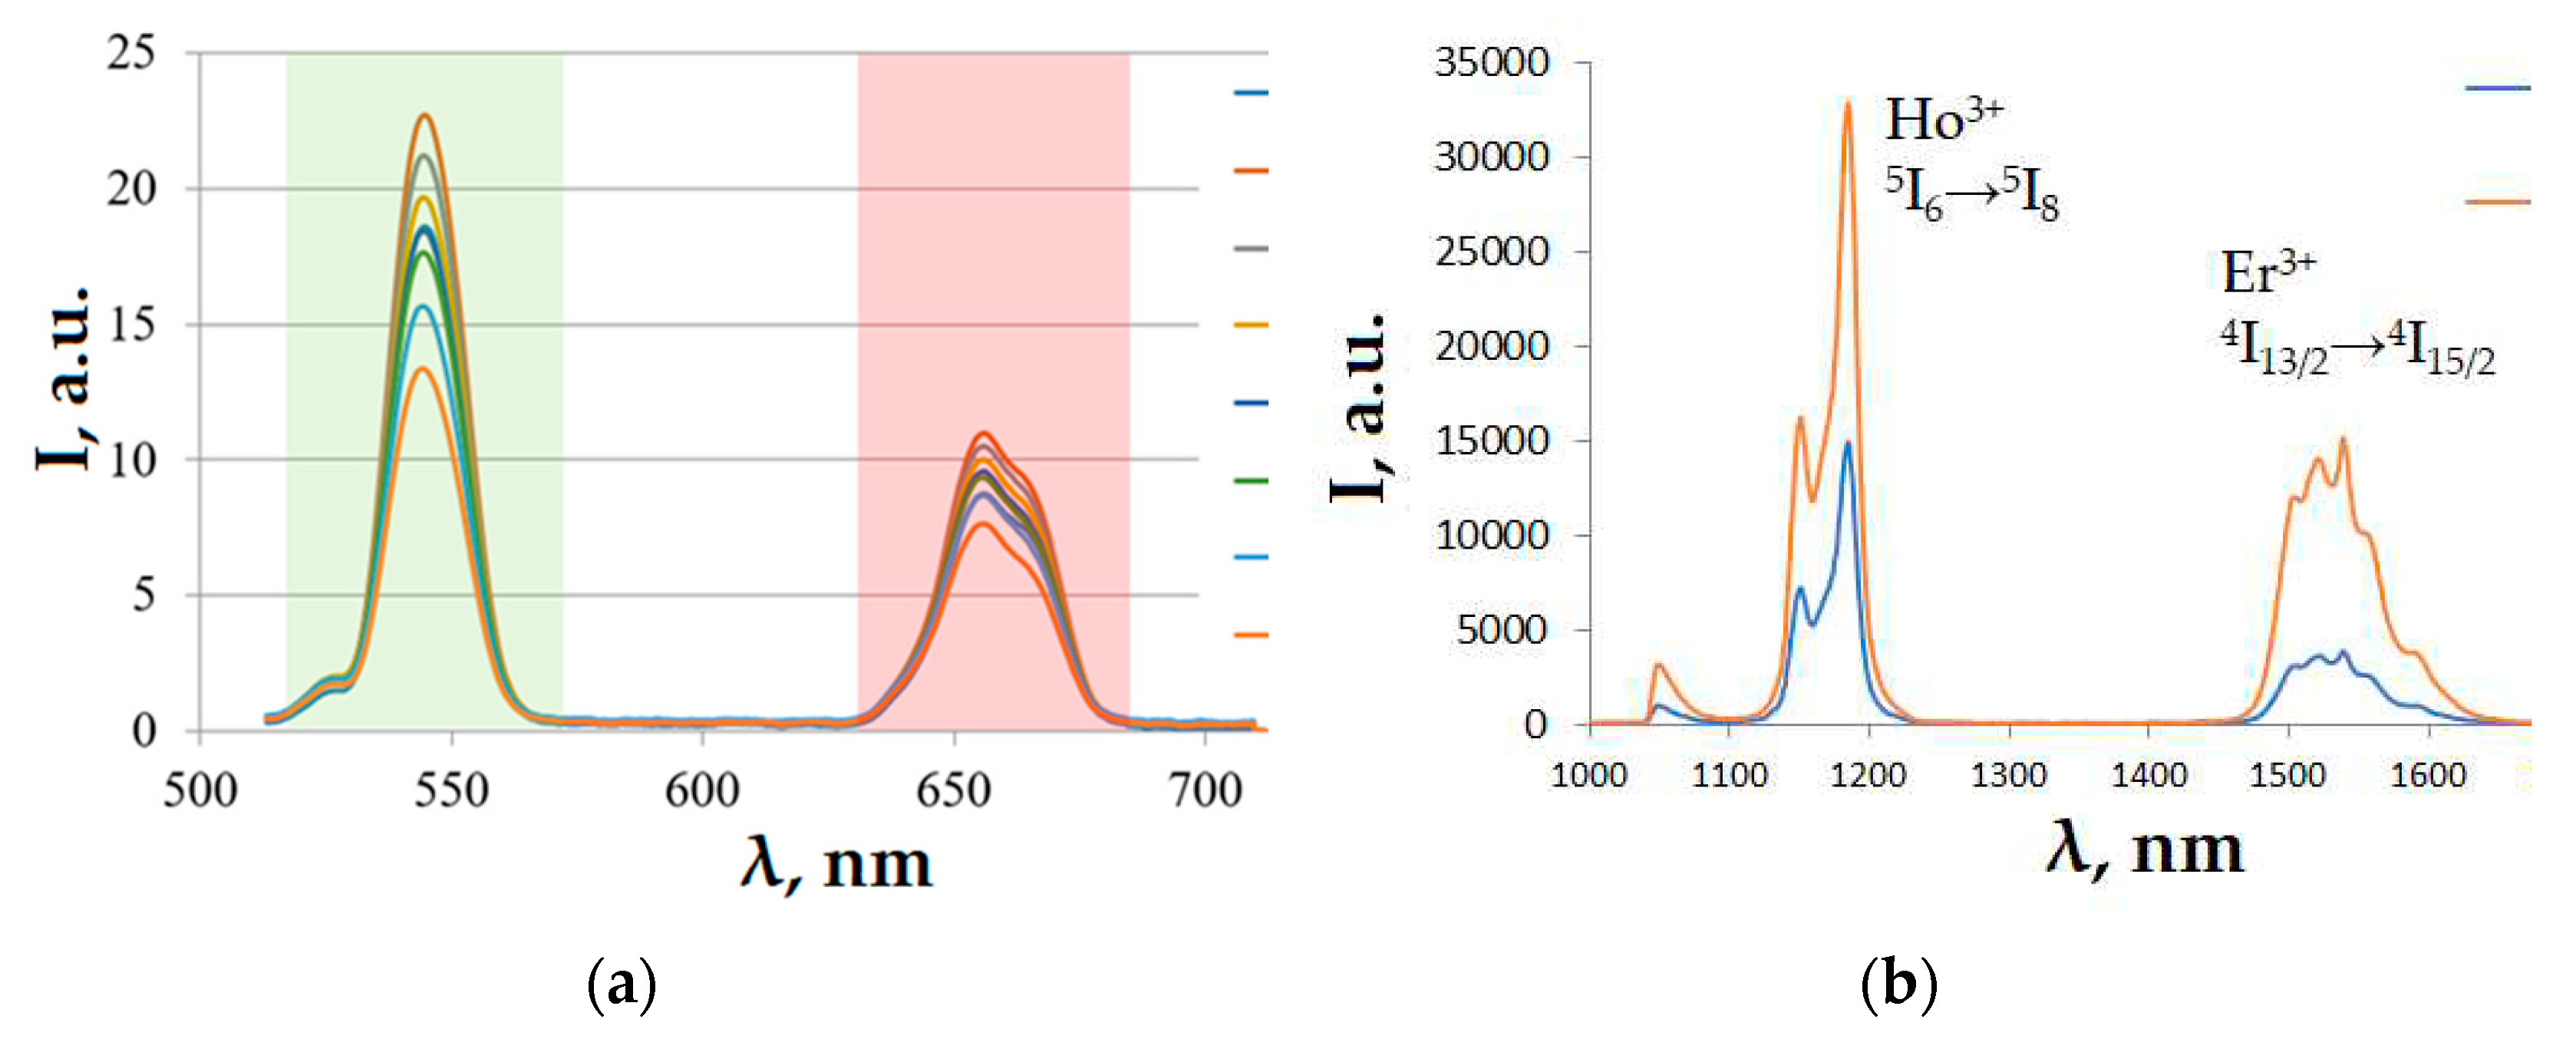
Figure 4 shows the luminescence spectra in the visible range of the spectrum for sample 5 at different temperatures (a) and in SWIR range for samples 3 and 5 at a temperature of 296 K (b).
Peak in SWIR region at 1150 nm wavelength corresponds to Ho3+ (5I6→5I8), and peak at 1550 nm corresponds to Er3+ (4I13/2→4I15/2).
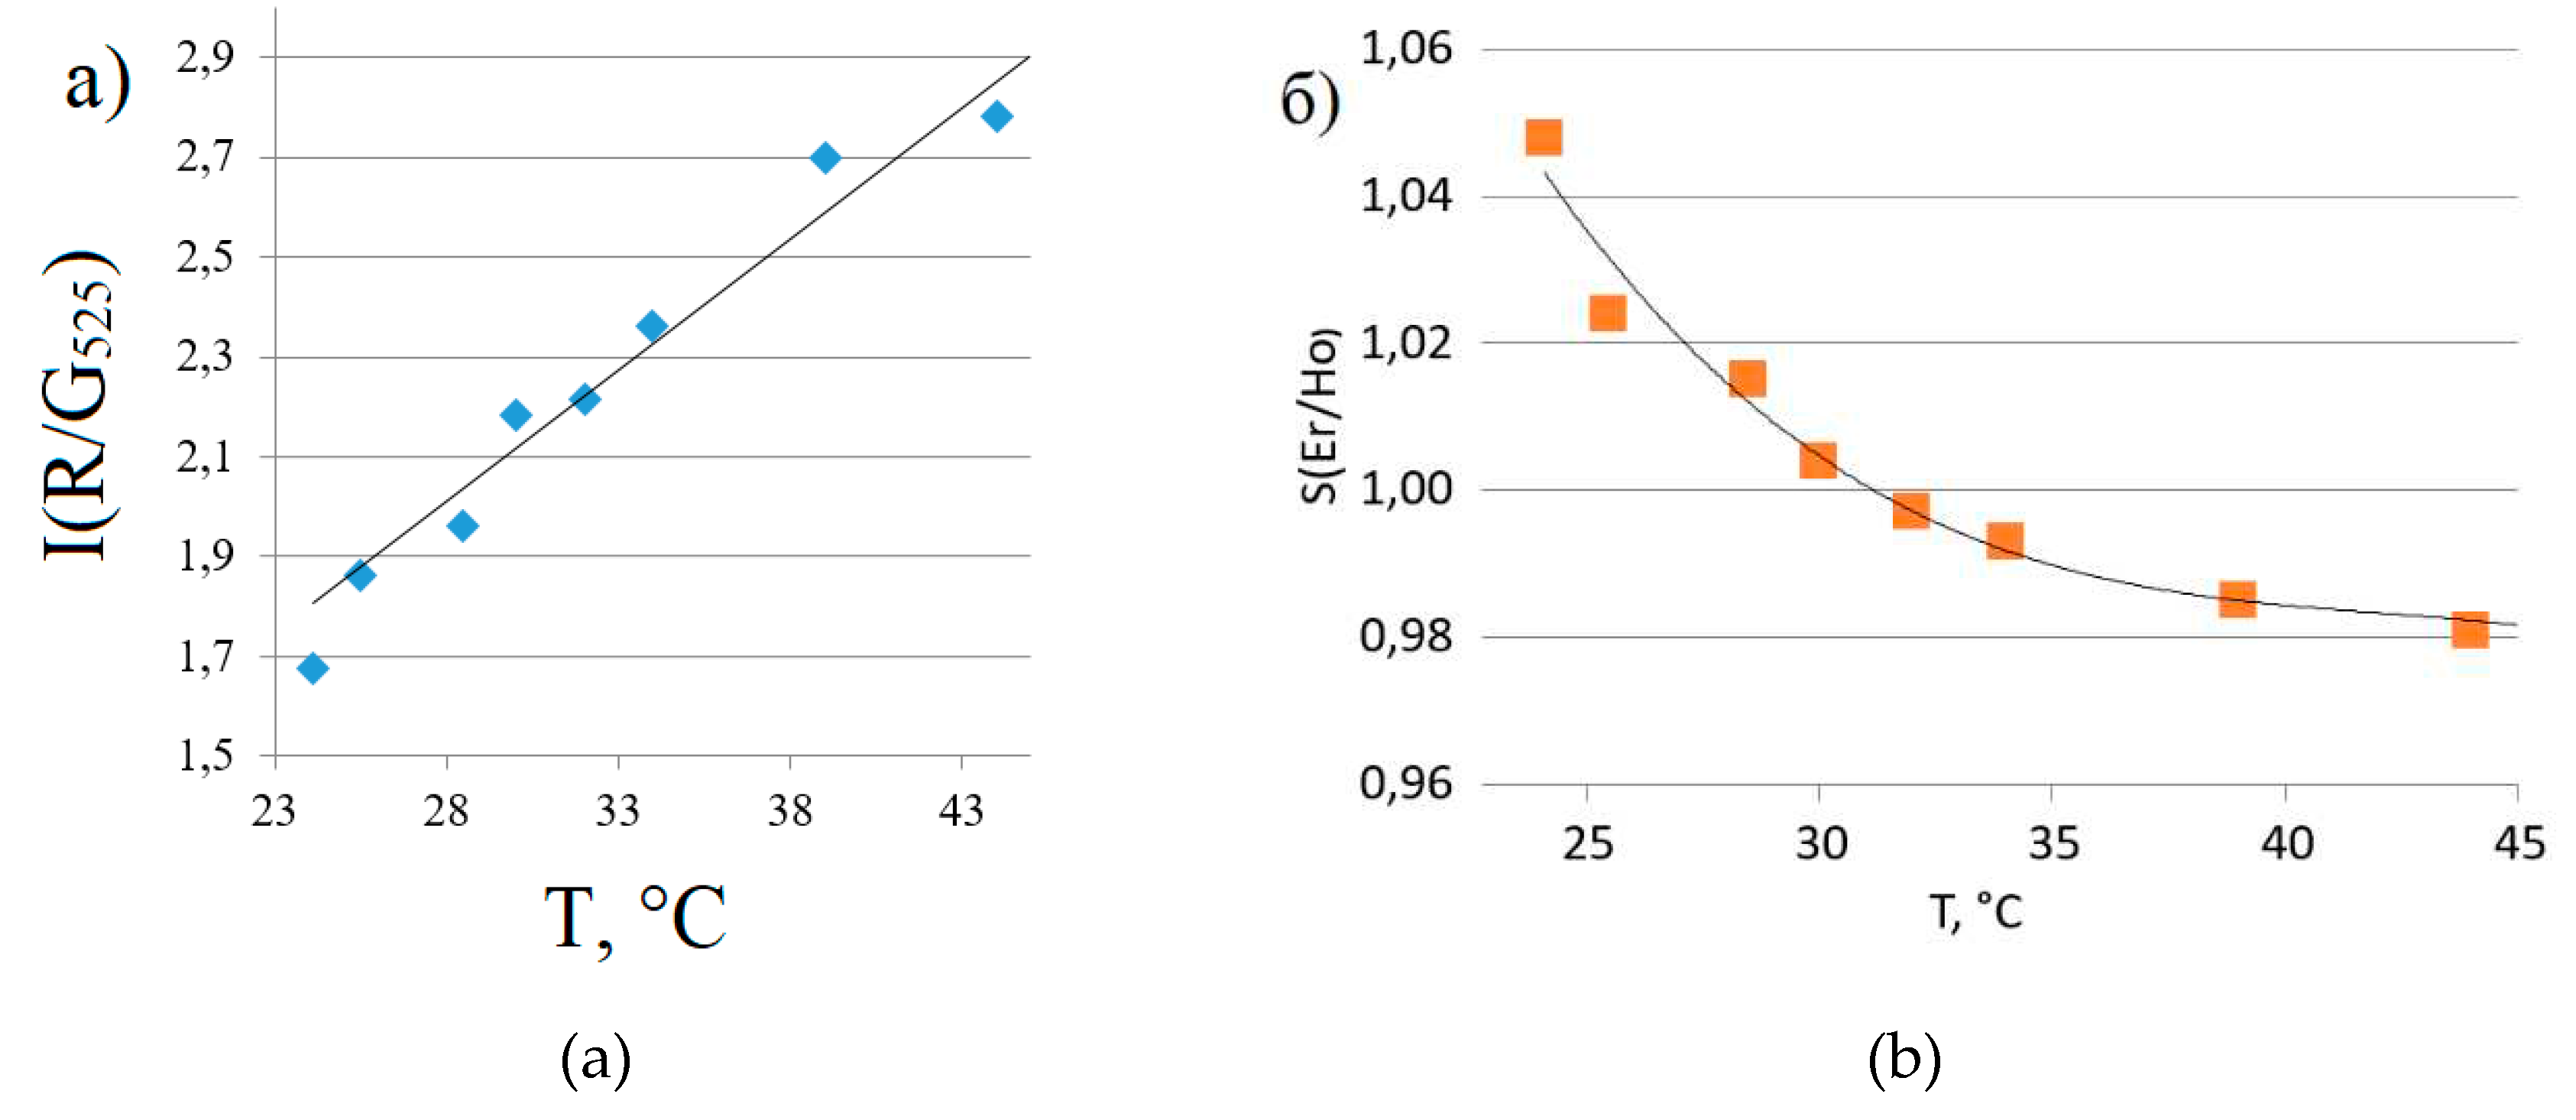
The temperature dependences of the ratio of the intensities of the red and green erbium luminescence bands for the visible range of the spectrum are shown in
Figure 5a, and the intensity ratios of the erbium and holmium luminescence bands for the SWIR range are shown in
Figure 5b.
From the dependences presented in
Figure 5, the relative coefficients of temperature sensitivity (Sr) in the temperature range from 24 to 44 °C are determined: Sr = 5.55% * K
-1 in the visible range and Sr = 0.34% * K
-1 in the SWIR range.
4. Discussion
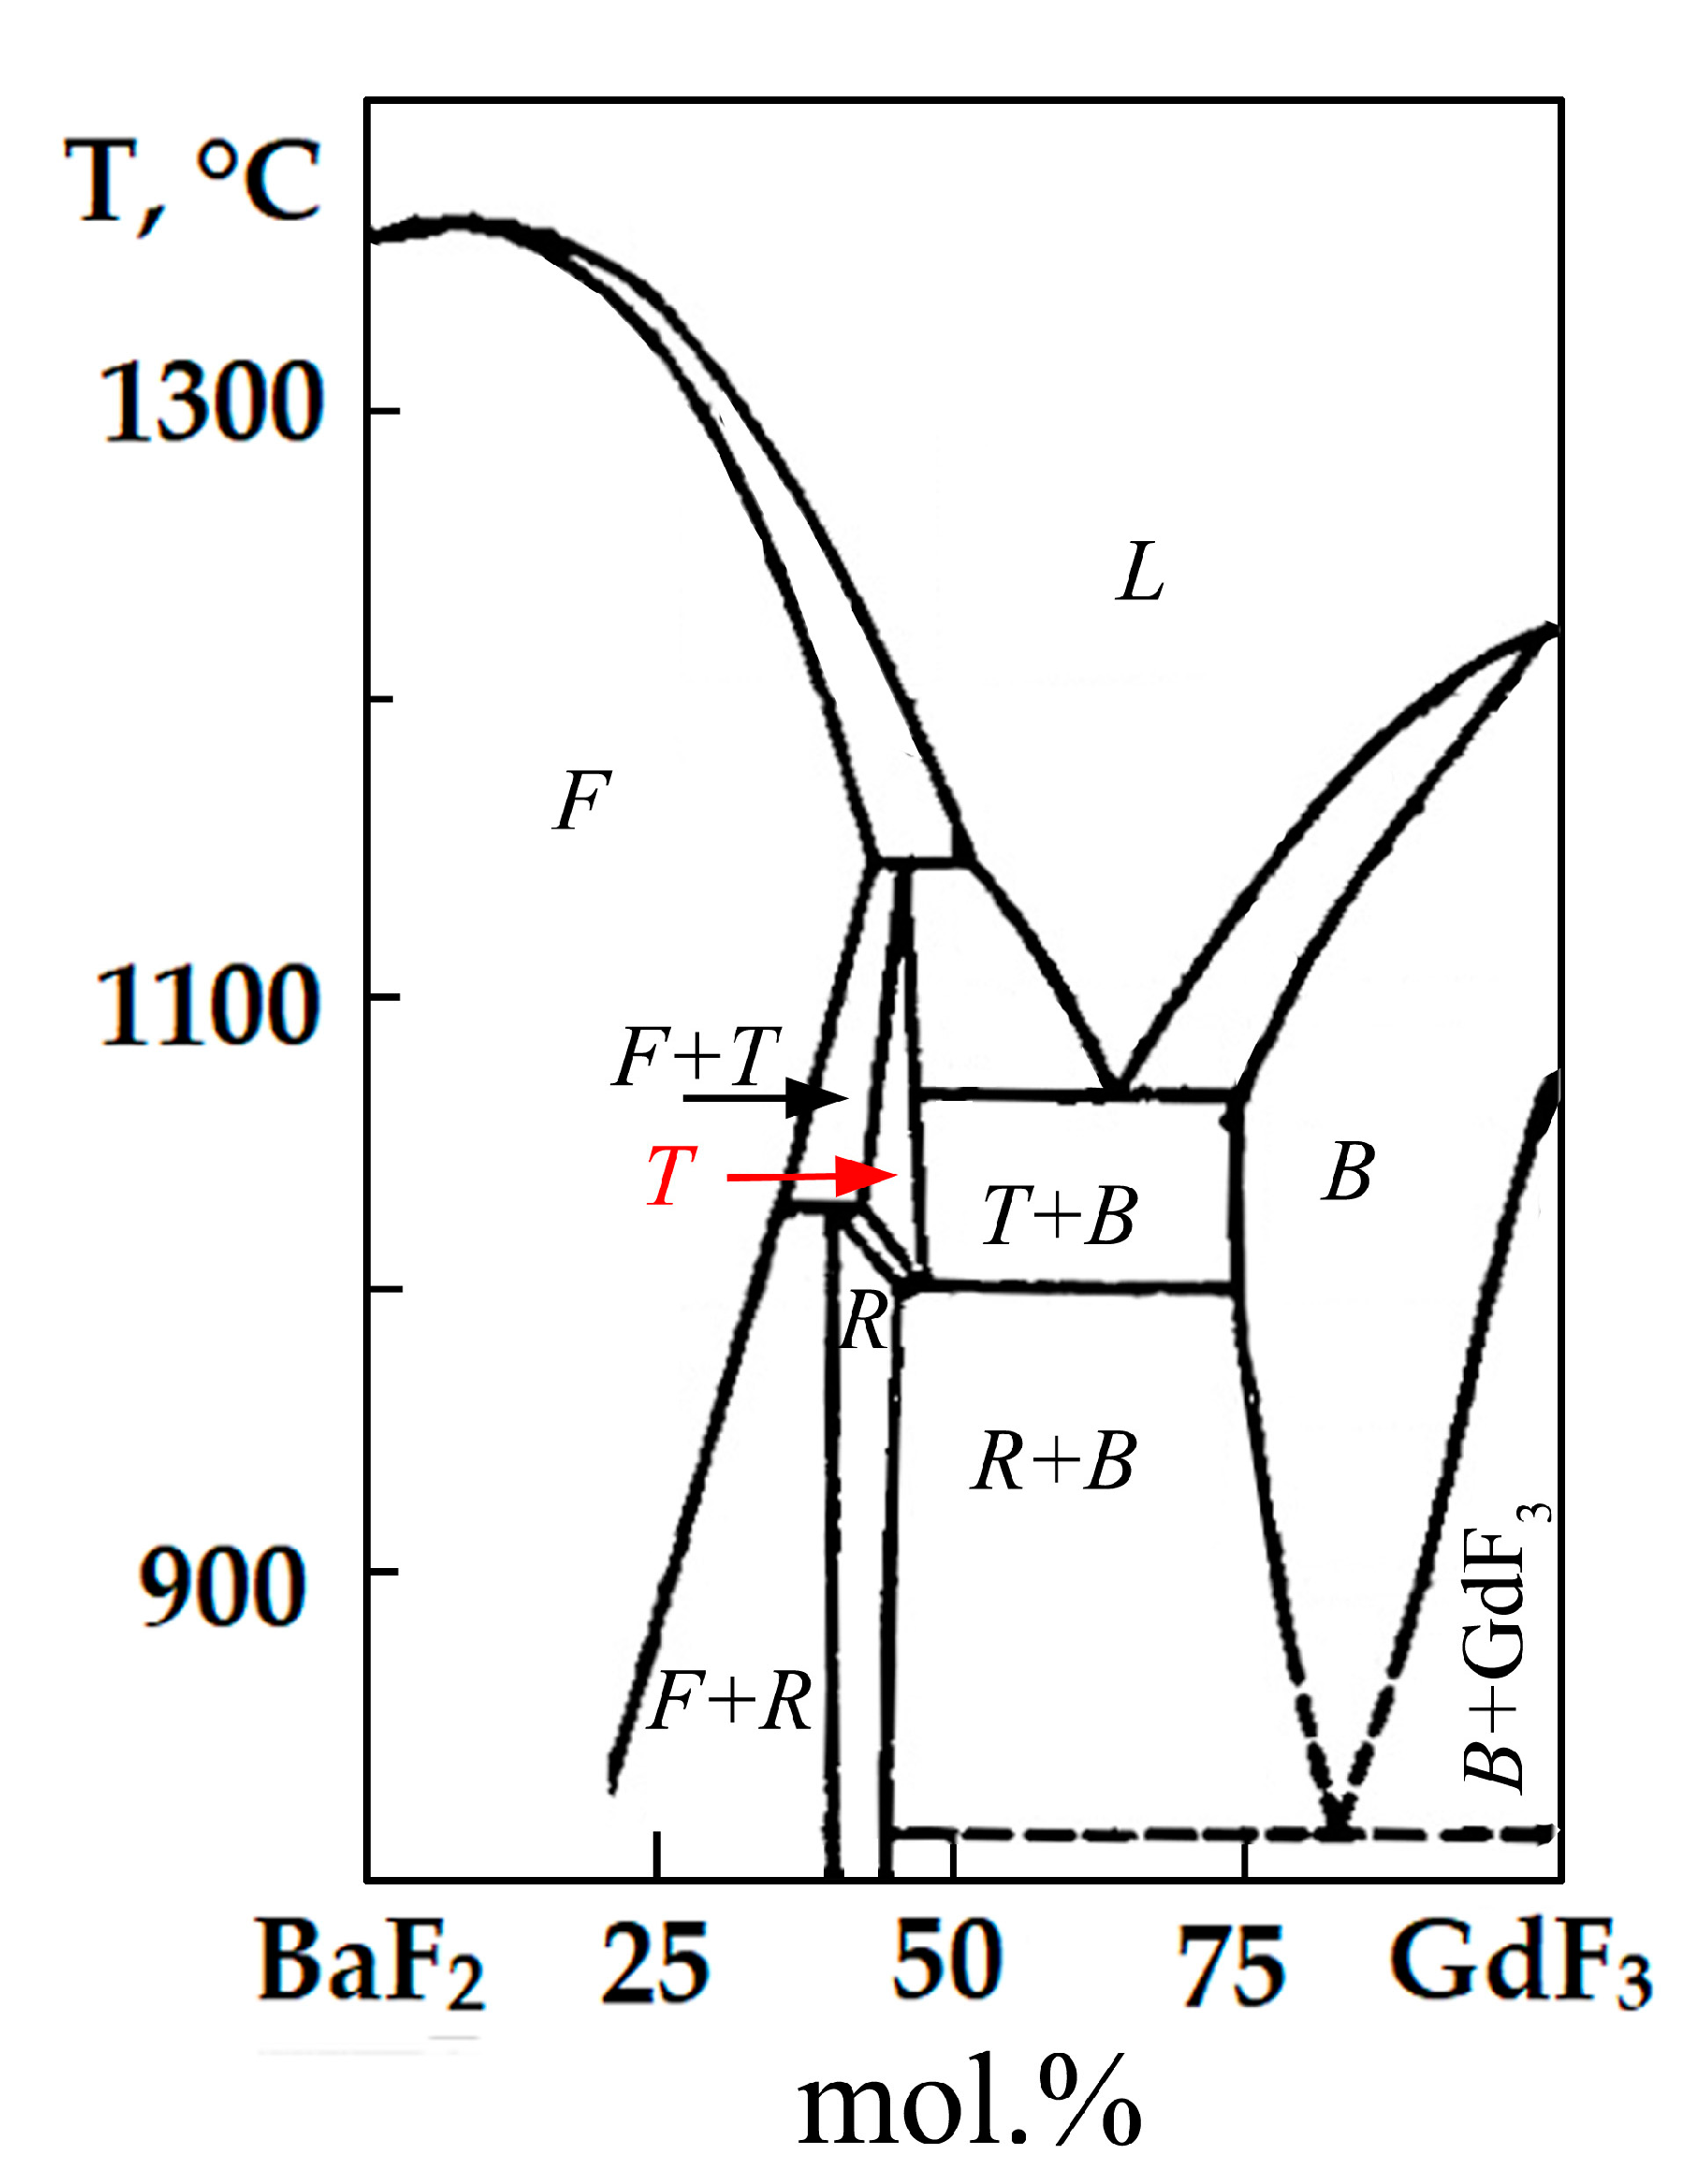
According to the XRD data, the synthesized samples crystallize in tetragonal crystallographic system with the spatial symmetry group (SSG)
I4. Comparing the data obtained with the well-known phase diagram of the BaF
2-GdF
3 system, presented in
Figure 6, makes it obvious that the samples prepared by us correspond to a high-temperature T phase having a similar composition [
22]. This phase with a fluorite-derived structure is characterized by a tetragonal cell, SSG
I4, with the parameter "
c" increased three times. The cause of tetragonal distortion is the ordered arrangement of clusters of defects in a fluorite-type lattice. The synthesis of the phase of such a structure at a low synthesis temperature of 500 °C is apparently explained by the entry of sodium into the lattice of synthesized samples, leading to stabilization of the high-temperature phase.
As the data in
Figure 5 show, the luminescent thermometer synthesized by us can be used to detect temperature in both visible and SWIR ranges. At the same time, the sensitivity in the visible range is high and significantly higher than in the IR range. However, the obtained characteristic of our phosphor is consistent with the analogues described in the literature (
Table 3).
5. Conclusions
The synthesis of a heavy matrix based on barium-gadolinium fluoride with a density of more than 6 g/cm3 was developed as a result of the study. The entry of sodium into the composition of the samples was recorded by EDX method. The presence of sodium stabilizes the high-temperature phase of the tetragonal crystallographic system with the general formula Ba0.5Gd0.5-xNaxF2.5-x.
The relative coefficients of temperature sensitivity (Sr) in the temperature range 296-316 K are equal to Sr = 5.55% * K-1 in the visible range and Sr = 0.34% * K-1 in the SWIR range. Thus, a novel dual-range luminescent thermometer of the composition Ba0.5Gd0.45Na0.05F2.45: Yb, Ho, Er has been developed.
Supplementary Materials
The following supporting information can be downloaded at the website of this paper posted on Preprints.org, Figure S1: Histogram of particle size distribution; Table S1: XRD data of Sample 1; Table S2: XRD data of Sample 2; Table S3: XRD data of Sample 3; Table S4: XRD data of Sample 4; Table S5: XRD data of Sample 5.
Author Contributions
Conceptualization, A.A.A., V.K.I. and P.P.F.; methodology, A.A.A., D.V.P.; validation, S.V.K., V.K.I. and P.P.F.; investigation, A.A.A., L.A.P., D.V.P., I.D.R.; resources, S.V.K.; writing—original draft preparation, A.A.A.; writing—review and editing, P.P.F.; visualization, A.A.A., L.A.P., supervision, V.K.I.; project administration, P.P.F.; funding acquisition, V.K.I., P.P.F. All authors have read and agreed to the published version of the manuscript.
Funding
This research was funded by the Russian Science Foundation, grant no. 22-13-00167. https://rscf.ru/project/22-13-00167/
Institutional Review Board Statement
Not applicable.
Informed Consent Statement
Not applicable.
Data Availability Statement
Not applicable.
Conflicts of Interest
The authors declare no conflict of interest.
References
-
Thermometry at the Nanoscale: Techniques and Selected Applications; Carlos, L.D., Palacio, F., Eds.; The Royal Society of Chemistry, 2015; ISBN 978-1-84973-904-7. [Google Scholar]
- Chen, W.; Cao, J.; Hu, F.; Wei, R.; Chen, L.; Guo, H. Sr2GdF7:Tm3+/Yb3+ Glass Ceramic: A Highly Sensitive Optical Thermometer Based on FIR Technique. J. Alloys Compd. 2018, 735, 2544–2550. [Google Scholar] [CrossRef]
- Zhong, J.; Chen, D.; Peng, Y.; Lu, Y.; Chen, X.; Li, X.; Ji, Z. A Review on Nanostructured Glass Ceramics for Promising Application in Optical Thermometry. J. Alloys Compd. 2018, 763, 34–48. [Google Scholar] [CrossRef]
- Hu, Y.; Shao, Q.; Zhang, P.; Dong, Y.; Fang, F.; Jiang, J. Mechanistic Investigations on the Dramatic Thermally Induced Luminescence Enhancement in Upconversion Nanocrystals. J. Phys. Chem. C 2018, 122, 26142–26152. [Google Scholar] [CrossRef]
- Dramićanin, M.D. Trends in Luminescence Thermometry. J. Appl. Phys. 2020, 128, 040902. [Google Scholar] [CrossRef]
- Thimsen, E.; Sadtler, B.; Berezin, M.Y. Shortwave-Infrared (SWIR) Emitters for Biological Imaging: A Review of Challenges and Opportunities. Nanophotonics 2017, 6, 1043–1054. [Google Scholar] [CrossRef]
- Kamimura, M.; Matsumoto, T.; Umezawa, M.; Soga, K. Ratiometric Near-Infrared Fluorescence Nanothermometry in the OTN-NIR (NIR II/III) Biological Window Based on Rare-Earth Doped β-NaYF4 Nanoparticles. J. Mater. Chem. B 2017, 5, 1917–1925. [Google Scholar] [CrossRef] [PubMed]
- Geitenbeek, R.G.; Nieuwelink, A.-E.; Jacobs, T.S.; Salzmann, B.B.V.; Goetze, J.; Meijerink, A.; Weckhuysen, B.M. In Situ Luminescence Thermometry To Locally Measure Temperature Gradients during Catalytic Reactions. ACS Catal. 2018, 8, 2397–2401. [Google Scholar] [CrossRef]
- Meng, M.; Zhang, R.; Fa, X.; Yang, J.; Cheng, Z.; Qiao, X.; Ou, J.; Wurth, C.; Resch-Genger, U. Core–Shell NaYF4 :Yb3+/Tm3+@NaGdF 4:Ce3+/Eu3+ Nanoparticles for Upconversion and Downconversion Dual-Mode Fluorescence-Based Temperature Sensing. ACS Appl. Nano Mater. 2022, 5, 9266–9276. [Google Scholar] [CrossRef]
- Wang, X.; Liu, Q.; Bu, Y.; Liu, C.-S.; Liu, T.; Yan, X. Optical Temperature Sensing of Rare-Earth Ion Doped Phosphors. RSC Adv. 2015, 5, 86219–86236. [Google Scholar] [CrossRef]
- Li, X.; Guo, H.; Wei, Y.; Guo, Y.; Lu, H.; Noh, H.M.; Jeong, J.H. Enhanced Up-Conversion in Er3+-Doped Transparent Glass-Ceramics Containing NaYbF4 Nanocrystals. J. Lumin. 2014, 152, 168–171. [Google Scholar] [CrossRef]
- Brites, C.D.S.; Kuznetsov, S.V.; Konyushkin, V.A.; Nakladov, A.N.; Fedorov, P.P.; Carlos, L.D. Simultaneous Measurement of the Emission Quantum Yield and Local Temperature: The Illustrative Example of SrF 2 :Yb 3+ /Er 3+ Single Crystals. Eur. J. Inorg. Chem. 2020, 2020, 1555–1561. [Google Scholar] [CrossRef]
- Runowski, M.; Goderski, S.; Przybylska, D.; Grzyb, T.; Lis, S.; Martín, I.R. Sr2LuF7:Yb3+–Ho3+ –Er3+ Upconverting Nanoparticles as Luminescent Thermometers in the First, Second, and Third Biological Windows. ACS Appl. Nano Mater. 2020, 3, 6406–6415. [Google Scholar] [CrossRef]
- Runowski, M.; Bartkowiak, A.; Majewska, M.; Martín, I.R.; Lis, S. Upconverting Lanthanide Doped Fluoride NaLuF4:Yb3+-Er3+-Ho3+ - Optical Sensor for Multi-Range Fluorescence Intensity Ratio (FIR) Thermometry in Visible and NIR Regions. J. Lumin. 2018, 201, 104–109. [Google Scholar] [CrossRef]
- Maurya, S.K.; Kushawaha, R.; Tiwari, S.P.; Kumar, A.; Kumar, K.; Da Silva, J.C.G.E. Thermal Decomposition Mediated Er 3+ /Yb 3+ Codoped NaGdF 4 Upconversion Phosphor for Optical Thermometry. Mater. Res. Express 2019, 6, 086211. [Google Scholar] [CrossRef]
- Sekiyama, S.; Umezawa, M.; Kuraoka, S.; Ube, T.; Kamimura, M.; Soga, K. Temperature Sensing of Deep Abdominal Region in Mice by Using Over-1000 Nm Near-Infrared Luminescence of Rare-Earth-Doped NaYF4 Nanothermometer. Sci. Rep. 2018, 8, 16979. [Google Scholar] [CrossRef]
- Pominova, D.; Proydakova, V.; Romanishkin, I.; Ryabova, A.; Kuznetsov, S.; Uvarov, O.; Fedorov, P.; Loschenov, V. Temperature Sensing in the Short-Wave Infrared Spectral Region Using Core-Shell NaGdF4:Yb3+, Ho3+, Er3+@NaYF4 Nanothermometers. Nanomaterials 2020, 10, 1992. [Google Scholar] [CrossRef]
- Fedorov, P.P.; Mayakova, M.N.; Alexandrov, A.A.; Voronov, V.V.; Pominova, D.V.; Chernova, E.V.; Ivanov, V.K. Synthesis of NaYF4:Yb, Er Up-conversion Luminophore from Nitrate Flux. Nanosyst. Phys. Chem. Math. 2020, 11, 417–423. [Google Scholar] [CrossRef]
- Alexandrov, A.A.; Mayakova, M.N.; Voronov, V.V.; Pominova, D.V.; Kuznetsov, S.V.; Baranchikov, A.E.; Ivanov, V.K.; Lysakova, E.I.; Fedorov, P.P. Synthesis of Upconversion Luminophores Based on Calcium Fluoride. Kondens. Sredy Mezhfaznye Granitsy Condens. Matter Interphases 2020, 22. [Google Scholar] [CrossRef]
- Kuznetsov, S.V.; Alexandrov, A.A.; Fedorov, P.P. Optical Fluoride Nanoceramics. Inorg. Mater. 2021, 57, 555–578. [Google Scholar] [CrossRef]
- Fedorov, P.; Mayakova, M.; Alexandrov, A.; Voronov, V.; Kuznetsov, S.; Baranchikov, A.; Ivanov, V. The Melt of Sodium Nitrate as a Medium for the Synthesis of Fluorides. Inorganics 2018, 6, 38. [Google Scholar] [CrossRef]
- Sobolev, B.P.; Tkachenko, N.L. Phase Diagrams of BaF2-(Y, Ln)F3 Systems. J. Less-Common Metals 1982, 85, 155–170. [Google Scholar] [CrossRef]
|
Disclaimer/Publisher’s Note: The statements, opinions and data contained in all publications are solely those of the individual author(s) and contributor(s) and not of MDPI and/or the editor(s). MDPI and/or the editor(s) disclaim responsibility for any injury to people or property resulting from any ideas, methods, instructions or products referred to in the content. |
© 2023 by the authors. Licensee MDPI, Basel, Switzerland. This article is an open access article distributed under the terms and conditions of the Creative Commons Attribution (CC BY) license (http://creativecommons.org/licenses/by/4.0/).
