Preprint
Article

Hybrid Model for Optimisation of Waste Dump Design and Site Selection

Altmetrics

Downloads

175

Views

51

Comments

0

A peer-reviewed article of this preprint also exists.

Submitted:

19 July 2023

Posted:

24 July 2023

You are already at the latest version

Alerts
Abstract
Waste management is an unavoidable technological operation in the process of raw material extraction. The main characteristic of this technological operation is the handling of large quantities of waste material, which can amount to several hundred million cubic metres. Working with this amount of material usually requires high-capacity systems for excavation and loading, a large fleet of trucks for haulage, construction, and maintenance of a complex roads network, use of a significant area of land in order to achieve the required capacities, etc. At the same time, this operation must comply with all administrative and environmental standards. Therefore, optimising waste rock management (particularly haulage and dumping) has the potential to significantly improve the overall value of the project. This paper presents a hybrid model for the optimisation of waste dump design and site selection. The model is based on different mathematical methods (genetic algorithm, analytic hierarchy process and heuristic methods) adapted to different aspects of the problem. The main objective of the model is to provide a solution (in analytical and graphical form) for the draft waste dump design, on the basis of which the final waste dump design can be defined.
Keywords: 
Subject: Engineering  -   Mining and Mineral Processing

1. Introduction

Mining is a complex activity, and the success of a mining project depends on a variety of factors. Certainly, cost management is an important component necessary for the project to realise its full potential. Material handling (particularly haulage) is the largest contributor to the cost of open pit mining, as confirmed by several studies and scientific papers [1,2,3,4,5,6].
In general, the majority of these costs are incurred in the excavation, haulage and dumping of waste. This can be explained by the stripping ratio, which is usually greater than one (there are larger quantities of waste than ore), and the fact that capacities and haulage distances for ore are approximately constant. On the other hand, unlike ore, when waste rock is hauled to a dump, the volume in the dump accumulates, resulting in higher costs due to increasing haulage distance and height as the waste dump expands horizontally and vertically [7]. The impact of waste management on total costs is likely to increase given the decline in ore grades in deposits and the trend towards decreasing cut-off grades, resulting in an increase in stripping ratio [8,9,10,11] and the need to mine larger quantities of waste per unit of ore. Therefore, optimising waste management (particularly haulage and dumping) has the potential to significantly improve the overall value of the project and is highly desirable. Although this is widely recognised, many authors agree that waste management has not received sufficient scientific and practical attention. Li et al. [7,12,13] argue that current mine planning practice is ore-centric, and that little attention is paid to the waste dumping. This is further emphasised by Fu et al. [14] who state that the waste management planning process is usually reduced to manual selection of the dump location based on the current shortest route (attention is focused on the short-term haulage cost saving objective, but long-term objectives are neglected) while ensuring that the waste rock from the pit does not exceed the waste dump capacity. In this way, the importance of waste management is highly underestimated. All this suggests that there is a great need to improve waste management planning, both from a scientific and practical point of view.
There are many papers related to waste management in mining that address specific problems. The optimal location of waste dumps is probably the most frequently analysed. Kumral and Dimitrakopoulos [15] developed a taboo search algorithm for the selection of optimal waste dump sites. The authors take into account financial, environmental and safety considerations to optimise the possibility of dumping waste at five potential sites from six predefined mines. Hajarian and Osanloo [16] have identified the effective factors in selecting the waste dump sites and have developed a linear mathematical model for finding a suitable waste dump site, minimising the haul road construction cost. The authors emphasise that the waste dump site with the shortest haul route is not inevitably the optimal solution, as earthworks and construction costs should be taken into account. In recent years, the selection of a preferred waste dump site has often been based on multi-attribute decision making (MADM) methods [17,18,19,20] and GIS methods have also been popular [21,22]. The focus of these studies is mostly on the correct selection of factors that influence the selection of a waste dump site and its management.
Many studies recognise the problem of waste scheduling as particularly important to the overall project optimisation process. Li et al. argue that current practice focuses mainly on ore recovery scheduling and subsequently neglects waste scheduling in long-term planning [13]. Mixed-integer programming (MIP) is a commonly used method that has been successfully implemented in several waste scheduling optimisation studies. As expected, minimising the total transport distance is the basic objective function in these studies. Minimisation of the required truck deviation between adjacent years [13] and prevention of undesired environmental impacts such as acid mine drainage [7,12,14] are additional objective functions or constraints used to generate the optimal waste placement schedules.
Internal waste dumping is also an interesting possibility, which has been addressed in many studies [23,24,25,26]. Due to the specific geological conditions (shape and location of the deposits) as well as the mining methods used, internal waste dumping is most often, but not necessarily, limited to open-pit coal mining. Sari and Kumral [27] developed a MIP-based model to maximise the Net Present Value (NPV) of the mining project which in addition to external dumping, supports a waste dumping option within the same pit. Peng and Zhang [28] developed a mathematical model to determine the optimal height of the internal waste dump and minimise costs.
It is noticeable that among the studies related to waste management, there are very few papers related to the design of waste dumps. This may be unusual, especially considering the amount of attention given to the design and optimisation of pit boundaries. Even some papers related to waste management include the word design in the title, they only partially address the actual overall design components and mostly focus only on the height of the waste dump or on the selection of the optimal one from a set of predefined dump designs based on economic, geotechnical or environmental conditions [29,30,31]. A particularly interesting study has been carried out by Ortiz [32], who uses linear programming to optimise waste dump design. More specifically, he optimises the ratio between the number of benches and the base area of the waste dump (more dump benches mean a smaller waste dump base area and vice versa) for a given volume, i.e. waste dump capacity. However, the described research does not consider the shape of the waste dump itself (waste dump shape and location are predefined), which is one of the basic components of the design.
Summarising the above, it is clear that the majority of studies carried out have focused on optimising waste dump site selection and the problem of waste scheduling, while relatively little attention has been paid to the overall aspects of waste dump design.

2. Hybrid model Development

This paper presents a hybrid model for the optimisation of waste dump design and site selection. Environmental conditions and constraints are considered through the criteria used in the model, while the waste scheduling issue was not the subject of interest in this research. The goal of the proposed model is to provide a solution for the draft design of the waste dump, based on which an experienced engineer can develop the final waste dump design (similar to the way the final pit design is developed based on the optimal pit shell).

2.1. Methods

To solve many different complex problems related to waste dumps, a hybrid model combines various mathematical methods adapted for individual aspects of the problem:
  • Random selection (Monte Carlo simulation) - to simulate the geometry of potential solutions,
  • Genetic algorithm - to optimise solutions,
  • Multi-criteria decision making - AHP method - for defining variable values,
  • Heuristic method - for expert interpretation and finalisation of solutions
The Monte Carlo method was firstly introduced by Metropolis and Ulam [33]. There is evidence of earlier applications of this method, but these applications were not published, so these earlier contributions went unnoticed [34]. Monte Carlo methods are numerical methods for solving mathematical problems using random variables and statistical evaluation of their properties. In Monte Carlo algorithms, so-called random numbers play an important role and, strictly speaking, exist only as the result of random processes [35]. In general, the Monte Carlo method consists of 4 steps [36]:
  • Generation of a static model (process functions),
  • Defining input parameters through probability distribution functions,
  • Generation of random variables from the set of distribution of input parameters,
  • Analysis of the obtained results.
The benefits of the Monte Carlo method have been recognised in many different industries over time. In mining, Monte Carlo has found application in risk analysis and as the accompanying method in the analysis of various problems [37,38,39].
The Genetic Algorithm (GA) was introduced by Holland in the early 1970s [40] and belongs to the group of optimisation algorithms which main goal is to find the minimum or maximum of a function (global optimum). In practice, genetic algorithms should produce an exact or approximate solution to an optimisation or search problem. The result can be a numerical value, a mathematical function, a path in a graph, etc. [41].
GA was developed on the basis of natural selection, i.e. the principle that only the strongest/highest-quality individuals in a population survive to reproduce and form new generations of individuals [42]. Using these basic ideas of evolution and the basic genetic transformations of selection, crossover and mutation, GA solves optimisation problems. Each possible solution to the optimisation problem is represented by a single chromosome or genotype. The parameters of the problem are encoded as genes in the chromosome [43].
It's well known that natural reproduction can lead to certain drawbacks, such as degeneration in the population. Similar can occur when GA is used for optimisation. In such situations, individuals from the offspring generation will not have better characteristics than individuals from the parent generation. The value of the objective function for this type of individuals will be worse (far from the optimal solution), so they will be excluded in the selection process. In addition to the appearance of such solutions, one of the most common problems encountered during the work of the GA is early convergence. Early convergence occurs when the GA population reaches a suboptimal state. This means that the genetic operators can no longer produce offspring with better performance than their parents. Thus, evolutionary algorithms remain trapped in the domain of local optimum [44]. The basic flowchart of a GA is presented in Figure 1. [45].
The use of GA in various scientific fields remains very common. It's similar in mining, where GA is most commonly used for production and equipment scheduling optimisation [46,47,48], cut-off optimisation [49,50], grade and quality control [51,52].
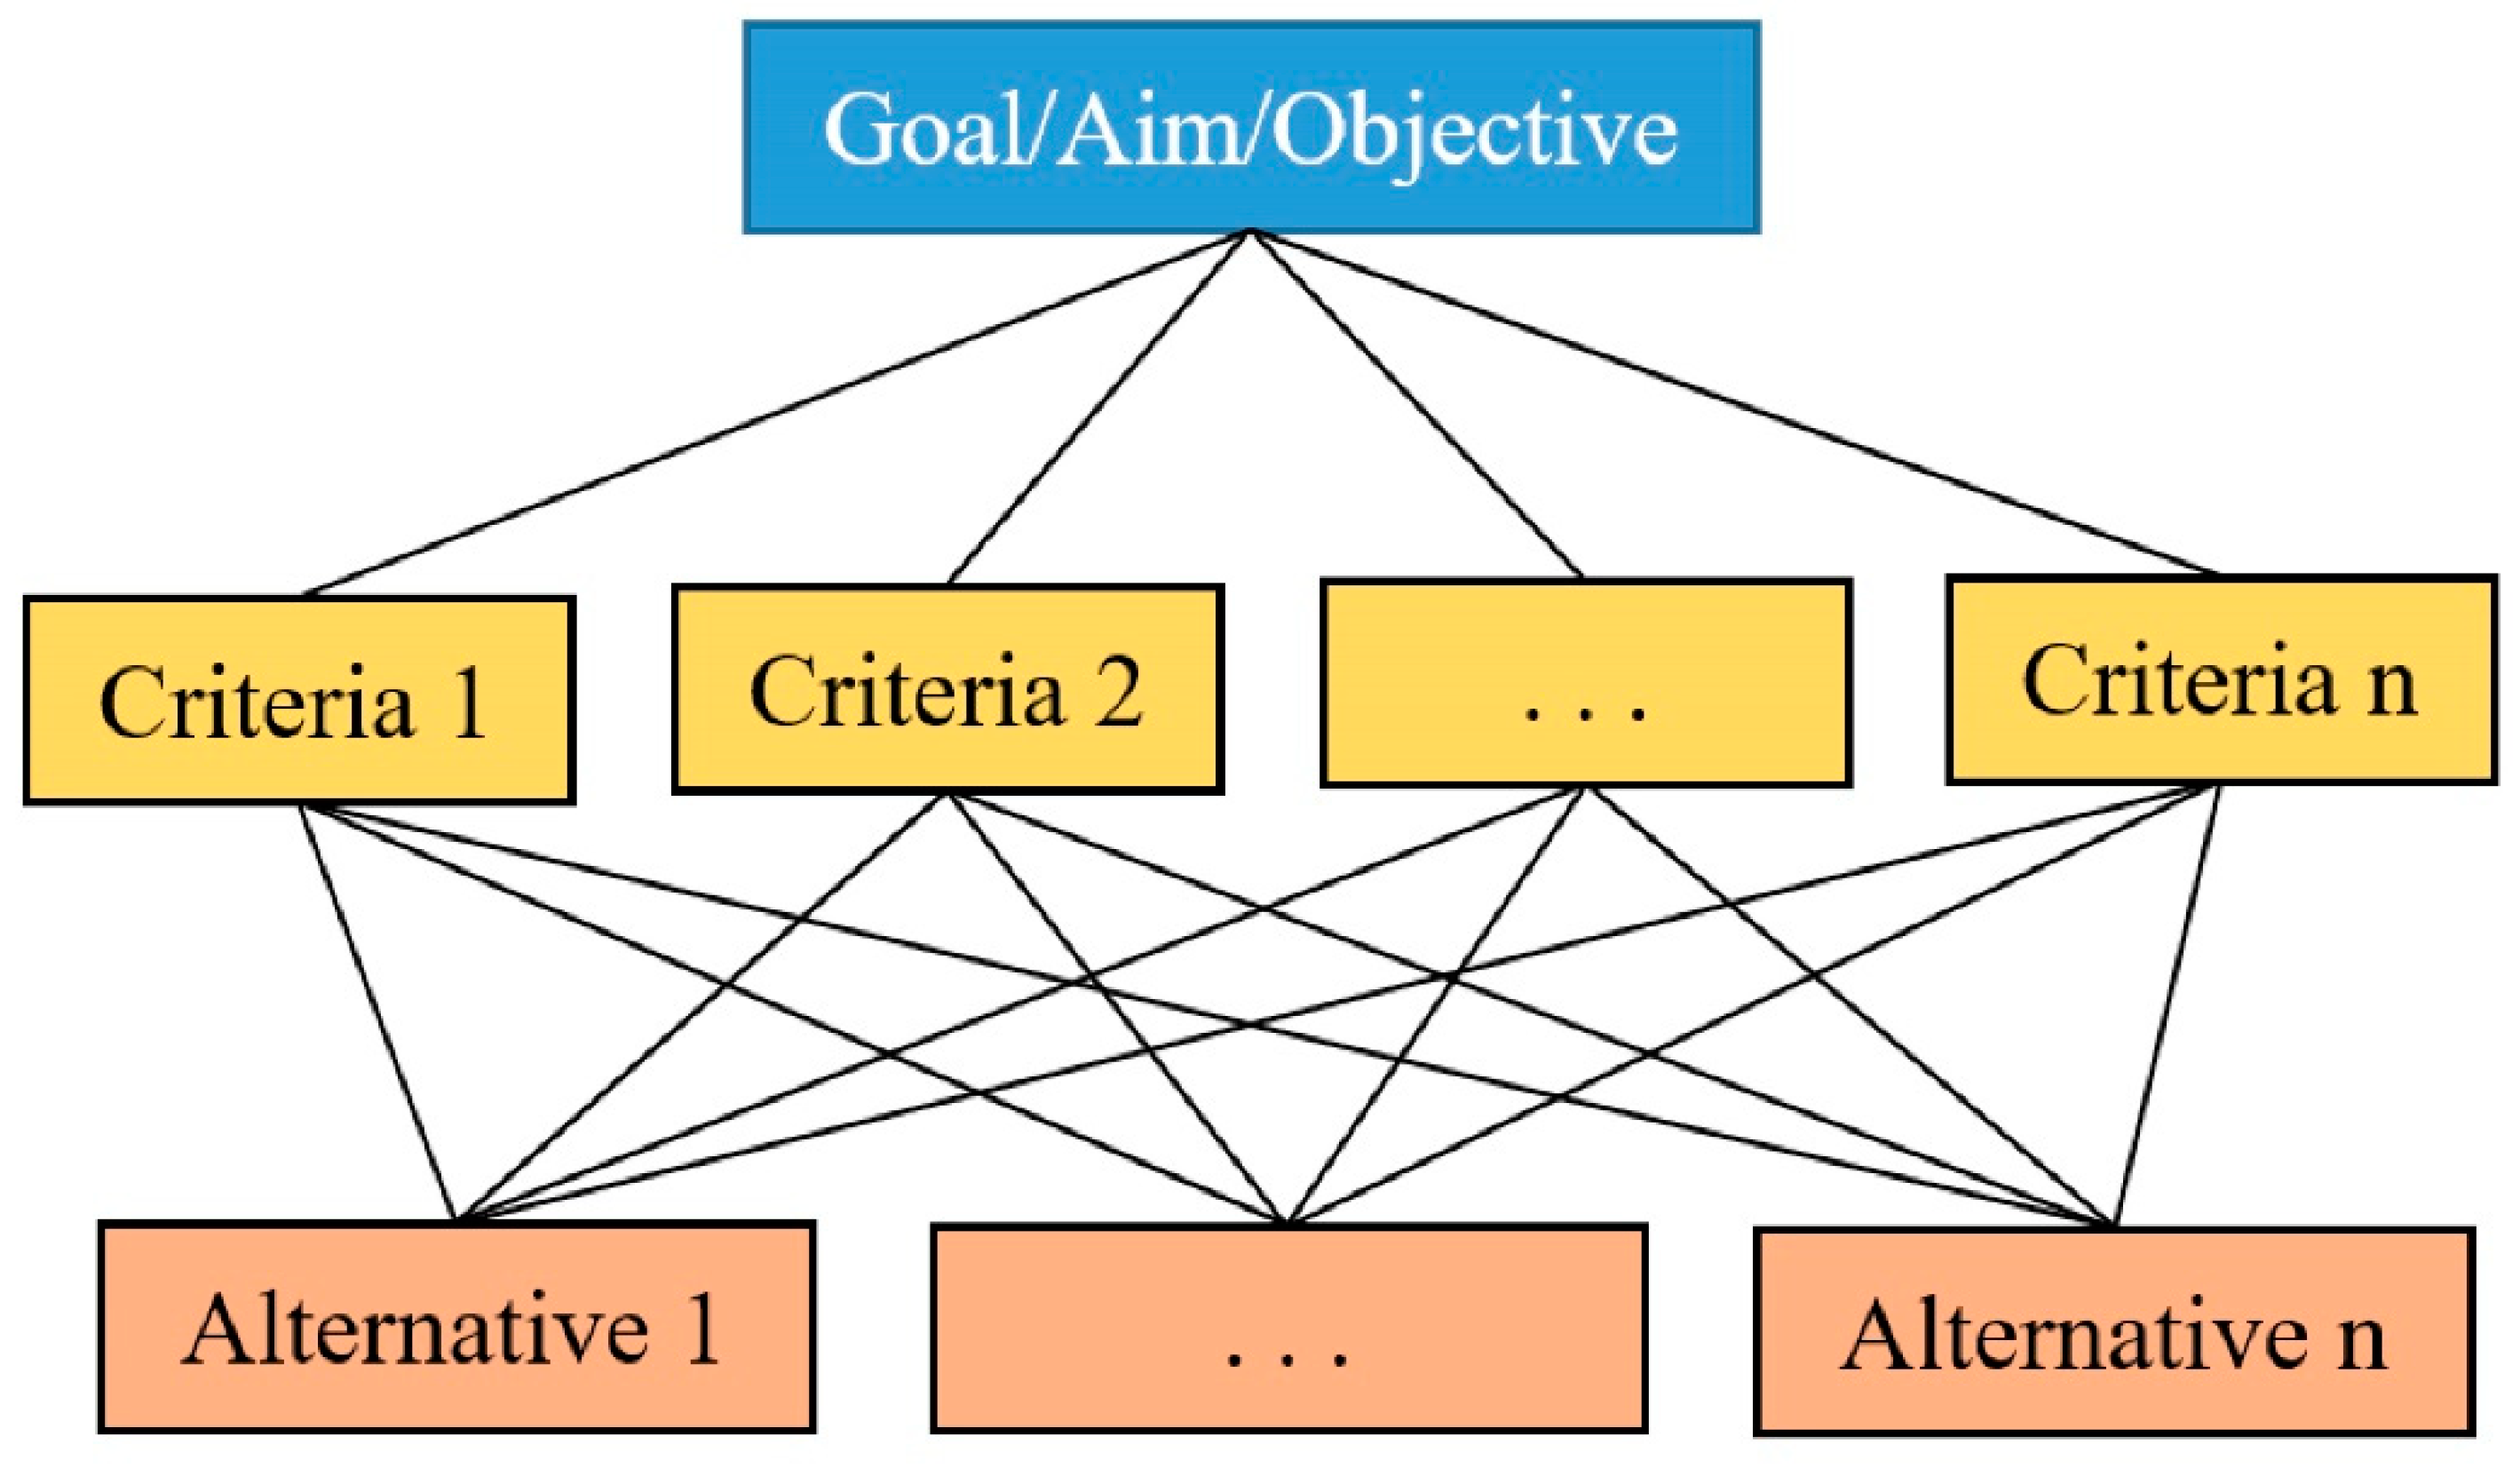
The Analytic Hierarchy Process (AHP) is a decision-making method developed by Thomas L. Saaty in the 1970s. It provides a structured approach to dealing with complex decisions by breaking them down into a hierarchical structure and evaluating the relative importance of different criteria and alternatives (Figure 2) [53]. AHP is widely used in various fields, including business, engineering, health care and environmental management [54].
The AHP method consists of the following steps [55,56]
  • Define the unstructured problem and clearly state the objectives and outcomes.
  • Decompose the complex problem into a hierarchical structure with decision elements (criteria, detailed criteria and alternatives).
  • Pairwise comparisons - assess the relative importance of criteria and alternatives through pairwise comparisons (using a scale that reflects their relative preference or importance).
  • Derive priority weights - based on the pairwise comparisons, the AHP calculates priority weights for each element in the hierarchy (these weights quantify the relative importance of each element in achieving the goal).
  • Consistency check - evaluates the consistency of the pairwise comparisons to ensure their reliability.
  • Aggregation and ranking - combine the priority weights to obtain a comprehensive ranking of the alternatives.
As the AHP method provides a systematic and structured approach to decision making, it has found significant application.

2.2. Model algorithm

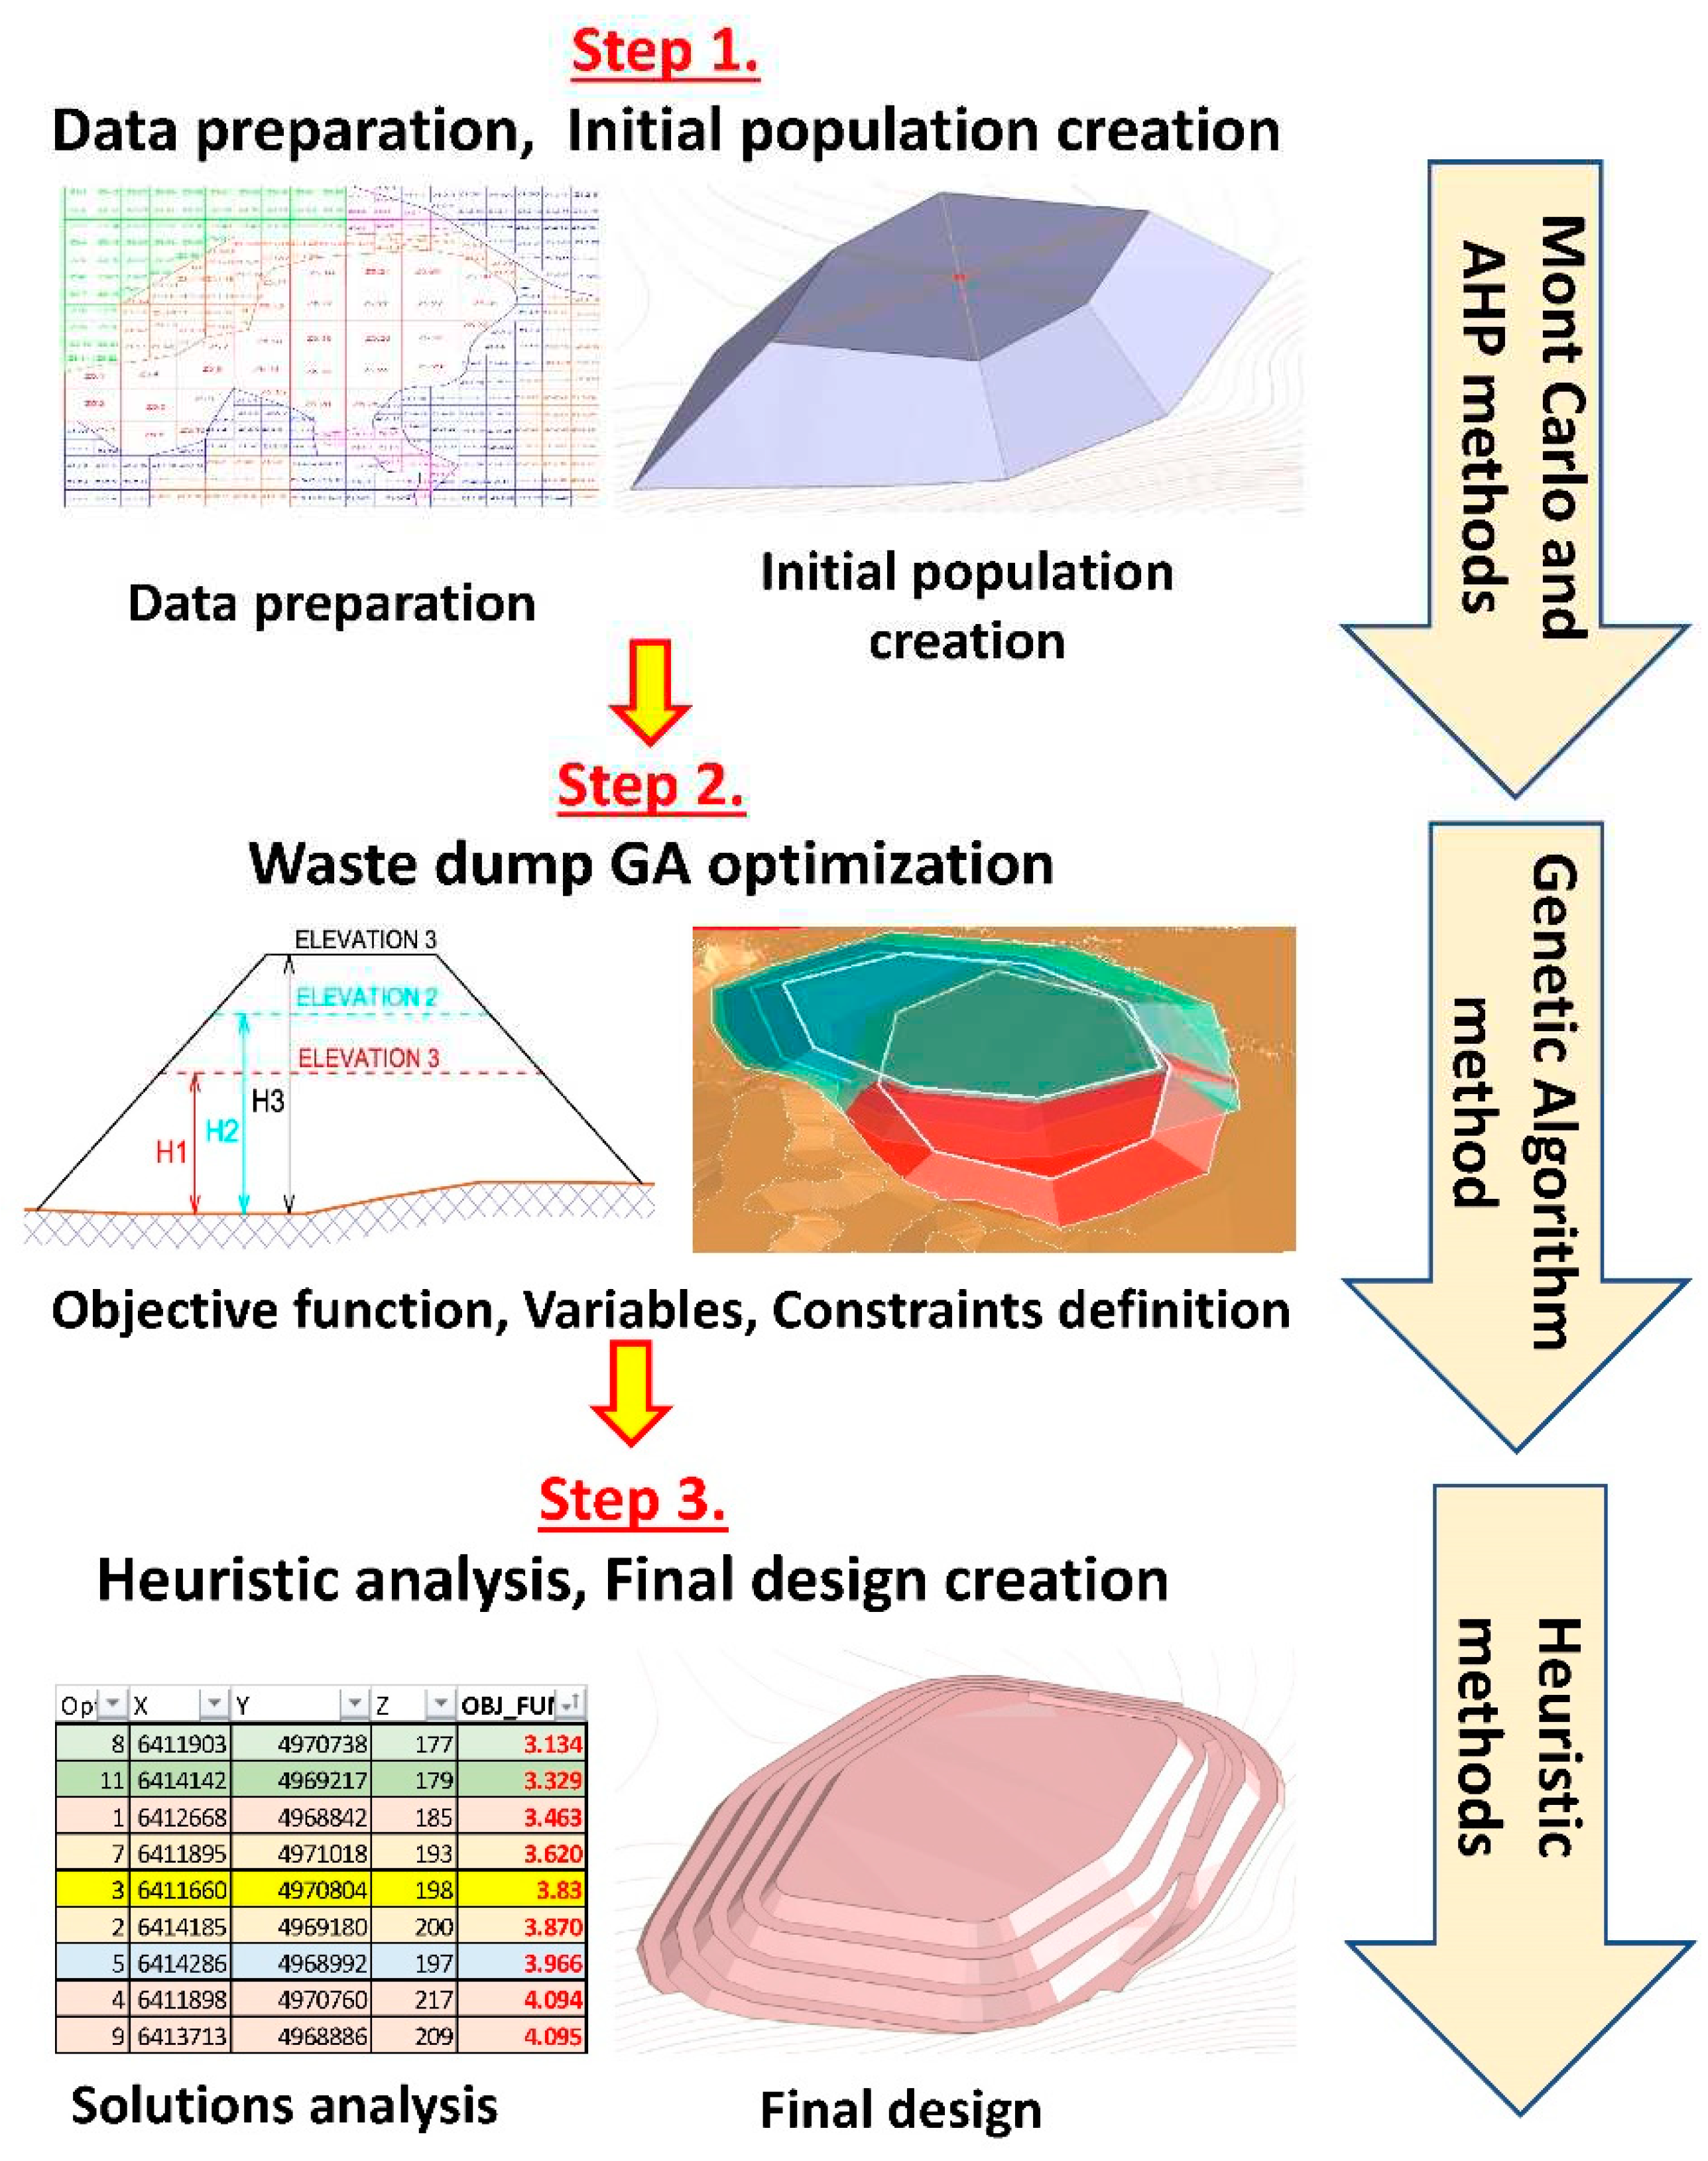
The proposed hybrid model algorithm can be roughly divided into 3 steps and is shown in Figure 3.

2.2.1. Step 1 – Data preparation and initial population creation

The first step in the algorithm is mainly related to data preparation, constraints definition and initial population generation (for the next step, i.e., GA optimisation). All the required data are part of the standard data set that is usually found during the design of waste dumps. According to the algorithm, it is necessary to define:
  • Waste dump capacity,
  • Overall slope angle of waste dump,
  • Basic geometry (shape) and elevation of waste dump top area,
  • Definition of terrain zones to be analysed by the model and zone evaluation.
The capacity of the waste dump is determined by the planned amount of waste material from the pit, increased by the swell factor. The overall slope angle of the waste dump depends on the properties of the waste material.
Geometry and elevation of waste dump top area are characteristics of each waste dump and in this case shape and elevation range (minimum and maximum elevation) are necessary elements of the initial population creation for further optimisation (GA). Basically, waste dump design can be controlled by waste dump top area (elevation and shape), overall slope angle and topography (defines waste dump base area). If we generate a waste dump top area with random shape and elevation and expend the top area boundary according to the overall slope angle to the intersection with the terrain, we will get a randomly generated waste dump. Same methodology is used to generate the initial population in the presented model.
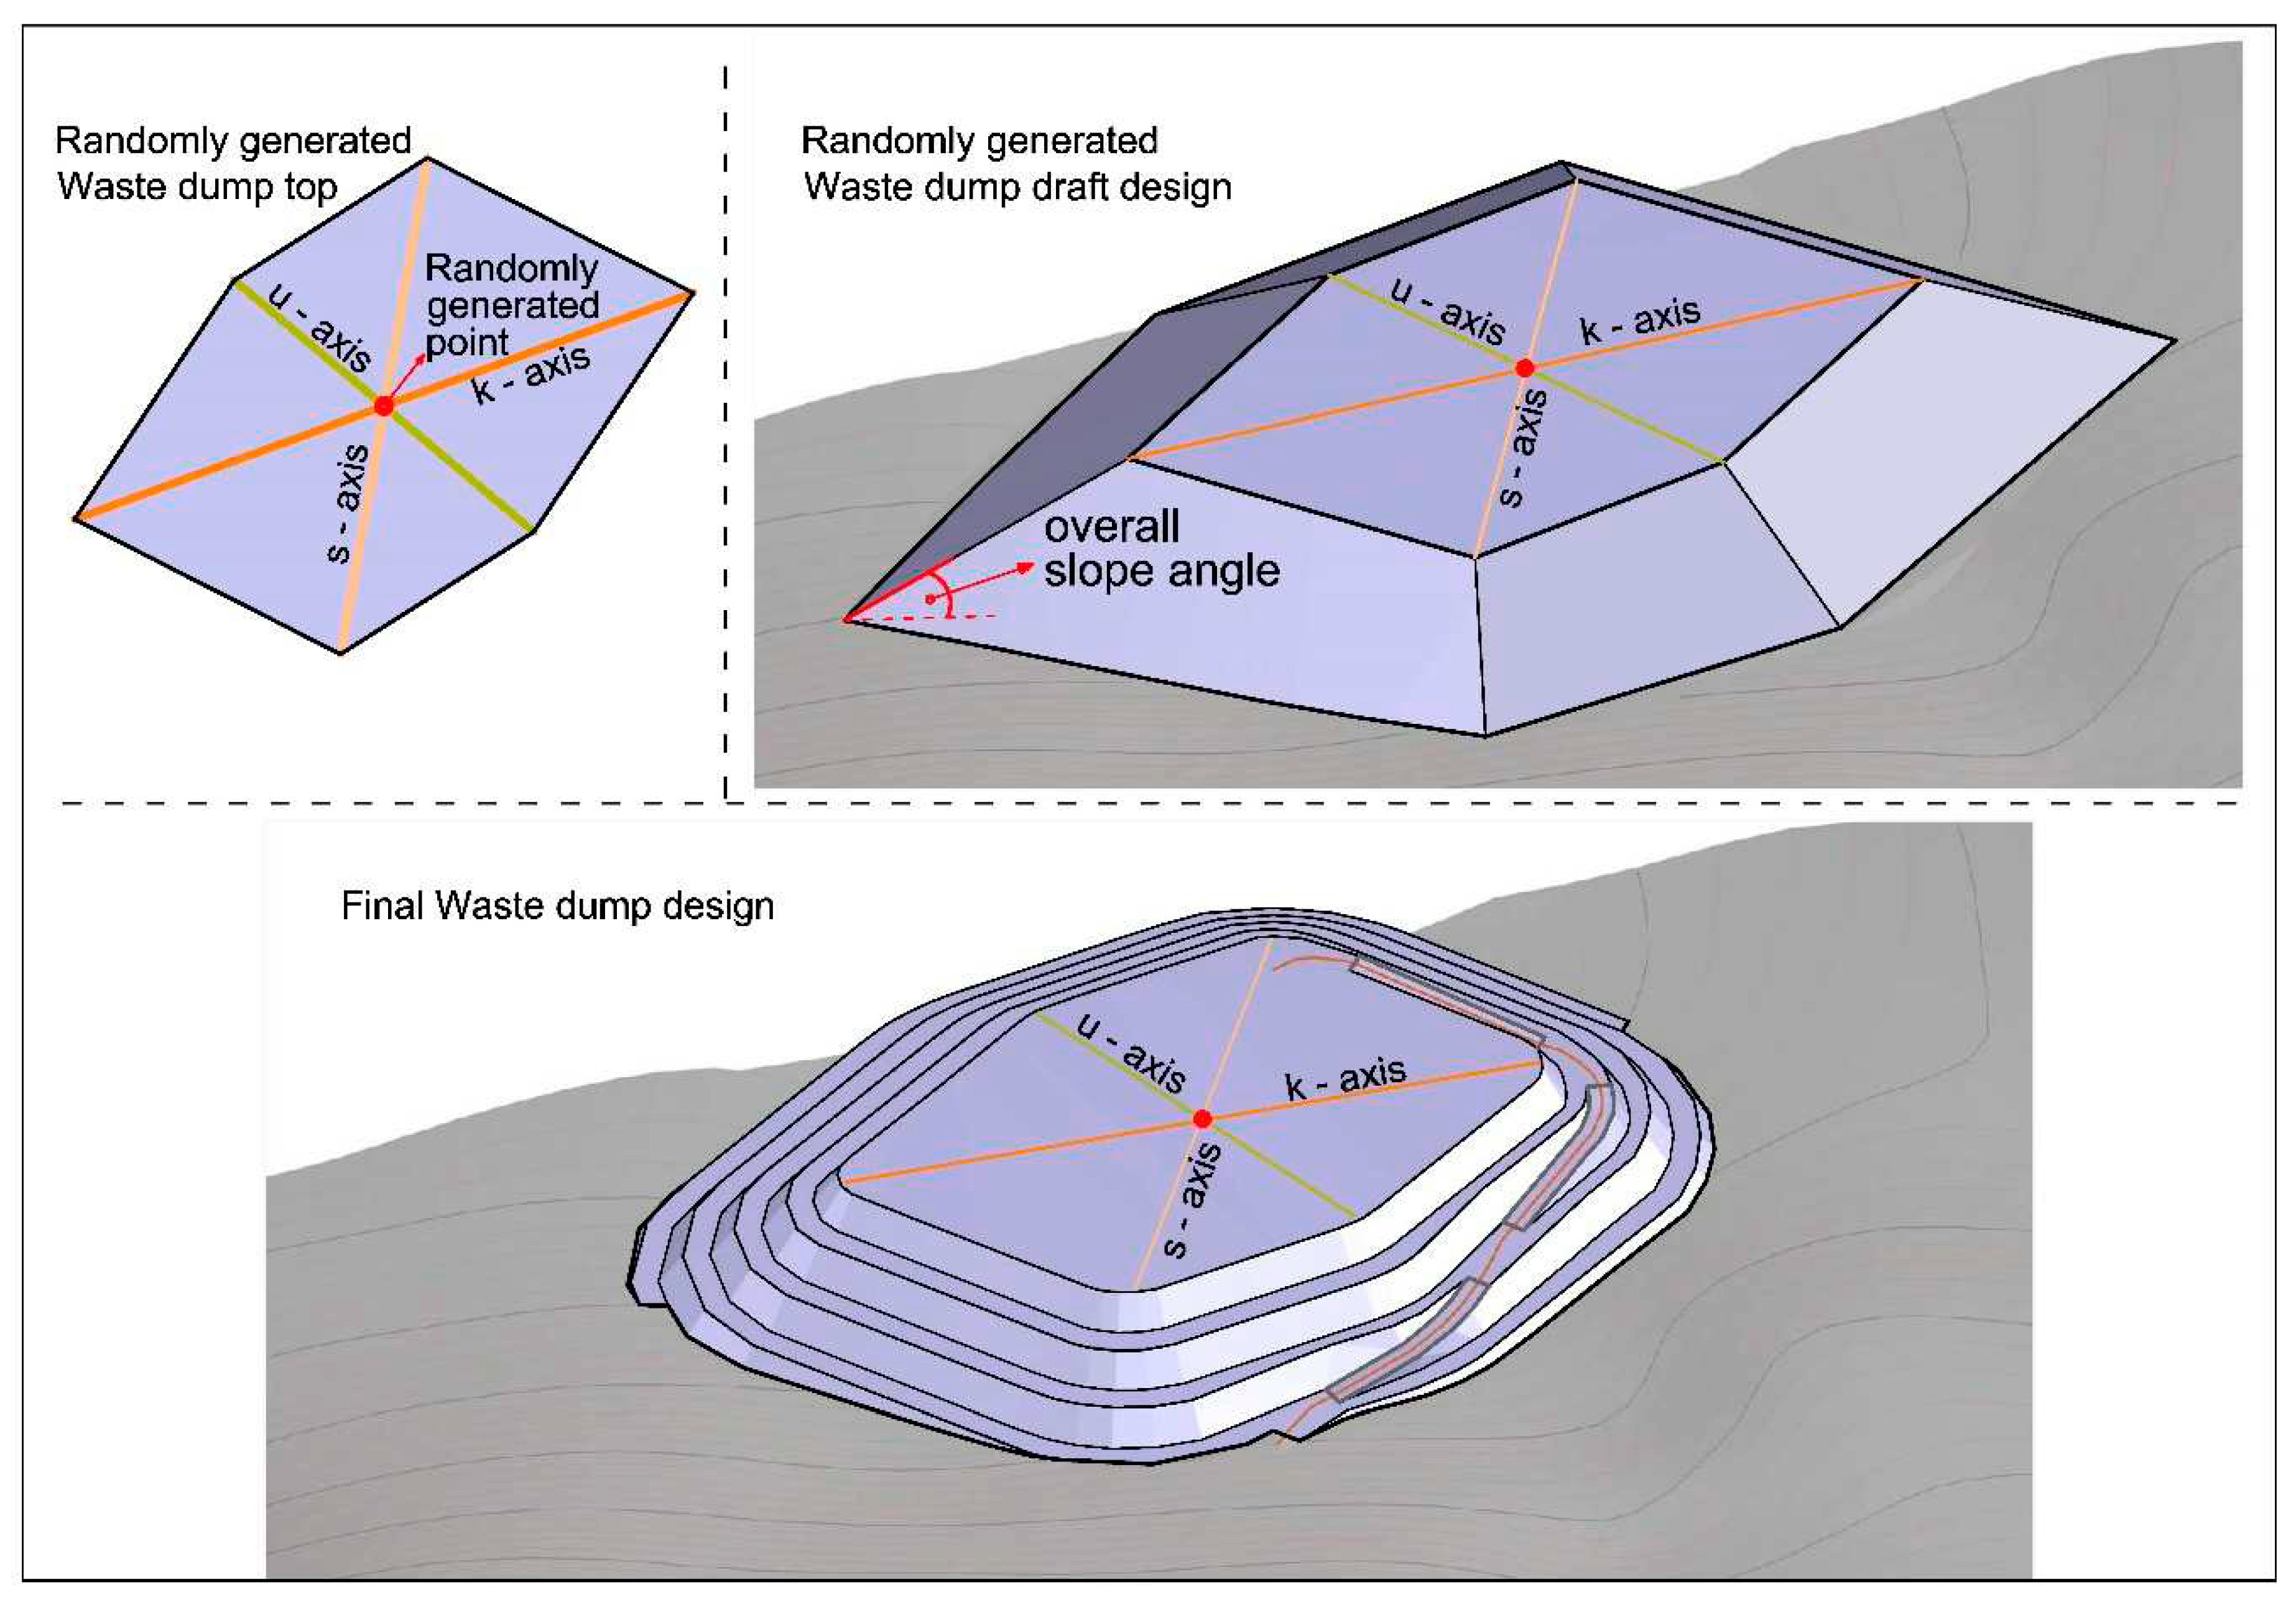
More specifically, the generation of the initial population in the proposed hybrid model starts with the generation of a point with randomly selected X, Y and Z coordinates (Figure 4). The selected coordinates (X and Y) must be within the terrain zone in which we consider waste dump creation, while the Z coordinate (elevation) is selected from the range of minimum and maximum elevations of the future waste dump. The elevation range is created empirically, and in practice the set of possible values is often constrained by existing administrative restrictions (e.g., the maximum elevation of an object in a certain zone may be limited by some administrative rule).
By generating several axes through a randomly selected point (at the same elevation as the point), the upper area of the waste dump is obtained. The process starts by drawing the first axis (k-axis, Figure 4) with a chosen length and direction, relative to north. Both the length and direction of the first axis can be specified by the user, and they can be randomly selected from the range of values created. It is recommended that the direction of the first k-axis coincides with the longest axis of the terrain zone. To obtain a feasible top of the waste dump, at least two other axes should be generated (axis - u and axis - s, Figure 4). The directions of the axes can (but do not have to) be equally divided (360°/two times the number of axes). The lengths of all other axes are partially controlled by the length of the first axis in the sense that the lengths between the axes cannot be too different in order not to generate technologically unfeasible (concave) shapes of the waste dump top. By connecting the ends of the generated axes, the waste dump top area is created. By expanding the top area boundary, according to the overall slope angle, to the intersection with the terrain, randomly generated waste dump design is obtained. This provides an initial population for further optimisation. It is important to note that not all randomly generated members of the initial population will be good candidates for further optimisation, in which case they will be discarded as unfit in the first step of the genetic algorithm.
Through the other steps, after the GA optimisation process and heuristic analysis of the generated solutions, the final waste dump design is created (Figure 4).
As emphasised in the introduction, the value of the land on which the waste dump is formed, also represents a significant part of the total cost, in addition to the cost of hauling. For this reason, the special attention in the model is given to the valuation of the land zones that are candidates for the creation of waste dump. It is important to note that the value of a piece of land does not only mean the value that could be obtained by simply buying the land, and that other factors should also be taken into account. These factors include various risks, such as the existence of administrative obstacles or problems related to the acquisition of ownership, the risk of mine expansion along a zone around the current final pit limit, the waste dump environmental impact, etc. In order to take into account all these different factors and to ultimately valorise them (through a single price per square metre of land), the AHP method is used in the model.
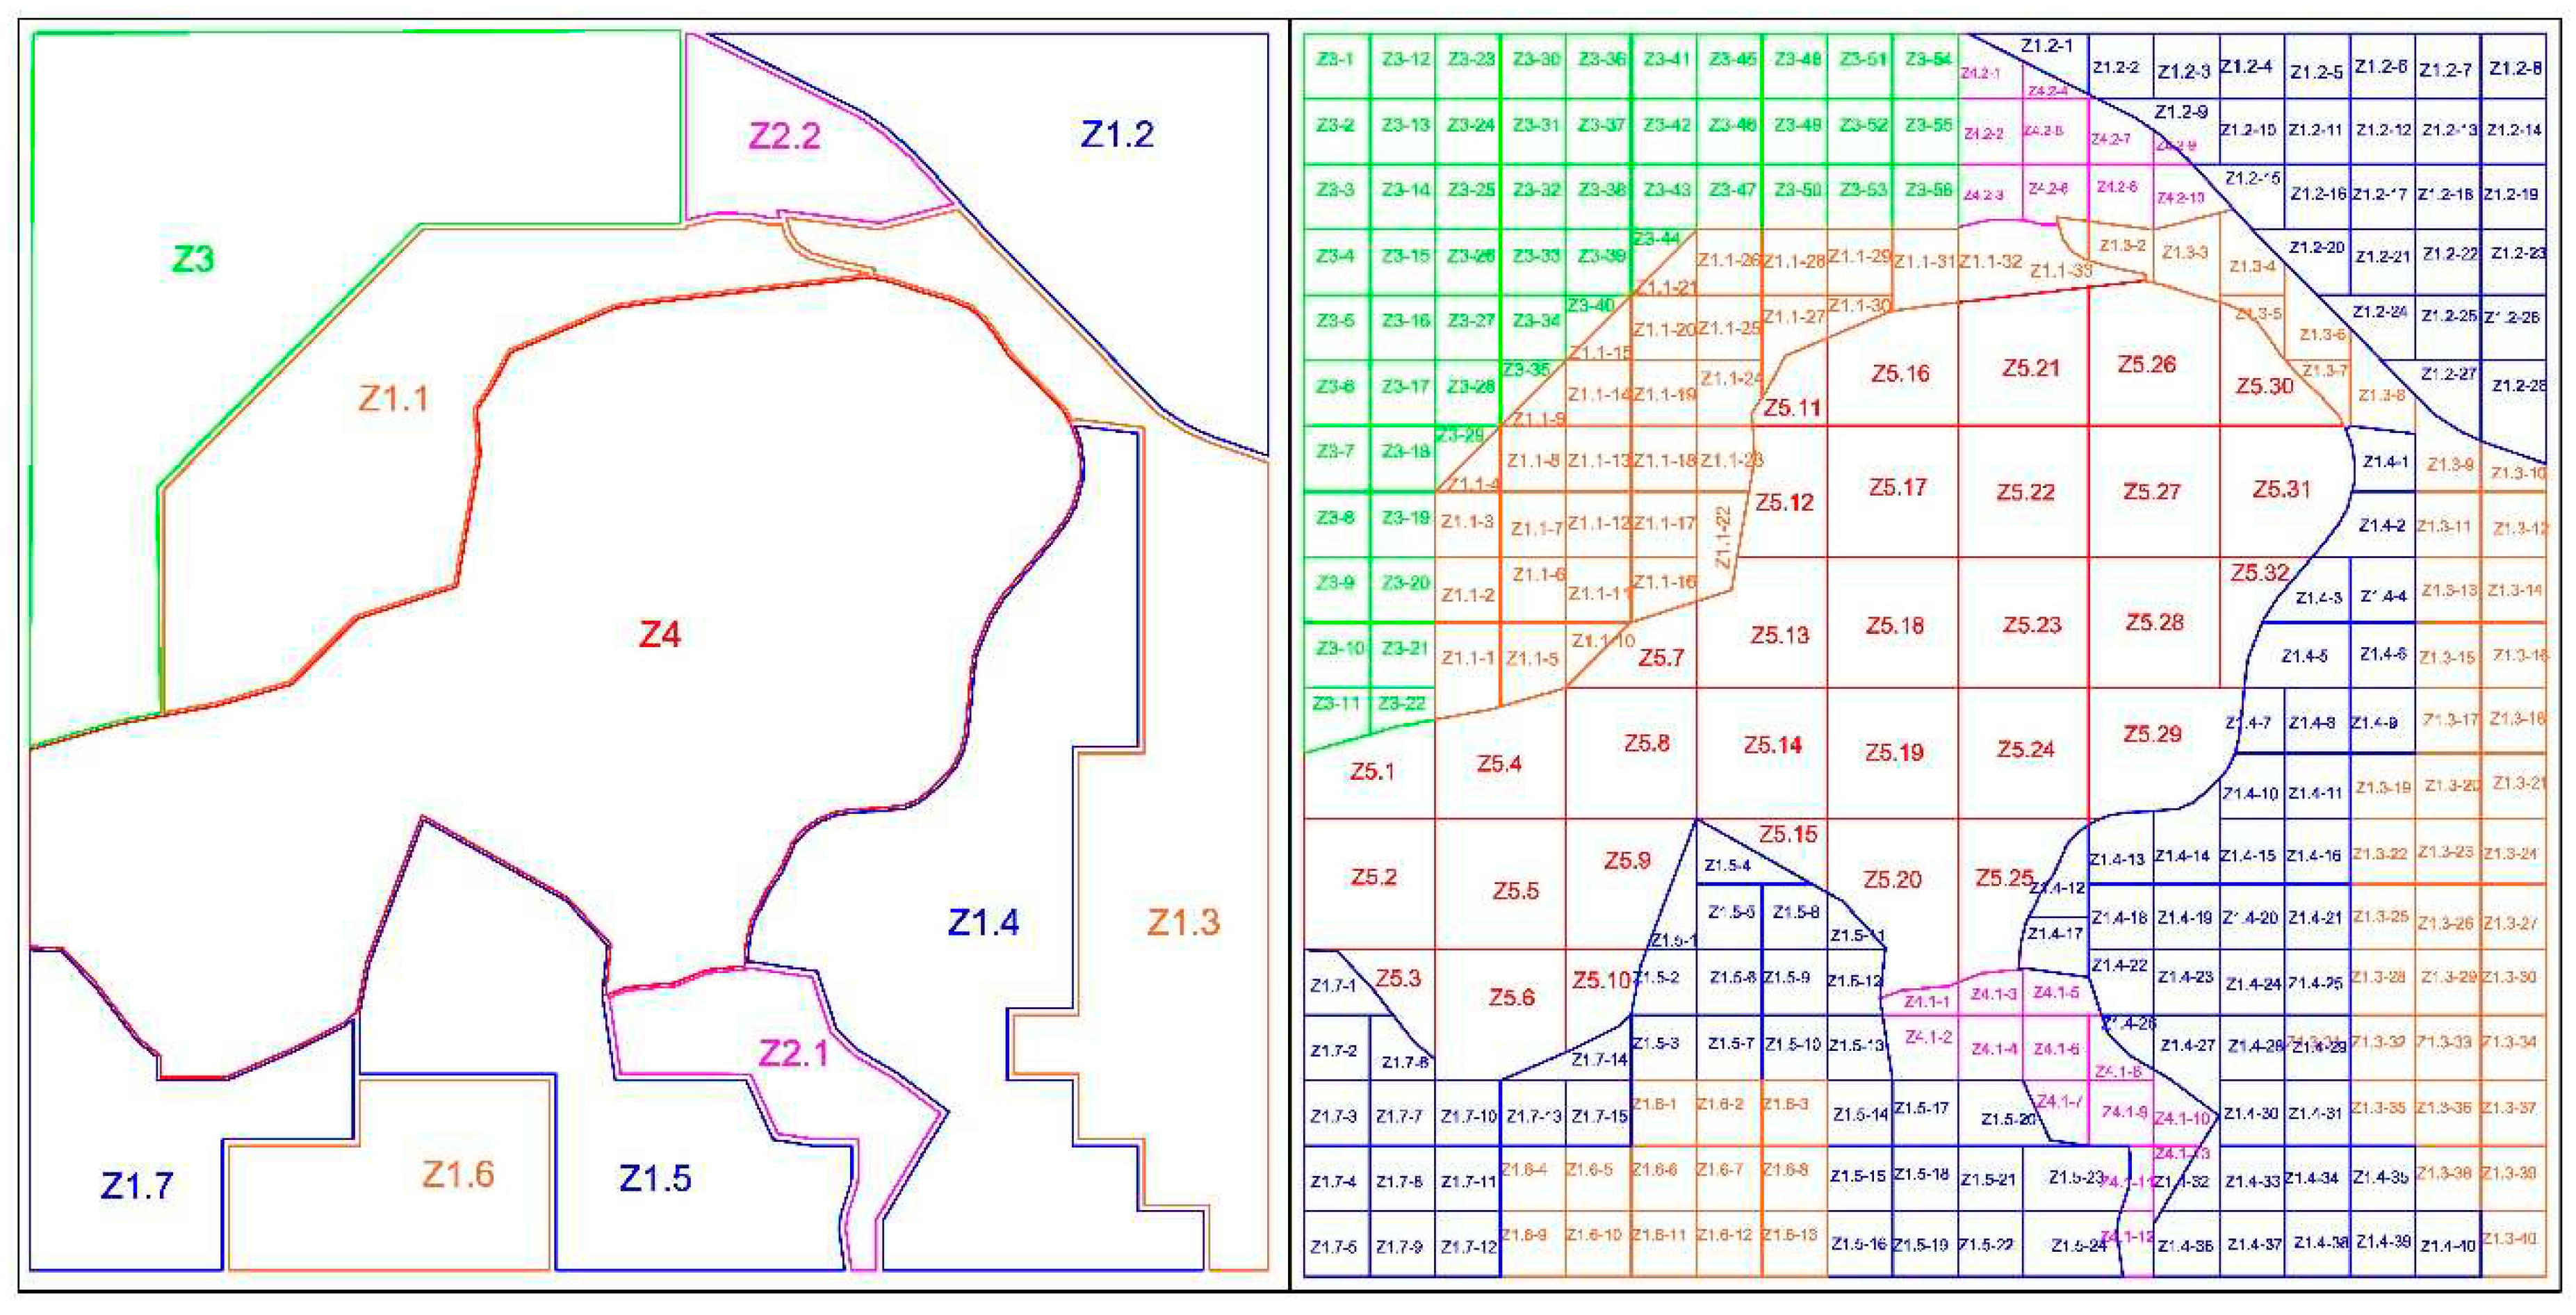
To accurately assess the value of land, the area of interest is divided into a number of zones according to the type of land (civil and industrial zone, agricultural zone, forest, etc.). Each zone is further subdivided into sub-zones, which in practice may represent private plots (Figure 5). Nominal value (€/m2) based on the corresponding zone (type of land) is assigned to each sub-zone. This value is increased by coefficients obtained by applying the AHP method. These coefficients represent all the additional factors (various risks, administrative obstacles, environmental impact) that are characteristic of each sub-zone. The additional factors are specific to each mining project and can be modified according to the needs and realistic conditions of each location. Finally, if there are civil, infrastructural or industrial facilities in a sub-zone, additional costs have been added to that sub-zone.
The value of an individual subzone (i) in the model is calculated based on the equation:
V s z i = V z i × A s z _ i × 1 k 1 + . . . . . + 1 k n + V a _ i ,
Where:
Vsz_i – Value of sub-zone i (€),
Vz_i - Value of sub-zone i, based on a type of land (€/m2),
Asz_i – Area of sub-zone (m2)
k1……kn - Coefficients obtained from the AHP method for all additional factors,
Va_i – Value added if civil, infrastructural, industrial facilities, etc. are located in subzone i (€).
The introduction of the AHP method into the algorithm of the presented model was carried out to more accurately determine the input parameters (value of the land for the potential waste dump) and thus create better conditions for further optimisation. It is understood that the use of the AHP method in the presented model is not mandatory and can be avoided if there is not enough data for analysis or a detailed assessment is not required.

2.2.2. Step_2 – Waste dump optimization - objective function, constraints and variables

Once the initial population has been generated and the zones of interest have been evaluated, the optimisation process is carried out. From a strictly theoretical point of view, the number of possible solutions for the location and design of the waste dump is practically infinite. Anyone can imagine a waste dump that is a few metres higher or lower, a few metres wider or narrower, or in a location that is shifted in a certain direction. Given the nature of the problem and the infinite number of possible solutions, the GA was chosen for optimisation.
The initial step in GA optimisation is defined by the objective function [46]. It is also necessary to define the elements to be optimised (variables), as well as their limits (constraint functions) [57]. Also, at the very beginning of the optimisation process, it is necessary to define the number of individuals in the initial population, as well as the number of generations.
The technological operation of waste handling generates unavoidable costs. By reducing these costs, the performance of a mining project can be significantly improved. Bearing this in mind, the objective function in the proposed model is to minimise the cost of waste dump formation. This means that the solution with the lowest cost is considered to be the best. It is important to note that by using the AHP method, additional factors that do not have monetary values (administrative and legal obstacles, possible environmental impact, etc.) can be included in the proposed model.
In the specific case, the cost of creating a waste dump can be influenced by various factors, but in general, two basic categories (present in the creation of any waste dump) are:
  • Costs related to the value of the land on which the waste dump is built; and
  • Haulage costs.
For this reason, special attention in model is given to these two categories.
The costs associated with the land value are defined in Equation 1. The haulage costs can be divided into two components, horizontal and vertical transport. This division into types of transport is essential for the functioning of the algorithm. The relationship between the cost values of the horizontal and vertical transport components optimises the design of the waste dump (is it better to have a waste dump with a larger area and a smaller height or vice versa?) The location of the waste dump is also largely determined by the cost of haulage (a waste dump closer to the mine and at a lower elevation will generate lower costs). Taking all this into account, the objective function can be written in the form:
M i n i m i z e   C m i n = C 1 + C 2 + C 3 ,
Where:
C1 - is the cost related to the value of the land along which the waste dump is formed and it is defined by equation 1,
C2 - represents the horizontal component of haulage costs,
C3 - represents the vertical component of the haulage costs.
The horizontal component of the haulage costs represents the costs that would be incurred to haul the waste material along the horizontal part of the route (sections without inclines) from the centre of mass of the waste material in the pit to the pit exit point and from the pit exit point to the centre of mass of the waste dump. This component is divided into two parts (to and from the pit exit point). If the waste exit point from the pit is already defined, the route should include the increase in length due to curves along the route. The horizontal component of the cost is defined by an equation:
C 2 = V L t C t ,
Where:
V – is volume of loose waste material to be placed on the waste dump (m3),
Lt – is horizontal distance between the center of mass of the waste material in the pit and the waste dump (km),
Ct – is cost of hauling 1 m3 of waste material over a horizontal distance of 1 km (€/m3/km).
The value of Ct can be obtained from existing open pit statistics or from mining equipment manufacturers' manuals.
The vertical component of the haulage cost represents the additional cost of lifting the material from the elevation of the waste material center of the mass in the pit to the elevation of the waste dump center of mass. It essentially represents haulage costs on sections of road with gradients and is defined by an equation:
C 3 = V H i C t k ,
Where:
V – is the volume of loose waste material to be deposited on the waste dump (m3),
ΔH – is elevation difference between the waste material centres of mass in the pit and the waste dump (m),
i – Average slope of the ramps (%),
H i - Total length of inclined sections (m),
Ct – Cost of hauling 1 m3 of waste along a horizontal distance of 1 km (€/m3/km),
k – Cost adjustment coefficient between horizontal and vertical components.
Hauling material along inclined sections of road has a negative effect on energy consumption, truck speed and increases the overall stress on the machinery (more about this can be found in [58] and numerous manuals from various mining equipment manufacturers). For this reason, the cost of hauling on inclined sections of road is significantly higher than the cost of hauling on horizontal sections of road. This difference is represented by the cost adjustment coefficient (k) between the horizontal and vertical components. A similar method for converting vertical to horizontal distance is presented by Li et al. [59]. In general, the coefficient k will vary in different locations (different open pits) and will depend on many factors (quality of road construction, type of truck, organisational conditions at the pit, slope of ramps, etc.).
Considering the above, the objective function can be defined by the following equation:
M i n i m i z e   C m i n =   V z i × A s z _ i × 1 k 1 + .   .   . . + 1 k n + V a _ i + V L t C t + V H i C t k ,
It is understood that each mining project has its own unique mining conditions, i.e. different sets of factors can affect the cost structure of waste dump formation to a greater or lesser extent. Bearing this in mind, it is clearer that equations 2 and 5 provide only the general structure of the most common costs of waste dump formation, and that for a specific mining project this equation can be expanded with additional cost categories. It should also be noted that these equations provide only initial costs of waste dump formation. Final costs may vary significantly and will be known more precisely after the engineering and construction phase of the project.
Introducing constraints into the optimisation algorithm reduces the number of possible solutions. In this way, model functioning is significantly accelerated. Constraints should be defined in such a way that technically infeasible solutions are rejected (infeasible variants of the generated waste dumps). At the same time, constraints should be carefully defined in order not to reject solutions with potential.
The following constraints are incorporated into the model:
  • waste dump capacity (volume),
  • waste dump elevation,
  • waste dump position in XY plane.
The capacity of the waste dump is determined by the volume of waste to be excavated from the pit, increased by the swell factor. The exact value of the required capacity cannot be formulated as a constraint, as this would significantly reduce the number of possible solutions. For this reason, the capacity constraint should be set as a range of values around the exact required volume. A wider volume range, from the minimum volume (Vmin) to the maximum volume (Vmax), will increase the set of potential solutions, but also the optimisation time. The experience gained during the development and testing of the model suggests that all solutions up to 5% smaller and 10% larger than the required volume should be considered for further optimisation (next generation in GA). The constraint related to the waste dump capacity is formulated by the equation:
V m i n V V m a x ,
The elevation of the top of the waste dump should not exceed a reasonable value (Zmax). The maximum elevation of the waste dump is usually limited by some administrative norm. The minimum elevation of the potential waste dump top must be higher than or equal to the lowest elevation of the terrain (Ztmin). The constraint range related to the waste dump elevation is formulated by the equation:
Z t m i n Z Z m a x ,
Generated waste dumps (potential solutions) must be located within the boundaries of an area which is suitable for waste dumping. This constraint is formulated as:
W D i . n S u i t a b l e   a r e a ,
Where WDi is the potential waste dump solution i (where i is from 1 to n-number of potential solutions).
All geometric parameters defining the waste dump design can be considered as variables (genes) in GA optimisation. The choice of parameters, which value will be varied to obtain new solutions (chromosomes) in the GA process, depends on the conditions under which the optimisation is carried out and is subject to engineering decisions.
Changing the shape of the top or base area, as well as the overall slope angle and the top elevation of the waste dump, will affect the design of the waste dump. Since the waste dump base area in the proposed model is determined (controlled) by the initial random generation of the waste dump top area, and as the overall slope angle is based on the waste material property (the largest angle that guarantees stability is used), the waste dump top elevation and shape are treated as variables.

2.2.3. Step 3 – Heuristic analysis of optimization results and final waste dump design

During the algorithm execution many optimised solutions (waste dump designs) are generated. Infeasible solutions, i.e. those that do not meet the given constraints, are rejected during the optimisation process. The performance of feasible solutions is different, i.e. they have a higher or lower value of the objective function (cost minimisation). The solution with the lowest cost of waste dump formation (€/m3 of waste material) is used for further processing (detailed engineering). Optimisation results are exported from the model in analytical and graphical form. Analytical form (csv file format) provides basic input parameters and results. Graphical form (dxf file format) is suitable for import into some 3D mining software, where contour lines of the best solution can be generated. Based on the generated contour lines (whose equidistance corresponds to the elevation of the dump benches), the final design is produced. This last step (from contour line to final design) is done manually by an experienced engineer.
The functionality of the developed model can be used in two modes.
In the first mode, the volume constraint is set in a narrow range around the required volume. All generated waste dump designs will have the required capacity (volume of waste material from the pit increased by the swell factor).
In the second mode, the volume constraint is set in a wide range. The maximal value of the volume range (Vmax - from equation 6.) is set to the required volume and the minimal value of the volume range (Vmin - from equation 6.) is set to a value several times smaller. This mode examines the case in which it is potentially more cost-effective to create two (or more) waste dumps, whose sum of volumes corresponds to the required volume. This case is particularly interesting when there are several physically separated zones (where the formation of waste dumps is possible) around the pit.

3. Case study

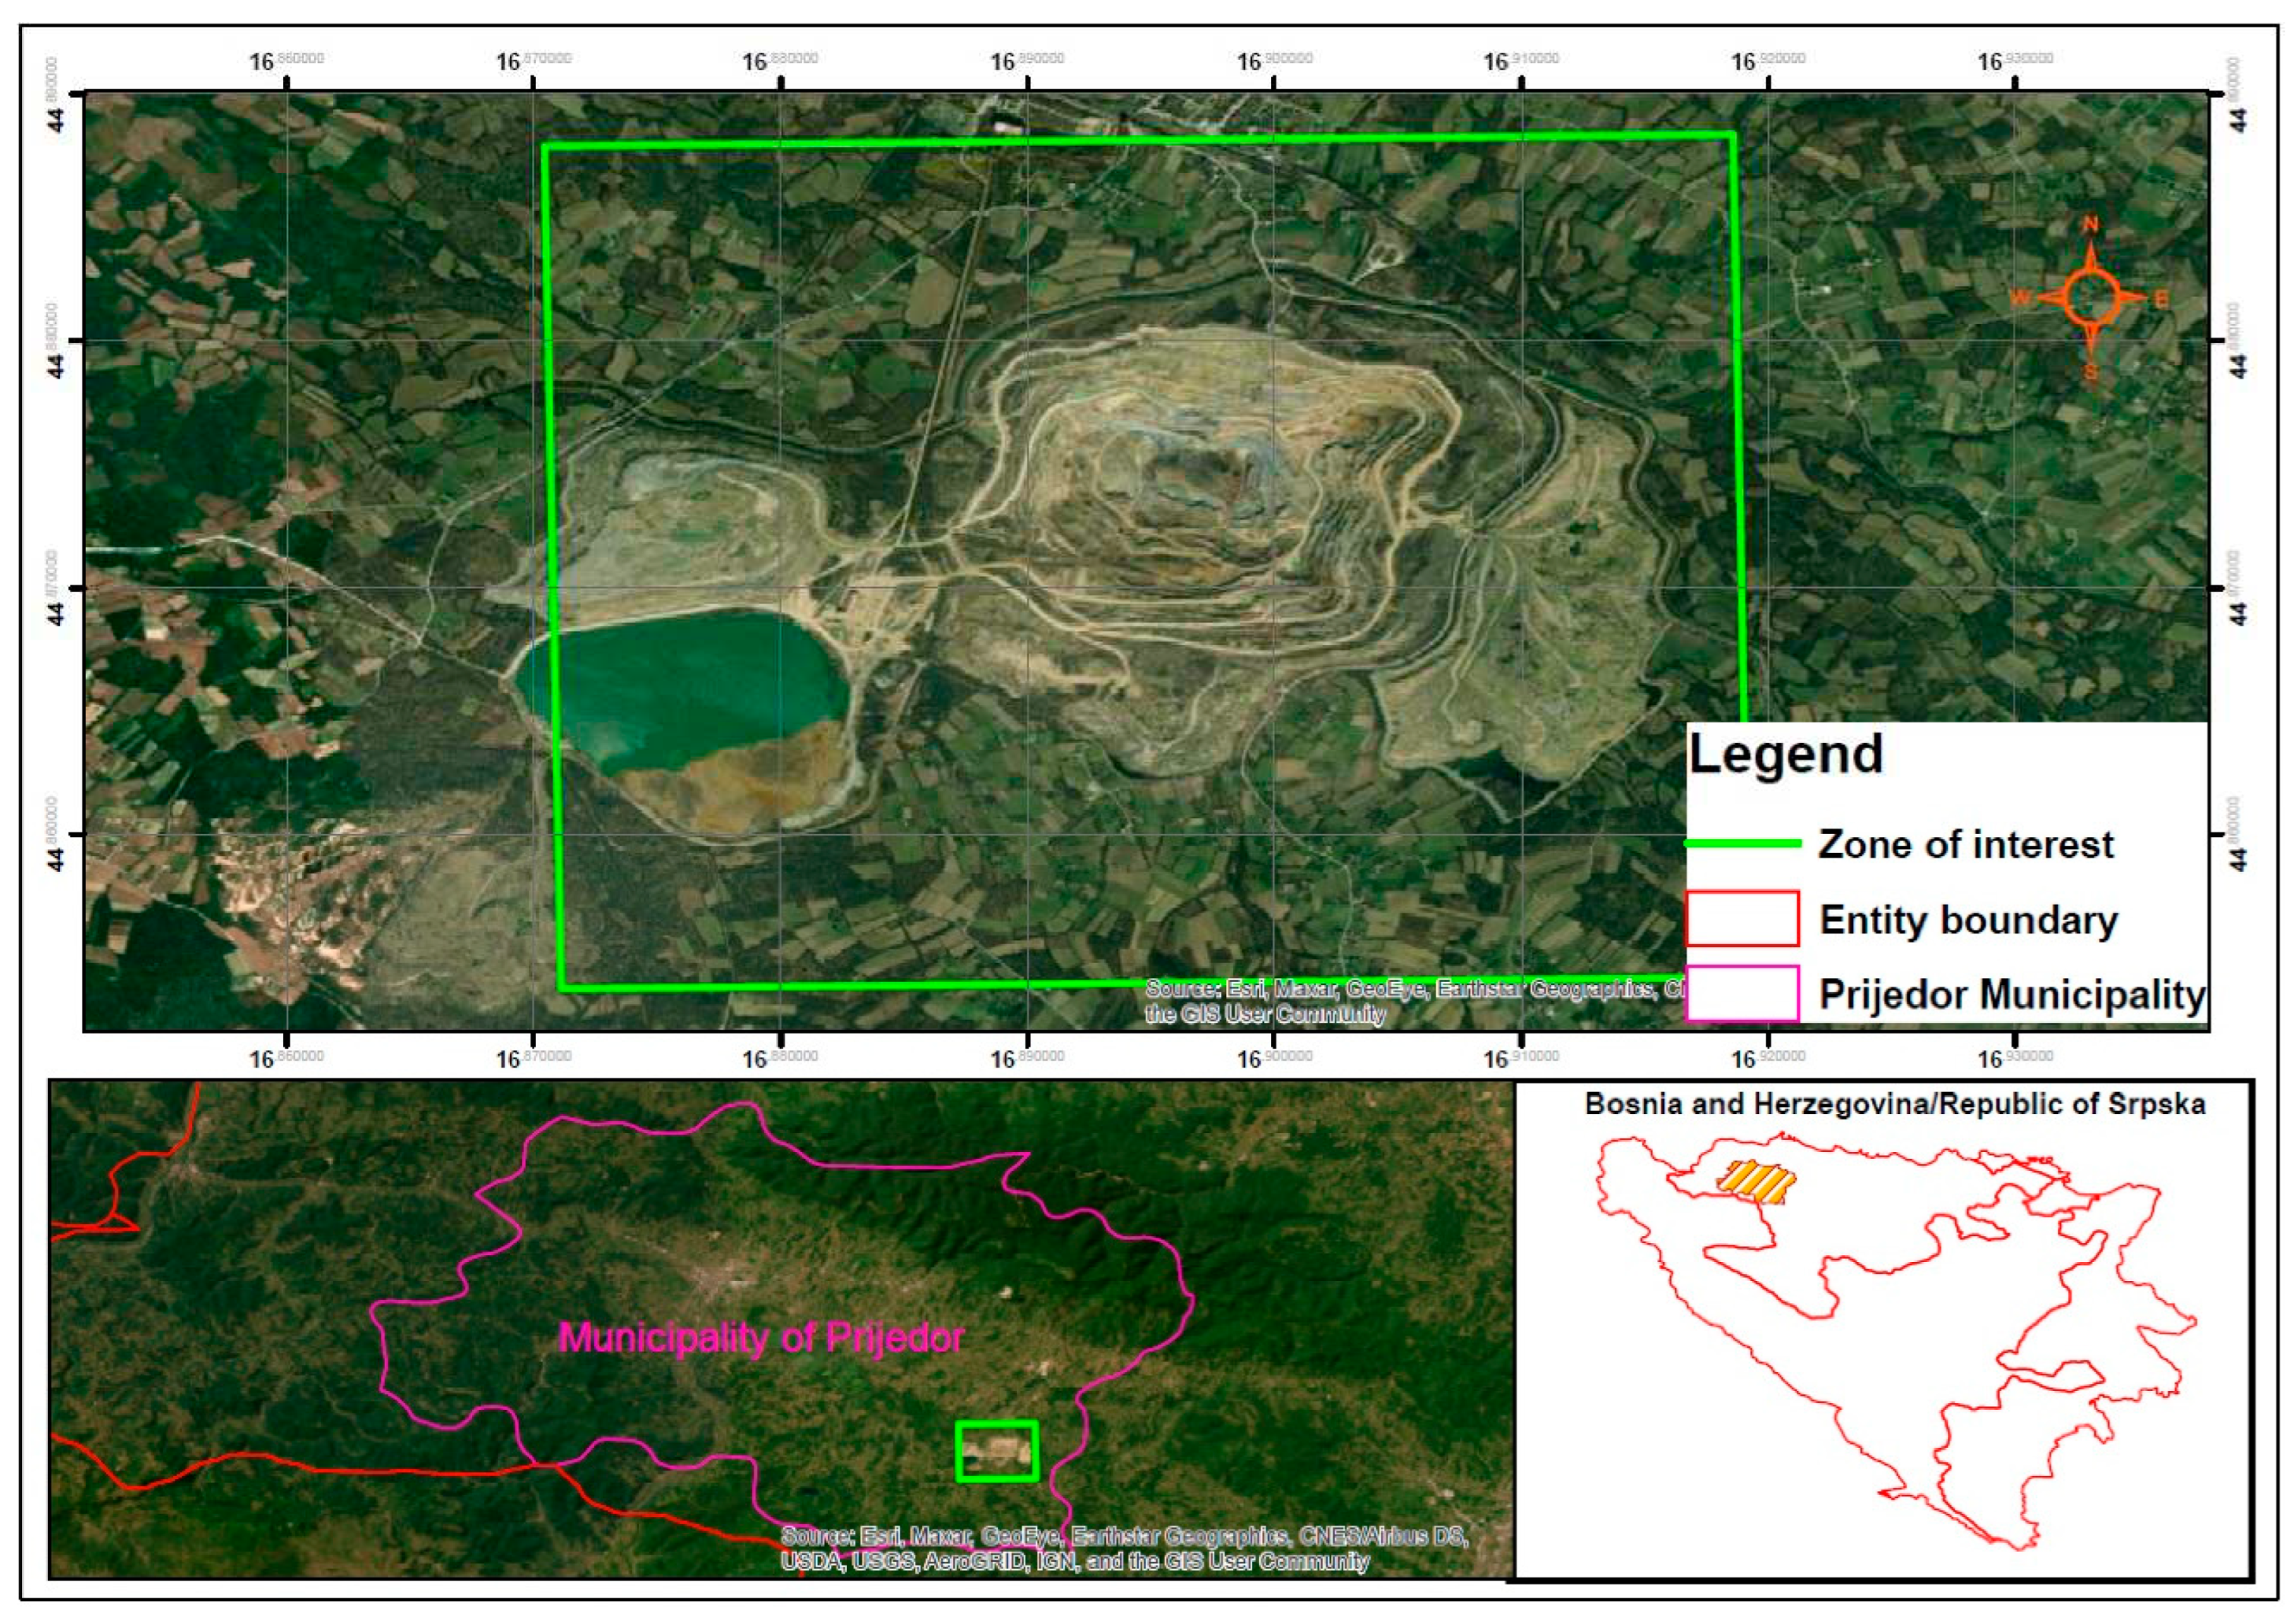
In order to illustrate how the model works, a case study has been conducted for the Buvac open pit mine. The Buvac is located in the Prijedor Municipality, in the north-western part of Bosnia and Herzegovina, entity of the Republic of Srpska (Figure 6).
Mining operations at the Buvac open pit started in 2008 and the capacity is set at 1.5 million tons of iron ore. In the past, waste material was dumped in the area of the former open pit "Jezero" (southwest of Buvac) and in the waste dump located south of the Buvac open pit. Since these two sites have reached full capacity, it is necessary to find additional space and define a new waste dump for future operations. By the end of the mine life, an additional 16.5 million m3 of waste will be excavated. Taking into account the swelling factor, it is necessary to design a waste dump with a capacity of 20 million m3.

3.1. Buvac waste dump optimization

The presented model was developed using the educational version of Matlab software [60], with integrated modules for Monte Carlo and Genetic algorithms. The AHP method conducted for the valorisation of the terrain around the Buvac open pit was developed in Microsoft Excel [61], while Surpac software [62] was used for heuristic data analysis and detailed engineering. The whole process was carried out on a computer with relatively modest characteristics (12 Gb of ram memory, 7th generation I7 processor, integrated graphics card).
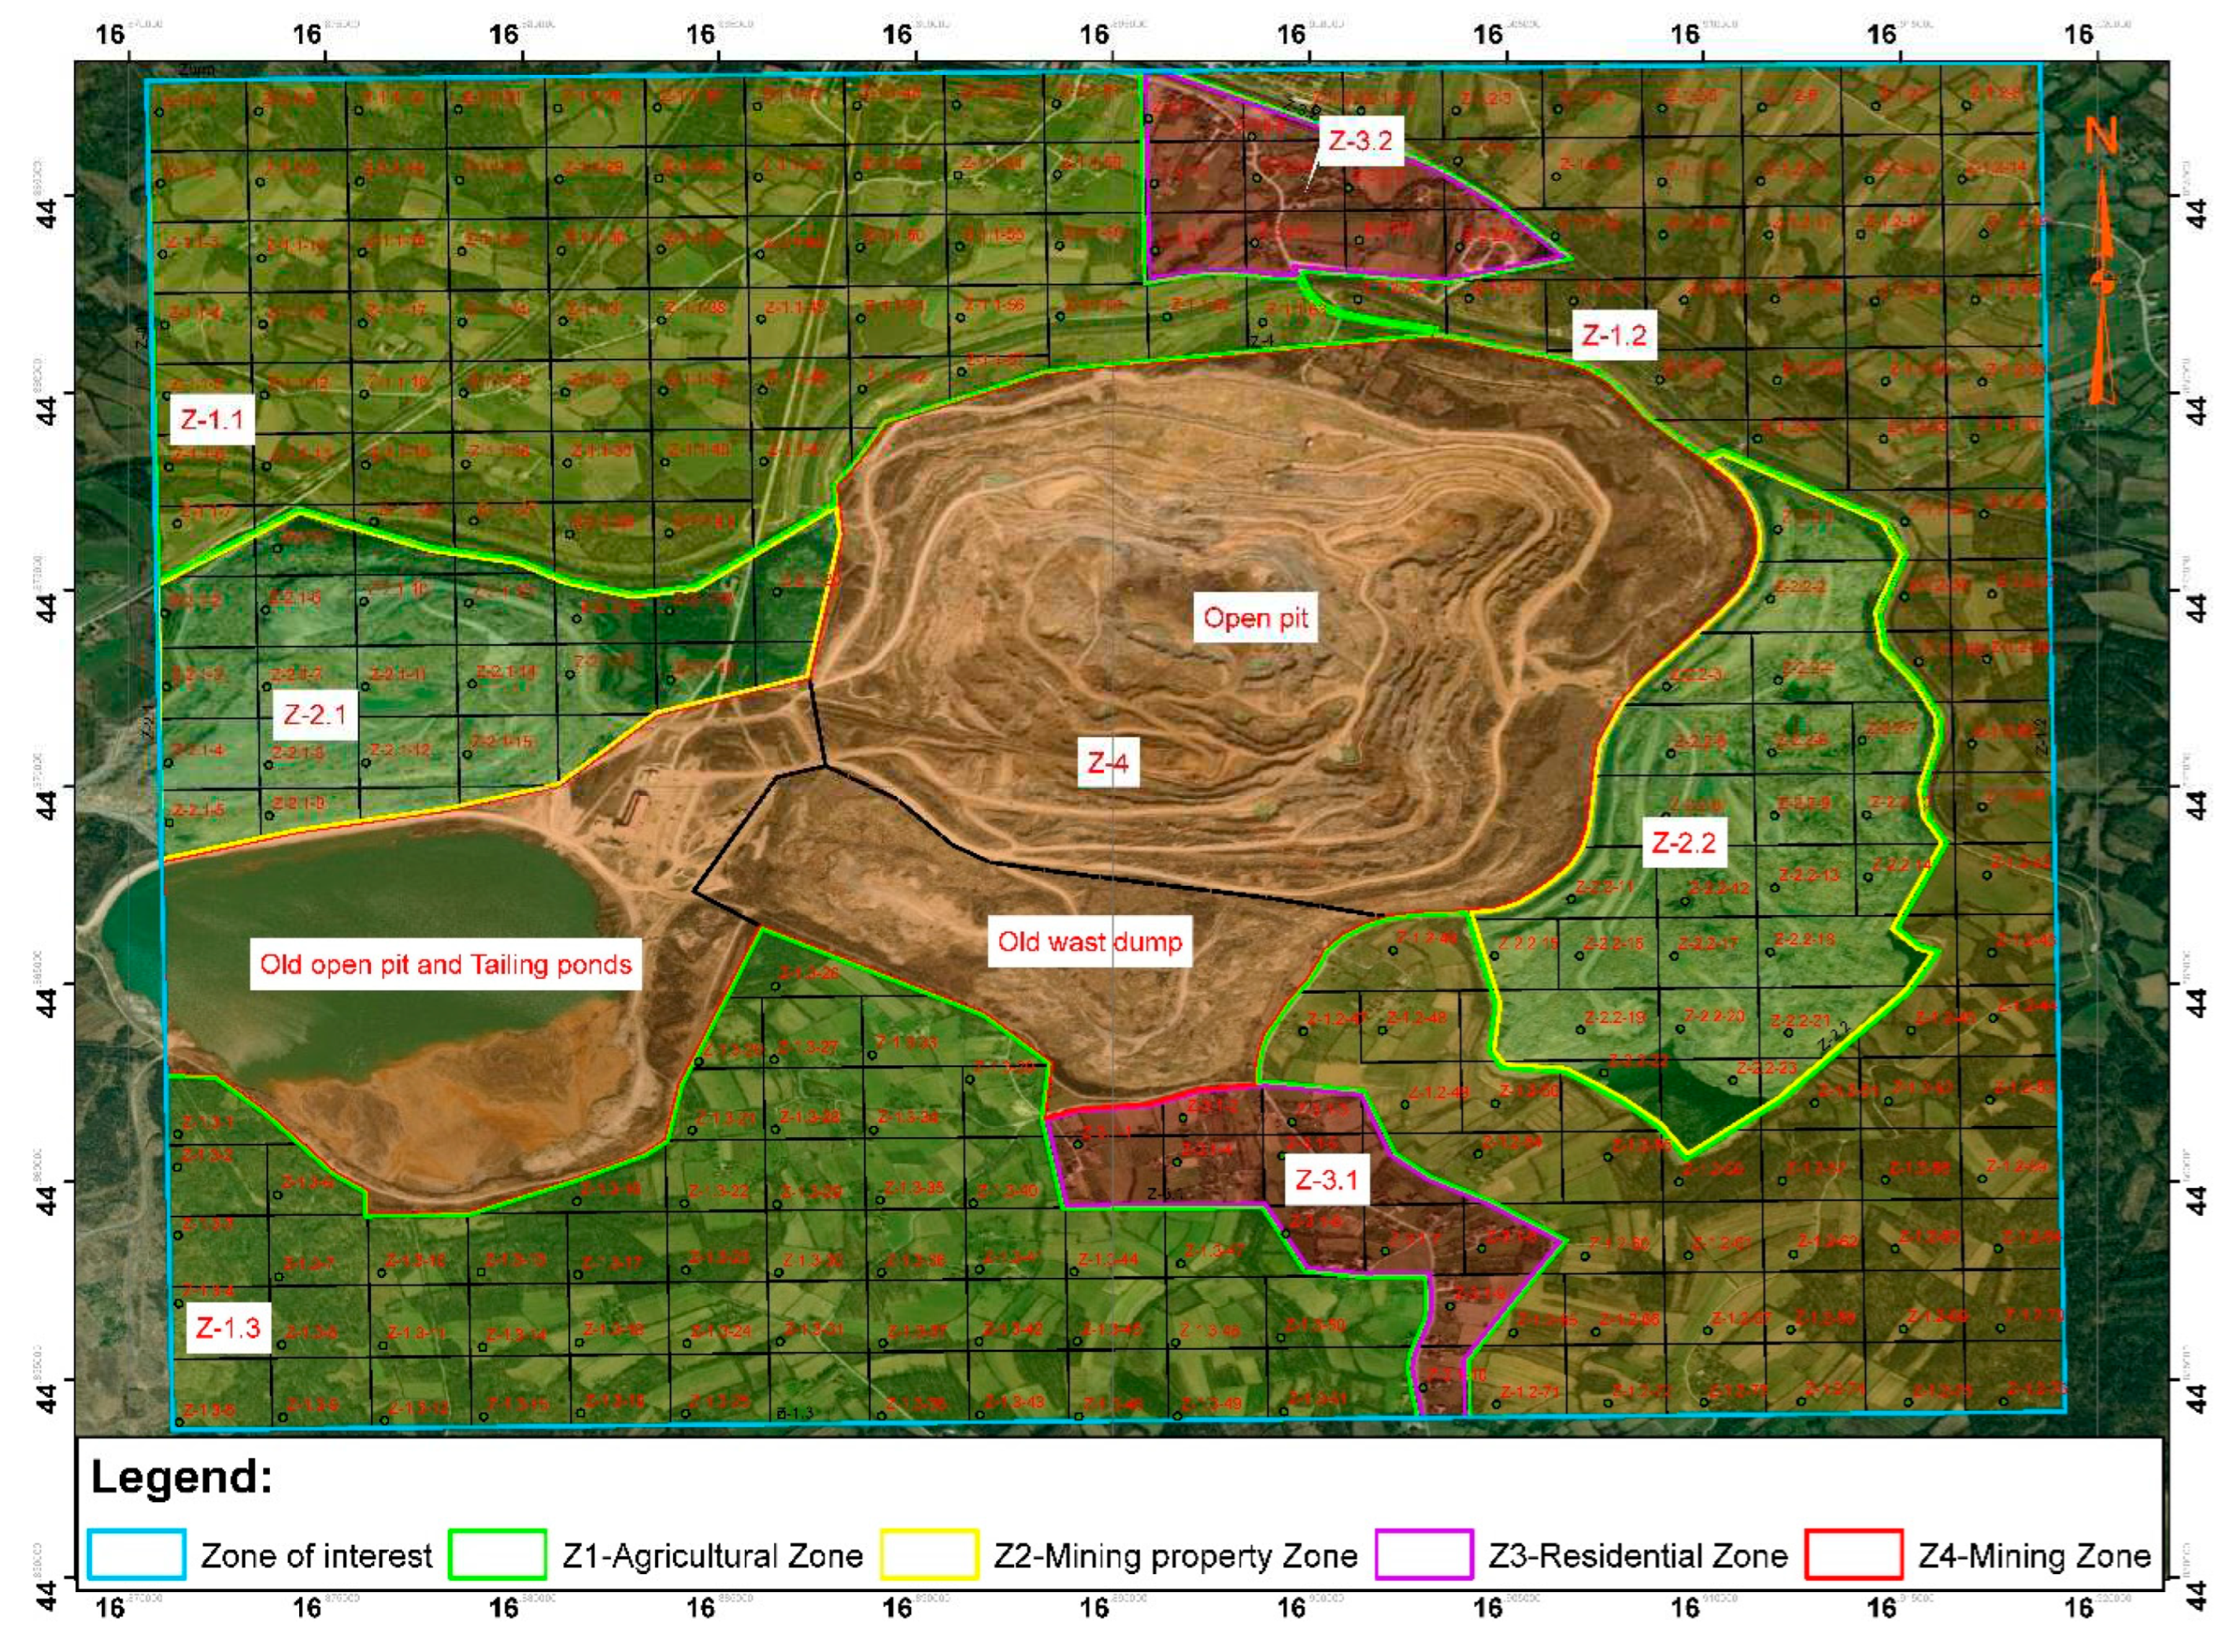
In order to accurately assess the value of the land surrounding the pit, the area of interest is divided into 4 zones according to the type of land (Z1-Agricultural Area, Z2-Mine Property Area, Z3-Residential Area, Z4-Mining Area). Each zone (except Z4-Mining Area) is further divided into sub-zones (private plots of land, Figure 7). The value of each sub-zone is determined based on the corresponding zone (type of land) and coefficients obtained by applying the AHP method (factors and other details of the AHP method are shown in Table 1). The final design of the open pit mine did not include the entire deposit, but only those parts where mining was economically justified. This means that there is potential for future expansion of the pit boundaries along certain sub-zones. For this reason, the potential expansion of the open pit limits is included in the list of AHP analysis factors. The possibility of obtaining all administrative permits and property rights is not the same for all sub-zones, so this factor is also included in the AHP analysis. The creation of waste dumps along the various sub-zones will have a greater or lesser impact on the environment (inevitable noise and dust emissions, impact on waterways, etc.). Therefore, using the AHP method, the environmental impact of each sub-zone was assessed individually, depending on the location of the sub-zone in relation to existing settlements. Finally, the value of each sub-zone (obtained from the type of land and the AHP analyses) is additionally increased if there are civil, infrastructural or industrial facilities in some sub-zones (according to equation 1).
The mining area (Z4) represents the zone where open pit and existing mining facilities are located, and as such is not suitable for the waste dump formation. For this reason, the value of this zone has been artificially inflated to avoid the generation of results along this zone.
In order to implement the GA optimisation process, it was necessary to define the constraints. As mentioned above, the required capacity of the waste dump is 20 million m3. By surveying the area around the open pit ("overall zone of interest") it was found that the areas to the north and south of the pit contain settlements (the value of the land here is significant, so we should not expect solutions in these areas). There are also existing mining facilities (old waste dumps and tailing pound) along the south side of the pit. Since this is recognised as Zone 4 - Mining Area (where it is not possible to form a waste dump), the southern side is practically disqualified from consideration, i.e. the algorithm will not be able to generate solutions here.
Based on statistical data from the open pit, the cost of hauling 1 m3 over 1 km is estimated to be €0.8 for the horizontal component and €1.2 for the vertical component of the haul.
After further consideration, it was determined that it is possible to form one or more waste dumps along the eastern and western sides of the mine. Since there are two physically separated areas (east and west sides of the pit) where the formation of waste dumps is possible, the second mode of operation of the optimisation is used. This means that the volume constraint (equation 6) is given in a wide range, specifically the minimal volume Vmin is set to 6 million cubic metres and the maximal volume Vmax is set to 22 million cubic metres (note that a slightly larger value than the required volume is deliberately given):
6   m i l . m 3 V 22   m i l . m 3 ,
The constraint range, related to the waste dump elevation, is set between 150 m for Ztmin (the lowest terrain elevation in the zone of interest) and 240 m for Zmax (the highest waste dump elevation):
150   m Z 240   m
The elevation and shape of the waste dump top area were used as variables in the optimisation process.
During the testing of the model's functionality, it was found that in order to reduce the processing time, it is more practical to perform more optimisations with a smaller initial population than vice versa. For this reason, 15 optimisations were performed with the aim of generating a sufficient set of solutions. Note that in each optimisation all parameters and constraints were the same. The basic GA optimization parameters are given in Table 2.
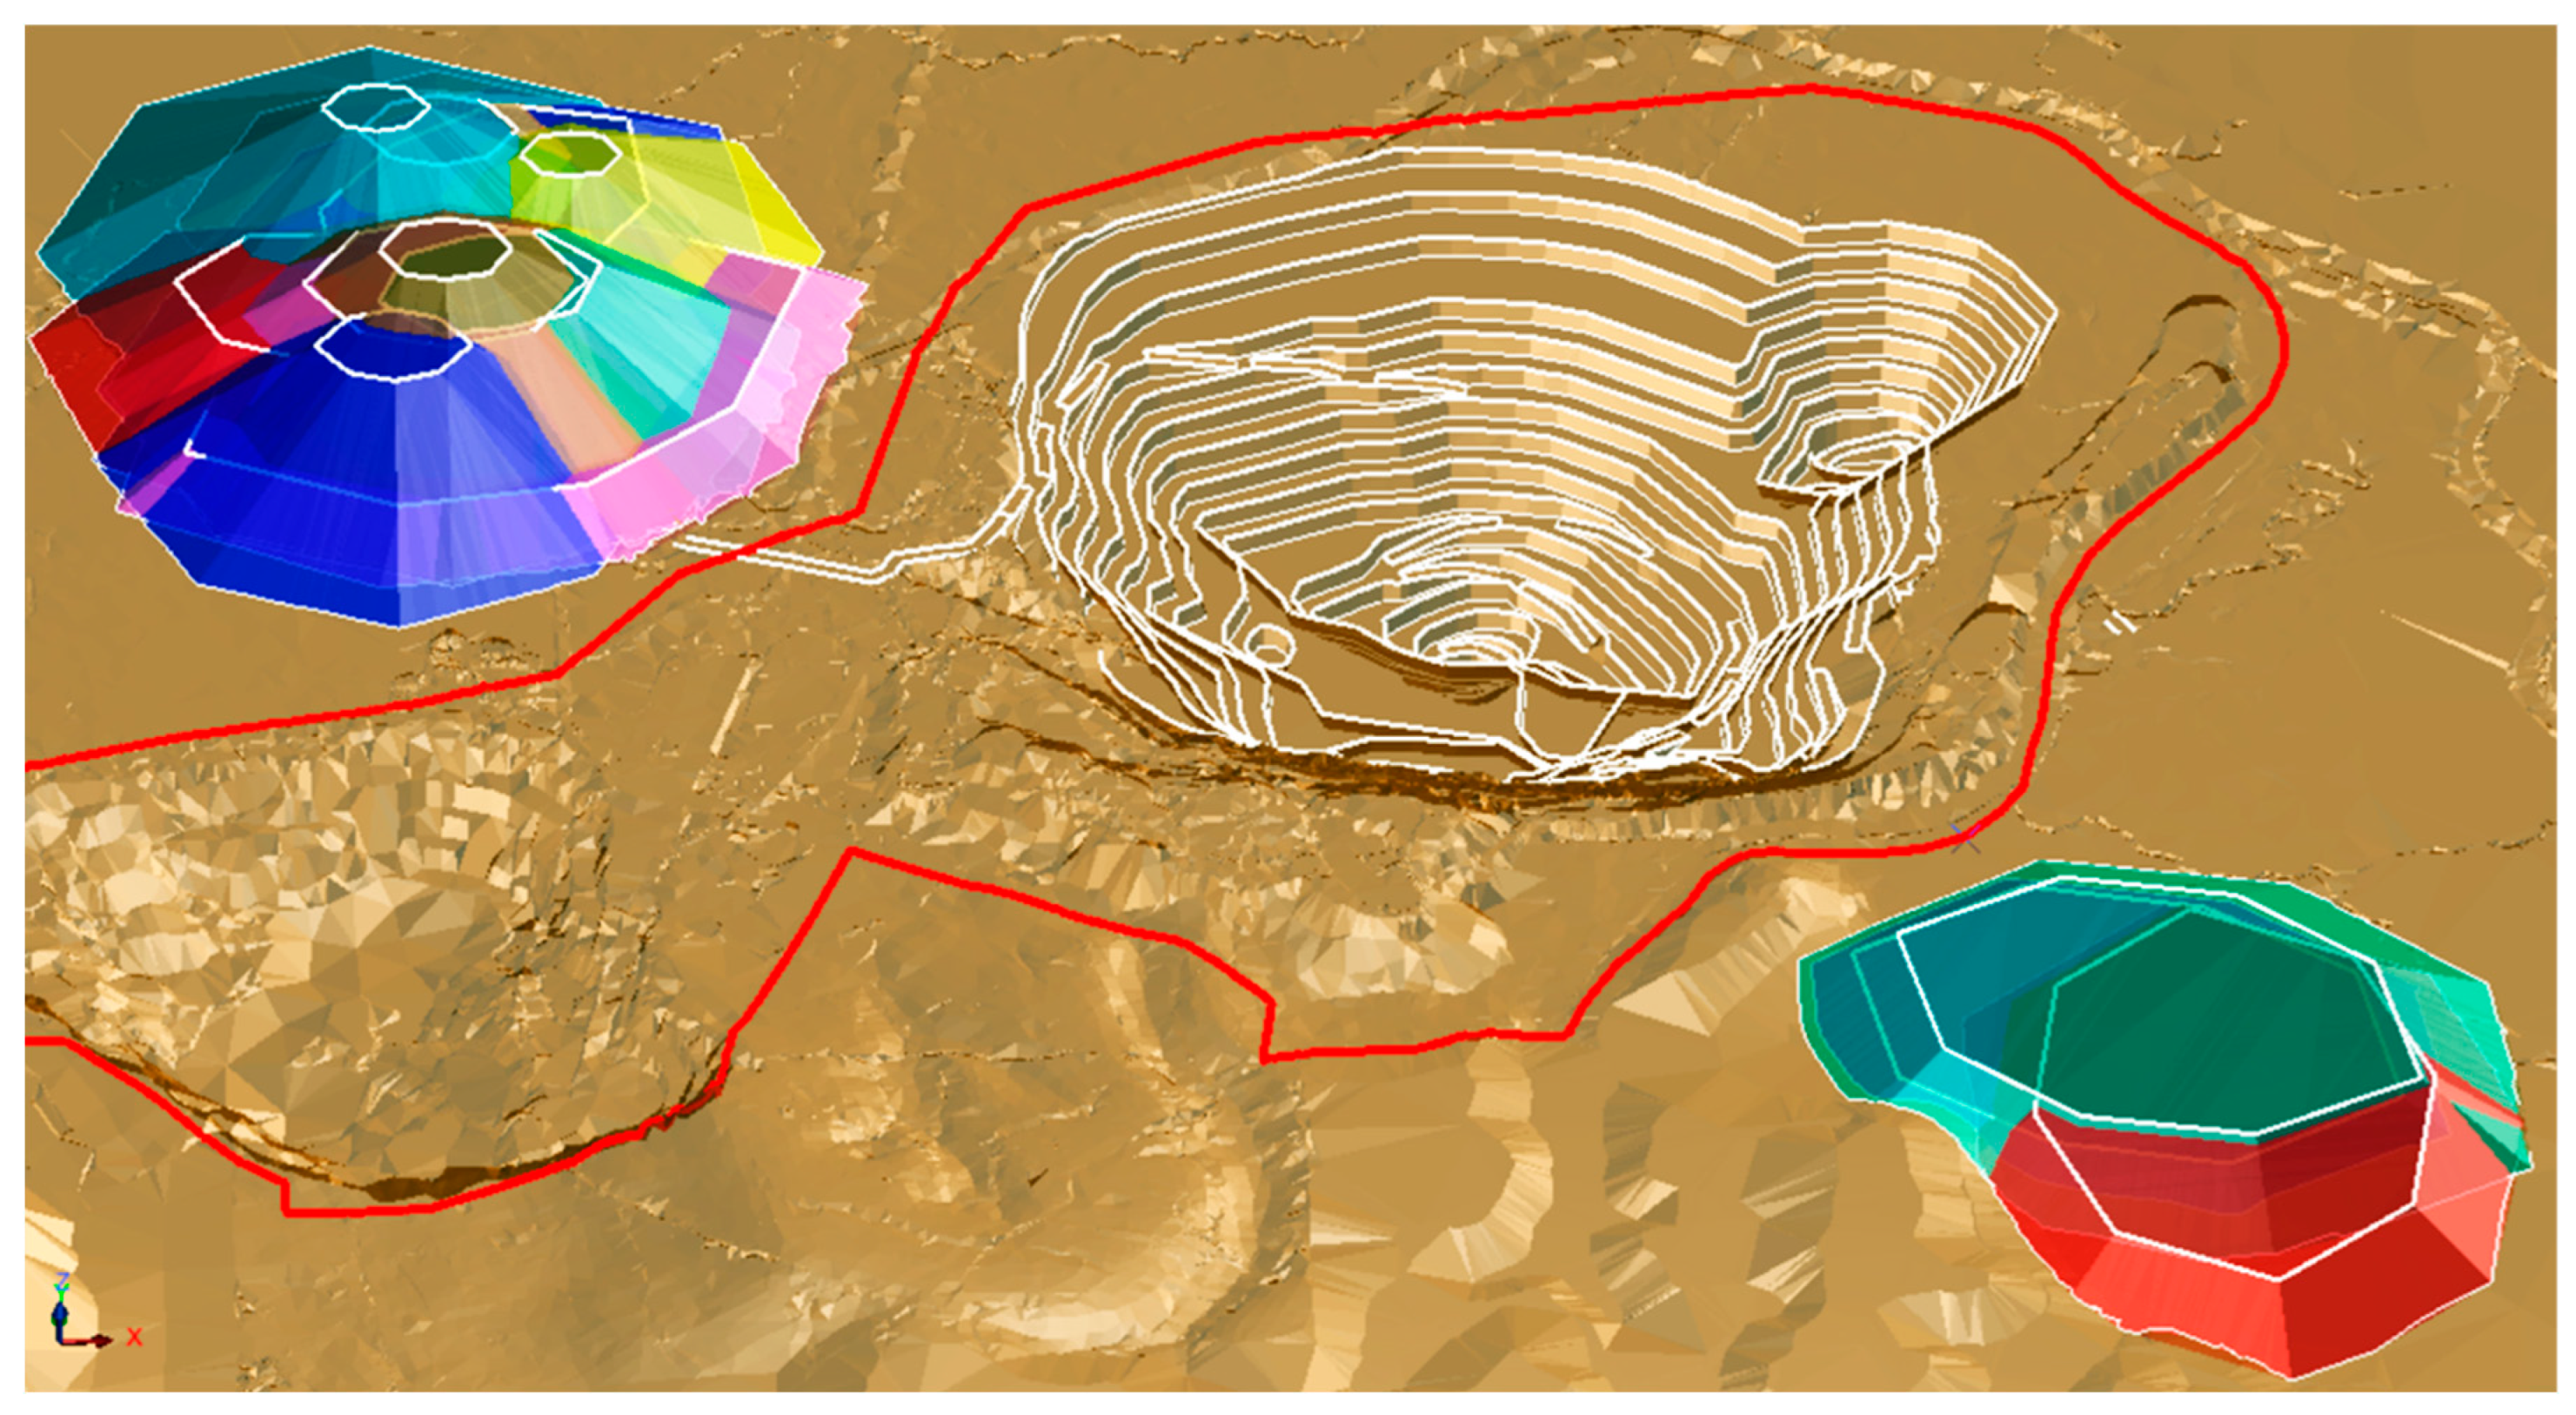
In further analysis, the 15 best solutions were considered and the results analysis are shown in Table 3. The solutions are listed in the table from best (the smallest objective function) to worst. The graphical results for the 15 considered solutions are presented in Figure 8.

4. Analysis of results and discussion

As it can be seen from Table 3. the best ranked solution with the required capacity (20. mil. m3) is solution number 6. This solution has an objective function value of 3.87 €/m3 and if we wanted to dispose all the waste in one place, we would adopt this solution as a draft design for further development of the final design. Consequently, the solution ranked 6 was taken into further consideration (as Option 1).
As within the overall zone of interest, there are two physically separate locations (eastern and western side of the mine) where it is possible to form a waste dump (all top 15 generated solutions are in these two locations). The possibility of creating several smaller waste dumps with a total volume corresponding to the required volume (20 million m3) should also be investigated. When considering this possibility, we should keep in mind that the design of many generated solutions will overlap (Figure 8). Waste dumps that overlap cannot be taken into account when analysing this option. The solutions ranked 1 and 2 (Table 3) have a total volume (21.2 million m3) slightly higher than the required value of 20 million m3. A slightly higher value than required is useful because it provides the necessary reserve of waste dump capacity. Also, these two solutions have the smallest objective function values and their designs do not overlap, which makes them the best candidates for analysing the possibility of waste dumping along multiple locations. Combinations of other solutions (solution numbers 2 and 3, or 3 and 5, etc.) have a volume which sum is close to the required value, but their objective function value is higher, or their designs overlap. For this reason, the combination of solutions 1 and 2 is also considered (as Option 2).
In the final stage, the performance of two possible options were compared. Option 1 – selection of a waste dump in one location (a unique waste dump with the required volume - solution number 6). Option 2 - choosing waste dumps on two locations (combination of solutions 1 and 2).
Table 4. Performance comparison of the analysed options.
Compered Options Option 1
(solution - rang number 6)
Option 2
(combination of solutions with rang number 1 and 2)
solution with rang number 1 solution with rang number 2
Top elevation 200 m 177 m 179 m
Volume 21.48 mil.m3 13.05 8.12
Volume sum = 13.41+8.74= 21.2 mil. m3
Objective function 3.87 3.13 3.33
3.21 (mean value weighted by volume)
t 4. Performance comparison of the analysed options.
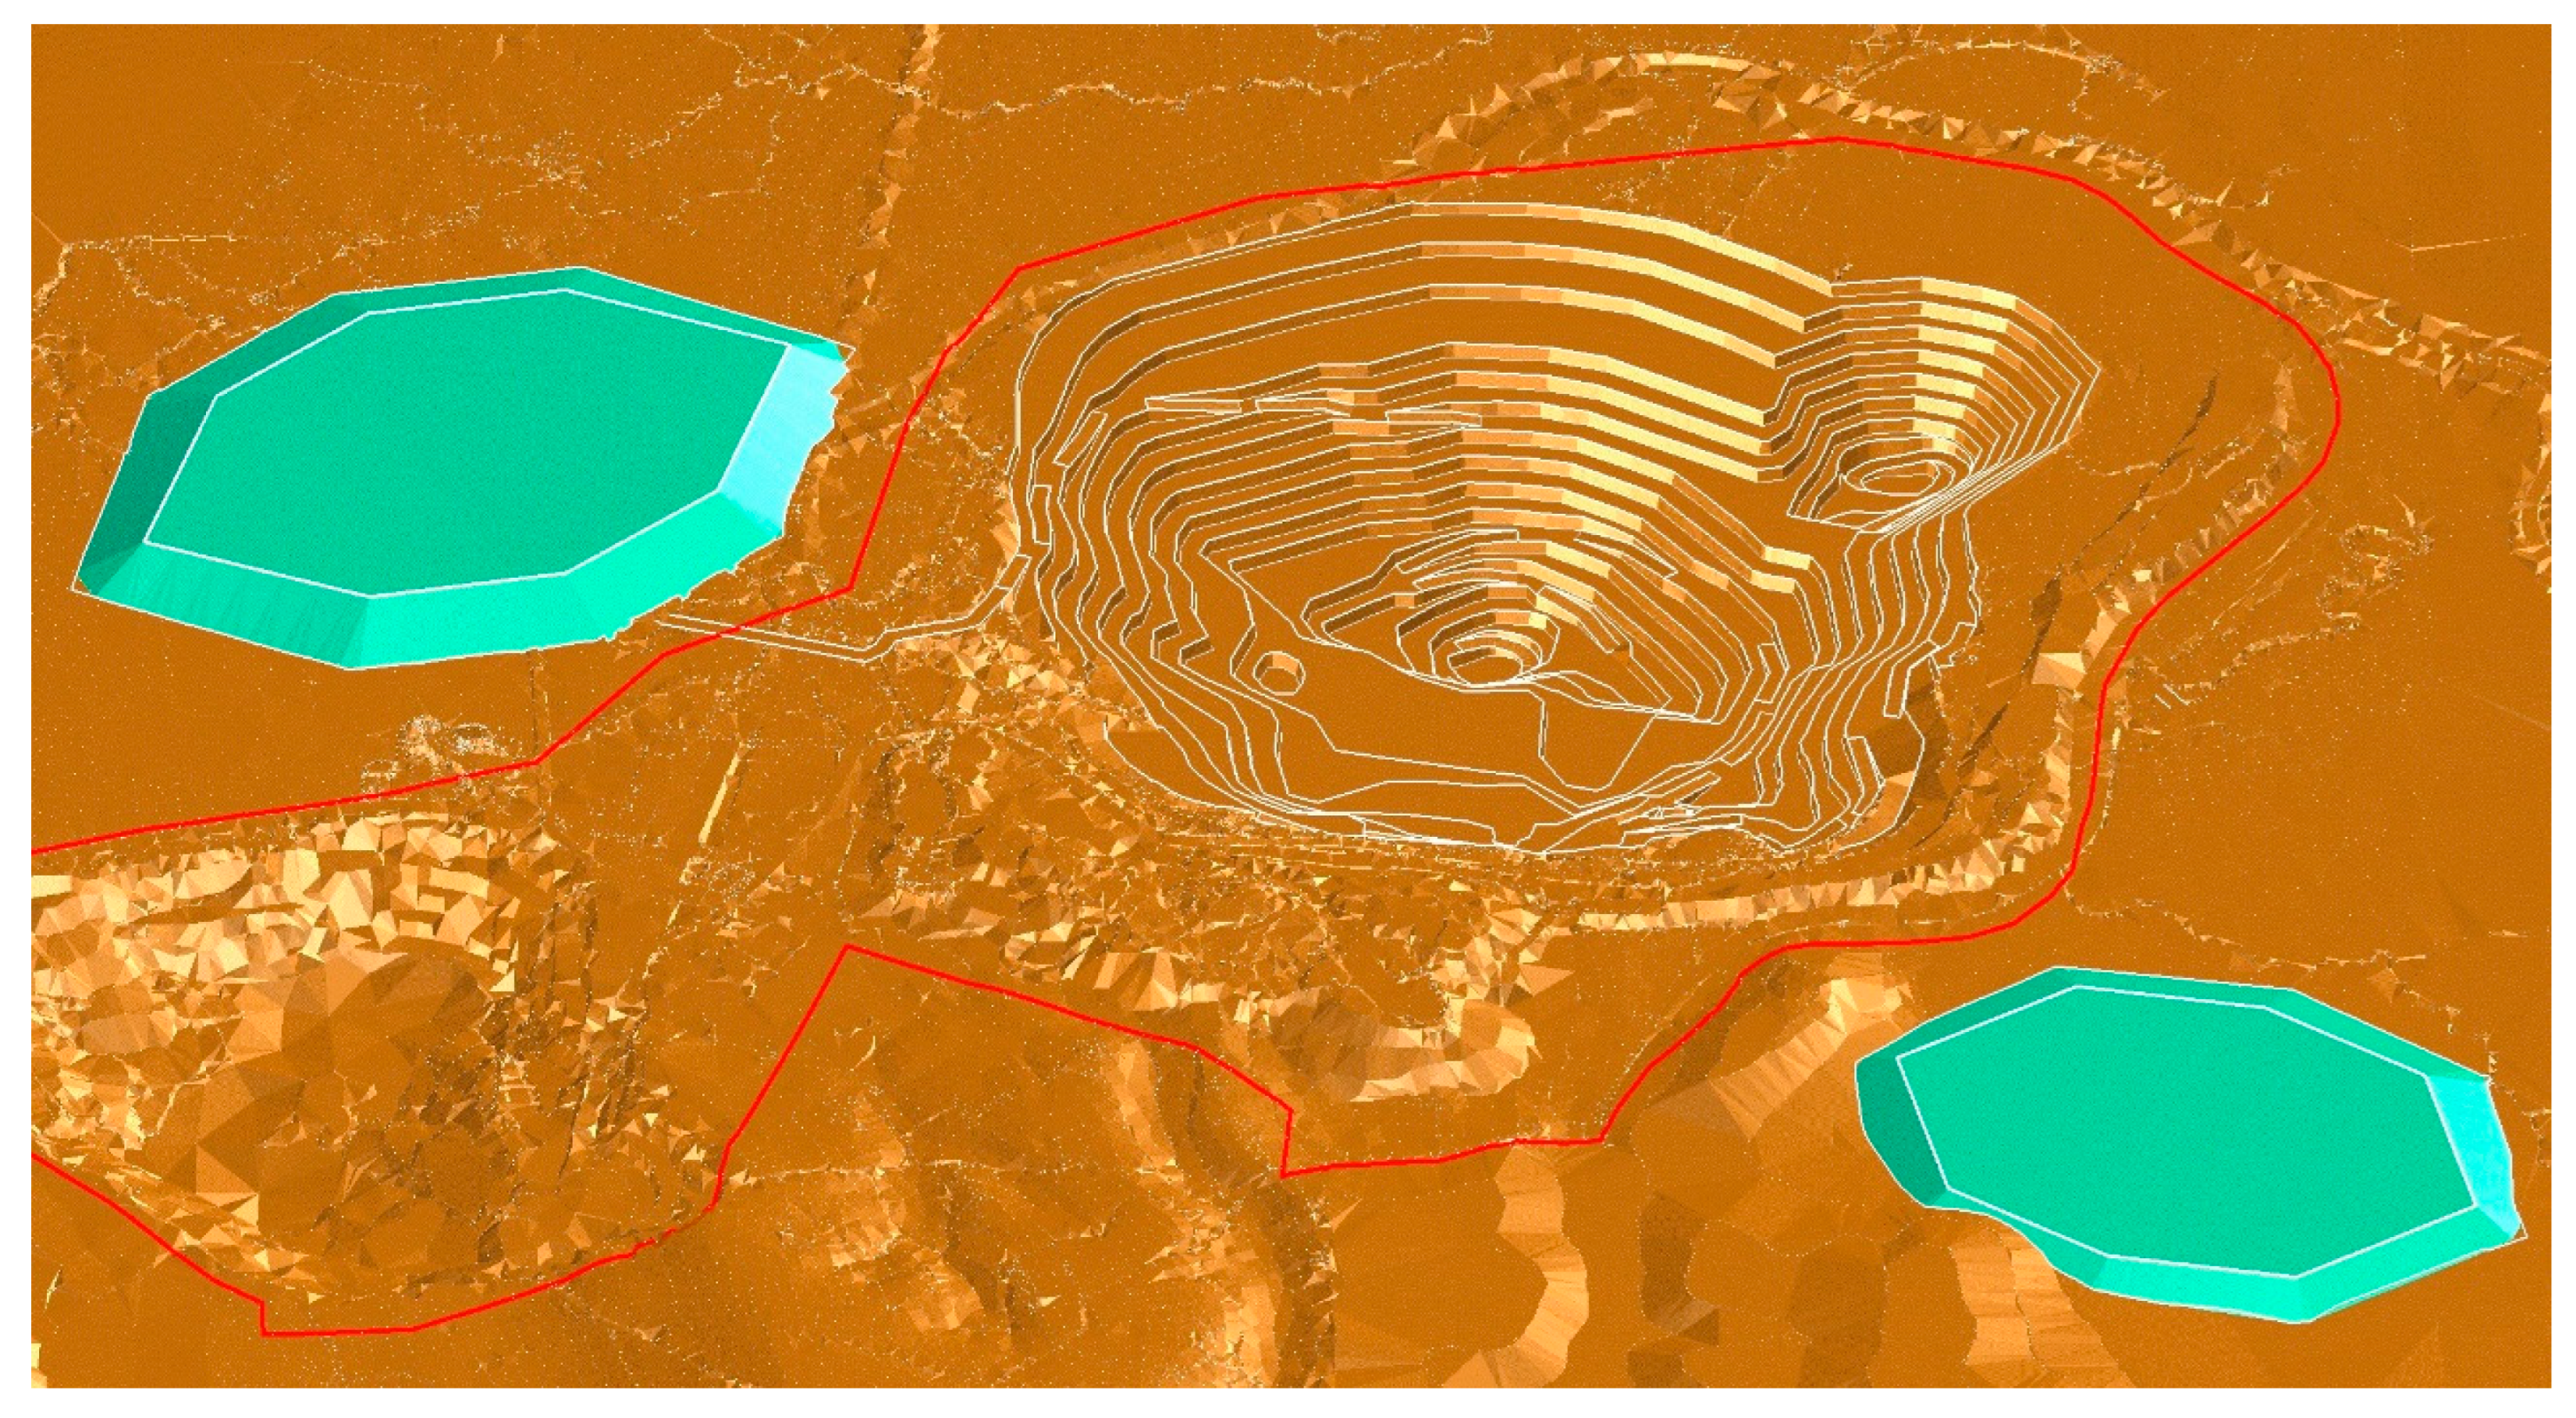
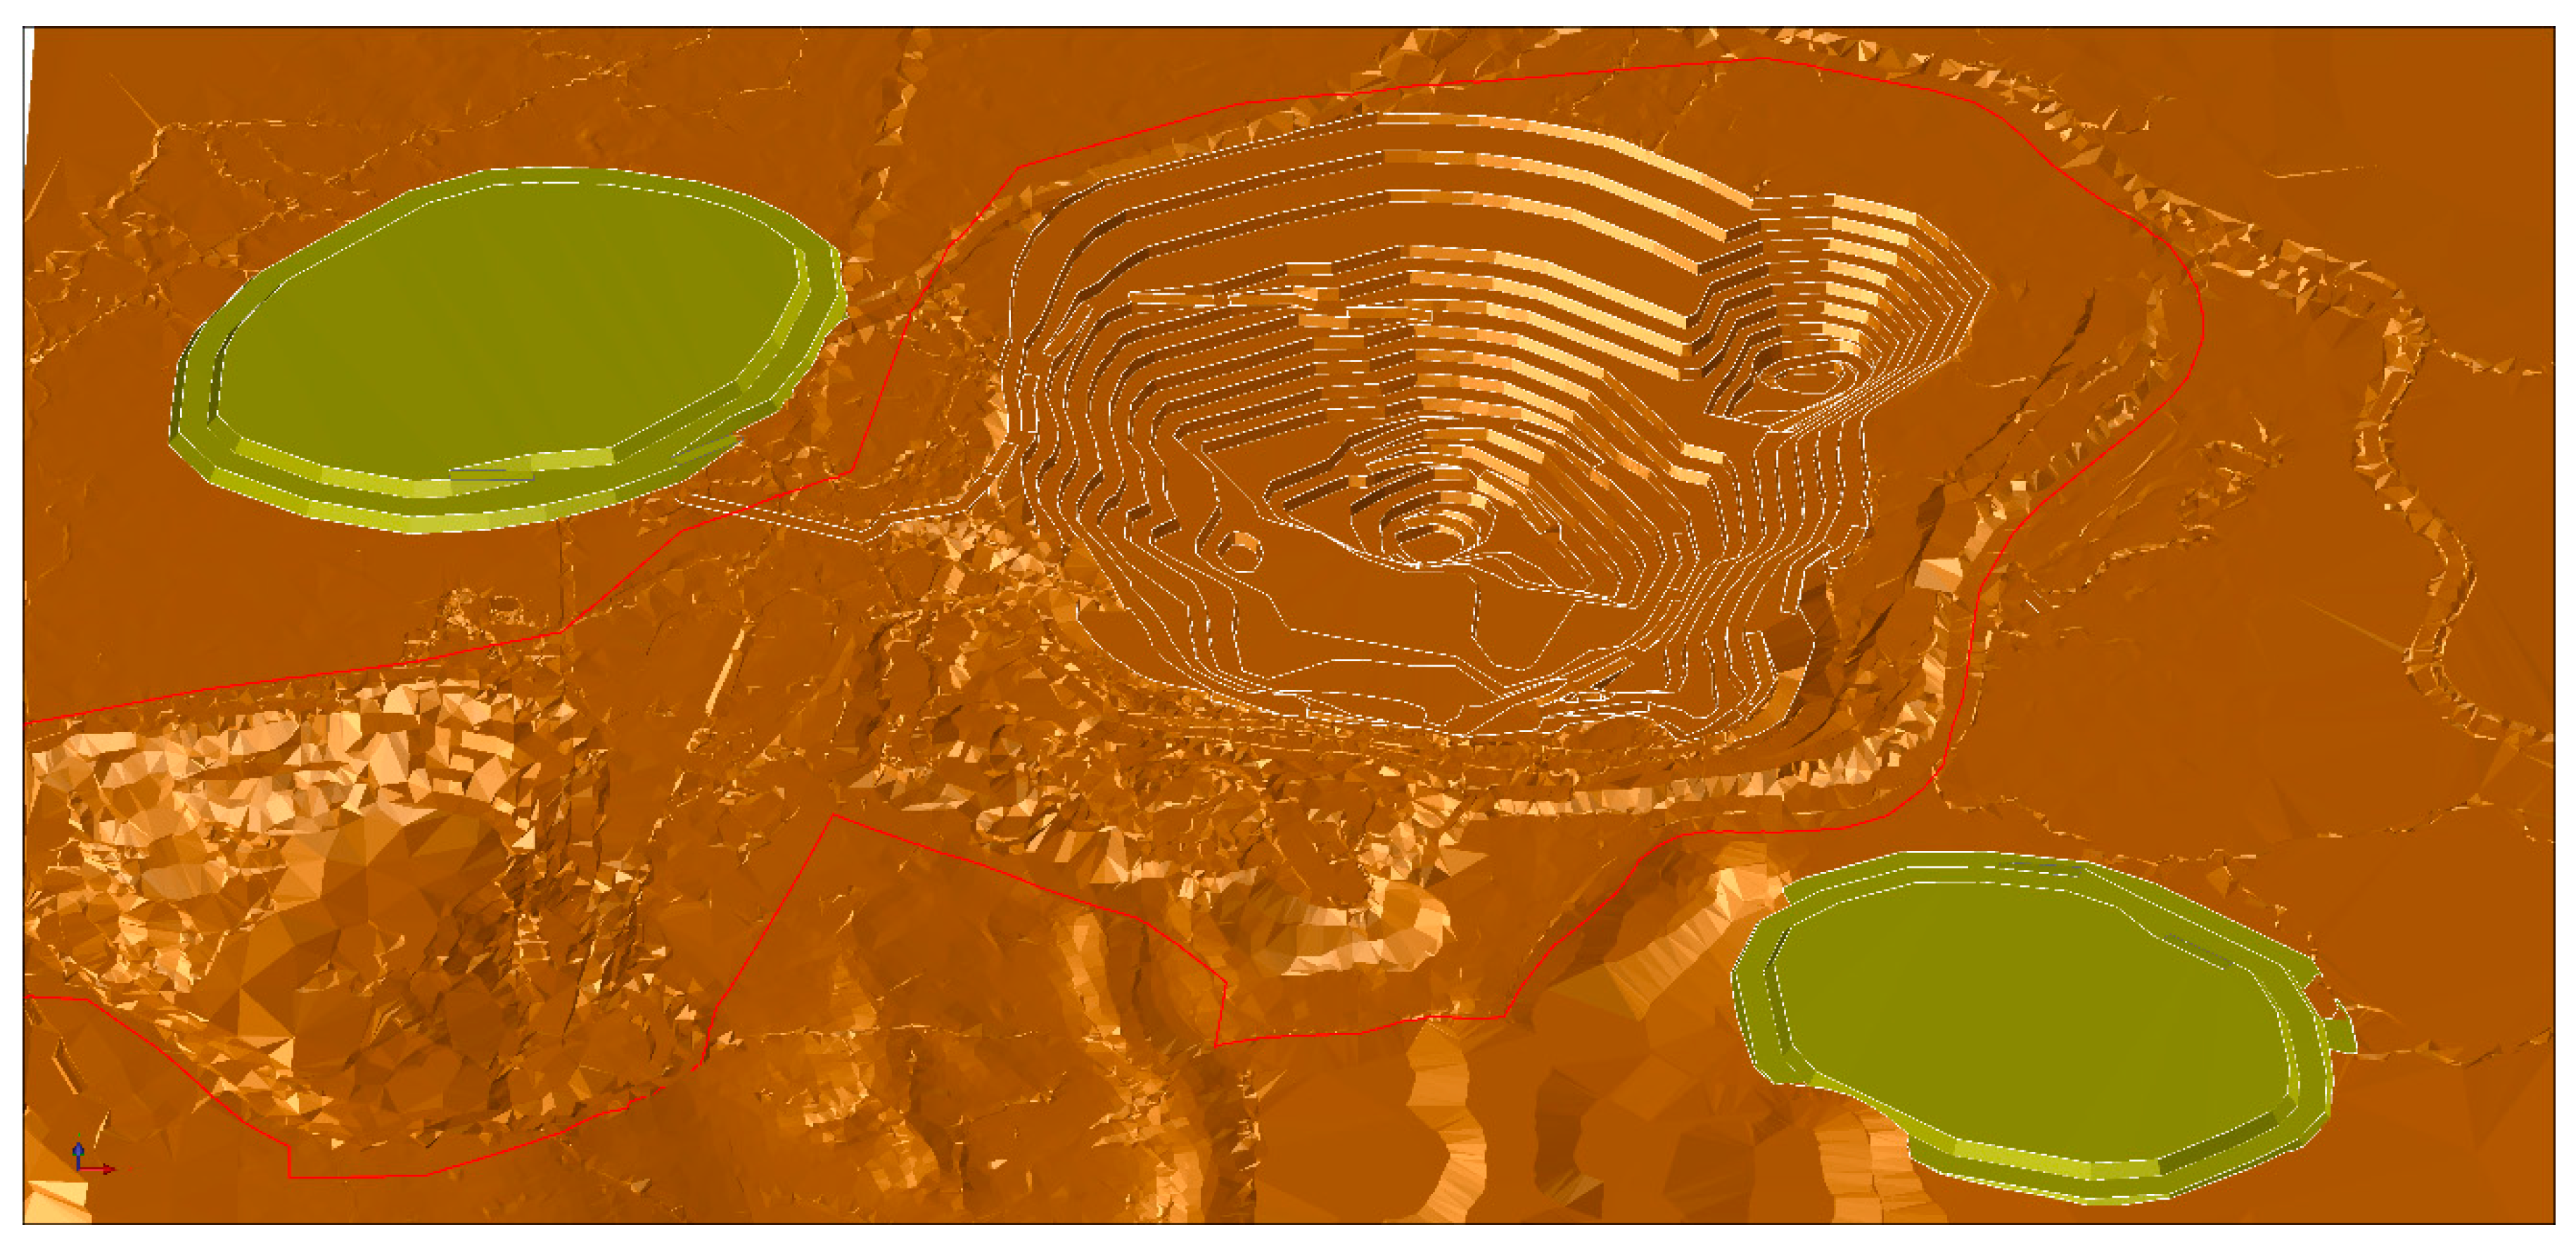
As can be seen from the table above, Option 2 has a significantly better (smaller) objective function value and is therefore adopted as the basis (draft design) for the detailed waste dump design. The generated draft design is presented in Figure 9.
Based on the adopted draft solution, the final detailed design of the waste dumps was created. For this step it was necessary to introduce additional geometric parameters:
  • Bench height is 10 m, Bench angle is 33°, Berm width is 40 m,
  • Ramp gradient is 8%, Ramp width is 25 m.
The final design consists of two waste dumps, with a total volume of 20,8 mil. m3, and is shown in Figure 10.
As it can be seen from the above, proposed hybrid model has ability to include various factors (economic, environmental and technological) of the waste dumping process and produce optimized solutions with a potential to improve the overall performance of mining project. In particular, the presented hybrid model can offer and rank a large number of solutions regarding waste dump design and location.
For the functioning of the model, it is necessary to analyse and define the input parameters and constraints, which is usually very time consuming. Despite the tedious process of defining a set of input parameters required for the model's optimisation algorithm to function, the realised benefits are significant. The process of defining the parameters is precisely what drives us to take a detailed look at all the influencing factors and evaluate their impact on the waste dumping process (something that is unfortunately often ignored in reality). This is particularly important in the process of defining the objective function, which can and should be adapted to each individual mining project. In addition, the proposed process of evaluating sub-zones using the AHP method allows for the ranking of additional factors that are different for each location.
During the application and testing, a long data processing time was identified as a basic drawback in the model's operation. For the presented case study, the processing time was 8 hours per optimisation, which can be considered long. However, it should be kept in mind that the development and testing of the model was done with relatively modest resources (primarily from the hardware aspect, but also considering the number of people involved in the research and their available time). It is a realistic assumption that with more resources the functioning of the model could be optimised and the processing time reduced. Taking into account, that the model is used to make important decisions (position and design of the waste dumps, which will have a long-term impact on the overall performance of the project), a longer processing time can be considered justified.
As previously mentioned, the optimisation of waste dumps is often a neglected issue in mining practice. Solutions are usually formed without detailed analysis and a mathematically defined optimisation process. In such conditions, engineers often rely on experience and their subjective judgement when making decisions. One of the main goals and benefits of the model is to reduce subjectivity in the decision making process.
The results of the proposed model depend entirely on the quality of the input parameters and are governed by defined constraints. Also, despite the graphical and analytical form, the generated waste dumps are only a draft of the final solution and additional analysis is required to transform the draft into a detailed final engineering solution. With this in mind, it is important to note that the presented hybrid model is not intended to replace an experienced waste dump design engineer. It is a useful and valuable tool that should contribute to and assist engineers in the process of solving important planning issues.

Author Contributions

Conceptualization, A.D. and D.S.; methodology, D.S.; software, M.D.; validation, A.D., M.D. and M.B.; formal analysis, A.D.; investigation, A.D.; resources, S.S.; writing—original draft preparation, A.D. and D.S.; writing—review and editing, M.B.; visualization, A.D. and D.S. All authors have read and agreed to the published version of the manuscript.

Funding

This research received no external funding.

Conflicts of Interest

The authors declare no conflict of interest.

References

  1. Dincer, T. Application pit optimization algorithms beyond open pit limits. In Proceedings of the seventeenth International Mining Congress and Exhibition of Turkey: IMCET 2001, Ankara, Turkey, 19-22 June 2001; pp. 549–556. [Google Scholar]
  2. Scoble, M.; Klein, B.; Dunbar, W.S. Mining waste: Transforming mining system for waste management. Int. j. surf. min. reclam. environ. 2003, 17, 123–135. [Google Scholar] [CrossRef]
  3. Alarie, S.; Gamache, M. Overview of solution strategies used in truck dispatching systems for open pit mines. Int. j. surf. min. reclam. environ. 2002, 16, 59–76. [Google Scholar] [CrossRef]
  4. Ozdemir, B.; Kumral, M. A system-wide approach to minimize the operational cost of bench production in open-cast mining operations. Int J Coal Sci Technol 2019, 6, 84–94. [Google Scholar] [CrossRef]
  5. Lizotte, Y.; Bonates, E. Truck and shovel dispatching rules assessment using simulation. Min. Sci. Technol. 1987, 5, 45–58. [Google Scholar] [CrossRef]
  6. Subtil, R. F.; Silva, D. M.; Alves, J. C. A practical approach to truck dispatch for open pit mines. In Proceedings of the 35th APCOM Symposium, Wollongong, Australia, 24-30 September 2011; pp. 765–778. [Google Scholar]
  7. Li, Y.; Topal, E.; Williams, D. Waste rock dumping optimization using mixed integer programming (MIP). Int. J. Min. Reclam. Environ. 2013, 27, 425–436. [Google Scholar] [CrossRef]
  8. Mudd, G.M. The Sustainability of Mining in Australia: Key Production Trends and Environmental Implications for the Future, Research Report No. RR5; Department of Civil Engineering, Monash University and Mineral Policy Institute, Melbourne, Australia, 2009.
  9. Northey, S.; Mohr, S.; Mudd, G.M.; Weng, Z.; Giurco, D. Modelling future copper ore grade decline based on a detailed assessment of copper resources and mining. Resour. Conserv. Recycl. 2014, 83, 190–201. [Google Scholar] [CrossRef]
  10. Calvo, G.; Mudd, G.; Valero, A.; Valero, A. Decreasing Ore Grades in Global Metallic Mining: A Theoretical Issue or a Global Reality? Resources 2016, 5, 36. [Google Scholar] [CrossRef]
  11. Calvo, G.; Palacios, J. L.; Valero, A. The influence of ore grade decline on energy consumption and GhG emissions: The case of gold. Environ. Dev. 2022, 41, 100683. [Google Scholar] [CrossRef]
  12. Li, Y.; Topal, E.; Williams, D.J. Optimisation of waste rock placement using mixed integer programming. Min. Tech. 2014, 123, 220–229. [Google Scholar] [CrossRef]
  13. Li, Y.; Topal, E.; Ramazan, S. Optimising the long-term mine waste management and truck schedule in a large-scale open pit mine. Mining Technology 2016, 125, 35–46. [Google Scholar] [CrossRef]
  14. Fu, Z.; Li, Y.; Topal, E.; Williams D., J. A new tool for optimisation of mine waste management in potential acid forming conditions. In Proceedings of the Tailings and mine waste management for the 21st century, Sydney, Australia, 27-28. July 2015. [Google Scholar]
  15. Kumral, M.; Dimitrakopoulos, R. Selection of waste dump sites using a tabu search algorithm. J. South. Afr. Inst. Min. Metall. 2008, 108, 9–13. [Google Scholar]
  16. Hajarian, A.; Osanloo, M. A New Developed Model to Determine Waste Dump Site Selection in Open Pit Mines: An Approach to Minimize Haul Road Construction Cost. Int. J. Eng. (IJE) 2020, 33, 1413–1422. [Google Scholar] [CrossRef]
  17. Shahba, S.; Arjmandi, R.; Monavari, M.; Ghodusi, J. Application of multi-attribute decision-making methods in SWOT analysis of mine waste management (case study: Sirjan's Golgohar iron mine, Iran). Resour. Policy 2017, 51, 67–76. [Google Scholar] [CrossRef]
  18. Osanloo, M.; Ataei, M. Factors affecting the selection of site for arrangement of pit rock-dumps. J. Min. Sci. 2003, 39, 148–153. [Google Scholar] [CrossRef]
  19. Hekmat, A.; Osanloo, M.; Shirazi, A. M. New approach for selection of waste dump sites in open pit mines. Min. Tech. 2008, 117, 24–31. [Google Scholar] [CrossRef]
  20. Yazdani-Chamzini, A.; Ahmadi, Z.; Oraee, K.; Basiri, M. H. Waste Dump Site Selection by Using Fuzzy VIKOR. In Proceedings of the 5th Conference of Applied Geology and the Environment, Eslamshahr, Iran, 07. March 2011. [Google Scholar]
  21. Mensah, F. Integrating Global Positioning Systems and Geographic Information Systems in Mine Waste disposal: The Case of Goldfields Ghana Limited. MSc Thesis, University of Mines and Technology, Tarkwa, 2007. [Google Scholar]
  22. Suleman, H. A.; Baffoe, P. E. Selecting suitable sites for mine waste dumps using GIS techniques at Goldfields, Damang Mine. Ghana Min. J. 2017, 17, 9–17. [Google Scholar] [CrossRef]
  23. Liu, Y. Y.; Bao, J. J.; Liu, Y. J. Discussion on the safety distance between the bottom of the inner dump and the stope. Surface Coal Mining Technology 2003, 2, 11–13. [Google Scholar]
  24. Verma, D.; Kainthola, A.; Gupte, S. S.; Singh, T. N. A finite element approach of stability analysis of internal dump slope in Wardha valley coal field, India, Maharashtra. American Journal of Mining and Metallurgy 2013, 1, 1–6. [Google Scholar]
  25. Cheskidov, V. I.; Norri, V. K. Stripping with direct dumping in Kuzbass open pit mines: The current state and prospects. J. Min. Sci. 2016, 52, 725–731. [Google Scholar] [CrossRef]
  26. Stevanović, D.; Banković, M.; Rupar, V.; Milisavljević, V.; Cvjetić, A.; Kržanović, D. Waste Dump Design Optimization, Case Study Open Pit Drmno. In Proceedings of the 6th International Symposium Mining and Environmental Protection, MEP 17, Vrdnik, Serbia, 21-24. June 2017; pp. 282–286. [Google Scholar]
  27. Sari, Y. A.; Kumral, M. A landfill based approach to surface mine design. J. Cent. South Univ. 2018, 25, 159–168. [Google Scholar] [CrossRef]
  28. Peng, H.; Zhang, D. Research on Inpit Dumping Height during Tracing Mining Period between Two Adjacent Surface Coal Mines. Adv. Civ. Eng. 2018, 2018, 1–8. [Google Scholar] [CrossRef]
  29. Kaykov, D.; Koprev, I. Rationalising The Location And Design Of The Waste Dump In The Case Of Open-Pit Mining. Sustainable Extraction and Processing of Raw Materials 2020, 1, 42–46. [Google Scholar] [CrossRef]
  30. Williams, D.J.; Scott, P.; Johnston, D.; Lee, G. Rock Dump Design to Limit Potential Acid Drainage. In Proceedings of the First International Seminar on the Management of Rock Dumps, Stockpiles and Heap Leach Pads, Perth, Western Australia, 5-6 March 2008. Australian Centre for Geomechanics (ACG); pp. 207–217. [Google Scholar]
  31. Ozturk, C.A.; Ercelebi, S.; Onsel, I.E.; Ozkan, M. Open pit mine waste dump area design based on stability principles. In Proceedings of the 24th International Mining Congress and Exhibition of Turkey, IMCET'15, Antalya, Turkey, 14-17. April 2015; pp. 570–578.
  32. Puell Ortiz, J. Methodology for a dump design optimization in large-scale open pit mines. Cogent Eng. 2017, 4, 1387955. [Google Scholar] [CrossRef]
  33. Metropolis, N.; Ulam, S. The Monte Carlo Method. J. Am. Stat. Assoc. 1949, 44, 335–341. [Google Scholar] [CrossRef] [PubMed]
  34. Anderson, H. L. Metropolis, Monte Carlo and the MANIAC. Los Alamos Science 1986, 14, 96–108. [Google Scholar]
  35. Vujić, S.; Ivić, A. Mathematical methods in mining and geology, Faculty of Mining and Geology, University of Belgrade, Serbia, 1991.
  36. Stevanović, D. Open pit mine optimization and planning with stochastic models. PhD dissertation, Faculty of Mining and Geology, University of Belgrade, Serbia, 2015.
  37. Sauvageau, M.; Kumral, M. Cash flow at risk valuation of mining project using Monte Carlo simulations with stochastic processes calibrated on historical data. The Engineering Economist 2018, 63, 171–187. [Google Scholar] [CrossRef]
  38. Wei, J.; Jian, Z.; Jianglan, L. Mining Investment Risk Analysis Based on Monte Carlo Simulation. In Proceedings of the 5th International Conference on Management of e-Commerce and e-Government, Wuhan, China, 5-6. November 2011; pp. 72–75. [Google Scholar] [CrossRef]
  39. Kopacz, M.; Kryzia, D.; Kryzia, K. Assessment of sustainable development of hard coal mining industry in Poland with use of bootstrap sampling and copula-based Monte Carlo simulation. J. Clean. Prod. 2017, 159, 359–373. [Google Scholar] [CrossRef]
  40. Holland, J. H. Adaptation in Natural and Artificial Systems, The University of Michigan Press, Ann Arbor, 1975.
  41. Еckhardt, R. Stan Ulam, John von Neumann, and the Monte Carlo method. Los Alamos Science Special Issue 1987, 15, 131–141. [Google Scholar]
  42. Katoch, S.; Chauhan, S. S.; Kumar, V. A review on genetic algorithm: past, present, and future. Multimed. Tools. Appl. 2020, 80, 8091–8126. [Google Scholar] [CrossRef]
  43. Stanković, R.; Lilić, N.; Obradović, I. Prediction of air pollution by coupling neural networks and genetic algorithms. In Proceedings of the Informatics, ecology and management in surface mining of mineral resources, Aranđelovac, Serbia, June 1997; pp. 211–220. [Google Scholar]
  44. Chang, P. C.; Huang, W. H.; Ting, C. J. Dynamic diversity control in genetic algorithm for mining unsearched solution space in TSP problems. Expert Syst. Appl. 2010, 37, 1863–1878. [Google Scholar] [CrossRef]
  45. Pham, D. T.; Karaboga, D. Intelligent optimisation techniques: genetic algorithms, tabu search, simulated annealing and neural networks, Springer, London, 2012. [CrossRef]
  46. Alipour, A.; Khodaiari, A.A.; Jafari, A.J.; Tavakkoli-Moghaddam, R. Production scheduling of open-pit mines using genetic algorithm: a case study. Int. J. Manag. Sci. Eng. Manag. 2020, 15, 176–183. [Google Scholar] [CrossRef]
  47. Noriega, R.; Pourrahimian, Y. A systematic review of artificial intelligence and data-driven approaches in strategic open-pit mine planning. Resour. Policy 2022, 77, 102727. [Google Scholar] [CrossRef]
  48. Gu, Z.; Cao, M.; Wang, C.; Yu, N.; Qing, H. Research On Mining Maximum Subsidence Prediction Based On Genetic Algorithm Combined with Xgboost Model. Sustainability 2022, 14, 10421. [Google Scholar] [CrossRef]
  49. Ahmadi, M.R.; Shahabi, R.S. Cutoff grade optimization in open pit mines using genetic algorithm. Resour. Policy 2018, 55, 184–191. [Google Scholar] [CrossRef]
  50. Paithankar, A.; Chatterjee, S.; Goodfellow, R. Open-pit mining complex optimization under uncertainty with integrated cut-off grade based destination policies. Resour. Policy 2021, 70, 101875. [Google Scholar] [CrossRef]
  51. Williams, J.; Singh, J.; Kumral, M.; Ramirez Ruiseco, J. Exploring Deep Learning for Dig-Limit Optimization in Open-Pit Mines. Nat. Resour. Res. 2021, 30, 2085–2101. [Google Scholar] [CrossRef]
  52. Banković, M.; Stevanović, D.; Pešić, M.; Tomašević, A.; Kolonja, Lj. Improving efficiency of thermal power plants through mine coal quality planning and control, Therm. Sci. 2018, 22, 721–733. [Google Scholar] [CrossRef]
  53. Saaty, T. The Analytical Hierarchy Process, Mc-Graw-Hill, New York, NY, USA, 1980.
  54. Pessoa, I. C.; Trojan, F.; Oliveira, G. A.; Setti, D. The statistical sampling about levels of utilization of multi-criteria methods to solve problems in POM. In POMS 26th Annual Conference - Production and Operations Management Society, Wasington DC, USA, 8-11 May 2015.
  55. Saaty, T. Decision-making with the AHP: Why is the principal eigenvector necessary. Eur. J. Oper. Res. 2003, 145, 85–91. [Google Scholar] [CrossRef]
  56. Lee, A. H. I.; Chen, W. C.; Chang, C. J. A fuzzy AHP and BSC approach for evaluating performance of IT department in manufacturing industry in Taiwan. Expert Syst. Appl. 2008, 34, 96–107. [Google Scholar] [CrossRef]
  57. Petković, D.; Radovanović, M. Primena genetskog algoritma za optimizaciju obradnih procesa na primeru struganja. IMK-14-Istraživanje i razvoj 2011, 17, 11–16. [Google Scholar]
  58. Hustrulid, W. A.; Kuchta, M.; Martin, R. K. Open pit mine planning and design, two volume set & CD-ROM pack, 3rd ed., CRC Press, London, 2013. [CrossRef]
  59. Li, Y.; Topal, E.; Williams, D. Waste rock dumping optimisation using mixed integer programming (MIP). Int. J. Min. Reclam. Environ. 2013, 27, 425–436. [Google Scholar] [CrossRef]
  60. Matlab, MathWorks, additional information. Available online: https://www.mathworks.com/products/matlab.
  61. Excel, Microsoft, additional information. Available online: https://www.microsoft.com/en-us/microsoft-365/excel.
  62. Geovia Surpac, Dessault Systemes, additional information. Available online: https://www.3ds.com/products-services/geovia/products/surpac/.
Figure 1. The basic flowchart of genetic algorithm [45].
Preprints 80022 g001
Figure 2. Scheme of a hierarchical structure of AHP.
Preprints 80022 g002
Figure 3. Hybrid model algorithm.
Preprints 80022 g003
Figure 4. Model basic geometry steps.
Preprints 80022 g004
Figure 5. An example of area of interest division into zones and sub-zones.
Preprints 80022 g005
Figure 6. The location of open pit Buvac.
Preprints 80022 g006
Figure 7. Division into zones and sub-zones.
Preprints 80022 g007
Figure 8. Graphical results for the top 15 solutions.
Preprints 80022 g008
Figure 9. Selected draft design.
Preprints 80022 g009
Figure 10. Final Waste dump design.
Preprints 80022 g010
Table 1. Factors and coefficients from AHP analysis.
Factor Coefficient Rang Index
Potential open pit expansion 0.657 1 K1
Potential administrative obstacles 0.105 3 K2
Increased environmental impact 0.238 2 K3
Table 2. Basic GA optimization parameters.
Model
operational mod
Volume range
(m3)
Number of Initial population members Number of optimizations Generations number
Mod 2 6x10⁶ - 22x106 2,250 15 5
Table 3. Analytical results of top 15 solutions.
Solution Rang
Number
Point Coordinates Haul Distance Component (m) Costs
(mil. €)
Waste Dump Volume (mil. m3) Objective
Function
(€/m3)
X Y Z Horiz. Verti. C1 C2 C3
1. 6,411,903 4,970,738 177 1,288 1,740 13.82 28.02 0.19 13.05 3.13
2. 6,414,142 4,969,217 179 1,459 1,786 10.21 18.75 0.14 8.12 3.33
3. 6,411,895 4,971,018 193 1,430 2,053 13.68 29.46 0.14 11.96 3.62
4. 6,412,230 4,971,409 192 1,465 2,048 21.05 44.15 0.20 17.97 3.64
5. 6,411,660 4,970,804 198 1,537 2,158 12.23 25.76 0.14 9.95 3.83
6. 6,414,185 4,969,180 200 1,516 2,207 24.22 52.90 0.18 20.48 3.87
7. 6,414,286 4,968,992 197 1,719 2,150 24.70 46.32 0.20 17.96 3.97
8. 6,411,898 4,970,760 217 1,301 2,537 16.43 48.06 0.15 15.79 4.09
9. 6,411,834 4,971,128 209 1,543 2,374 10.63 24.53 0.11 8.61 4.10
10. 6,412,016 4,971,044 216 1,348 2,520 9.36 26.26 0.12 8.68 4.12
11. 6,411,836 4,970,765 216 1,359 2,524 20.39 56.78 0.16 18.75 4.12
12. 6,411,942 4,970,816 220 1,286 2,598 19.81 60.04 0.16 19.26 4.15
13. 6,411,761 4,970,614 220 1,378 2,606 14.70 41.73 0.12 13.34 4.24
14. 6,411,836 4,970,765 236 1,359 2,912 21.73 69.84 0.17 19.98 4.59
15. 6,411,745 4,971,070 238 1,584 2,963 25.19 70.69 0.18 19.88 4.83
Disclaimer/Publisher’s Note: The statements, opinions and data contained in all publications are solely those of the individual author(s) and contributor(s) and not of MDPI and/or the editor(s). MDPI and/or the editor(s) disclaim responsibility for any injury to people or property resulting from any ideas, methods, instructions or products referred to in the content.
Copyright: This open access article is published under a Creative Commons CC BY 4.0 license, which permit the free download, distribution, and reuse, provided that the author and preprint are cited in any reuse.
Prerpints.org logo

Preprints.org is a free preprint server supported by MDPI in Basel, Switzerland.

Subscribe

© 2024 MDPI (Basel, Switzerland) unless otherwise stated