1. Introduction
Cancer, with its metastatic nature, stands as a formidable force shaping life expectancy [
1]. Metastasis, the insidious spread of cancer cells to distant sites, poses a dire threat to patients, setting the boundaries of treatment efficacy [
2]. The appearance of secondary tumors in vital organs jeopardizes their normal function and complicates therapeutic interventions. Unraveling the origin of metastatic cancer becomes paramount in this battle [
3]. Failure to correctly identify the cancer origin can ultimately lead to a large reduction in survival rate as highlighted by the case of Cancer of unknown primary [
4]. Determining the primary tumor site allows for tailored treatment strategies, aligning therapies with the specific characteristics of the cancer. The ability to discern the origin illuminates divergent responses to chemotherapy, radiation therapy, and targeted approaches across cancer types, ultimately leading to improved patient outcomes. Moreover, this pursuit of origin unveils the intricate mechanisms underpinning cancer cell spread, facilitating the development of novel interventions aimed at curbing metastasis.
Predicting cancer using Copy Number Alterations (CNA) could be instrumental in tracking the origin of metastases [
5]. CNA refers to the genomic changes in cancer cells, where specific regions have an altered number of copies compared to normal cells. As cancer spreads and metastasizes, it leaves distinct CNA patterns that can be used to trace the primary tumor site. It was shown using scRNA-seq that there is a high degree of similarity between
monogenetic primary tumors and their metastases suggesting clonality of CNA fingerprint in cancer [
6]
. Several pieces of evidence support this hypothesis, for example, investigating intratumor heterogeneity in lung adenocarcinomas using multiregional sequencing revealed a high degree of conservation of CNAs across different tumor regions, supporting clonality and the retention of genetic alterations during metastasis [
7,
8]. Analyzing the CNA profiles of metastatic tumors could provide valuable insights into the origin and spread of the disease, aiding treatment decisions, personalized medicine approaches, and targeted therapies for improved patient outcomes.
Advancements have been made in using copy number alterations (CNA) to track the origin of metastases; however, further improvements are needed.
Ding et al analyzed recurrent CNVs from non-tumor blood cell DNAs of non-cancer subjects and identified differences in CN losses and gains between cancer patients and controls in hepatocellular carcinoma, gastric cancer, and colorectal cancer [
9].
Ning et al. utilized CNVs of 23,082 genes to classify six different types of cancers, achieving 75% accuracy by reducing the feature space to CNVs of 19 genes [
10]. Similarly,
Sanaa et al. trained seven machine learning classifiers using the same dataset, with the random forest algorithm achieving 86% accuracy [
11]. These studies highlight the potential of CNVs and CNA analysis in predicting cancer risk, differentiating cancer types, and providing genetic insights. Recently,
Karim et al. collected CNV data from The Cancer Genome Atlas, including genomic deletions and duplications, for 8000 cancer patients covering 14 different cancer types. They employed sparse representations based on oncogenes and protein-coding genes, training Conv-LSTM and convolutional autoencoder (CAE) networks to capture important features and initialize weights for subsequent convolutional layers (Karim et al.,[
5]). However, the highest accuracy their approach could reach is 75%. These recent efforts contribute to further advancing the field and addressing the need for improvement in CNA analysis for metastasis tracking, but they also emphasize the need for further improvements.
In our study, we trained an Artificial Intelligence (AI) model using CNA data from twenty different cancer types and achieved 90% accuracy in predicting the primary tumor origin based on the CNA type and its chromosomal location. This AI-based approach presents a promising avenue for enhancing metastatic cancer diagnosis and treatment planning. Further research is needed to improve the accuracy and reliability of CNA-based predictions. Nevertheless, our study showcases the potential of AI and genomic profiling to provide valuable insights into the origin and progression of metastatic cancer, paving the way for more targeted and effective therapeutic strategies.
2. Methods
2.1. Database construction
We downloaded 20 types of cancer through the
https://www.cbioportal.org/ portal. The data came from a study consisting of 32 different studies and deposited at TCGA, PanCancer Atlas (Table 1) (
Figure 1). After the data had been downloaded, we filtered the data to remove lower-frequency genes by using a threshold of 6%. We then removed duplicates based on the highest frequency for any given gene. Based on this filtration process, the dataset included 130,000 records organized into 20 different cancer types. Using the gene names, we retrieved the chromosome location, including coordinates, start, end, and strand, using a Python in-house analysis of the Gh38 downloaded from the University of Santa Cruz website (
https://genome.ucsc.edu/). Following that, the input to the AI model is the chromosome number, start, and end strand type of CNA (4 different types), forming 4 input states in total. The four states of the CNA were encoded using a single hot encode vector in Python.
| |
Study |
Organ |
Number of samples |
| 1 |
Adrenocortical Carcinoma |
Adrenal gland |
132 |
| 2 |
Bladder Urothelial Carcinoma |
Bladder |
612 |
| 3 |
Brain Lower Grade Glioma |
Brain |
3 |
| 4 |
Breast Invasive ductal Carcinoma |
Breast |
1007 |
| 5 |
Cervical Squamous Cell Carcinoma |
Cervix |
475 |
| 6 |
Cholangiocarcinoma |
Bile duct |
212 |
| 7 |
Colorectal Adenocarcinoma |
Large intestine |
405 |
| 8 |
Diffuse Large B-Cell Lymphoma |
B Cells |
858 |
| 9 |
Esophageal Adenocarcinoma |
Esophagus |
905 |
| 10 |
Glioblastoma Multiforme |
Brain |
39 |
| 11 |
Head and Neck Squamous Cell Carcinoma |
Oral cavity, pharynx, and larynx |
3 |
| 12 |
Kidney Renal Clear Cell Carcinoma |
Kidney |
277 |
| 13 |
Liver Hepatocellular Carcinoma |
Liver |
183 |
| 14 |
Lung Adenocarcinoma |
Lung |
53 |
| 15 |
Ovarian Serous Cystadenocarcinoma |
Ovary |
1071 |
| 16 |
Prostate Adenocarcinoma |
Prostate |
171 |
| 17 |
Sarcoma |
Connective tissue |
286 |
| 18 |
Skin Cutaneous Melanoma |
Skin |
2 |
| 19 |
Testicular Germ Cell Tumors |
Testicles |
258 |
| 20 |
Uveal Melanoma |
Eye |
106 |
2.2. Model Construction
In the first workflow, after downloading the data, we normalized the chromosome values (start, end, and strand). The CNA values were encoded using a single vector hot encoder to represent four different cases. Similarly, the cancer types were encoded to each numerically represent a single cancer type. Several architectures were compared using the KERAS sequential pipeline. In the second workflow, we combined types of cancer based on their locations within the human body. For example, low-grade gliomas and Glioblastoma Multiforme were both labeled as brain cancers. This allowed us to experiment with more generalized models. The main aim of this model is to differentiate between different cancer types, taking into account their location. This decreases the number of labels from 20 to 16. Following this first stage, we built smaller specialized models to differentiate between types of cancer within the same organ or location (i.e., between low-grade Glioma and Glioblastoma Multiforme). Both models were constructed in a Google Colab notebook using Python 3.
2.2.1. The Generalized model
For the first model, we experimented with several architectures and optimizers while using cross-entropy as the loss function. We used softmax as the last layer to give probability predictions for the 16 types of cancer. For the optimization, we used an ADAM or ADAMAX optimizer with a categorical cross-entropy option. We experimented with two main architectures: a) Convolution+Relu and b) Selu+Relu+Elu. For the Selu model, we used several sequential layers within the Keras framework (
Table 2).
2.2.2. The specialized models
For the specialized model, we used binary classification either using a single layer of a classifier or a classifier plus a Relu layer. Then we calculated accuracy and loss. Internal validation was done using the train-test split method, where the database was divided into a 3:2 ratio (
Table 3).
2.3. Hyperparameter tuning
To find the optimal values for each model, we used two methods: a) Keras hyperparameter tuning and b) grid search. In both cases, our optimization method aimed to find the lowest validation loss and the highest validation accuracy value. The values that were investigated were for learning rate, clip norm, and batch size.
2.4. Cross Validation using synthetic dataset and threshold setting
We built a synthetic database that replicates the original training data. This was done by generating the data using a similar statistical distribution for chromosomes, CNA values, and cancer types. We calculated sensitivity as the number of correct predictions divided by the total number of predictions. We performed three different runs, and each run generated three different values to be randomly selected from the dataset. In the case of the sensitivity analysis, we performed a grid search to identify the optimum threshold to achieve the highest mean precession recall. The threshold was chosen by investigating the overall accuracy and the threshold for assigning a respective probability to a respective category.
2.6. Availability and Implementation
The code for differentiating between cancer types based on Copy Number Alterations (CNA) is available on GitHub. It allows users to submit a gene name, its chromosome location, and strand information to predict the associated cancer type. The code is implemented using advanced machine-learning techniques and the Keras framework. It can be easily integrated into existing workflows or used as a standalone tool. The availability of this code promotes collaboration and supports research in cancer genomics, aiding in the development of improved treatment strategies.
3. Results
3.1. The generalized Model can predict with 90% accuracy
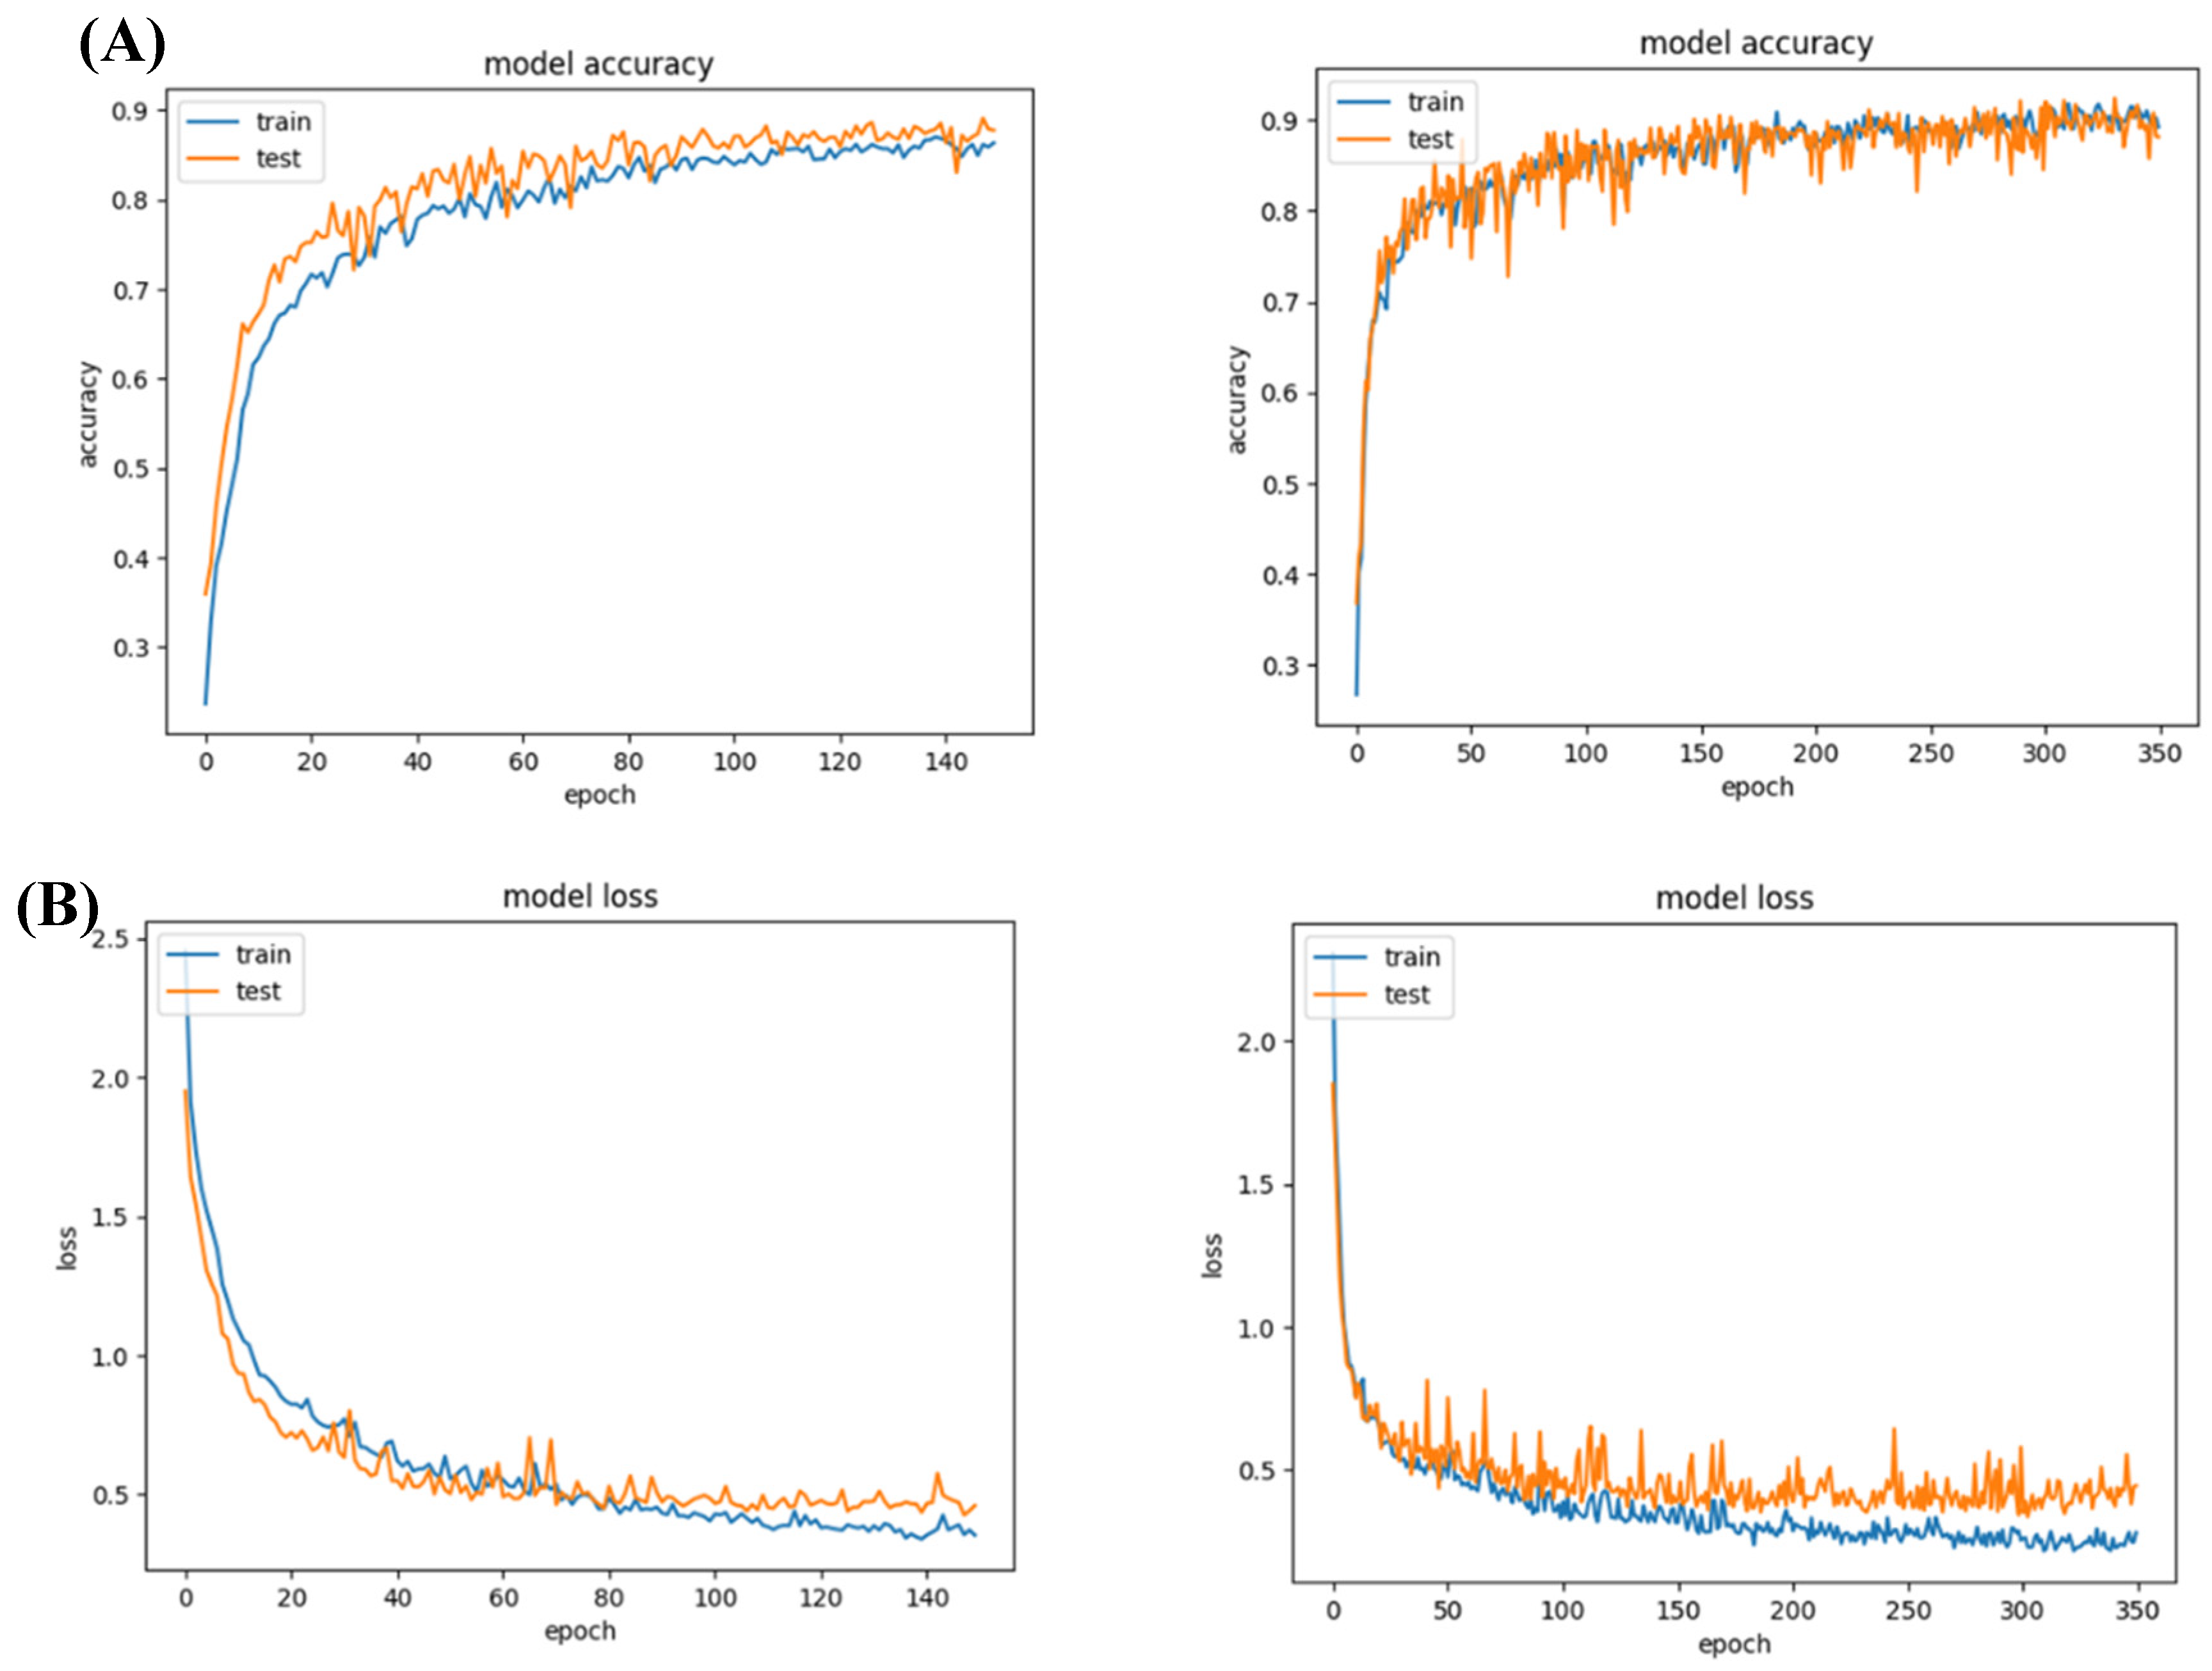
We tried two different architectures for this model: a) convolution 2D based + convolution, and b) Relu. The convolution Sigmoid achieved 90 % accuracy, while the relu-based model achieved around 90% accuracy with less than 0.5 loss.
Figure 2.
Model 1 accuracy and loss values. (A) Both networks achieved a reasonable accuracy of 90%; (B) their loss for training and validation was lower than 0.5.
Figure 2.
Model 1 accuracy and loss values. (A) Both networks achieved a reasonable accuracy of 90%; (B) their loss for training and validation was lower than 0.5.
3.2. The specific models achieve more than 95 % accuracy
A. Classification of Male-specific cancers
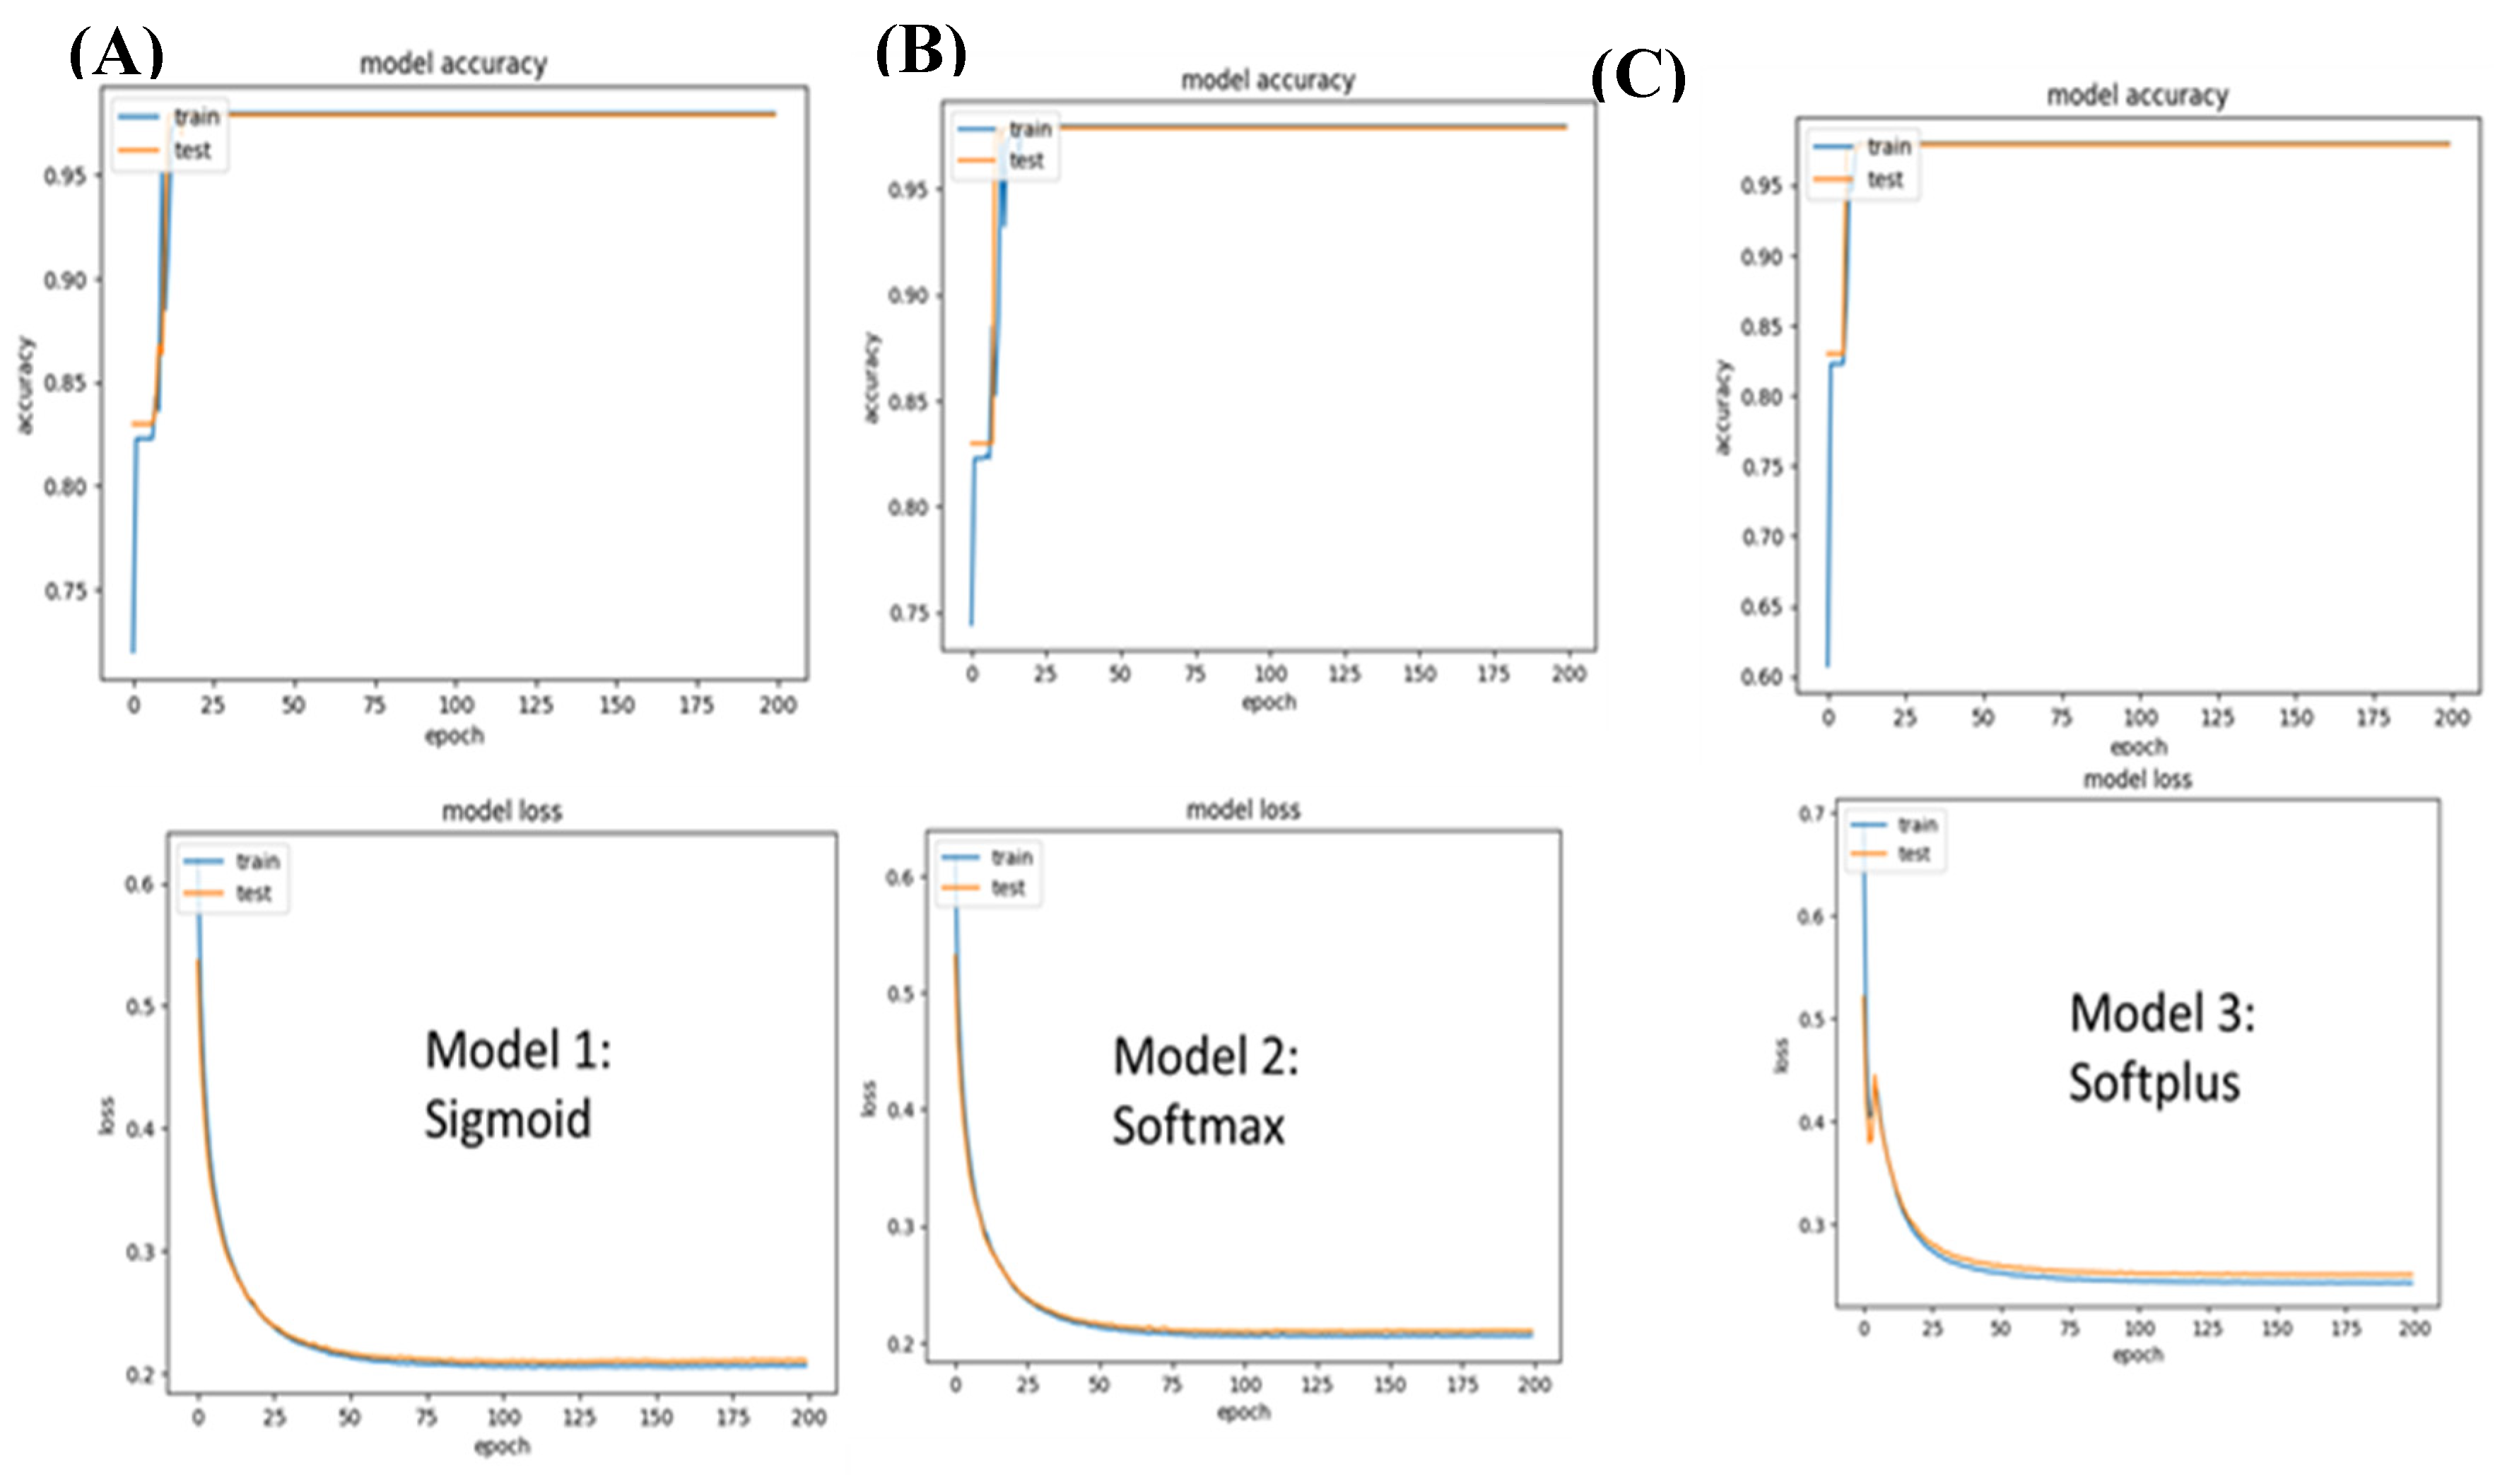
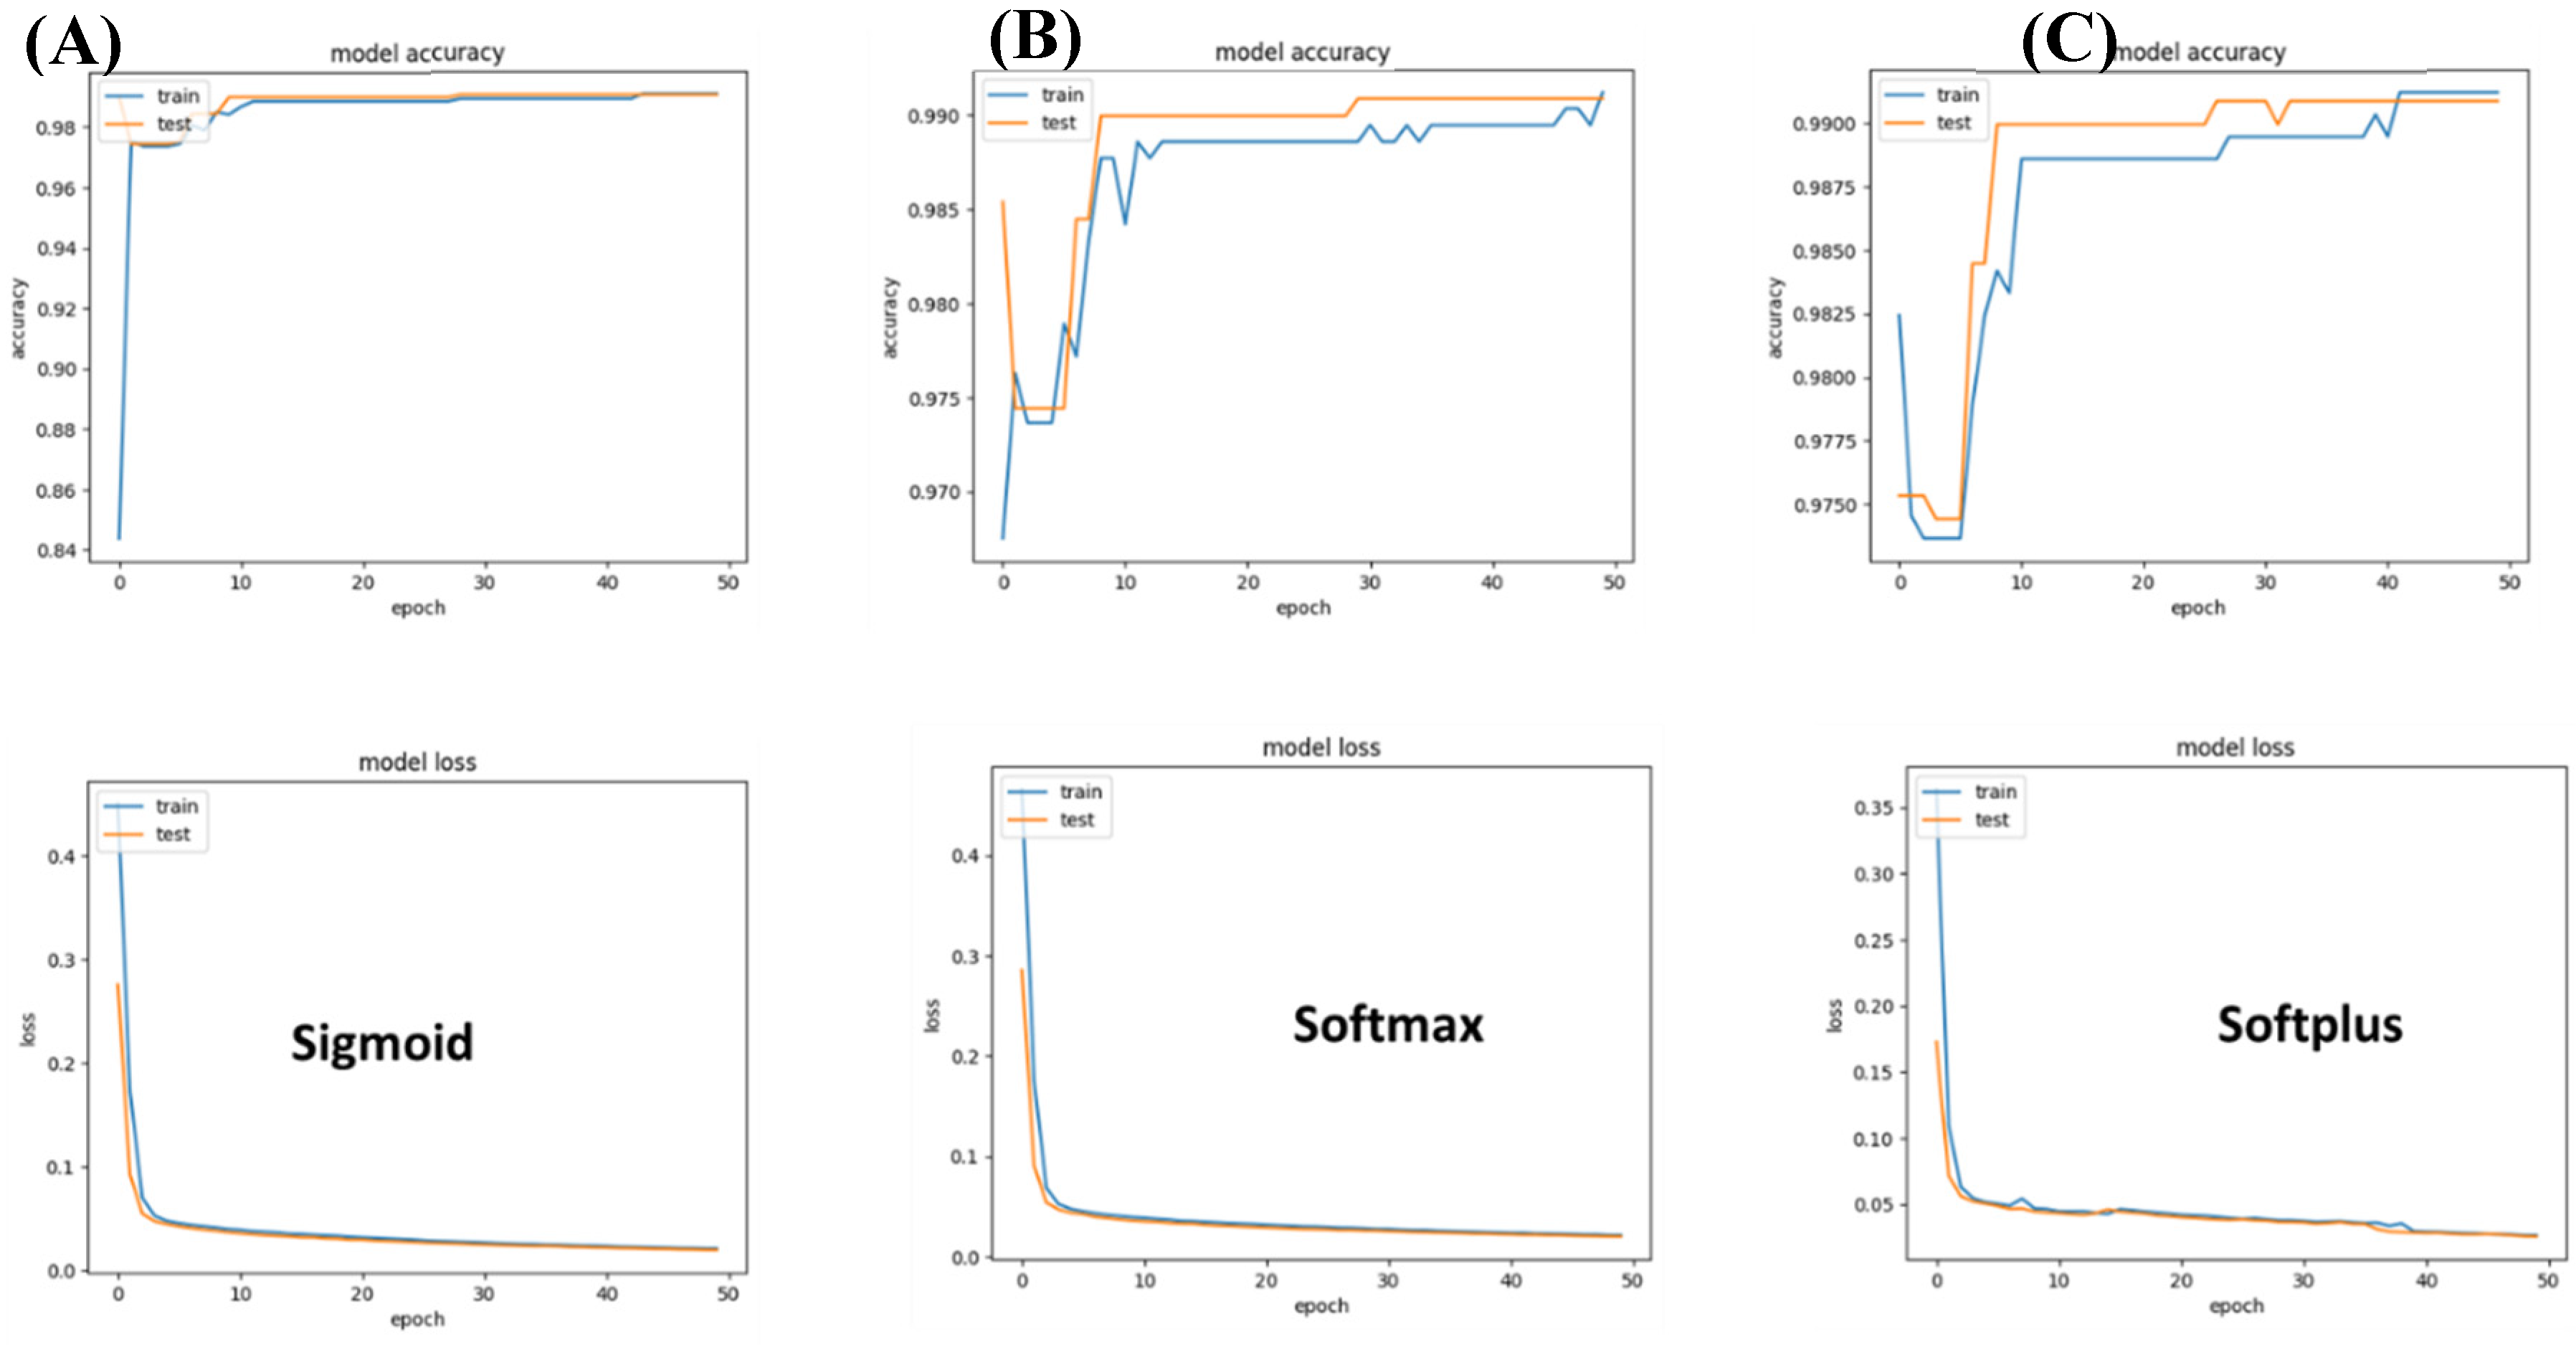
For this, we experimented with three models: a) Sigmoid, b) Softmax, and c) Softplus. Overall, all three models achieved high accuracy, with over 95% accuracy and very low loss. The lowest loss was achieved by the Sigmoid network, with a value of 0.2063 and an accuracy of 97%.
Figure 3.
Model 2 (Male-specific cancer) accuracy and loss values. A) While the Sigmoid network achieved a loss of 0.2066, the loss in the case of the softplus model was 0.24. B) The softmax performance came in second to the sigmoid network with 0.2063.
Figure 3.
Model 2 (Male-specific cancer) accuracy and loss values. A) While the Sigmoid network achieved a loss of 0.2066, the loss in the case of the softplus model was 0.24. B) The softmax performance came in second to the sigmoid network with 0.2063.
B. Classification of Brain cancers
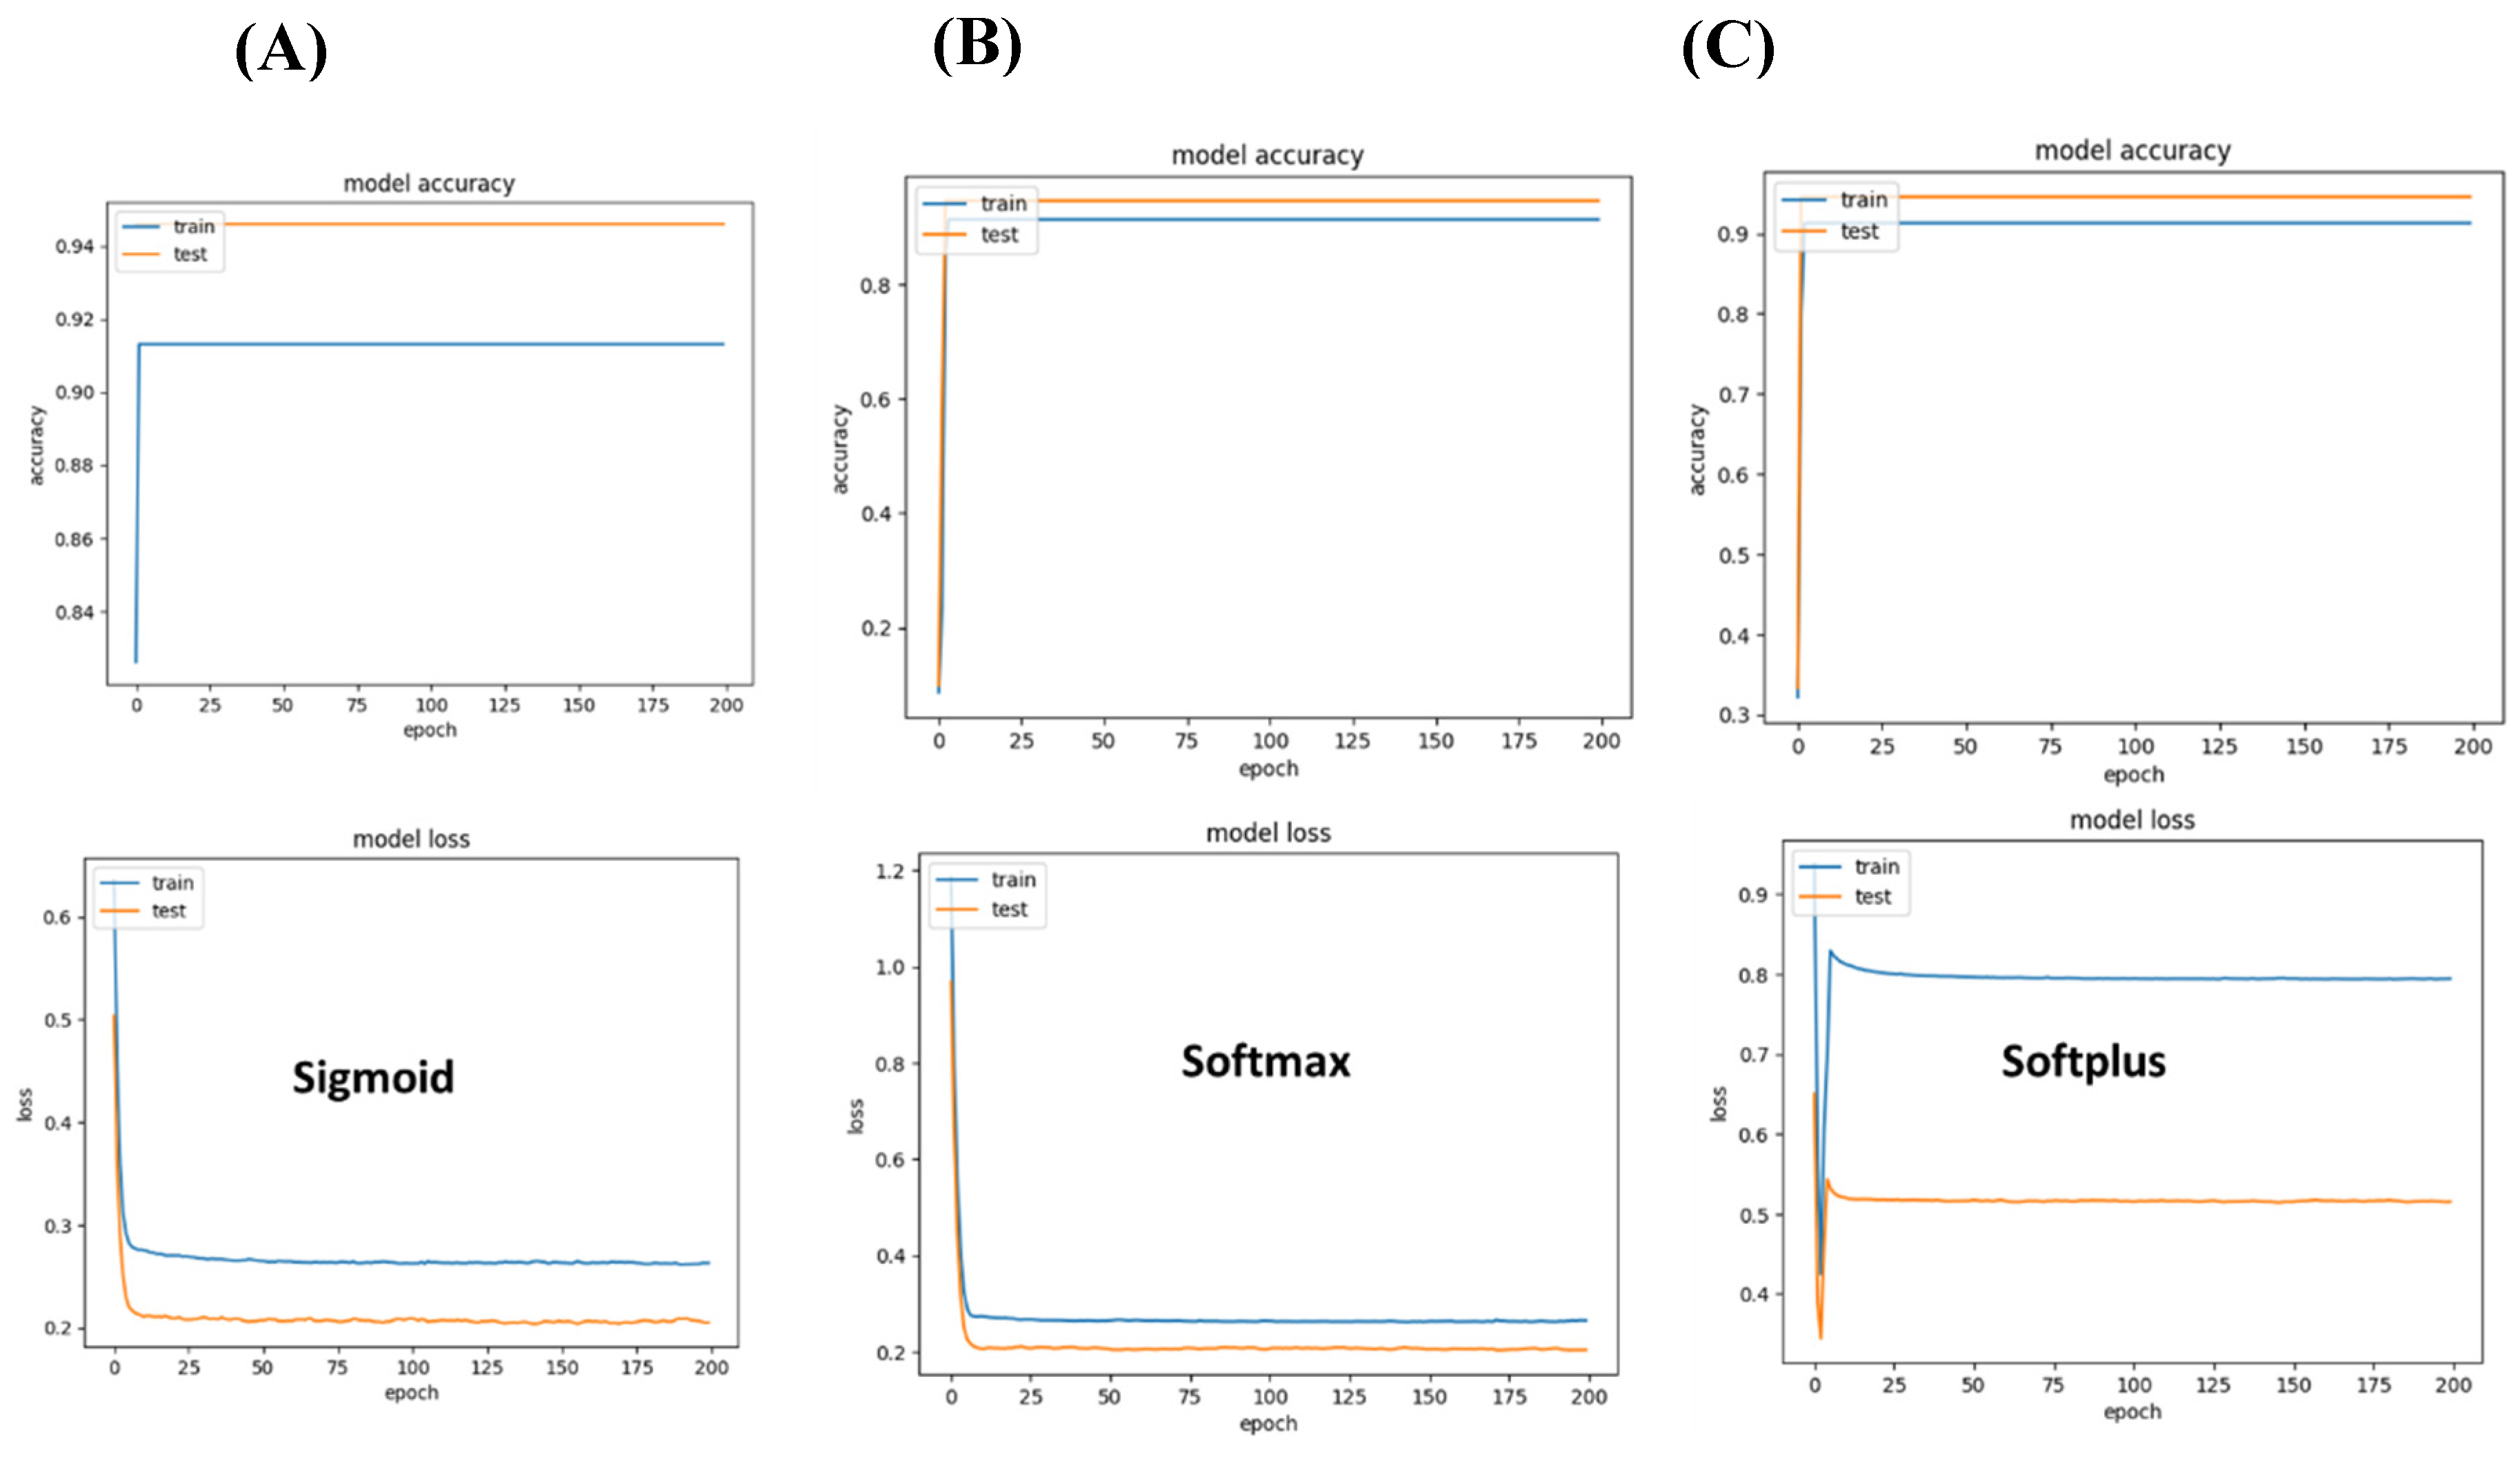
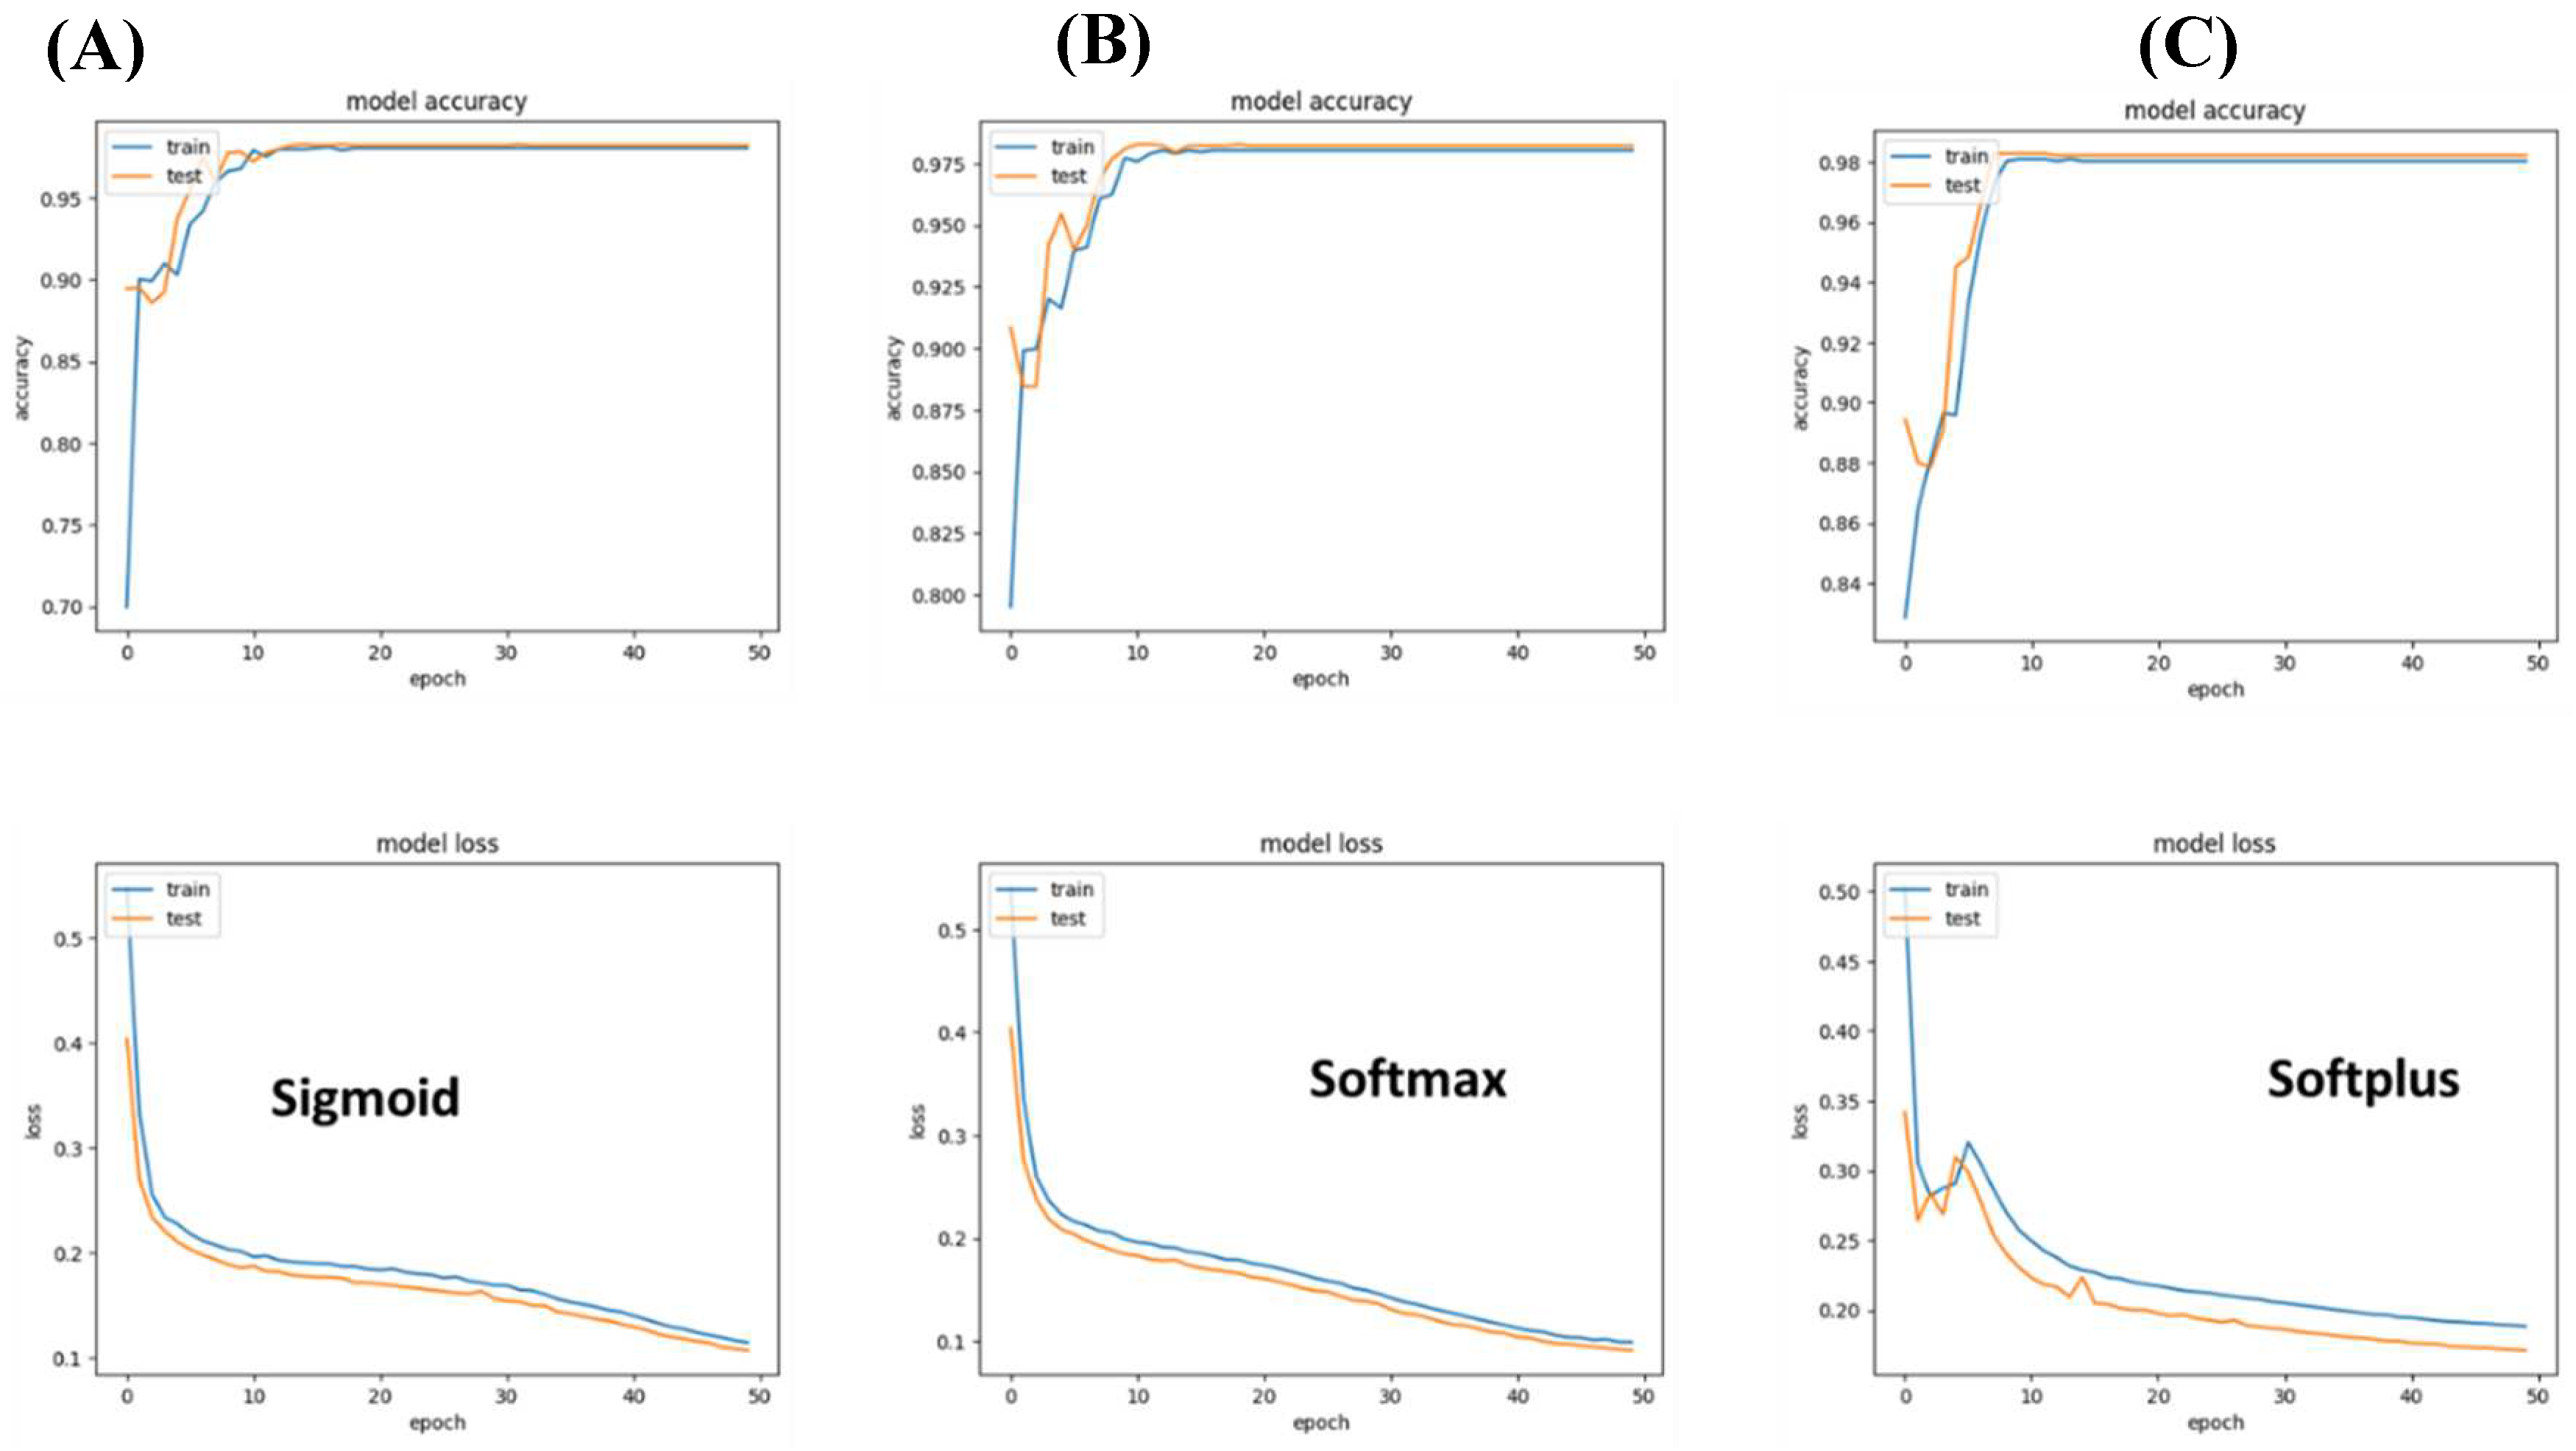
For this, we experimented with three models: a) Sigmoid, b) Softmax, and c) Softplus. The sigmoid model achieved the highest accuracy; however, the validation accuracy did not show any increase in accuracy across epochs of variation. The softplus model was limited, suffering the highest loss. Overall, the Softmax presented the best performance.
Figure 4.
Performance of different networks for differentiating between two brain cancer types. (A) Sigmoid-based networks suffered from a strong variation between training and accuracy. (B) Softmax seems to be the best suited to differentiate between the two brain cancer types that were included in the study. (C) In the case of Softplus, the model suffered a large loss.
C. Classification of execratory system cancers
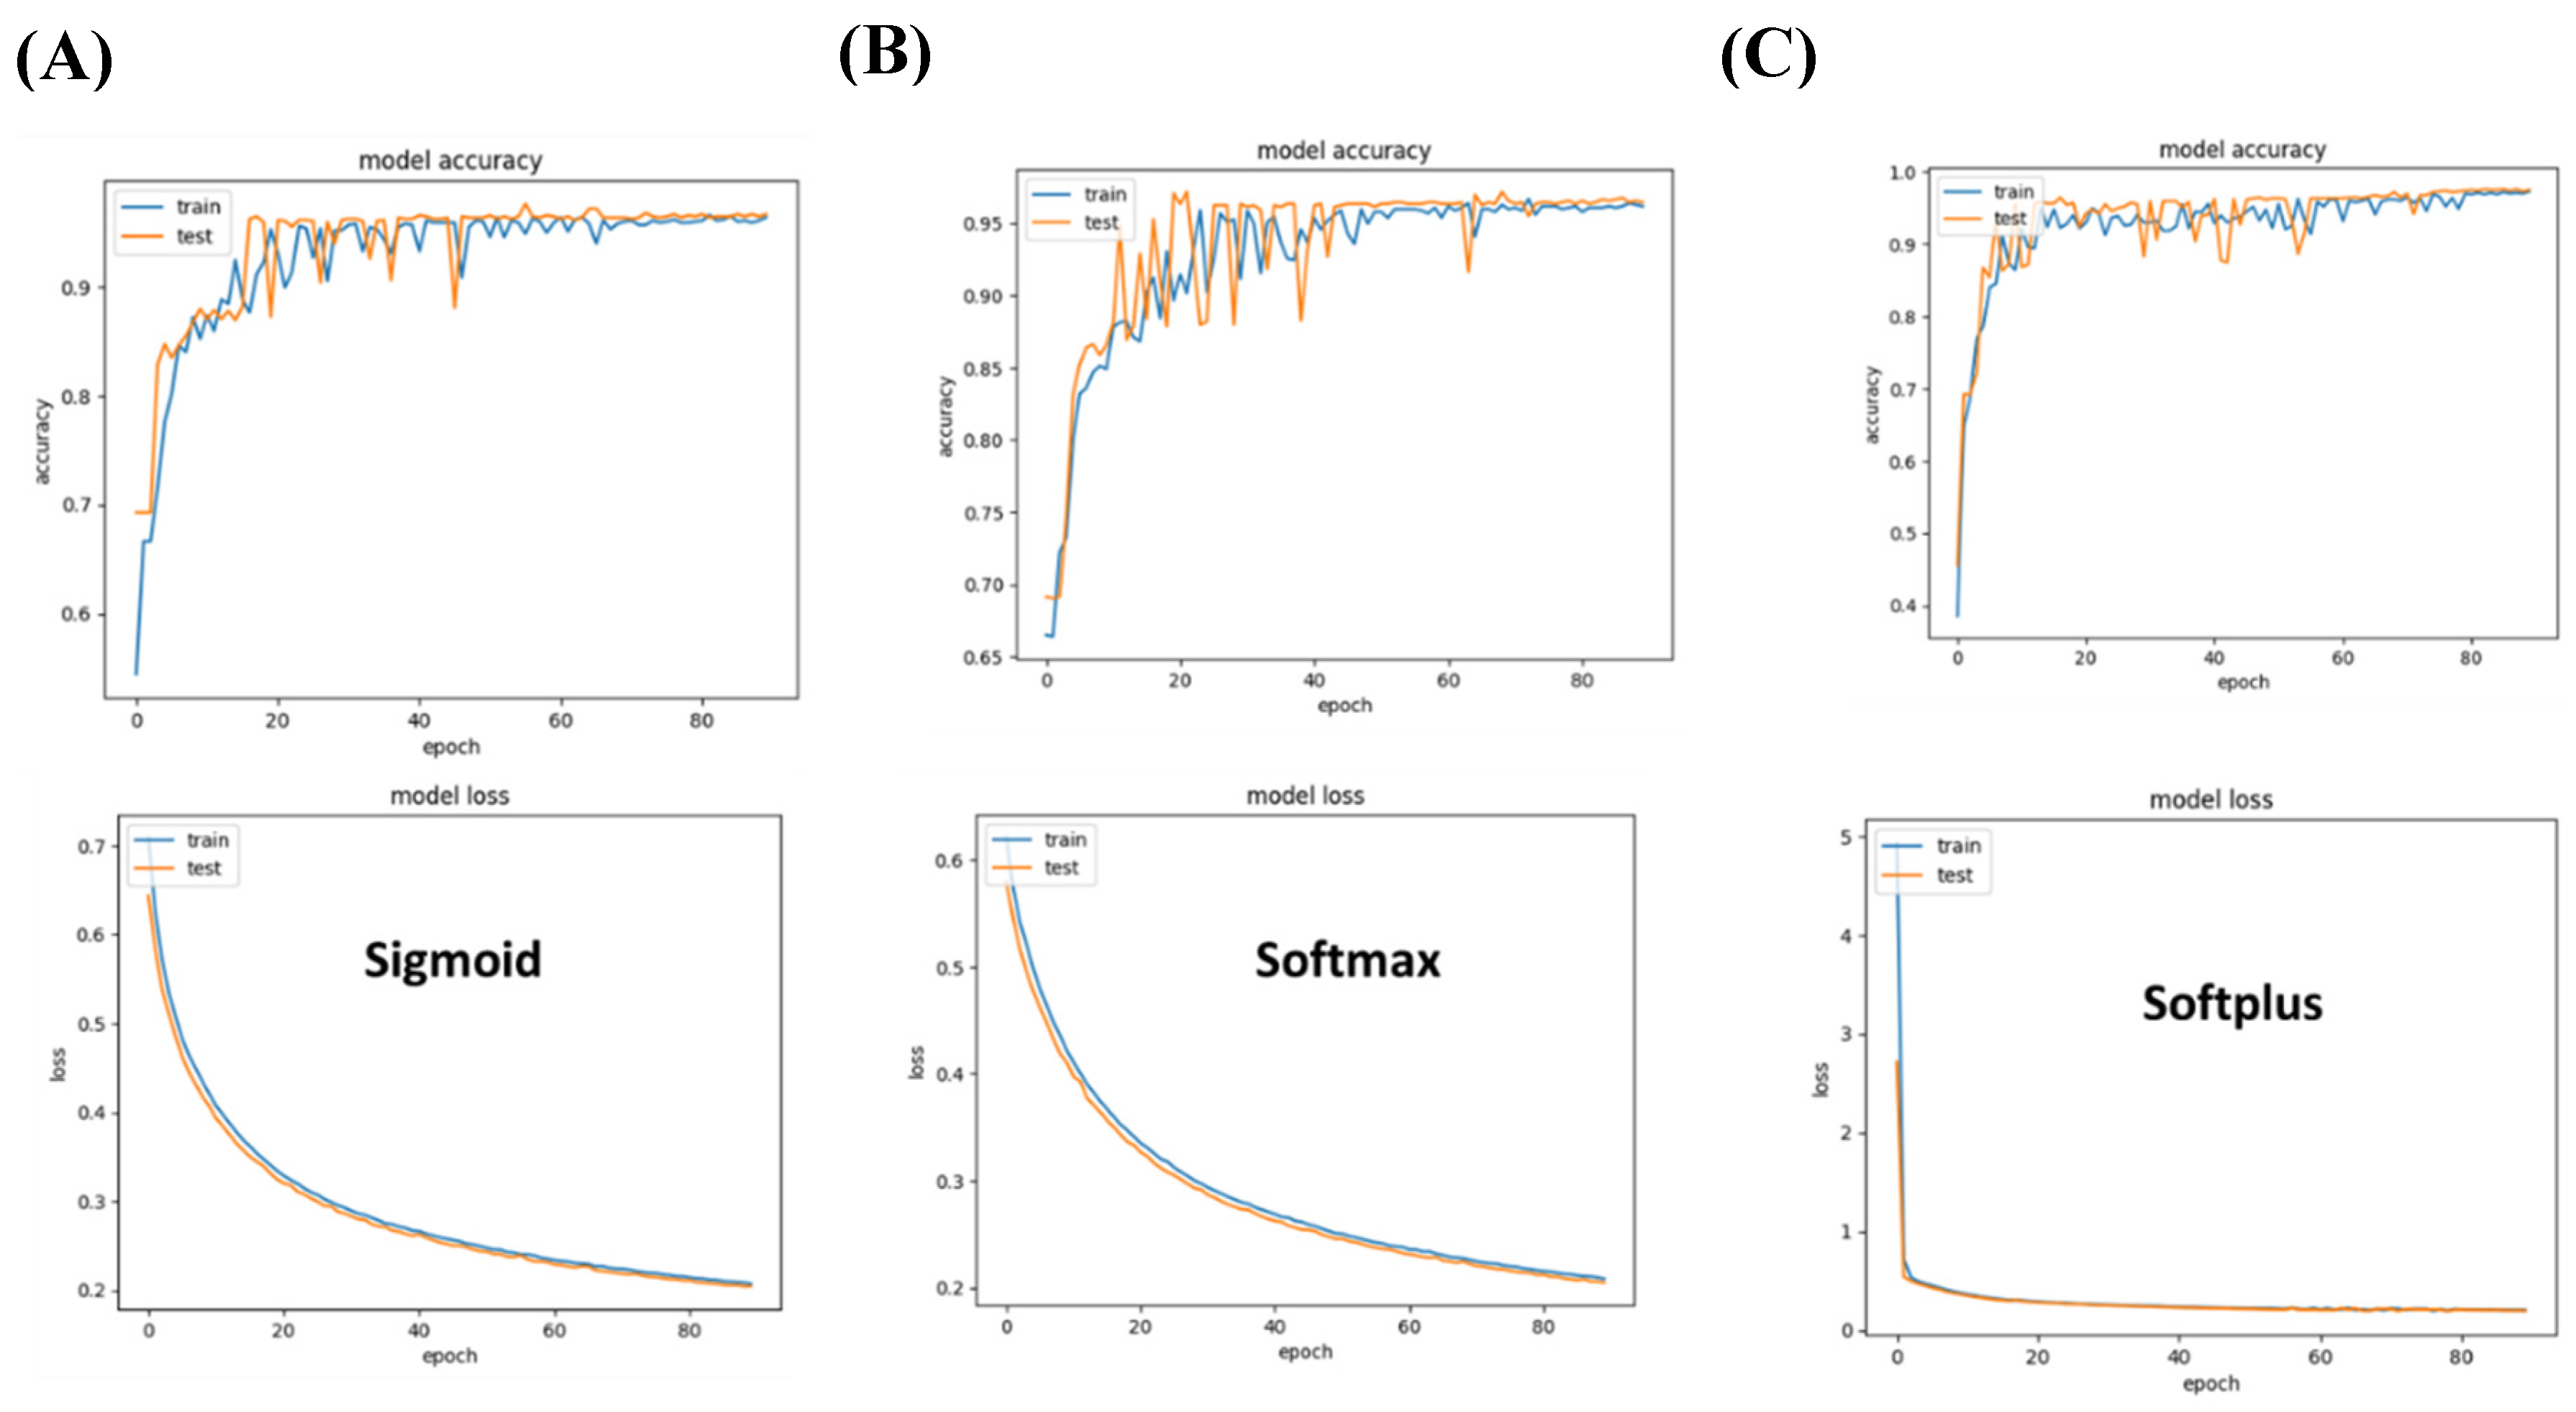
We also investigated binary classification to differentiate between two types of execratory system cancers, namely; Kidney Renal Clear Cell Carcinoma and Bladder Urothelial Carcinoma. As in the other binary classification, we compared the performance of sigmoid, softmax, and Softplus. In agreement with other classifications, we found that a single layer of the Softmax network outperforms other networks both in accuracy and loss during training and validation.
Figure 5.
Performance of specialized models differentiating between two types of execratory system cancers. (A) Sigmoid-based networks achieve an accuracy margin of over 90% on both training and testing datasets. (B) Softmax outperforms sigmoid with 95% accuracy and less than 0.2 (C) Softplus-based models underperform as they suffer from the highest loss in comparison to the other models investigated.
D. Classification of digestive system cancers
We built three different models with sigmoid, softmax, and softplus networks. To increase accuracy, we augmented the networks with a dense layer of Relu activation. Over all, the results show that the three networks achieve over 99%.
Figure 6.
Performance of different networks for differentiating between two digestive cancers. (A) The sigmoid model achieves considerable accuracy and stabilizes after 20 epochs. (B) Similar to the Sigmoid-based network, the softmax network achieves high accuracy and low loss. (C) There does not seem to be a significant difference in performance between softplus-based networks and sigmoid or softmax-based networks in classifying cancer types within the two investigated digestive disease cancers (i.e., cholangiocarcinoma and Colorectal Adenocarcinoma).
E. Classification of Female-specific cancer
We used our pipeline to classify two female-specific cancers namely; Cervical Squamous Cell Carcinoma and Ovarian Serous Cystadenocarcinoma. We compared the performance of our three networks; sigmoid, softmax, and softplus. Overall all networks investigated achieved more than 95% accuracy and lower than 0.2 loss (
Figure 7).
3.3. Hyperparameter tuning
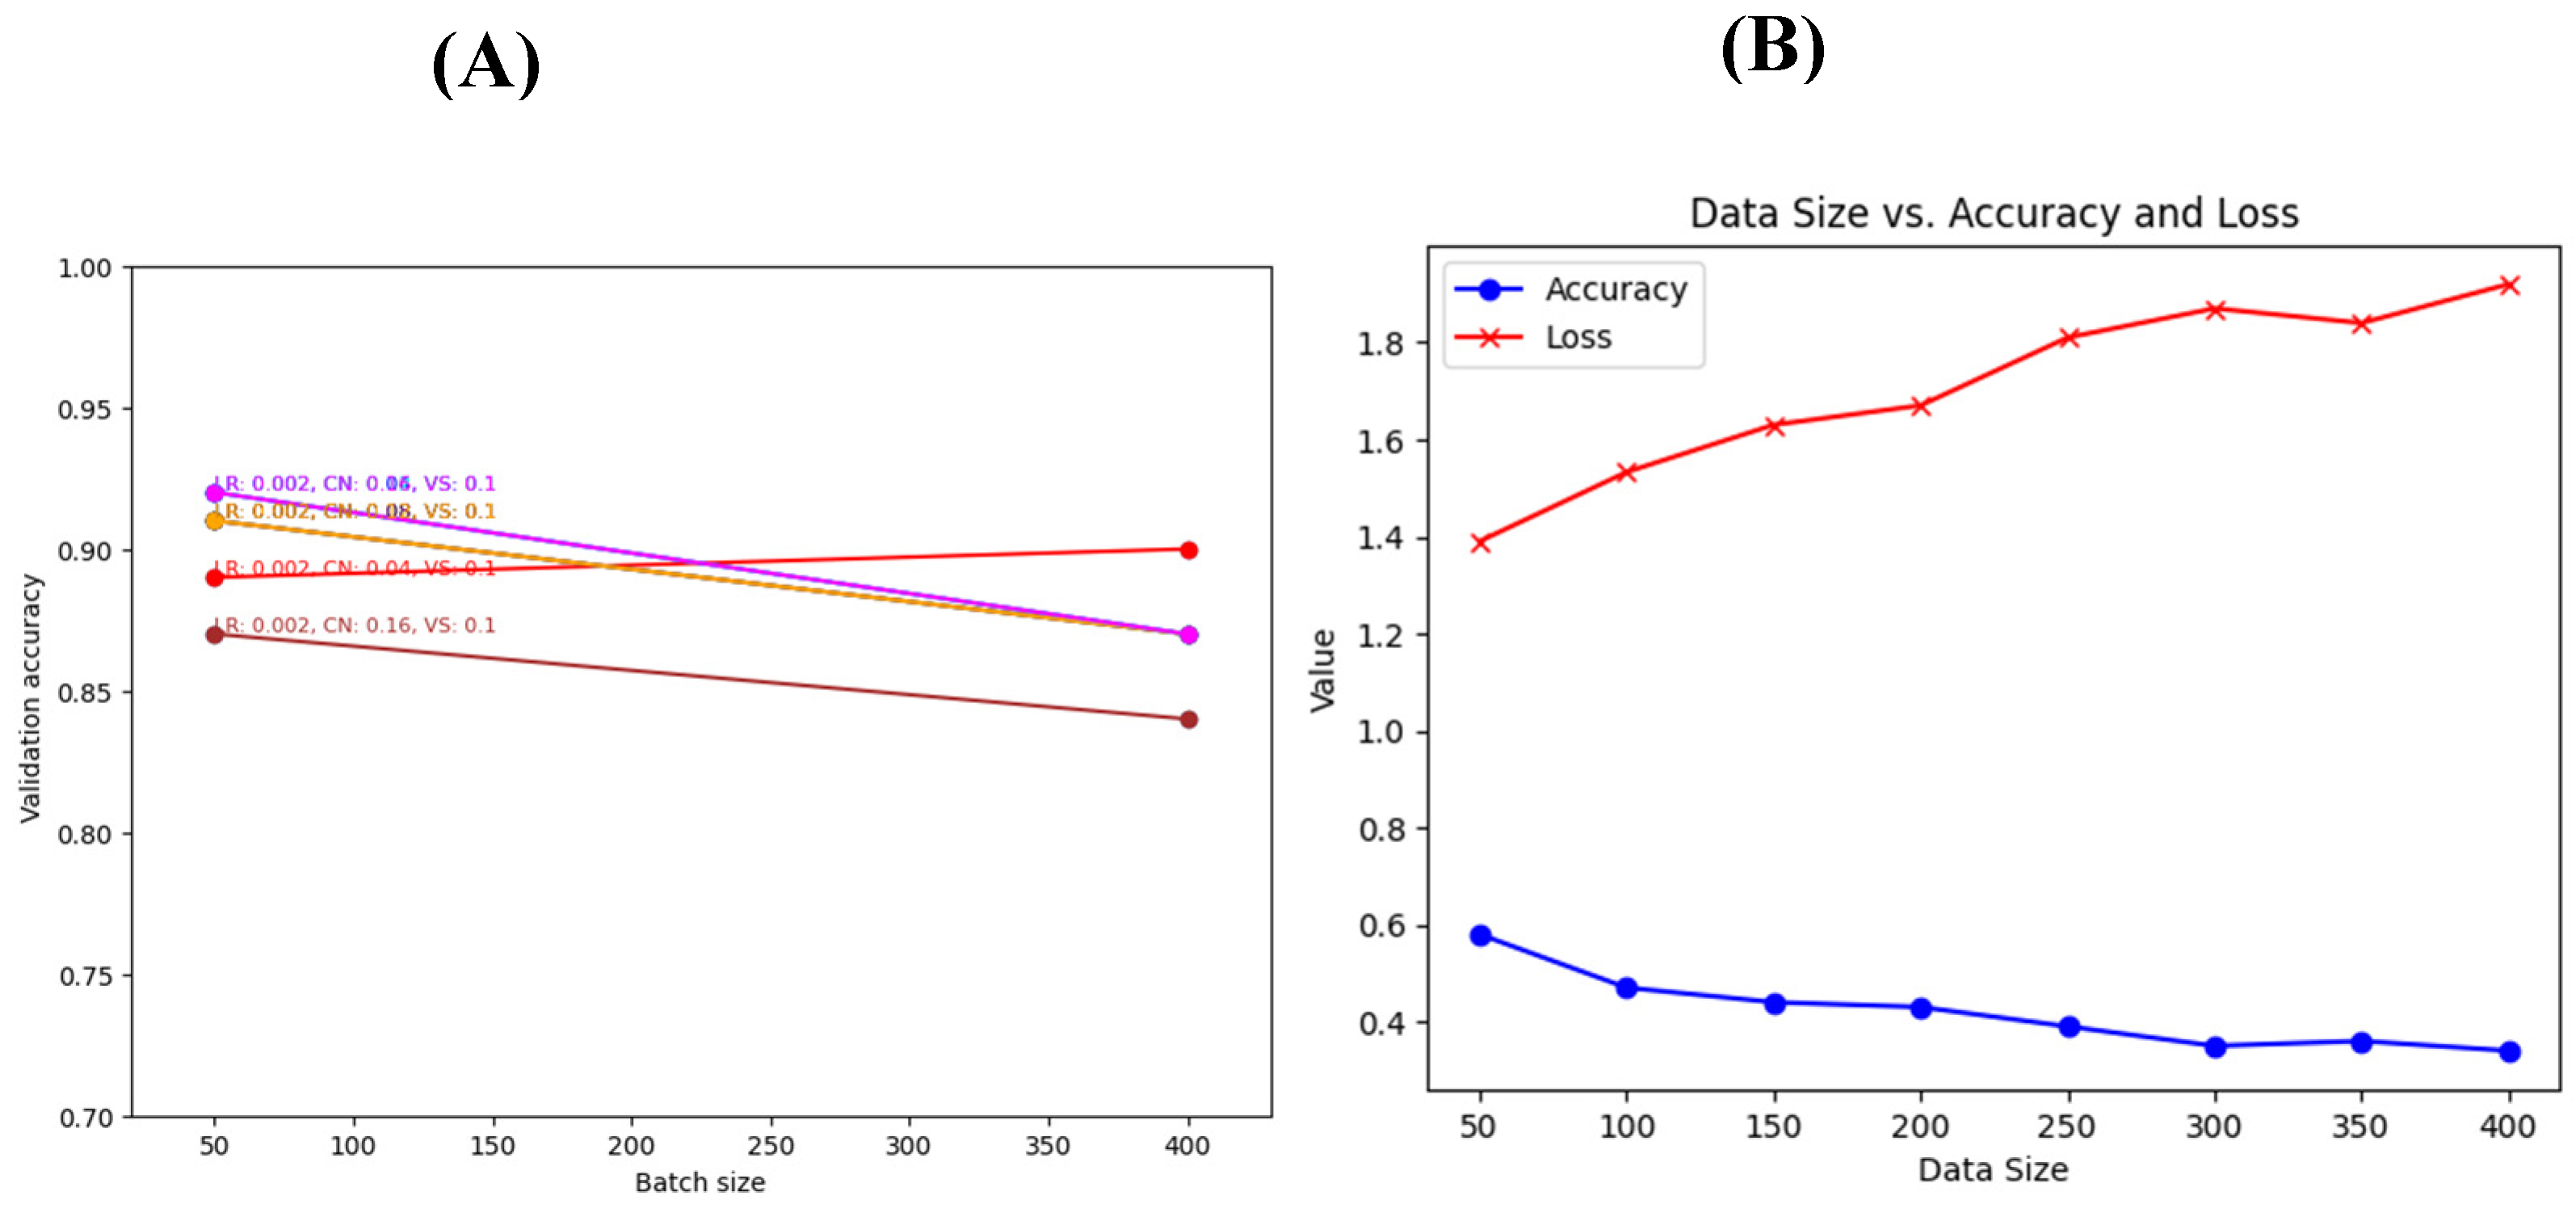
We used a grid search algorithm to search for the parameters that would maximize the accuracy of the classification and minimize the loss for the generalized networks. The parameters that were investigated are the learning rate, learning rate and clip norm, and batch size. Our results show that the best results could be achieved using a batch size of 50, a learning rate of 0.002, a clip norm of 0.08, and a validation split of 0.1. This combination results in over 92% accuracy and less than 0.28 loss (
Figure 8).
3.5. Cross-validation using another dataset and threshold setting
We compared the performance of our two generalized models using an in-house built synthetic dataset. The synthetic dataset copies the essence of the original dataset based on the chromosome location, strand, CNA values, and cancer type. To determine the best threshold for accepting a prediction as a tag for a certain cancer type, we investigated the threshold versus the mean accuracy. Both versions of Model 1 (with and without the conv2D network) achieved an accuracy of 0.750.35 at different threshold levels
4. Discussion
In the quest for advancing cancer diagnosis and personalized treatment, identifying the precise origin of cancer becomes of paramount importance. Cancer is a complex disease with diverse manifestations, and determining its primary site can significantly impact patient care and treatment outcomes. Chromosomal copy number alterations (CNA) data, offering insights into genetic changes, have emerged as valuable tools in unraveling the intricate molecular landscape of cancer. By harnessing the power of deep learning models, we sought to explore the potential of CNA data in accurately pinpointing the origin of metastatic cancers [
12,
13]. Our study sheds light on the promise of leveraging computational approaches to revolutionize cancer diagnostics and empower oncologists and pathologists with more reliable and efficient methods for determining cancer origin and guiding tailored therapeutic strategies
In our comprehensive study, we harnessed the power of two generalized models: Conv2D+ReLU and SELU+ReLU, both culminating with the softmax activation function. The Conv2D+ReLU model has been widely used due to its effectiveness in feature extraction and pattern recognition while SELU activation has shown promise in reducing vanishing/exploding gradients and promoting self-normalization, enhancing learning in deep neural networks. Surprisingly, our experiments on diverse datasets did not reveal any significant difference in accuracy or loss between these models. Both models exhibited remarkable performance, achieving over 90% accuracy and less than 0.25 loss. The lack of discernible differences underscores the robustness and versatility of both approaches. Furthermore, we applied our methodology to develop smaller, binary-based models specialized in differentiating between specific cancer types, such as male-specific and female-specific cancers. The achieved accuracy of 95% indicates the potential of our approach in cancer classification, particularly in scenarios where precise identification is crucial. Our findings suggest that our approach could significantly impact cancer diagnosis, particularly in identifying the primary cancer site of metastasis using simple clinical tests. This has the potential to revolutionize cancer diagnosis, assisting oncologists and pathologists in making accurate and timely decisions for patient care. As we continue to refine and optimize our models, incorporating feedback from domain experts and implementing advancements in deep learning research, we anticipate even higher accuracies and enhanced clinical utility for cancer diagnosis.
While our study demonstrates promising results in utilizing deep learning models for cancer classification and origin prediction, several limitations warrant consideration. The primary limitation lies in the large standard deviations observed during validation on the synthetic dataset. These variations could be attributed to the nature of synthetic data generation and the inherent challenges of accurately simulating real-world complexities present in actual patient data.
In future directions, we propose investigating the potential synergy of multimodal data integration. Combining CNA data with other omics data, such as gene expression profiles or epigenetic signatures, may yield more comprehensive and nuanced insights into cancer classification and origin determination.
5. Conclusions
This research article highlights the significance of Copy Number Alterations (CNA) as valuable genomic markers for accurate identification of the primary tumor origin in metastatic cancer cases. Utilizing advanced AI-based techniques, the study achieved impressive accuracies of over 90% and approximately 95% for the generalized and specialized models, respectively, with minimal loss values, demonstrating the potential of AI-driven approaches in improving metastatic cancer diagnosis and personalized treatment strategies.
References
- Łazarczyk, M.; Mickael, M.E.; Skiba, D.; Kurzejamska, E.; Ławiński, M.; Horbańczuk, J.O.; Radziszewski, J.; Fraczek, K.; Wolinska, R.; Paszkiewicz, J.; et al. The Journey of Cancer Cells to the Brain: Challenges and Opportunities. Int. J. Mol. Sci. 2023, 24, 3854. [Google Scholar] [CrossRef] [PubMed]
- Lyden, D.; Ghajar, C.M.; Correia, A.L.; Aguirre-Ghiso, J.A.; Cai, S.; Rescigno, M.; Zhang, P.; Hu, G.; Fendt, S.M.; Boire, A.; et al. Metastasis. Cancer Cell 2022. [CrossRef] [PubMed]
- Nimmakayala, R.K.; Batra, S.K.; Ponnusamy, M.P. Unraveling the Journey of Cancer Stem Cells from Origin to Metastasis. Biochim. Biophys. Acta - Rev. Cancer 2019. [Google Scholar] [CrossRef] [PubMed]
- Kato, S.; Alsafar, A.; Walavalkar, V.; Hainsworth, J.; Kurzrock, R. Cancer of Unknown Primary in the Molecular Era. Trends in Cancer 2021. [CrossRef] [PubMed]
- Karim, M.R.; Rahman, A.; Jares, J.B.; Decker, S.; Beyan, O. A Snapshot Neural Ensemble Method for Cancer-Type Prediction Based on Copy Number Variations. Neural Comput. Appl. 2020. [Google Scholar] [CrossRef]
- Navin, N.; Kendall, J.; Troge, J.; Andrews, P.; Rodgers, L.; McIndoo, J.; Cook, K.; Stepansky, A.; Levy, D.; Esposito, D.; et al. Tumour Evolution Inferred by Single-Cell Sequencing. Nature 2011. [Google Scholar] [CrossRef] [PubMed]
- Nicoś, M.; Krawczyk, P. Genetic Clonality as the Hallmark Driving Evolution of Non-Small Cell Lung Cancer. Cancers (Basel). 2022. [CrossRef] [PubMed]
- Wu, H.J.; Temko, D.; Maliga, Z.; Moreira, A.L.; Sei, E.; Minussi, D.C.; Dean, J.; Lee, C.; Xu, Q.; Hochart, G.; et al. Spatial Intra-Tumor Heterogeneity Is Associated with Survival of Lung Adenocarcinoma Patients. Cell Genomics 2022. [Google Scholar] [CrossRef] [PubMed]
- Ding, X.; Tsang, S.Y.; Ng, S.K.; Xue, H. Application of Machine Learning to Development of Copy Number Variation-Based Prediction of Cancer Risk. Genomics Insights 2014. [Google Scholar] [CrossRef] [PubMed]
- Zhang, N.; Wang, M.; Zhang, P.; Huang, T. Classification of Cancers Based on Copy Number Variation Landscapes. Biochim. Biophys. Acta - Gen. Subj. 2016. [Google Scholar] [CrossRef] [PubMed]
- Elsadek, S.F.A.; Makhlouf, M.A.A.; Aldeen, M.A. Supervised Classification of Cancers Based on Copy Number Variation. In Proceedings of the Advances in Intelligent Systems and Computing; 2019. [Google Scholar] [CrossRef]
- Kubick, N.; Pajares, M.; Enache, I.; Manda, G.; Mickael, M.-E. Repurposing Zileuton as a Depression Drug Using an AI and In Vitro Approach. Molecules 2020, 25, 2155. [Google Scholar] [CrossRef] [PubMed]
- Lazarczyk, M.; Duda, K.; Mickael, M.E.; AK, O.; Paszkiewicz, J.; Kowalczyk, A.; Horbańczuk, J.O.; Sacharczuk, M. Adera2.0: A Drug Repurposing Workflow for Neuroimmunological Investigations Using Neural Networks. Molecules 2022, 27. [Google Scholar] [CrossRef] [PubMed]
|
Disclaimer/Publisher’s Note: The statements, opinions and data contained in all publications are solely those of the individual author(s) and contributor(s) and not of MDPI and/or the editor(s). MDPI and/or the editor(s) disclaim responsibility for any injury to people or property resulting from any ideas, methods, instructions or products referred to in the content. |
© 2023 by the authors. Licensee MDPI, Basel, Switzerland. This article is an open access article distributed under the terms and conditions of the Creative Commons Attribution (CC BY) license (https://creativecommons.org/licenses/by/4.0/).
