1. Introduction
Diabetes, a chronic metabolic condition characterised by persistent hyperglycaemia, is becoming a major global health concern. This condition profoundly impacts societies and healthcare systems around the globe, causing both economic and societal disruptions [
1,
2]. The situation is particularly critical in Oman and the Middle East at large, where the prevalence of diabetes has shown an alarming increase, leading to significant socioeconomic burdens [
3]. The importance of early diabetes detection is well established, as this condition often goes unnoticed until complications develop, underscoring the need for proactive detection and early intervention. Traditional diagnostic methods for diabetes, such as fasting plasma glucose, oral glucose tolerance tests, and Haemoglobin A1c tests, are reliant on the symptomatic manifestation, typically presenting in the disease's more severe stages [
1].
The recent breakthroughs in machine learning and deep learning offer a transformative approach to medical prognosis and diagnosis, unlocking unprecedented prospects for disease prediction, including diabetes. Among the novel technologies, Convolutional Neural Networks (CNN), a subset of deep learning algorithms, have displayed significant efficacy. CNNs, along with other machine learning models, can process and analyse extensive medical data, identifying intricate patterns and correlations that can be challenging for human clinicians to perceive. These models can potentially anticipate early signs of diabetes, possibly leading to earlier diagnosis, treatment, and enhanced patient outcomes [
1,
2,
3].
With the promising potential of machine learning in diagnosing diabetes, this research aims to put forth an innovative Convolutional Neural Network Model architecture dedicated to early diabetes prediction. The model will make use of a newly collected clinical dataset from Oman, aspiring to achieve high accuracy in predicting type 2 diabetes. By focusing on a region-specific dataset, the study intends to enhance health outcomes for those at risk of developing diabetes in Oman and the wider Middle East [
4,
5,
6].
This research aims to contribute significantly to the worldwide effort to fight diabetes through thorough model development, validation, and performance optimisation. The findings can potentially affect healthcare providers, policymakers, and researchers, with the goal of strengthening early detection strategies and reducing the severe health implications of late-stage diabetes. In the end, the newly proposed CNN model can be a promising tool for diagnosing diabetes, offering critical insights for personalised and proactive diabetes management.
2. Related Studies
Several studies discussed in this literature review provide valuable insights into the successes and challenges associated with the use of Convolutional Neural Networks (CNNs) in disease prediction, with a particular emphasis on diabetes. The rise of machine learning and deep learning technologies has propelled advancements in disease prediction and health informatics. Among these advancements, CNNs, celebrated for their efficacy in image recognition, have increasingly been utilized for disease prediction [
8,
9]. Their application in diabetes prediction and management has shown considerable promise, albeit with room for enhancement.
For instance, one study leveraged CNNs to predict diabetes remission following gastric bypass surgery, showcasing greater prediction accuracy compared to traditional indices [
10]. However, due to potential regional differences in health factors, these findings may not be universally applicable. Another promising technique combined numerical data and images based on feature importance, employing ResNet CNN models for early diabetes diagnosis [
8]. This approach surpassed prior methods by achieving prediction accuracies between 77.37% and 90.04% on the PIMA Indian dataset.
A different study combined CNNs and Long Short-Term Memory (LSTM) models to predict diabetes, demonstrating high accuracy [
10]. Despite this, the study recommended incorporating other classifiers and developing hybrid models to boost diabetes prediction capabilities. CNNs have also shown promise in predicting blood glucose levels. One research revealed a CNN model outperformed LSTM models for blood glucose level prediction [
11]. Similarly, a combined CNN-LSTM model excelled in accuracy and error rates for short-term blood glucose level forecasts. However, the model's performance declined for longer-term predictions, indicating the need for larger datasets and strategies to manage missing data [
12]. Comparatively, studies like [
13] continue to explore the use of CNN with different activation functions for diabetes prediction. Such works might bring further insights into how to optimize the usage of CNN for better performance.
Beyond diabetes, CNNs have found applications in epidemiological forecasting. One study used one-dimensional CNN models for predicting influenza-like illness (ILI) data, demonstrating comparable or superior capabilities to recurrent neural networks (RNNs) [
14]. These results underscore the potential of CNNs in epidemiological forecasting but necessitate further research to extend these findings to other diseases.
One research paper utilized a Deep 1D-Convolutional Neural Network (DCNN) for classifying diabetes mellitus in an imbalanced dataset with missing values [
15]. This study combined outlier detection to handle missing values and oversampling (SMOTE) to address class imbalance, showing the effectiveness of the DCNN algorithm in diabetes classification.
However, CNN applications extend beyond diabetes and heart disease prediction [
16,
17], illustrating their versatility in disease prediction beyond diabetes. CNNs have also been proven useful in the diagnosis and prognosis of COVID-19, leveraging medical imaging such as X-ray and computed tomography (CT) scans [
18]. The study in question explored various CNN models, underlining the critical role of medical imaging in corroborating RT-PCR tests. These findings point towards the broader potential of CNNs for efficient COVID-19 diagnosis and prognosis.
Additionally, the application of CNNs has found relevance in environmental health sectors, such as water quality monitoring. CNNs have been utilized to interpret 2D fluorescence spectra without the need for dimensionality reduction, showcasing their ability to accurately predict disinfection by-product (DBP) formation potential based on fluorescence EEMs [
19]. Although this application deviates from disease prediction, it introduces an exciting direction for the use of CNNs.
In a more comprehensive context, CNNs are being employed for a variety of applications. These include computer vision, image recognition, and medical image analysis, underscoring their significance and potential in predictive analytics and healthcare data science [
20]. Therefore, the potential of CNNs in disease prediction, particularly diabetes, is apparent. Nevertheless, more research is required to refine and adapt these models to enhance their predictive accuracy and utility, ensuring they provide the most significant benefit to the healthcare sector.
3. Materials and Methods
The The methodology followed in this study is a systematic sequence of events designed to predict diabetes using Convolutional Neural Networks (CNN). A specific dataset from Oman has been utilized to train, validate, and test the model. The methodology includes steps such as loading and pre-processing the dataset and designing a custom 4D CNN architecture.
3.1. Dataset
Files The dataset used in this study was meticulously collected, validated, and prepared by drawing from multiple reliable sources of diabetes-related data in Oman. To ensure the accuracy and relevance of the findings derived from the dataset, strict compliance with ethical guidelines was followed, and advanced tools were employed for data handling [
21].
3.1.1. Data Collection
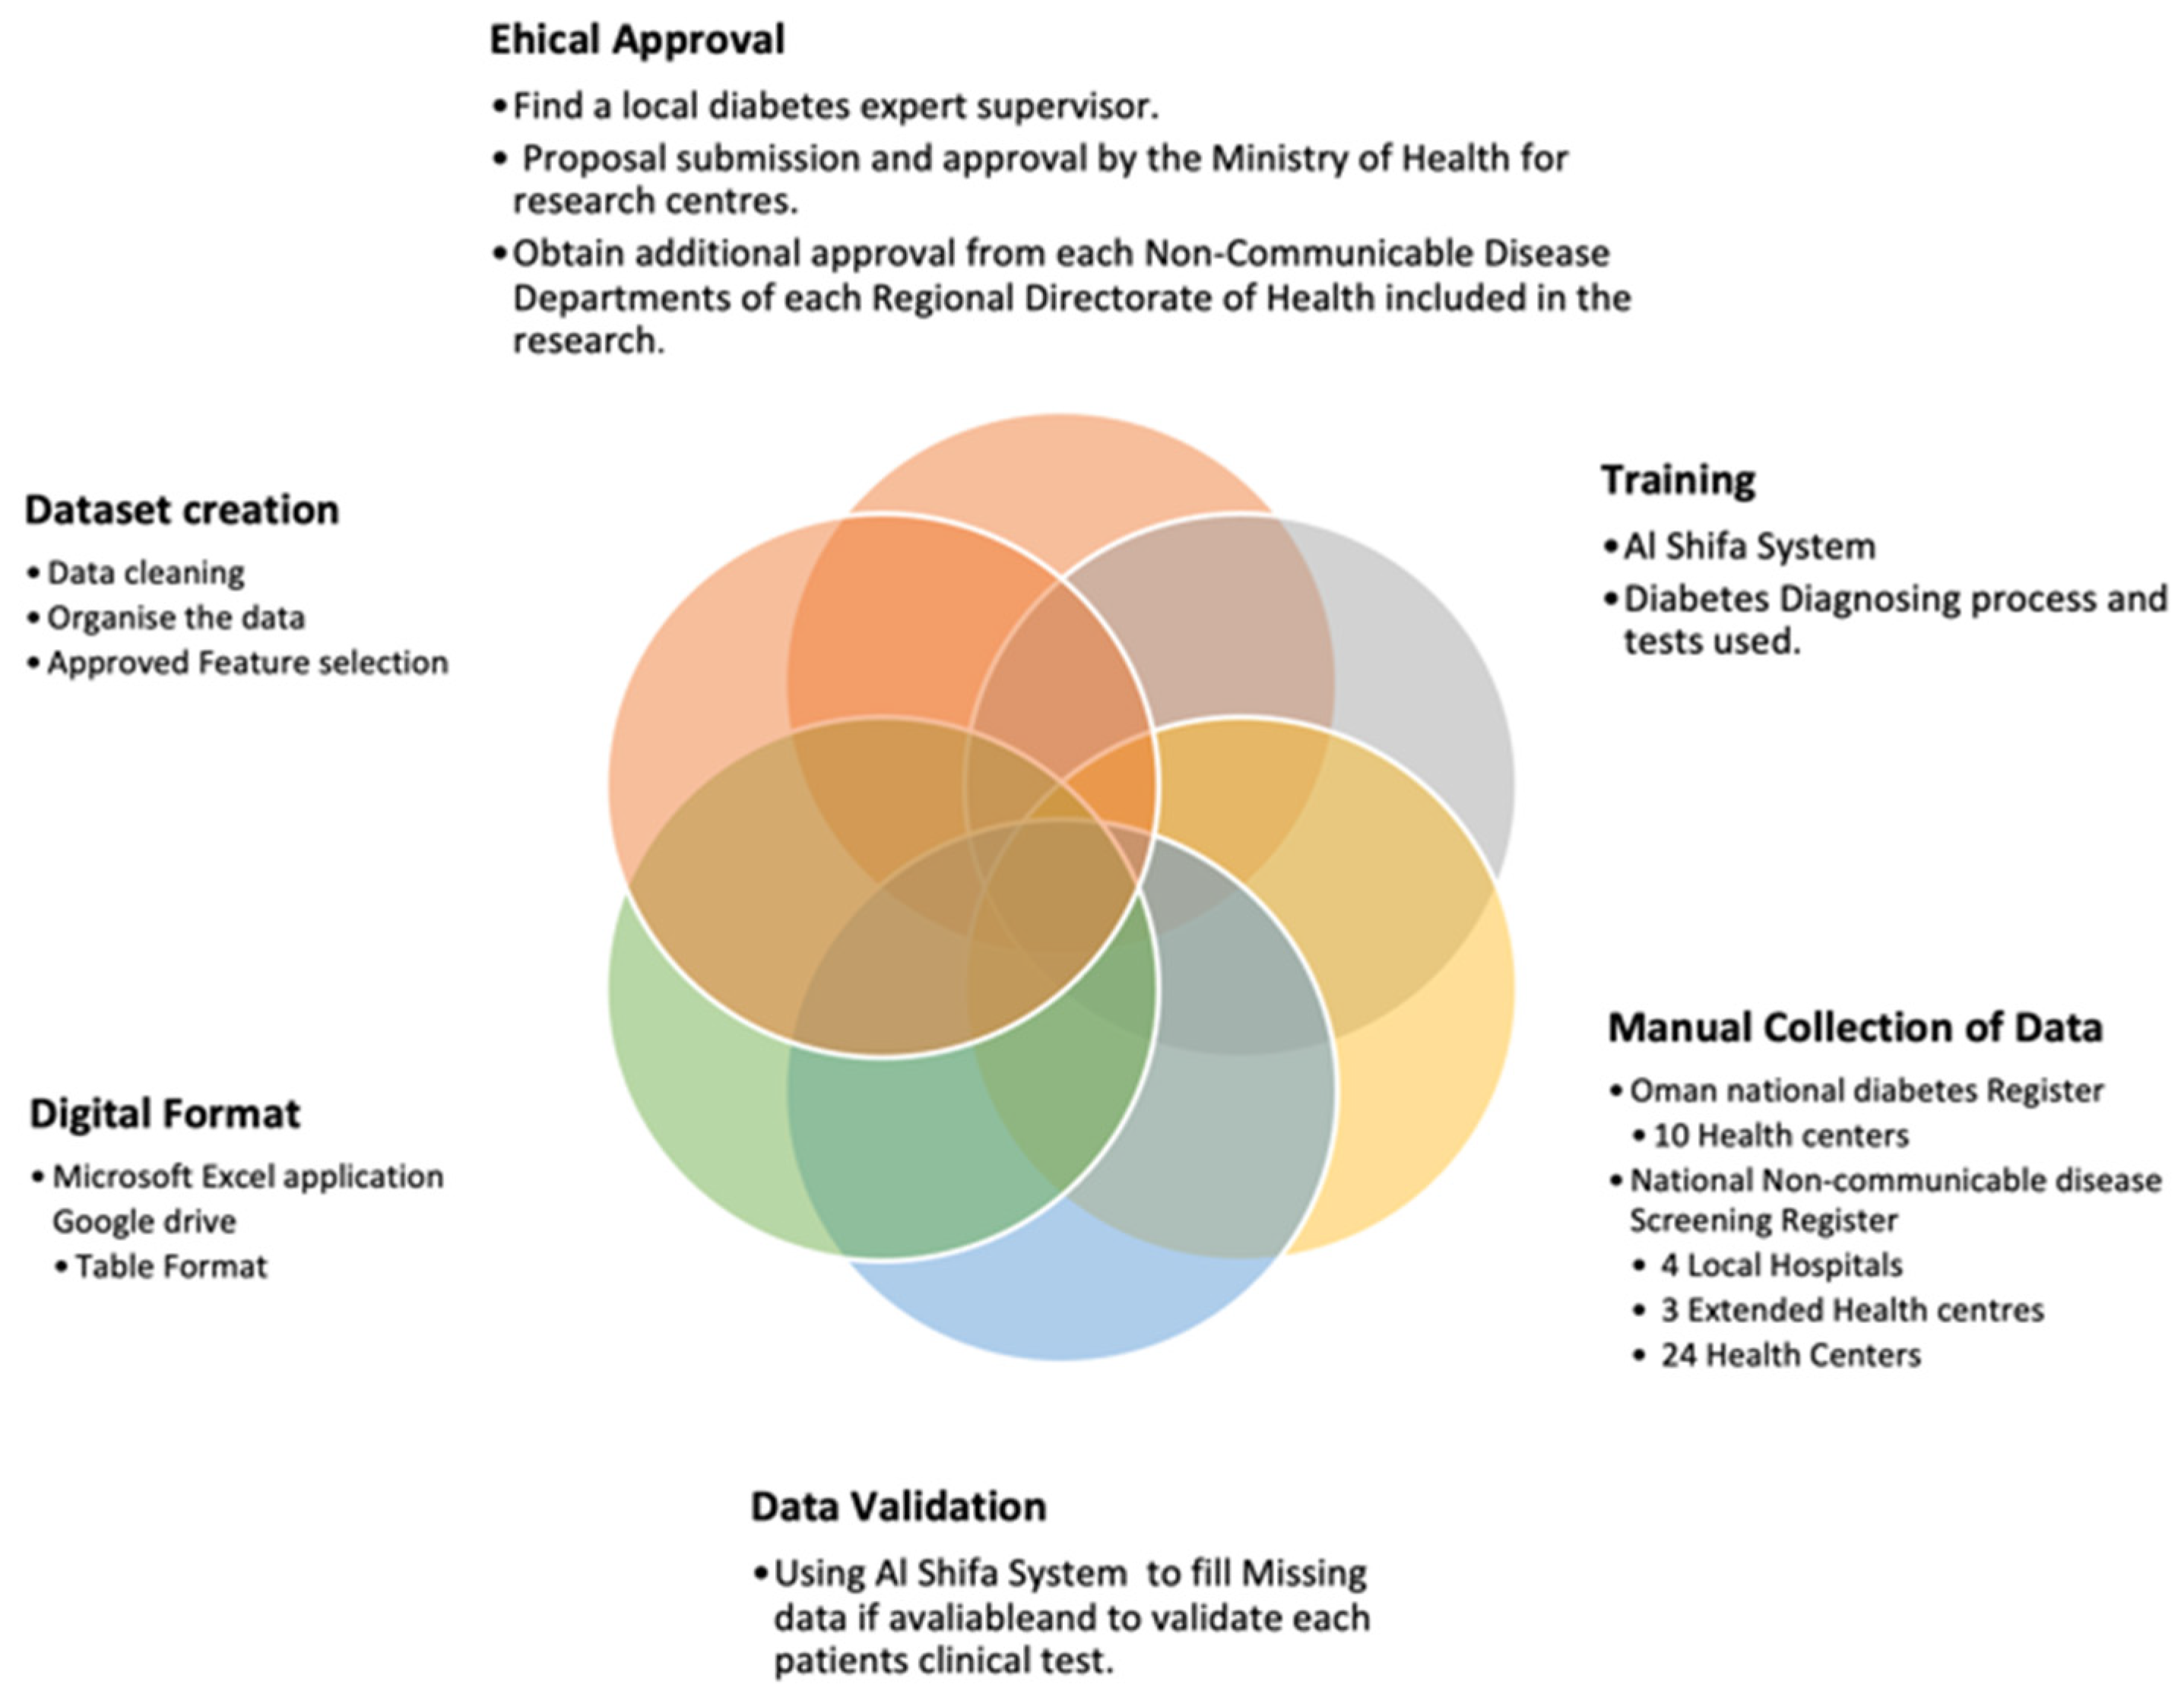
The data collection process in
Figure 1. began with obtaining ethical approval, which involved finding a local diabetes expert supervisor and submitting a research proposal for approval by the Ministry of Health and the relevant health departments. Additional approvals were obtained from each Non-Communicable Disease Department of the Regional Directorates of Health participating in the research [
21] The researchers leveraged the Al Shifa System, the national diabetes Register, and the National Non-communicable Disease Screening Register to manually collect data from 41 healthcare facilities. These facilities included 34 primary care health centres, 3 secondary care Extended Health Centres, and 4 local hospitals [
22,
23].
3.1.2. Data Validation
Al In the process of creating the dataset for our healthcare research, the Al Shifa System, an advanced healthcare information system in Oman, played a pivotal role. Al Shifa is an extensive local healthcare information management system that integrates electronic medical records and provides a comprehensive view of patient history and clinical data [
21]. This system is accessible across more than 200 healthcare facilities, including both Ministry of Health (MOH) and non-MOH establishments [
24].
Our dataset incorporated data manually collected from 41 healthcare facilities. To ensure the validity and integrity of the data, Al Shifa proved to be instrumental. Given its widespread access across healthcare facilities and the integration of a holistic view of patient history and clinical data, it facilitated a robust validation process for the data collected. It served as a reference point to cross-check and validate the clinical test results of each patient included in our dataset [
25]. Moreover, the Al Shifa system was leveraged to fill in any missing data when available, thus contributing to the completeness and comprehensiveness of the dataset. Its seamless information exchange among service departments made it possible to reduce any inconsistencies or gaps in the collected data [
26].
Upon the completion of the validation process and filling in of any missing data, the verified dataset was converted into a soft copy using Microsoft Excel. This format ensures the data's accessibility and ease of use for further analysis and study.
3.1.3. Dataset Creation and Cleaning
In the exploratory data analysis stage, the dataset was loaded into MATLAB. The "Oman dataset" file was loaded using MATLAB's “readtable” function, which allowed for easy manipulation and handling of the data. Import specifications were defined using the “spreadsheetImportOptions” function, specifying the number of variables, the sheet to import from, the range of data to import, variable names, and variable types. The study focused on 13 variables of the 'double' type, representing the health-related factors under investigation [
21,
27].
3.1.4. Data Acquisition
The dataset used in this study was sourced from various health centres in Oman. It consisted of 13,224 records spanning across 13 variables, namely: Age, Weight, Height, BMI, WC, T_Cholesterol, BP, RPG, FPG, FH, PH, Gender, and Outcome. This comprehensive dataset provided a solid foundation for the exploration of factors influencing diabetes outcomes in the patient population [
21,
28].
3.1.5. Approved Feature Selection
The variable selection process in this study was guided by the criteria set by the Ministry of Health in Oman for diagnosing Diabetes. This included factors such as age, weight, height, body mass index, waist circumference, total cholesterol, blood pressure, random plasma glucose, fasting plasma glucose, family history of diabetes, personal history of diabetes, and gender of the patient. All these factors were deemed significant based on their role in the diagnosis and treatment of Diabetes, guided by the expertise of a supervising diabetes physician [
29].
In data analysis, it is often necessary to convert categorical data to numeric data for further analysis or modelling. In this study, the MATLAB programming language was used to accomplish this task. The process began by creating a categorical variable for each unique outcome in the dataset. This was achieved by using MATLAB's "categorical" function, which assigns a unique category to each distinct value in the "Outcome" column. This transformation facilitates the efficient representation and manipulation of the nonnumeric data within a finite set of discrete categories [
30].
Next, the "grp2idx" function was utilized to convert these categorical labels into numeric labels. This function assigns a unique numeric value to each category, starting from 1, and following the order of appearance of the categories in the categorical array. The converted numeric labels effectively replaced the original categorical labels, which could then be used for order assigned by this function does not correspond to the original values but provides a simplified form suitable for further statistical computations [
31,
32].
This conversion process is integral to the flexibility of data representation and manipulation within MATLAB, allowing for versatile conversions between numeric arrays, strings, character arrays, dates, and times, amongst others. The process is particularly critical when treating variables as categorical for certain modelling functions while needing them as continuous variables for other analyses [
33].
Table 1. outlines the features that were approved and selected for the study.
This selection of features enables a comprehensive exploration of This selection of features enables a comprehensive exploration of the factors influencing diabetes outcomes in the patient population [
21,
27].
3.2. Filling Missing Data
In our dataset, missing values are indeed a common occurrence, a commonality shared by most real-world datasets, which requires meticulous handling to maintain the integrity of the analysis. With the use of the ismissing function, we identified the missing values by generating a logical array that maps out the location of these missing entries. Each column's missing values were subsequently tabulated and printed to the console [
34,
35]. The summary of missing data in the table is presented below:
Table 2.
Missing values.
| Features |
Age |
Weight |
Height |
BMI |
WC |
T_Cholesterol |
BP |
RPG |
FPG |
FH |
PH |
Gender Encoded |
Outcome |
| Missing values |
765 |
8 |
2 |
137 |
2117 |
167 |
12 |
3793 |
3813 |
102 |
84 |
0 |
0 |
Our next objective was to understand the statistical characteristics of each variable. The statistical summary reveals various critical parameters, such as the minimum, median, and maximum values for each variable, inclusive of their respective missing values. For instance, the 'Age' variable ranges from 4 to 113 with a median of 42, while the 'Weight' variable, exhibits a broader range, spanning from 0 to 186, with a median of 74. A couple of variables like 'RPG' also have missing values, identified for handling in the subsequent steps. Lastly, our 'Outcome' variable, representing the presence or absence of diabetes, is a binary variable taking values of either 0 or 1 [
36].
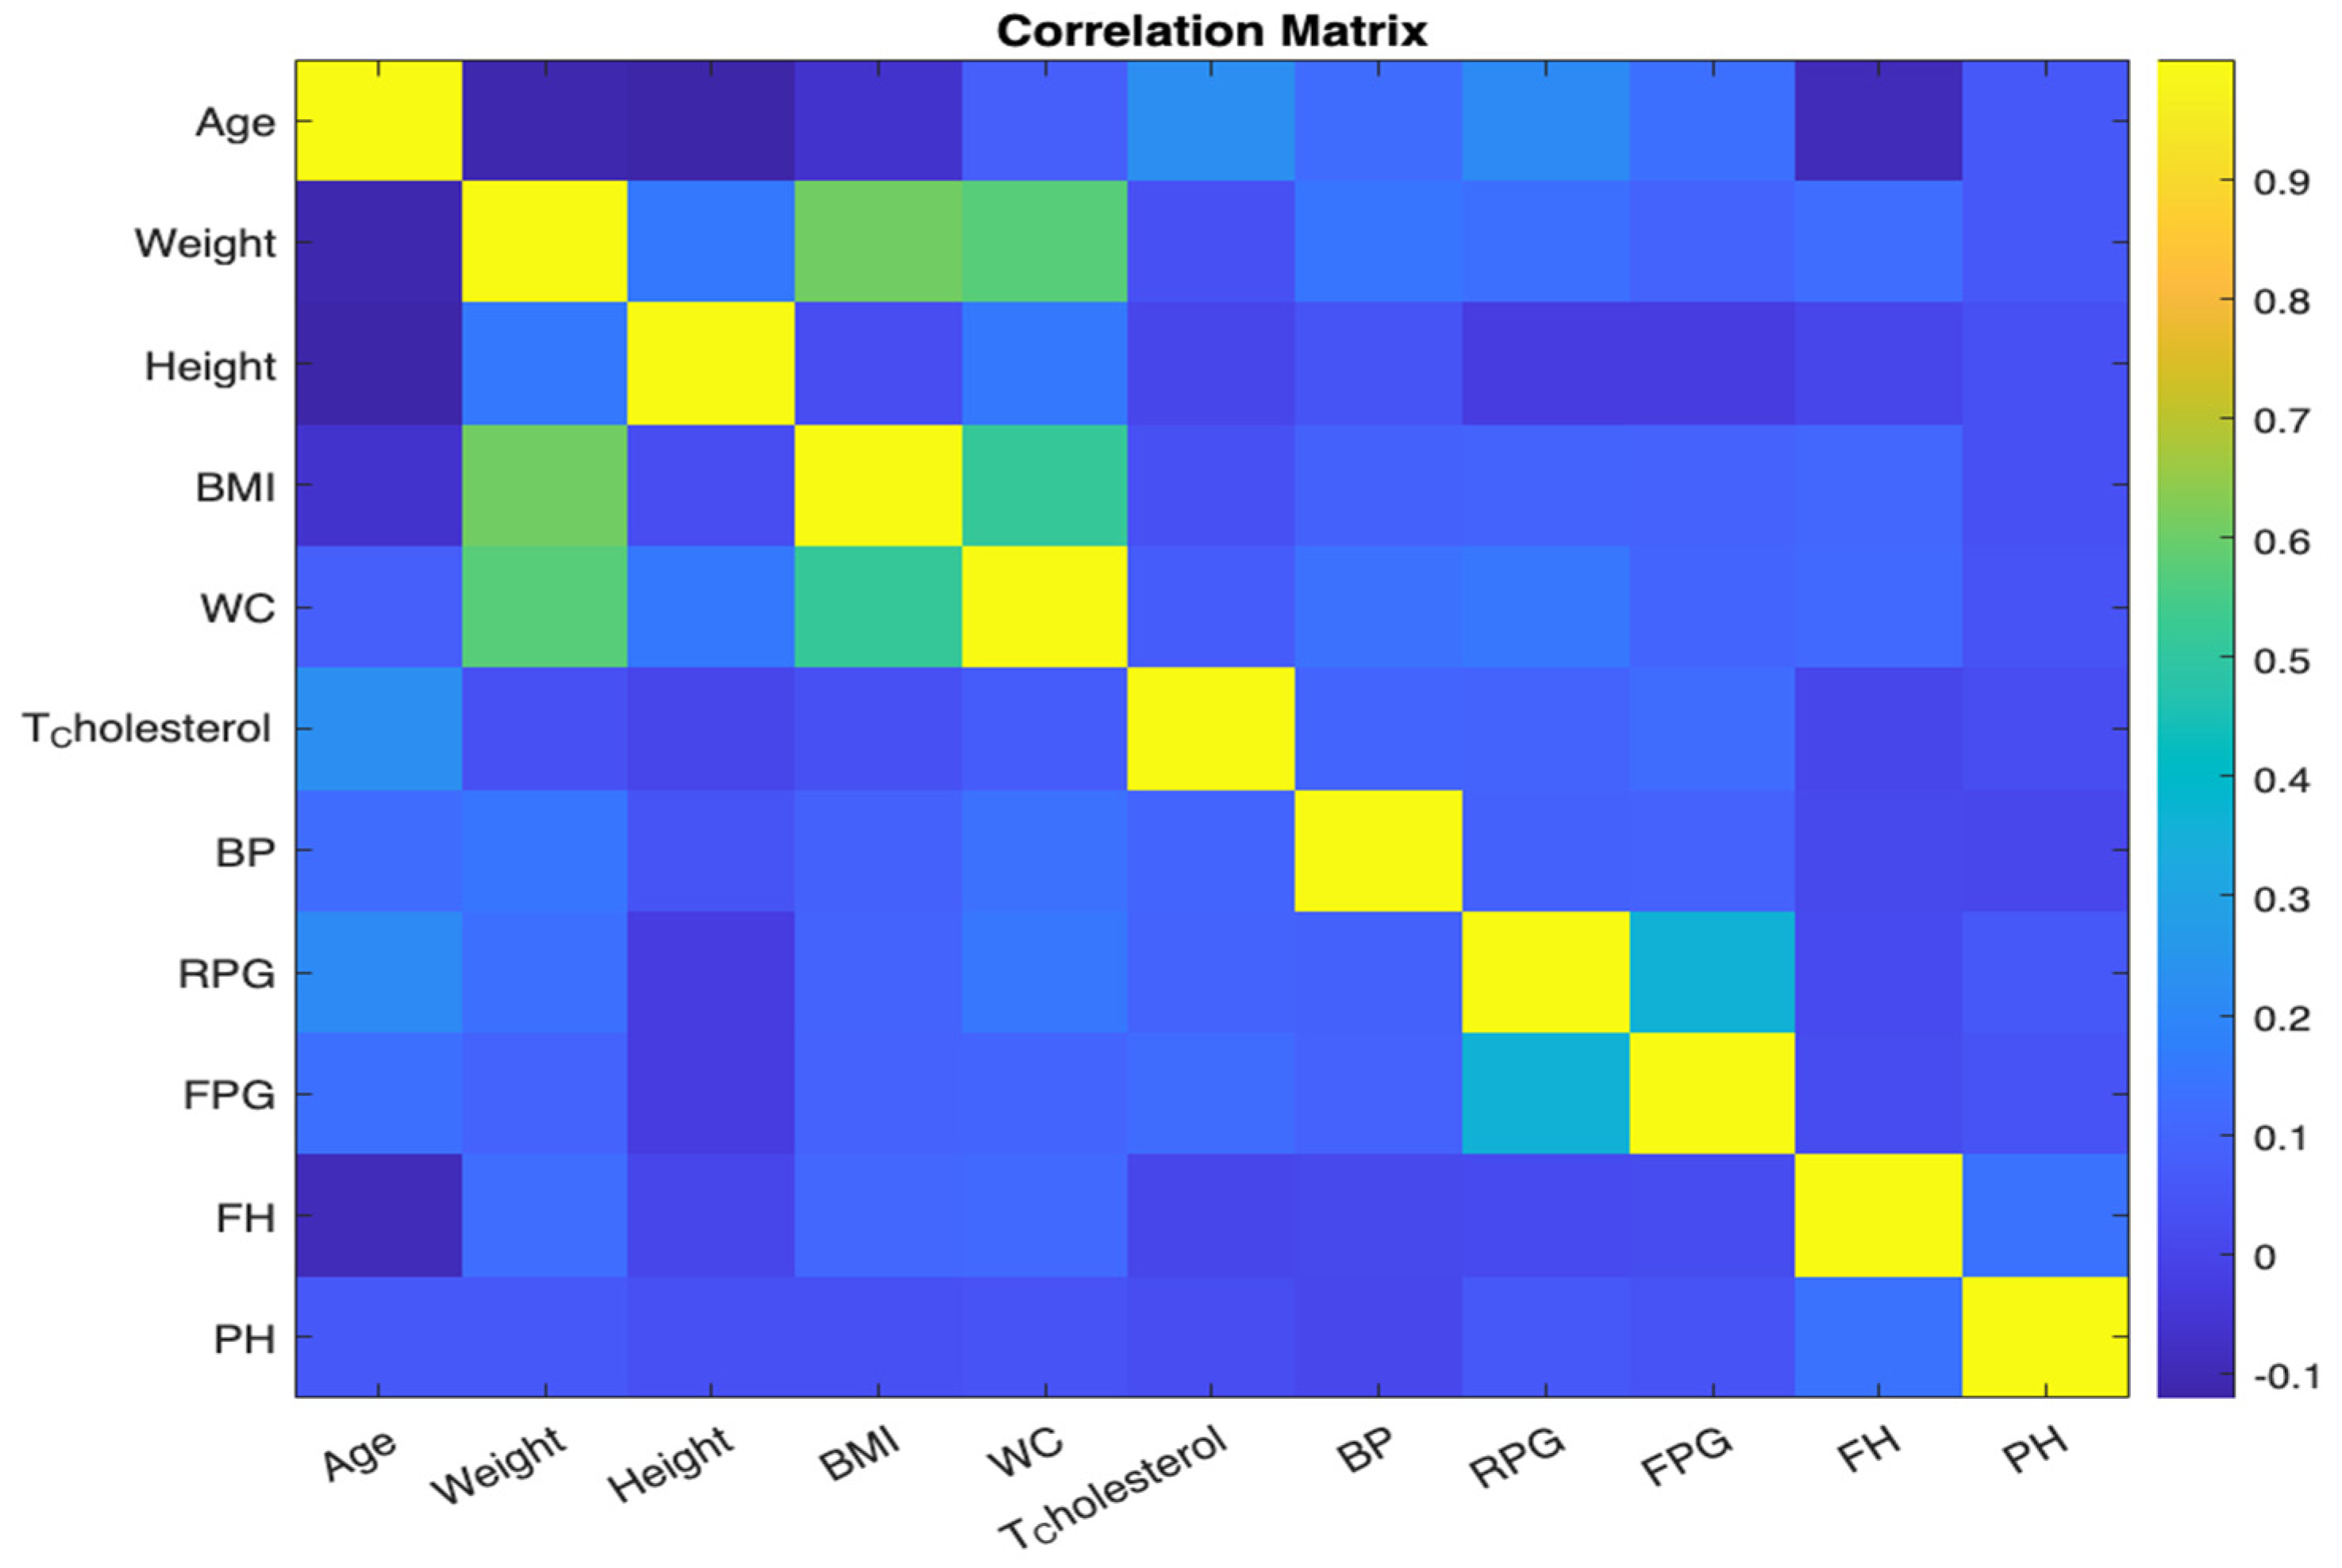
Upon identifying the missing values, the immediate step involved devising an appropriate handling strategy. This involved the employment of a method known as the K-Nearest Neighbors (KNN), instrumental in estimating the missing values based on the values of other similar records. This approach is particularly effective when the data exhibits a significant degree of correlation or pattern among the variables [
37,
38]. See
Figure 2. Each cell in the grid corresponds to a pair of variables, and the colour of the cell represents the strength and direction of the correlation between those variables. The x and y axes are labelled with the variable names for clarity. By examining the colour of each cell, we can quickly identify pairs of variables that are strongly correlated.
The fillmissing function from MATLAB was used in conjunction with the 'knn' option to fill in the missing data. This function replaces missing values in the dataset based on the 'k' closest instances (i.e., most similar records). The fillmissing function provides multiple options to replace the missing values; however, the KNN option was chosen in this case due to its ability to maintain the overall distribution and relationships within the data, leading to more accurate and reliable analysis results [
39].
In the end, the KNN method proved to be an effective way to handle missing values in our dataset. It maintains the underlying structure and relationships in the data, which can improve the performance of subsequent analyses and predictive modelling. It also avoids the potential bias and inaccuracies that could be introduced by simply removing or ignoring missing values [
39,
40].
3.3. Removing Outliers
Outliers in the dataset were identified and removed using the Z-score method [
41]. The z-scores of each variable were calculated, and data points with absolute z-scores greater than 3 were considered outliers. The outliers were replaced with NaN (Not-a-Number) values, and the missing values were filled using the nearest neighbour method.
3.4. Feature Processing
Large Following data pre-processing, specific clinical features are processed to generate new binary features that aid in predictive accuracy. The following feature processing operations were performed:
3.4.1. Risk Factor (PH): The attribute "PH" (Personal History) was converted into a binary variable indicating whether the value is greater than or equal to 3.3.4.2. BMI and Waist Circumference: The attributes "BMI" and "WC" (Waist Circumference) were converted into binary variables indicating whether the values are above certain thresholds (BMI >= 25 kg/m², WC (M) >= 94cm, WC (F) >= 80cm).3.4.3. Mean Blood Pressure: The attribute "BP" (Blood Pressure) was converted into a binary variable indicating whether the value is greater than or equal to 85mHg diastolic.3.4.4. Abnormal Blood Sugar: The attributes "FPG" (Fasting Plasma Glucose) and "RPG" (Random Plasma Glucose) were converted into a binary variable indicating whether the values fall within specific ranges (5.6 <= FPG < 7 or 5.5 <= RPG < 11.1).3.4.5. Cholesterol: The attribute “T_Cholesterol” (Total Cholesterol) was converted into a binary variable indicating whether the value is greater than or equal to 5.2 mmol/l.
3.5. Target Variable Encoding
The target variable “Outcome” was initially categorical. To enable training the CNN model, it was converted into numeric labels using the grp2idx function.
3.6. Novel 4D CNN Model
The application of a Convolutional Neural Network (CNN) for the prediction of diabetes constitutes a significant advancement in the field of machine learning and healthcare analytics, and it showcases the potential of these models to assist in early disease diagnosis and proactive care [
42]. In particular, o CNN model utilizes a four-dimensional (4D) structure, which is relatively uncommon in CNN applications [
43], and so, it exhibits several novel aspects. The term “4D” refers to the four-dimensional input that the CNN model accepts, i.e., an array of size [height, width, depth, num_samples]. In this case, height and width are both 1, depth is equal to the number of features in the input data, and num_samples is the number of data samples.
The proposed CNN model takes as input a 4D tensor, reshaped from the initial 2D data. This tensor’s dimensions. Represent [batch size, height, width, channels], with height and width being 1 in this case due to the nature of the input data. By contrast, typical CNN models used for image analysis have 2D or 3D layers for the height and width of an image and its colour channels, respectively. This architectural novelty enables the model to process multivariate input data efficiently, each channel acting like a separate feature of the input data.
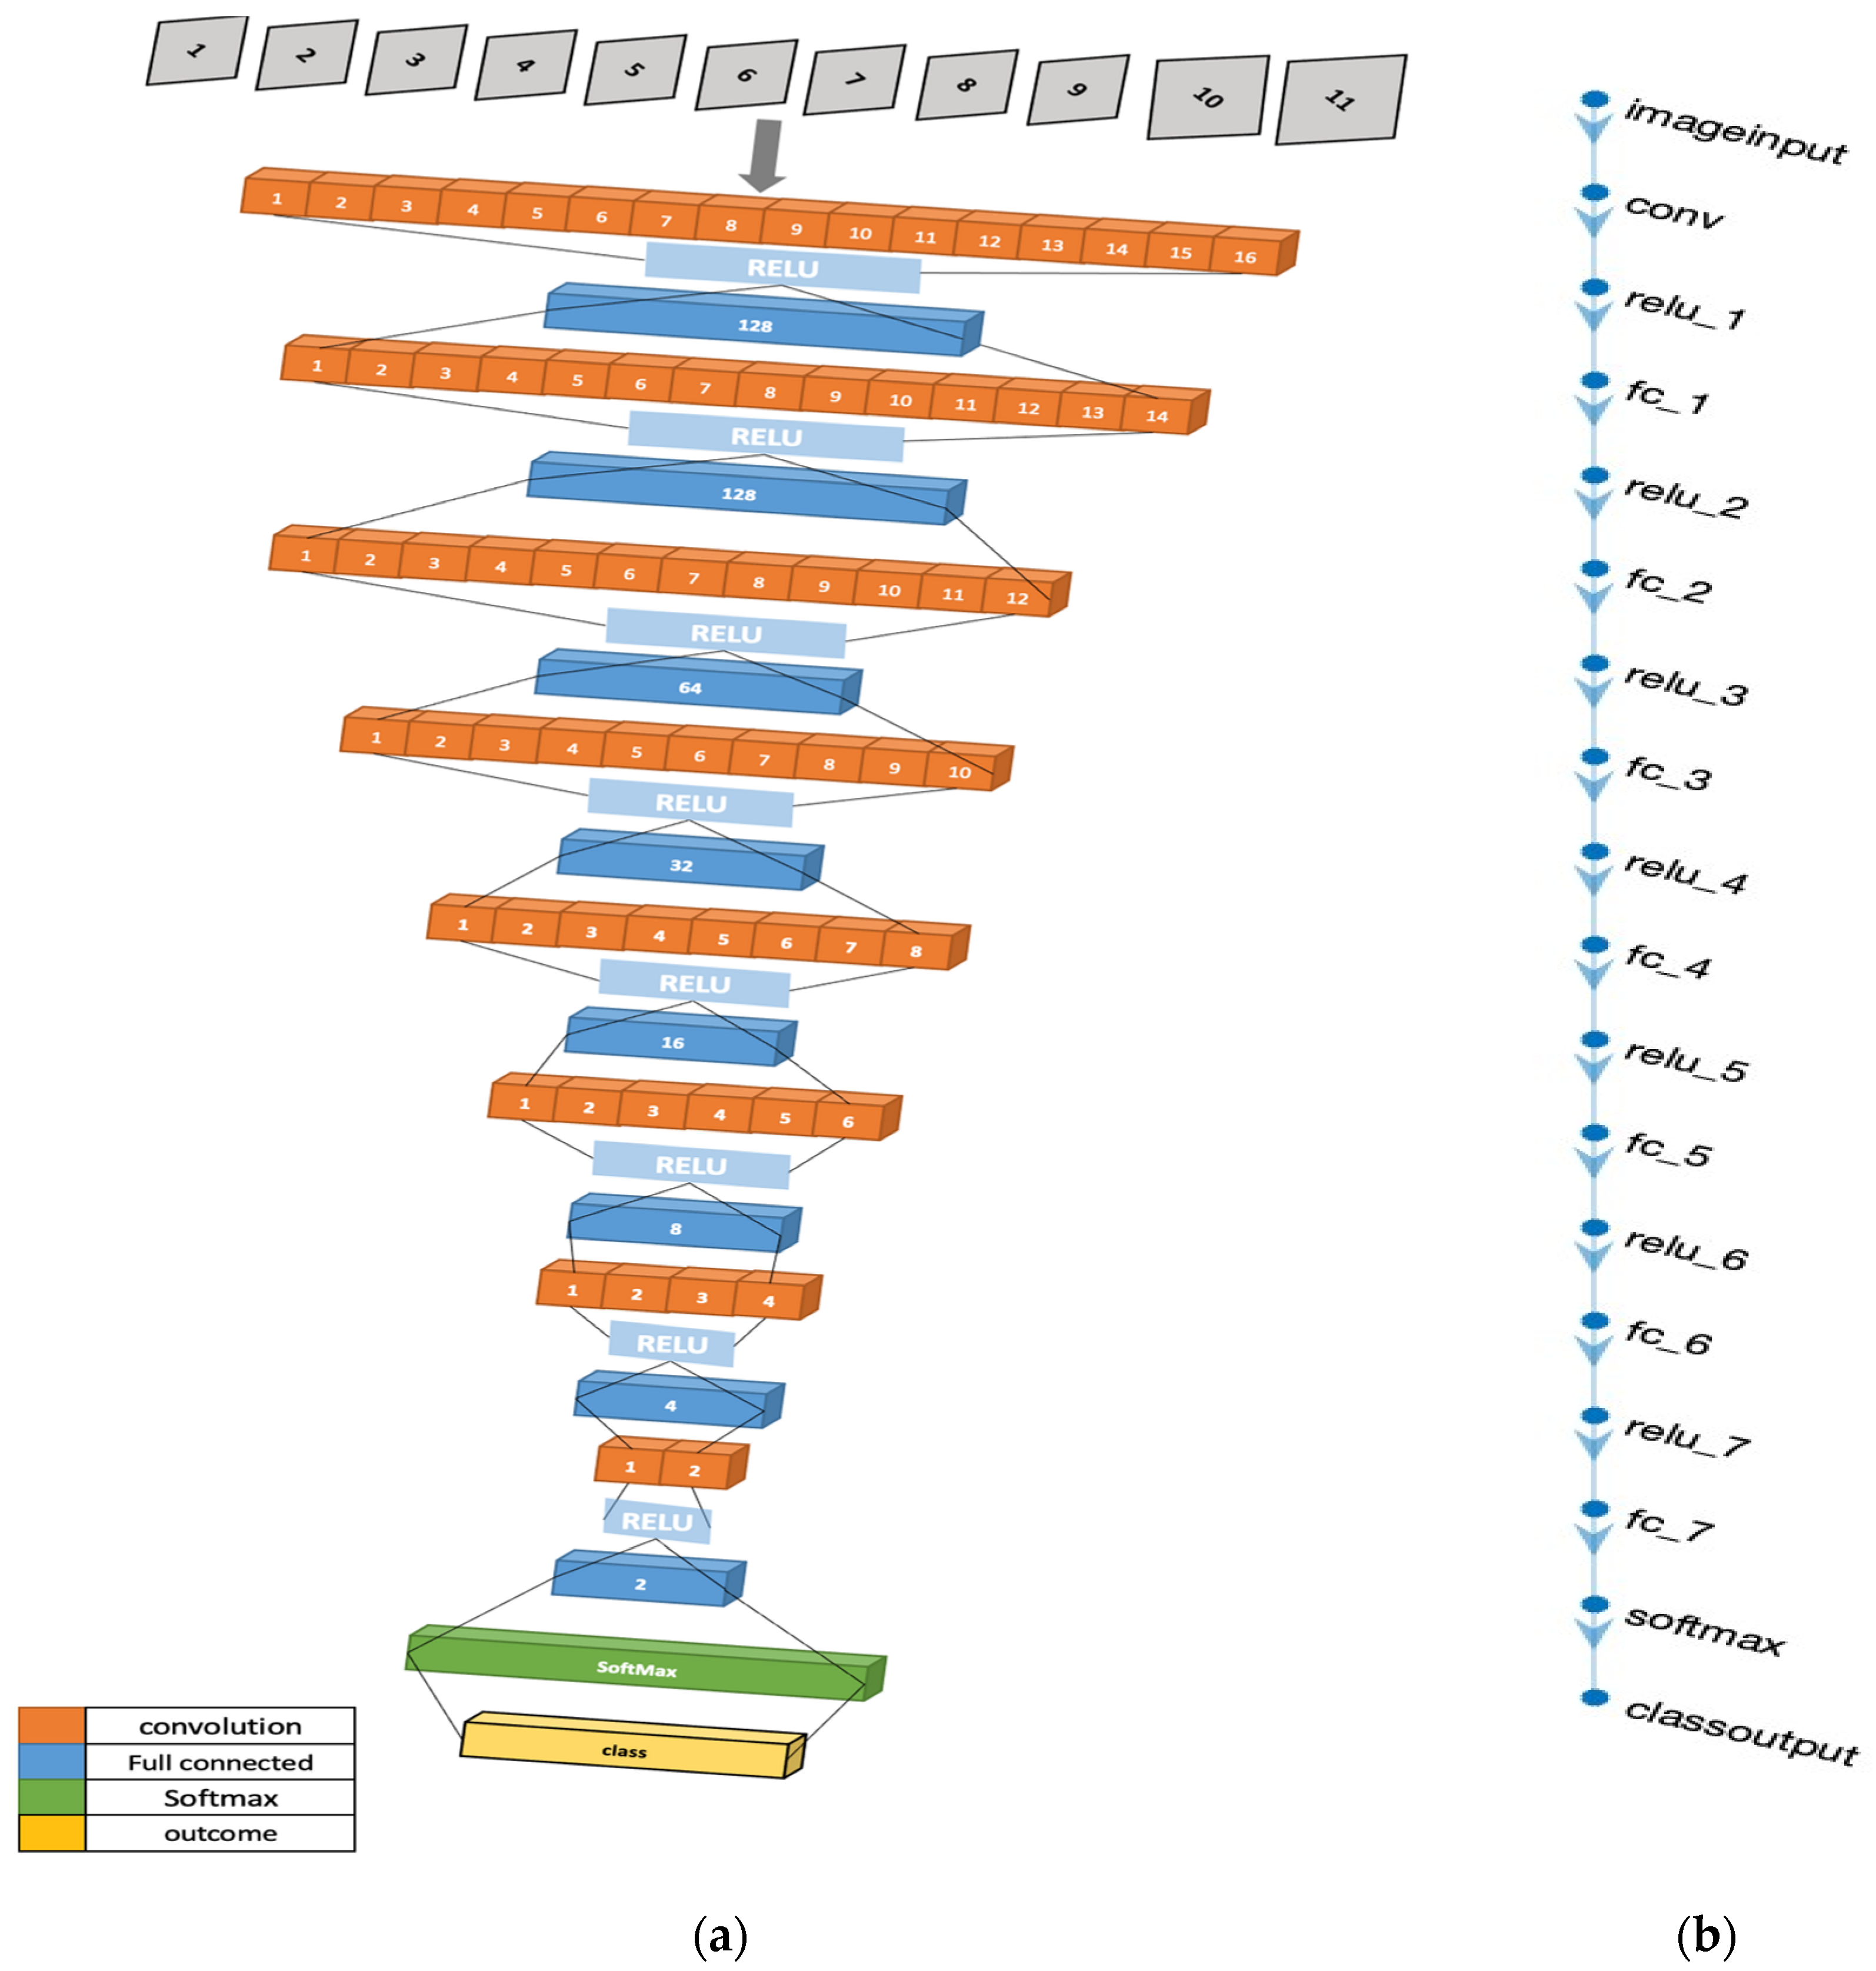
This 4D CNN model architecture is designed to incrementally reduce the dimensionality of the input data, an approach that aids in distilling complex data into a lower-dimensional space. This architecture begins with an input layer, followed by a series of alternating convolutional layers with Rectified Linear Unit (ReLU) activation functions and fully connected layers. The convolutional layer employs a [
1,
1] kernel size with 16 filters, which performs a point-wise convolution operation on the input data. This operation allows the model to capture higher-order feature interactions between different input channels.
Figure 3.
4-Dimensional CNN Architecture illustrations: (a) The 3-dimensional design of the 4D-CNN model architecture. (b) MATLAB illustration of the model.
Figure 3.
4-Dimensional CNN Architecture illustrations: (a) The 3-dimensional design of the 4D-CNN model architecture. (b) MATLAB illustration of the model.
The design employs a pattern of decreasing neurons in subsequent fully connected layers (128, 64, 32, 16, 8, 4, and 2 neurons). This structure is utilized to gradually reduce the dimensionality of the input data while retaining its salient features. Each fully connected layer is followed by a ReLU layer, which adds non-linearity to the model, enhancing its ability to learn from the complex diabetes dataset.
After the fully connected layers, the model employs a softmax layer, a commonly used function in multiclass classification problems that outputs the probabilities of the input belonging to each class. Finally, a classification layer is used to assign the input to the class with the highest probability. This output gives the model's prediction of whether the input data indicates a diabetic or non-diabetic patient.
In contrast to other existing models in predicting diabetes, which use either traditional machine learning approaches [
44], Lasso regularization for feature selection [
45], or combine CNN with other deep learning models like Bi-LSTM [
42], our model stands out by utilizing a 4D CNN with a novel architecture design that offers an efficient, effective, and straightforward way to predict diabetes from multivariate data.
This pioneering model could pave the way for future research, potentially leading to models that can predict not only diabetes but also other chronic diseases using complex multivariate data. This work thus contributes to ongoing efforts to leverage deep learning for improved health outcomes, early detection, and proactive care in the field of diabetes.
3.7. Training and Validation of the Proposed 4D CNN Model
The training and validation phases of the proposed 4D Convolutional Neural Network (CNN) model involve splitting the dataset into discrete subsets for training, validation, and testing. We employed MATLAB's inbuilt capabilities to carry out this division, thereby ensuring consistency in results across various runs [
46].
For this division, we utilised the 'cvpartition' function with a 'Holdout' parameter value set at 0.2. This partitioning strategy allows for 20% of the data to be held back for validation and testing purposes, whereas the remaining 80% is utilized for training. This Holdout validation method, originally established by Kohavi in 1995, is a frequently adopted approach in machine learning for model development [
47]
The training data (XTrain, YTrain) incorporates features and labels from the primary data (X, Y), respectively. The residual 20% of data is then evenly divided into validation (XValidation, YValidation) and testing (XTest, YTest) sets. It's critical to note that the labels for the validation and testing sets were converted to a categorical format to ensure compatibility with the CNN.
The next step involved reshaping the feature data to match the format required by the CNN model, thereby creating a 4D matrix. This restructuring procedure guarantees that each sample in the training, validation, and testing datasets is perceived as an independent channel.
Our proposed CNN model comprises multiple layers such as 2D convolutional layers, ReLU (rectified linear unit) layers, fully connected layers, a softmax layer, and a final classification layer. The model was constructed using MATLAB's 'trainNetwork' function, which specifies Stochastic Gradient Descent with momentum ('sgdm') for model optimization [
48].
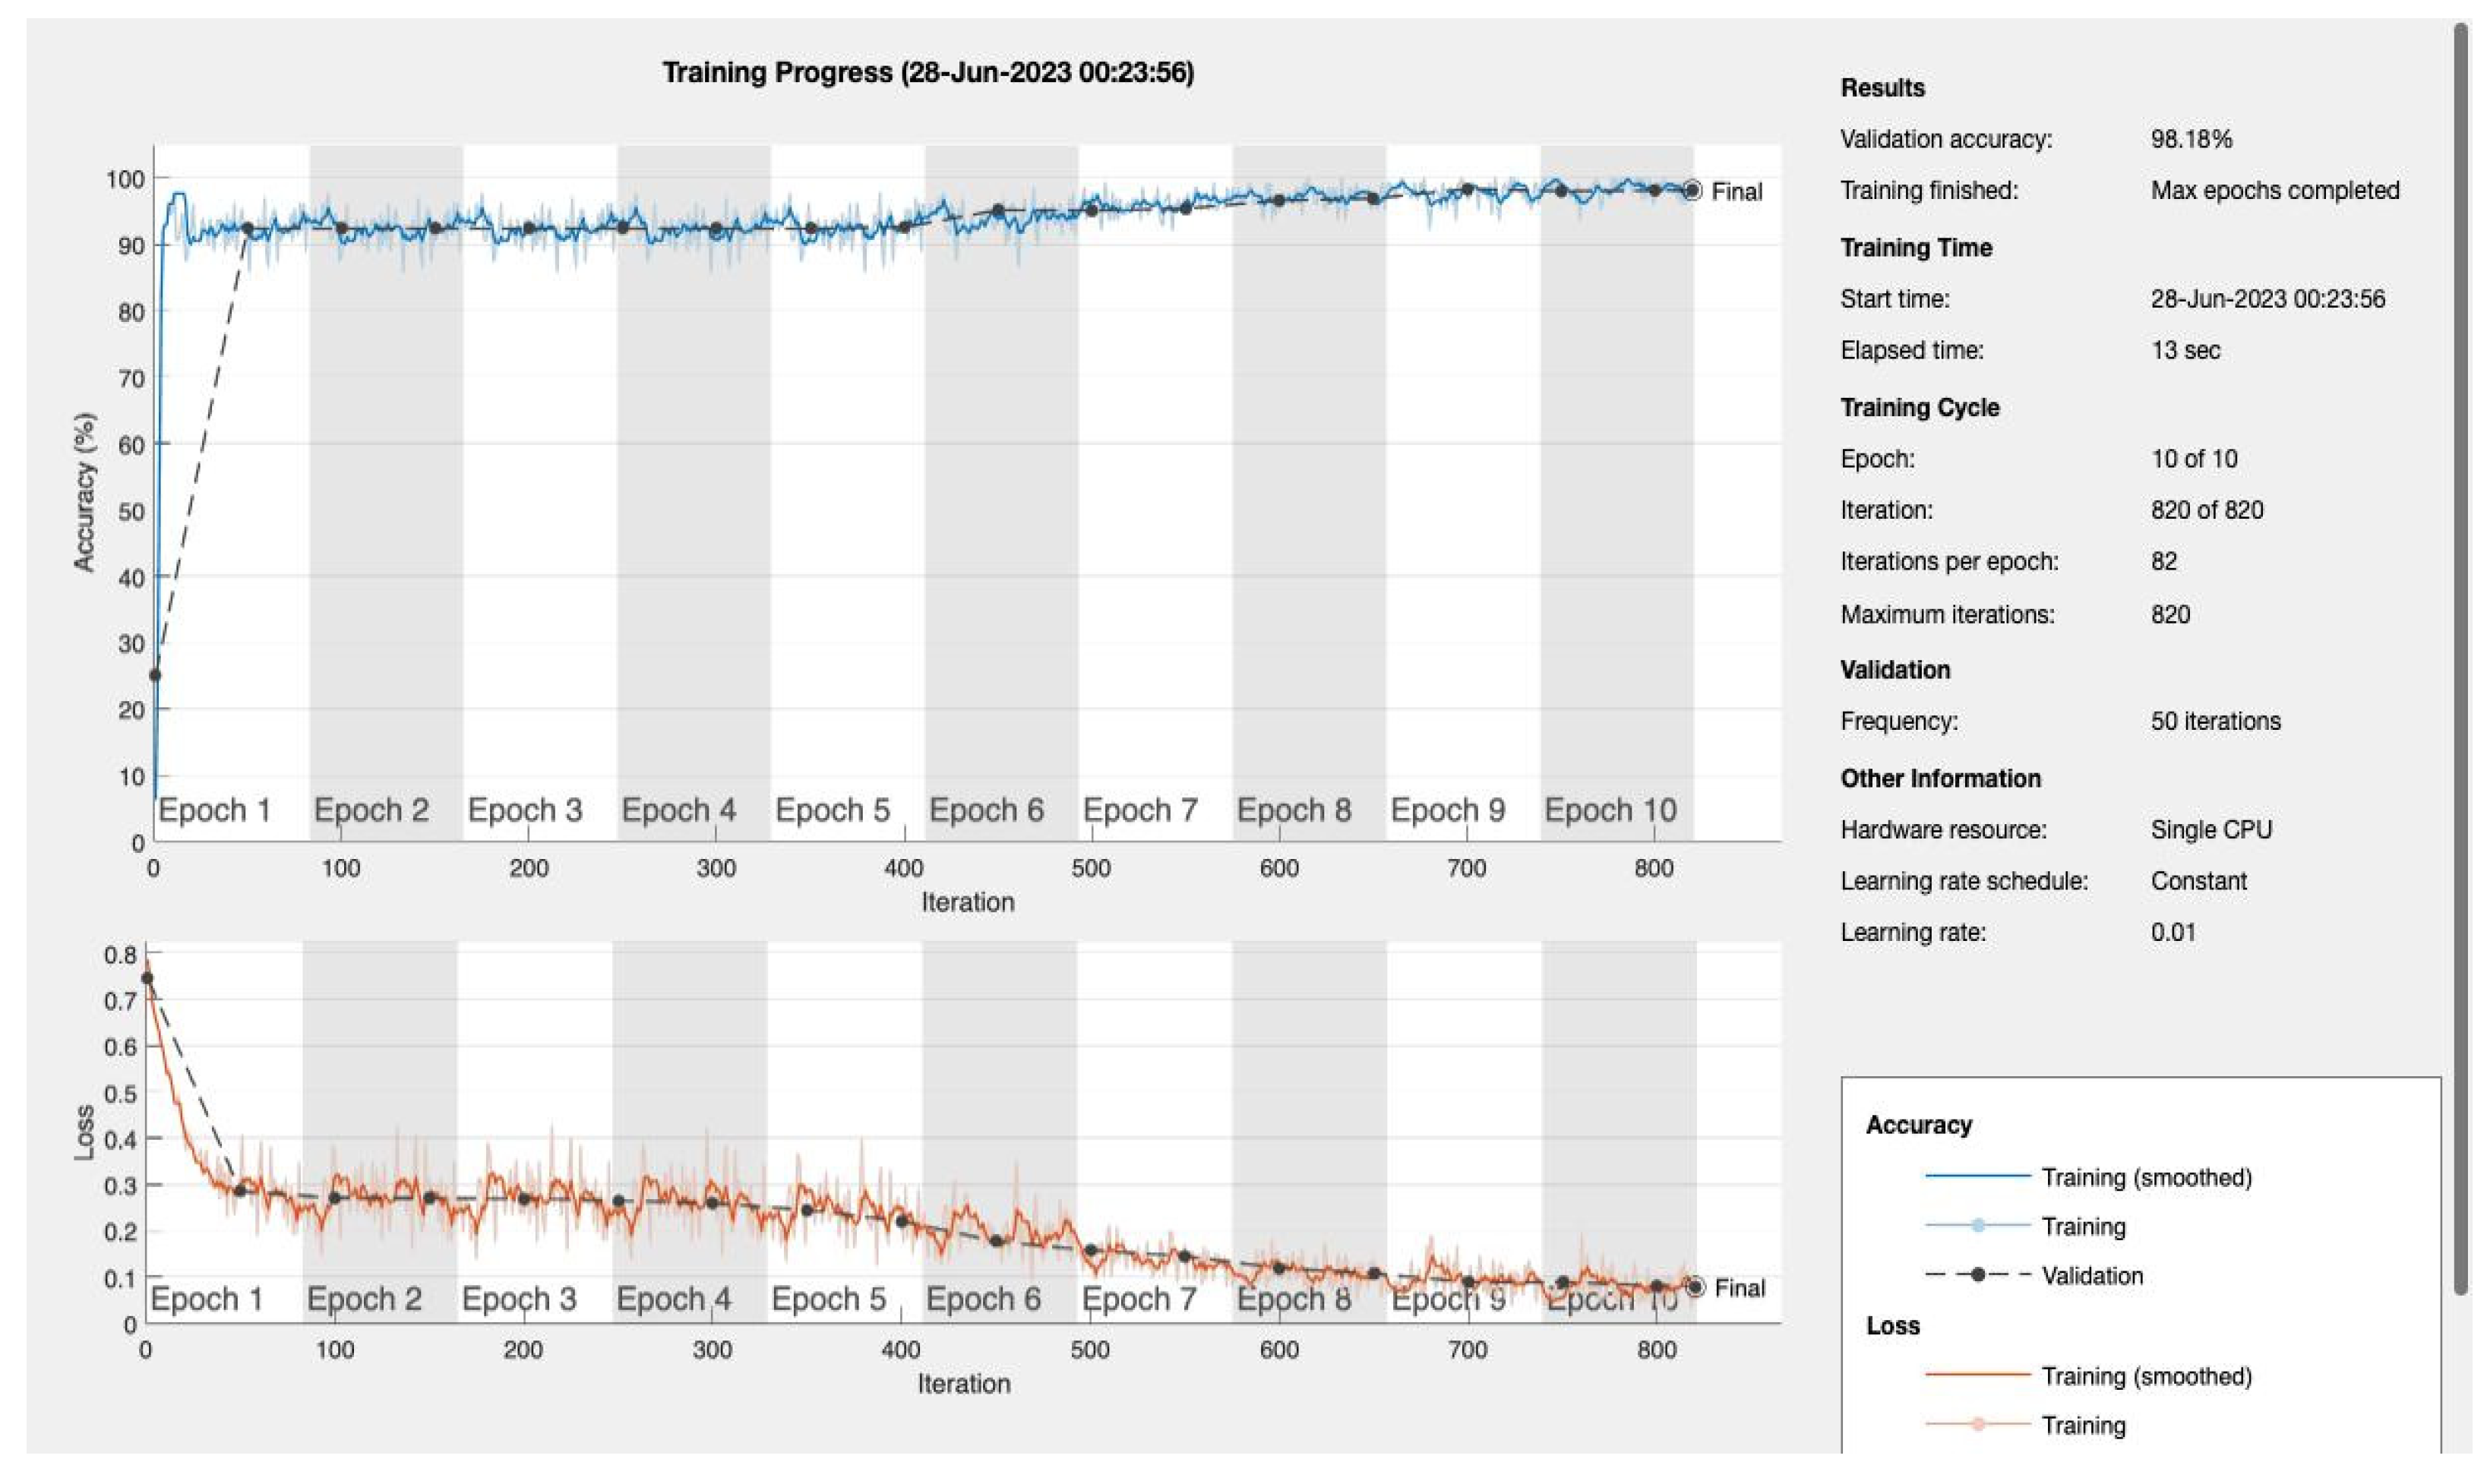
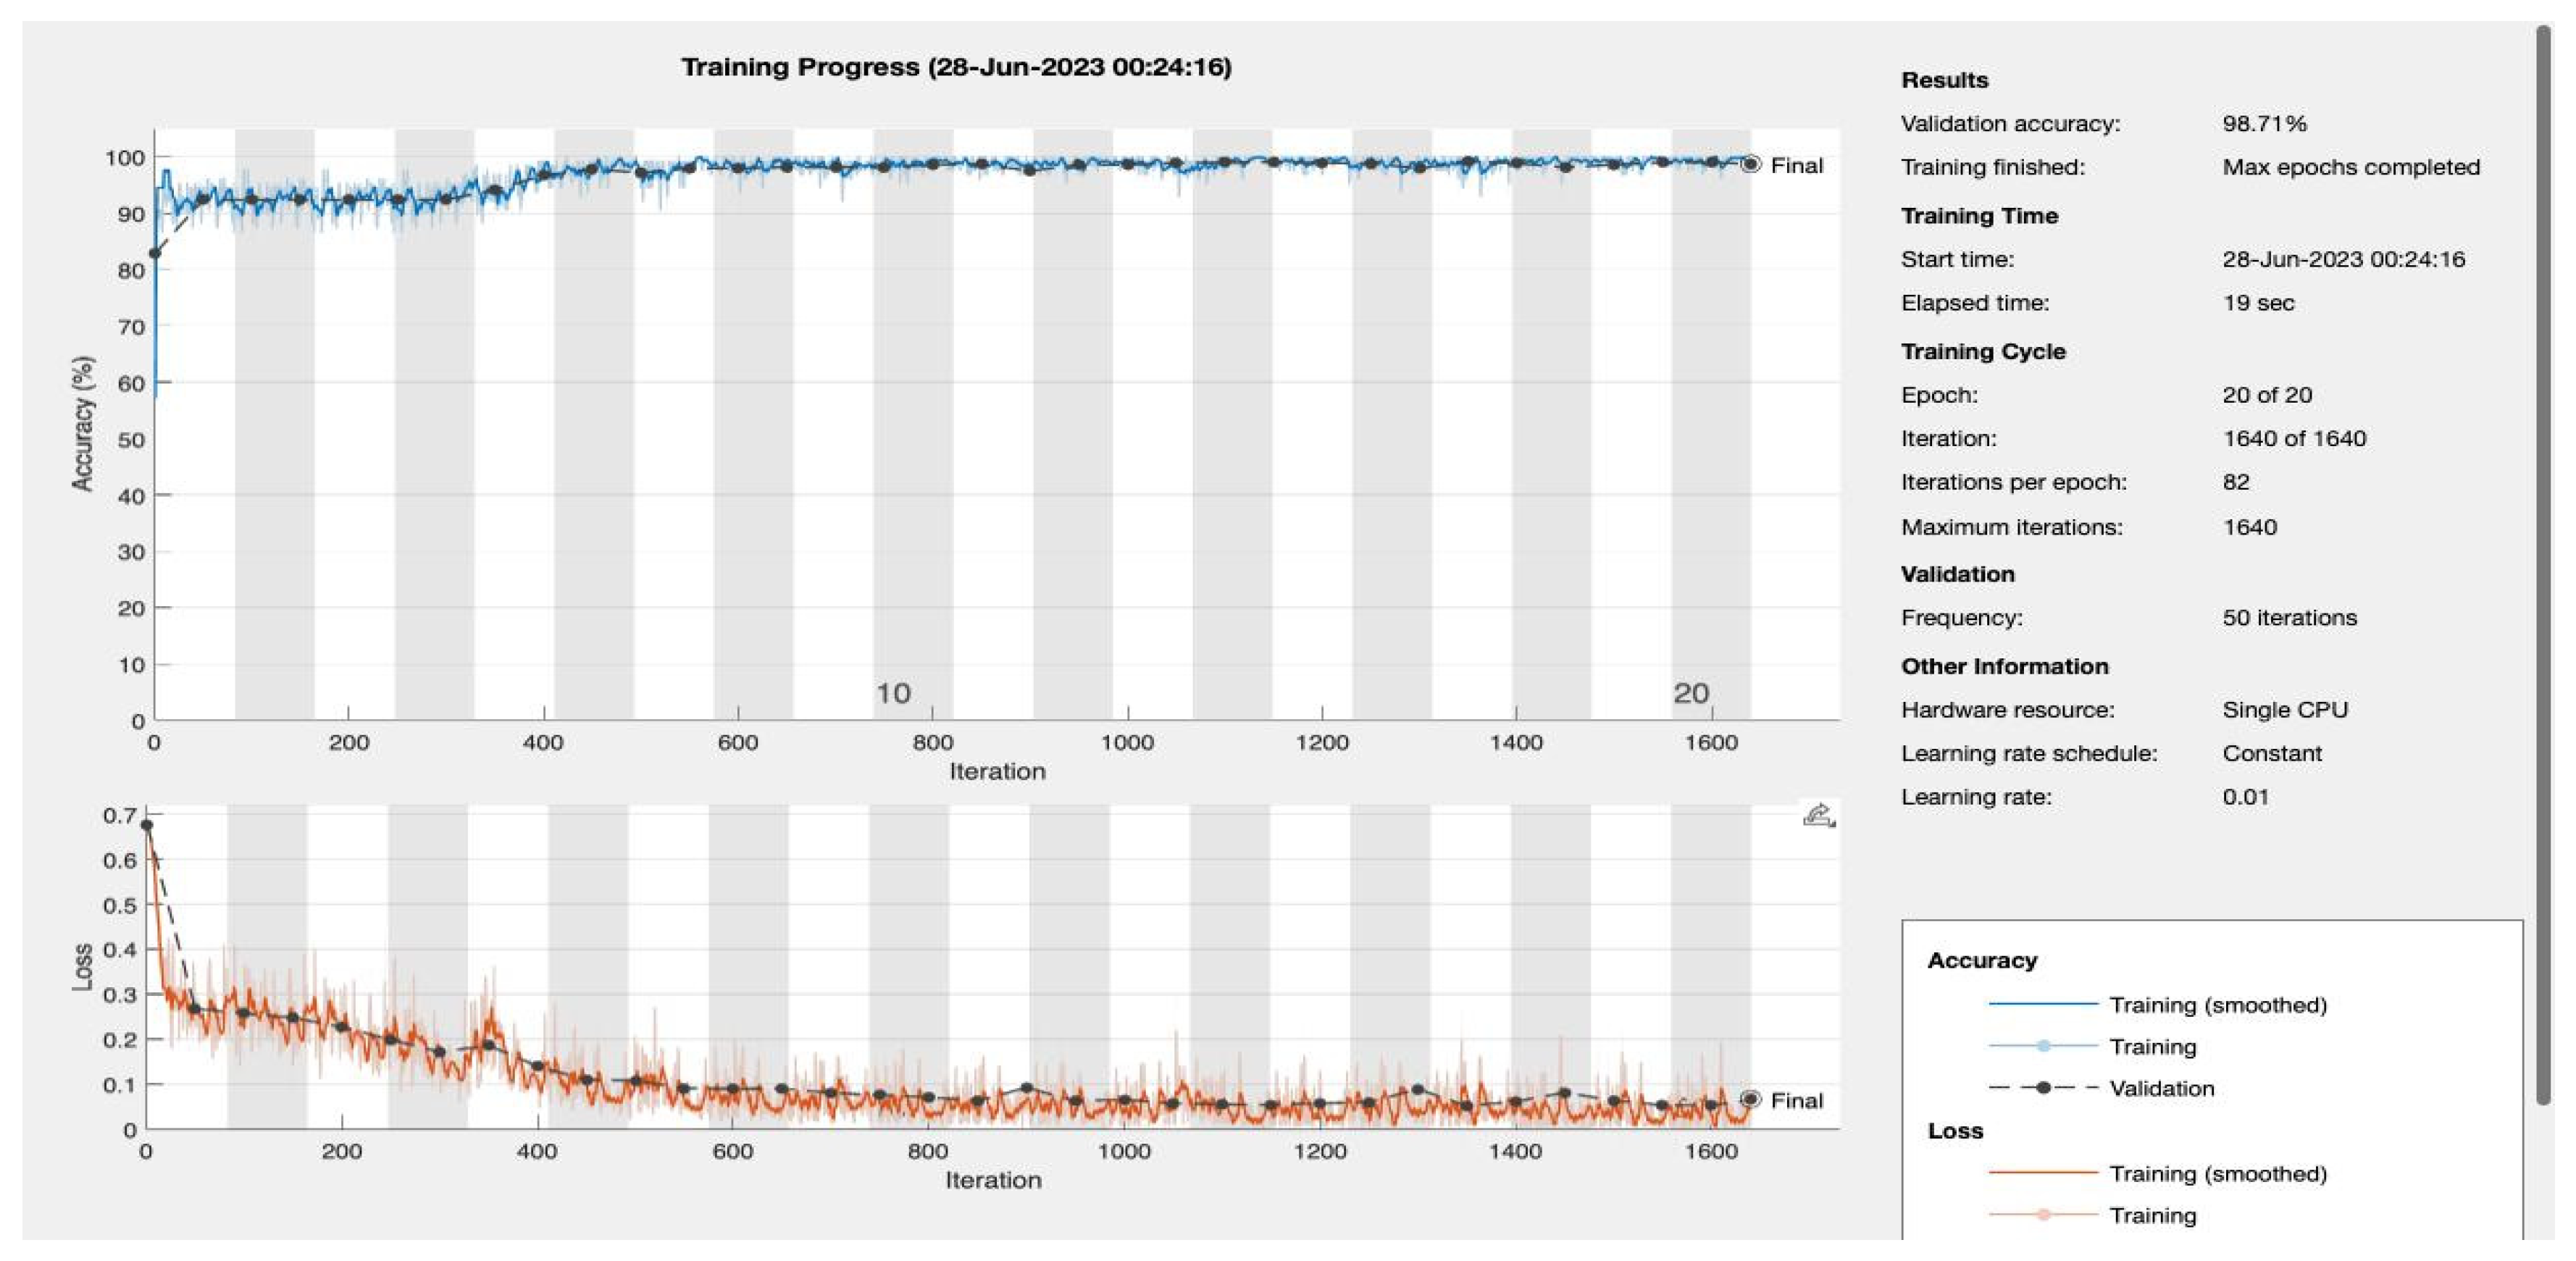
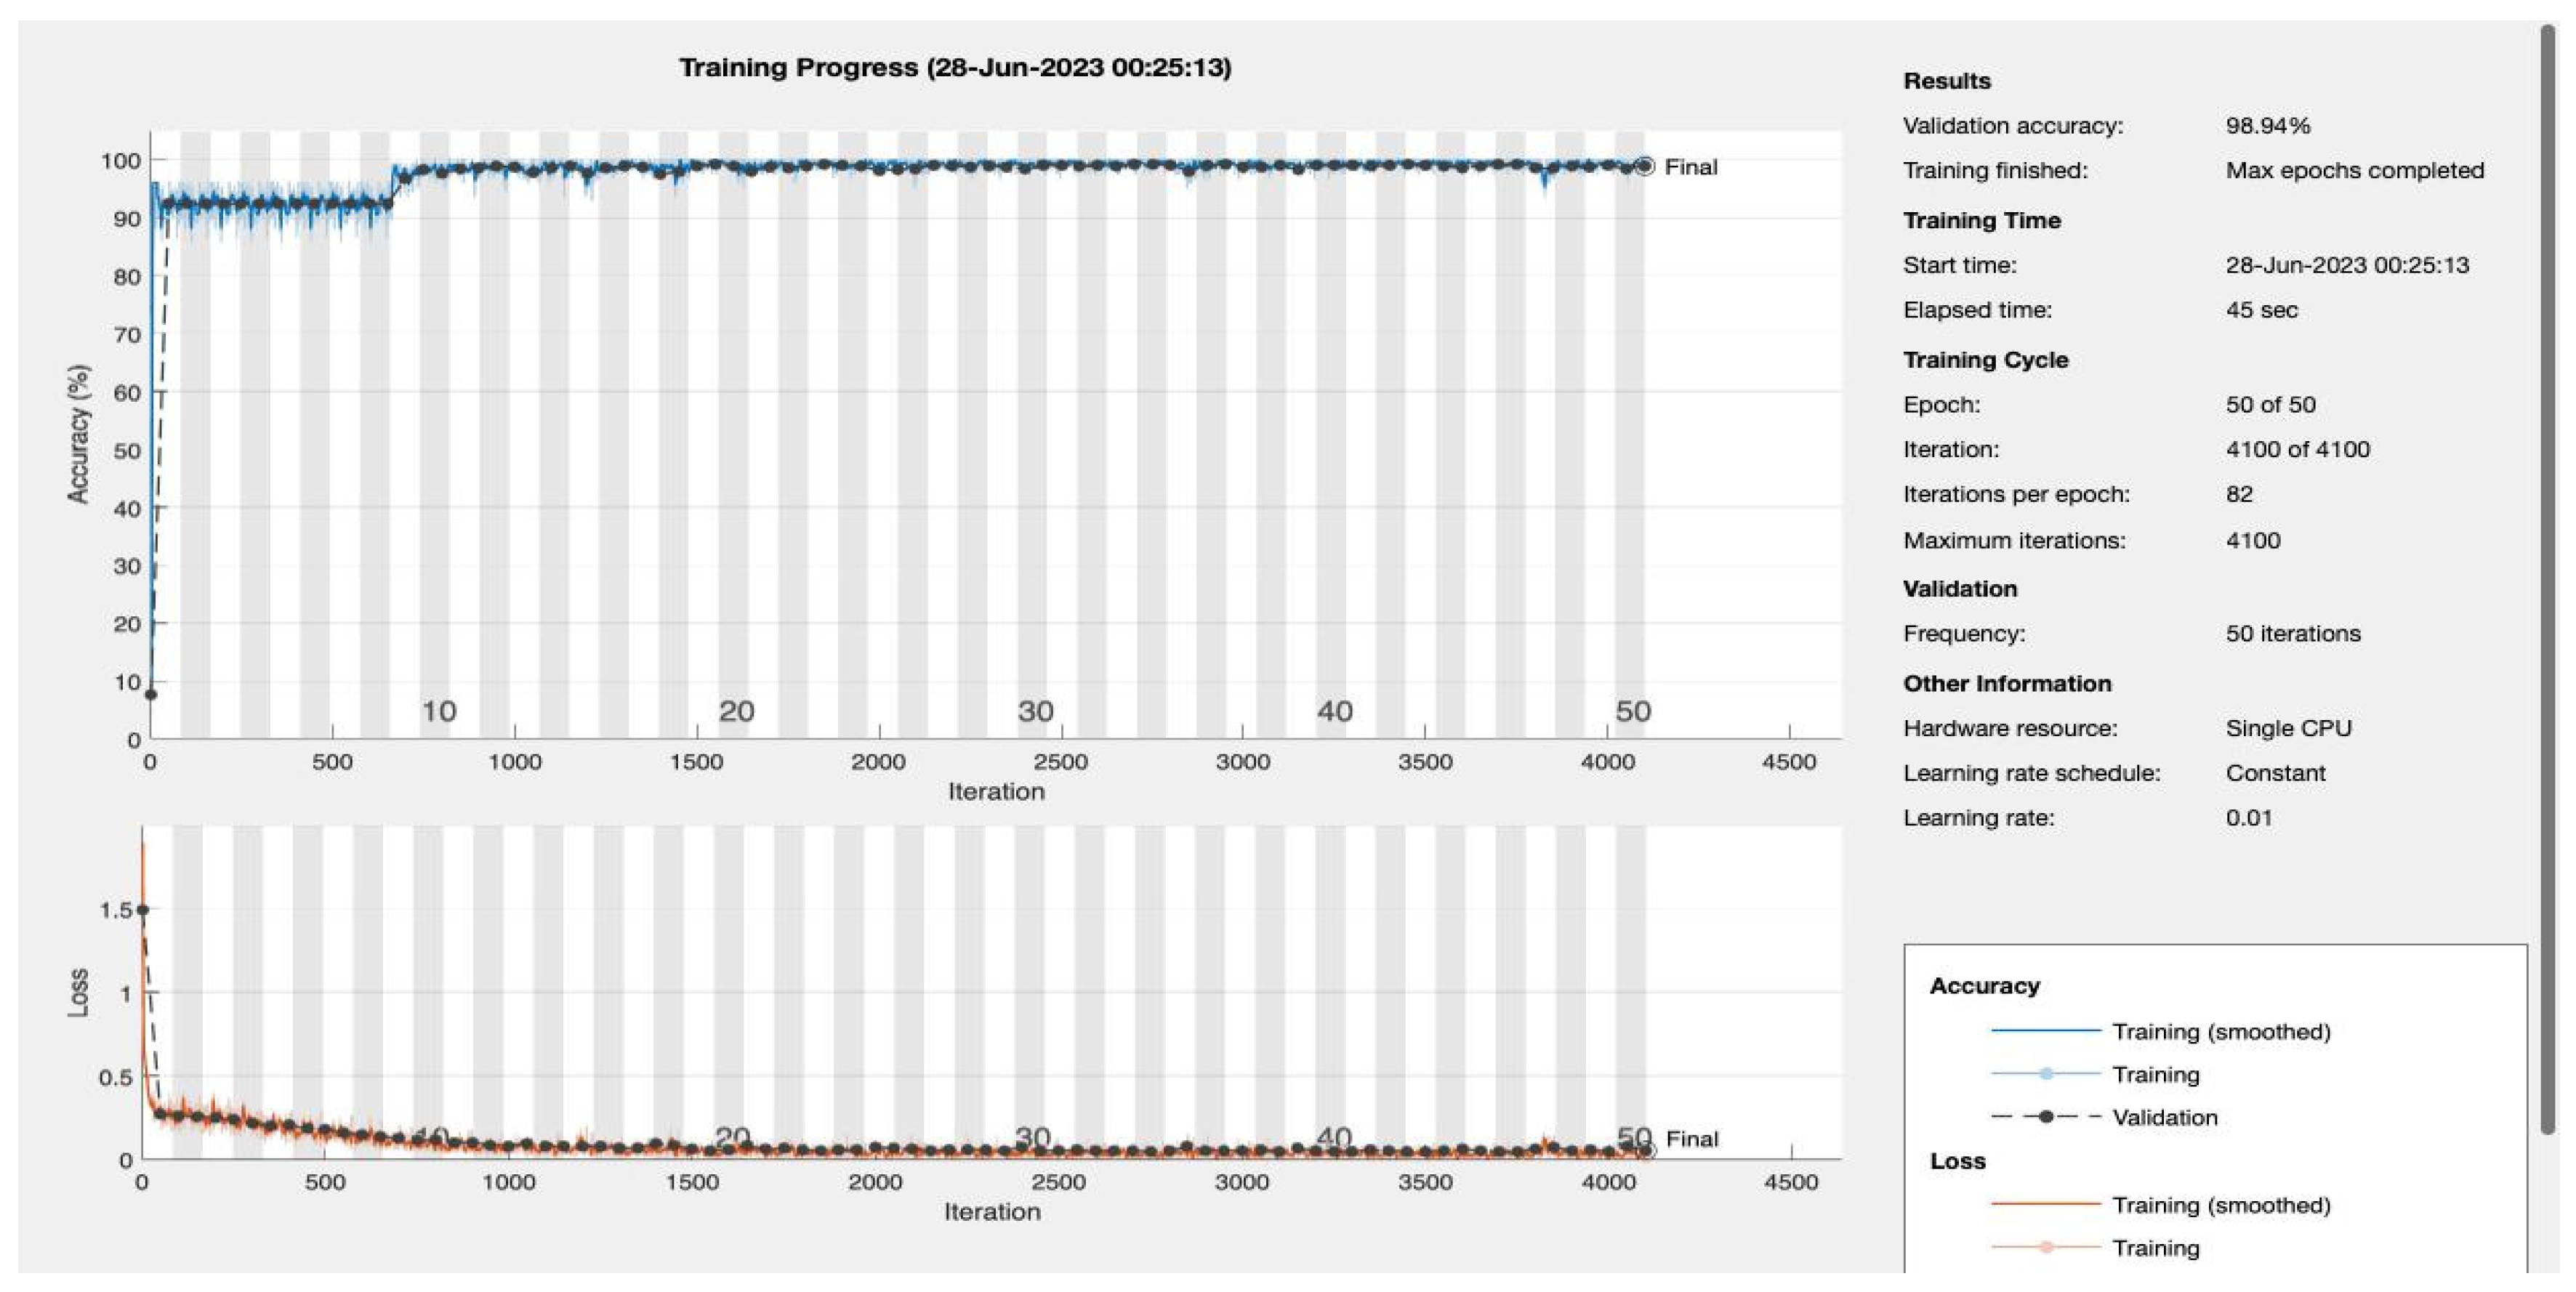
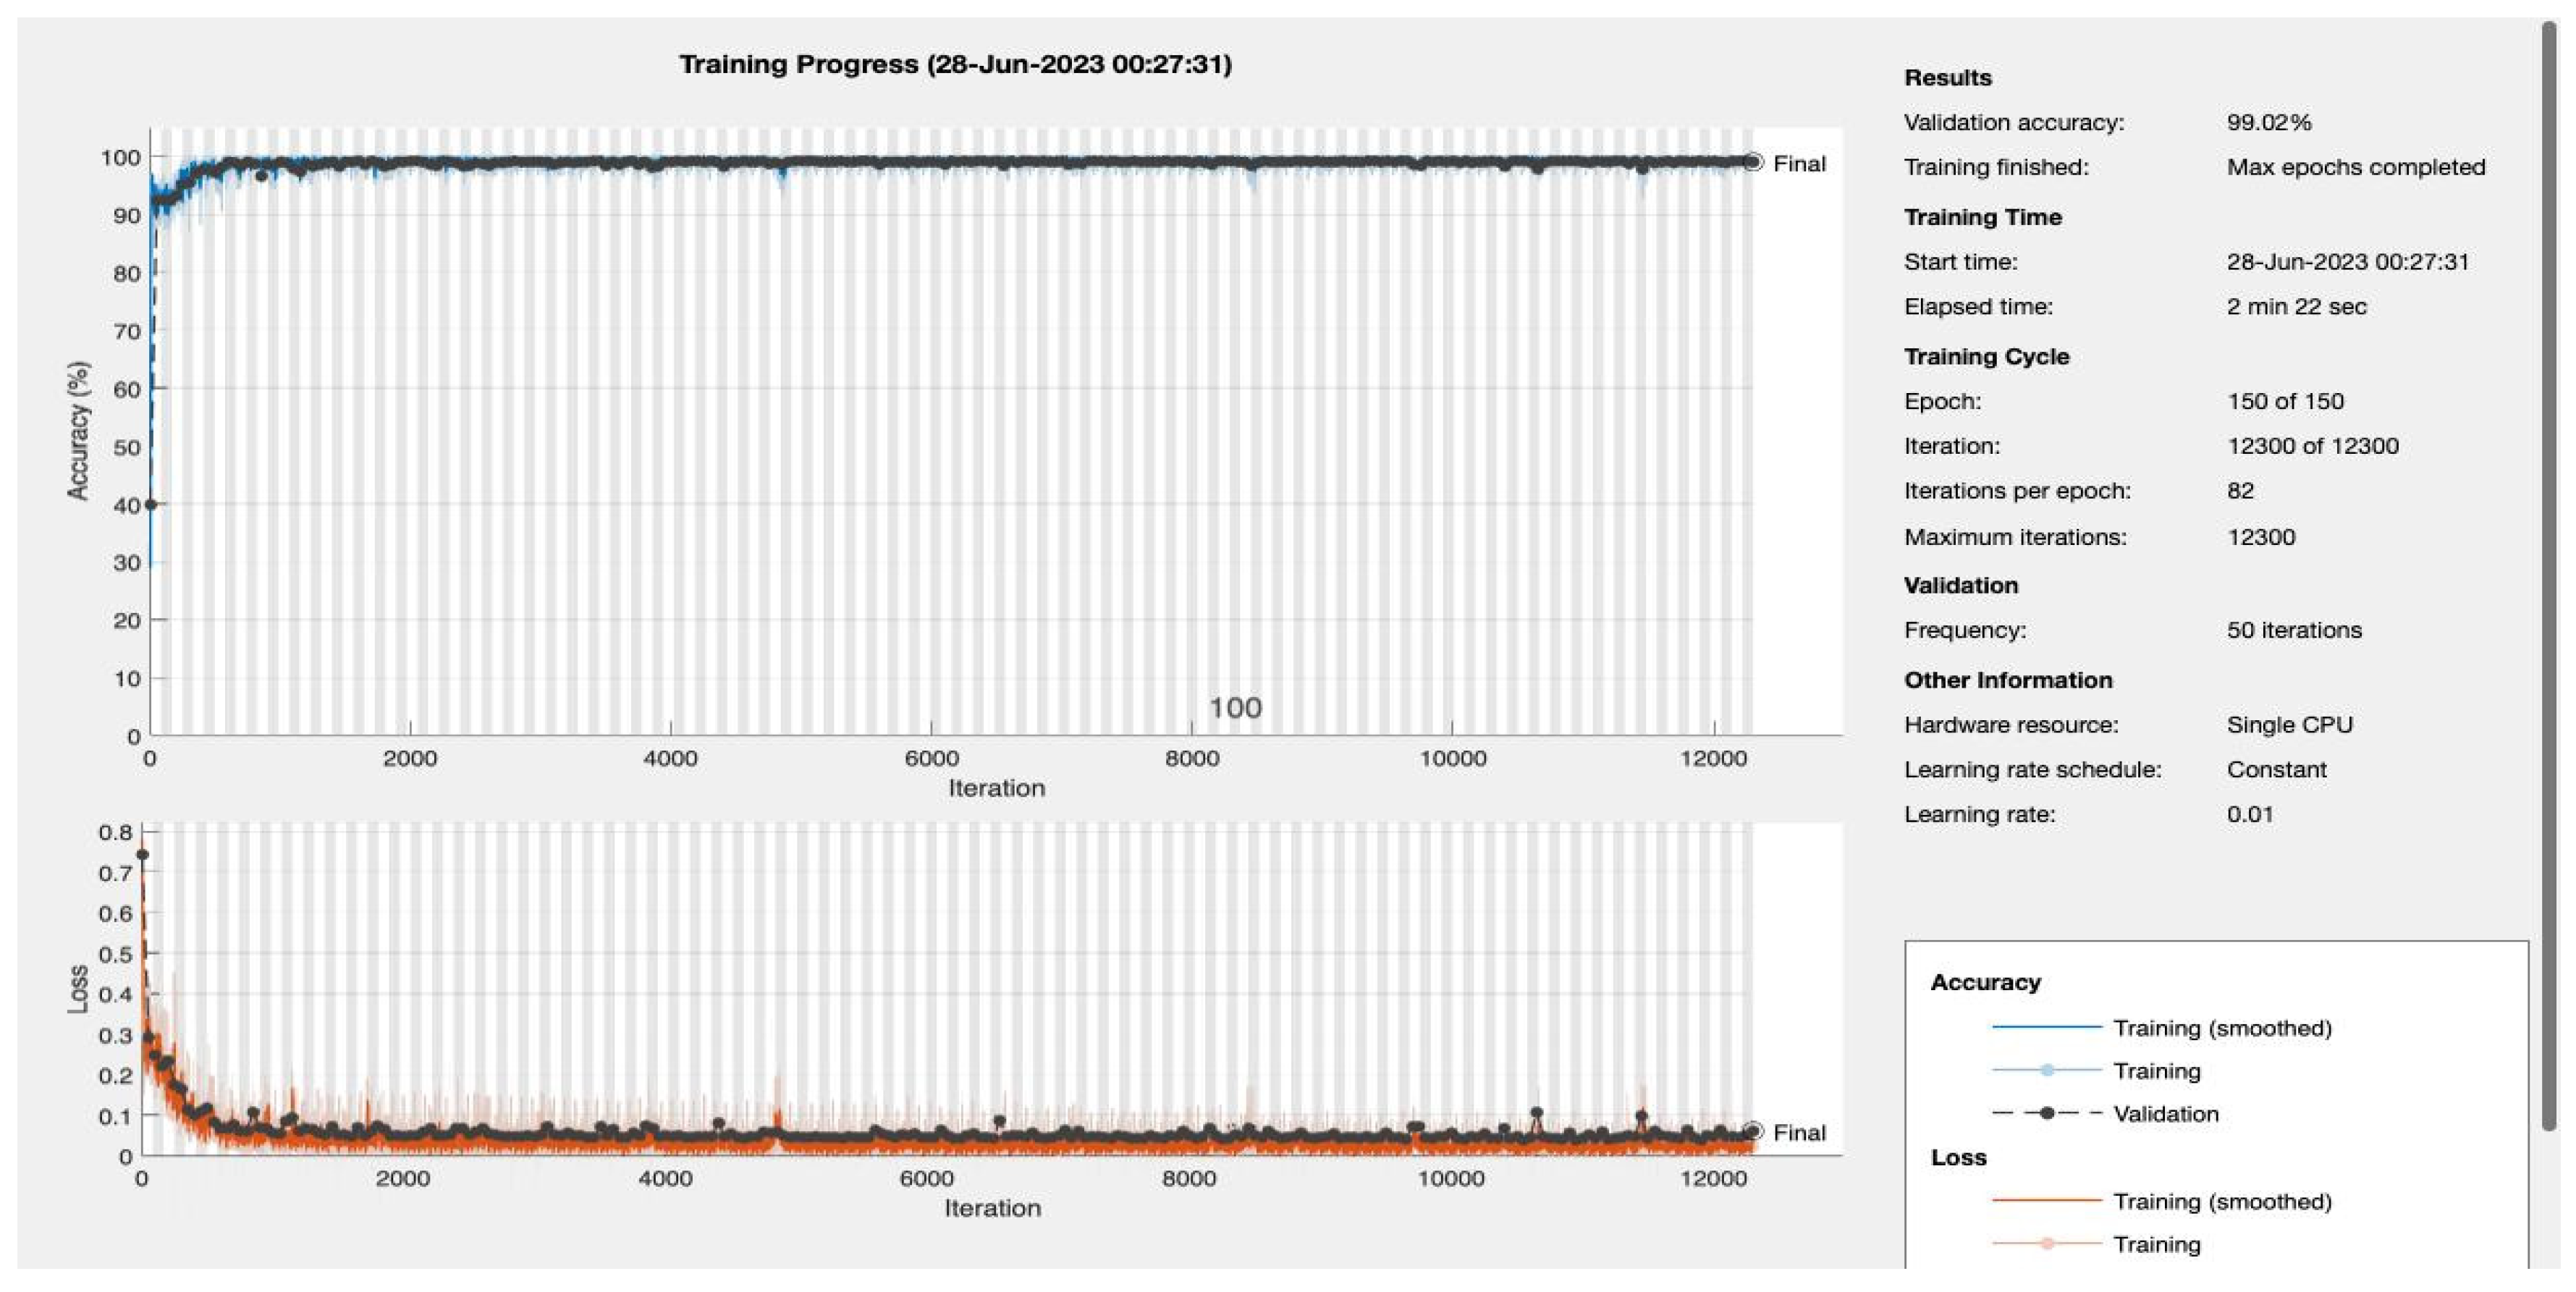
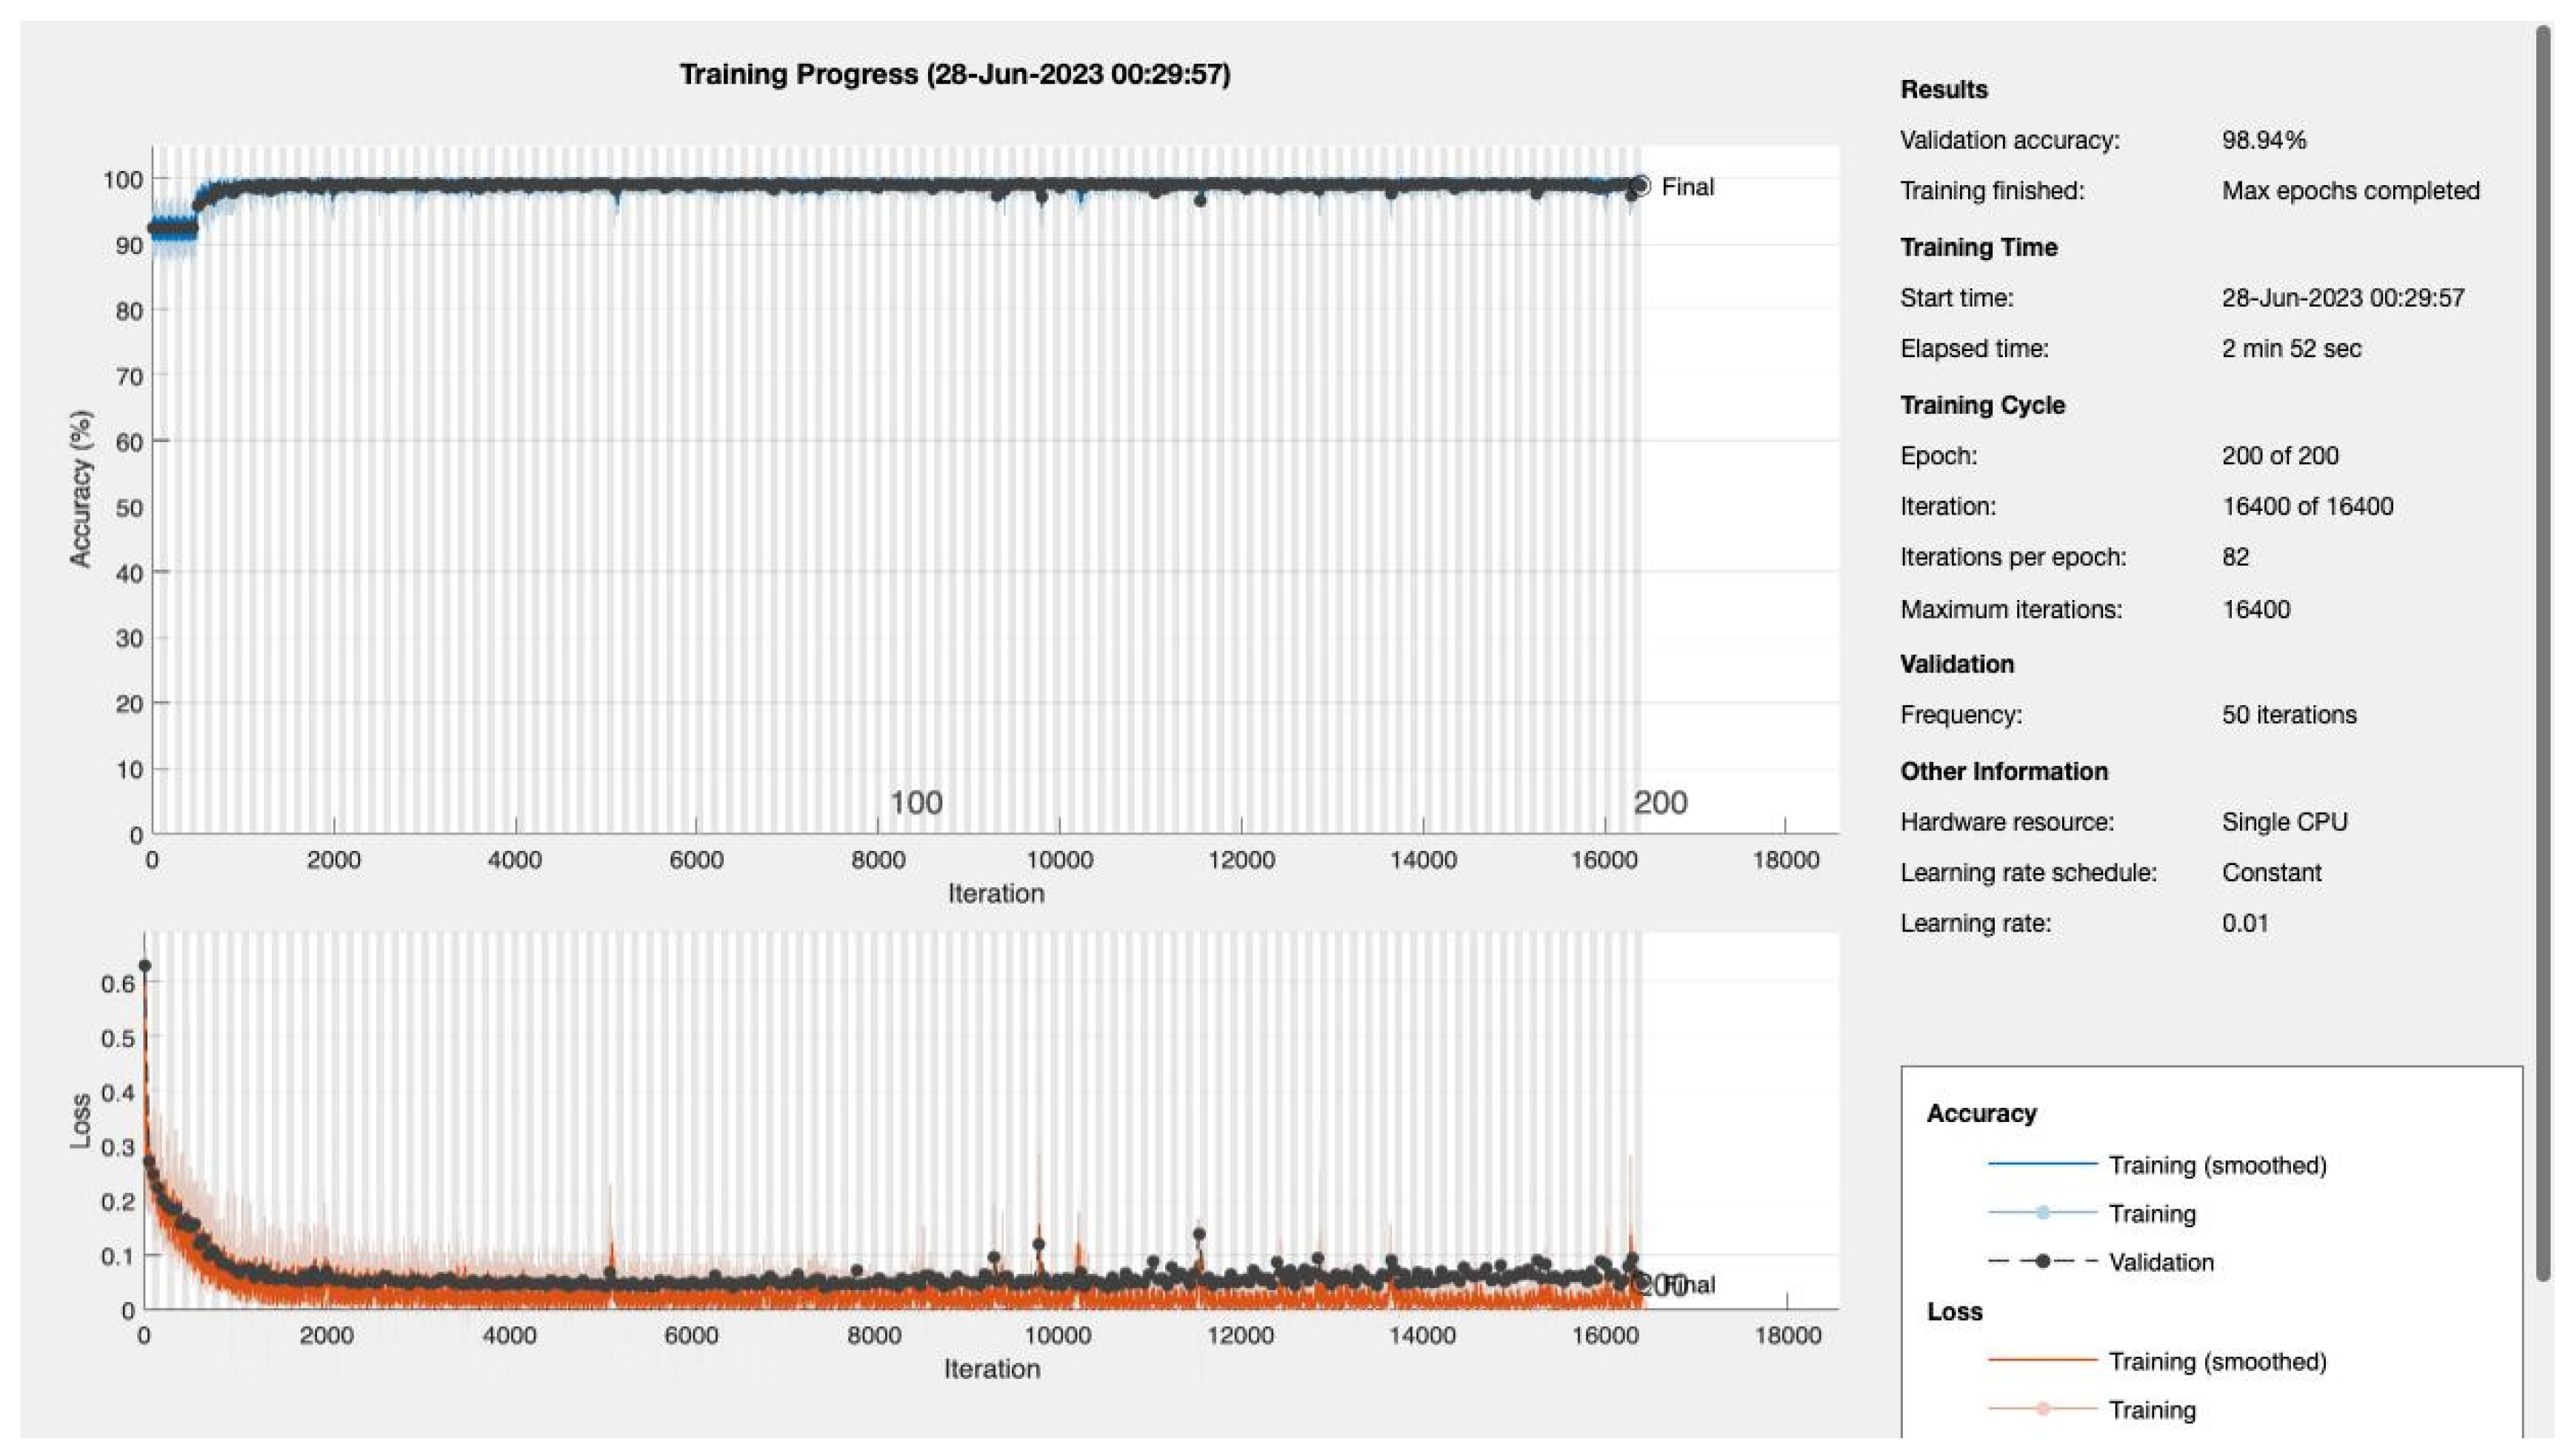
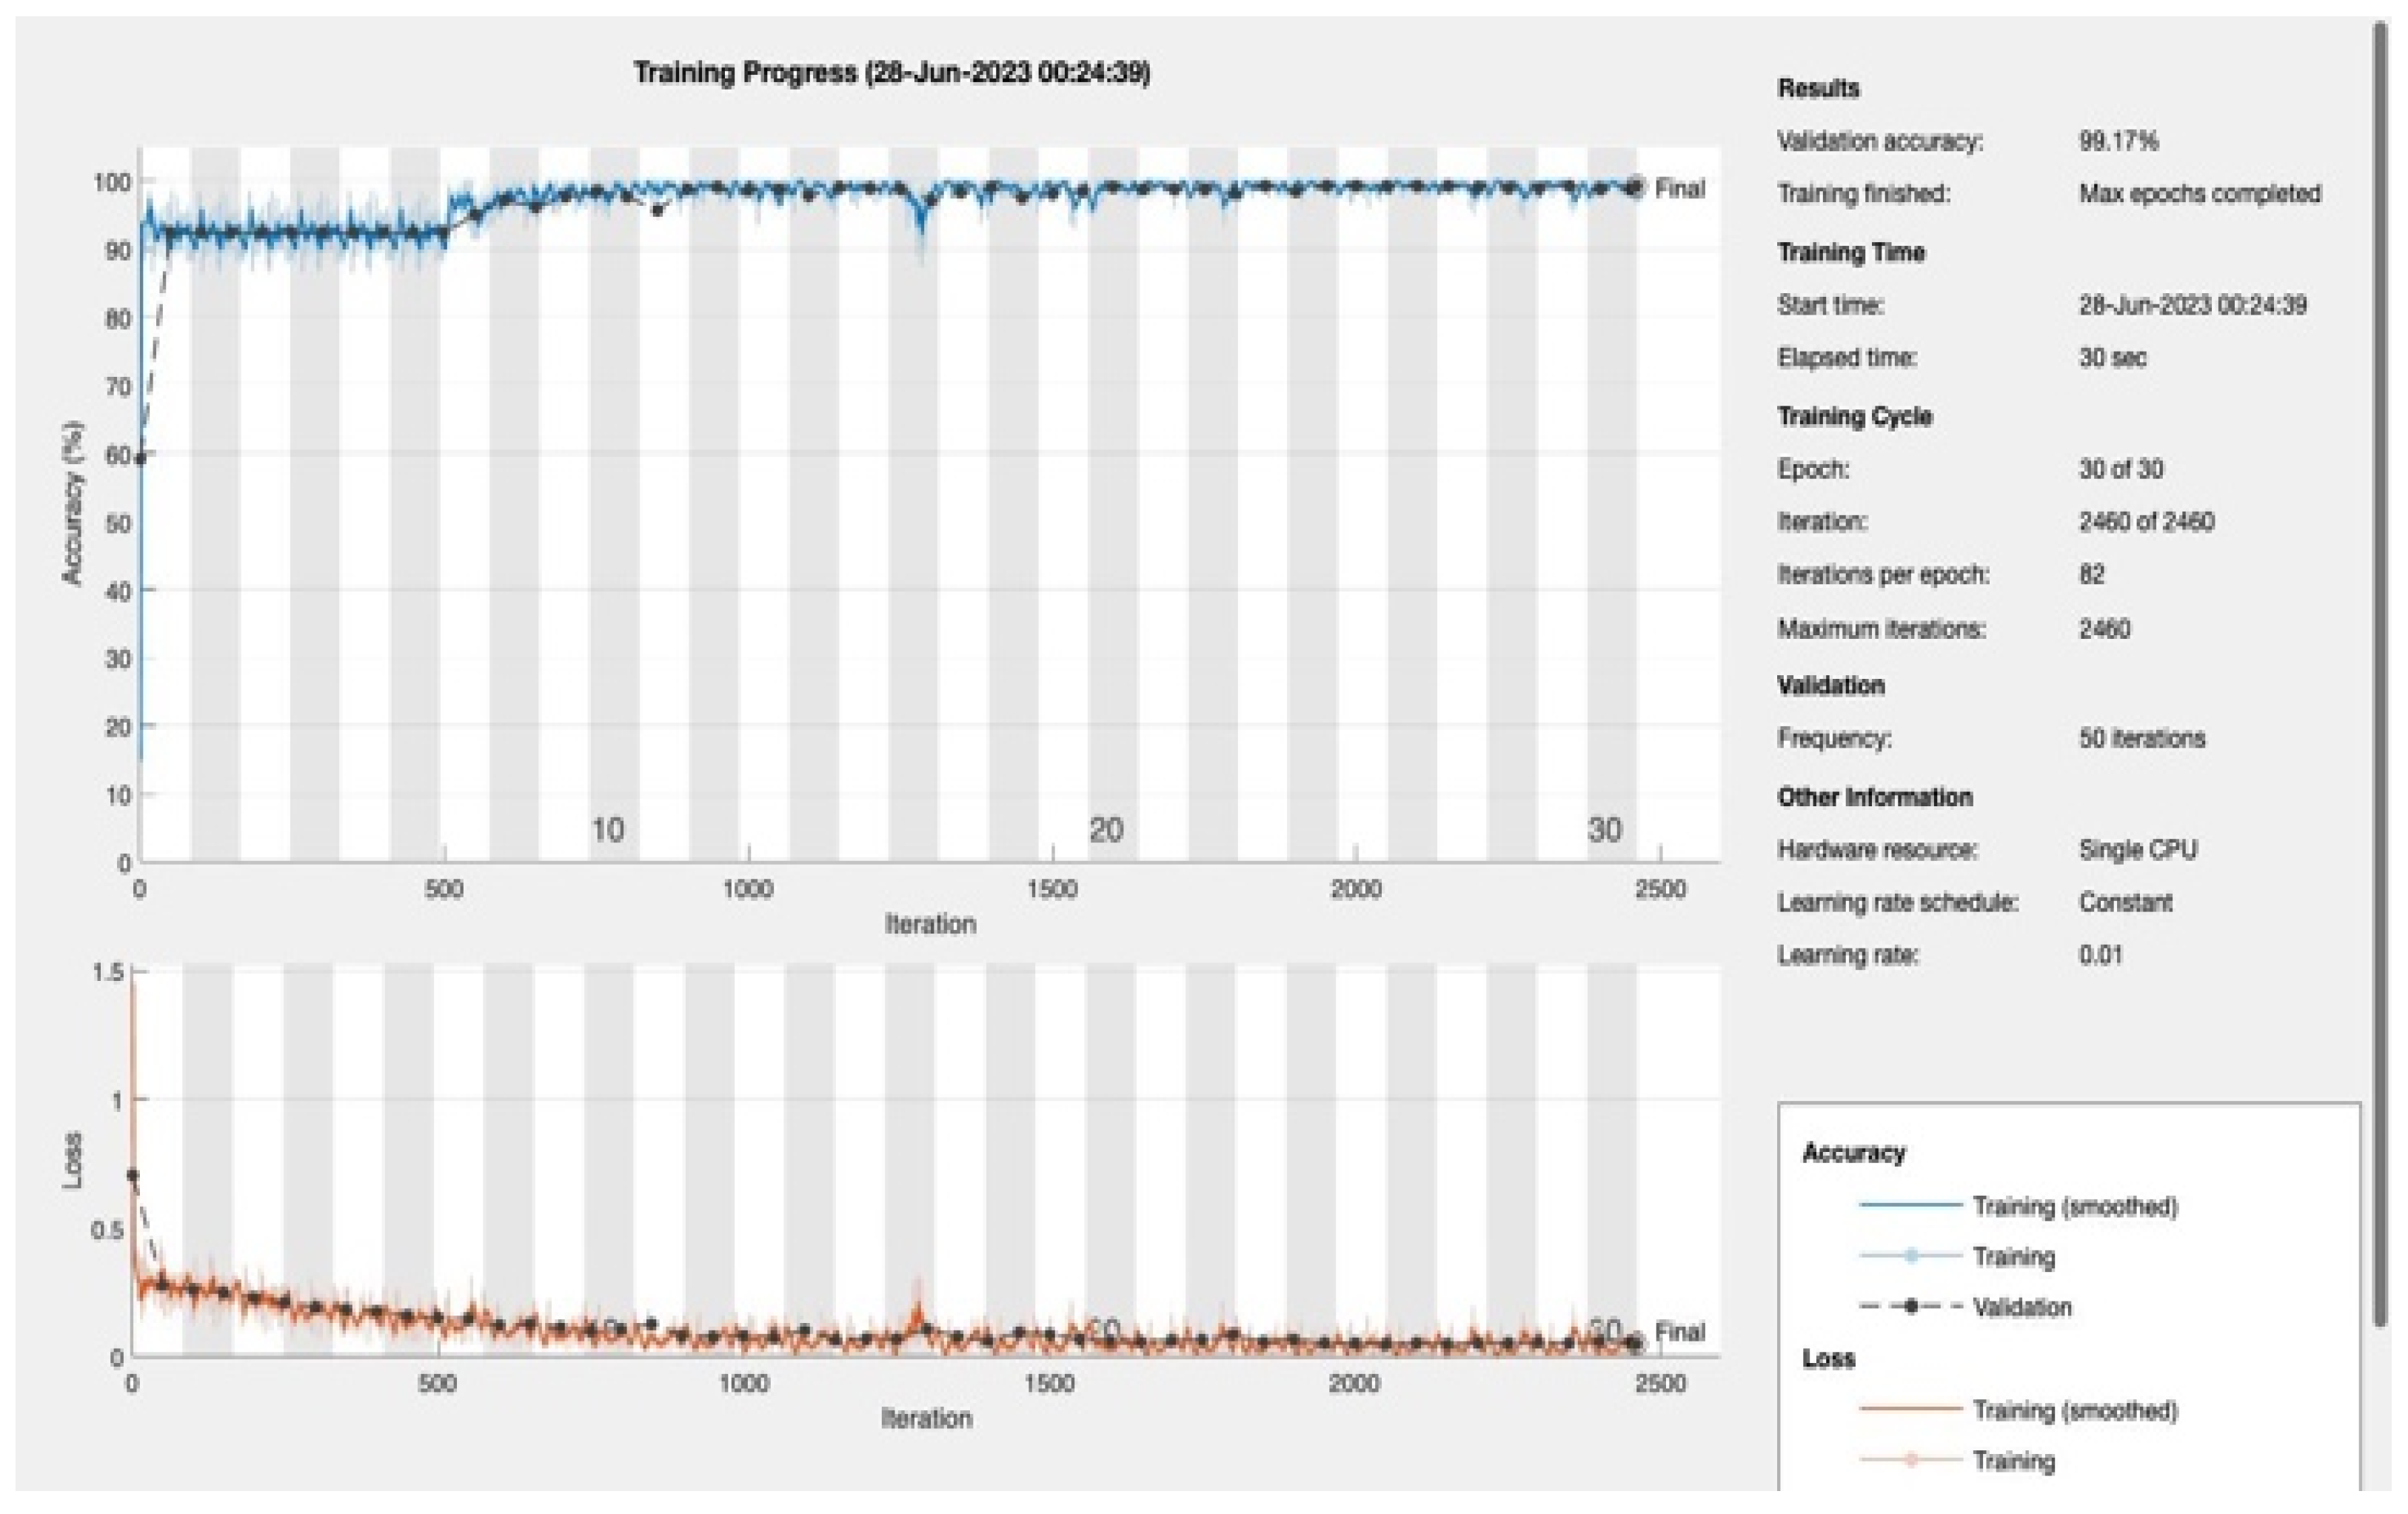
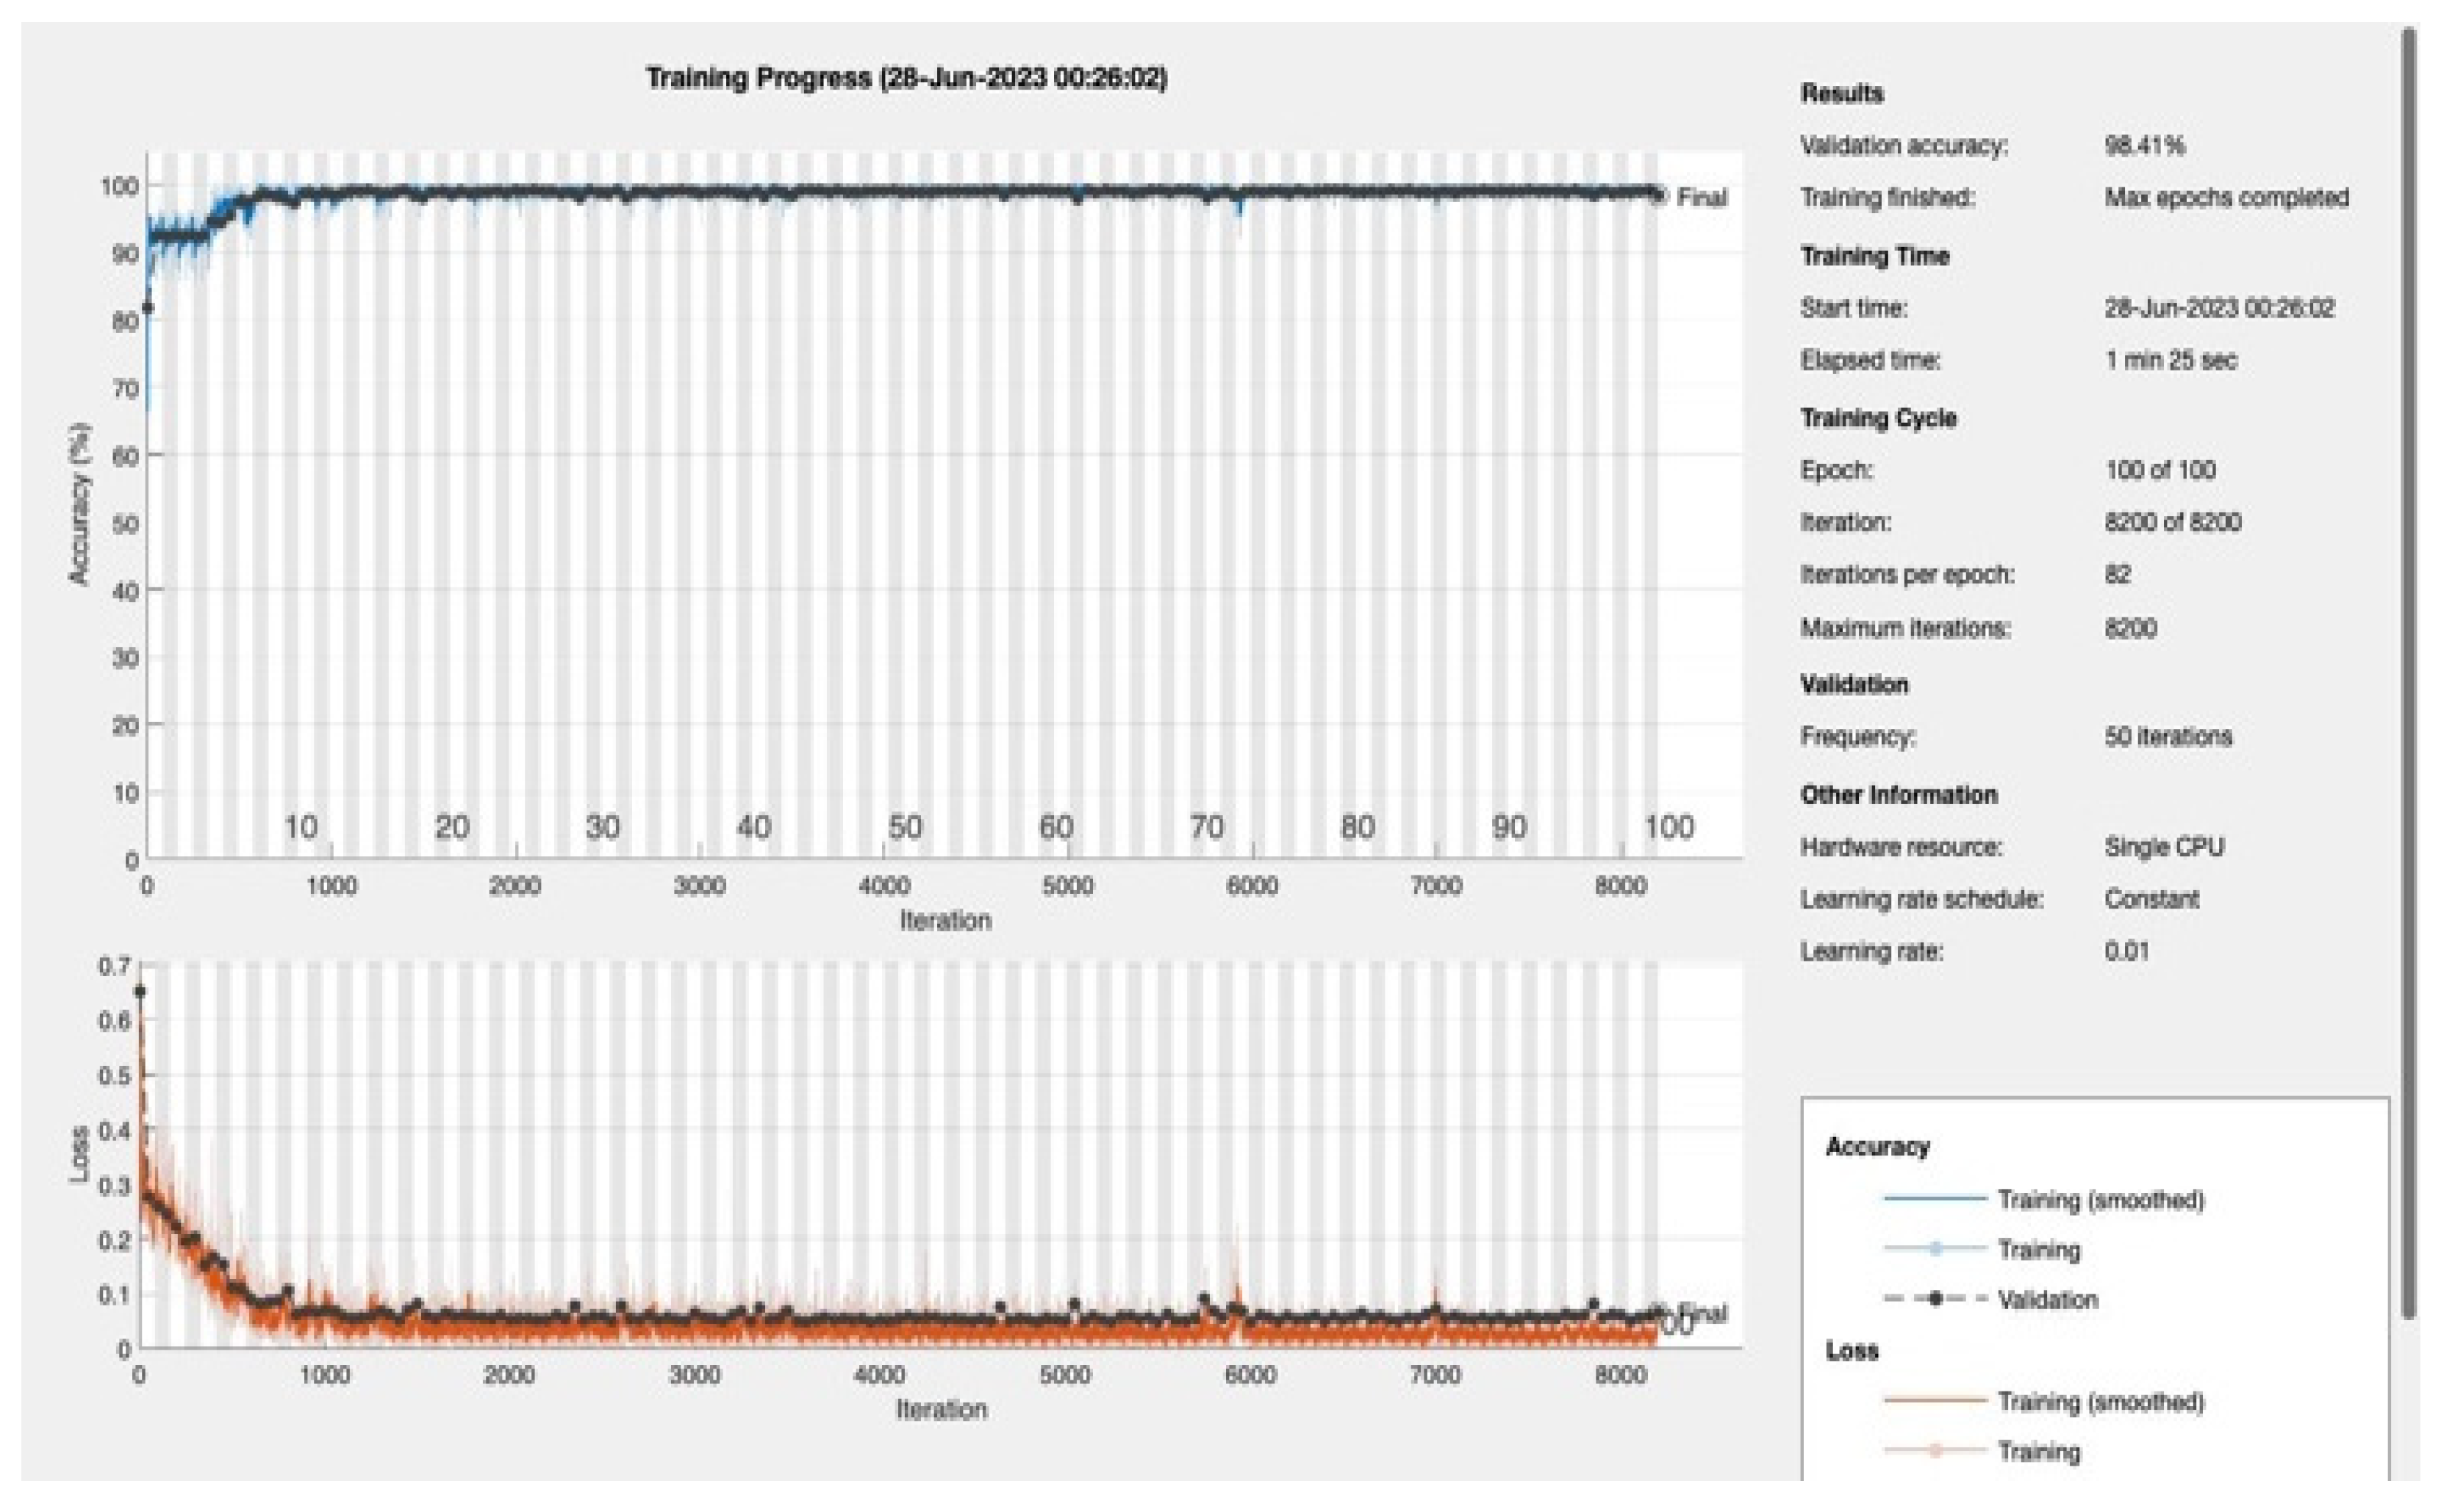
To determine the optimal number of epochs for model training, we tested a range of values - 10, 20, 30, 50, 100, 150, and 200. For each epoch value, the CNN was trained, and the performance was visualized with MATLAB's built-in plotting functionality. To avoid overfitting and ascertain the best epoch for the model, we employed the validation data (XValidation, YValidation) during the training phase [
49].
After the models were trained, they were tested using unseen testing data, which enabled an unbiased evaluation of their performance. This procedure led to the computation of several performance metrics such as accuracy, F1-score, recall, and sensitivity, thus offering a comprehensive understanding of the model's classification abilities.
In conclusion, the proposed 4D CNN model was successfully trained and validated utilizing the steps mentioned above. This approach has proven to be robust for the classification task at hand.
4. Evaluation Results of the 4D CNN Model
In this study, we proposed a novel 4D Convolutional Neural Network (CNN) model and evaluated its performance for predicting the presence of diabetes. We used the metrics of accuracy, F1 score, recall, and sensitivity to evaluate the model's performance.
We varied the number of training epochs, training the model for 10, 20, 30, 50, 100, 150, and 200 epochs see
Figure 4 and
Figure 5,
Appendix A. Our model achieved a remarkable accuracy ranging between 98.49% and 99.17%. In terms of F1 score, the model achieved a range between 0.8913 and 0.94359, indicating an excellent balance between precision and recall.
Our model's recall and sensitivity scores were also impressive. The recall score ranged between 0.80392 and 0.90196, demonstrating the model's strong ability to identify true positive cases. Similarly, the sensitivity, which represents the True Positive Rate, ranged between 0.92857 and 1, suggesting that the model had a high rate of predicting true positive cases correctly. The following table summarizes the performance metrics:
Table 3.
Performance Results.
Table 3.
Performance Results.
| Epochs |
Accuracy |
F1 Score |
Recall |
Sensitivity |
| 10 |
0.98487 |
0.8913 |
0.80392 |
1 |
| 20 |
0.99168 |
0.94359 |
0.90196 |
0.98925 |
| 30 |
0.98638 |
0.90323 |
0.82353 |
1 |
| 50 |
0.98941 |
0.92929 |
0.90196 |
0.95833 |
| 100 |
0.99168 |
0.94359 |
0.90196 |
0.98925 |
| 150 |
0.99092 |
0.93878 |
0.90196 |
0.97872 |
| 200 |
0.98638 |
0.91 |
0.89216 |
0.92857 |
5. Discussion
The performance of our proposed 4D CNN model is comparable, if not superior, to other state-of-the-art methods for predicting diabetes.
A recent study applied various machine learning algorithms to the Pima Indian Diabetes dataset and achieved an accuracy of 88.6% using a neural network model with two hidden layers [
50]. Our CNN model, in contrast, achieved an accuracy well above 98% across all tested epochs, signifying a considerable improvement.
Furthermore, another study developed a Convolutional LSTM model for diabetes detection and found it outperformed other models, demonstrating the effectiveness of deep learning techniques in diabetes prediction [
51]. While the precise performance metrics were not explicitly reported, our model's high accuracy and robust F1 score, recall, and sensitivity metrics suggest that it can hold its ground against other high-performing models.
Interestingly, a study comparing different deep learning architectures, including AlexNet, VGG Net, ResNet, DenseNet, and EfficientNet for diabetic retinopathy detection, showed that these models could achieve remarkable results [
52]. Although our study differs in the target condition and input data (we focused on general diabetes prediction rather than diabetic retinopathy), our CNN model's performance is in line with these high-performing architectures, further reinforcing the effectiveness of CNNs in medical prediction tasks.
Finally, our study further confirms the value of machine learning and deep learning techniques for early disease detection, as emphasized in numerous other studies [50, 51,52,53,54]. By accurately predicting the presence of diabetes, our proposed model could aid in the early detection and treatment of this prevalent condition, potentially saving lives and reducing the burden on healthcare systems.
6. Conclusion
In conclusion, our research presents a ground-breaking approach to diabetes prediction through the development of a novel 4D CNN model. The model's architecture, specifically designed for multivariate data, demonstrates superior accuracy in early diabetes detection compared to traditional methods. The high performance of the model, as evidenced by impressive metrics such as accuracy, F1 score, recall, and sensitivity, validates its potential as an effective tool for personalized and proactive diabetes management. This research contributes to the global effort in fighting diabetes and holds promise for broader applications of CNNs in disease prediction and healthcare analytics. Implementing our proposed CNN model can have a profound impact on healthcare providers, policymakers.
Author Contributions
Originality of dataset K.A.S, Conceptualization K.A.S and W.B.; software, (K.A.S); validation, K.A.S, data curation, K.A.S; visualization K.A.S; supervision W.B; writing (K.A.S) and (W.B.)—original draft preparation (K.A.S).
Funding
Please add: This research received no external funding.
Institutional Review Board Statement
This study was approved by the Research and Ethical Review & Approval Committee, Ministry of Health, Oman (Proposal ID: MoH/CSW20/24055, 23/122020). This study does not involve humans or animals.
Informed Consent Statement
Not applicable. This study did not involve humans.
Data Availability Statement
The uniquely constructed Oman Diabetes Type II Screening Dataset, which substantiates the findings of this study, can be made available upon reasonable request by contacting the corresponding author.
Acknowledgments
I wish to convey my profound gratitude to the Research and Ethical Review & Approval Committee, Ministry of Health, Oman for their authorization and access to the indispensable data for this study. I further extend my sincere thanks to the Information Technology Department at the University of Technology and Applied Sciences-Al-Mussanha, Oman, whose provision of a paid study leave greatly facilitated my pursuit of a PhD at Brunel University London.
Conflicts of Interest
The authors declare no conflict of interest.
Appendix A
Model Training and Testing:
The dataset was split into training, validation, and testing sets using the Holdout method. The CNN model was trained using different numbers of epochs (10, 20, 30, 50, 100, 150, 200). For each epoch value, the model was trained and tested, and the performance metrics were evaluated.
References
- Seiglie, J.A.; Nambiar, D.; Beran, D.; Miranda, J.J. To tackle diabetes, science and health systems must take into account social context. Nat. Med. 2021, 27, 193–195. [Google Scholar] [CrossRef]
- World Health Organization, “Diabetes,” World Health Organisation, Apr. 05, 2023. Available online: https://www.who.int/news-room/fact-sheets/detail/diabetes.
- Lin, X.; Xu, Y.; Pan, X.; Xu, J.; Ding, Y.; Sun, X.; Song, X.; Ren, Y.; Shan, P.F. Global, regional, and national burden and trend of diabetes in 195 countries and territories: an analysis from 1990 to 2025. Sci. Rep. 2020, 10, 14790. [Google Scholar] [CrossRef]
- Ganasegeran, K.; Hor, C.P.; Jamil, M.F.A.; Loh, H.C.; Noor, J.M.; Hamid, N.A.; Suppiah, P.D.; Manaf, M.R.A.; Ch’ng, A.S.H.; Looi, I. A Systematic Review of the Economic Burden of Type 2 Diabetes in Malaysia. Int. J. Environ. Res. Public Heal. 2020, 17, 5723. [Google Scholar] [CrossRef]
- Rosella, L.C.; Lebenbaum, M.; Fitzpatrick, T.; O'Reilly, D.; Wang, J.; Booth, G.L.; Stukel, T.A.; Wodchis, W.P. Impact of diabetes on healthcare costs in a population-based cohort: a cost analysis. Diabet. Med. 2015, 33, 395–403. [Google Scholar] [CrossRef]
- The TRIAD Study Group Health Systems, Patients Factors, and Quality of Care for Diabetes. Diabetes Care 2010, 33, 940–947. [CrossRef]
- Aslan, M.F.; Sabanci, K. A Novel Proposal for Deep Learning-Based Diabetes Prediction: Converting Clinical Data to Image Data. Diagnostics 2023, 13, 796. [Google Scholar] [CrossRef]
- Cao, Y.; Näslund, I.; Näslund, E.; Ottosson, J.; Montgomery, S.; Stenberg, E. Using a Convolutional Neural Network to Predict Remission of Diabetes After Gastric Bypass Surgery: Machine Learning Study From the Scandinavian Obesity Surgery Register. JMIR Public Heal. Surveill. 2021, 9, e25612. [Google Scholar] [CrossRef]
- Sainte, L.M.; Aburahmah, L.; Almohaini, R.; Saba, T. Current Techniques for Diabetes Prediction: Review and Case Study. Appl. Sci. 2019, 9, 4604. [Google Scholar] [CrossRef]
- O. Gervasi et al., “Computational Science and Its Applications – ICCSA 2020,” in Springer, Y. Karaca , Ed., Jul. 2020. Available online: https://link.springer.com/chapter/10.1007/978-3-030-58802-1_28 (accessed on 25 June 2023). [CrossRef]
- Jaloli, M.; Cescon, M. Long-term Prediction of Blood Glucose Levels in Type 1 Diabetes Using a CNN-LSTM-Based Deep Neural Network. J. Diabetes Sci. Technol. 2022, 193229682210927. [Google Scholar] [CrossRef]
- Lee, K.; Ray, J.; Safta, C. The predictive skill of convolutional neural networks models for disease forecasting. PLOS ONE 2021, 16, e0254319. [Google Scholar] [CrossRef] [PubMed]
- Goel, S.; Sharma, S.; Tripathi, R. Predicting Diabetes using CNN for Various Activation Functions: A Comparative Study. 2021, 665–669. [CrossRef]
- Alex, S.A.; Nayahi, J.J.V.; Shine, H.; Gopirekha, V. Deep convolutional neural network for diabetes mellitus prediction. Neural Comput. Appl. 2021, 34, 1319–1327. [Google Scholar] [CrossRef]
- Ambekar, S.; Phalnikar, R. Disease Risk Prediction by Using Convolutional Neural Network. 2018, 1–5. [CrossRef]
- Mehmood, A.; Iqbal, M.; Mehmood, Z.; Irtaza, A.; Nawaz, M.; Nazir, T.; Masood, M. Prediction of Heart Disease Using Deep Convolutional Neural Networks. Arab. J. Sci. Eng. 2021, 46, 3409–3422. [Google Scholar] [CrossRef]
- Shankar, V.; Kumar, V.; Devagade, U.; Karanth, V.; Rohitaksha, K. Heart Disease Prediction Using CNN Algorithm. SN Comput. Sci. 2020, 1, 1–8. [Google Scholar] [CrossRef]
- Kugunavar, S.; Prabhakar, C.J. Convolutional neural networks for the diagnosis and prognosis of the coronavirus disease pandemic. Vis. Comput. Ind. Biomed. Art 2021, 4, 1–14. [Google Scholar] [CrossRef]
- Liszka-Hackzell, J.J. Prediction of Blood Glucose Levels in Diabetic Patients Using a Hybrid AI Technique. Comput. Biomed. Res. 1999, 32, 132–144. [Google Scholar] [CrossRef]
- P. Sharma, “Applications of Convolutional Neural Networks(CNN),” Analytics Vidhya, Oct. 04, 2021. Available online: https://www.analyticsvidhya.com/blog/2021/10/applications-of-convolutional-neural-networkscnn/ (accessed on 26 June 2023).
- Al Sadi, K.; Balachandran, W. Prediction Model of Type 2 Diabetes Mellitus for Oman Prediabetes Patients Using Artificial Neural Network and Six Machine Learning Classifiers. Appl. Sci. 2023, 13, 2344. [Google Scholar] [CrossRef]
- Yousif, J.H.; Khan, F.R.; Zia, K.; Al Saadi, N. Analytical Data Review to Determine the Factors Impacting Risk of Diabetes in North Al-Batinah Region, Oman. Int. J. Environ. Res. Public Heal. 2021, 18, 5323. [Google Scholar] [CrossRef]
- A Al-Lawati, N.; Alfonso, H.; Al-Lawati, J. Development and Validation of a Risk Score for Diabetes Screening in Oman. Oman Med J. 2021, 37, e340. [Google Scholar] [CrossRef] [PubMed]
- M. of H. Oman, “Ministry of Health Al Shifa System,” 2015. [Online]. Available online: https://omanportal.gov.om/wps/wcm/connect/2a19ffae-ade0-428b-9f7c-b30bdd874882/Al%2BShifa_MoH.pdf?MOD=AJPERES (accessed on 26 June 2023).
- Al Mandhari, A. Al-Raqadi, and B. Awladthani, “Al-Shifa Electronic Health Record System: From Simple Start to Paradigm Model,” Taylor & Francis Group an informa bunsiness, 2018. Available online: https://www.taylorfrancis.com/chapters/edit/10.1201/9781315586359-49/oman-ahmed-al-mandhari-abdullah-al-raqadi-badar-awladthani (accessed on 27 June 2023).
- The official e-government services portal, “Al-Shifa,” Whole of Government, 2013. Available online: https://omanuna.oman.om/en/home-top-level/whole-of-government/central-initiative/al-shifa (accessed on 26 June 2023).
- Y. MALHOTRA, “EDA, Cleaning & Modelling on Diabetes Dataset 💉,” kaggle.com, Aug. 03, 2021. Available online: https://www.kaggle.com/code/iamyajat/eda-cleaning-modelling-on-diabetes-dataset (accessed on 26 June 2023).
- Mehmet Akturk, “Diabetes Dataset,” Kaggle.com, Aug. 05, 2020. Available online: https://www.kaggle.com/datasets/mathchi/diabetes-data-set (accessed on 26 June 2023).
- M. of H. Oman, “Resources - Ministry of Health,” Moh.gov.om, 2019. Available online: https://www.moh.gov.om/en/web/directorate-general-of-planning/resources (accessed on 27 June 2023).
- MATLAB & Simulink. (n.d.), “Categorical Arrays - MATLAB & Simulink - MathWorks United Kingdom,” uk.mathworks.com, 2023. Available online: https://uk.mathworks.com/help/matlab/categorical-arrays.html (accessed on 27 June 2023).
- Math Solves Everything. (n.d.), “MATLAB: Convert categorical to numeric – Math Solves Everything,” imathworks.com. Available online: https://imathworks.com/matlab/matlab-convert-categorical-to-numeric/ (accessed on 27 June 2023).
- Stack Overflow. (n.d.), “Convert categorical strings to integers in Matlab,” Stack Overflow, Jul. 09, 2017. Available online: https://stackoverflow.com/questions/44999283/convert-categorical-strings-to-integers-in-matlab (accessed on 27 June 2023).
- MathWorks. (n.d.), “Data Type Conversion - MATLAB & Simulink - MathWorks United Kingdom,” uk.mathworks.com, 2023. Available online: https://uk.mathworks.com/help/matlab/data-type-conversion.html (accessed on 27 June 2023).
- missing data using nearest-neighbor method MATLAB knnimpute, “Impute missing data using nearest-neighbor method - MATLAB knnimpute - MathWorks United Kingdom,” uk.mathworks.com, 2023. Available online: https://uk.mathworks.com/help/bioinfo/ref/knnimpute.html (accessed on 27 April 2023).
- F. k-nearest neighbors using input data MATLAB knnsearch., “Find k-nearest neighbors using input data - MATLAB knnsearch - MathWorks United Kingdom,” uk.mathworks.com, 2023. Available online: https://uk.mathworks.com/help/stats/knnsearch.html (accessed on 26 April 2023).
- Impute Missing Data in the Credit Scorecard Workflow Using the k-Nearest Neighbors Algorithm, “Impute Missing Data in the Credit Scorecard Workflow Using the k-Nearest Neighbors Algorithm - MATLAB & Simulink Example - MathWorks United Kingdom,” uk.mathworks.com, 2023. Available online: https://uk.mathworks.com/help/finance/impute-missing-data-using-k-nearest-neighbor.html (accessed on 25 April 2023).
- k-nearest neighbor classification, “k-nearest neighbor classification - MATLAB - MathWorks United Kingdom,” uk.mathworks.com, 2023. Available online: https://uk.mathworks.com/help/stats/classificationknn.html (accessed on 27 April 2023).
- StackExchange, “K-nearest neighbour imputation of missing values,” Cross Validated, Mar. 23, 2016. Available online: https://stats.stackexchange.com/questions/200273/k-nearest-neighbour-imputation-of-missing-values (accessed on 27 April 2023).
- Machine Learning Mastery., “Fill missing entries - MATLAB fillmissing - MathWorks United Kingdom,” uk.mathworks.com, Jun. 24, 2020. Available online: https://uk.mathworks.com/help/matlab/ref/fillmissing.html (accessed on 27 June 2023).
- Brownlee, “kNN Imputation for Missing Values in Machine Learning,” Machine Learning Mastery, Aug. 17, 2020. Available online: https://machinelearningmastery.com/knn-imputation-for-missing-values-in-machine-learning/ (accessed on 27 April 2023).
- Madan, P.; Singh, V.; Chaudhari, V.; Albagory, Y.; Dumka, A.; Singh, R.; Gehlot, A.; Rashid, M.; Alshamrani, S.S.; AlGhamdi, A.S. An Optimization-Based Diabetes Prediction Model Using CNN and Bi-Directional LSTM in Real-Time Environment. Appl. Sci. 2022, 12, 3989. [Google Scholar] [CrossRef]
- Regnell, “CNNs-in-matlab,” GitHub, Dec. 11, 2022. Available online: https://github.com/KodAgge/CNNs-in-matlab (accessed on 2 March 2023).
- Kumar, “Machine Learning Model to Predict diabetes,” uk.mathworks.com, Jun. 25, 2020. Available online: https://uk.mathworks.com/matlabcentral/fileexchange/77326-machine-learning-model-to-predict-diabetes (accessed on 11 April 2023).
- The MathWorks,” Lasso Regularization,” uk.mathworks.com, Jun. 2013. Available online: https://uk.mathworks.com/products/demos/machine-learning/diabetes.html (accessed on 15 April 2023).
- Mathworks., “MathWorks - Normalise Data—MATLAB Normalize,” www99.mathworks.com, 2018. Available online: https://uk.mathworks.com/help/matlab/ref/double.normalize.html (accessed on 27 June 2023).
- The Mathworks, “Partition data for cross-validation - MATLAB - MathWorks United Kingdom,” uk.mathworks.com, 2008. Available online: https://uk.mathworks.com/help/stats/cvpartition.html (accessed on 22 July 2022).
- he Mathwork, “Training indices for cross-validation - MATLAB training - MathWorks United Kingdom,” uk.mathworks.com, 2008. Available online: https://uk.mathworks.com/help/stats/cvpartition.training.html (accessed on 22 July 2022).
- Train deep learning neural network - MATLAB trainNetwork - MathWorks United Kingdom,” uk.mathworks.com, 2023. Available online: https://uk.mathworks.com/help/deeplearning/ref/trainnetwork.html (accessed on 1 March 2023).
- Training A Model From Scratch,” uk.mathworks.com. (accessed Jun. 21, 2022). Available online: https://uk.mathworks.com/solutions/deep-learning/examples/training-a-model-from-scratch.html (accessed on 21 June 2022).
- Khanam, J.J.; Foo, S.Y. A comparison of machine learning algorithms for diabetes prediction. ICT Express 2021, 7, 432–439. [Google Scholar] [CrossRef]
- Rahman, M.; Islam, D.; Mukti, R.J.; Saha, I. A deep learning approach based on convolutional LSTM for detecting diabetes. Comput. Biol. Chem. 2020, 88, 107329. [Google Scholar] [CrossRef]
- Pak, A.; Ziyaden, A.; Tukeshev, K.; Jaxylykova, A.; Abdullina, D. Comparative analysis of deep learning methods of detection of diabetic retinopathy. Cogent Eng. 2020, 7. [Google Scholar] [CrossRef]
- J, D.R.; Mca, C.D.O.; Jakka, A. Performance Evaluation of Machine Learning Models for Diabetes Prediction. Int. J. Innov. Technol. Explor. Eng. 2019, 8, 1976–1980. [Google Scholar] [CrossRef]
- David, S.K.; Rafiullah, M.; Siddiqui, K. Comparison of Different Machine Learning Techniques to Predict Diabetic Kidney Disease. J. Heal. Eng. 2022, 2022, 1–9. [Google Scholar] [CrossRef]
|
Disclaimer/Publisher’s Note: The statements, opinions and data contained in all publications are solely those of the individual author(s) and contributor(s) and not of MDPI and/or the editor(s). MDPI and/or the editor(s) disclaim responsibility for any injury to people or property resulting from any ideas, methods, instructions or products referred to in the content. |
© 2023 by the authors. Licensee MDPI, Basel, Switzerland. This article is an open access article distributed under the terms and conditions of the Creative Commons Attribution (CC BY) license (http://creativecommons.org/licenses/by/4.0/).
