
Submitted:
24 July 2023
Posted:
25 July 2023
You are already at the latest version
Abstract
Recent studies have indicated that terahertz time-domain spectroscopy (THz-TDS) can stably and efficiently acquire output spectra using an affordable and compact multimode laser diode (MMLD) with delayed optical feedback as the light source. This research focused on a numerical analysis of the optimal conditions for employing an MMLD with delayed optical feedback (chaotic oscillating laser diode) in THz-TDS, utilizing multimode rate equations. The findings revealed that the intermittent chaotic output generated by the MMLD, characterized by concurrent picosecond pulse oscillations lasting several tens of picoseconds, proves to be highly effective for THz-TDS. By appropriately setting the amounts of injection current and optical feedback, and the delay time of optical feedback, intermittent chaotic oscillation can be attained within a considerably broad parameter range. Moreover, both the MMLD output spectrum and the THz-TDS output spectrum exhibit a consistently stable shape at the microsecond scale, demonstrating the attractor properties inherent in an MMLD with delayed optical feedback.
Keywords:
terahertz time-domain spectroscopy
; multimode laser diode
; delayed optical feedback
; laser chaos
; intermittent chaos
; picosecond optical pulse generation
; concurrent pulse oscillation
; multimode rate equations
1. Introduction
In recent years, the field of terahertz technology has witnessed remarkable progress in both fundamental and practical investigations [1,2]. Among the crucial techniques in this field, terahertz time-domain spectroscopy (THz-TDS) stands out as an invaluable method [3,4]. It enables precise measurement of complex permittivity at room temperature, and its roots can be traced back to the pioneering Auston switch [5]. Consequently, numerous researchers are actively engaged in exploring this technology [6,7,8,9,10,11,12,13,14]. However, a major challenge associated with THz-TDS is the requirement of a large and expensive mode-locked femtosecond laser as the light source. To address this issue, one solution that has already been reported is the utilization of a multimode laser diode, known as MMLD, which offers promising advantages [15,16,17,18,19]. Another proposed solution involves the use of a chaotically oscillating laser diode called COLD to achieve more stable and efficient THz-TDS outputs [20,21,22]. However, the underlying reasons behind the effectiveness of COLD remain unclear. The objective of this paper is to numerically determine the optimal conditions for utilizing an MMLD with delayed optical feedback to achieve stable and efficient THz-TDS outputs. This investigation is conducted by employing the multimode laser diode rate equations, aiming to provide valuable insights into enhancing the performance of THz-TDS systems.
2. Methods
2.1. Rate Equations for a Multimode Laser Diode with Delayed Optical Feedback
We initiate the simulation process by modeling a multimode laser diode (MMLD) with delayed optical feedback, employing the rate equations specific to MMLDs. This comprehensive model incorporates the inclusion of Langevin noise and accounts for the band filling effect, as described in previous works [23,24,25,26].
where Em, Em(t−τfb), Sm, and gm are the complex optical electric field, the complex delayed optical feedback field, photon density, and the modal gain for the mth-mode, respectively. The delayed optical feedback term is added to the last term on the right-hand side of Equation (1) and recombines with the MMLD cavity using a coupling coefficient, fc. This formulation is based on the Lang-Kobayashi equation for single-mode oscillation [27]. Since the MMLD output releases approximately 90% of the optical energy from the cavity to the outside during the round-trip time, up to 81% of the optical energy is fed back into the MMLD cavity through the delayed optical feedback. As a result, the maximum value of fc is 0.9 (). To simplify the interaction between the complex delayed optical feedback fields and the complex optical electric fields in the LD cavity, we assumed a coupling phase between them of zero, and therefore fc was treated as a real number. This choice reflects the positioning of the external mirror at an integer multiple of the optical path length of the LD cavity. N is the carrier density. Rspn and T1 are the carrier density dependent-spontaneous emission coefficient and -carrier lifetime, respectively. ξSm and ξN are the zero-mean and unit-variance Gaussian distributions, respectively, whose amplitudes are varied every ∆τc as step functions [25,26]. The differential gain coefficient, G0m, the carrier density at transparency, N0m, and the intrinsic gain saturation coefficient, εNm, for the mth-mode are represented by polynomial equations of mode number m [24,25,26]. The condition m = 0 stands for the central mode, which is set to 375 THz (800 nm) by taking into account wavelength matching with a GaAs photoconductive antenna. A negative mode number indicates that the oscillation frequency for the mode of interest is lower than the central frequency, while a positive mode number indicates that it is higher. The m-value was varied over a range of −30 to +30, allowing for the simulation of multimode oscillation involving a total of 61 modes. The notation and values for the other parameters are listed in Table 1.
The temporal evolutions of variables Em(t) and N(t) were numerically evaluated at regular intervals of 0.03 ps using the fourth-order Runge-Kutta method, considering the specified parameter values.
2.2. Simulation Model for THz Time-Domain Spectroscopy
Figure 1 illustrates a typical numerical model of a THz-TDS system. The system comprises an MMLD with delayed optical feedback, serving as the input light source. The input light is divided equally into pump light and probe light using a half mirror. The pump light is focused on a gap between metallic electrodes of a photoconductive antenna, generating photo-carriers, n(t), described by the equation:
Here, φm represents an arbitrary phase for the mth-mode. The photo-carriers induce a transient current, J(t), when a bias voltage is applied to the gap. Consequently, electromagnetic waves are emitted into free space, with their amplitude being proportional to the time derivative of the transient current, dJ(t)/dt. In cases where the antenna exhibits wideband characteristics due to the ultrafast relaxation time of the photo-carriers, the THz wave, ETHz(t), can be represented as
The frequency of the electromagnetic waves is in the range from sub-THz to a few THz, corresponding to the optical beats of the MMLD output.
The THz waves are collimated using an off-axis parabolic mirror and subsequently pass through a sample. Another off-axis parabolic mirror is employed to focus the transmitted THz waves onto a second photoconductive antenna, similar to the first one. The second antenna is also irradiated by the probe light to generate photo-carriers, n(t), within its gap. The photo-carriers flow outside the photoconductive antenna as a transient current, which is proportional to the potential difference across the gap determined by the electric field of the irradiated THz waves. By varying the delay time, τ, for the probe light, a cross-correlation trace, CC(τ), between the THz- and the photo-carrier-waveforms can be obtained. CC(τ) can be represented by
The THz-TDS output of the no sample case, , is obtained by Fourier-transforming CC(τ) as
which is proportional to the power spectrum of the photo-carriers [26].
3. Results and Discussion
3.1. Classification of LD Oscillation State by the Coupling Coefficient of Optical Feedback
Figure 2 shows simulated results of temporal waveforms for 1 µs of the MMLD outputs (a1−d1), along with the corresponding power spectra (a2−d2) and THz-TDS outputs (a3−d3) for different values of fc: 0 (a1−a3), 0.1 (b1−b3), 0.4 (c1−c3), and 0.6 (d1−d3) when the pumping rate r and the delay time of the optical feedback τfb are set to 1.5 and 1 ns, respectively. When fc is set to 0 (no optical feedback), the MMLD exhibits steady-state oscillation (a1), albeit with a relatively significant amount of noise resulting from the Langevin noise. The side-mode suppression ratio attains 26.4 dB (a2), indicating that the MMLD operates in single-mode oscillation at the −1st mode. As a result, the generation of optical beats between the multimode is effectively suppressed, leading to a low THz-TDS output (a3). When fc is set to 0.1, the temporal waveform exhibits chaotic behavior (b1), and the spectrum demonstrates multimode oscillation, primarily operating in four modes ranging from the −4th to the −1st mode (b2). This behavior arises from the periodic optical feedback, which acts as a seed light for each mode, preventing the concentration of gain in a particular mode. The presence of optical feedback disrupts the MMLD's ability to settle into steady-state oscillation, resulting in a continuous transient state. Consequently, the THz-TDS output spectrum (b3) shows an increase in the 139, 278, and 417 GHz spectral components, corresponding to one, two, and three times the longitudinal mode spacing of the MMLD, respectively. Subsequently, when fc is raised to 0.4, the temporal waveform exhibits intermittent chaotic oscillation, characterized by intense peaks at specific time points: 6, 116, 134, 189, 284, 420, 508, 579, 648, 736, 875, and 959 ns (c1). Concurrently, the multimode spectrum of the MMLD output broadens asymmetrically (c2), leading to a corresponding broadening of the THz-TDS output spectrum to approximately 2 THz (c3). Moreover, the widening of each linewidth observed in both the LD output spectrum (c2) and the corresponding THz-TDS output spectrum (c3) indicates that the intermittent chaotic oscillation is accompanied by the presence of short optical pulses. However, when fc is further increased to 0.6, the MMLD returns to steady-state oscillation (d1) with two (−5th and −6th) modes (d2). The resulting THz-TDS output spectrum displays only a 139 GHz spectral component (d3). This result can be attributed to the delicate equilibrium between optical feedback and optical gain, with the presence of relatively strong optical feedback leading to the phenomenon of optical injection locking in the MMLD. By performing area integration on the spectra presented in Figure 2(a2)−(d2), we observed a moderate increase in the MMLD output by a factor of 1.06 (fc = 0.1), 1.46 (fc = 0.4), and 1.91 (fc = 0.6) compared to the case without optical feedback (a2). This increase is attributed to the presence of optical feedback. In contrast, upon analyzing the corresponding THz-TDS outputs from the area integration of the spectra in Figure 2(a3)−(d3), a significant surge was estimated. The THz-TDS outputs experienced an increase by a factor of 22 (fc = 0.1), 676 (fc = 0.4), and 466 (fc = 0.6) due to the effect of optical feedback. These findings demonstrate that an appropriate amount of optical feedback is necessary to achieve broadband and high-intensity THz-TDS output using an MMLD with delayed optical feedback.
3.2. Characteristics of Intermittent Chaotic Oscillations
Next, we will conduct a detailed numerical investigation of the intermittent chaotic oscillation under the condition of fc = 0.4. Figure 3(a) depicts the temporal waveform of the carrier density when fc is set to 0.4, revealing significant accumulations of carrier density at specific time points: 0, 109, 130, 179, 276, 414, 502, 576, 644, 728, 866, and 956 ns. It is worth noting that the intense peak intensities observed in the MMLD output in Figure 2(c1) occur between 3 to 10 ns after the carrier density accumulation timings, indicating that the MMLD operates similar to a Q-switched laser [28] under the given optical feedback condition. Figure 3(b) and 3(c) illustrate the temporal variations of the MMLD output energy (b) and the THz-TDS output energy (c), respectively, integrated every 1 ns. The distinct energy drops observed in Figure 3(b) precisely correspond to the significant carrier density accumulations shown in Figure 3(a). These rapid energy drops in Figure 3(b) can be observed when the temporal waveform depicted in Figure 2(c1) is measured with a slightly slower optical detector, commonly referred to as "low-frequency fluctuation (LFF)" in the field of laser chaos [29]. In contrast, the distinct energy increases observed in Figure 3(c) align precisely with the strong peak intensities of the MMLD output in Figure 2(c1).
In Figure 4(a), a magnified view of a section from Figure 3(c) is presented. The points (b), (c), and (d) within the figure correspond to the THz-TDS output energies during specific time periods: (b) 644−645 ns, (c) 648−649 ns, and (d) 690−691 ns, respectively. Figure 4(b), 4(c), and 4(d) display the corresponding temporal waveforms of the MMLD output for the respective time periods. During the time periods (b) and (c), characterized by the occurrence of the LFF phenomenon, optical pulses with durations in the range of several tens of picoseconds are generated. Conversely, during many other time periods, chaotic oscillations with low peak intensities are observed, as depicted in Figure 4(d). Notably, the THz-TDS output energy is maximized when the shortest pulse, approximately 30 ps in duration, is generated (Figure 4(c)). Therefore, the efficient generation of optical short pulses is crucial for achieving effective THz-TDS utilizing the MMLD with delayed optical feedback. This is because the generation of THz waves relies on the time derivative of the temporal waveform of photo-carriers, as described in Equation (8).
In Figure 5(a), the power spectrum of the MMLD output in Figure 4(b) is presented. Despite the short 1 ns time period, many oscillation mode components are generated simultaneously. The corresponding temporal waveforms of eight modes (−2nd to 5th) are displayed in Figure 5(b), revealing the nearly simultaneous oscillation of approximately 50 ps optical pulses with different pulse peaks. Thus, the optical modulation of the MMLD by the optical feedback results in the generation and concurrent oscillation of picosecond optical pulses, thereby enhancing the occurrence of optical beats in THz-TDS.
Figure 6(a) and 6(b) present the power spectra of the MMLD outputs in Figure 4(c) and 4(d), respectively. Despite both spectra exhibiting symmetric shapes of multimode oscillation due to the influence of optical feedback, there is a notable distinction in the spectral width depending on the presence or absence of high-peak picosecond optical pulses during each time period. The spectral width of the power spectrum in Figure 6(b) is comparable to that in Figure 2(b2) calculated under the condition of fc = 0.1. In contrast, the spectrum in Figure 6(a) is approximately three times wider than that in Figure 6(b). Furthermore, the spectral peak in Figure 6(a) is shifted toward shorter wavelengths by approximately 1 nm in comparison to that in Figure 6(b). This shift reflects the band-filling effect resulting from the abrupt accumulations of carrier density just prior to the generation of picosecond optical pulses, as seen in Figure 3(a). In Figure 4(b), the temporal waveform exhibits a mixture of picosecond pulses and chaotic oscillations with relatively low intensities, with both elements present in almost equal proportions. As a result, the corresponding power spectrum shown in Figure 5(a) clearly resembles the composite shape of the power spectra in Figure 6(a) and 6(b), with significant asymmetry in its spectral profile. The power spectrum averaged over 1 μs in Figure 2(c2) also exhibits a similar asymmetric shape, which is evidence that the MMLD output exhibits intermittent chaotic oscillations.
Figure 6(c) presents an experimental result of the output spectrum of the MMLD (Sharp, DL-7140-213X, 780 nm) with delayed optical feedback, which was utilized as an efficient light source for generating and detecting THz waves in reference [22]. In the experiment, the injection current of the MMLD was set to 80 mA against the threshold current of 40 mA (r = 2.0), and an external cavity length of approximately 30 cm (τfb = 2 ns) was used. The observed asymmetric spectral shape depicted in Figure 6(c) is consistent with the calculation shown in Figure 2(c2), indicating that the MMLD with delayed optical feedback used in the experiment exhibited intermittent chaotic oscillations including picosecond optical pulse generation. In that sense, the COLD (chaotic oscillating laser diode) used in the THz-TDS experiment can be specifically called ICOLD (intermittent chaotic oscillating laser diode).
3.3. Time Convergence of Output Spectral Shapes
Figure 7(a) shows the temporal variation of the intensity difference, DLD(t), between adjacent MMLD output spectra averaged every 1 ns using the rate equations mentioned above. This intensity difference is calculated using the following equation:
where and represent the spectral intensity of the power spectra of the MMLD outputs averaged within the time points t0 and t1, respectively. The time difference between t0 and t1 was set to 1 ns, and this calculation continued until t1 reached 1 μs. The intensity difference demonstrates a convergence trend, approximately reaching a reciprocal of time. Figure 7(b), 7(c), and 7(d) depict power spectra of the MMLD outputs averaged over 10 ns, 100 ns, and 500 ns, respectively. Taking into account the convergence of the intensity difference displayed in Figure 7(a), the power spectrum shape in Figure 7(d) (averaged over 500 ns) closely resembles that of Figure 2(c2) (averaged over 1000 ns). Hence, despite the chaotic changes in the temporal waveform of the MMLD output with delayed optical feedback from moment to moment, the averaged power spectrum consistently converges to a constant shape, reflecting the attractor characteristics of the MMLD system with delayed optical feedback. These findings are consistent with the previously reported experimental result that the averaged power spectrum was stably observed with a constant shape [22]. The results presented in Figure 7 demonstrate that the power spectrum of the MMLD with delayed optical feedback stabilizes to a constant shape through a time average on the order of microseconds.
Figure 8(a) shows the temporal variation of the intensity difference, DTHz(t), between adjacent THz-TDS output spectra averaged every 1 ns. This intensity difference is calculated using the following equation:
where and represent the spectral intensity of the power spectra of the THz-TDS outputs averaged within the time points t0 and t1, respectively. Similar to Figure 7, the time difference between t0 and t1 was set to 1 ns, and this calculation continued until t1 reached 1 μs. Additionally, Figure 8(b), 8(c), and 8(d) present the power spectra of the THz-TDS outputs, averaged over 10 ns, 100 ns, and 500 ns, respectively. The observed fluctuations in Figure 8(a) can be attributed to the time derivative of the chaotic temporal waveform of the photo-carriers during THz wave generation described in Equation (8). Despite the presence of fluctuations, which introduce a certain amount of delay, they still adhere to the overall convergence trend observed in the MMLD output spectrum illustrated in Figure 7.
3.4. Expansion of Intermittent Chaotic Oscillation Region
Figure 9(a) illustrates the temporal waveform peaks as a function of fc for the time period of 900−1000 ns, with r = 1.5 and τfb = 1 ns (the same conditions as in Figure 2). Notably, significant peak fluctuations with intensities exceeding 100 (arb. unit), indicative of intermittent chaos, are observed only when fc is set to 0.27, 0.32, and 0.40. These values correspond to situations where even slight variations in fc cause a sharp decrease in the THz-TDS output. However, previous experiments reported that the THz-TDS output exhibited only minor fluctuations in response to slight variations in fc [22]. To reconcile these calculation results with the experimental results, the controllable parameter values (pumping rate r and delay time of the optical feedback τfb) were systematically varied, and the corresponding bifurcation diagrams were plotted in Figure 9(b1), 9(b2), 9(c1), and 9(c2). Specifically, Figure 9(b1) and 9(b2) demonstrate that under higher r values, the region of intermittent chaos expands towards the higher fc side. This expansion is attributed to the increase in the relaxation oscillation frequency of the MMLD resulting from an increase in r, which in turn increases the likelihood of intermittent chaotic oscillation. Figure 9(c1) demonstrates that when τfb is set to a short time (0.5 ns), the region of intermittent chaos completely disappears. This phenomenon can be attributed to the high frequency of the optical modulation caused by the optical feedback (1/τfb ~ 2 GHz), which approaches the relaxation oscillation frequency of the MMLD driven at r = 1.5 (~ 4 GHz). In contrast, in Figure 9(c2), where τfb is set to 2 ns, the frequency of the optical modulation (1/τfb ~ 0.5 GHz) becomes significantly lower than the relaxation oscillation frequency, resulting in an expansion of the intermittent chaos region. Thus, increasing the injection current or delay time expands the intermittent chaotic area of the MMLD with delayed optical feedback.
4. Conclusions
In THz-TDS, we employed a miniature MMLD with delayed optical feedback as the light source. Through numerical analysis using the multimode rate equations, we determined the optimal conditions for the MMLD with delayed optical feedback to achieve highly sensitive and wide-band THz-TDS output. Remarkably, we discovered that the most favorable MMLD output for THz-TDS involves intermittent chaotic oscillation, encompassing concurrent picosecond pulse oscillations. The generation of intermittent chaotic oscillation can be confirmed by observing its characteristic asymmetric spectral shape. Furthermore, under the parameters of the MMLD with delayed optical feedback, we showed that the averaged power spectrum converges to a constant shape within the microsecond range. Correspondingly, the shape of the THz-TDS output spectrum also exhibits similar convergence. Notably, by significantly increasing both the controllable pumping rate and the delay time of the optical feedback, we found an expansion of the parameter space in which intermittent chaotic oscillation occurs. These findings hold significant importance for the application of THz-TDS utilizing a compact and cost-effective MMLD with delayed optical feedback as the light source.
Author Contributions
Conceptualization, K.W. and F.K.; methodology, K.W. and F.K.; software, K.W. and T. M.; validation, K.W., K.O. and F.K.; formal analysis, K.W. and F.K.; investigation, K.W., T.K. and F.K.; resources, K.W.; data curation, K.W. and T.K.; writing—original draft preparation, K.W.; writing—review and editing, K.W., T.M., K.O. and F.K.; visualization, K.W. and T.M.; supervision, K.O. and F.K.; project administration, K.W.; funding acquisition, K.W. All authors have read and agreed to the published version of the manuscript.
Funding
This research received no external funding.
Data Availability Statement
Data is contained within the article.
Acknowledgments
The authors thank Prof. Ken Umeno of Kyoto Univ., Prof. Kei Inoue of Sanyo-Onoda city Univ., and Dr. Yuki Kawakami of NIT, Fukui College for fruitful discussions on chaotic oscillations from laser diodes.
Conflicts of Interest
The authors declare no conflict of interest.
References
- Hangyo, M. Development and future prospects of terahertz technology. Jpn. J. Appl. Phys. 2015, 54, 120101. [Google Scholar] [CrossRef]
- Fundamentals of Terahertz Devices and Applications; Pavlidis, D., Ed.; John Wiley & Sons Ltd.; NJ, USA, 2021.
- Terahertz Optoelectronics; Sakai, K., Ed.; Springer, Berlin, Germany, 2005.
- Zhang, X.−C.; Xu, J. Introduction to THz Wave Photonics; Springer, Berlin, Germany, 2010.
- Auston, D.H.; Cheung, K. P.; Smith, P.R. Picosecond photoconducting Hertzian dipoles. Appl. Phys. Lett. 1984, 45, 284–286. [Google Scholar] [CrossRef]
- Pupeza, I.; Wilk, R.; Koch, M. Highly accurate optical material parameter determination with THz time-domain spectroscopy. Opt. Express 2007, 15, 4335–4350. [Google Scholar] [CrossRef] [PubMed]
- Withayachumnankul, W.; Fischer, B.M.; Lin, H.; Abbott, D. Uncertainty in terahertz time-domain spectroscopy measurement. J. Opt. Soc. Am. 2008, 25, 1059–1072. [Google Scholar] [CrossRef]
- Han, N.R.; Chen, Z.C.; Lim, C.S.; Ng, B.; Hong, M.H. Broadband multi-layer terahertz metamaterials fabrication and characterization on flexible substrates. Opt. Express 2011, 19, 6990–6998. [Google Scholar] [CrossRef]
- Yang, Y.; Shutler, A.; Grischkowsky, D. Measurement of the transmission of the atmosphere from 0.2 to 2 THz. Opt. Express 2011, 19, 8830–8838. [Google Scholar] [CrossRef]
- Shrekenhamer, D.; Rout, S.; Strikwerda, A.C.; Bingham, C.; Averitt, R.D.; Sonkusale, S.; Padilla, W.J. High speed terahertz modulation from metamaterials with embedded high electron mobility transistors. Opt. Express 2011, 19, 9968–9975. [Google Scholar] [CrossRef] [PubMed]
- Anthony, J.; Leonhardt, R.; Leon-Saval, S.G.; Argyros, A. THz propagation in kagome hollow-core microstructured fibers. Opt. Express 2011, 19, 18470–18478. [Google Scholar] [CrossRef] [PubMed]
- Niu, T.; Withayachumnankul, W.; Ung, B.S.-Y.; Menekse, H.; Bhaskaran, M.; Sriram, S.; Fumeaux, C. Experimental demonstration of reflectarray antennas at terahertz frequencies. Opt. Express 2013, 21, 2875–2889. [Google Scholar] [CrossRef] [PubMed]
- Islam, Md.S.; Cordeiro, C.M.B.; Franco, M.A.R.; Sultana, J.; Cruz, A.L.S.; Abbott, D. Terahertz optical fibers. Opt. Express 2020, 28, 16089–16117. [Google Scholar] [CrossRef] [PubMed]
- Wang, Y.; Wang, G.; Xu, D.; Jiang, B.; Ge, M.; Wu, L.; Yang, C.; Mu, N.; Wang, S.; Chang, C.; Chen, T.; Feng, H.; Yao, J. Terahertz spectroscopic diagnosis of early blast-induced traumatic brain injury in rats. Biomed. Opt. Express 2020, 11, 4085–4098. [Google Scholar] [CrossRef] [PubMed]
- Tani, M.; Matsuura, S.; Sakai, K.; Hangyo, M. Multiple-frequency generation of sub-terahertz radiation by multimode LD excitation of photoconductive antenna. IEEE Microw. Guid. Wave Lett. 1997, 7 282−284.
- Morikawa, O.; Tonouchi, M.; Tani, M.; Sakai, K.; Hangyo, M. Sub-THz emission properties of photoconductive antennas excited with multimode laser diode. Jpn. J. Appl. Phy. 1999, 38, 1388–1389. [Google Scholar] [CrossRef]
- Morikawa, O.; Tonouchi, K.; Hangyo, M. Sub-THz spectroscopic system using a multimode laser diode and photoconductive antenna. Appl. Phy. Lett. 1999, 75, 3772–3774. [Google Scholar] [CrossRef]
- Scheller, M.; Koch, M. Terahertz quasi time domain spectroscopy. Opt. Express 2009, 17, 17723–17733. [Google Scholar] [CrossRef] [PubMed]
- Morikawa, O.; Fujita, M.; Takano, K.; Hangyo, M. Sub-terahertz spectroscopic system using a continuous-wave broad-area laser diode and a spatial filter. J. Appl. Phys. 2011, 110, 063107. [Google Scholar] [CrossRef]
- Kuwashima, F.; Taniguchi, S.; Nonaka, K.; Hangyo, M.; Iwasawa, H. Stabilization of THz wave generation by using chaotic oscillation in a laser. Int. Conf. Infrared, Millimeter and Terahertz Waves, paper Tu-P.63, Rome, Italy, 5−10 September 2010.
- Kuwashima, F.; Shirao, T.; Kishibata, T.; Okuyama, T.; Akamine, Y.; Tani, M.; Kurihara, K.; Yamamoto, K.; Nagashima, T.; Hangyo, M. High efficient THz time domain spectroscopy systems using laser chaos and a metal V grooved waveguide. Int. Conf. Infrared, Millimeter and Terahertz Waves, paper W5-P24.2, Tucson, Arizona, USA, 14−18 September 2014.
- Kuwashima, F.; Jarrahi, M.; Cakmakyapan, S.; Morikawa, O.; Shirao, T.; Iwao, K.; Kurihara, K.; Kitahara, H.; Furuya, T.; Wada, K.; Nakajima, M.; Tani, M. Evaluation of high-stability optical beats in laser chaos by plasmonic photomixing. Opt. Express 2020, 28, 24833–24844. [Google Scholar] [CrossRef] [PubMed]
- Wada, K.; Yoshioka, H.; Jiaxun, Z.; Matsuyama, T.; Horinaka, H. Simple form of multimode laser diode rate equations incorporating the band filling effect. Opt. Express 2011, 19, 3019–3036. [Google Scholar] [CrossRef] [PubMed]
- Wada, K.; Matsuyama, T.; Horinaka, H. Simple gain form of 1.5μm multimode laser diode incorporating band filling and intrinsic gain saturation effects. Jpn. J. Appl. Phy. 2015, 54, 032101. [Google Scholar] [CrossRef]
- Wada, K.; Kitagawa, N.; Matsukura, S. , Matsuyama, T.; Horinaka, H. Timing and amplitude jitter in a gain-switched multimode semiconductor laser. Jpn. J. Appl. Phy. 2016, 55, 042702. [Google Scholar] [CrossRef]
- Wada, K.; Kitagawa, N.; Matsuyama, T. The degree of temporal synchronization of the pulse oscillations from a gain-switched multimode semiconductor laser. Materials 2017, 10, 950. [Google Scholar] [CrossRef] [PubMed]
- Lang, R.; Kobayashi, K. External optical feedback effects on semiconductor injection laser properties. IEEE J. Quantum. Electron. 1980, 16, 347–355. [Google Scholar] [CrossRef]
- Siegman, A.E. Lasers, University Science Books, Mill Valley, CA, USA, 1986; pp. 1004−1022.
- Ohtsubo, J. Chap. 5, Semiconductor Lasers−Stability, Instability and Chaos−, 3rd ed.; Springer: Berlin, Heidelberg, Germany, 2013. [Google Scholar]
Figure 1.
Configuration of a THz-TDS system using an MMLD with delayed optical feedback.
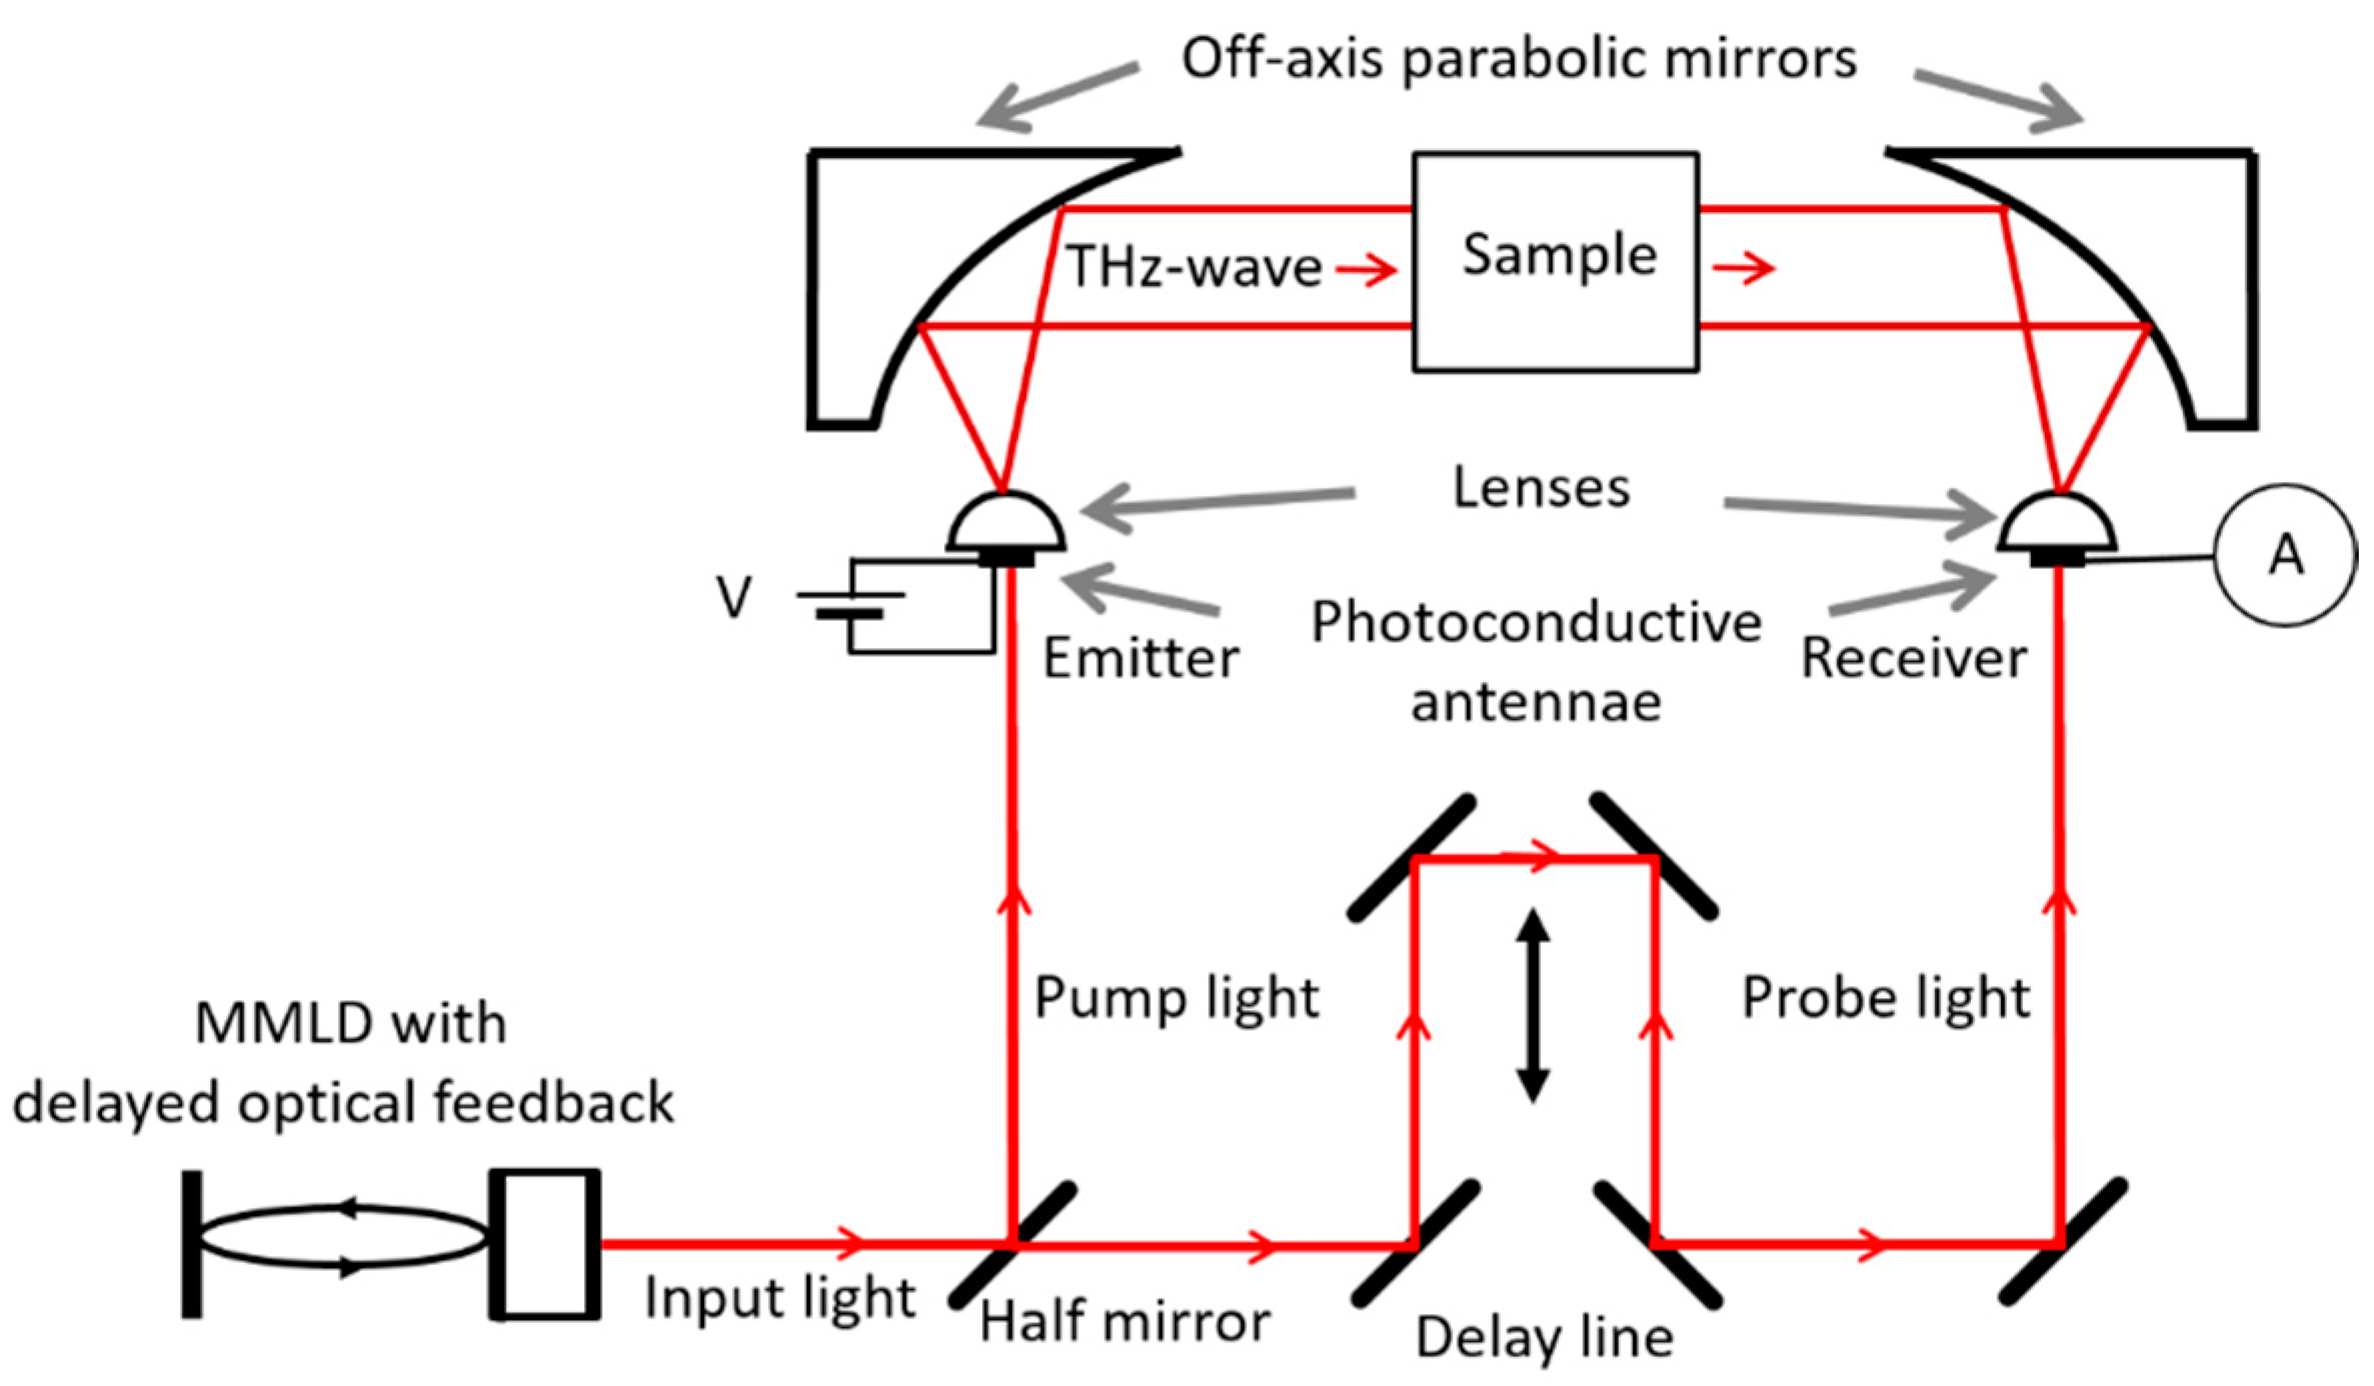
Figure 2.
Temporal waveforms of the MMLD outputs (a1−d1), along with the corresponding power spectra (a2−d2) and THz-TDS outputs (a3−d3) for different values of fc: 0 (a1−a3), 0.1 (b1−b3), 0.4 (c1−c3), and 0.6 (d1−d3). The parameters r and τfb are set to 1.5 and 1ns, respectively.
Figure 2.
Temporal waveforms of the MMLD outputs (a1−d1), along with the corresponding power spectra (a2−d2) and THz-TDS outputs (a3−d3) for different values of fc: 0 (a1−a3), 0.1 (b1−b3), 0.4 (c1−c3), and 0.6 (d1−d3). The parameters r and τfb are set to 1.5 and 1ns, respectively.
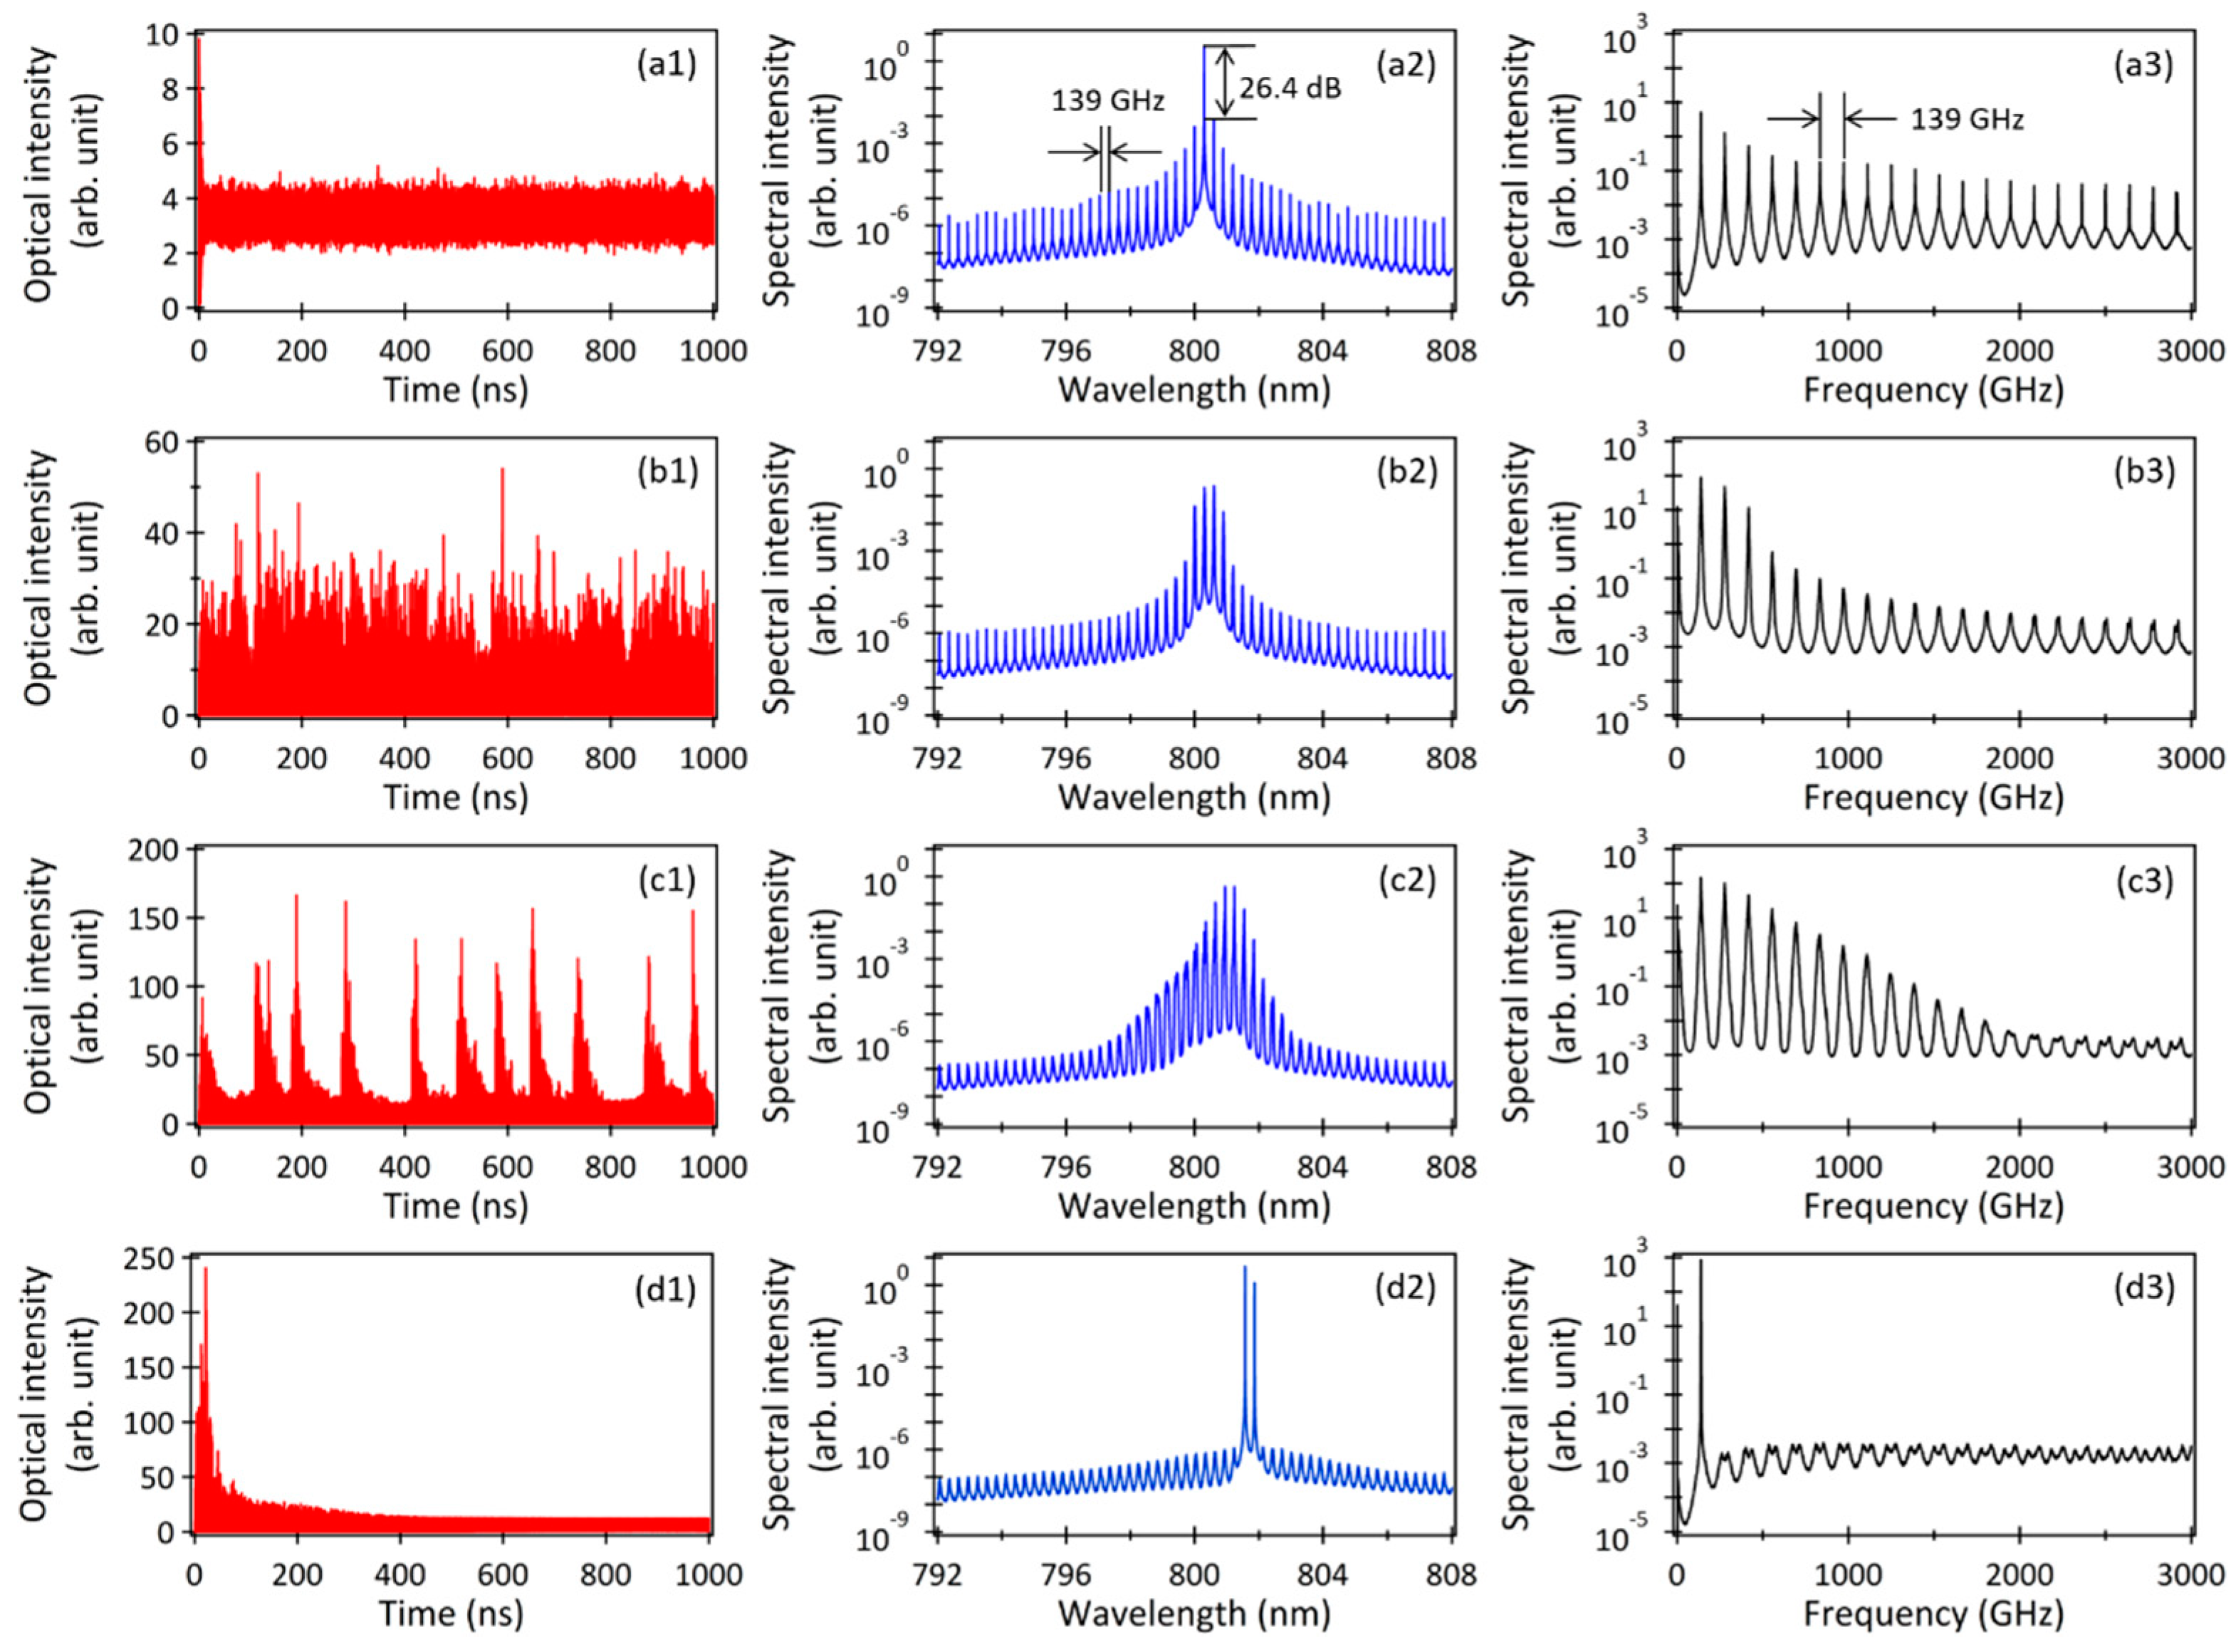
Figure 3.
(a) Temporal waveform of the carrier density when fc is set to 0.4. Temporal variations of (b) MMLD output energy and (c) THz-TDS output energy integrated every 1 ns.
Figure 3.
(a) Temporal waveform of the carrier density when fc is set to 0.4. Temporal variations of (b) MMLD output energy and (c) THz-TDS output energy integrated every 1 ns.
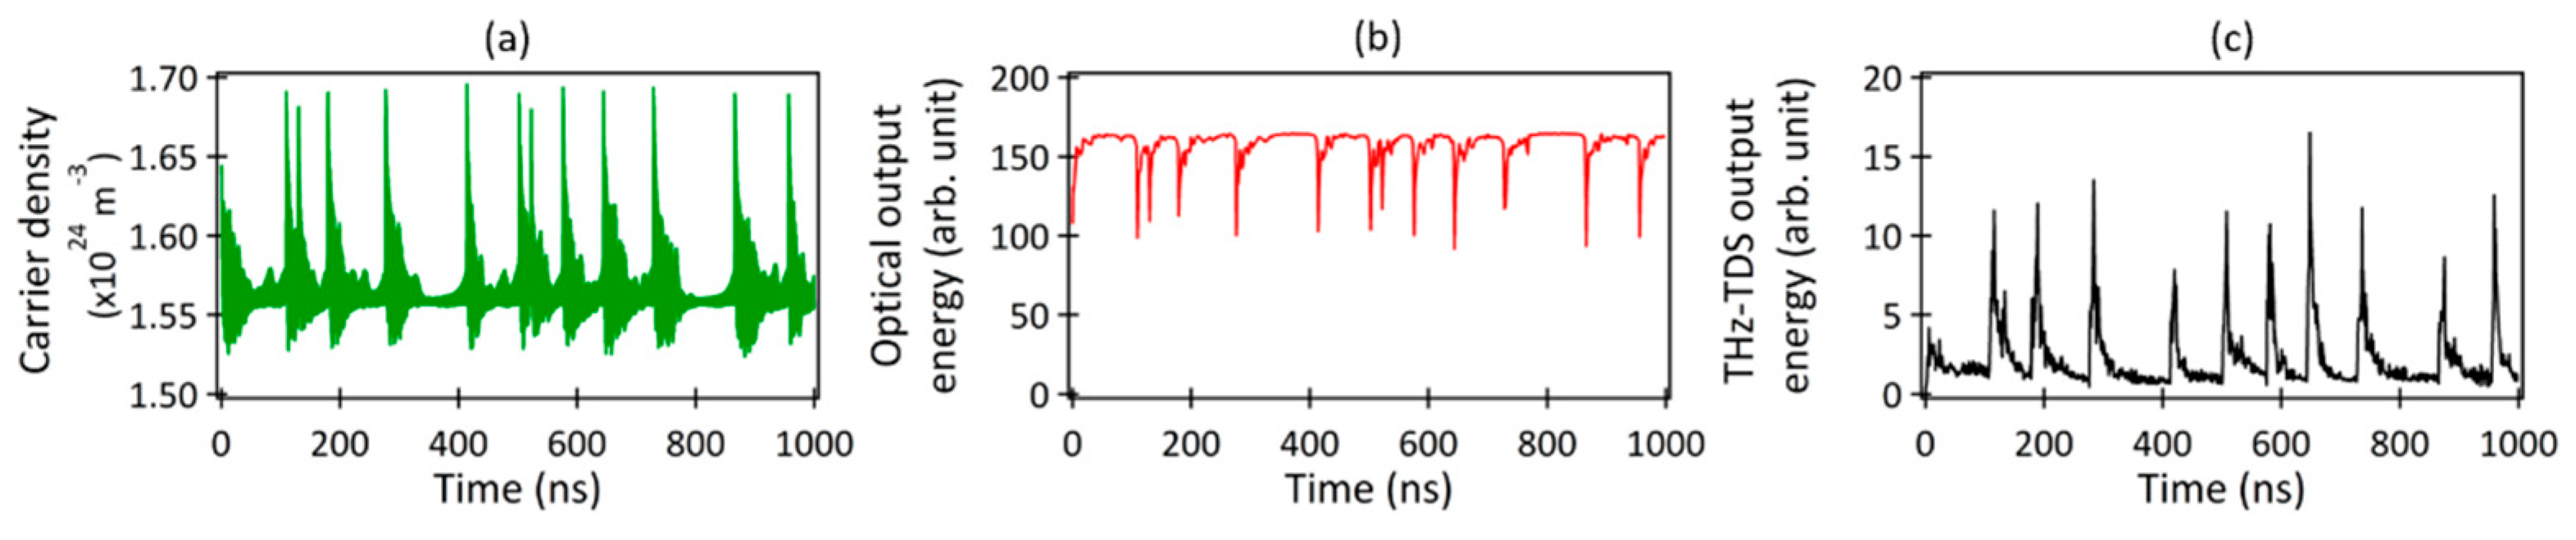
Figure 4.
(a) A magnified view of a section from Figure 3(c). Temporal waveforms of the MMLD outputs during the time periods of (b) 644−645 ns, (c) 648−649 ns, and (d) 690−691 ns, respectively.
Figure 4.
(a) A magnified view of a section from Figure 3(c). Temporal waveforms of the MMLD outputs during the time periods of (b) 644−645 ns, (c) 648−649 ns, and (d) 690−691 ns, respectively.
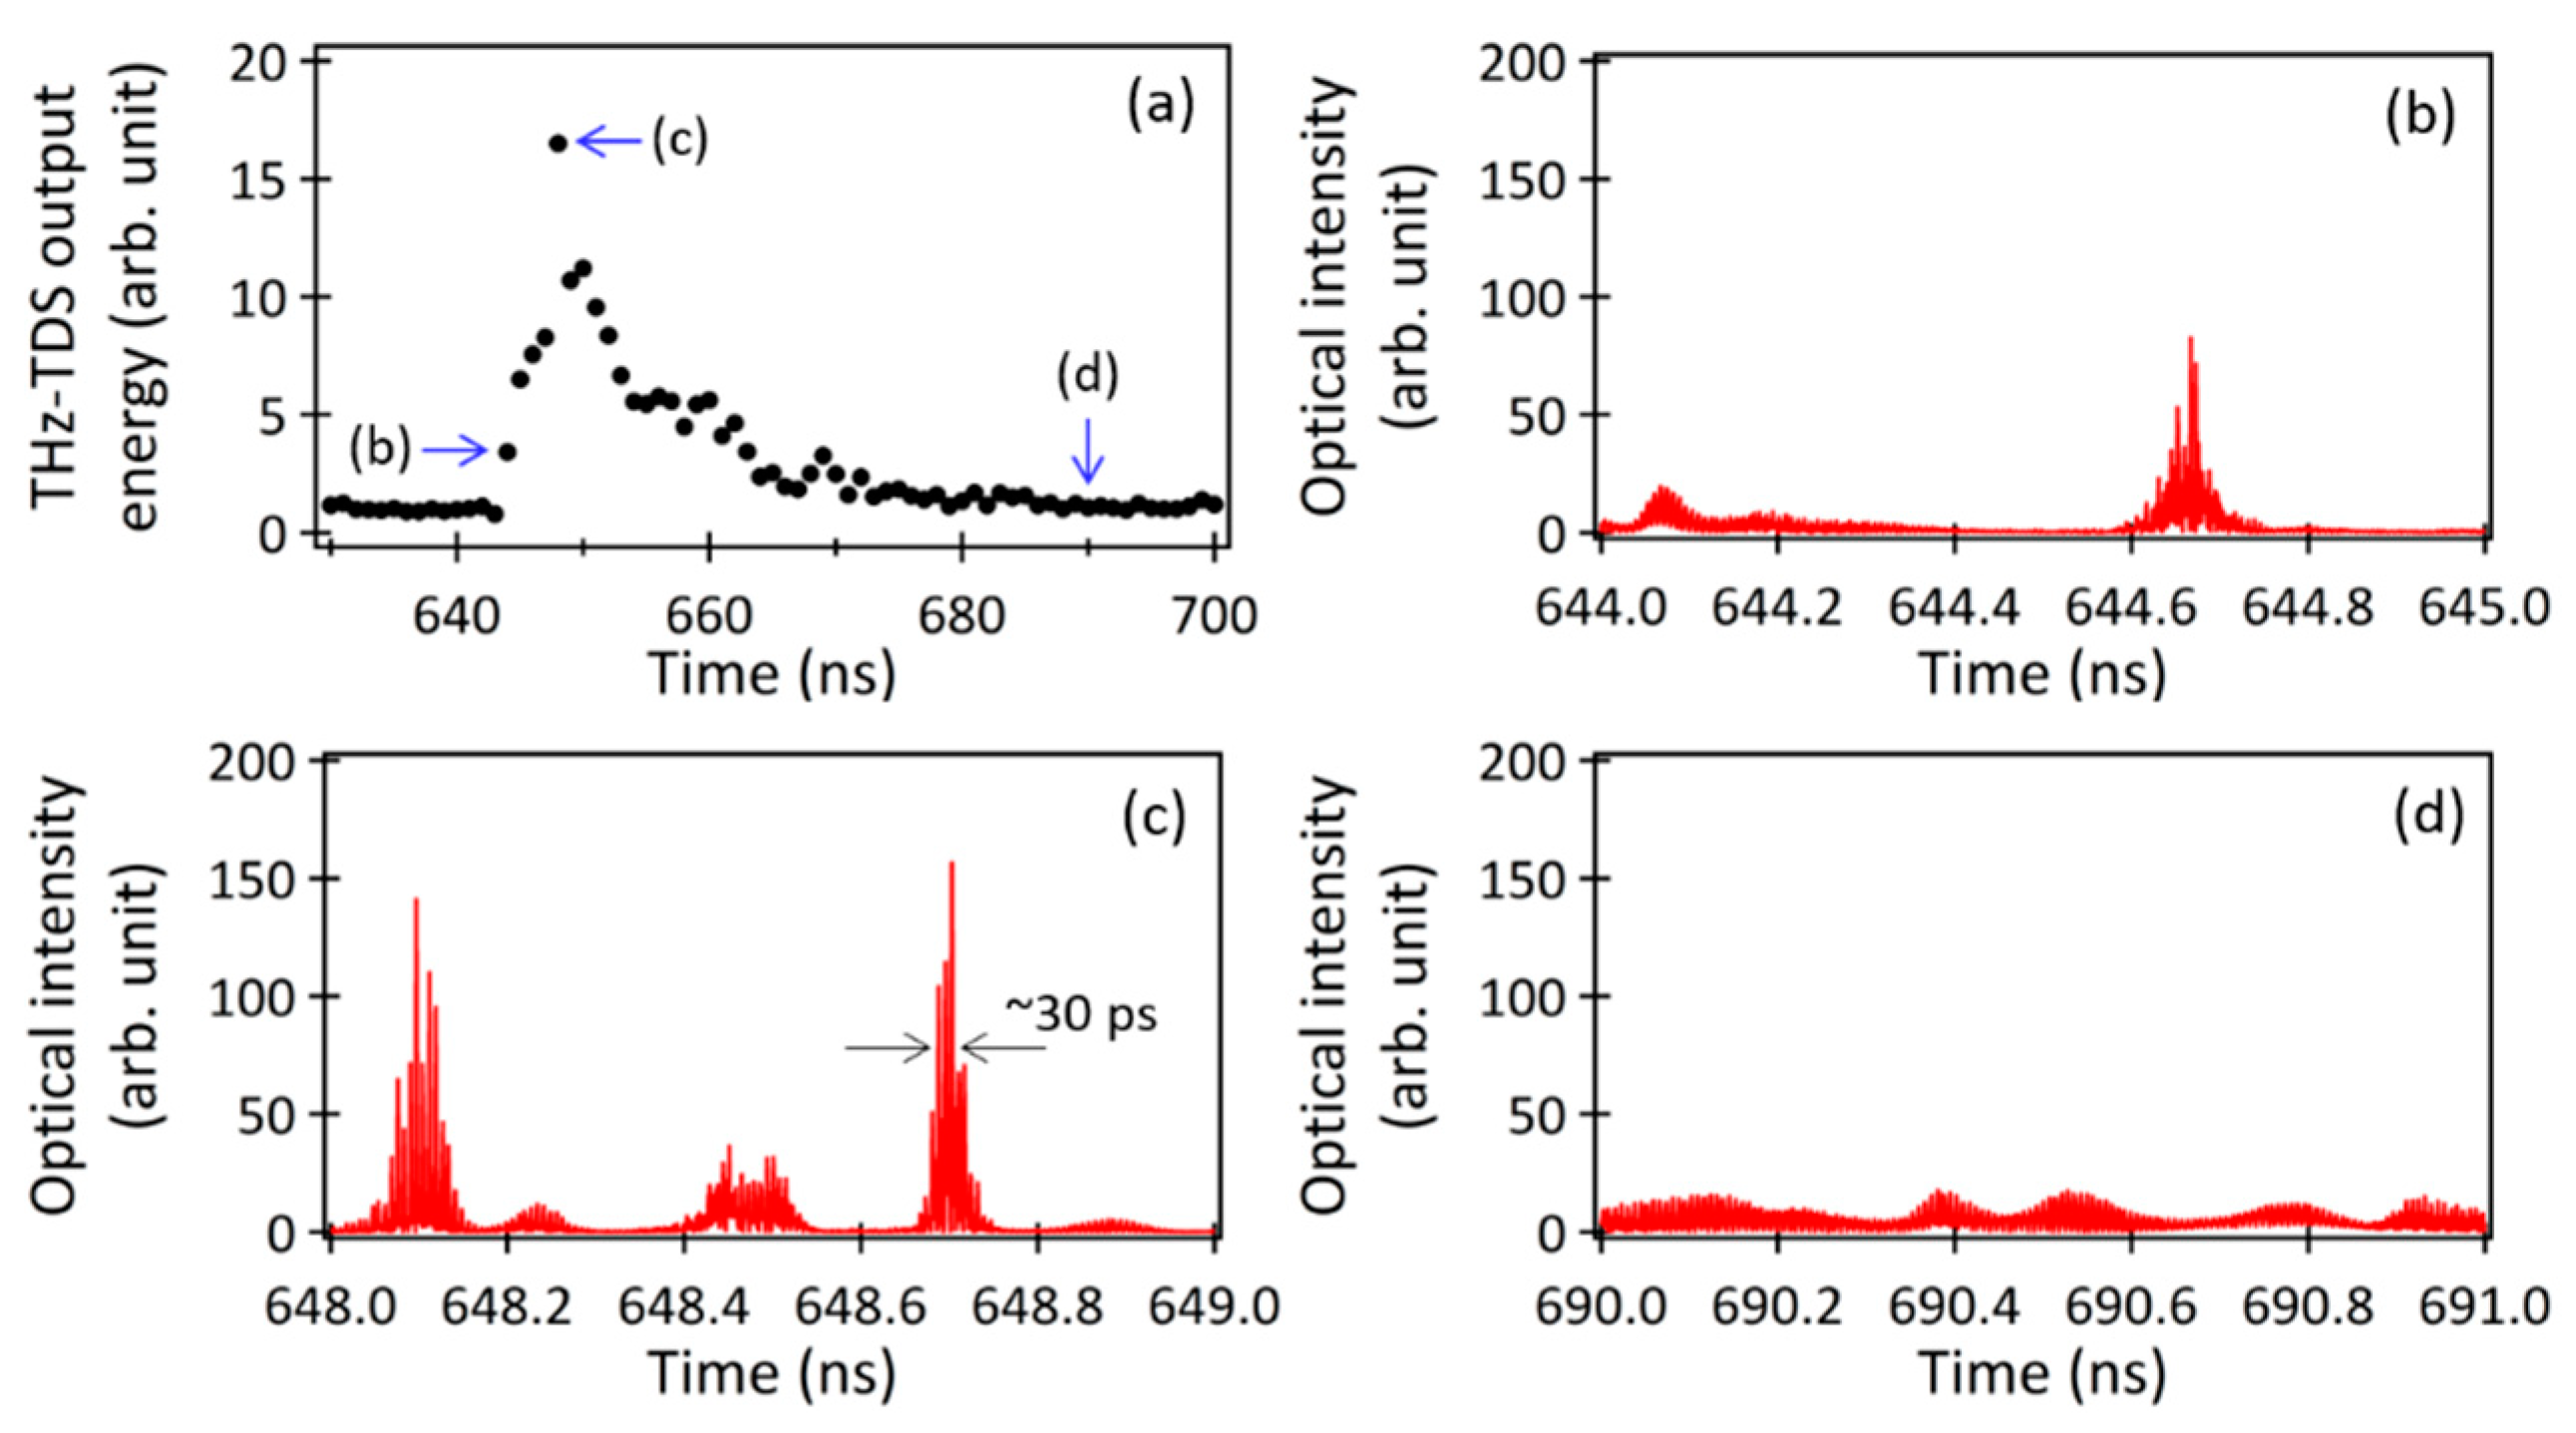
Figure 5.
(a) Power spectrum of the MMLD output corresponding to the temporal waveform in Figure 4(b). (b) Temporal waveforms of the MMLD output for respective (−2nd to +5th) modes.
Figure 5.
(a) Power spectrum of the MMLD output corresponding to the temporal waveform in Figure 4(b). (b) Temporal waveforms of the MMLD output for respective (−2nd to +5th) modes.
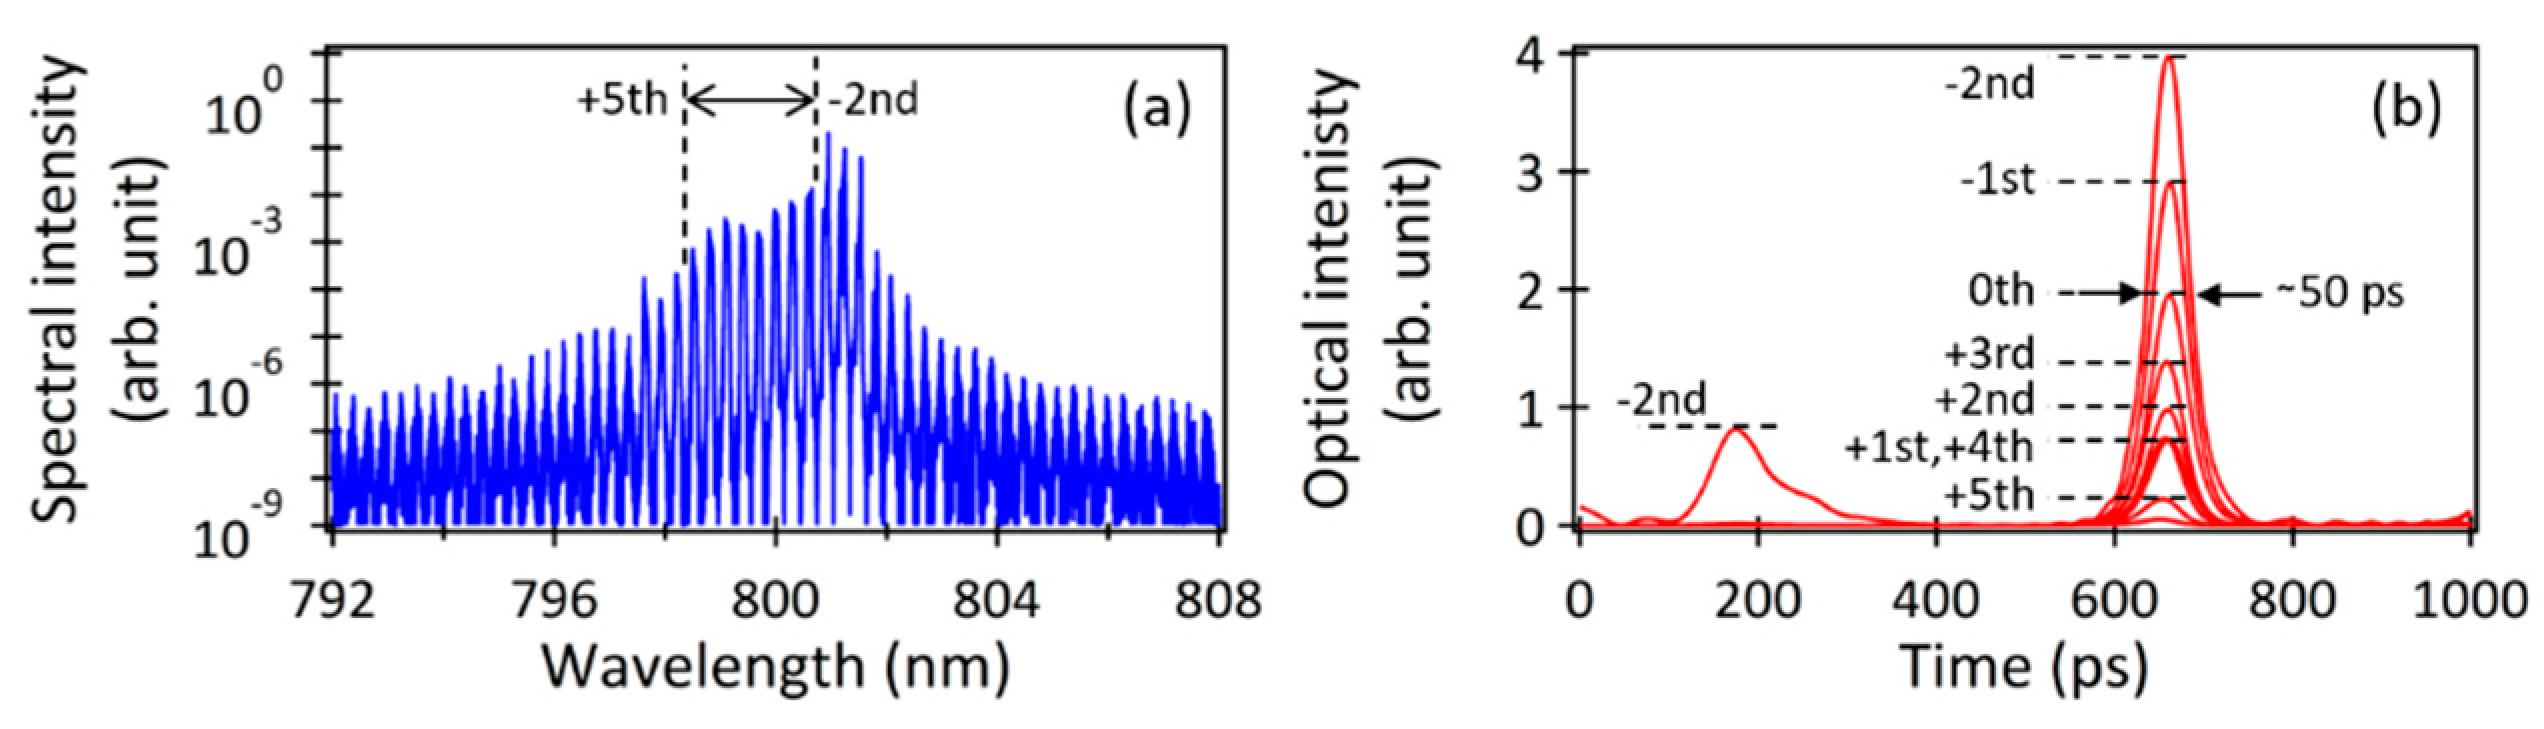
Figure 6.
(a, b) Power spectra calculated using the temporal waveforms in Figure 4(c) and 4(d), respectively. (c) Experimentally observed power spectrum of the output from the MMLD with delayed optical feedback [22].
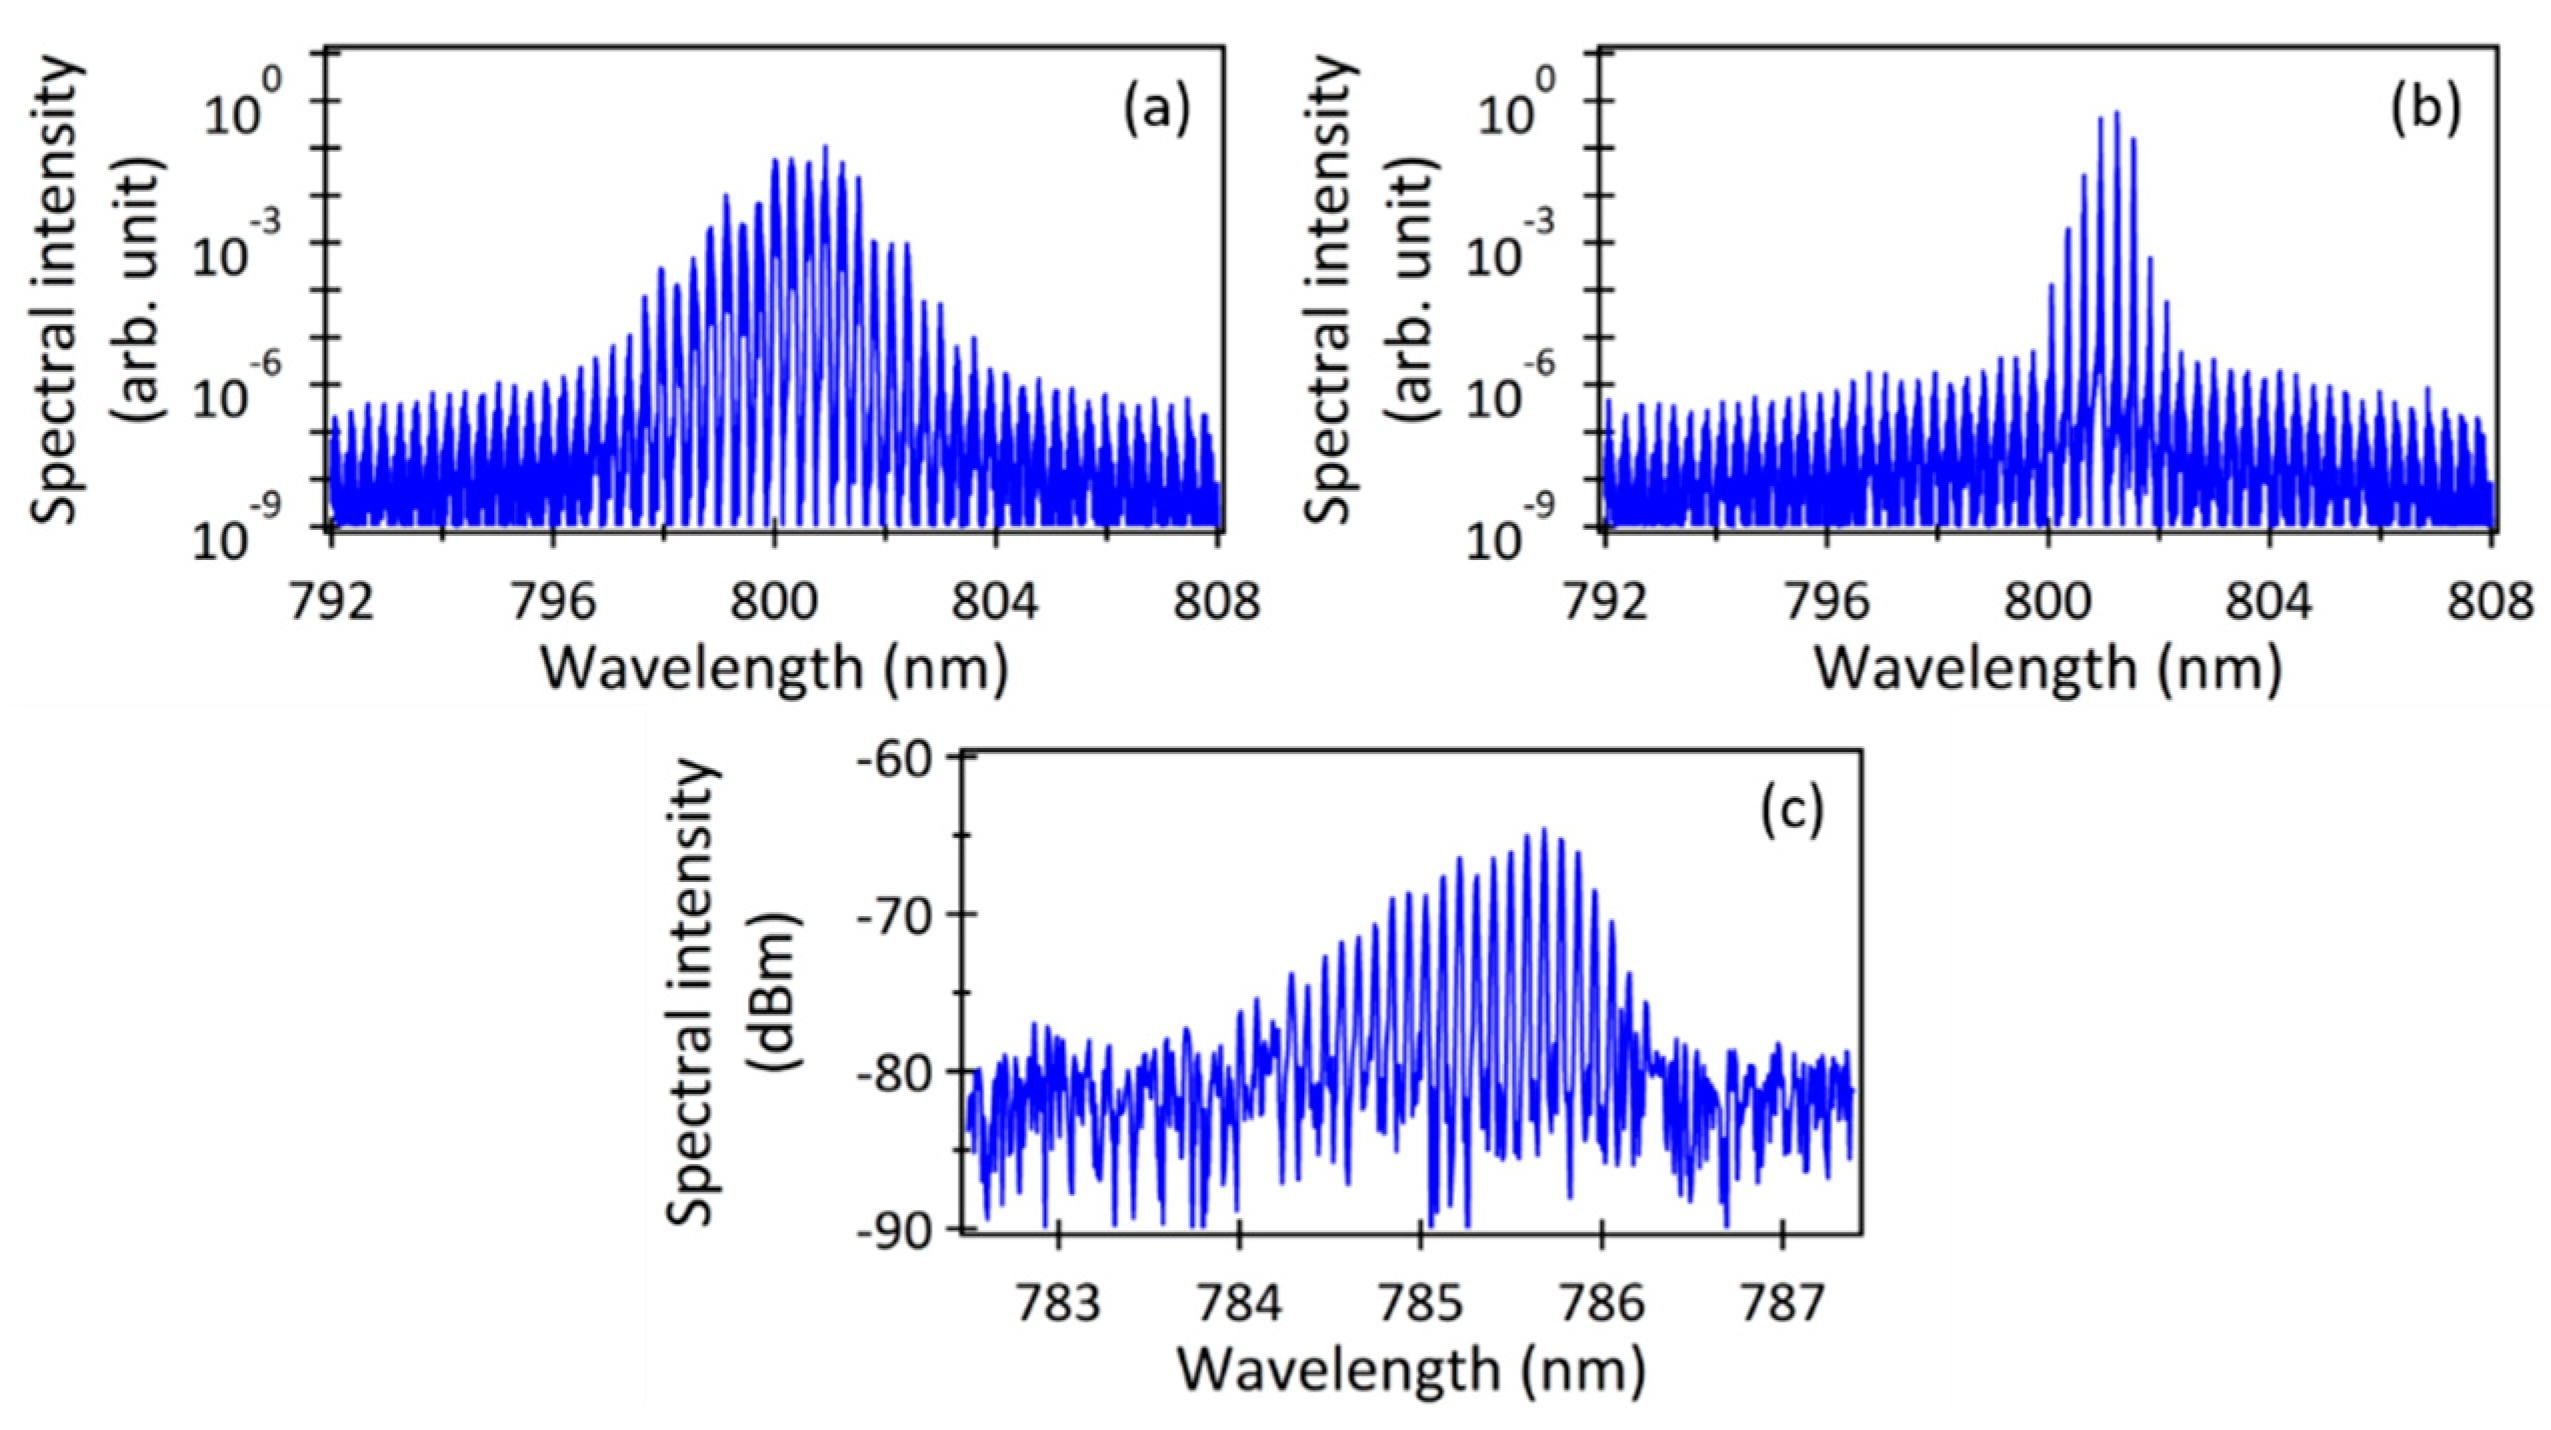
Figure 7.
(a) Temporal variation of the intensity difference between adjacent averaged MMLD output spectra. Examples of the MMLD output spectra averaged over (b) 10 ns, (c) 100 ns, and (d) 500 ns, respectively.
Figure 7.
(a) Temporal variation of the intensity difference between adjacent averaged MMLD output spectra. Examples of the MMLD output spectra averaged over (b) 10 ns, (c) 100 ns, and (d) 500 ns, respectively.
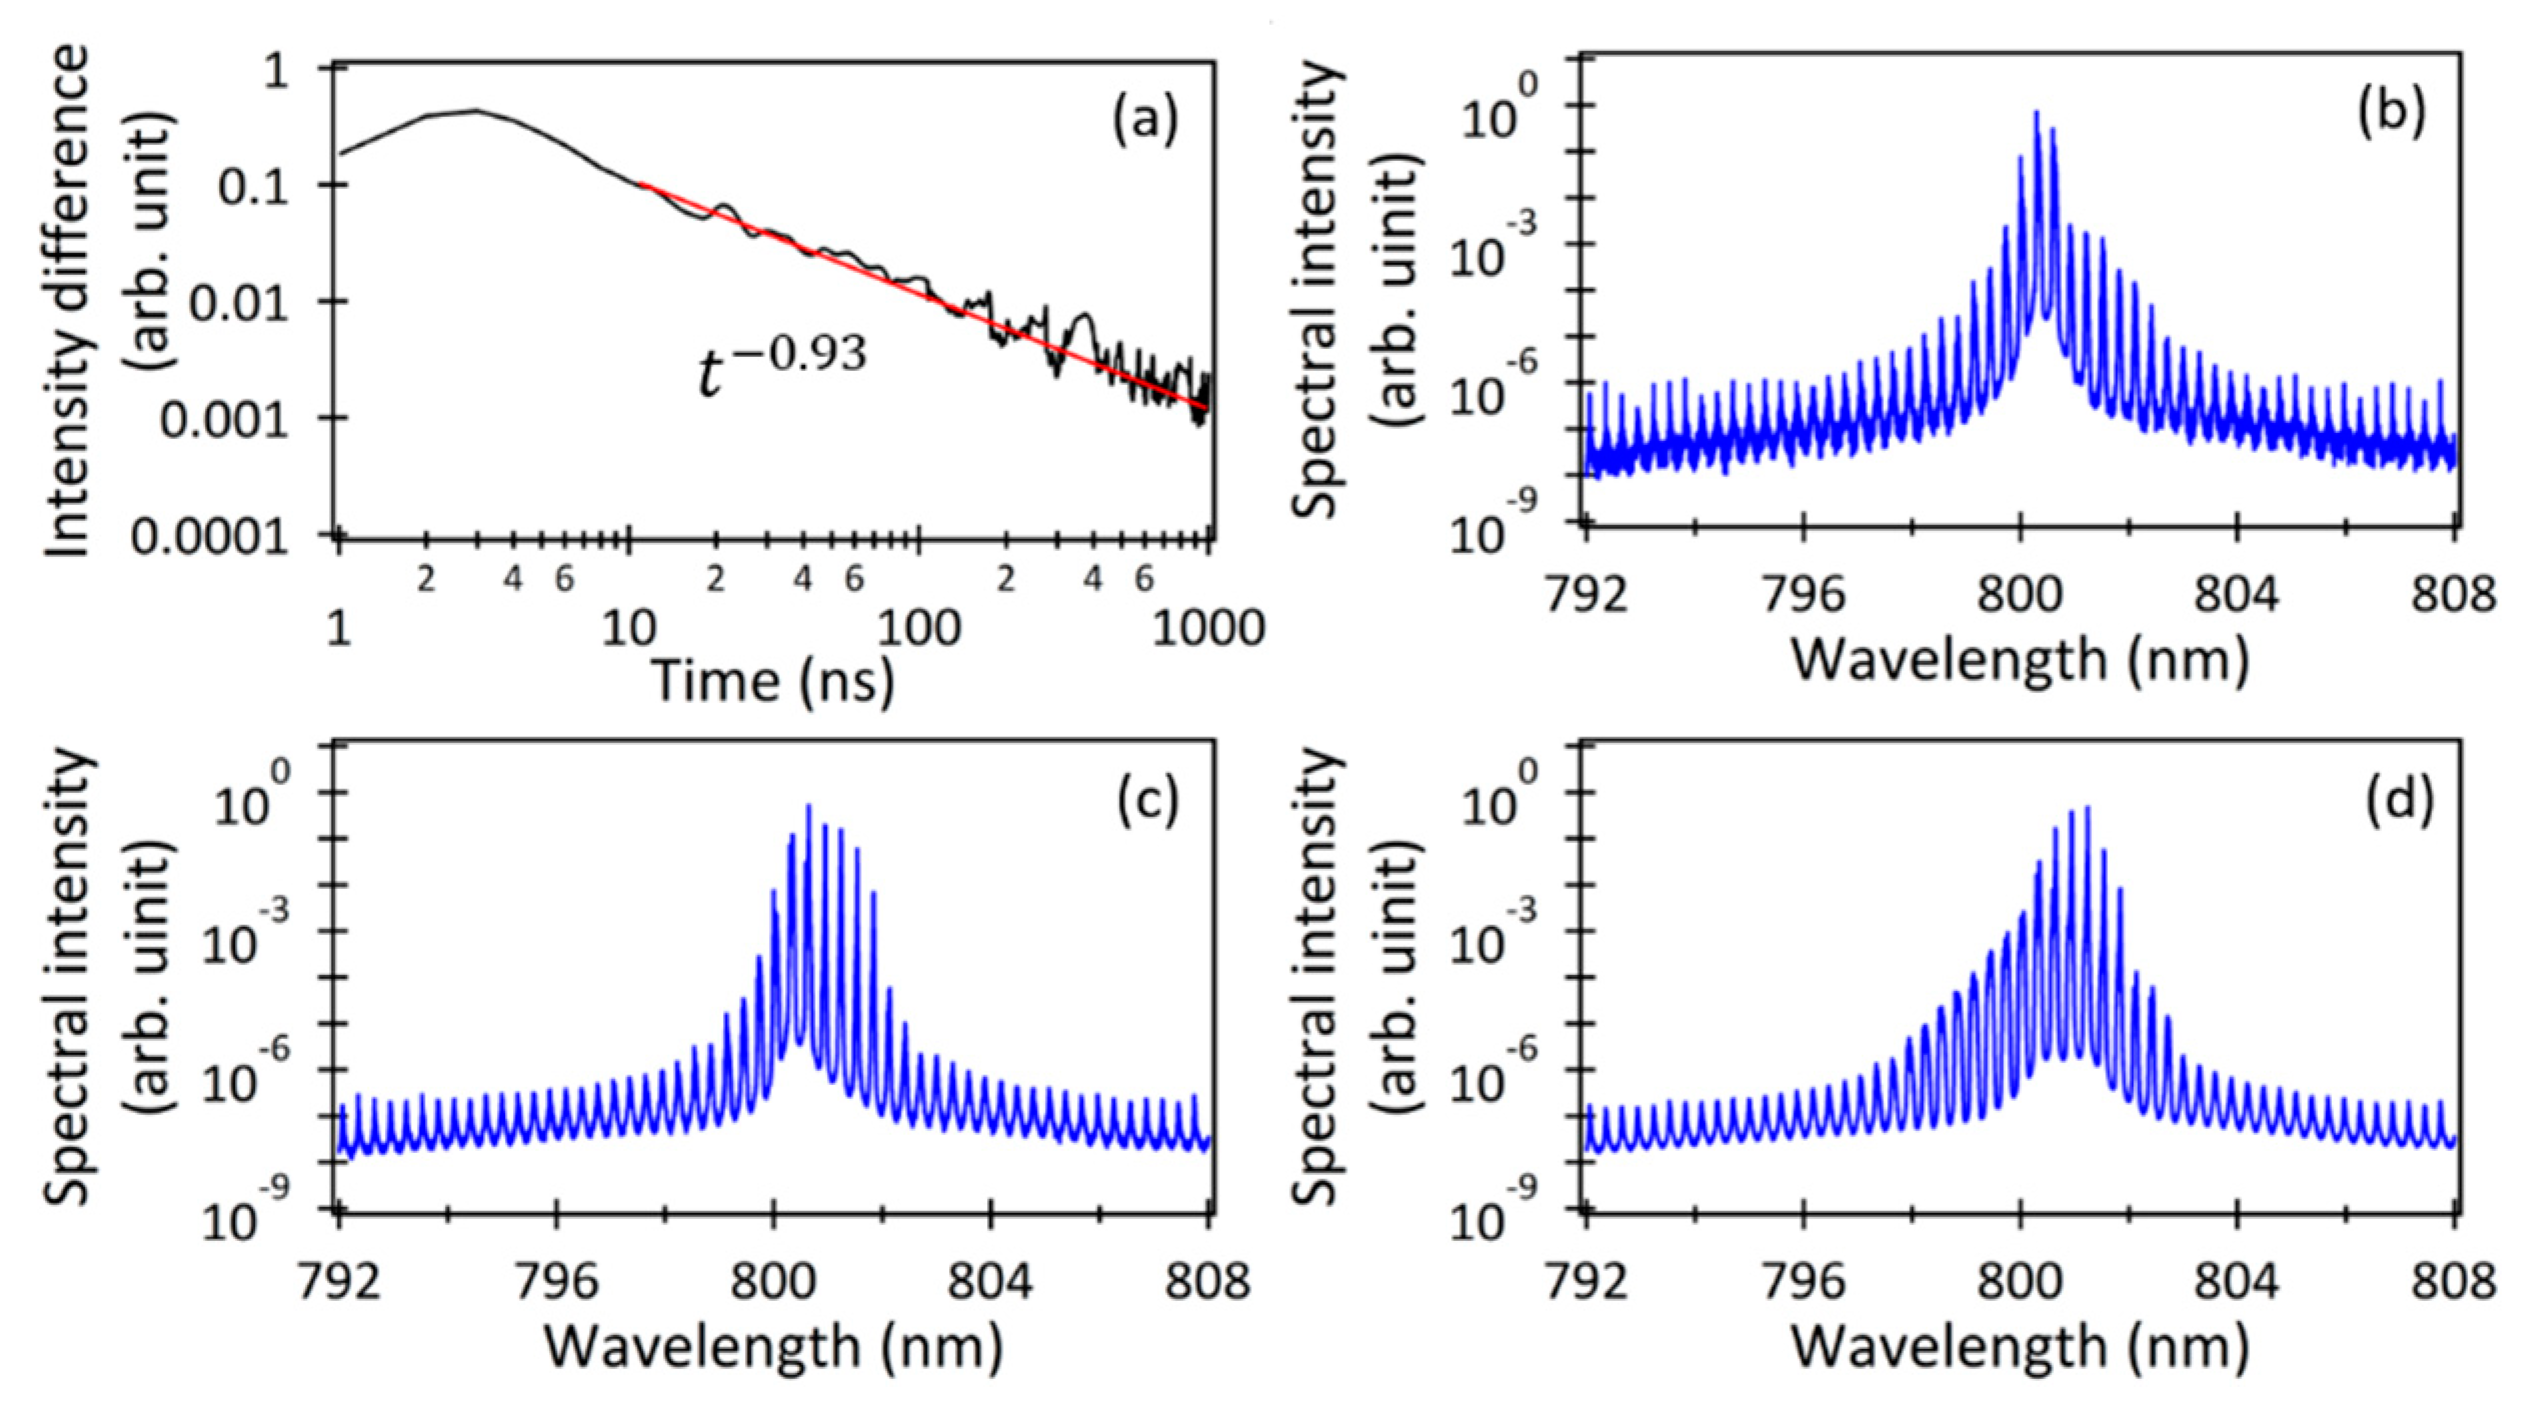
Figure 8.
(a) Temporal variation of the intensity difference between adjacent averaged THz-TDS output spectra. Examples of the THz-TDS output spectra averaged over (b) 10 ns, (c) 100 ns, and (d) 500 ns, respectively.
Figure 8.
(a) Temporal variation of the intensity difference between adjacent averaged THz-TDS output spectra. Examples of the THz-TDS output spectra averaged over (b) 10 ns, (c) 100 ns, and (d) 500 ns, respectively.
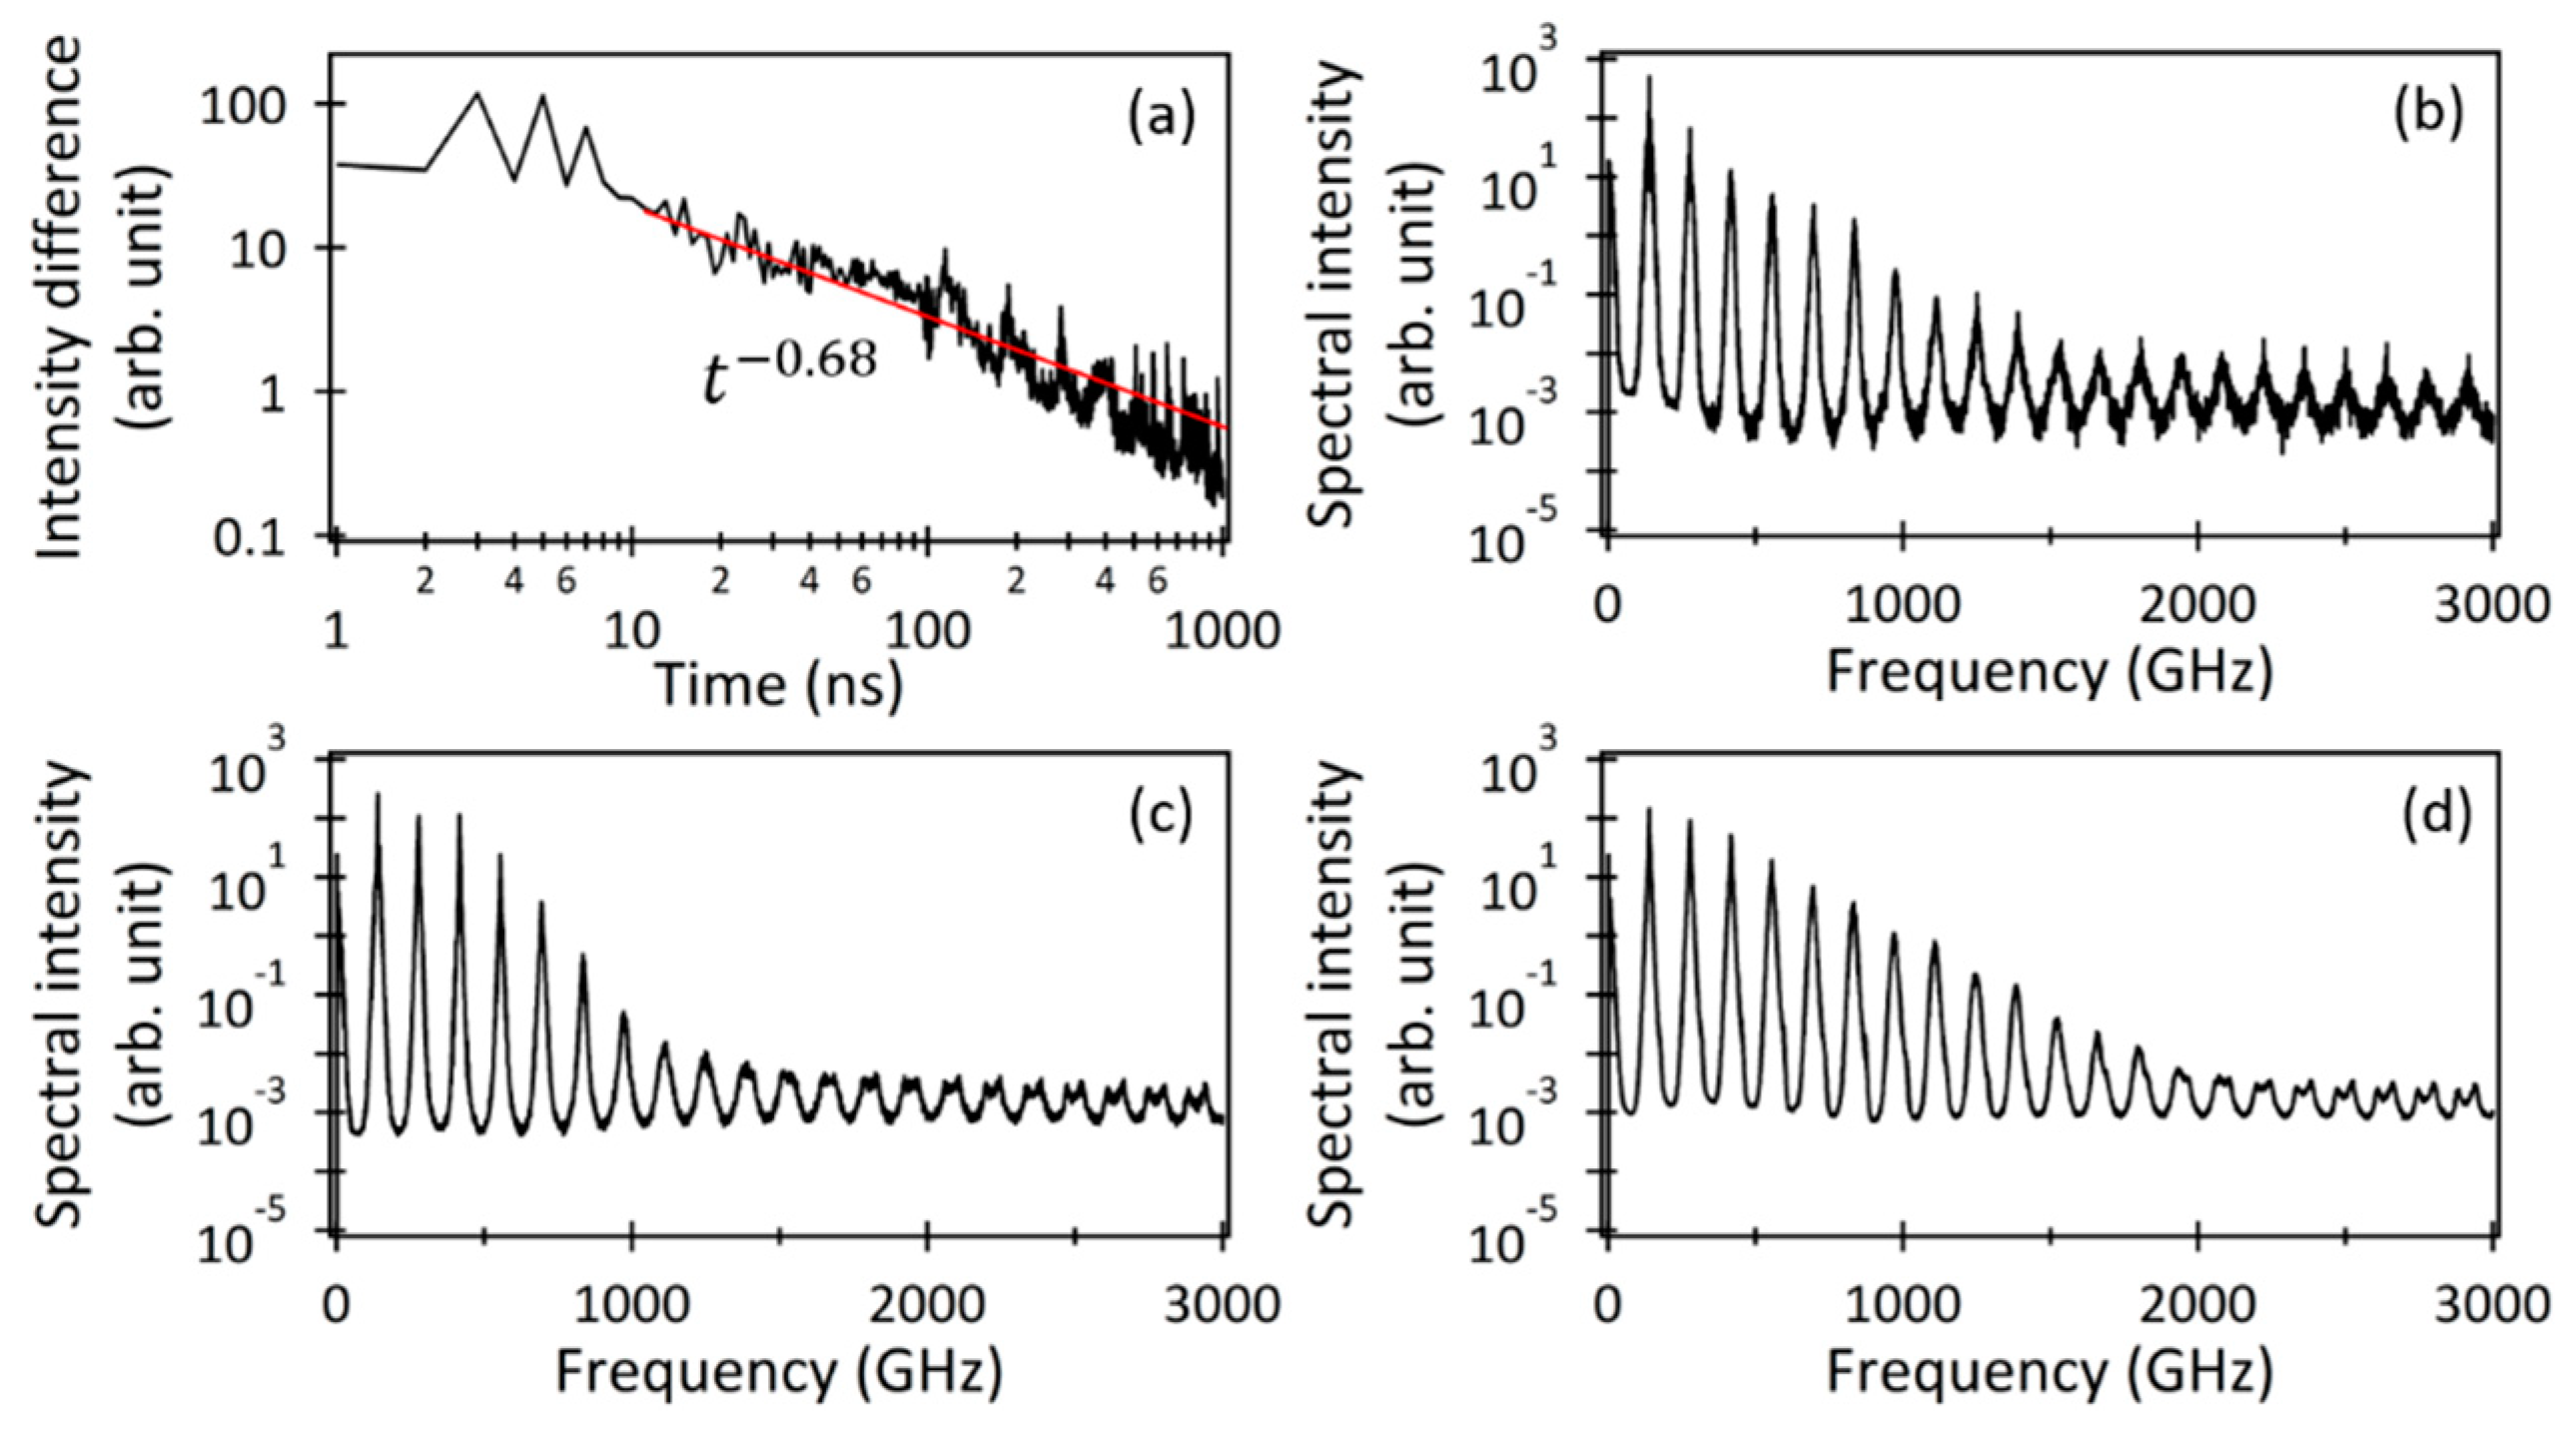
Figure 9.
Peak plots as a function of fc when (r, τfb) is set to (a) (1.5, 1 ns), (b1) (2.0, 1 ns), (b2) (2.5, 1 ns), (c1) (1.5, 0.5 ns), and (c2) (1.5, 2 ns), respectively.
Figure 9.
Peak plots as a function of fc when (r, τfb) is set to (a) (1.5, 1 ns), (b1) (2.0, 1 ns), (b2) (2.5, 1 ns), (c1) (1.5, 0.5 ns), and (c2) (1.5, 2 ns), respectively.
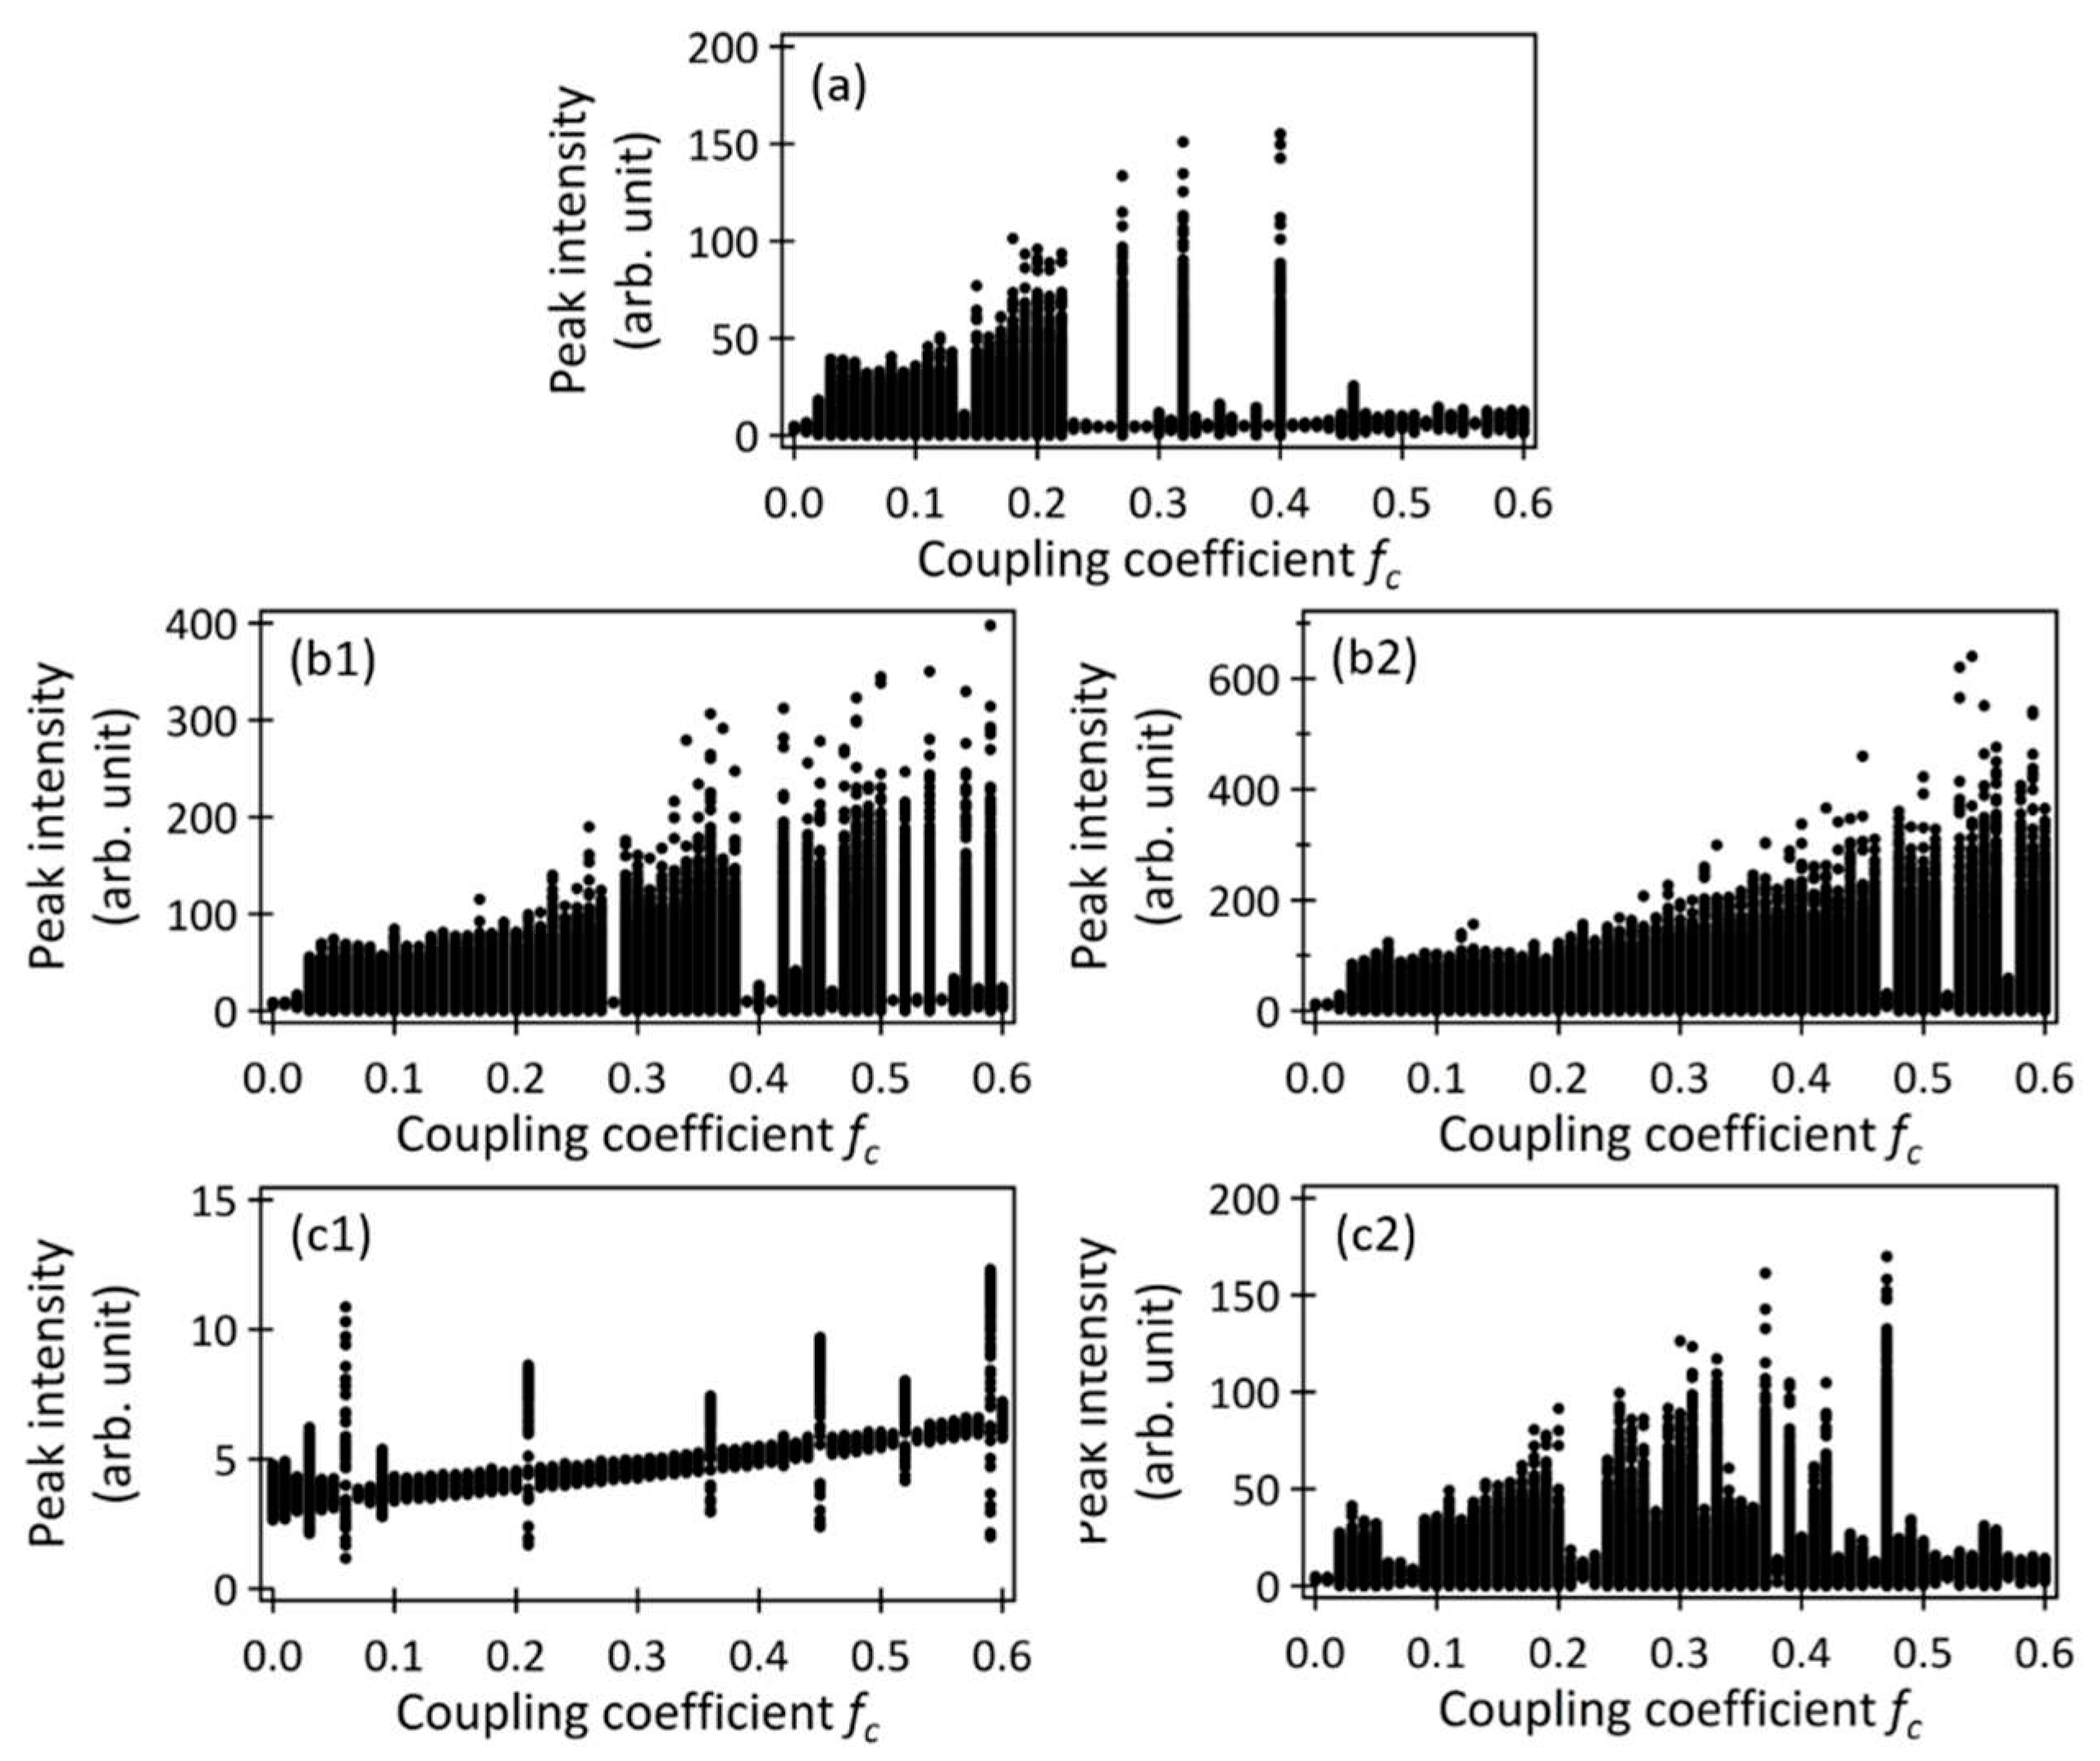

Table 1.
Notation and values for parameters [26].
Table 1.
Notation and values for parameters [26].
| Notation | Parameter | Value | Unit |
|---|---|---|---|
| m | Mode number | −30 ~ +30 | |
| τp | Photon lifetime | 2.0 | Ps |
| Trt | Round-trip time of the LD cavity | 7.1 | Ps |
| τfb | Delay time of the optical feedback fields | 1 | Ns |
| C1 | Nonradiative recombination rate | 2.0 × 10⁸ | s−1 |
| C2 | Radiative recombination coefficient | 2.0 × 10⁻¹⁶ | m3 s−1 |
| C3 | Auger recombination coefficient | 0 | m6 s−1 |
| fc | Coupling coefficient of the optical feedback fields | 0 ~ 0.6 | |
| α | Linewidth enhancement factor | 3.0 | |
| β | Spontaneous emission factor | 1.0 × 10⁻⁶ | |
| εS | Gain compression factor | 0.05 × 10⁻²³ | m3 |
| δf | Longitudinal mode spacing | 0.139 | THz |
| ∆τc | Coherence time of amplified spontaneous emission | 7.1 | Ps |
| e | Elementary electric charge | 1.60 × 10⁻¹⁹ | C |
| L | Laser cavity length | 300 | Μm |
| V | Laser cavity volume | 180 | μm3 |
| nr | Refractive index of the active layer | 3.6 | |
| ε0 | Dielectric constant for vacuum | 8.85 × 10⁻¹² | F/m |
| h | Planck’s constant | 6.63 × 10⁻³⁴ | Js |
| fm | Oscillation frequency of the mth-mode | 375 + 0.139m | THz |
| I | Bias current | r × Ith0 | mA |
| r | Pumping rate | 1.5 ~ 2.5 | |
| Ith0 | Threshold current for the central mode | 24 | mA |
Disclaimer/Publisher’s Note: The statements, opinions and data contained in all publications are solely those of the individual author(s) and contributor(s) and not of MDPI and/or the editor(s). MDPI and/or the editor(s) disclaim responsibility for any injury to people or property resulting from any ideas, methods, instructions or products referred to in the content. |
© 2023 by the authors. Licensee MDPI, Basel, Switzerland. This article is an open access article distributed under the terms and conditions of the Creative Commons Attribution (CC BY) license (http://creativecommons.org/licenses/by/4.0/).
Copyright: This open access article is published under a Creative Commons CC BY 4.0 license, which permit the free download, distribution, and reuse, provided that the author and preprint are cited in any reuse.


