1. Introduction
Radiation therapy (RT) is one of the major pillars of cancer therapy and is used to treat a substantial portion of cancers, including breast cancer. However, tumors often do not respond to RT or recur after RT, thus strategies to enhance the antitumor efficacy of RT need to be developed. To discover optimal targets that enhance the antitumor effect of RT, understanding how RT modulates the tumor microenvironment (TME) and cancer cells is crucial.
Among numerous mechanisms underpinning the low efficacy of local RT is the induction of immunosuppressive cells in the tumor [
1]. Although RT promotes antitumor immune responses, regulatory T cells (Tregs), myeloid-derived suppressor cells (MDSCs), and tumor-associated macrophages (TAMs) increase in the TME after local RT [
2,
3,
4,
5], and induction of immunosuppressive cells by RT has been observed in both preclinical models and cancer patients. Hence, inhibition of immunosuppressive cells in the TME may enhance the response of the irradiated tumor and improve systemic antitumor immune responses.
Bromodomain-containing protein 4 (BRD4) is a member of the Bromo- and Extra-Terminal domain (BET) family that regulates gene expression by recruiting various transcription factors [
6]. The target genes of BRD4 include several oncogenes, such as KRAS, BRAF, and PIM2. BRD4 is also involved in DNA repair and telomere regulation. Moreover, recent evidence suggests that inhibition of BRD4 polarizes TAMs into the M1-like phenotype [
7,
8], inhibits activation of TAMs [
9], upregulates expression of MHC molecules [
10], and induces immunogenic cell death of tumor cells [
11]. Due to these effects of BRD4 inhibition, a BRD4 inhibitor may improve the antitumor effects of local RT; however, the immunologic effects of combining local RT and BRD4 inhibition have not been explored.
Here, we investigated whether BRD4 inhibition improves the antitumor effects of RT in the syngeneic murine triple-negative breast cancer (TNBC) model and found that addition of a BRD4 inhibitor to RT led to a less immunosuppressive TME. Our results suggest that BRD4 may be a viable target to enhance the efficacy of local RT.
2. Results
2.1. Effects of local RT and BRD4 inhibition on tumor growth
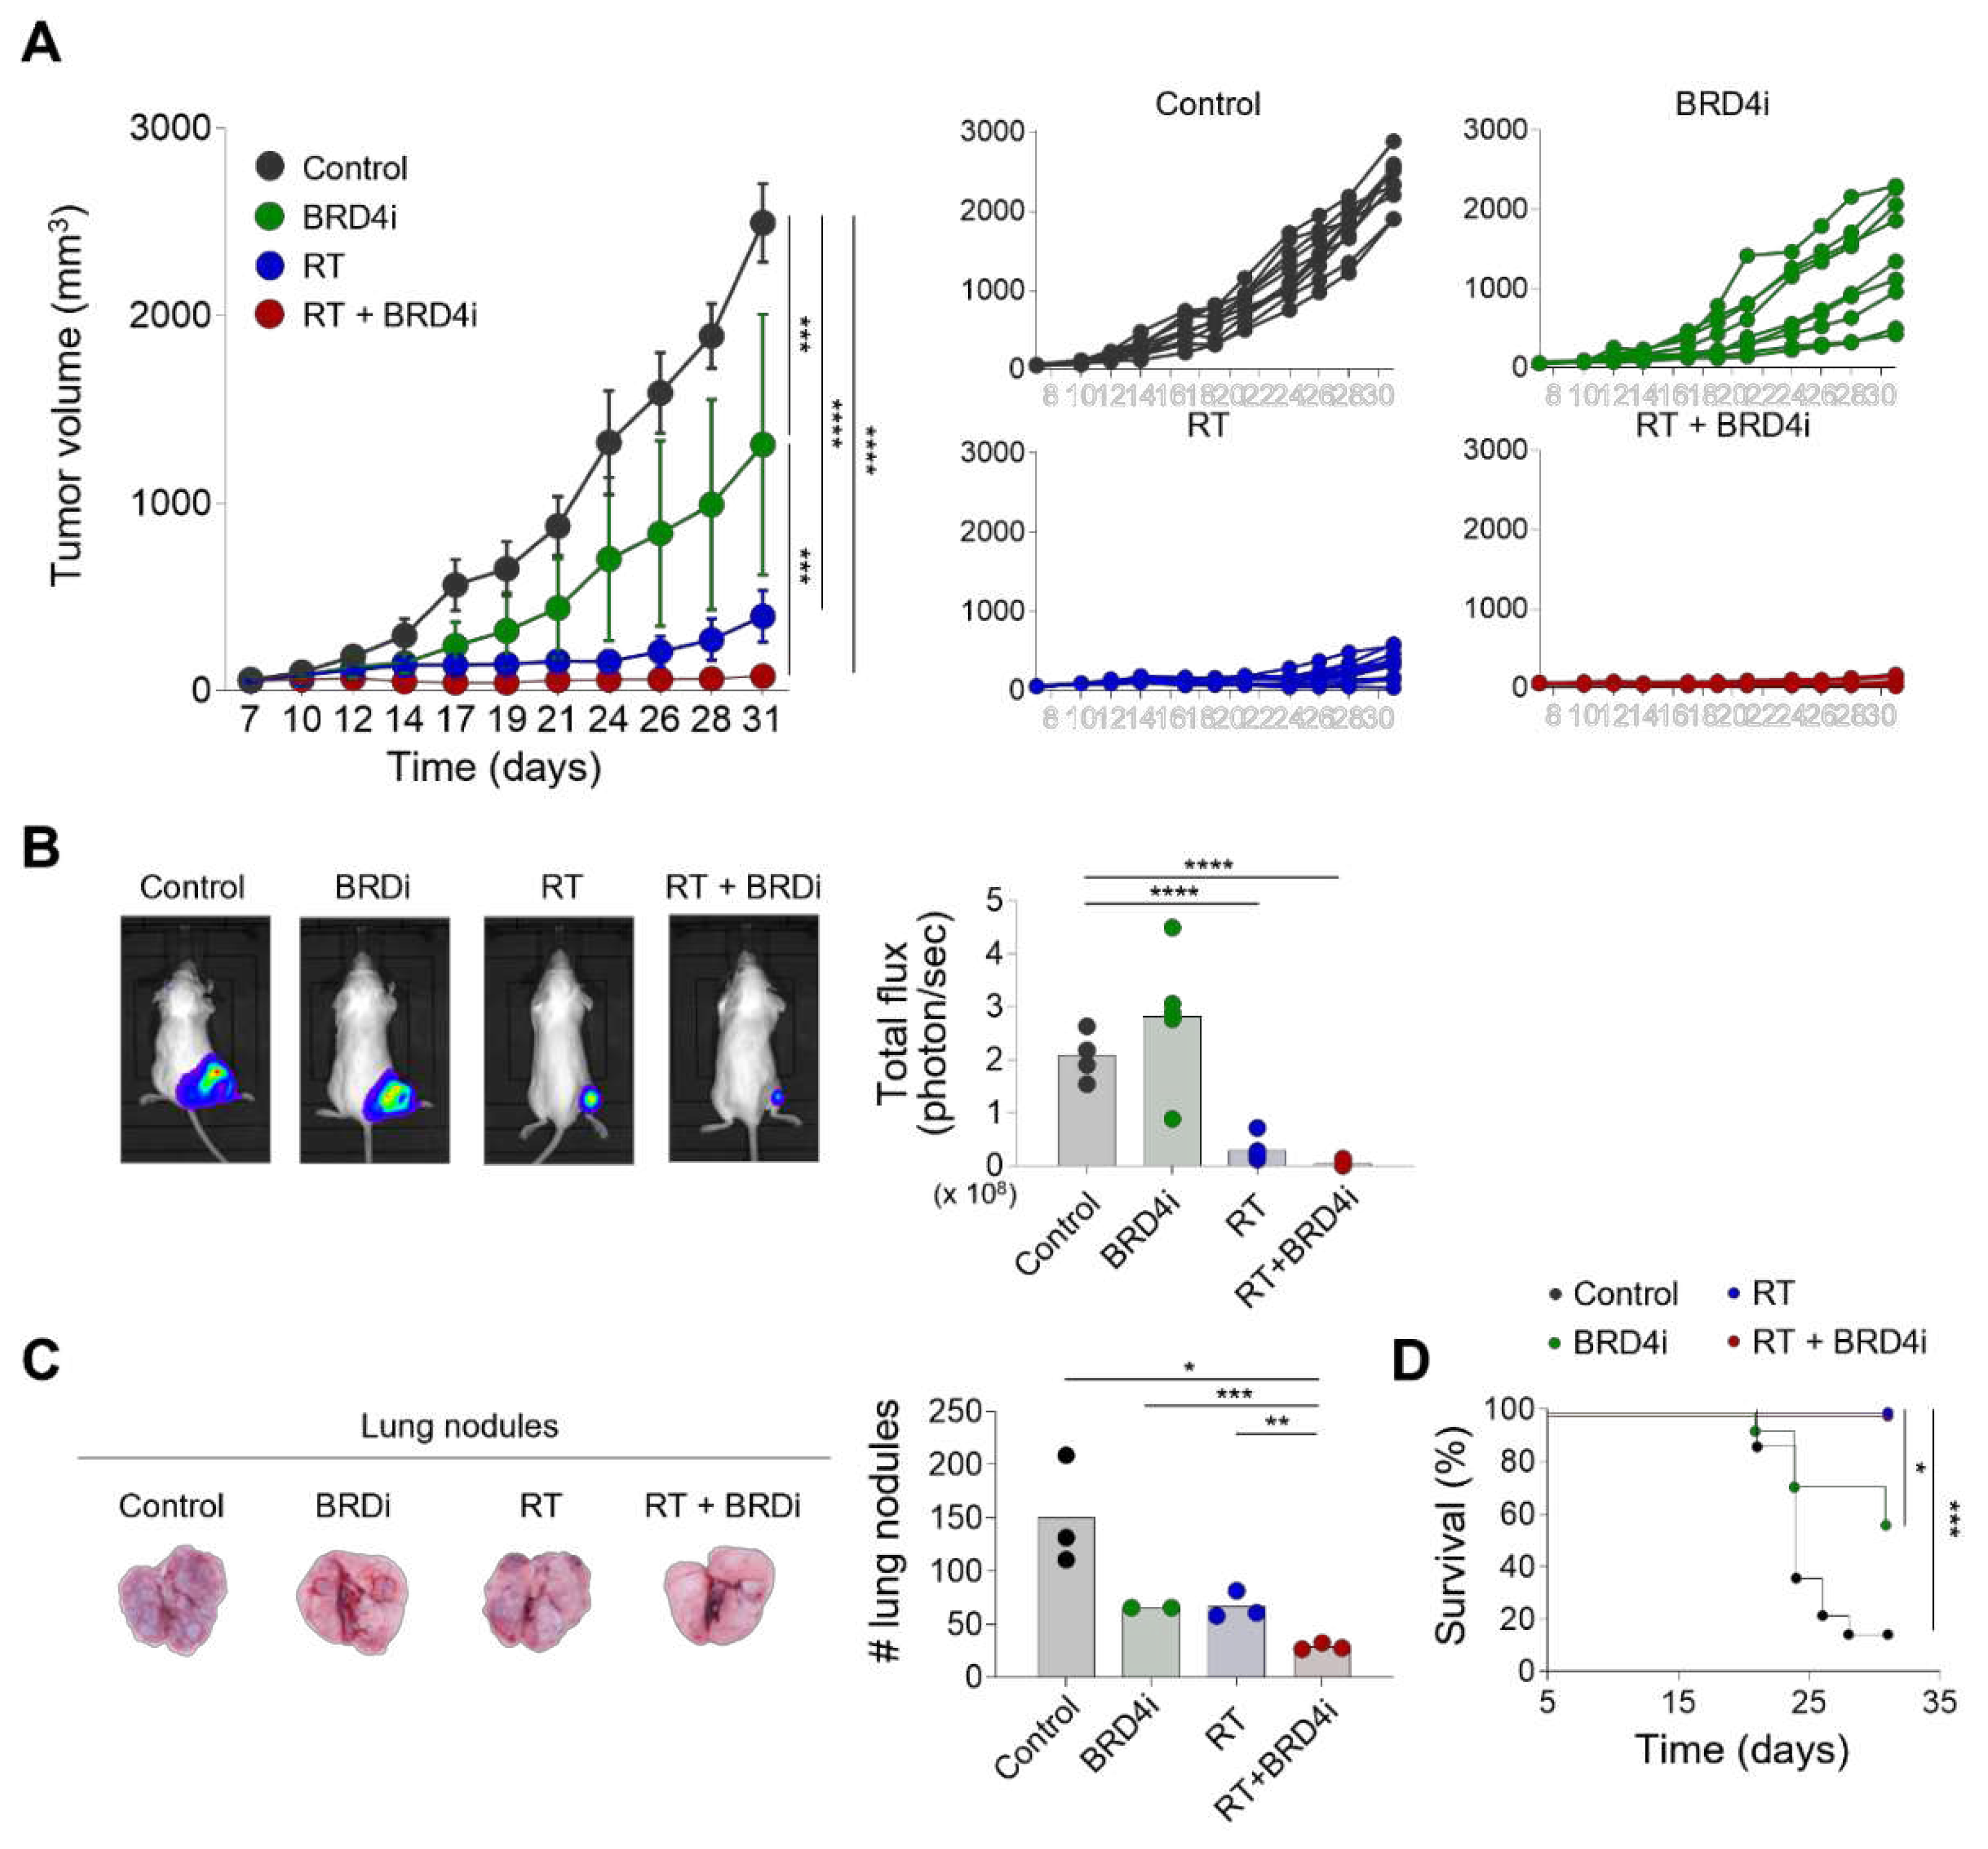
We first examined the antitumor effects of local RT combined with the BRD4 inhibitor. Local RT or BRD4 inhibitor alone delayed tumor growth (
Figure 1A). Importantly, combination treatment with local RT and the BRD4 inhibitor reduced tumor growth significantly more than either monotherapy alone. Similarly, in vivo imaging showed that combination treatment resulted in a smaller tumor burden than local RT alone (
Figure 1B). Additionally, the numbers of metastatic lung nodules decreased significantly with combination therapy compared to either monotherapy (
Figure 1C) suggesting that the BRD4 inhibitor suppresses both local growth and systemic spread of the tumor. Both local RT alone and combination therapy resulted in excellent survival rates for tumor-bearing mice that were significantly better than the survival rates of the control and BRD4 inhibitor alone mice (
Figure 1D). These data indicate that the BRD4 inhibitor enhances the antitumor effects of local RT.
2.2. Effects of the BRD4 inhibitor on the abscopal effects of local RT
To examine whether addition of the BRD4 inhibitor improves systemic immune responses evoked by local RT, we used the dual-tumor model that was previously used to observe the abscopal effects of RT [
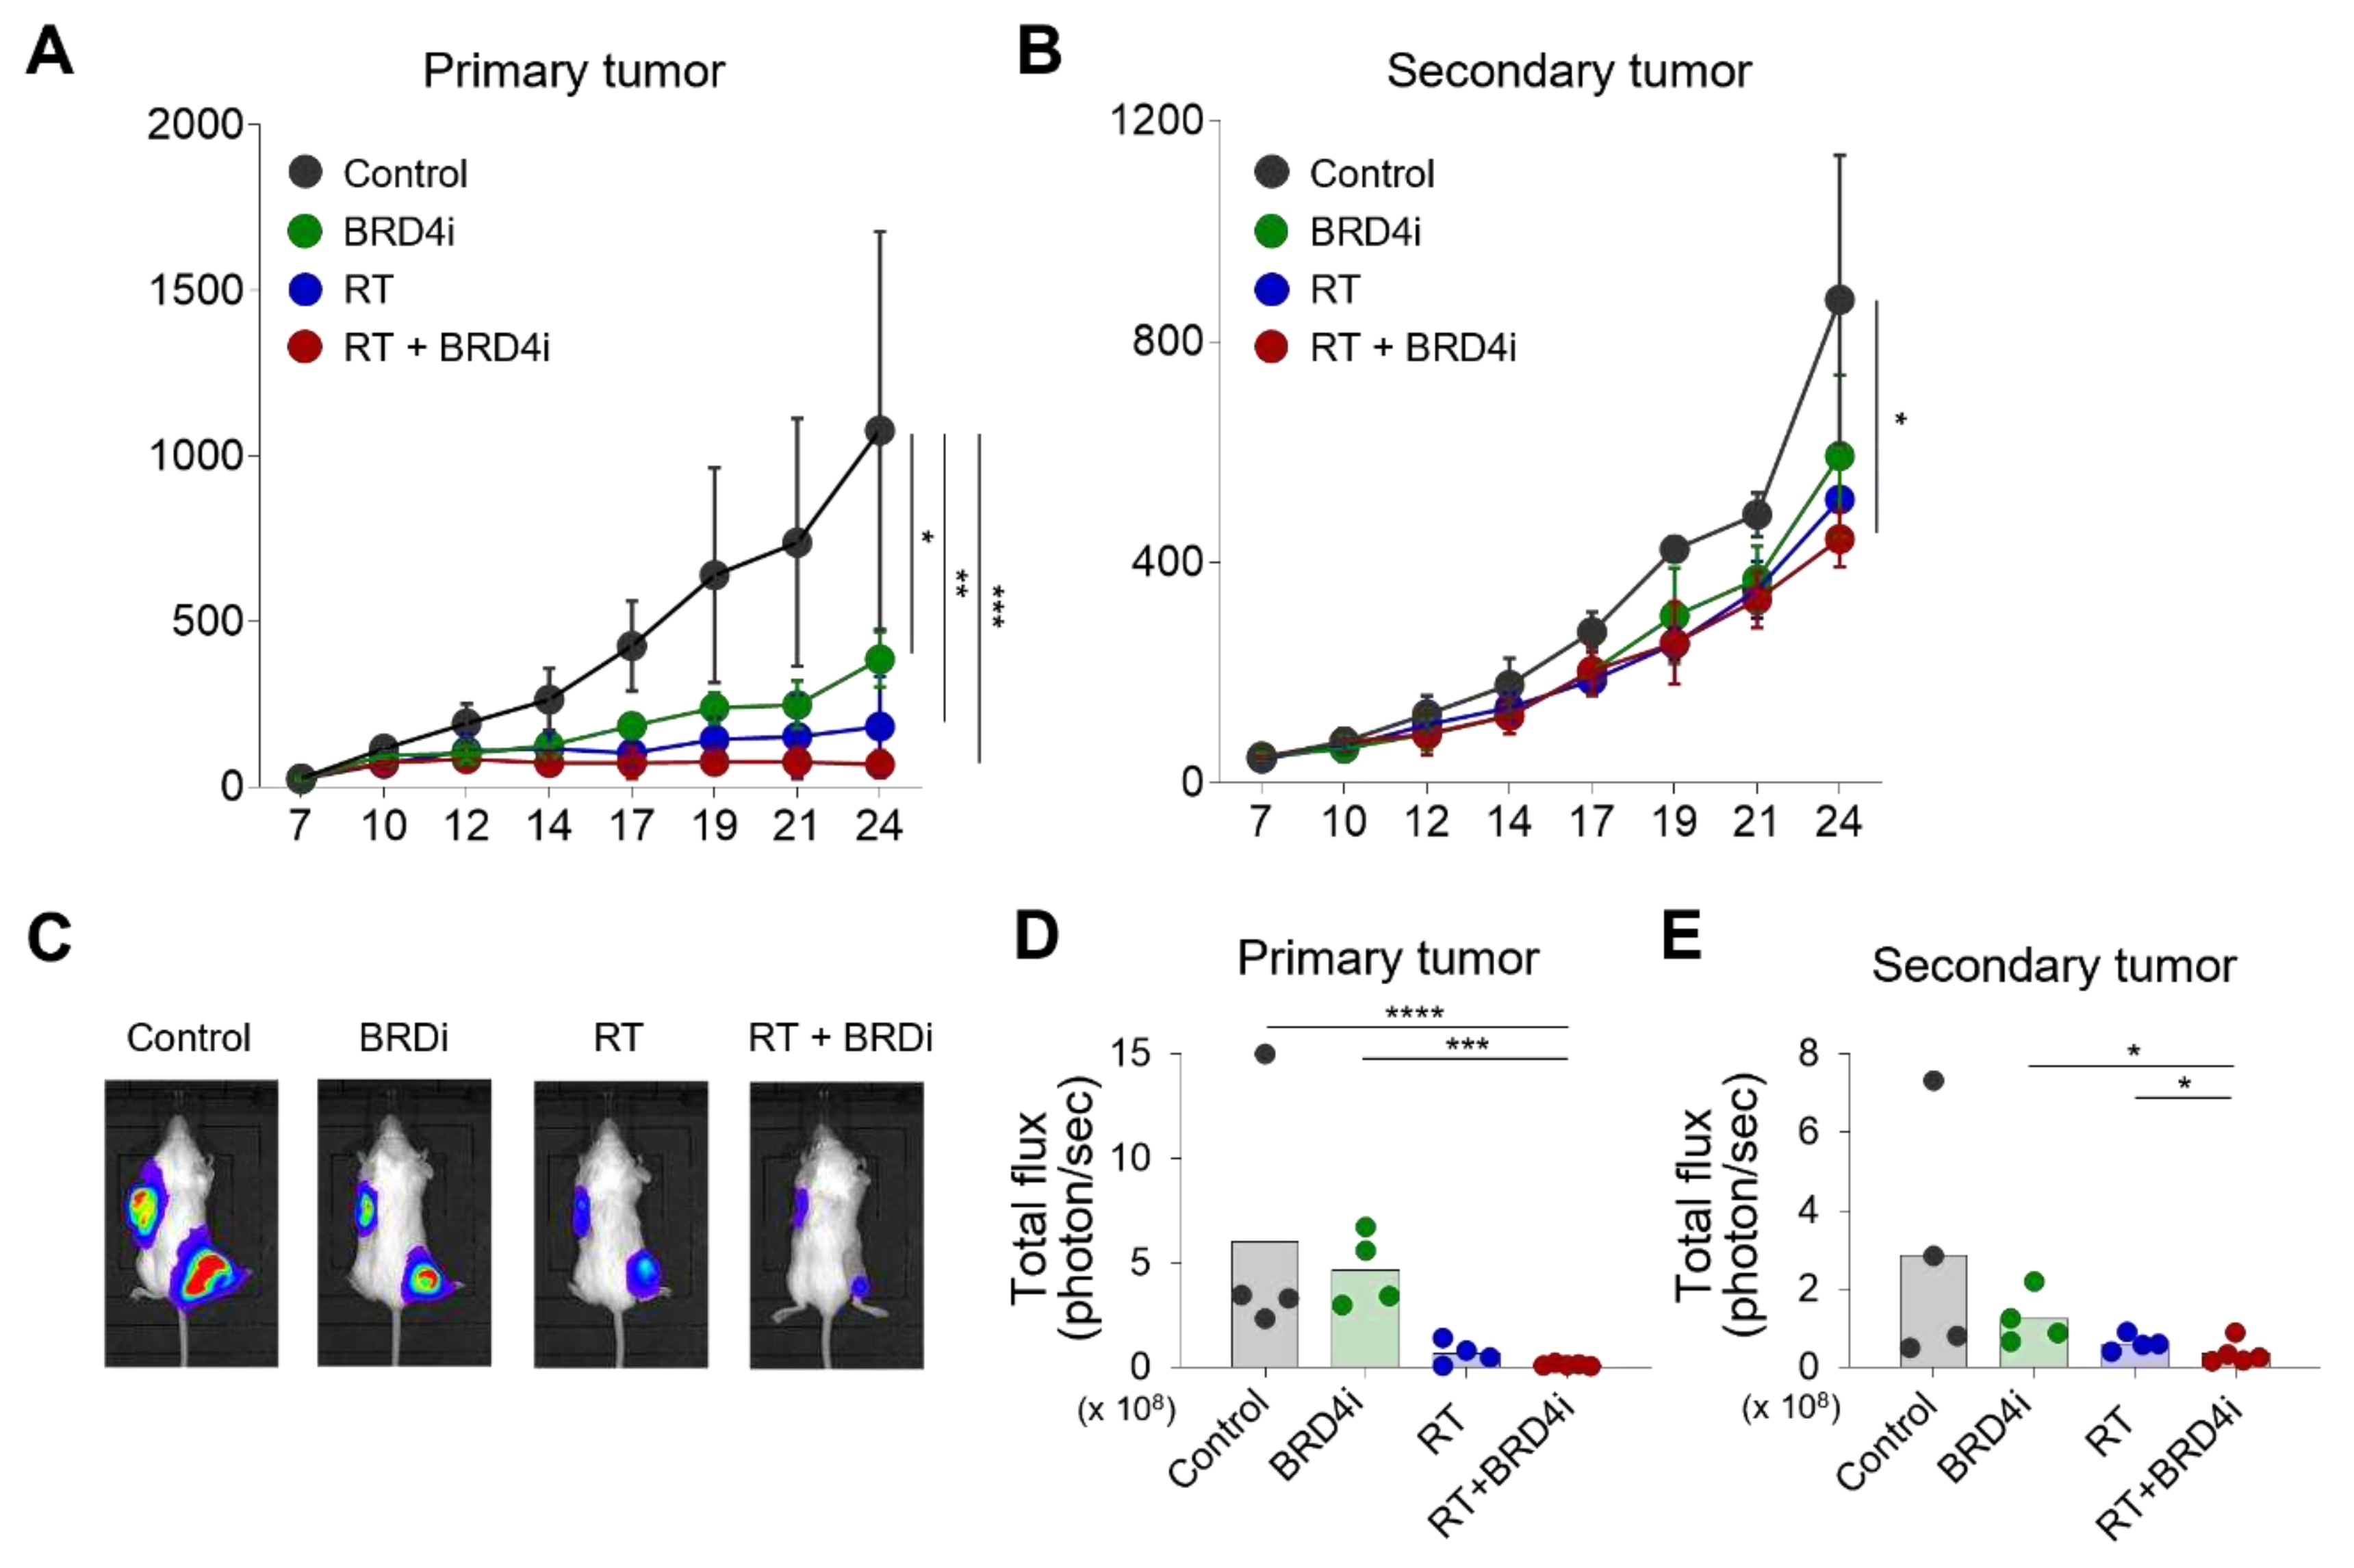
12]. RT alone and combination therapy led to similar growth inhibition of the primary tumor (
Figure 2A). Notably, combination therapy delayed growth of the secondary tumor when compared to the control, RT alone, and BRD4 alone groups (
Figure 2B). No significant effect on the secondary tumor was observed with RT or BRD4 inhibitor alone. In vivo imaging also demonstrated that combination therapy decreased the burdens of the primary and secondary tumors (
Figure 2C–E) suggesting that the BRD4 inhibitor improves the abscopal effects of local RT.
2.3. Treatment effects on the TME
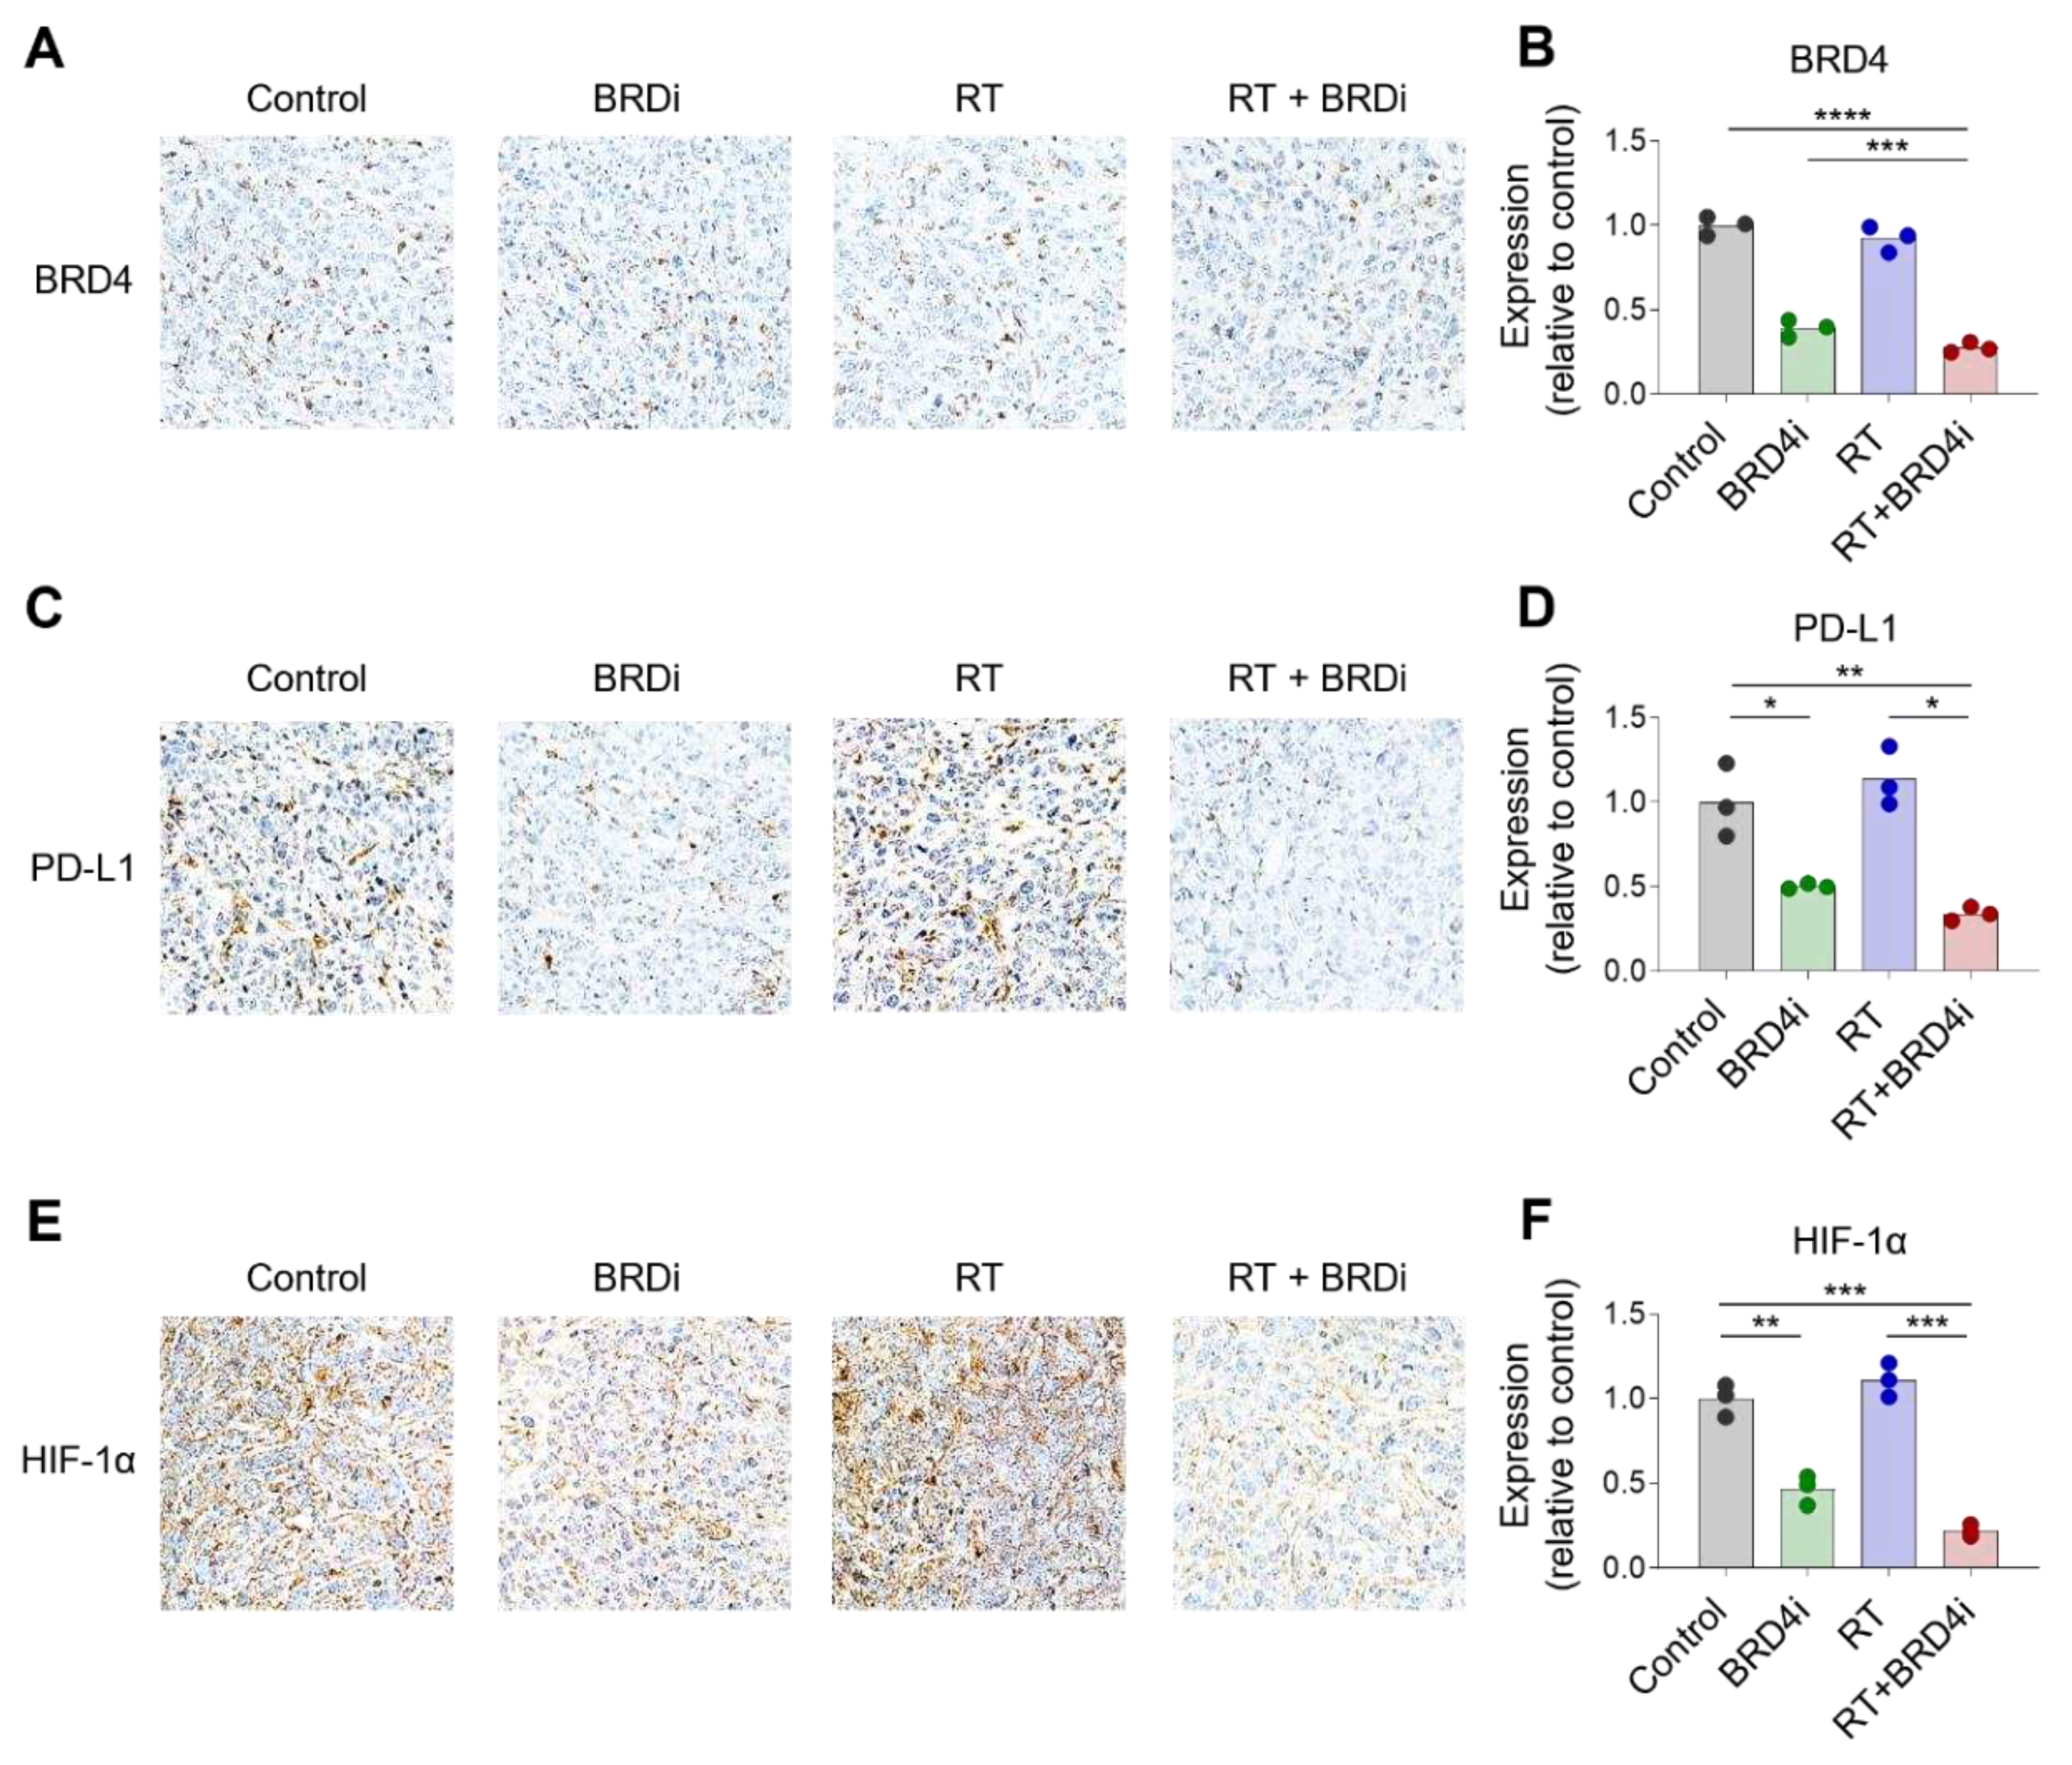
Having observed the additional antitumor effects of BRD4 inhibition with local RT, we examined changes in the TME upon local RT and BRD4 inhibition. BRD4 protein expression decreased significantly in the BRD4 inhibitor treatment group, but not in the RT alone group (
Figure 3A–B). Expression of HIF-1α also decreased in the BRD4 inhibitor group (
Figure 3C–D), which is consistent with previous reports. Notably, PD-L1 expression was downregulated in the BRD4 inhibitor group (
Figure 3E–F) suggesting that BRD4 inhibition may resolve, in part, the immunosuppressive TME.
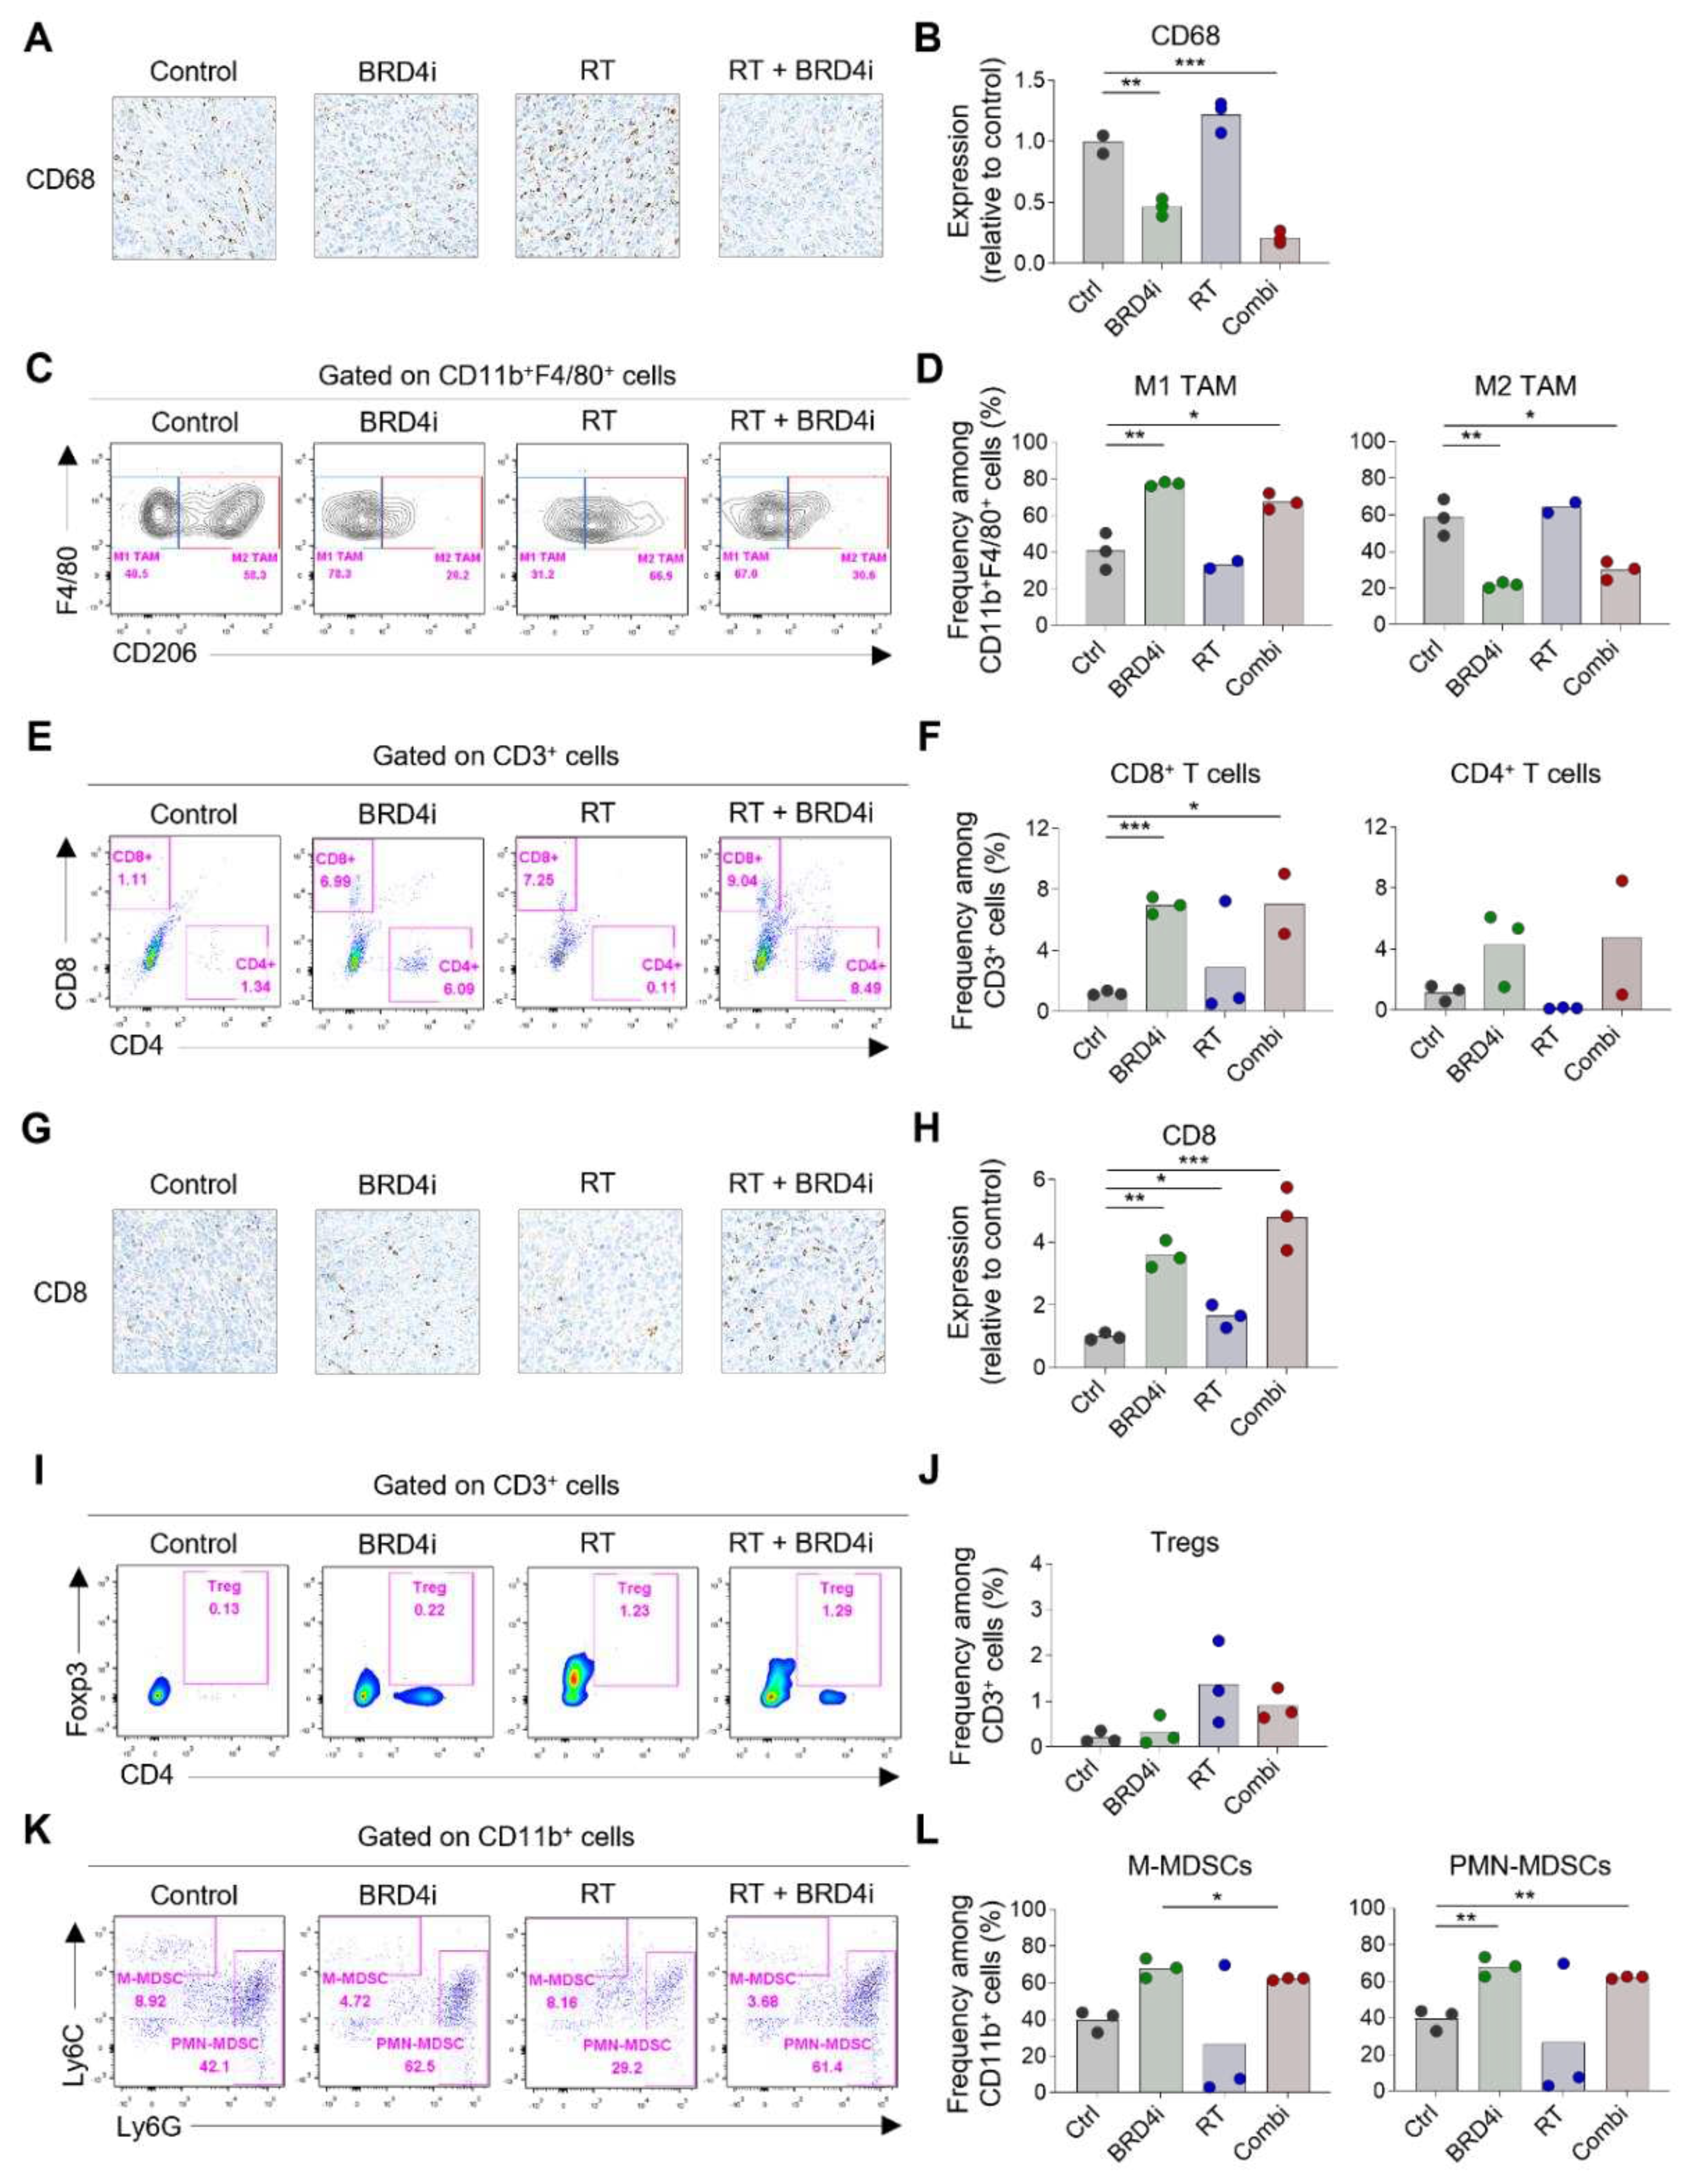
Next, we examined the immune cell composition in the TME after treatment. Infiltration of CD68
+ TAMs decreased upon addition of the BRD4 inhibitor (
Figure 4A–B). Treatment with the BRD4 inhibitor significantly increased the proportion of CD206
– M1 TAMs and reduced the proportion of CD206
+ M2 TAMs (
Figure 4C–D). Additionally, the BRD4 inhibitor significantly increased the proportion of CD8
+ T cells (
Figure 4E–F). This increase in CD8
+ T cells was confirmed by IHC (
Figure 4G–H). The proportion of Tregs increased upon local RT, and this increase diminished upon the addition of the BRD4 inhibitor; however, the diminution was not statistically significant (
Figure 4I–J). We also examined the proportions of MDSCs and found the frequency of Ly6C
high monocytic MDSCs among CD11b
+ cells decreased upon RT or BRD4 treatment. However, the reductions were not statistically significant. The proportion of Ly6G
high polymorphonuclear MDSCs increased upon treatment with the BRD4 inhibitor (
Figure 4K–L). These data suggest that combination therapy leads to a more immunogenic TME than local RT alone.
2.4. Treatment effects on systemic immune responses
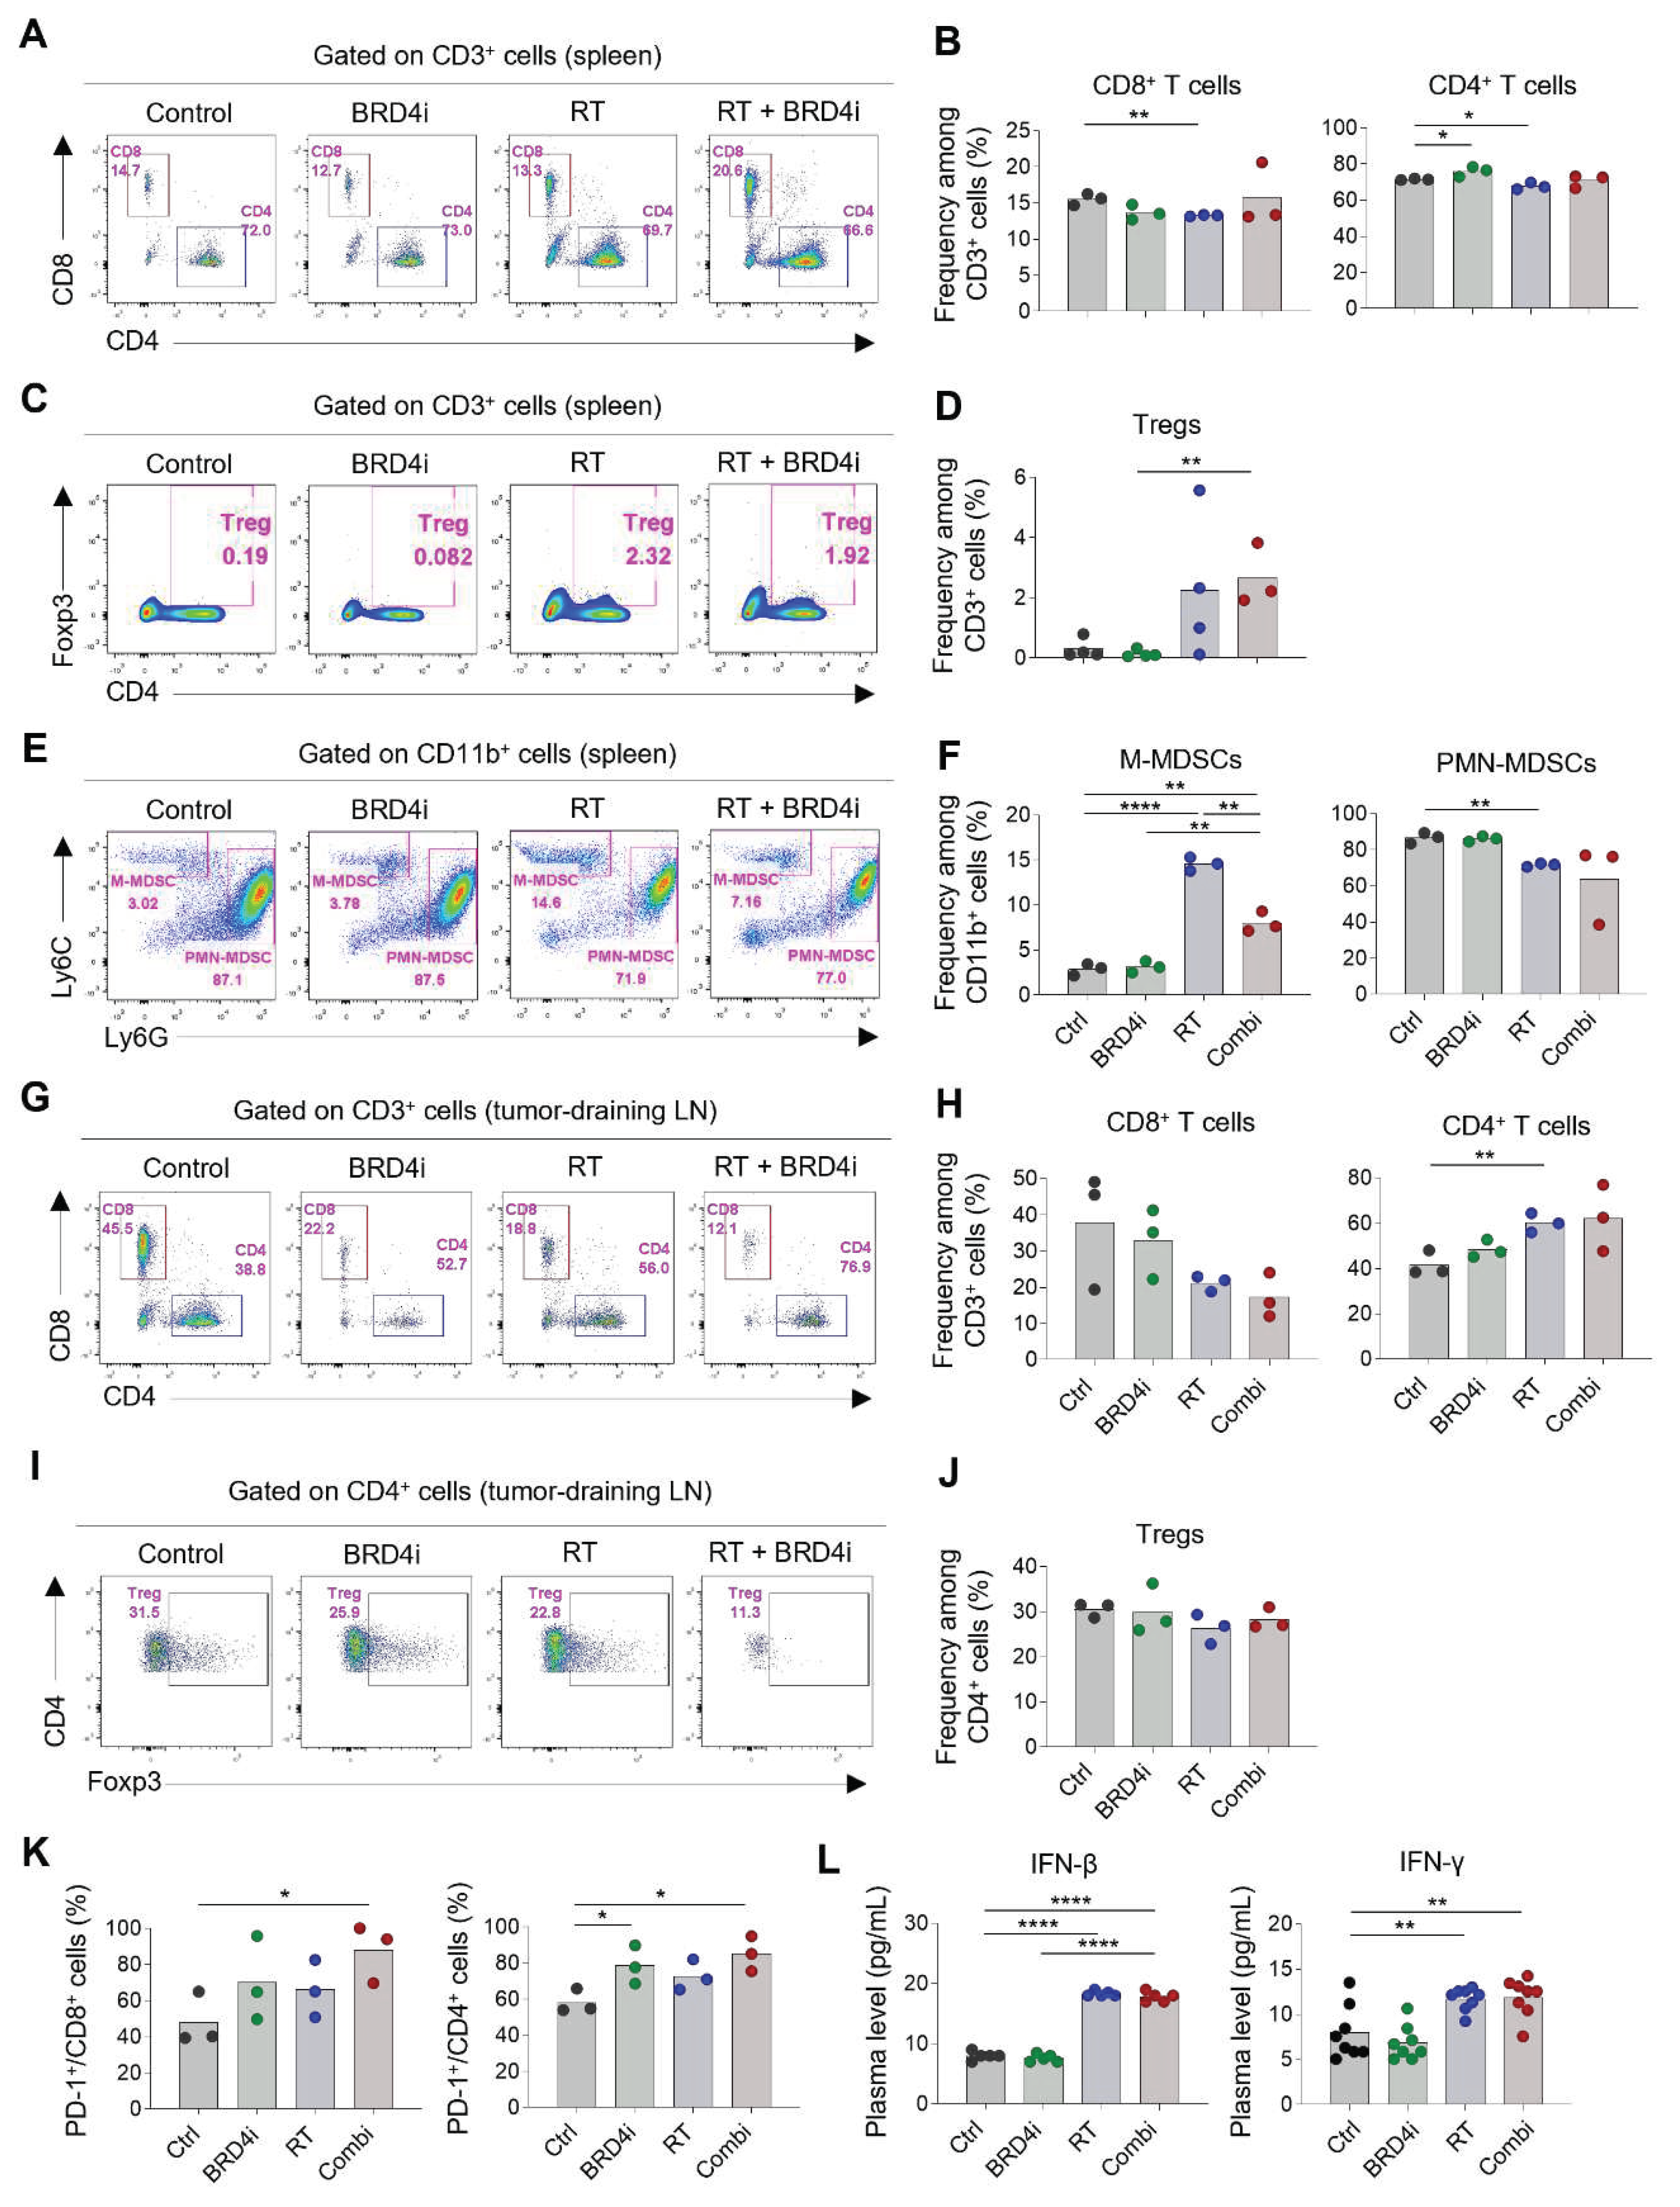
Because we observed that the abscopal effects of local RT increased upon the addition of the BRD4 inhibitor, we profiled the immune cells in spleens and the tumor-draining lymph nodes to determine the effects of the treatments on systemic immunity. The proportions of CD8
+ and CD4
+ T cells in the spleen were not altered remarkably by any of the treatments (
Figure 5A–B), whereas splenic Tregs increased upon combination therapy (
Figure 5C–D). Notably, the proportion of monocytic MDSCs increased upon local RT; however, this increase was ameliorated by the addition of the BRD4 inhibitor (
Figure 5E–F). The proportion of polymorphonuclear MDSCs was lowest upon combination therapy, although the difference was not statistically significant. In tumor-draining lymph nodes, the proportion of CD4
+ T cells among total T cells increased upon combination therapy, whereas the proportion of CD8
+ T cells decreased (
Figure 5G–H). Proportions of Tregs did not change significantly upon any of the treatments (
Figure 5I–J). Importantly, expression of PD-1 on CD8
+ and CD4
+ T cells in tumor-draining lymph nodes increased upon combination therapy (
Figure 5K) indicating an abundance of tumor-specific T cells after local RT and BRD4 inhibition. Levels of plasma IFN-β and IFN-γ increased upon RT but were not further elevated upon the addition of the BRD4 inhibitor (
Figure 5L). Collectively, these results suggest that BRD4 inhibition may contribute to a systemic decrease in immunosuppressive cells, particularly MDSCs, and an increase in tumor-specific T cells in draining lymph nodes.
3. Discussion
The antitumor effect of local RT is often limited by various mechanisms, including induction of an immunosuppressive TME. Discovery of novel strategies to overcome this limitation is necessary to maximize the effects of local RT. In this study, we suggest that inhibition of BRD4 enhances the antitumor effects of local RT and induces an immunostimulatory TME in a breast cancer model. To the best of our knowledge, this is the first study to describe immunologic changes by local RT and BRD4 inhibition.
Besides the direct cytotoxic effect of RT on tumor cells, local RT activates various immunostimulatory and immunosuppressive cells [
1]. The immunomodulatory effects of RT have been attributed to various factors, including damage-associated molecular patterns, cytokines, upregulation of immune receptors, and release of tumor antigens. Our previous studies using the 4T1-Luc mouse model showed that M2 TAMs, MDSCs, and Tregs increased upon local RT [
12,
13]. A growing body of evidence suggests that modulating immunosuppressive cells improve the antitumor effect of RT [
14,
15,
16]. Several novel strategies to inhibit immunosuppressive cells to enhance the efficacy of both local RT and immune checkpoint inhibitors have been suggested [
12,
13]. This study indicates that BRD4 inhibition can be utilized to enhance the antitumor effect of RT, probably by modulating TAMs and MDSCs.
BRD4 is expressed on various cells, including cancer cells and immune cells, and previous investigations on the BRD4 inhibitor focused on its direct effects on cancer cells. Recent studies indicated that BRD4 is also involved in innate immune responses [
17,
18]. Our finding that the BRD4 inhibitor significantly reduced M2 TAMs within the TME is in accordance with previous studies that showed that BRD4 promoted M2 polarization [
7,
8]. BRD4 was also shown to be involved in the recruitment of TAMs in a preclinical model [
19]. Meanwhile, the role of BRD4 and the effects of BRD4 inhibition on MDSCs have not been elucidated. Further research on the role of BRD4 in MDSCs is needed to fully understand the antitumor effects of the BRD4 inhibitor and its ability to improve the efficacy of RT.
The results of this study indicate that the BRD4 inhibitor improves local RT via the reduction of M2 TAMs and M-MDSCs. In addition, the BRD4 inhibitor also regulates the characteristics of tumor cells. Indeed, a previous study showed that BRD4 inhibition directly sensitizes tumor cells to RT by regulating DNA repair [
20]. Therefore, further studies are needed to dissect the direct and indirect effects of BRD4 inhibition on tumor cells.
In addition to immunologic changes, we observed that the BRD4 inhibitor downregulated HIF-1α expression. Although local RT did not significantly alter HIF-1α expression in our experiment, RT is a known potent inducer of hypoxia, which activates HIF-1α in cancer cells. Hypoxia and HIF-1α have been shown to play various roles in immunity, and hypoxia-driven immunologic changes in the TME tend to inhibit antitumor responses. HIF-1α induces FoxP3 resulting in an abundance of Tregs [
21], upregulates PD-L1 that inhibits T cell activation [
22], and drives M2-like polarization of TAMs [
23]. Hence, downregulation of HIF-1α by BRD4 inhibition may attenuate RT-induced immunosuppression in the TME as demonstrated in this study.
Recent studies have suggested that tumor-draining lymph nodes play a crucial role in RT-induced antitumor immune responses [
24,
25]. Priming and activation of tumor-specific T cells take place in tumor-draining lymph nodes and effects of immune checkpoint inhibitors are regulated in lymph nodes [
26]. Tumor-specific T cells that egressed from lymph nodes into the circulation can be recruited into the TME, therefore activation of systemic immune cells is as important as activation of tumor-infiltrating immune cells. Although we did not observe significant effects on immune cells in tumor-draining lymph nodes upon RT or BRD4 inhibition, we noticed a remarkable increase in splenic T cells. Therefore, BRD4 inhibition may mitigate the immunosuppressive TME and stimulate systemic antitumor immune responses, which should be investigated further in future studies.
This study employed the murine TNBC model, which showed clear abscopal effects in our previous studies [
12,
13]. Breast cancer is considered a less immunogenic tumor, thus it is believed that immunotherapy provides limited clinical benefit [
27]. However, among the subtypes of breast cancer, TNBC is relatively immunogenic with a high tumor mutational burden, thus immunotherapy provides significant benefits [
28,
29]. Recent evidence from single-cell profiling suggests that the characteristics and constitution of tumor-infiltrating myeloid cells differ substantially according to cancer type [
30]. Because our data demonstrated that the antitumor effects of the BRD4 inhibitor were accompanied by alterations in TAMs and MDSCs within the TME, the immunomodulatory effects of the BRD4 inhibitor may vary across tumor types.
In summary, the BRD4 inhibitor enhanced the antitumor effects of RT and increased antitumor immune responses in the TME, specifically, levels of M2 TAMs and M-MDSCs decreased. Clinical studies using the BRD4 inhibitor are warranted to validate its benefit in combination with RT.
4. Materials & Methods
4.1. Cell culture
The luciferase-tagged 4T1 (4T1-Luc) murine TNBC cell line was purchased from the Japanese Collection of Research Bioresources Cell Bank. The cell line was maintained in complete RPMI1640 medium supplemented with 10% FBS and 1% penicillin/streptomycin. The cells were maintained at 37°C in a 5% CO2 incubator.
4.2. Mouse tumor model
All animal experiments were conducted using immune-competent BALB/c female mice (7 weeks of age). The 4T1-Luc cells (6 × 10⁵ cells) were subcutaneously injected into the right hindlimb. For the dual-tumor model, the 4T1-Luc cells were subcutaneously injected into the right hindlimb (6 × 10⁵ cells) and left flank (105 cells). Seven days after tumor injection, mice were allocated into 4 treatment groups: control, RT alone, BRD4 inhibitor alone, and combination treatment. All experiments were performed in compliance with animal ethics rules and in accordance with the IACUC Animal Experiment Protocol (BA-2103-316-021-01) of Seoul National University Bundang Hospital.
4.3. Treatments
BRD4 inhibitor (OPT-0139; 10 mg/kg) was injected intravenously on days 10, 12, 14, 17, 19, and 21 post-inoculation. RT was delivered on days 10, 12, and 14 post-inoculation; a 6 MeV electron beam was used to administer 8 Gy per treatment leading to irradiation with a total of 24 Gy. On the 31st day after tumor implantation, mice were sacrificed, and lungs, draining lymph nodes, spleens, and tumor tissues were harvested. Half of an extracted tumor sample was fixed in 4% paraformaldehyde and embedded in paraffin for immunohistochemistry (IHC). The obtained lymph nodes, spleens, and tumors were separated into single cells and stored at -70°C for subsequent flow cytometry analysis.
4.4. Tumor growth
Tumor size was measured using vernier calipers and tumor volume was calculated as Volume = (D x d2)/2 in which D and d represent the long and short diameters, respectively. Luciferase solution was used to obtain bioluminescence images, and the images were analyzed using the IVIS Lumina III In Vivo Imaging System on day 31 post-inoculation.
4.5. Immunohistochemistry (IHC)
Tumor tissues embedded in paraffin blocks were cut into 4 μm thick transverse slices and attached to glass slides. Tissue slices were deparaffinized using xylene and ethanol and then immersed in a solution of 3% H2O2 in methyl alcohol at room temperature for 10 min. Then, tissue slices were boiled in 0.01 M sodium citrate buffer pH 6.0 and blocked with 5% normal goat serum. Tissue slices were incubated with primary antibodies targeting BRD4, HIF-1α, PD-L1, CD8, and CD68 overnight at 4°C. Images were collected using an Axioskop 40 light microscope (Carl Zeiss) and AxioVision 4.7 software. Image J software was used for quantification, and the average density value was calculated for at least 3 slides per sample.
4.6. Flow cytometric analysis
After thawing, cells were treated with Fc blocking agent (Biolegend: 156604) at 4°C for 15 min and incubated with fluorochrome-conjugated antibodies against the surface markers at 4°C for 30 min. Then, cells were fixed and permeabilized using the Foxp3 Buffer Set (BD Biosciences: 560098) according to the manufacturer’s instructions. After washing, cells were incubated with fluorochrome-conjugated antibodies against Foxp3 at 4°C for 30 min. Flow cytometry analysis was performed using FACSCalibur (BD Biosciences) and FACSDiva software (BD Biosciences). All data were analyzed using FlowJo software (Treestar). All primary antibodies used for flow cytometry are listed in
Supplementary Table S1.
4.7. Statistical analysis
Statistical analyses were performed using GraphPad PRISM statistical analysis and graphing software (GraphPad). Two-way ANOVA was used to compare tumor growth in the mouse tumor model. The unpaired Student t-test was used to compare continuous variables between two groups. Significance was defined as a P value < 0.05.
Supplementary Materials
Table S1. List of flow cytometric antibodies used in the study.
Author Contributions
Conceptualization, I.A.K.; Methodology, S.M.K. and S.H.J.; Software, S.M.K..; Validation, S.M.K. and S.H.J.; Formal Analysis, S.M.K. and S.H.J.; Investigation, S.M.K., M.G.H., and M.H.K.; Resources, I.A.K..; Data Curation, S.M.K.; Writing – Original Draft Preparation, S.M.K. and S.H.J.; Writing – Review & Editing, I.A.K.; Visualization, S.H.J.; Supervision, S.H.J. and I.A.K.; Project Administration, I.A.K.; Funding Acquisition, I.A.K.
Funding
This study was supported by a grant from JBKLAB. It was also partially supported by an NRF-2023R1A2C3003782 grant.
Institutional Review Board Statement
Not applicable.
Informed Consent Statement
Not applicable.
Data Availability Statement
Not applicable.
Acknowledgments
This study was supported by a provision of OPT-0139 (BRD4 inhibitor) from JBKLAB.
Conflicts of Interest
The authors declare no conflict of interest.
References
- Weichselbaum RR, Liang H, Deng L, Fu YX. Radiotherapy and immunotherapy: A beneficial liaison? Nat Rev Clin Oncol 2017;14:365–79. [CrossRef]
- Muroyama Y, Nirschl TR, Kochel CM, Lopez-Bujanda Z, Theodros D, Mao W, et al. Stereotactic radiotherapy increases functionally suppressive regulatory T cells in the tumor microenvironment. Cancer Immunol Res 2017;5:992–1004. [CrossRef]
- Lin L, Kane N, Kobayashi N, Kono EA, Yamashiro JM, Nickols NG, et al. High-dose per fraction radiotherapy induces both antitumor immunity and immunosuppressive responses in prostate tumors. Clin Cancer Res 2021;27:1505–15. [CrossRef]
- Sia J, Hagekyriakou J, Chindris I, Albarakati H, Leong T, Schlenker R, et al. Regulatory T Cells Shape the Differential Impact of Radiation Dose-Fractionation Schedules on Host Innate and Adaptive Antitumor Immune Defenses. Int J Radiat Oncol Biol Phys 2021;111:502–14. [CrossRef]
- Jiménez-Cortegana C, Galassi C, Klapp V, Gabrilovich DI, Galluzzi L. Myeloid-Derived Suppressor Cells and Radiotherapy. Cancer Immunol Res 2022;10:545–57. [CrossRef]
- Donati B, Lorenzini E, Ciarrocchi A. BRD4 and Cancer: Going beyond transcriptional regulation. Mol Cancer 2018;17:1–13. [CrossRef]
- Li X, Fu Y, Yang B, Guo E, Wu Y, Huang J, et al. BRD4 Inhibition by AZD5153 Promotes Antitumor Immunity via Depolarizing M2 Macrophages. Front Immunol 2020;11:89. [CrossRef]
- Yang T, Hu Y, Miao J, Chen J, Liu J, Cheng Y, et al. A BRD4 PROTAC nanodrug for glioma therapy via the intervention of tumor cells proliferation, apoptosis and M2 macrophages polarization. Acta Pharm Sin B 2022;12:2658–71. [CrossRef]
- Yin M, Guo Y, Hu R, Cai WL, Li Y, Pei S, et al. Potent BRD4 inhibitor suppresses cancer cell-macrophage interaction. Nat Commun 2020;11:1–14. [CrossRef]
- Zhang M, Wang G, Ma Z, Xiong G, Wang W, Huang Z, et al. BET inhibition triggers antitumor immunity by enhancing MHC class I expression in head and neck squamous cell carcinoma. Mol Ther 2022;30:3394–413. [CrossRef]
- Riganti C, Lingua MF, Salaroglio IC, Falcomatà C, Righi L, Morena D, et al. Bromodomain inhibition exerts its therapeutic potential in malignant pleural mesothelioma by promoting immunogenic cell death and changing the tumor immune-environment. Oncoimmunology 2018;7. [CrossRef]
- Han MG, Jang BS, Kang MH, Na D, Kim IA. PI3Kγδ inhibitor plus radiation enhances the antitumour immune effect of PD-1 blockade in syngenic murine breast cancer and humanised patient-derived xenograft model. Eur J Cancer 2021;157:450–63. [CrossRef]
- Chang WI, Han MG, Kang MH, Park JM, Kim EE, Bae J, et al. PI3Kαδ Inhibitor Combined With Radiation Enhances the Antitumor Immune Effect of Anti-PD1 in a Syngeneic Murine Triple-Negative Breast Cancer Model. Int J Radiat Oncol 2021;110:845–58. [CrossRef]
- Ji D, Song C, Li Y, Xia J, Wu Y, Jia J, et al. Combination of radiotherapy and suppression of Tregs enhances abscopal antitumor effect and inhibits metastasis in rectal cancer. J Immunother Cancer 2020;8:e000826. [CrossRef]
- Seifert L, Werba G, Tiwari S, Giao Ly NN, Nguy S, Alothman S, et al. Radiation Therapy Induces Macrophages to Suppress T-Cell Responses Against Pancreatic Tumors in Mice. Gastroenterology 2016;150:1659-1672.e5. [CrossRef]
- Shiao SL, Ruffell B, De Nardo DG, Faddegon BA, Park CC, Coussens LM. TH2-polarized CD4+ T Cells and macrophages limit efficacy of radiotherapy. Cancer Immunol Res 2015;3:518–25. [CrossRef]
- Bao Y, Wu X, Chen J, Hu X, Zeng F, Cheng J, et al. Brd4 modulates the innate immune response through Mnk2-eIF4E pathway-dependent translational control of IκBα. Proc Natl Acad Sci U S A 2017;114:E3993–4001. [CrossRef]
- Ahmed NS, Gatchalian J, Ho J, Burns MJ, Hah N, Wei Z, et al. BRD9 regulates interferon-stimulated genes during macrophage activation via cooperation with BET protein BRD4. Proc Natl Acad Sci U S A 2022;119:e2110812119. [CrossRef]
- Mu J, Sun P, Ma Z, Sun P. BRD4 promotes tumor progression and NF-κB/CCL2-dependent tumor-associated macrophage recruitment in GIST. Cell Death Dis 2019;10:1–11. [CrossRef]
- Ni M, Li J, Zhao H, Xu F, Cheng J, Yu M, et al. BRD4 inhibition sensitizes cervical cancer to radiotherapy by attenuating DNA repair. Oncogene 2021;40:2711–24. [CrossRef]
- Clambey ET, McNamee EN, Westrich JA, Glover LE, Campbell EL, Jedlicka P, et al. Hypoxia-inducible factor-1 alpha-dependent induction of FoxP3 drives regulatory T-cell abundance and function during inflammatory hypoxia of the mucosa. Proc Natl Acad Sci U S A 2012;109. [CrossRef]
- Noman MZ, Desantis G, Janji B, Hasmim M, Karray S, Dessen P, et al. PD-L1 is a novel direct target of HIF-1α, and its blockade under hypoxia enhanced MDSC-mediated T cell activation. J Exp Med 2014;211:781–90. [CrossRef]
- Colegio OR, Chu NQ, Szabo AL, Chu T, Rhebergen AM, Jairam V, et al. Functional polarization of tumour-associated macrophages by tumour-derived lactic acid. Nature 2014;513:559–63. [CrossRef]
- Marciscano AE, Ghasemzadeh A, Nirschl TR, Theodros D, Kochel CM, Francica BJ, et al. Elective nodal irradiation attenuates the combinatorial efficacy of stereotactic radiation therapy and immunotherapy. Clin Cancer Res 2018;24:5058–71. [CrossRef]
- Buchwald ZS, Nasti TH, Lee J, Eberhardt CS, Wieland A, Im SJ, et al. Tumor-draining lymph node is important for a robust abscopal effect stimulated by radiotherapy. J Immunother Cancer 2020;8:e000867. [CrossRef]
- Dammeijer F, van Gulijk M, Mulder EE, Lukkes M, Klaase L, van den Bosch T, et al. The PD-1/PD-L1-Checkpoint Restrains T cell Immunity in Tumor-Draining Lymph Nodes. Cancer Cell 2020;38:685-700.e8. [CrossRef]
- Wein L, Luen SJ, Savas P, Salgado R, Loi S. Checkpoint blockade in the treatment of breast cancer: Current status and future directions. Br J Cancer 2018;119:4–11. [CrossRef]
- Schmid P, Cortes J, Pusztai L, McArthur H, Kümmel S, Bergh J, et al. Pembrolizumab for Early Triple-Negative Breast Cancer. N Engl J Med 2020;382:810–21. [CrossRef]
- Cortes J, Cescon DW, Rugo HS, Nowecki Z, Im SA, Yusof MM, et al. Pembrolizumab plus chemotherapy versus placebo plus chemotherapy for previously untreated locally recurrent inoperable or metastatic triple-negative breast cancer (KEYNOTE-355): a randomised, placebo-controlled, double-blind, phase 3 clinical trial. Lancet 2020;396:1817–28. [CrossRef]
- Mulder K, Patel AA, Kong WT, Piot C, Halitzki E, Dunsmore G, et al. Cross-tissue single-cell landscape of human monocytes and macrophages in health and disease. Immunity 2021;54:1883-1900.e5. [CrossRef]
Figure 1.
Antitumor effects of radiotherapy (RT) and the BRD4 inhibitor. (A), Growth curves of tumors in mice treated with the control, the BRD4 inhibitor, local RT, or combination therapy. (B), Representative bioluminescence images (left) and intensities (right) in mice treated with the control, the BRD4 inhibitor, local RT, or combination therapy. (C), Representative images (left) and numbers of metastatic lung nodules (right) in mice treated with the control, the BRD4 inhibitor, local RT, or combination therapy. (D), Survival curves of mice treated with the control, the BRD4 inhibitor, local RT, or combination therapy.
Figure 2.
Abscopal effects of RT and the BRD4 inhibitor. A–B, Growth curves of primary tumors (A) and secondary tumors (B) in a dual-tumor model treated with the control, the BRD4 inhibitor, local RT, or combination therapy. (C), Representative bioluminescence images in the dual-tumor model. D–E, Bioluminescence intensities of primary tumors (D) and secondary tumors (E) in the dual-tumor model treated with the control, the BRD4 inhibitor, local RT, or combination therapy.
Figure 3.
Changes in BRD4, PD-L1, and HIF-1α expression upon RT and BRD4 inhibition. A–B, Representative immunohistochemistry (IHC) images (A) and relative expression (B) of BRD4 in the tissue microenvironment (TME). C–D, Representative IHC images (C) and relative expression (D) of PD-L1 in the TME. E–F, Representative IHC images (E) and relative expression (F) of HIF-1α in the TME.
Figure 4.
Changes in tumor-infiltrating immune cells by RT and BRD4 inhibition. A–B, Representative IHC images (A) and relative expression (B) of CD68 in tumors. C–D, Representative flow cytometry plots (C) and frequencies (D) of M1 and M2 tumor-associated macrophages (TAMs) in tumors. E–F, Representative flow cytometry plots (E) and frequencies (F) of CD8+ T cells and CD4+ T cells in tumors. G–H, Representative IHC images (G) and relative expression (H) of CD8 in the TME. I–J, Representative flow cytometry plots (I) and frequencies (J) of regulatory T cells (Tregs) in tumors. K–L, Representative flow cytometry plots (K) and frequencies (L) of monocytic and polymorphonuclear myeloid-derived suppressor cells (MDSCs) in tumors.
Figure 5.
Changes in systemic immune responses by RT and BRD4 inhibition. A–B, Representative flow cytometry plots (A) and frequencies (B) of CD8+ T cells and CD4+ T cells in spleens. C–D, Representative flow cytometry plots (C) and frequencies (D) of Tregs in spleens. E–F, Representative flow cytometry plots (E) and frequencies (F) of monocytic and polymorphonuclear MDSCs in spleens. G–H, Representative flow cytometry plots (G) and frequencies (H) of CD8+ T cells and CD4+ T cells in tumor-draining lymph nodes. I–J, Representative flow cytometry plots (I) and frequencies (J) of Tregs in tumor-draining lymph nodes. K, Frequencies of PD-1+ cells among CD8+ T cells (left) and CD4+ T cells in tumor-draining lymph nodes. L, Concentrations of plasma interferon-β (left) and interferon-γ (right).
|
Disclaimer/Publisher’s Note: The statements, opinions and data contained in all publications are solely those of the individual author(s) and contributor(s) and not of MDPI and/or the editor(s). MDPI and/or the editor(s) disclaim responsibility for any injury to people or property resulting from any ideas, methods, instructions or products referred to in the content. |
© 2023 by the authors. Licensee MDPI, Basel, Switzerland. This article is an open access article distributed under the terms and conditions of the Creative Commons Attribution (CC BY) license (http://creativecommons.org/licenses/by/4.0/).
