Preprint
Article

Herbivory and Invasive Plant Species dynamics in Protected Rangelands: A Case for Conservation of Hell’s Gate National Park, Kenya

Altmetrics

Downloads

163

Views

143

Comments

0

Submitted:

25 July 2023

Posted:

25 July 2023

You are already at the latest version

Alerts
Abstract
The status of vegetation and the impacts of mammalian herbivores on rangelands are complex, and such studies in Kenya are scanty. We investigated the dynamics of ground cover vegetation in Hell’s Gate National Park in relation to mammalian herbivory. Removal of palatable vegetation is postulated to enhance the development of invasive plant species. We investigated the influence of mammalian herbivores on vegetation diversity and dynamics in this rangeland. Three sampling blocks approximately 3 Km apart measuring 100 m x 50 m were established, each divided into three belt-transects (100 m x 10 m), and separated by a 10 m buffer zone. 2 m by 2 m quadrats at 20 m intervals were established in each transect. We measured composition the richness of plant and mammal species, and herbivory levels four times for six months (September 2018 to February 2019). Plant cover (P< 0.001) and species diversity (P< 0.001) differed significantly among sampling blocks and between seasons (P< 0.001). Non-metric multidimensional scaling of plant species and herbivores showed co-occurrence of Zebras with Sida tenuicarpa and giraffes with Solanum incunum. We conclude that the removal of preferred plants through herbivory may be giving an edge to invasive species in the park.
Keywords: 
Subject: Environmental and Earth Sciences  -   Environmental Science

1. Introduction

Rangelands are natural habitats composed mainly of grasses, a few trees, and shrubs. They form the fundamental sources of forage in natural ecosystems thus supporting the survival of wildlife and sustaining food chains particularly in the protected areas [1]. Vegetation in the rangelands varies due to both abiotic and biotic factors such as climate, edaphic factors, fire, herbivores, or the interaction among these factors. What is not well understood is how these variables interact across productivity gradients to structure the vegetation [2].
In arid and semi-arid environments, the concentration of water and nutrients provide suitable areas for vegetation establishment, and this results in a heterogeneous pattern of vegetation and plant populations [3]. Accordingly, when there is a high rate of biomass removal and selective feeding on palatable plant species, there results in a decline in resource retention as well as altered plant life forms. This study hypothesizes that herbivory plays a major role in determining vegetation dynamics in rangeland ecosystems like those of Hell’s Gate National Park of Kenya. For instance, some studies have shown that heavy grazing by herbivores favors the annuals and short plants with stoloniferous structure [4]. Furthermore, [5] and [6] portray herbivory as an important driver of ecosystem processes in Kenyan rangelands as well as the major determinant of ground cover vegetation density. This is by trampling on or removal of the plant material [7].
Herbivores have a direct effect on the ground cover vegetation by consuming the vegetation, and can reduce above and below-ground carbon stocks across vegetation types in the rangelands [8]. Uncontrolled herbivory can lead to a decrease in density and cover of palatable grasses, forbs, and herbs in the rangelands. Long term grazing may lead to the prevalence of unpalatable plant species due to selective grazing on palatable plants [9]. [10] have shown that herbivory in the rangelands reduces the growth, survival, and fitness of most of the plants that are grazed or browsed upon. Furthermore, [5] noted that overgrazing and trampling by herbivores reduce ground cover vegetation and the standing biomass as well as indirectly causing erosion, which leads to rangeland deterioration. [2] also observed that shifts in vegetation cover due to herbivory among other factors can change the ecosystem functioning in the rangelands. In this regard, [6] proposed that one management implication against excessive herbivory within protected rangeland may be temporal and spatial manipulation of the herbivore densities to maintain appropriate carrying capacities following the soil and rainfall status of the given area. However, his proposition is only applicable in areas where proper research has been conducted concerning the impact of herbivory on rangeland vegetation.
Despite the negative impacts of herbivory, some studies have shown that in some very limited instances, low levels of herbivory may benefit plants by stimulating re-growth that produces greater amounts of biomass than initially removed by the herbivores [8,11]. This is critical in ensuring that old plant tissues that are less nutritious to herbivores are removed thus allowing for the continuous availability of quality foliage [6]. This ensures proper functioning of the rangeland ecosystem through delivering natural ecosystem services such as soil and water conservation, nutrient recycling as well as disaster and risk prevention to humanity [1]. Though several studies have addressed herbivory [12,13,14], only a few have established its relative importance in determining changes in ground cover vegetation in the rangelands [2]. Most studies tend to generalize on the impact of herbivory on rangeland vegetation, as well as address one or a few parameters in their interpretations of vegetation changes [9,15,11].
The last research in Hells Gate National park was done by [16], and since then management measures instituted include exclusion of grazing by domestic animals leading to a change in animal population and herbivory dynamics. The park is also under enhanced protection from human encroachment. However, there is a need to assess the current status of the park in an attempt to improve rangeland productivity, conservation status, and sustainability. This study, therefore, aimed at assessing multiple parameters over two seasons in determining if mammalian herbivores are key players in ground cover vegetation dynamics. The study speculates that the type of herbivores and their densities, as well as the vegetation composition in various parts of the park, are likely to influence ground cover vegetation changes and the associated ecosystem services of the park rangelands over space and time. This study further hypothesizes that given the current protection status of the park, there have been changes in plant species composition and diversity over time which could be attributed to mammalian herbivory. It is also possible that an increase in invasive plant species has altered the distribution, regeneration, and quantity of palatable plant species in the park.

2. Materials and Methods

Study area

This study was conducted in Hell's Gate National Park (Kenya) (Figure S1). The park is located approximately 120 km northwest of Nairobi, 0o 54’ 57” S; 36o 18’ 48” E. It has an altitude of 1,560 - 2,187 m ASL. Soils are mainly volcanic ashes. The park covers an area of 68.25 square Km [17]. Annual rainfall is approximately 600 mm and is largely bimodal with two rainy seasons; the long rain (between March and May) and short rain (between October and December). This zone is characterized by a dry season from January to February and July to September. The mean temperature range is 20 to 26 oC [18].

The biophysical characteristics

Vegetation is mainly grasslands dominated by Cynodon dactylon and shrublands dominated by Tarchonanthus camphoratus [18]. Tarchonanthus camphoratus is not palatable to the herbivores because its leaves are sclerophyllous and have hairy lamina. Besides, it is evergreen and not affected by seasonality. It is allelopathic and hence it limits the growth of other plant species around it. Some of the few grass species that manage to coexist with Tarchonanthus camphoratusare, Themeda triandra and Chloris gayana. Most mammal herbivore species take cover within the bushlands of T. camphoratus when not feeding in the grasslands. There is also a wide variety of succulents and unique plants capable of withstanding high temperatures. Besides, there is a wide range of mammalian herbivores in the park including the African buffalo (Syncerus caffer), Zebra (Equus quagga), Eland (Taurotragus oryx), Hartebeest (Alcelaphus buselaphus), Thomson's and Grant gazelle as well as the Impala (Aepyceros melampus) [19].

The sampling of ground cover plant species

Within each of the three sampling blocks in the park, 2 m by 2 m quadrats were placed randomly at 20 meters intervals along the belts- transects. The number and type of individuals of plant species in the quadrats were determined through direct counting of the shoots. For each plant species, counts were recorded for each quadrat sampled, and the totals were later calculated for each of the blocks.

Mammal herbivore species survey and identification

Game drives were carried out within the park to survey on the mammalian herbivore species, and they were identified with the help of the park resource person. In case there was grazing activity but the herbivores involved could not be traced at the time of sampling, indirect citing was done by the use of animal dung, footprints, and animal tracks. Data on herbivore species numbers were tabulated for the study sites. Data concerning the continued presence or absence of a particular plant species in a sampling block over the sampling period as well as the herbivore species visiting a particular sampling block over the sampling period was collected. In this regard, migration patterns of the herbivores were close-monitored within and around the park through surveillance visits from time to time during the entire period of data collection. It was expected that such movements would aid in determining if the ground cover vegetation dynamics experienced within the park were influenced by the herbivores or other factors.

Rangeland conditions

Monitoring of the park rangeland conditions was done on a recurrent basis to detect the change in vegetation attributes such as the proliferation of certain plant species, exposed grounds in areas previously with vegetation (bare ground), habitat degradation following overgrazing, and the forage removal intensity by the mammalian herbivores. Data collection involved the use of close-up photographs taken using a camera (Width 1600 pixels x Height 1200 pixels) both for areas captured and areas not captured by the quadrats. These could show the condition of the study area in terms of the vegetation quality at different times and the mammalian herbivores present during the data collection period.

Data analysis

Ground cover plant species analysis

Both invasive and native ground cover plants were identified to species level with the help of the KWS taxonomist, identification keys [20], and photos or images in web-based plant identification databases [21]. Analysis of vegetation parameters included plant cover, plant species richness; species canopy cover, species frequency, and species composition. Plant cover was measured as a component of plant species, the number of individuals per species, and relative ground cover, determined by use of the Daubenmire cover scale [22] in a range of 1- 6 classes. The scale categorizes plant cover into 6 classes represented as a percentage cover range as follows: class 1 (0-5%), class 2 (5-25%), class 3 (25-50%), class 4 (50-75%), class 5 (75-95%) and class 6 (95-100%). The mid-points were then considered as follows: class 1 (2.5%), class 2 (15.5%), class 3 (37.5%), class 4 (62.5%), class 5 (85.0%) and class 6 (97.5%).
Canopy cover was calculated by multiplying the number of quadrats in which the plant species was observed by the midpoint of the appropriate cover class. Then, the sum of the products for all the cover classes by species was obtained and the total divided by the number of quadrats sampled on the belt-transect to get the average. Percent frequency for each plant species was calculated by dividing the number of occurrences of a plant species by the total number of quadrats sampled along the belt-transect and then multiplying the result by 100. Species composition was based on the canopy cover of the various plant species. It was calculated by dividing the percent canopy cover of each plant species by the total canopy cover of all the plant species sampled [23].
Plant species diversity was determined using Shannon-Wiener’s diversity index (H) described in [24]. Plant species evenness (E) was determined using the H and Hmax, where Hmax is the natural logarithm of the species richness (S) [14]. The E value gives information on how equitably the abundance of individual plant species is distributed among all the plant species in the plant community [11].

Analysis of mammalian herbivores data

Mammalian herbivores were identified to species level with the help of KWS taxonomists within the park, and the data tabulated based on the presence or absence of a particular herbivore species. Diversity measures such as species richness and evenness within each block were calculated. Rank abundance curves were constructed to determine the proportion of the most abundant mammalian herbivore species using package Biodiversity R [25] and implemented in R [26].

3. Results

Plant species composition and distribution

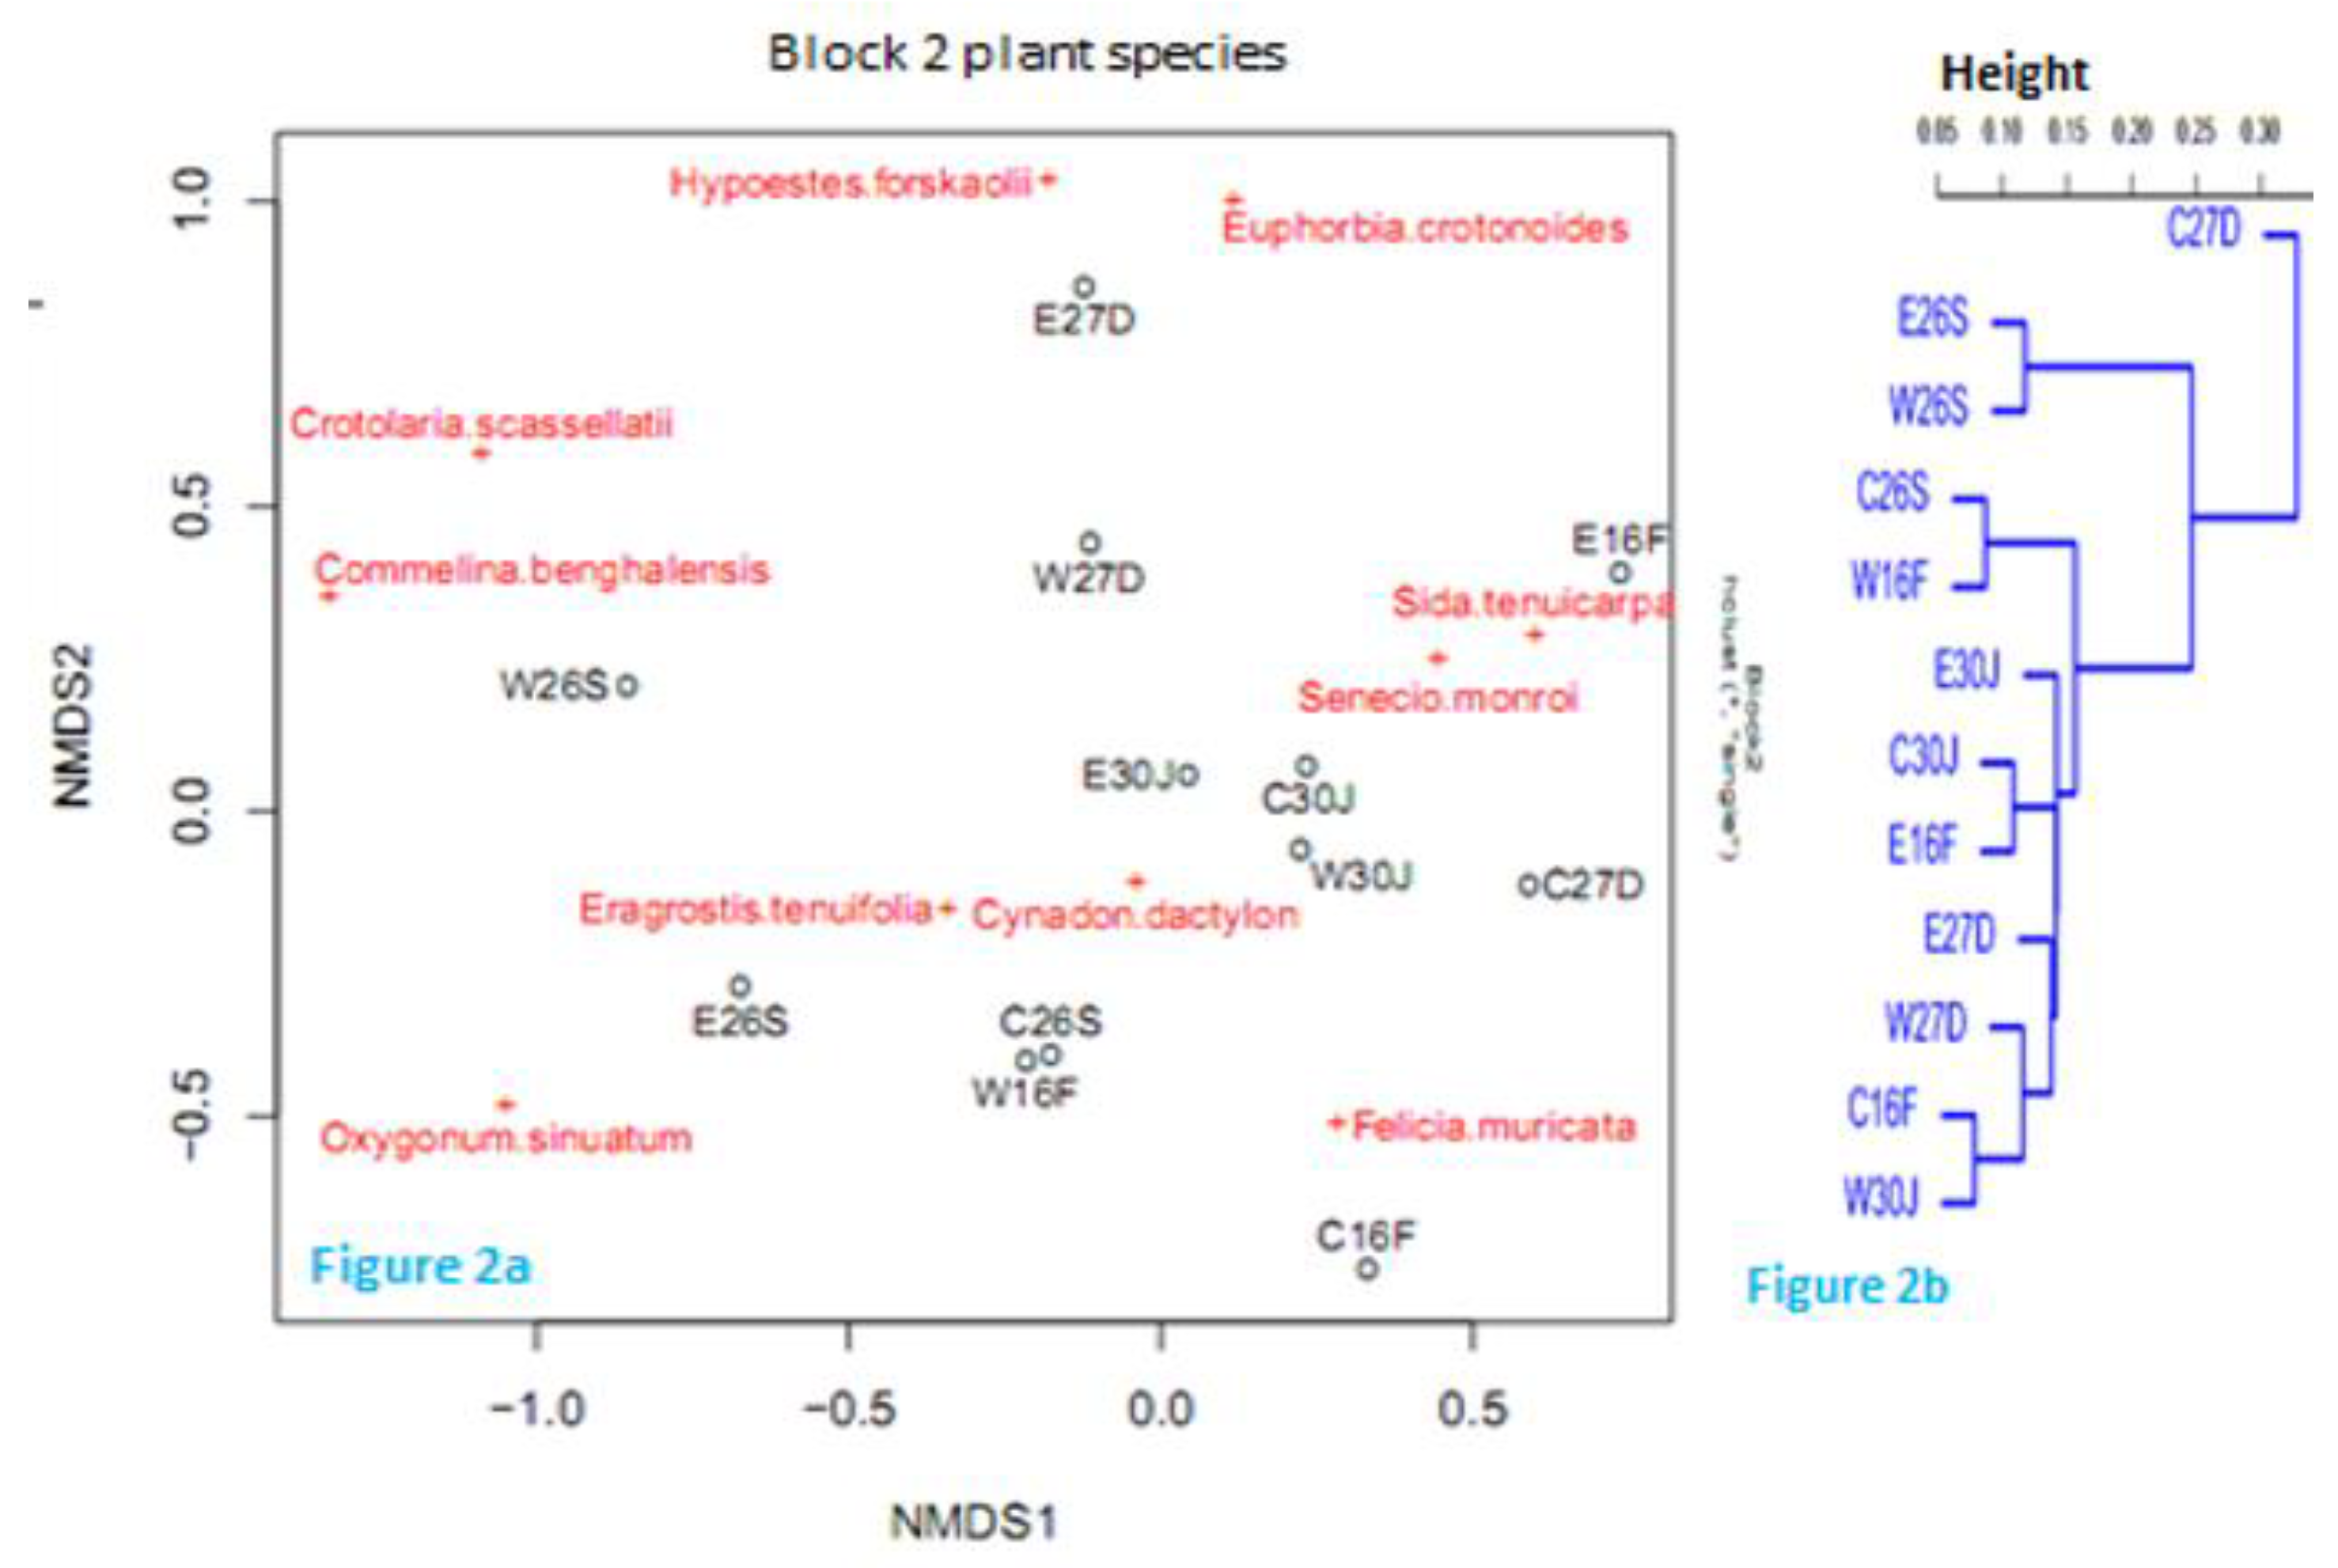
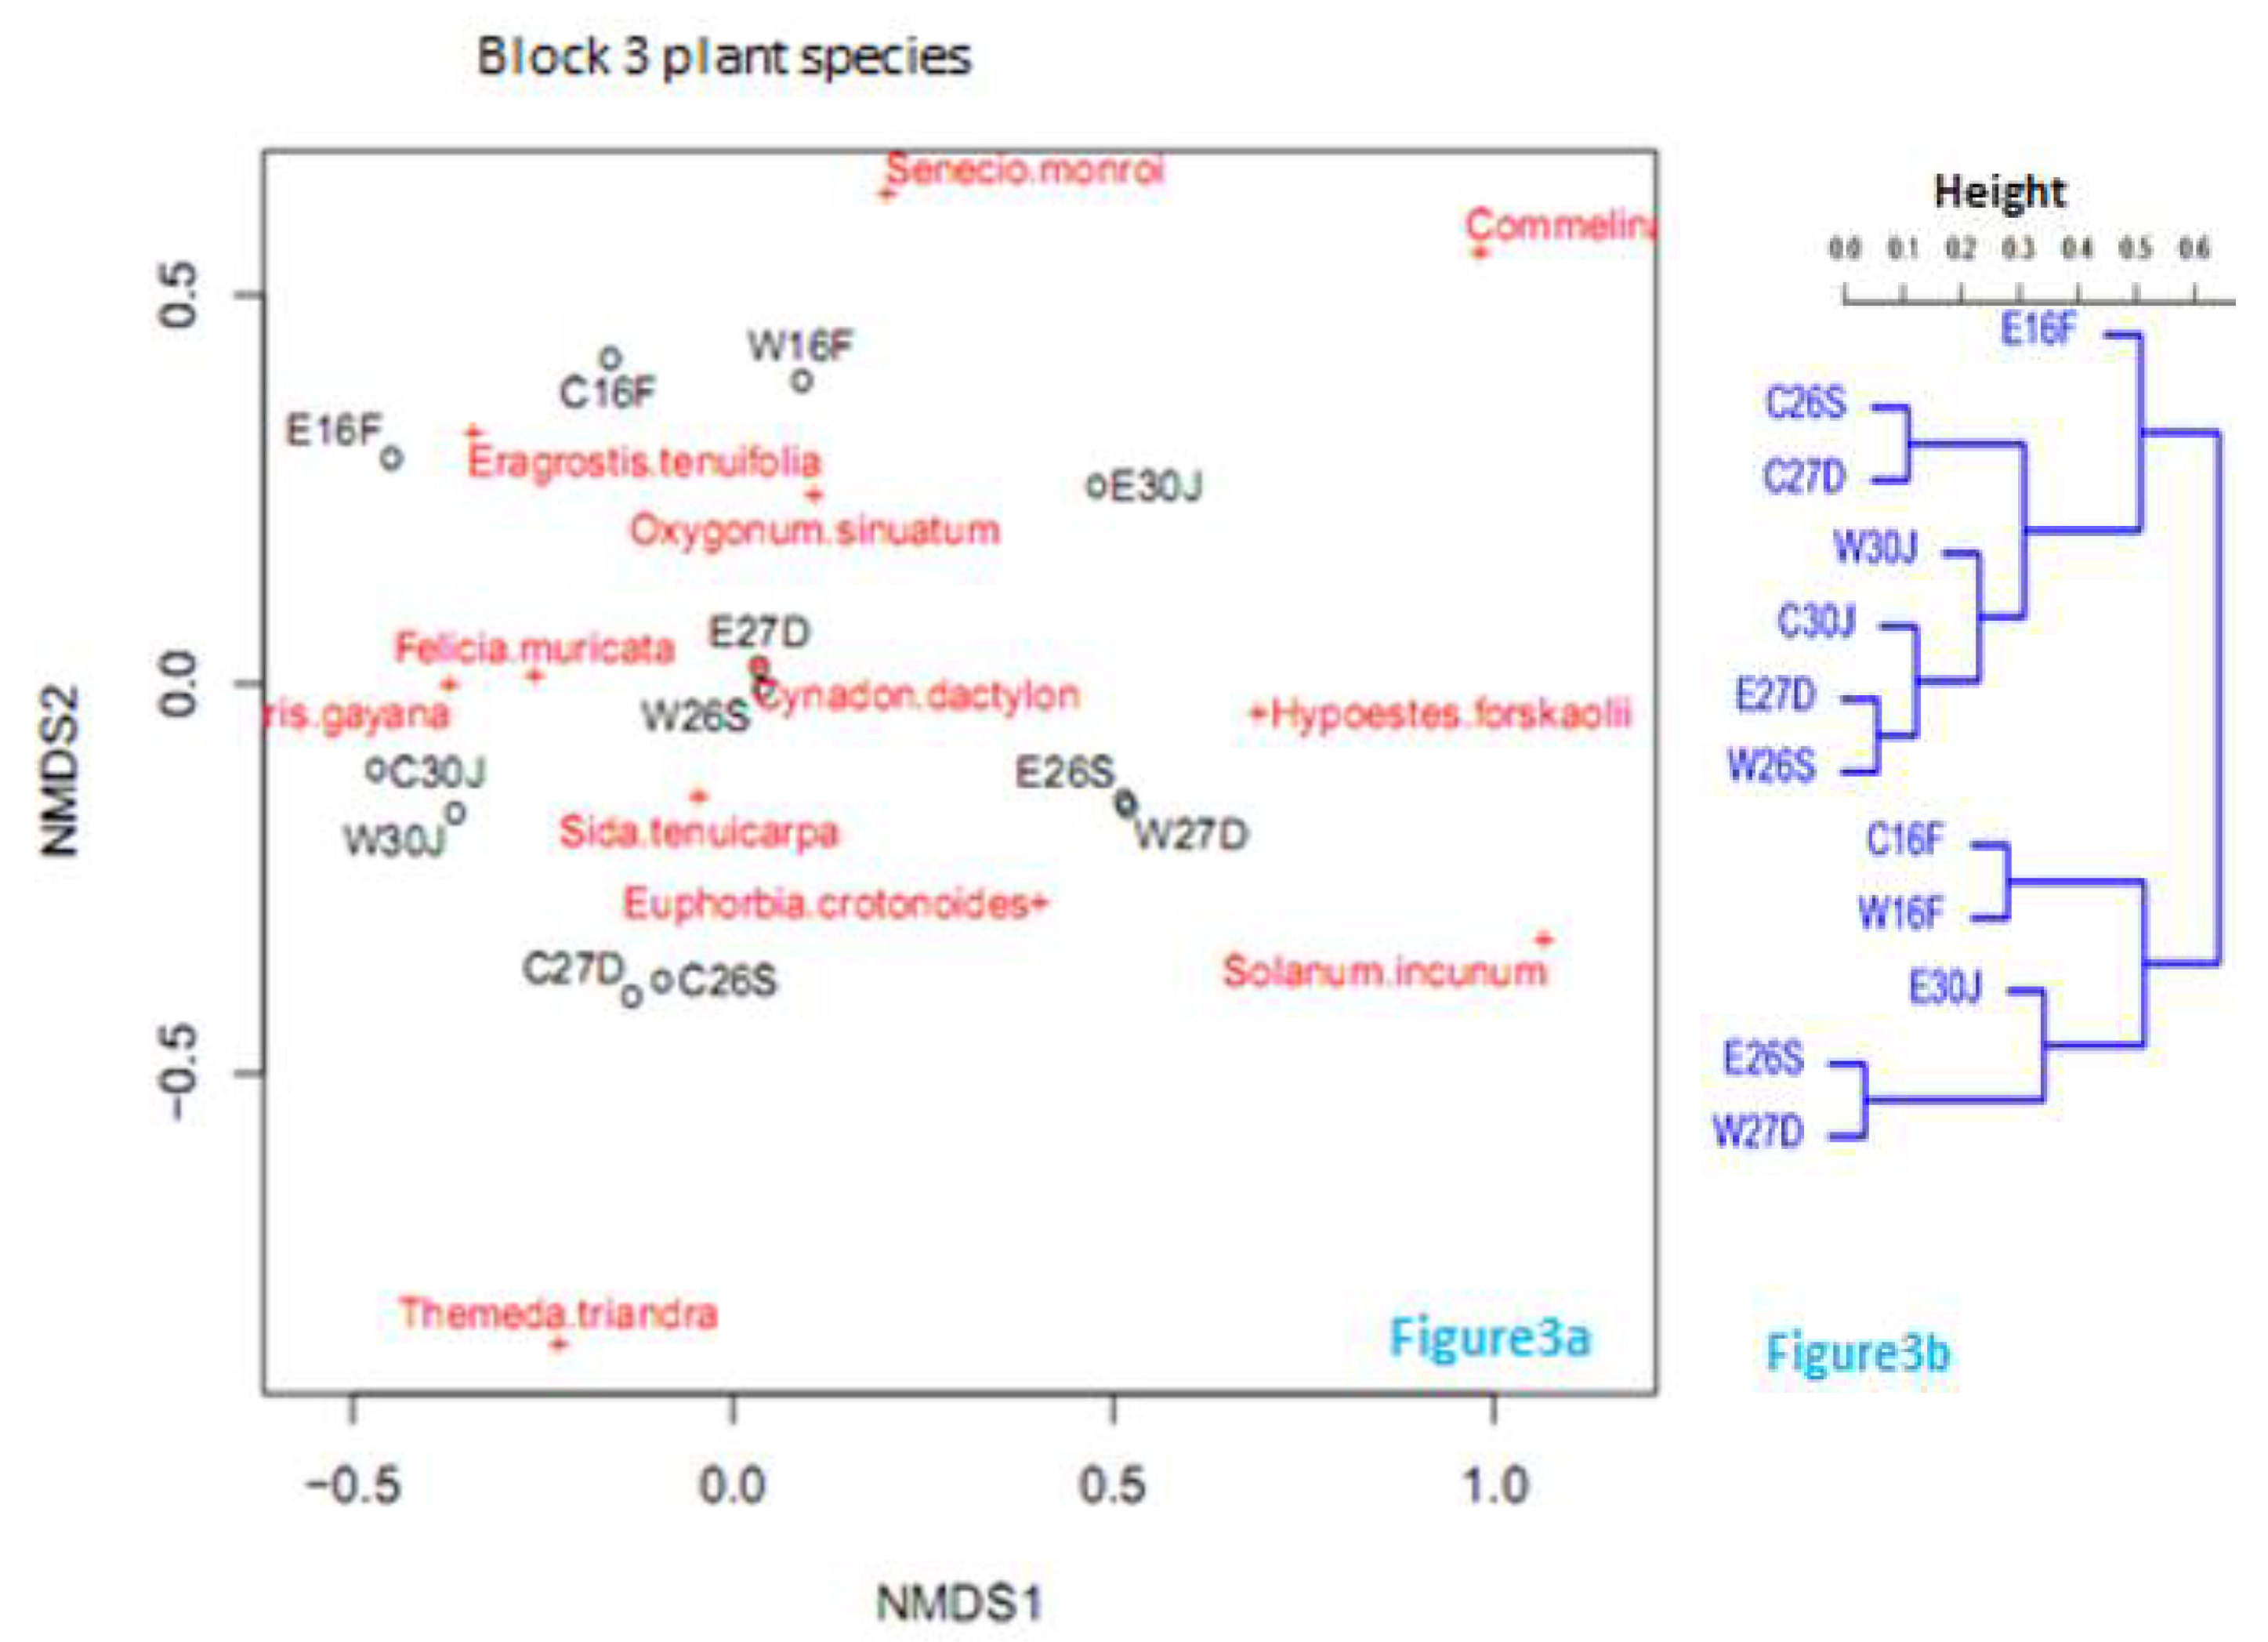
A total of 16 plant species were sampled in Hell’s Gate National Park, out of which nine (9) were native while seven (7) were invasive plant species. Cynodon dactylon, Felicia muricata, and Eragrostis tenuifolia were among the most abundant plant species while Themeda triandra and Solanum incunum were encountered once in the blocks they occurred (Table 1). Certain plant species were constantly encountered within the sampled blocks during the entire sampling period (e.g., Cynodon dactylon, Felicia muricata, and Eragrostis tenuifolia). Other plant species were moderately frequent (e.g., Hypoestes forskaolii, Crotolaria scassellatii, and Commelina benghalensis) while other plant species were only encountered once (Chloris gayana, Sida spp, and Eragrostis spp.). Cluster dendrograms linking sampling points through single linkage criteria in Blocks 1, 2, and 3 revealed that the closeness of certain sampling points was an indication of the similarity in the plant species they contained. There was a strong cophenetic correlation between Bray-Curtis dissimilarities (plant species + sampling points) and the dendrogram distances (r= 0.8385, r= 0.8425 & r= 0.8324) for the sampling Blocks 1, 2, and 3 respectively (Figure 1, Figure 2 and Figure 3).
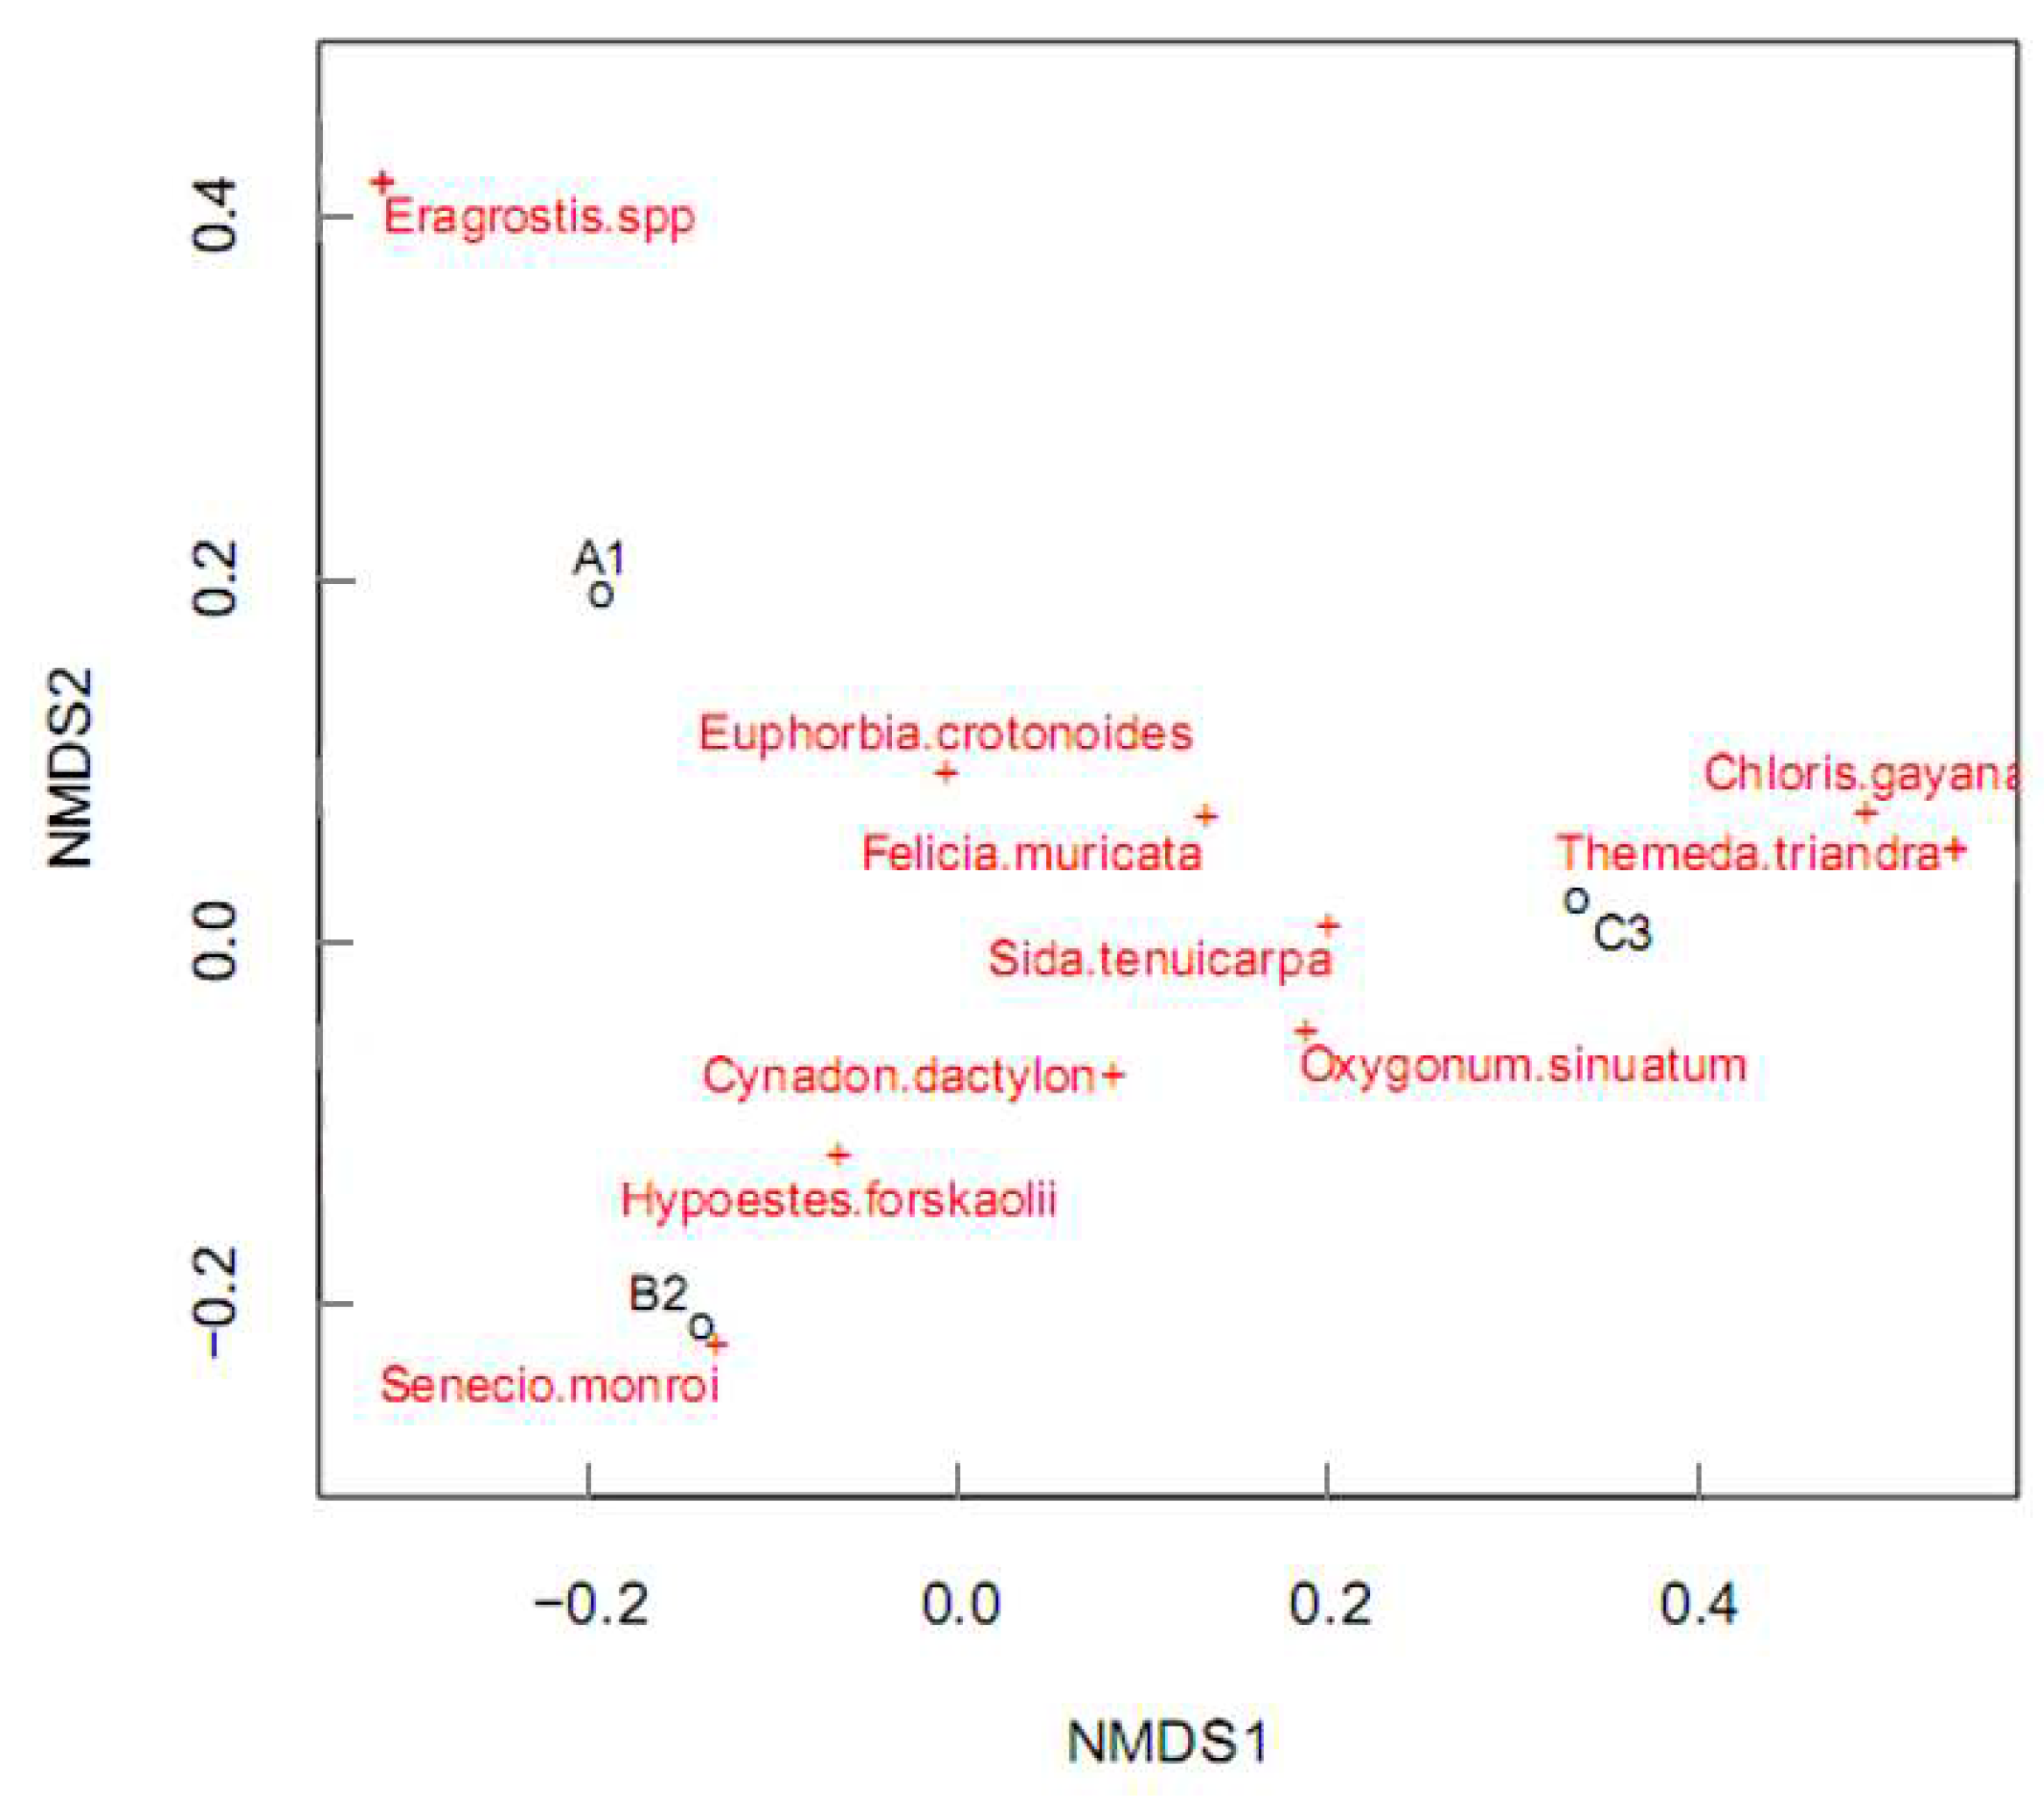
Whereas most plant species co-occurred in the three sampled blocks, Themeda triandra, and Solanum incunum occurred only in Block 3 while Eragrostis spp, Sida spp, and Ocimum gratissimum were found only in Block 1. Crotolaria scassellatii was absent in Block 3 while Chloris gayana was missing in Block 2. All the plant species in Block 2 also occurred in Block 1, though in differing proportions. Also noted with the distribution of the plant species was the fact that some plant species were more abundant in a given sampling block relative to the others. For instance, Chloris gayana was more abundant in Block 3 in comparison to Block 1 (Figure 4).

Co-occurrence of mammalian herbivores with the plant species

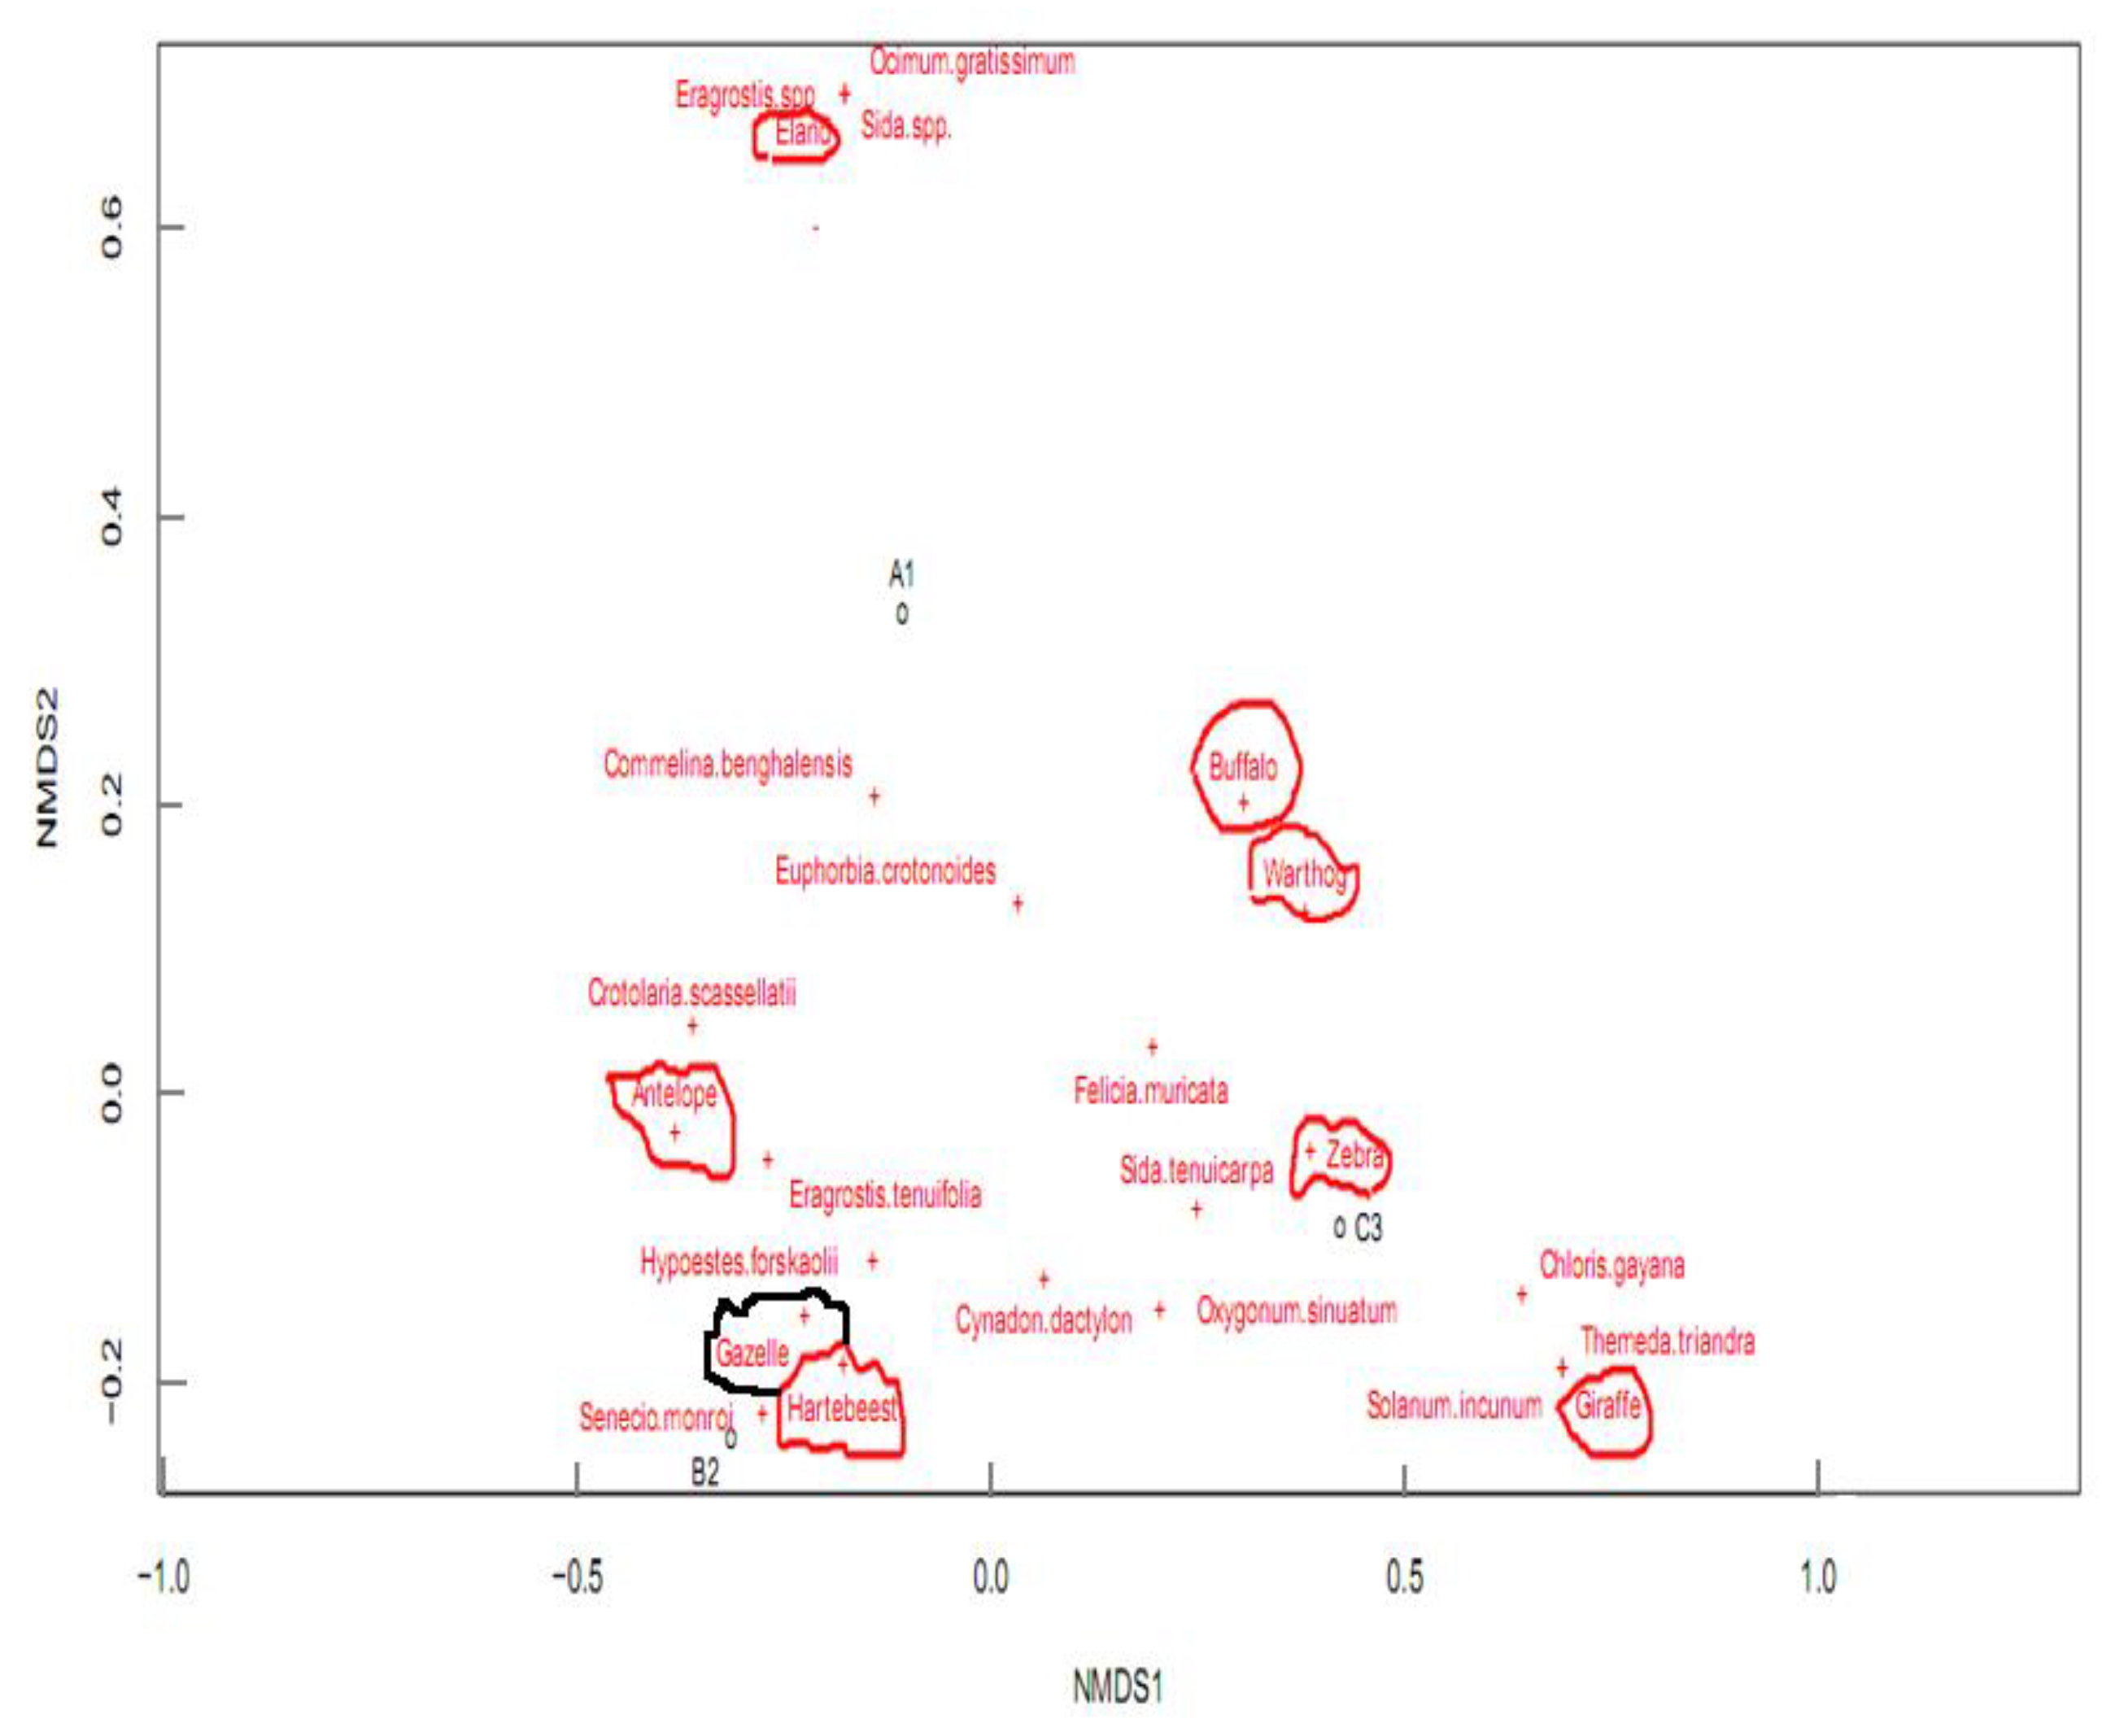
Results on mammalian herbivores within the three blocks revealed that eight different species frequented the sampled area; with Block 3 registering the highest number and Block 2 registering the lowest number of herbivores in total. In terms of abundances, zebras (Equus quagga) were well represented, followed by gazelles (Eudorcas thomsonii) while giraffes (Giraffa camelopardalis) were the least. Further, the results showed that while some herbivores frequented all the sampled blocks, some were only restricted to particular blocks. For instance, gazelles (Eudorcas thomsonii) and elands (Taurotragus oryx) in Blocks 2 and 1 respectively while zebras (Equus quagga) and warthogs (Phacochoerus africanus) were more inclined to Block 3 (Table 2). A closer look at the relationship between mammalian herbivores and the distribution of plant species revealed that most herbivores occurrences were influenced by the presence of particular plant species (Figure 5).

Vegetation attributes dynamics over time

Sampling Blocks recorded a significant difference in the overall percentage of plant cover (P < 0.001). The percent plant cover for Sampling Blocks 1 and 3 was not statistically different, but that of Block 2 was different from Block 1 and Block 3. Plant cover decreased significantly over time (P < 0.001) from 83.6% in September 2018 to approximately 71.05% in February 2019. A significant difference in the Shannon Weiner species diversity index was observed among the Sampling Blocks (P < 0.001). Block 3 had the highest index, followed by Block 1, and the least index observed in Block 2 (Figures S2, S3 and S4)

4. Discussion

This study sought to establish the effects of herbivory on vegetation at Hell’s Gate National Park. Results indicated that: (i) Different species richness and population abundances for both plants and mammalian herbivores exist in different sections of the park, (ii) A total of 16 plant species; nine native and seven invasive plant species occurred in the park grasslands, (iii) There is the co-occurrence of plant species and mammalian herbivore species, (iv) There is a correlation between herbivory and encroachment by invasive plant species, and (v) There was seasonal variation in plant species composition and abundance. These results are discussed based on rangeland management and conservation perspectives.
The study established that within the study area, Felicia muricata, Sida tenuicarpa, Senecio monroi, Hypoestes forskaolii, Solunum incunum, and Ocimum gratissimum are the main invasive plants' species in Hell’s Gate National Park, and these are possibly attributable to intense herbivory. F. muricata and S. tenuicarpa being the most aggressive alien plant species in Hell’s Gate National Park are likely to cause adverse ecological implications in the future. F. muricata is a drought-resistant perennial herb that normally grows up to 20 cm in height. It is an indicator of degradation and desertification and is largely invasive in the grasslands [27]. [1] and [28] also noted that the presence of invasive plant species within the rangelands is an indication of degradation due to intensive herbivory. Other studies have also shown that degraded rangelands as a result of overgrazing are characterized by little vegetation cover and encroachment by unpalatable alien plant species as well as a shift in plant species composition [29,7].
Results in this study further conquer with findings by [30] who noted that herbivory by the wild ungulates is a major driver of vegetation changes in the protected rangelands. The results reveal that mammalian herbivory has led to the encroachment of the park by aggressive, unpalatable alien plant species like F. muricata, S. monroi, and S. tenuicarpa. In severe cases, the invasive plant species could outcompete the native palatable plant species like Eragrostis tenuifolia, Cynodon dactylon, and Chloris gayana, and endanger their future existence in the park rangelands, and potentially lead to their local extinction [17]. Additional consequences would be the migration of the mammalian herbivores or even their death due to lack of forage [28]. Invasive species can, however, play an important role by checking the rate of soil erosion, increasing species richness, acting as important habitats for animals as well as a source of food to some herbivores during times of drought [31].
Plant species occurring in Hell’s Gate National Park varied in their degree of richness. Such species richness variance among the sampling blocks could be due to diverse habitats and varying levels of herbivory [6]. For instance, Block 1 was located near the park entrance and experienced relatively lower grazing intensity in comparison to the other sampling blocks. This could be due to herbivores migrating to other areas to avoid disturbances by visiting persons [32]. Also, Block 1 was on a lower ground which suggests that it retained some of the runoff rainwater that supported the growth and regeneration of the vegetation, and hence a higher plant species richness [33].
On the other hand, sampling Block 2 was in open grassland that was preferred by the small herbivore species for its short grasses and herbs thus lowering its plant species richness [9]. Other studies suggest that the importance of the small mammalian herbivores as vegetation dynamics drivers depend on their numerical abundance [11]. These findings imply that Block 2 had its plant cover composed of palatable plant species like E. tenuifolia and C. dactylon that were intensively fed on by the herbivore grazers [8,2]. The results also suggest that Block 2 had less abundant unpalatable plant species like S. monroi and H. forskaolii that would have otherwise increased its plant cover [31]. Physical factors such as the nature of the moisture content of the soil and temperatures may have also resulted in the lower plant cover for the sampling Block 2 [34].
Sampling Block 3 was situated near artificial watering points within the park, and hence both large and small herbivores occasionally aggregated there to drink water thus feeding and trampling on the vegetation, and this could explain its lower plant species richness and abundance in comparison to Block 1 (see also [14]). Studies by [30] and [35] confirm that ungulates decrease plant species richness by grazing on them.
Plant species abundance between the sampling blocks may have differed because of spatial variations in herbivory intensity and forage preference. [11] pointed out that herbivores preferentially feed on the dominant plant species lowering their competitive advantage. Furthermore, the effects of the grazing herbivores normally intensify as the grazing pressure increases. [7] suggested that the impact of small herbivores on plant species abundance is directly correlated with their numerical abundance. Therefore, the grazing intensity work to shape the plant community composition and species richness. Other studies reported that the local moisture content of the soil, air temperature, and the changes in rainfall patterns are also important productivity gradients that work to drive the plant species abundance [34].
Naturally, the occurrence of food resources is a major driver to the occurrence of certain animals in a particular locality [36,32]. In the case of Hell’s Gate Park, the occurrence of certain herbivores on particular sampling blocks was greatly influenced by the plant species they contained. For instance, the presence of E. tenuifolia, C. dactylon, and C. gayana influenced the occurrence of grazers like zebras, antelopes, hartebeests as well as generalists like the elands. Other studies have reported that plant species drive the occurrence of the mammalian herbivores in a particular locality by providing the much-needed food to the animals [37,15]. In most cases, the mammalian herbivore grazers and browsers were seen foraging together among the park’s grasses and herbs. These could have been responsible for the plant species dynamics observed in the park rangelands due to foraging and trampling on the vegetation. [38] noted that the state of the rangelands is a function of the interaction between the wild ungulates and vegetation, which also depends on the climatic conditions and seasons.
The relationship between herbivory and vegetation is complex [9, 10]. [10] observed that within protected rangelands, vegetation utilization levels, and rainfall amounts work together to determine the plant cover and the plant species composition. Other factors that may determine plant characteristics include spatial heterogeneity as observed in the different sampling blocks in this study, as well as the characteristics of seed dispersion [39]. It is highly probable that the changes in species composition for the three dominant plant species in Hell’s Gate Park namely: C. dactylon, F. muricata, and E. tenuifolia may be attributable to the level of palatability of the plant species to the dependent herbivores, tolerance of the particular plant species to the disturbance forces such as mammalian herbivory and erratic weather conditions within the area. It could also be attributed to the competitive ability of particular plant species in terms of nutrient acquisition and water uptake as observed in the C. dactylon plant cover trend over time [40].
Mammalian herbivores are very vital seed dispersers. As they graze around, they carry the plants’ seeds in their gut, and later defecate releasing them elsewhere [41]. Seeds with sticky or hooked structures are often transported by the grazing animals when they stick to the animals’ coats. In some cases, the animals may cause long-distance seed dispersal. Areas, where the seeds are deposited, become more fertile due to the seeds’ decomposition. Besides, they have relatively higher plant species richness due to seed germination [42].

5. Conclusions

Based on the findings discussed above, it is concluded that herbivory is an important driver of vegetation dynamics in Hell’s Gate National Park. Both small and large mammal herbivores, contribute to the changes in plants’ attributes such as dynamics in plant species richness, abundance, distribution, canopy cover, and species composition. The situation is worse during the dry season when the rate of the regeneration of the consumed vegetation is very low and some of the vegetation dries off. Uncontrolled herbivory in the park grasslands has resulted in a shift in species composition and encroachment of aggressive unpalatable invasive plant species especially F. muricata and S. tenuicarpa. This has threatened the future of the park grasslands since the disappearance of native plant species is likely to occur resulting in adverse ecological implications. Starvation of the mammalian herbivores is also inevitable in the future unless the alien herbaceous plant species are controlled. Problems associated with the plant species and mammalian herbivory dynamics in the park could be managed using approaches like reseeding of the park’s degraded rangelands with native herbaceous plants, frequent determination of the carrying capacity of the park, and controlling the encroachment of the invasive plant species by physical removal.

Supplementary Materials

The following supporting information can be downloaded at the website of this paper posted on Preprints.org, Figure S1; Figure S2; Figure S3 and Figure S4.

Author Contributions

Conceptualization, MKG and JMN.; methodology, MKG., JMN, RNN and FNN.; formal analysis, MKG, JMN, RNN and FNN.; resources, MKG; writing—original draft preparation, MKG and JMN.; writing—review and editing, MKG., JMN, RNN and FNN.; visualization, MKG, JMN and RNN.; supervision, JMN, RNN, FNN; project administration, MKG., JMN, RNN and FNN. All authors have read and agreed to the published version of the manuscript.

Funding

This research received no external funding.

Acknowledgments

The research work was supported by the University of Embu through a MSc. Scholarship to Mr. Moses K. Gichure. We acknowledge the support by the Kenya Wildlife Service and the Staff at Hell’s Gate National Park.

Conflicts of Interest

The authors declare no conflict of interest.

References

  1. Alemu, M.M.; Bhattacharyya, S.; Reeves, A.; Lemon, M. Grass Species Diversity and Ground Cover of Herbs in the Grassland Plains of Nech Sar National Park, Ethiopia. J. Environ. Prot. 2017, 250–257. [Google Scholar] [CrossRef]
  2. Holdo, R.M.; Holt, R. D.; Fryxell, J.M. Grazers, browsers, and fire influence the extent andspatial pattern of tree cover in the Serengeti. Ecol. App. 2009, 19(1), 95–109. [Google Scholar] [CrossRef] [PubMed]
  3. Al-Rowaily, S.L.; El-Bana, M.I.; Al-Dujain, F.A.R. Changes in vegetation composition and diversity in relation to morphometry, soil, and grazing on a hyper-arid watershed in central Saudi Arabia. Catena 2012, 97, 41–49. [Google Scholar] [CrossRef]
  4. Neilly, H.; Vanderwal, J.; Schwarzkopf, L. Balancing Biodiversity and Food Production: A Better Understanding of Wildlife Response to Grazing Will Inform Off-Reserve Conservation on Rangelands. Rangel. Ecol. Manag. 2016, 69(6), 430–436. [Google Scholar] [CrossRef]
  5. Verdoodt, A.; Mureithi, S.M.; Van Ranst, E. Impacts of management and enclosure age on the recovery of the herbaceous rangeland vegetation in semi-arid Kenya. J. Arid Environ. 2010, 74(9), 1066–1073. [Google Scholar] [CrossRef]
  6. Venter, Z.S.; Hawkins, H. J.; Cramer, M.D. Implications of historical interactions between herbivory and fire for rangeland management in African savannas. Ecosphere 2017, 8. [Google Scholar] [CrossRef]
  7. Vandandorj, S.; Eldridge, D.J.; Travers, S.K.; Val, J.; Oliver, I. Microsite and grazing intensity drive infiltration in a semiarid woodland. Ecohydrology 2017, 10(4), 1–10. [Google Scholar] [CrossRef]
  8. Tanentzap, A. J.; Coomes, D.A. Carbon storage in terrestrial ecosystems: Do browsing and grazing herbivores matter? Biol. Rev. 2012, 87(1), 72–94. [CrossRef]
  9. Al-Rowaily, S.L.; El-bana, M.I.; Al-bakre, D.A.; Assaeed, A.M.; Hegazy, A.K.; Ali, M.B. Effects of open grazing and livestock exclusion on floristic composition and diversity in the natural ecosystem of Western Saudi Arabia. Saudi J. Biol. Sci. 2015, 22(4), 430–437. [Google Scholar] [CrossRef]
  10. Staver, A.C.; Bond, W.J. Is there a “browse trap”? Dynamics of herbivore impacts on trees and grasses in an African savanna. J. Ecol. 2014, 102, 595–602. [Google Scholar]
  11. Burkepile, D.E.; Fynn, R.W.S.; Thompson, D.I.; Lemoine, N.P.; Koerner, S.E.; Eby, S.; Smith, M. D. Herbivore size matters for productivity–richness relationships in African savannas. J. Ecol. 2017, 105(3), 674–686. [Google Scholar] [CrossRef]
  12. Giljohann, K.M.; Mccarthy, M.A.; Tozer, M.G.; Regan, T.J.; Keith, D.A.; Kelly, L.T. Interactions between rainfall, fire, and herbivory drive resprouter vital rates in a semi-arid ecosystem. J. Ecol. 2017, 105, 1562–1570. [Google Scholar] [CrossRef]
  13. Qasim, S.; Gul, S.; Shah, M.H.; Hussain, F.; Ahmad, S.; Islam, M.; Yaqoob, M. Influence of grazing exclosure on vegetation biomass and soil quality. ISWCR. 2017, 5(2), 62–68. [Google Scholar] [CrossRef]
  14. Jawuoro, S.O.; Koech, O.K.; Karuku, G.N.; Mbau, J.S. Plant species composition and diversity depending on piospheres and seasonality in the southern rangelands of Kenya. Ecol. Process. 2017, 6(1). [Google Scholar] [CrossRef]
  15. Foster, C.N.; Barton, PS.; Sato, C.F.; Wood, J.T.; Macgregor, C.I.; Lindenmayer, DB. Herbivory and fire interact to affect forest understory habitat, but not its use by small vertebrates. Anim. Conserv. 2016, 19(1), 15–25. [Google Scholar] [CrossRef]
  16. Kiringe, J.W. A Vegetation and Large herbivore survey in Hell’s Gate National Park, Naivasha, Kenya. 1990.
  17. Mutia, T. M. Short Course IV on Exploration for Geothermal Resources. 2009.(11), 1–9.
  18. Muthoni, F.K.; Groen, T.A.; Skidmore, A.K.; Oel, P. Van. Ungulate herbivory overrides rainfall impacts on herbaceous regrowth and residual biomass in a key resource area. J. Arid Environ. 2014, 101, 9–17. [Google Scholar]
  19. Hodd, M. East Africa handbook: the travel guide. Footprint Travel Guides, 2002,152.
  20. Spichiger, R.E.; Savolainen, V.; Figeat, M.; Jeanmonod, D. Systematic Botany of Flowering Plants. In CRC Press. 2019. [Google Scholar] [CrossRef]
  21. Muyekho, F.N.; Barrion, A.T.; Khan, Z.R. A Primer on grass identification and their uses in Kenya. 2004. 1–86.
  22. Bonham, C.D.; Mergen, D.E.; Montoya, S. Plant Cover Estimation: A Contiguous Daubenmire Frame. Rangel. Ecol. Manag 2018, 26(1), 17–22. [Google Scholar]
  23. National Oceanic and Atmospheric Administration. Daubenmire Method. Daubenmire Method 2003, 6(1), 1–3.
  24. Spellerberg, I.A.N.F.; Fedor, P.J. A tribute to Claude Shannon (1916 – 2001) and a plea for more rigorous use of species richness, species diversity and the “ Shannon – Wiener ” Index. Glob. Ecol. Biogeogr. 2003, (12), 177–179. [Google Scholar] [CrossRef]
  25. Kindt, R. Package “ BiodiversityR.”2016. 3(12).
  26. Team, R. C. R: A language and environment for statistical computing, version 3.3. 1. Vienna, Austria: R Foundation for Statistical Computing; 2016.
  27. Ashafa, A.O.T.; Grierson, D.S.; Afolayan, A.J. Foliar Micromorphology of Felicia muricata Thunb., A South African Medicinal Plant. PJBS. 2008, 13(11), 1713–1717. [Google Scholar] [CrossRef] [PubMed]
  28. Masters, R.A.; Sheley, R.L. Synthesis Paper : Principles and practices for managing rangeland invasive plants. J. Range Manag 2001, 54(5). [Google Scholar] [CrossRef]
  29. Kimiti, D.W.; Riginos, C.; Belnap, J. Low-cost grass restoration using erosion barriers in degraded African rangeland. Restor. Ecol. 2017, 25(3), 376–384. [Google Scholar] [CrossRef]
  30. Boulanger, V.; Baltzinger, C.; Chevalier, R.; Corcket, E.; Dumas, Y.; Sonia, P.; Ulrich, E. Ungulates increase forest plant species richness to the benefit of non-forest specialists. Glob. Change Biol. 2018, (3), 485–495. [Google Scholar] [CrossRef] [PubMed]
  31. Shackleton, S.E.; Shackleton, R.T. Local knowledge regarding ecosystem services and disservices from invasive alien plants in the arid Kalahari, South Africa. J. Arid Environ. 2017, 1–12. [Google Scholar] [CrossRef]
  32. M’soka, J. Creel, S.; Becker, M. S.; Murdoch, J. D. Ecological and anthropogenic effects on the density of migratory and resident ungulates in a human-inhabited protected area. Afr. J. Ecol. 2017, 55(4), 618–631. [Google Scholar] [CrossRef]
  33. Weber, K.T.; Horst, S. Desertification and livestock grazing: The roles of sedentarization, mobility, and rest. Pastoralism. 2011, 1(1), 1–11. [Google Scholar] [CrossRef]
  34. Moutllot, F.; Rambal, S.; Joffre, R. Simulating climate change impacts on fire frequency and vegetation dynamics in a Mediterranean-type ecosystem. 2002, 423–437. [Google Scholar]
  35. Angassa, A. Effects of grazing intensity and bush encroachment on herbaceous species and rangeland conditions in southern Ethiopia. Land Degrad Dev. 2014, 451(5), 438–451. [Google Scholar] [CrossRef]
  36. Schuldt, A.; Ebeling, A.; Kunz, M.; Staab, M.; Guimarães-steinicke, C.; Bachmann, D.; Eisenhauer, N. Consumer communities across ecosystems. Nat. Commun. 2019. [Google Scholar] [CrossRef]
  37. Mramba, R.P.; Andreassen, H.P.; Skarpe, C. Browsing and plant traits in nutrient-rich and nutrient-poor savannas in Tanzania. J. Trop. Ecol. 2017, 33(5), 327–336. [Google Scholar] [CrossRef]
  38. Kiage, L.M. Perspectives on the assumed causes of land degradation in the rangelands of Sub-Saharan Africa. Prog Phys Geogr 2013, 37(5), 664–684. [Google Scholar] [CrossRef]
  39. Gaiballa, A.K.; Elhaj, G.O. Relationship between grazing intensity and distance from water points. Sudan University of Science and Technology. 2006, 7(1), 1–11. [Google Scholar]
  40. Kaplan, S. Natural Desert and Human Controlled Landscapes: Remote Sensing of LULC Response to Drought. 2014.
  41. Shiponeni, N.N.; Milton, S.J. Seed dispersal in the dung of large herbivores: implications for restoration of Renosterveld shrubland old fields. 2006. 3161–3175. [CrossRef]
  42. Davies, K.W.; Sheley, R.L. A Conceptual Framework for Preventing the Spatial Dispersal of Invasive Plants. 2007, (4), 178–184. [Google Scholar] [CrossRef]
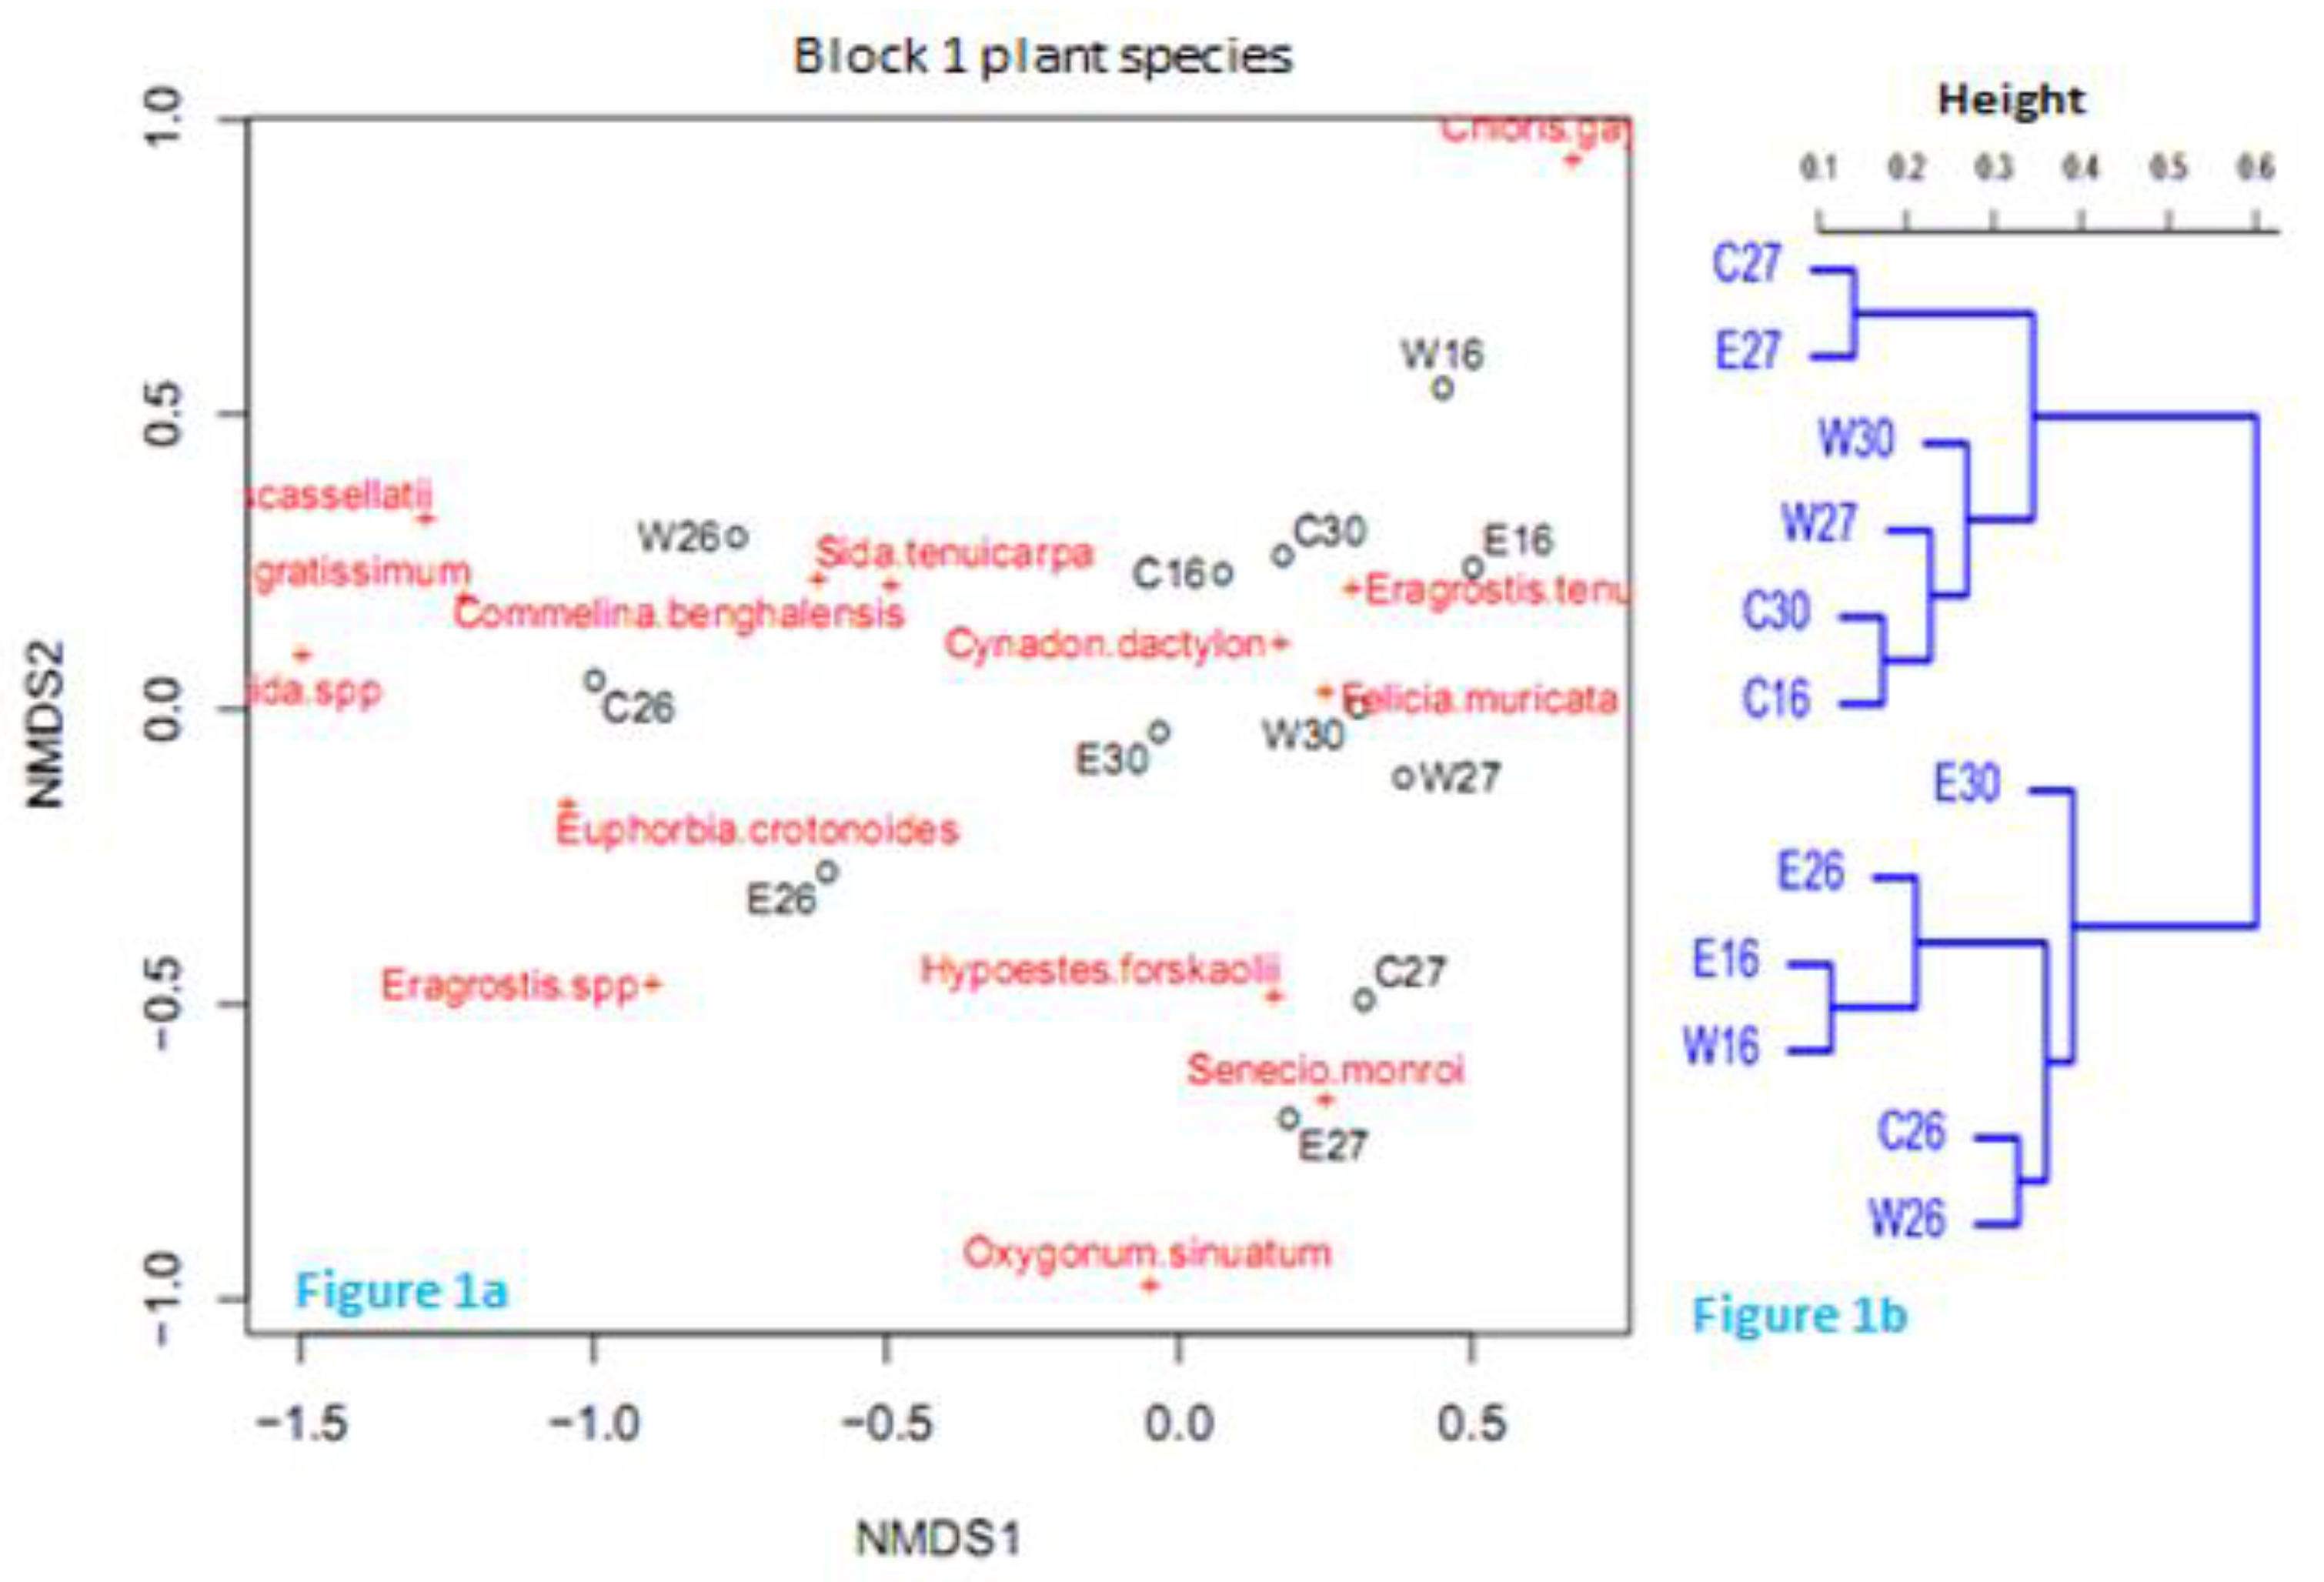
Figure 1. Non-metric multidimensional scaling (NMDS) and cluster dendrogram linking sampling points through single linkage criteria within Block 1. A letter followed by a number e.g., C27 and E27 represents a belt transect and date respectively (sampling point). Closer sampling points (in Black) tend to have some similar species (1a). The horizontal axis of the dendrogram represents the distance or dissimilarity between clusters. R =0.8385 representing the cophenetic correlation between the Bray-Curtis dissimilarities and the dendrogram distances (1b).
Preprints 80501 g001
Figure 2. Non-metric multidimensional scaling (NMDS) and cluster dendrogram linking sampling points through single linkage criteria within Block 2. A letter followed by a number e.g., C16F and W16F represents a belt transect and date respectively (sampling point). Closer sampling points (in Black) tend to have some similar species (2a). The horizontal axis of the dendrogram represents the distance or dissimilarity between clusters. R = 0.8425 representing the cophenetic correlation between the Bray-Curtis dissimilarities and the dendrogram distances (2b).
Preprints 80501 g002
Figure 3. Non-metric multidimensional scaling (NMDS) and cluster dendrogram linking sampling points through average linkage criteria within Block 3. A letter followed by a number e.g., C27D and C26S represents a belt transect and date respectively (sampling point). Closer sampling points (in Black) tend to have some similar species (3a). The horizontal axis of the dendrogram represents the distance or dissimilarity between clusters. R = 0.8324 representing the cophenetic correlation between the Bray-Curtis dissimilarities and the dendrogram distances (3b).
Preprints 80501 g003
Figure 4. Non-metric multidimensional scaling of sampling points and plant species in the 3 sampled blocks within Hells Gate National Park. A1, B2, and C3 represent Blocks 1, 2, and 3 respectively. + represents the plant species inclination to a given site or sites. Most plant species co-occurred in the three sampled blocks. However, some plant species were in occurrence in some blocks and not in others.
Preprints 80501 g004
Figure 5. Distribution of mammalian herbivores in the three sampling blocks in reference to plant species. A1, B2, and C3 represent Blocks 1, 2, and 3 respectively. The circled text points represent herbivores while free text with crosses represents the plant species. The occurrence of certain herbivores on certain sampling blocks was related to the plant species they contained.
Preprints 80501 g005
Table 1. Plant species abundances of 16 plant species in the sampled blocks within Hell’s Gate National Park. Blocks 1, 2, and 3 recorded 14, 10, and 12 different plant species respectively. (N) represent a native plant species while (INV) invasive plant species. Cynodon dactylon, Felicia muricata, and Eragrostis tenuifolia were the most abundant plant species.
Plant Species Sampling Block 9/26/2018 12/27/2018 1/30/2019 2/16/2019 Total counts
Cynodon dactylon (N) Block 1 2832 1354 1634 2560 8380
Block 2 3050 1292 1838 1462 7642
Block 3 973 966 701 687 3327
Felicia muricata (INV) Block 1 129 411 491 265 1296
Block 2 20 22 32 36 110
Block 3 675 673 756 729 2833
Eragrostis tenuifolia (N) Block 1 93 99 460 420 1072
Block 2 339 49 105 150 643
Block 3 5 5 33 41 84
Sida tenuicarpa (INV) Block 1 78 0 6 2 86
Block 2 2 0 5 19 26
Block 3 186 176 219 32 613
Chloris gayana (N) Block 1 0 0 0 3 3
Block 2 0 0 0 0 0
Block 3 134 182 141 244 701
Euphorbia crotonoides (N) Block 1 421 0 7 0 428
Block 2 0 28 0 0 28
Block 3 70 94 44 0 208
Senecio monroi (INV) Block 1 0 67 35 0 102
Block 2 0 111 164 30 305
Block 3 0 0 31 19 50
Hypoestes forskaolii (INV) Block 1 10 230 6 0 246
Block 2 0 64 0 0 64
Block 3 17 20 12 0 49
Oxygonum sinuatum (N) Block 1 1 4 0 0 5
Block 2 5 0 0 0 5
Block 3 13 20 6 21 60
Crotolaria scassellatii (N) Block 1 47 0 0 0 47
Block 2 16 1 0 0 17
Block 3 0 0 0 0 0
Commelina benghalensis (N) Block 1 32 0 8 2 42
Block 2 3 0 0 0 3
Block 3 0 0 3 0 3
Ocimum gratissimum (INV) Block 1 32 0 8 2 42
Block 2 3 0 0 0 3
Block 3 0 0 3 0 3
Eragrostis spp. (N) Block 1 2 0 0 0 2
Block 2 0 0 0 0 0
Block 3 0 0 0 0 0
Themeda triandra (N) Block 1 0 0 0 0 0
Block 2 0 0 0 0 0
Block 3 1 1 0 0 2
Solanum incunum (INV) Block 1 0 0 0 0 0
Block 2 0 0 0 0 0
Block 3 1 1 0 0 2
Sida spp. (INV) Block 1 1 0 0 0 1
Block 2 0 0 0 0 0
Block 3 0 0 0 0 0
Table 2. Mammalian herbivores counted in the various sampling blocks during the sampling period.
Mammalian Herbivore Species Common Name Block 1 Block 2 Block 3 Total counts
Equus quagga Zebra 47 3 457 507
Eudorcas thomsonii Gazelle 45 66 20 131
Phacochoerus africanus Warthog 26 0 73 99
Alcelaphus buselaphus Hartebeest 15 31 16 67
Syncerus caffer Buffalo 8 0 11 19
Taurotragus oryx Eland 18 0 0 18
Aepyceros melampus Antelope 5 3 0 8
Giraffa Camelopardalis Giraffe 0 0 1 1
Total 164 103 578
Disclaimer/Publisher’s Note: The statements, opinions and data contained in all publications are solely those of the individual author(s) and contributor(s) and not of MDPI and/or the editor(s). MDPI and/or the editor(s) disclaim responsibility for any injury to people or property resulting from any ideas, methods, instructions or products referred to in the content.
Copyright: This open access article is published under a Creative Commons CC BY 4.0 license, which permit the free download, distribution, and reuse, provided that the author and preprint are cited in any reuse.
Prerpints.org logo

Preprints.org is a free preprint server supported by MDPI in Basel, Switzerland.

Subscribe

© 2024 MDPI (Basel, Switzerland) unless otherwise stated