Preprint
Article

Cooling Energy Benefits of Increased Green Infrastructure in Subtropical Urban Building Environments

Altmetrics

Downloads

122

Views

56

Comments

0

A peer-reviewed article of this preprint also exists.

Submitted:

25 July 2023

Posted:

26 July 2023

You are already at the latest version

Alerts
Abstract
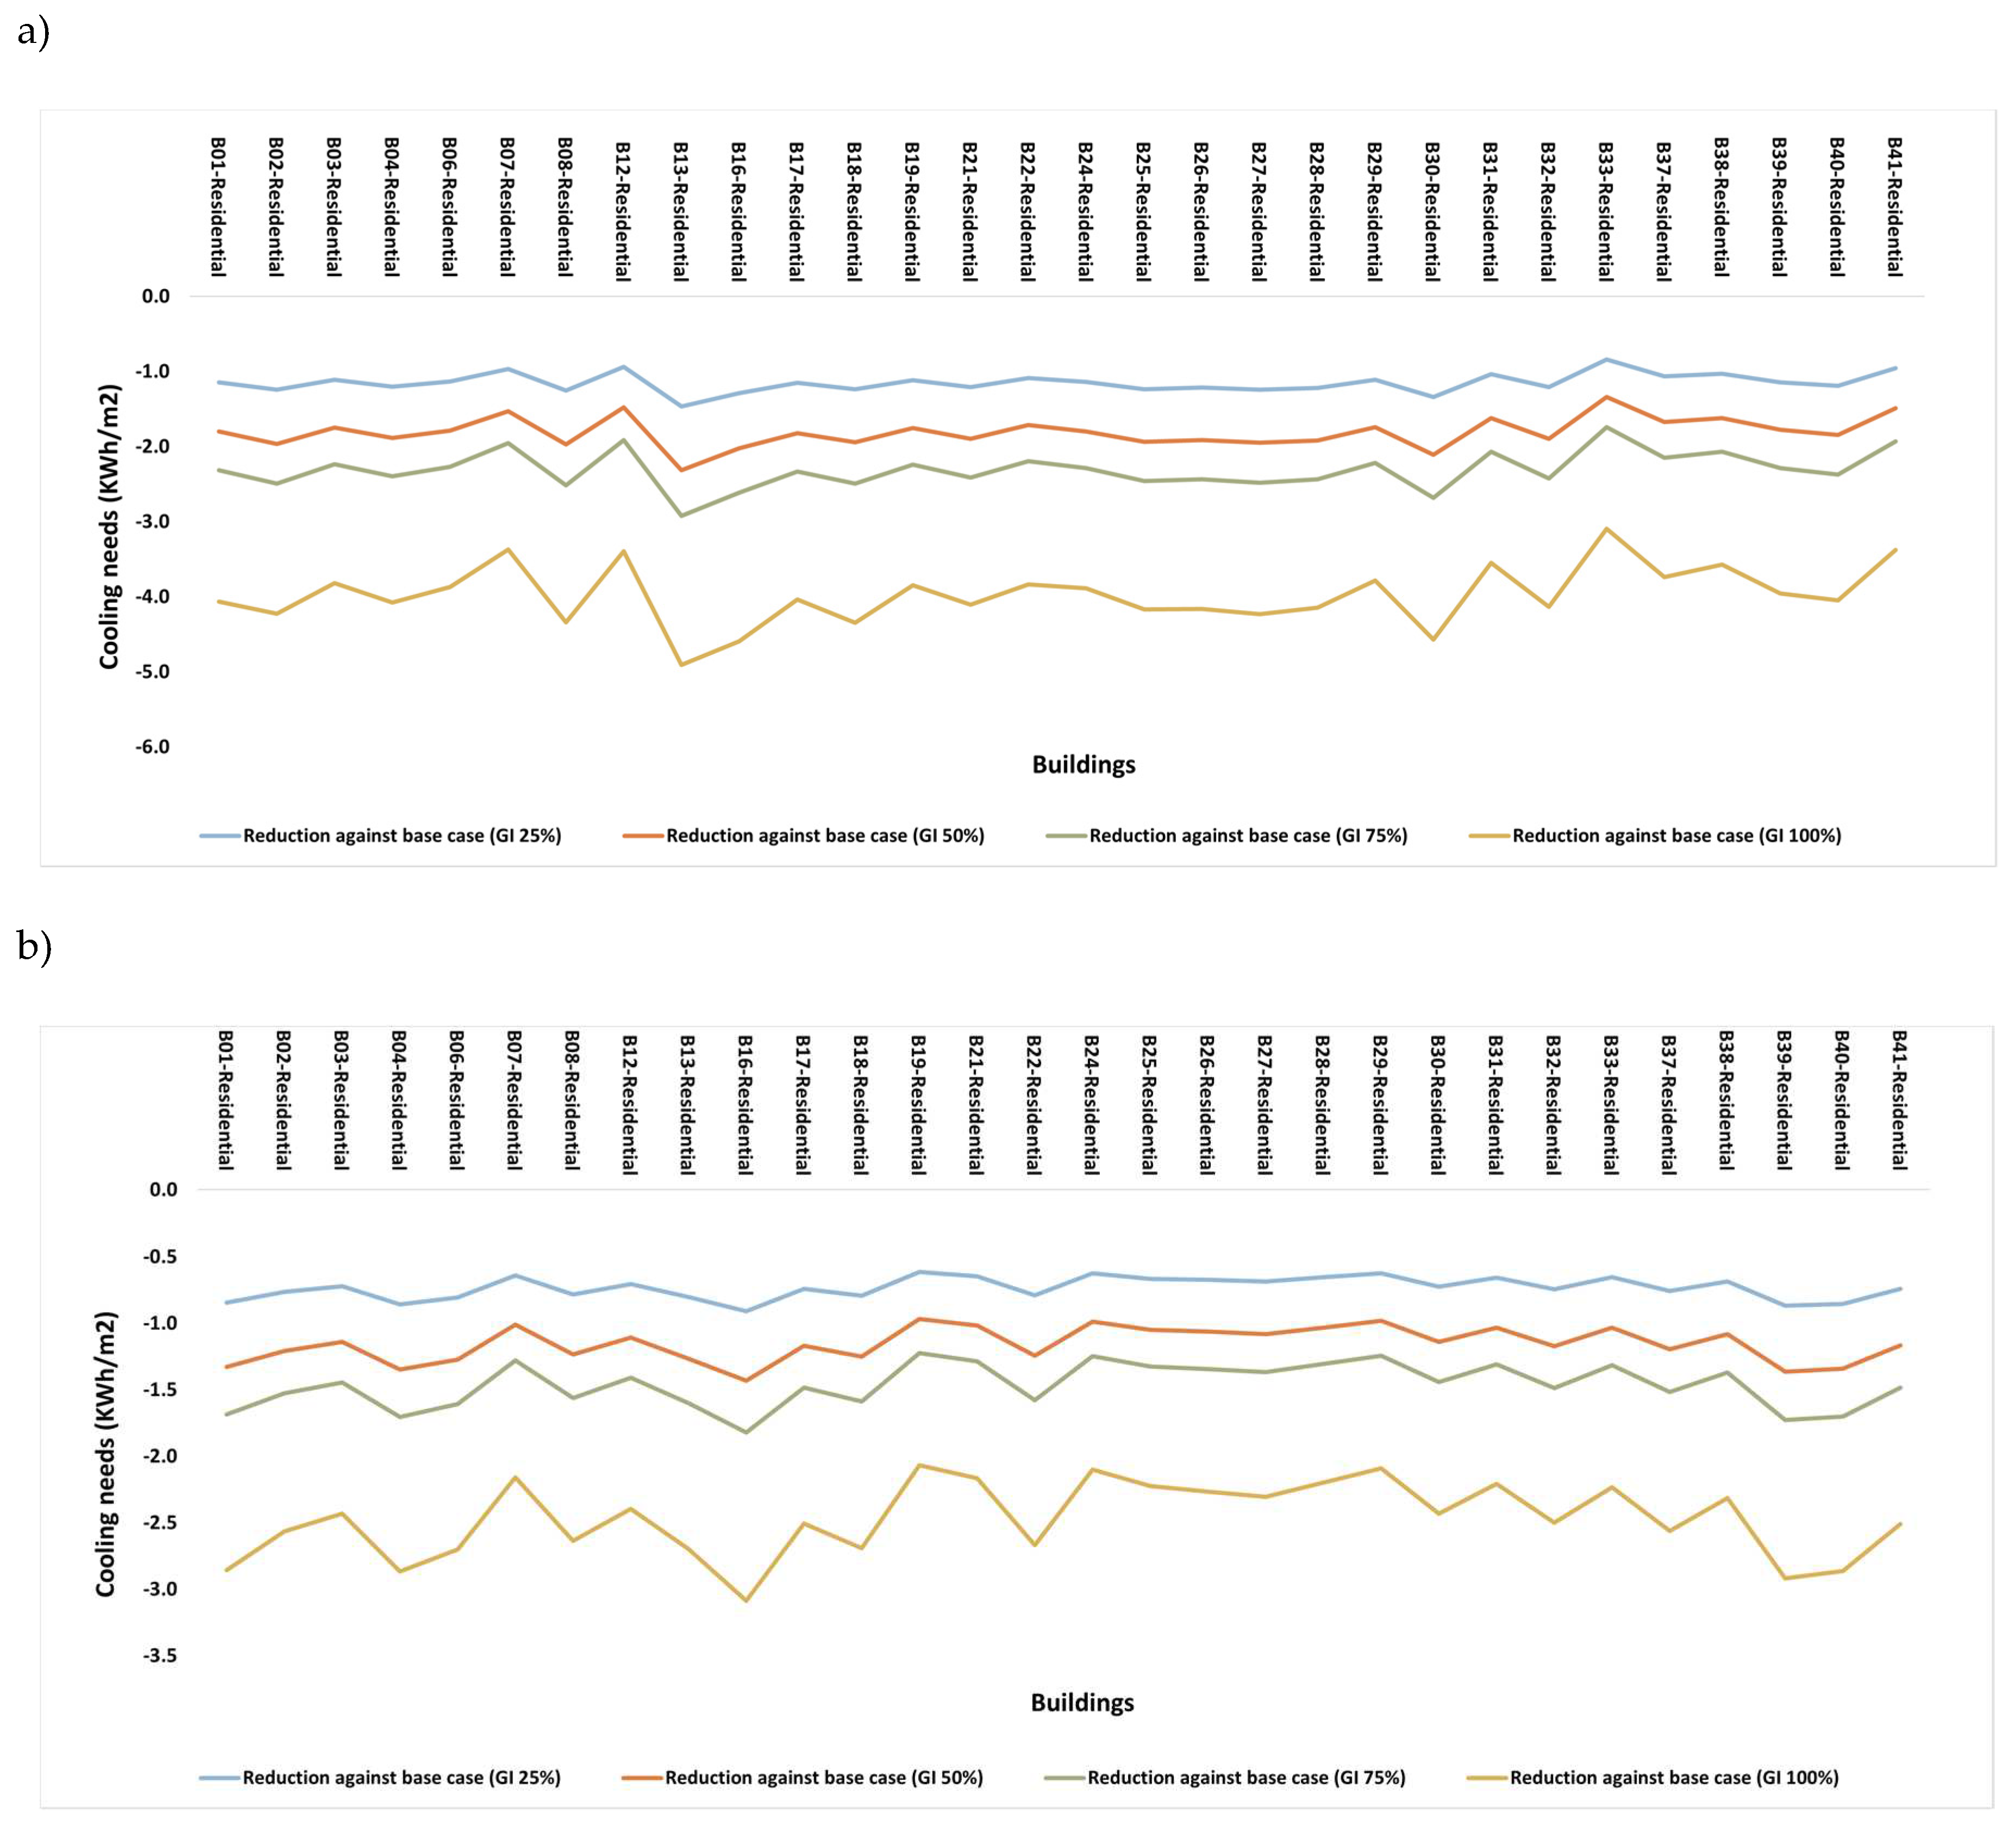
Due to urban warming, energy demand for cooling buildings is rising. The current study used CitySim to estimate the cooling energy requirements for 40 buildings in Downtown, Dubai using high-resolution climate data from weather research and forecasting (WRF) coupled with single layer urban canopy model (SLUCM). Simulating the four mitigation scenarios allowed for the examination of the reduction in cooling load caused by the addition of greenery at a rate ranging from 25% to 100%. The insulated building's cooling demand reduced by a maximum of 13.89% under 100% GI (M4). Scenario M4 resulted in a reduction of 4.6 kWh/m2 and 3.1 kWh/m2 for the non-insulated and insulated low-rise residential buildings, respectively, while the high-rise buildings saw a reduction of 3.09-4.91 kWh/m2 for the non-insulated and 2.07-3.09 kWh/m2 for insulated buildings. This study offered a potential remedy to deal with the problem of urban heating in subtropical environments.
Keywords: 
Subject: Engineering  -   Other

1. Introduction

Among the most crucial issues facing governments and experts worldwide are the environmental challenges brought on by urbanization and climate change. Cities are facing a major threat from rising temperatures, which will have a negative impact on the ecosystem and climate there. The environment, the need for energy for cooling systems, the need for water for irrigation, the need for power, and people's quality of life—especially those living in low-income households—are all negatively impacted by urban heat [1]. Urban population growth, rising temperatures, and increased energy use are all contributing factors to the large rise in greenhouse gas emissions and energy use [2,3]. Energy demand is rising as a result of industry, construction, and transportation. According to a prediction, by 2050, 34% of the entire energy demand for the world would be used to address cooling needs, and by 2100, this percentage will rise to 61% [3]. The impact of rising temperatures and energy consumption in urban areas has a significant impact on building attributes, the quantity of heating needed, the urban layout, and the local urban environment [4,5,6,7]. With regard to their effects on the environment and the substantial health problems they bring about, some of which are lifethreatening, urban heating and global warming have reached a point where significant worry has been expressed [2]. According to a study by Santamouris, a large amount of the cooling demand is met by urban heating when summer temperatures in hot climatic zones reach or exceed 27°C [8]. According to predictions, during the next 30 to 40 years, the demand for cooling energy will surpass that for heating energy [3]. The use of air conditioners will increase by 84%, and Melbourne's maximum electricity demand would rise by 10% [9], primarily as a result of global warming. As a result, it can be projected that in the future; there will be significant issues with urban heating and green house gas emissions from cooling systems [10]. Different thermal mitigation solutions have been developed for the urban areas to help mitigate the effects of these climate challenges [11]. The employment of albedo materials, the inclusion of green infrastructure (GI), and the installation of evaporative systems are the main components of these technologies [12]. These mitigating measures make an effort to increase heat sinks' capacity to absorb heat and lessen the potential of heat-generating sources [13]. There are certain of these mitigation strategies that have been proven to be more appropriate than others. For instance, after high albedo and inland water, a study carried out in London discovered that vegetation is one of the most efficient mitigating measures [14]. Due to their effects on the thermal equilibrium of the urban surface and consequent reduction in heat storage, evapotranspiration and urban vegetation mitigate the impact of an urban heat wave [15,16]. According to a Melbourne study that used the weather research and forecasting (WRF) and Princeton urban canopy model (PUCM) models in conjunction, GI, whether it includes cool roofs or not, will lessen thermal stress on people. According to studies, the amount of urban vegetation, such as grassy areas and urban vegetation diminishes as the amount of the city grows [16,17]. The association between daytime and night-time ambient temperatures and the rise in the amount of urban vegetation was found to be statistically significant in a study on extreme urban heat-induced mortality and environmental quality, which included fifty-five case studies [18]. For every 1°C decrease in temperature, an increase in urban greenery resulted in 3% less heat-related mortality [18]. According to a number of studies on reducing urban heat, existing mitigation measures can lower the outside temperature by up to 3°C, which lowers the need for cooling resources, cuts down on electricity use, and reduces heat-related morbidity and mortality [19,20,21,22,23]. Urban cities must address a number of issues that call for the integration of social, technological, and ecological systems, while putting an emphasis on natural and planted vegetation that can help create resilient and sustainable urban ecosystems [24,25,26,27]. GI is defined in a number of ways that vary in scope and intensity. The GI, according to the European Environmental Agency, is a network of connected green features that adds to the built environment's usability and adaptability [28]. A network of natural and semi-natural green areas, such as woods, parks, and green roofs, are referred to as GI and are meant to support environmentally friendly and economically sensible solutions, according to a different study [29]. Developing strategies to enhance urban climate resiliency and lower energy usage is a problem for the building sector. The addition of urban greenery to the building's exterior or the outdoors in an urban setting was one of the mitigating techniques in various studies [30,31,32,33]. According to studies, the amount of energy required for cooling a building depends on two things: the shading that covers its surface, which reduces the amount of solar energy that is absorbed, stored, and transmitted through conduction [34], and the evapotranspiration of plants and other physical processes that cool the air [35,36]. A study conducted in Florida found that vegetation can lower a building's energy use because it can intercept solar radiation and evapotranspiration, which can reduce the amount of power used for air conditioning by 50% each day [37]. Another study done in Mexico found that compared to an unshaded building, trees lowered the annual energy demand of a residential building by 76.6% [38]. Additionally, the presence of urban vegetation is very important for lowering both urban heat and environmental pollution [39]. According to a study conducted in Dubai, particular trees help to lower pollution levels and improve the quality of the air in metropolitan areas [40]. Previous research has demonstrated that trees can help lower energy use around buildings. Assessing and comprehending the effect of tree characteristics on the energy requirements of buildings is required for future elucidation [41,42,43]. To determine the effect of vegetation on the cooling energy requirements of buildings, a study was carried out in Thessaloniki, Greece. The ENVI-met model and the Energy Plus building energy modeling application were both used in the study. The study found that the leaf density and the spacing between shade trees directly affect the cooling capability of urban trees, potentially cutting energy use by 54% [44]. The height, type, and proximity of trees to buildings may have an impact on the cooling requirements of those structures [32]. It is challenging to lower cooling load needs in the United Arab Emirates (UAE), where there is a significant amount of humidity, a general warmth, and sun radiation. The UAE consumes the most energy per person in the world as a result of its exceptionally high energy needs, with the construction industry making up 70% of the country's overall energy requirements. By 2050 and 2080, respectively, it is predicted that the UAE will need to cool its buildings by an additional 22.2% and 40% [45,46] . The current study's objective is to use WRF and CitySim modeling to examine the impact of increased urban greenery on the building cooling loads of residential and commercial structures. By conducting for energy modeling scenarios in Downtown Dubai, different amounts of vegetation fraction have been taken into account, and the effects of increasing the urban greenery area on a building's cooling demand have been determined. After then, the findings are examined and discussed. An encompassing technique for the modeling of building energy use on an urban scale needs to be developed, yet there is a research void in this area. Because there is currently little information accessible for small cities, the energy modeling tools that are currently available are limited to the analysis of individual buildings rather than addressing the interplay between the built environment and GI. In order to perform energy simulation on a building scale, a multi-modeling approach and high-resolution data for GI and transpiration, building envelope, climatic data, and energy demands are needed.

2. Geography and Climatic Condition in Dubai

The coordinates of Dubai are 25°16' N and 55°18' E, placing it on the Tropic of Cancer. On the eastern tip of the Arabian Peninsula, its 72km of coastline [47] are open to the sea. In a relatively short period of time, Dubai has become the most renowned city in the entire world due to rapid urbanization. Dubai is the second-largest metropolis among the UAE's seven emirates, with a covered area of 4114 km2 , or 5% of the country's total territory. Due to its geographic location, Dubai has a subtropical desert climate. Mild winters and hot, muggy summers are typical in the city. The city's average temperature varies from 10 to 30°C in the winter and reaches 48°C in the summer [47]. Warm air advection from desert fetch and sea wind, which has a noticeable impact primarily at night, are two synoptic meteorological conditions that have an impact on Dubai's urban heating. Coastal towns like Dubai, in general, face more protracted and frequent excessive urban temperatures. A long-term strategy, the National Climate Change Plan 2017–2050, was designed by the UAE to address the impact of UHI and the problem of rising urban heat. In the central business centre (CBD) of downtown Dubai, a zone was taken into consideration for this study. Buildings for both residential and business use can be found within this 2 km2 region. As input climate data, CitySim used the Meteonorm software dataset. In the form of an XML file, CitySim made use of building data. In Dubai, it is important to look into how vegetation affects the demand for urban cooling in various types of structures. There is a paucity of information on the role of flora in subtropical desert climates in terms of lowering the cooling load of buildings. Thus, to calculate the energy needs at building size in Dubai metropolis, this study used high resolution climate data from WRF as the input of CitySim. The goal of the present study was to assess the corresponding cooling load demand by taking into account various GI fractions. The study includes two main steps: running the WRF coupled with single layer urban canopy model (SLUCM) simulation for several GI mitigation scenarios, and then importing the results into CitySim to assess the building cooling load for each mitigation option.

3. Materials and Methods

The focus of this research is on how the vegetation fraction affects the cooling load of different commercial and residential building types in Downtown Dubai, where an increase in urban greenery could result in a large drop in surface temperature. The quantity of trees and other types of flora might be increased, which would assist to cool the urban climate and reduce the intensity of the summer heat. Building energy models (BEMs) are frequently used to assess a structure's thermal performance in response to the negative effects of urban heat on energy consumption [48,49]. The development of urban building energy models (UBEMs) was made possible by improvements in computing resources [50,51]. UBEMs, which are used in conjunction with other urban modeling tools to evaluate a building's thermal behaviour in response to energy balance at the urban scale, latent and sensible heat, advective and anthropogenic heat, are primarily focused on urban sustainability and energy efficiency. The EPFL-developed CitySim Pro is one of the UBEMs used in the current work to carry out urban energy simulations [52]. CitySim utilizes a physics-based modeling simulation engine and a C++-based user interface [50]. CitySim employs a number of models; including hourly urban radiation models, building thermal characteristics, and heating, ventilation and air-conditioning (HVAC) models [51]. A HVAC system is used by CitySim to carry out simulation tasks. There were two steps in the methodology: First, urban scale WRF simulations were run for the base case and four mitigation scenarios that corresponded to the variable vegetative fraction. In order to assess the effects of expanding GI on building cooling demands, the simulation's results was also incorporated into the CitySim model. In our earlier research [33], we studied four mitigation strategies and one control case on the scale of the Dubai urban area. While building data from SketchUp was directly used by CitySim, weather data from WRF was transformed to a format that was compatible with CitySim using Meteonorm. The study also investigated four mitigation scenarios with vegetative proportions of GI25, GI50, GI75, and GI100 for the sake of comparison. The base case was chosen to be a vegetation fraction of 10%, which corresponds to a GI proportion of 10%.

3.1. CitySim Configuration for Energy Simulations

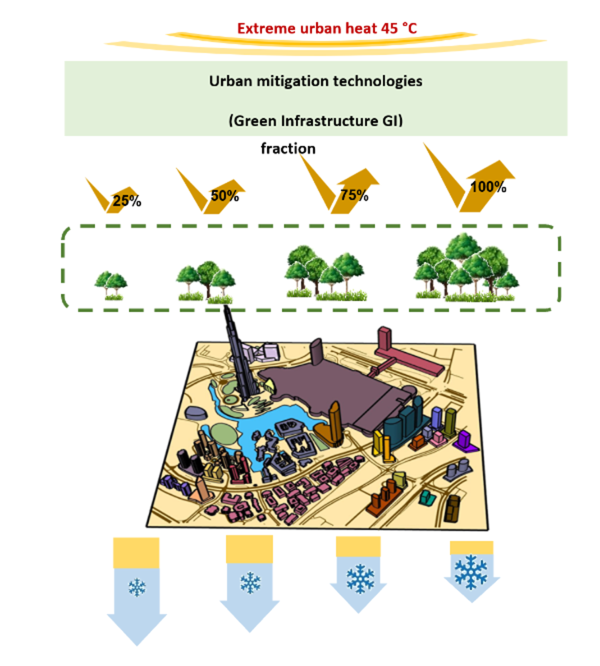
For accurate simulations of the urban environment for the cooling load of 40 different commercial and residential buildings in Dubai, CitySim includes unique settings. As indicated in Figure 1, there are numerous procedures that must be taken in order to set up the setup correctly. The first step was to input local meteorological and geometric data into the CitySim program. Cli and Hor files, which include climate data, were used. Building attributes were specified after the climatic data import. For commercial buildings, the inside and outdoor temperatures were taken to be 19°C and 24°C, respectively; for residential buildings, these values were 20°C and 26°C.
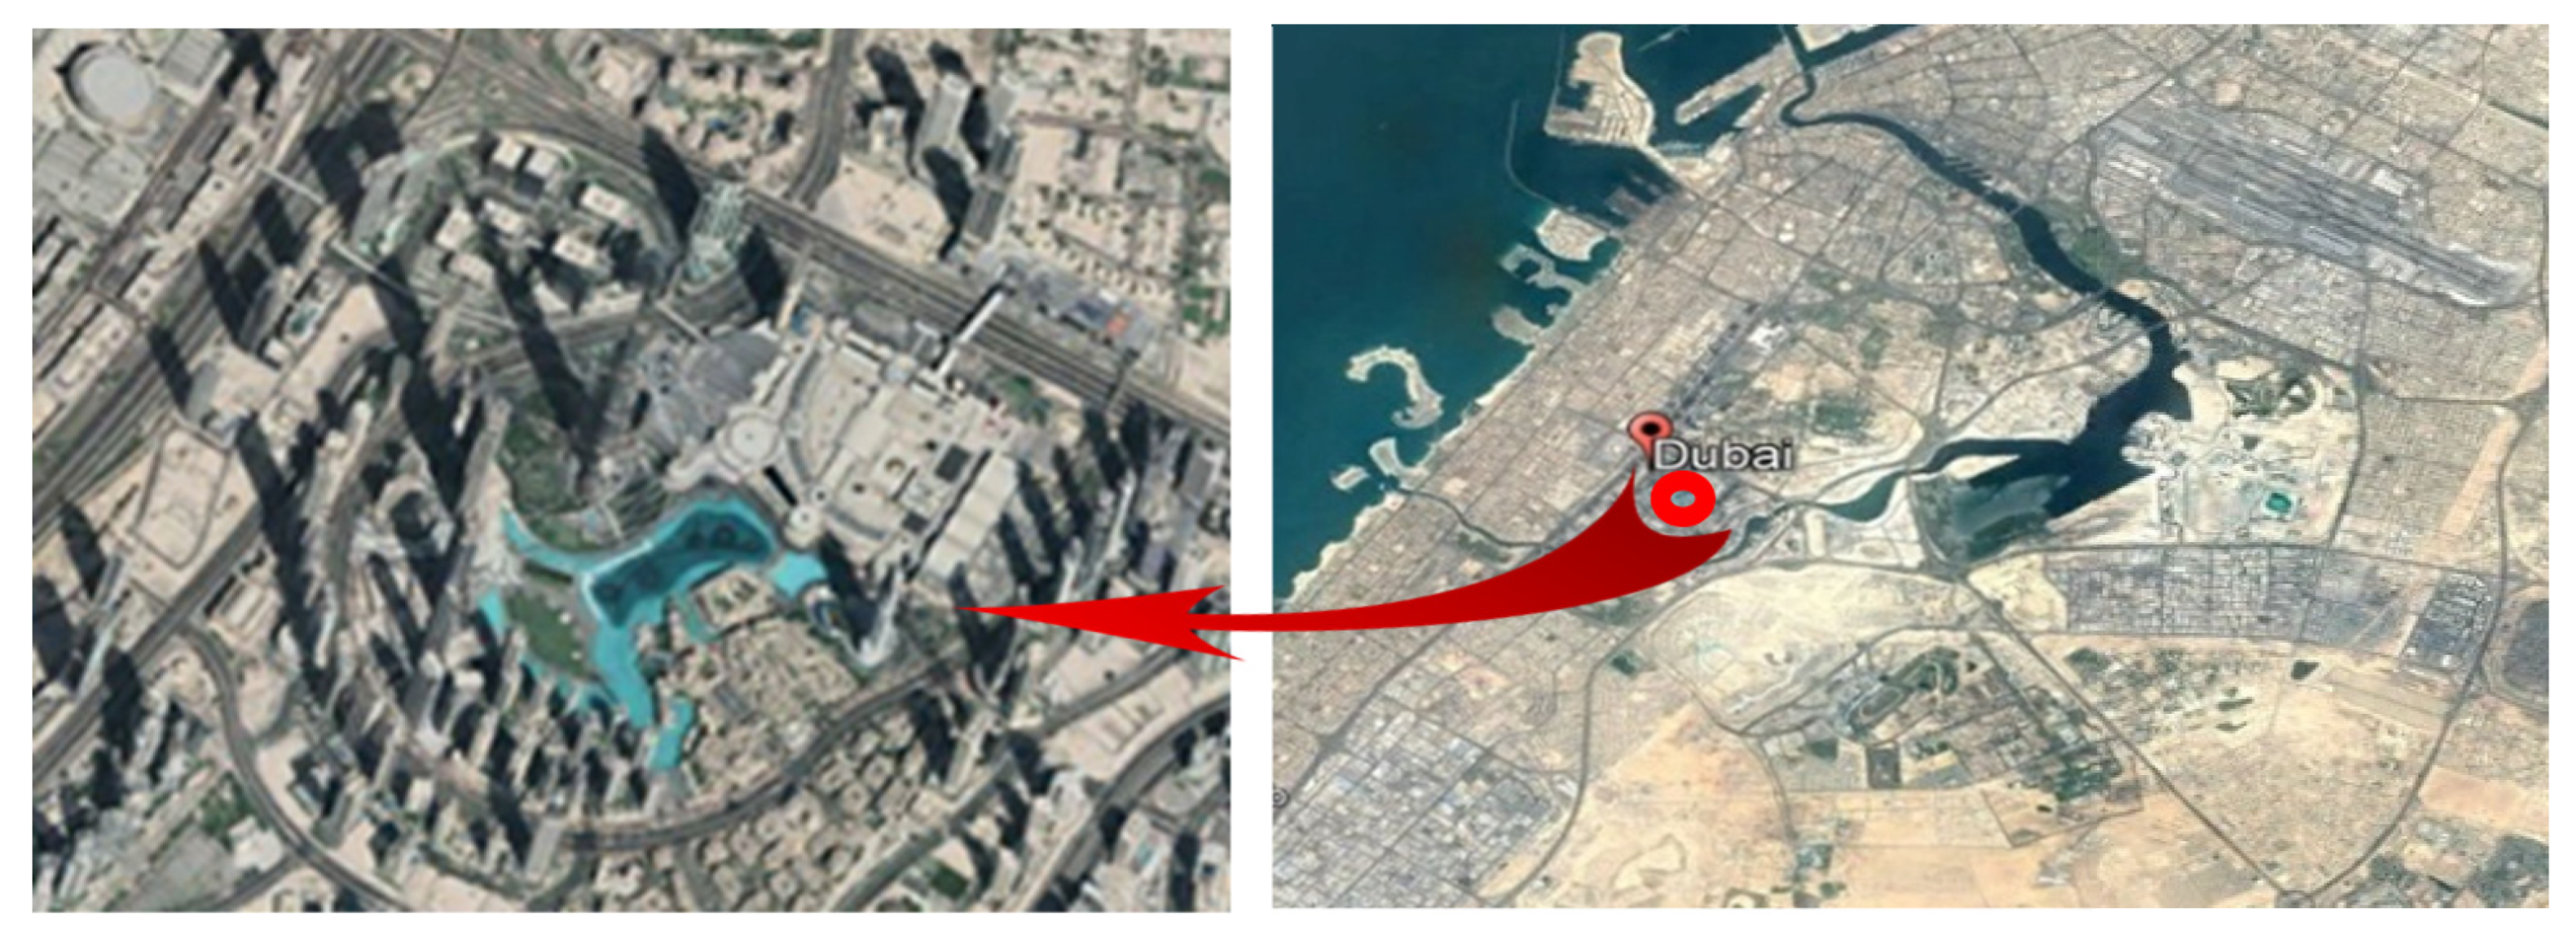
The invasion as determined by 1. The glazing gvalue was set at 0.85, the cut-off irradiance at 100 W/m2 , and the shading device at 0.2. Surface reflectance was calculated at 0.2. As stated in Table 1, the glazing U-value for insulated buildings was taken as 1.6, 1.9, and 2.1 W/m2K, respectively, whereas the glazing U-value for non-insulated structures was 5.8 W/m2K. The value for the open able proportion was assigned as 0.5. The parameters of the roof, wall, and floor envelopes as well as composite materials were defined in the XML with consideration for the simulation needs. For both insulated and uninsulated buildings, these materials were specified. The final step was to provide CitySim with information on occupant density and heat gains. According to Figure 2, the current case study takes into account a 2 km2 urban area in Downtown Dubai, which is located at 25.18°N and 55.27°E. Umm Al Tarif was the previous name for this location before the year 2000. Business Bay is to the south and financial centre road to the northeast of this region. This study looked at 40 buildings in the neighbourhood, including 10 commercial and 30 residential structures. There are both high-rise and low-rise structures among these. Commercial structures range in height from 12 to 89m and house offices, malls, theatres, and fitness centres. Residential structures, on the other hand, can be anywhere between 22 and 605m tall.

3.2. Simulation Process

Two steps can be used to divide the simulation process: (a) Using SketchUp and WRF to retrieve climatic and building data for use as CitySim's input parameters, and (b) executing CitySim's simulation of the energy performance of 40 buildings.

3.2.1. CitySim Data from SketchUp and WRF

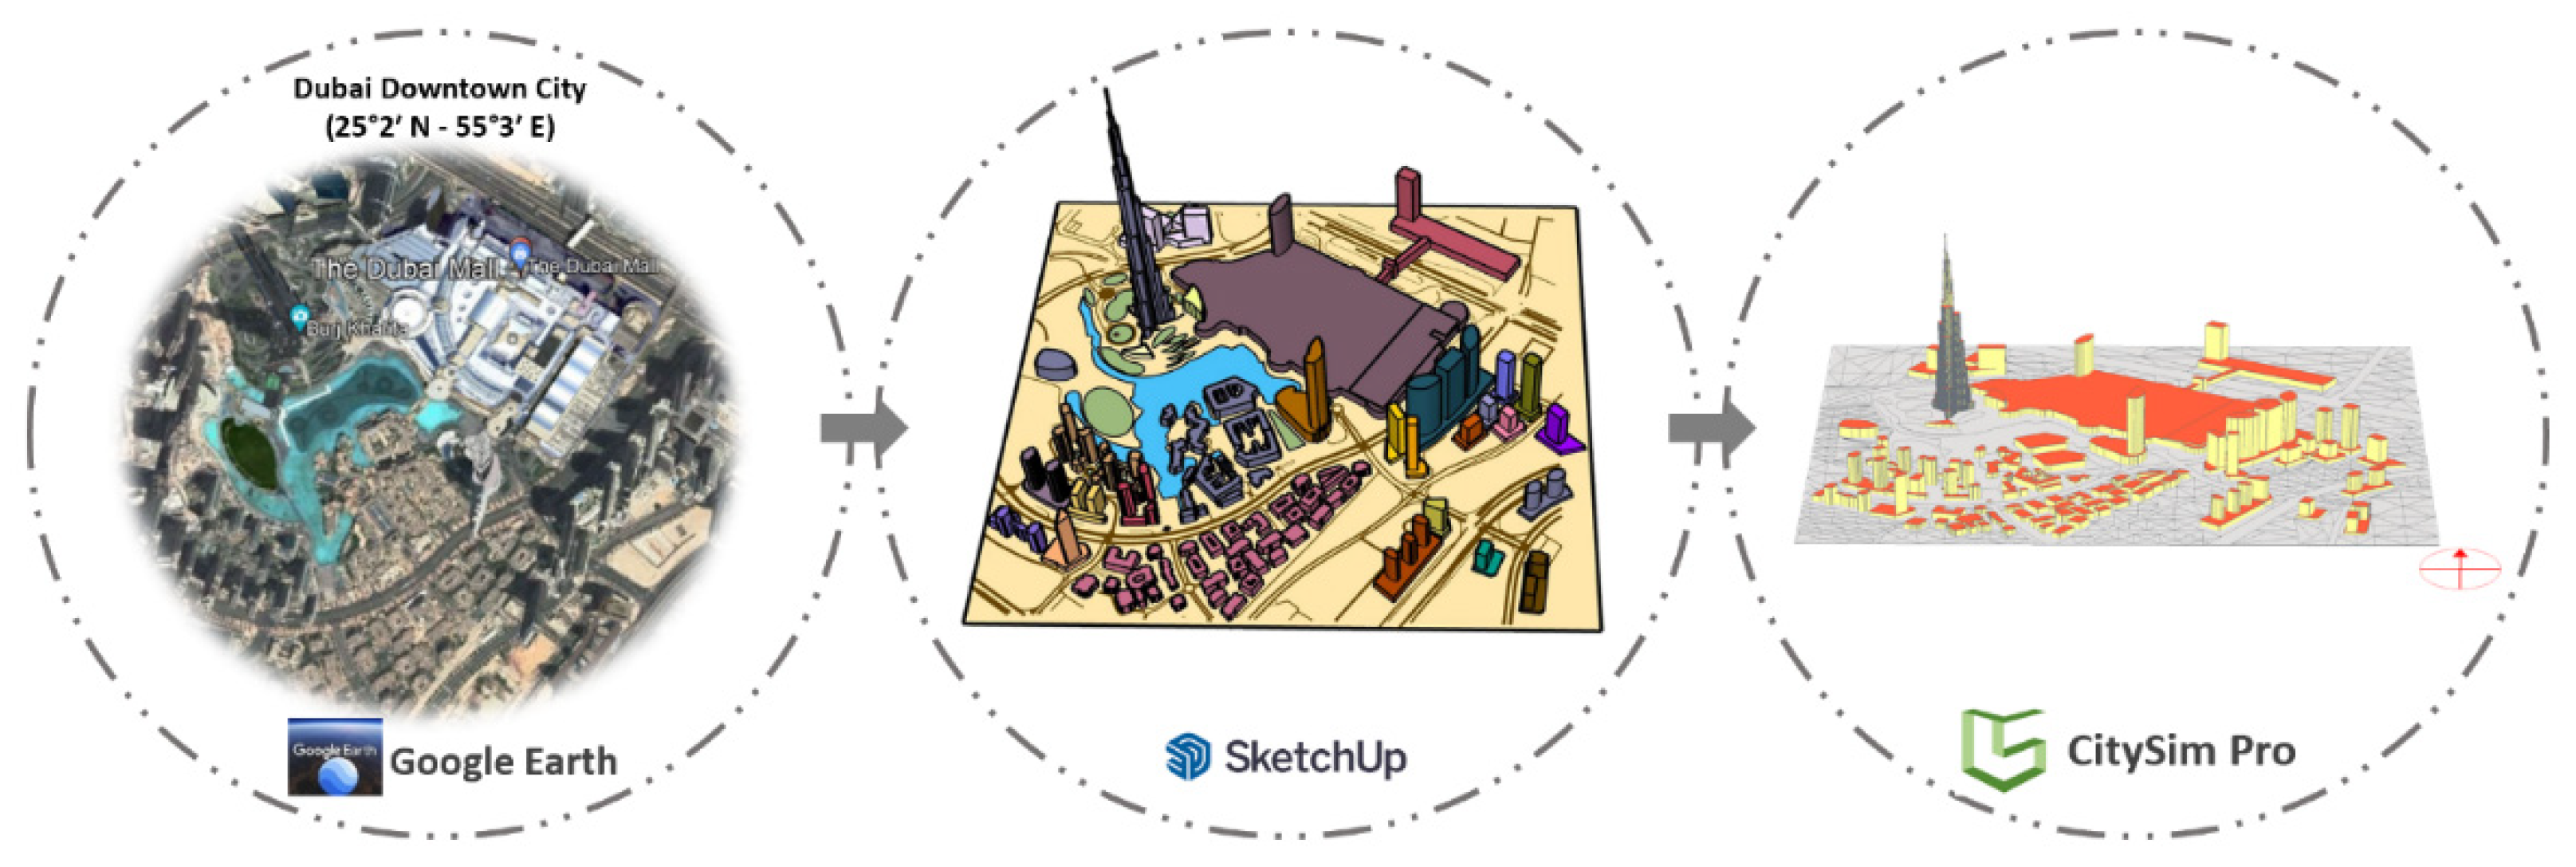
Data from WRF was used as CitySim input data. As a result, the reliability of this climatic data's precision and correctness can be said. The accuracy of the results from the CitySim simulation are closely correlated with the accuracy of this data. Surface temperature, wind speed, ambient temperature, humidity level, and wind direction were all included in the WRF data. On 40 buildings, including both residential and commercial ones, simulation was done. Over 2 km2 was used for the simulation. SketchUp was used to import these structures from Google Earth, and models were made that can be seen in Figure 3.
In order to be compatible with the simulation software, models were created in meters. The common surfaces between buildings were removed, and each building had its own layers as a result of the North being pointed toward the top of the building model. The final model was then directly loaded into CitySim as dxf files. The models' traits include building space, window-wall ratio (WWR), number of stories, and geometrical measurements, which are all in accordance with the archetypes indicated in Table 2. As shown in Table 3, the American society of heating, refrigerating and air-conditioning engineers (ASHRAE) standards and the Dubai Building Code manual were used to choose the building materials.

3.2.2. Building Energy Simulation by CitySim

To evaluate the performance of the buildings in relation to different GI fractions, energy simulations of both insulated and non-insulated buildings were run on a building scale. According to the hypothetical classification system, buildings were divided into low-rise, medium-rise, and high-rise categories depending on the number of floors they had—6 stories, 7–12 stories, and more than 12 stories, respectively. Building energy simulation test (BESTEST) was used to validate the simulation results of CitySim, and results were compared to those of a reference software suite (IEA BESTEST set) [53]. Additionally, when the results of CitySim were contrasted with actual data on energy use, slight differences were found [54]. In order to create climatic (.cli) and horizon (.hor) files that work with the simulation software, Meteonorm 8.0 was used to convert the output data from WRF. Then .cli and.hor files with the climate data for the base and mitigation scenarios were created. The climate (.cli) file includes different climatic variables as stated in Table 4 as well as hourly climate data for an entire year (8760 h). Using these climate and horizon files for the month of July, cooling load simulations for the base and mitigation scenarios were run. Separate simulations of uninsulated and insulated buildings were run, and the efficiency of the vegetation infrastructure was examined. The simulation also needed a set of variables that included precipitation, cloud cover fraction, and surface temperature. Any of the lacking parameters can be produced using Meteonorm. These hourly climate data files were utilized by the CitySim program to simulate cooling loads for the month of July in both the control case and the mitigation scenario. For each scenario, two cooling load simulations of insulated and non-insulated buildings were run using the climate data parameters. This study focused on gathering simulation results for both non-insulated and insulated structures in order to evaluate the efficacy of mitigation techniques on cooling load requirements in metropolitan locations.

4. Results and Discussion

For Dubai, where the highest ambient temperature in the winter months ranged between 10 and 30°C and the maximum temperature in the summer months can reach 48°C with an average temperature of 41°C, the thermal performance of enhanced GI fraction has been tested. According to the results of the reference scenarios, synoptic weather conditions like hot, dry desert winds and chilly sea breezes have a significant impact on metropolitan heat. As a result of the reduction in sensible heat, the results showed that increasing the vegetative percentage had an impact on the thermal balance of cities and could greatly lower the cooling load requirements. At 14:00 LT in the summer, the reductions in ambient temperature were 0.60°C, 1.10°C, 1.40°C, and 1.70°C, respectively. The decrease in surface temperature was determined to be 1.40°C, 1.90°C, 2.10°C, and 2.70°C for the increase in greenery, which corresponds to the mitigation measures M1, M2, M3, and M4.

4.1. WRF Model Evaluation and Validation

By taking into account the four meteorological data sets provided by the national centre of meteorology (NCM) of the UAE, this study examines and validates the performance of additional GI. The local weather stations at Saih Al-Salem, Lahbab station, Al-Maktoum International Airport, and Dubai International Airport provided the meteorological data. The statistical comparison between the local climatic measurements and the hourly base case simulation results of 2 m temperature at the seasonal scale is necessary for the validation and evaluation of the performance of the WRF model [55].

4.2. Effects of Increased Urban Vegetation on Building Cooling Loads

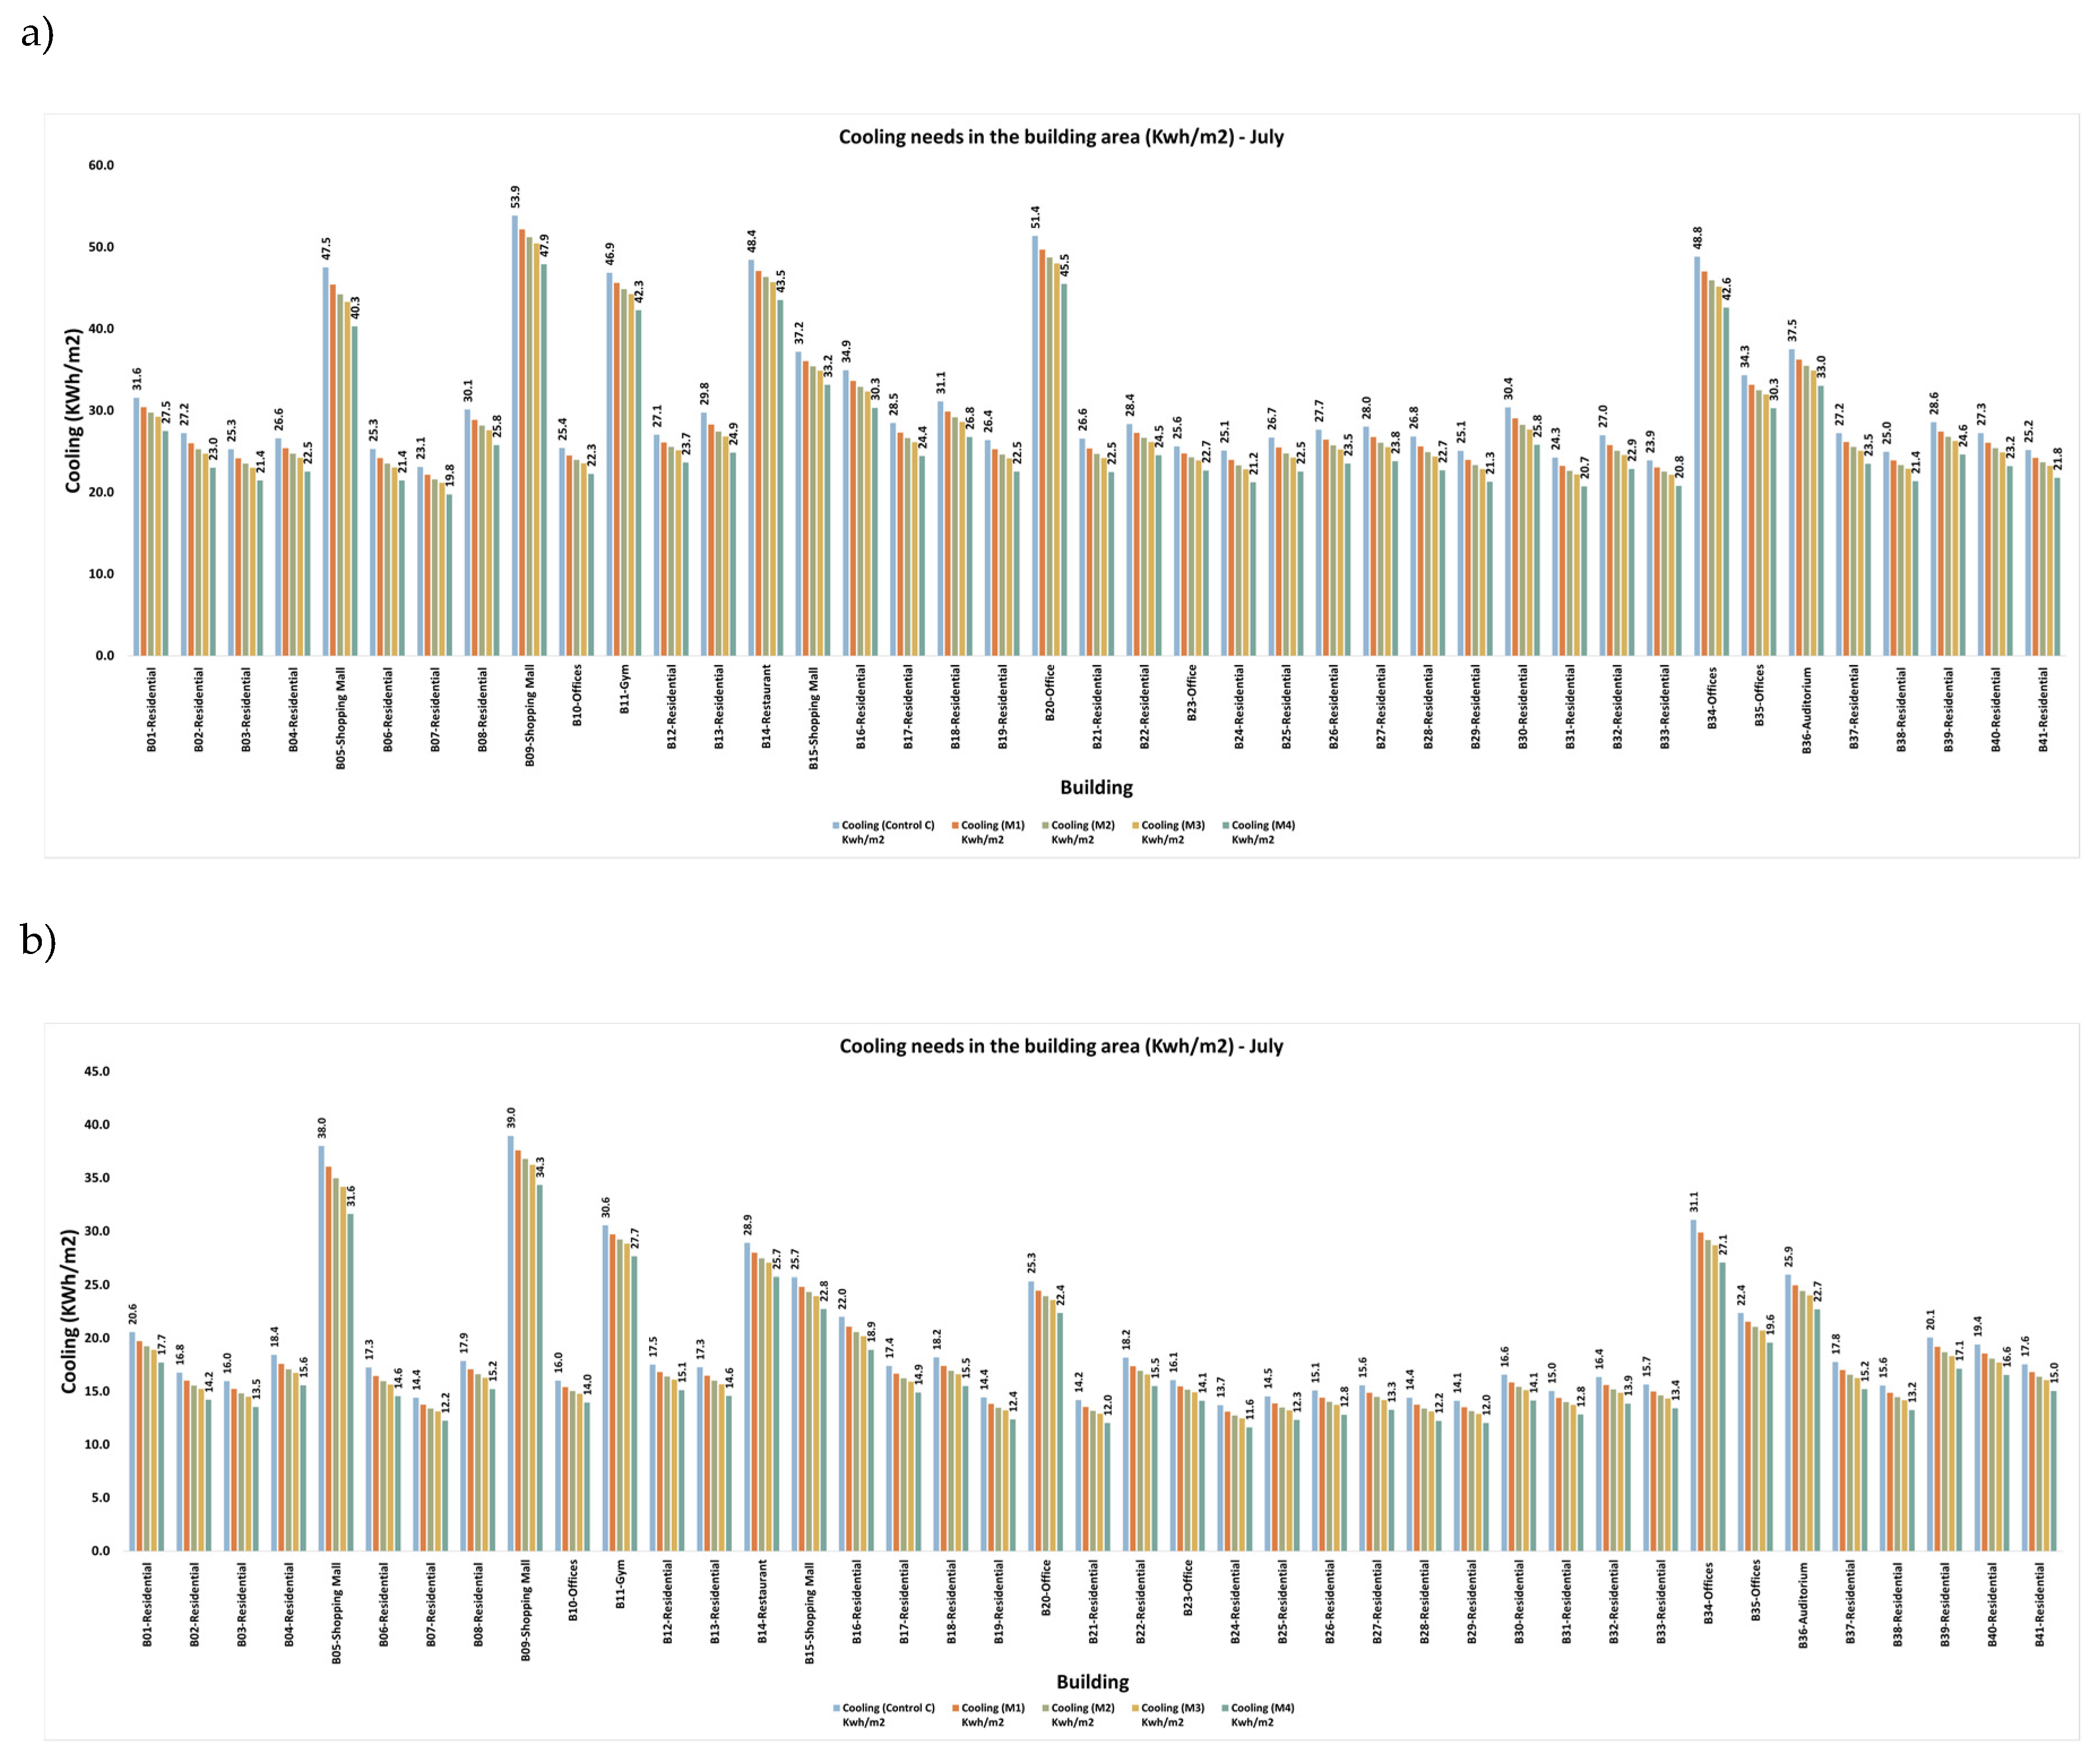
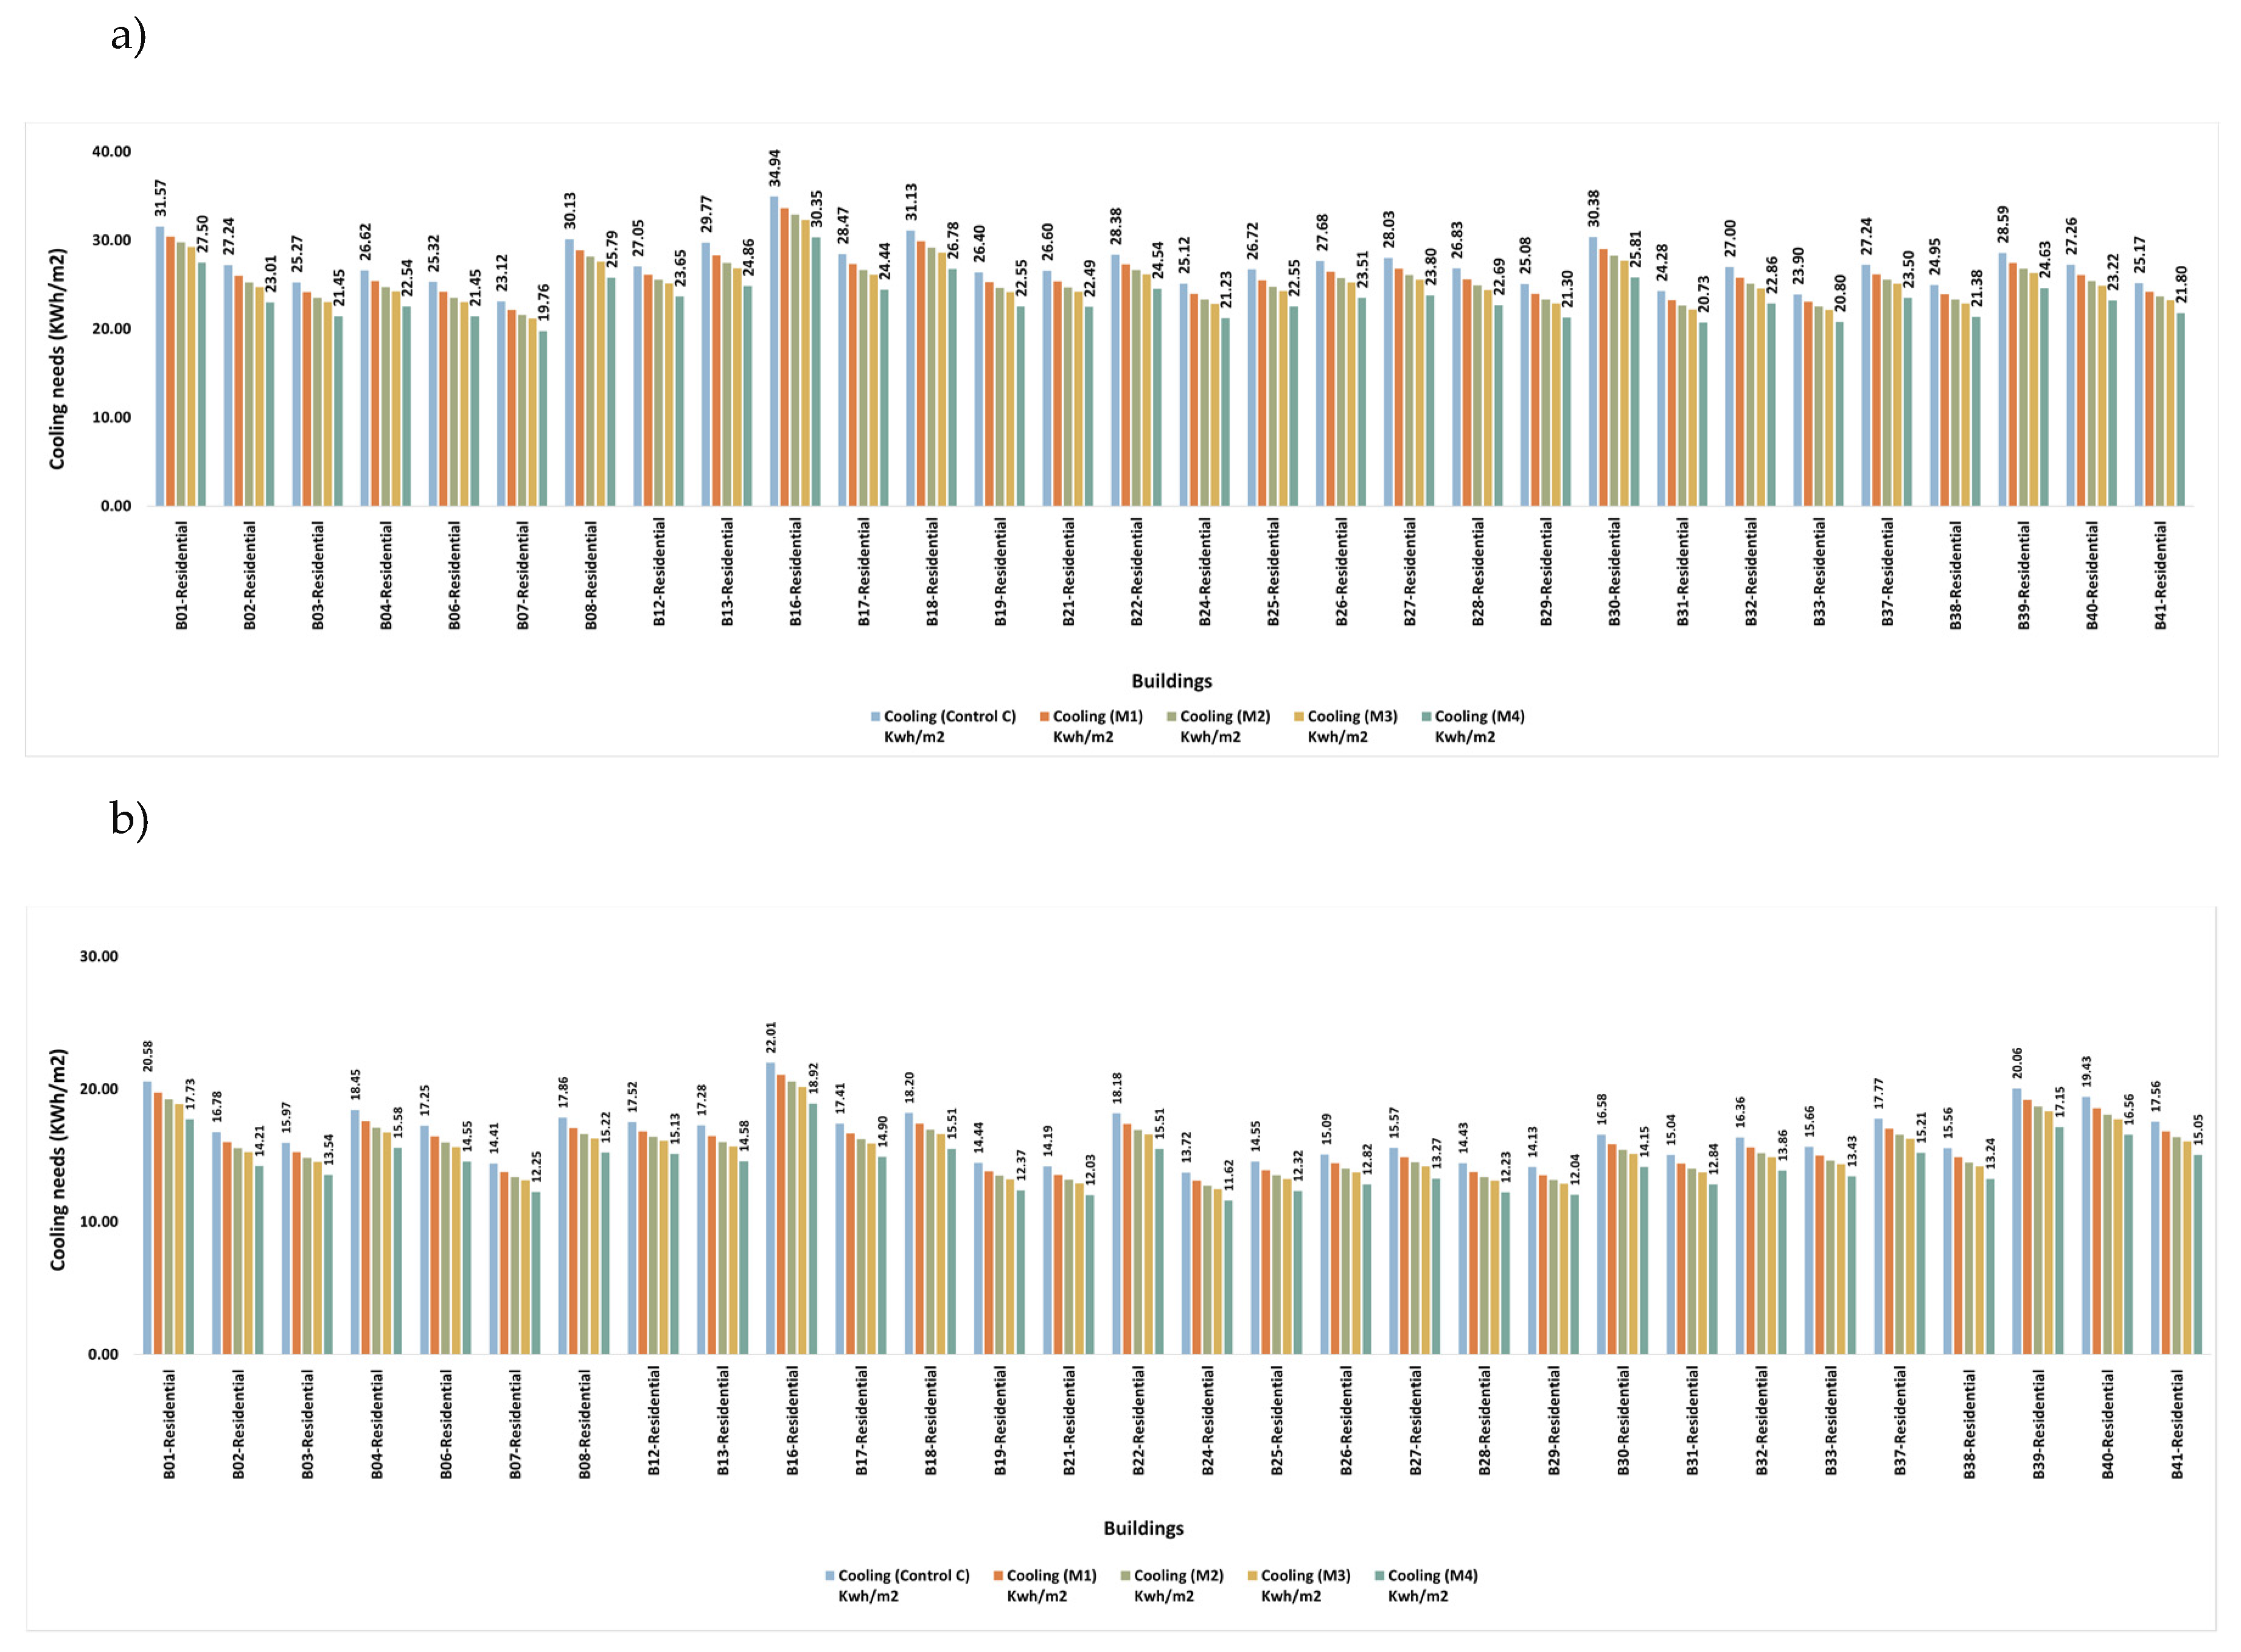
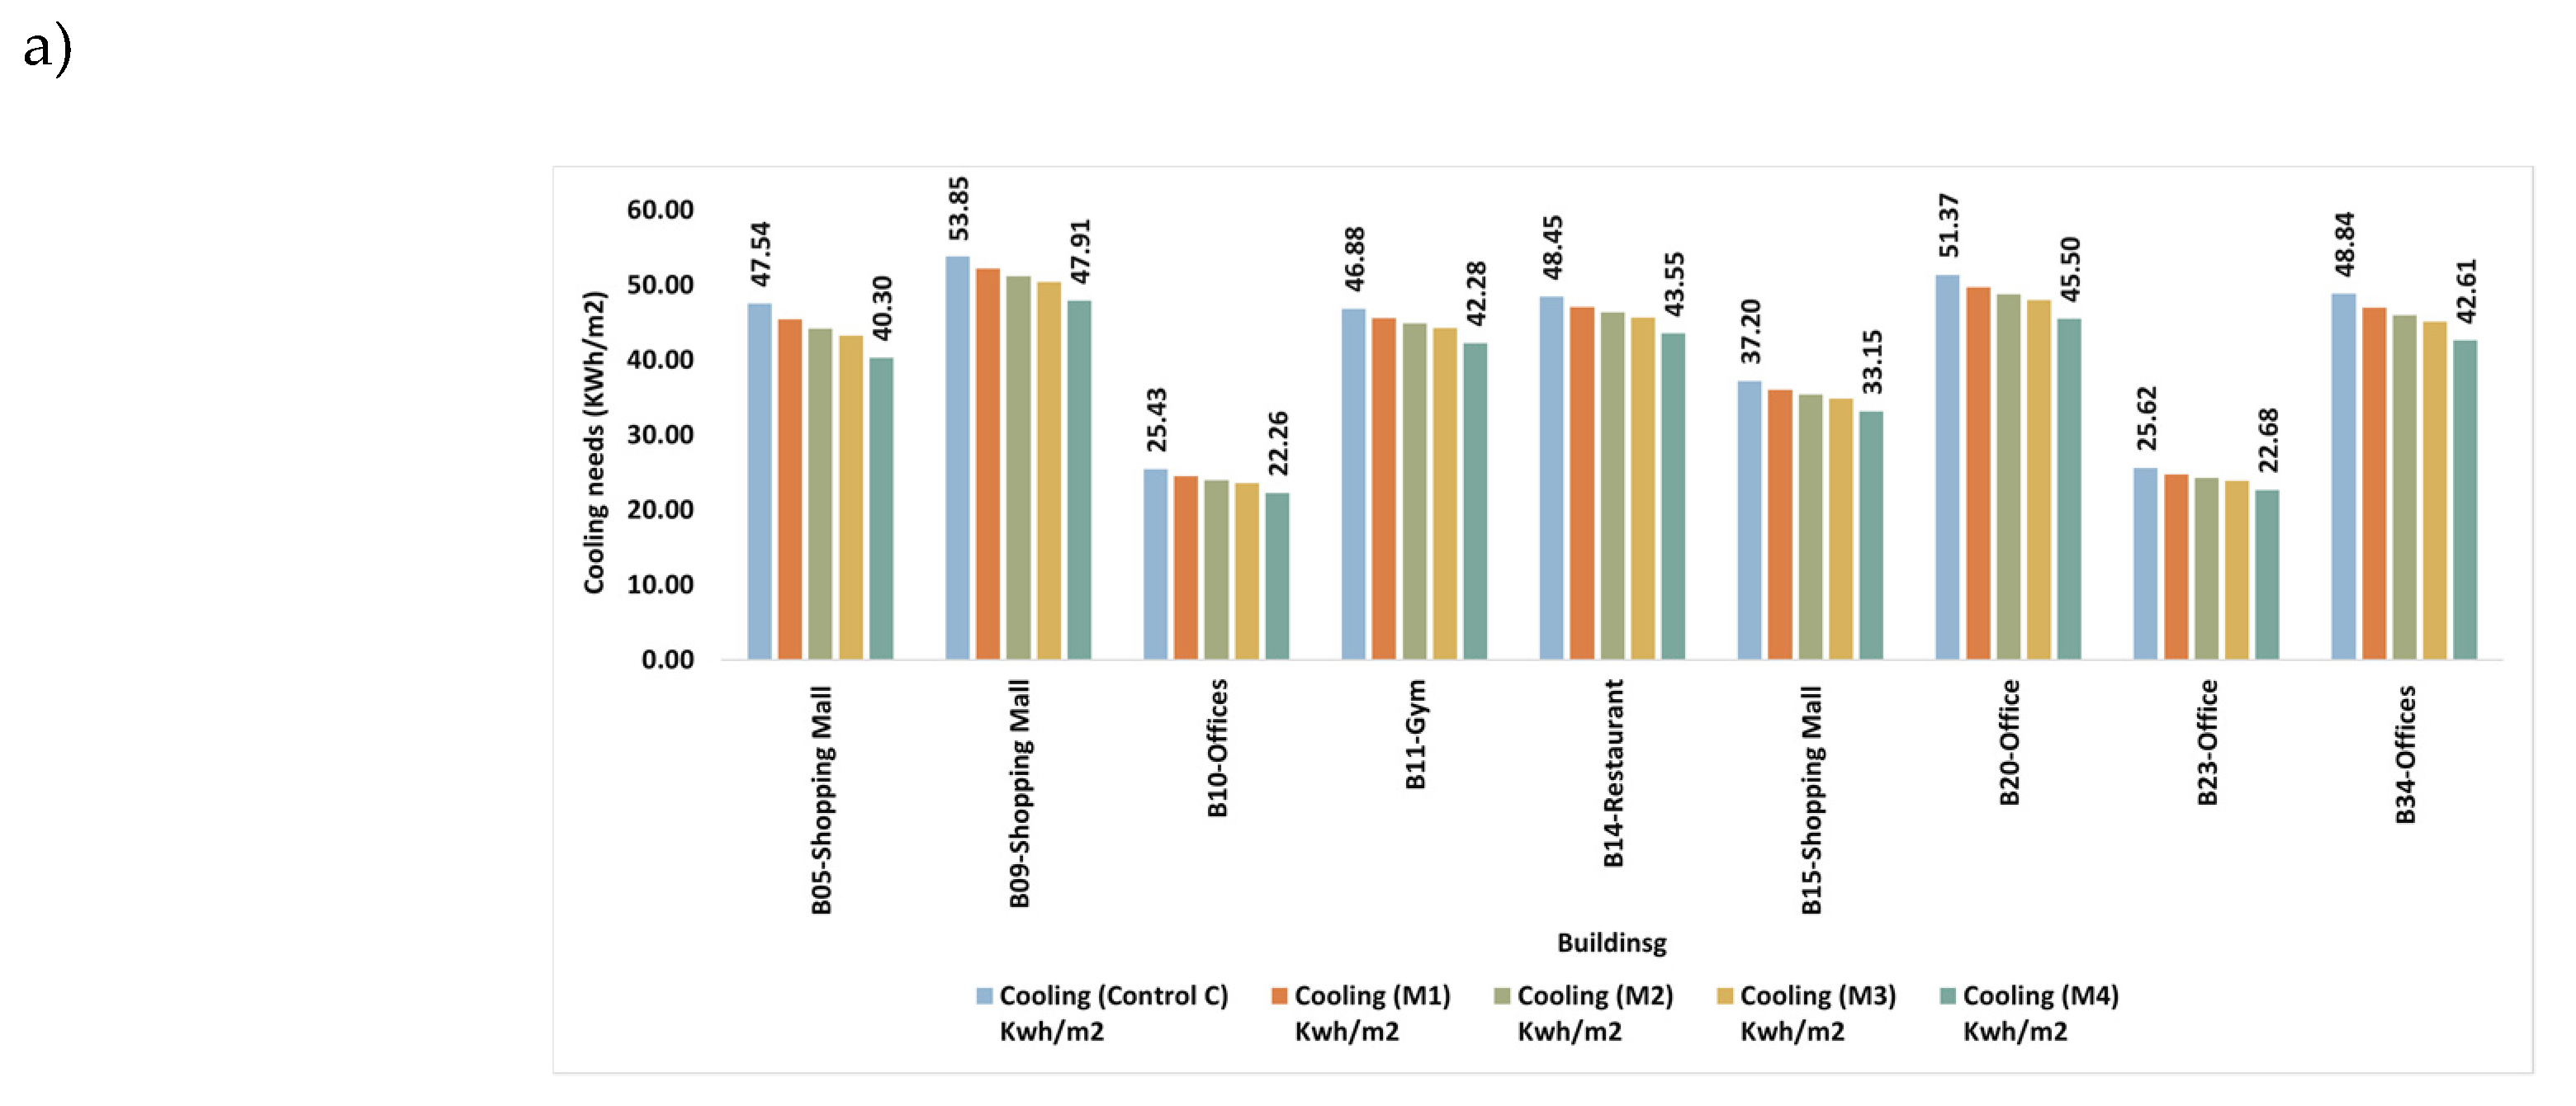
Utilizing weather information from WRF, CitySim simulations for the month of July 2019 were run for the control case and four extra vegetation scenarios. 40 high-rise and low-rise, commercial and residential structures were included in this simulation. The study took a wide range of commercial structures into account, such as theatres, malls, dining establishments, offices, and gyms. In Figure 4, the cooling demand is shown in kWh/m2 for all buildings under various mitigating strategies. According to the study, in the case of residential buildings lacking insulation, the reference case showed a cooling load of 34.94 kWh/m2, which was decreased to 33.65 kWh/m2 , 32.92 kWh/m2, 32.33 kWh/m2 , and 30.35 kWh/m2 for low-rise buildings, respectively, according to mitigation scenarios GI25 (M1), GI50(M2), GI75(M3), and GI100(M4). In contrast, high-rise structures saw cooling loads between 31.57 and 23.12 kWh/m2 in the base case, which decreased to 22.15 kWh/m2 to 30.43 kWh/m2 , 21.60 kWh/m2 to 29.77 kWh/m2 , 21.17 to 29.26 kWh/m2 , and 19.76 to 27.50 kWh/m2 for mitigation scenarios M1, M2, M3, and M4, respectively, as shown in Figure 5. In contrast, non-insulated commercial buildings showed cooling load ranges for the low-rise structures of 24.77-52.19 kWh/m2 , 24.30-51.21 kWh/m2 , 23.92-50.46 kWh/m2 , and 22.68- 47.91 kWh/m2 for the four mitigation scenarios, respectively.
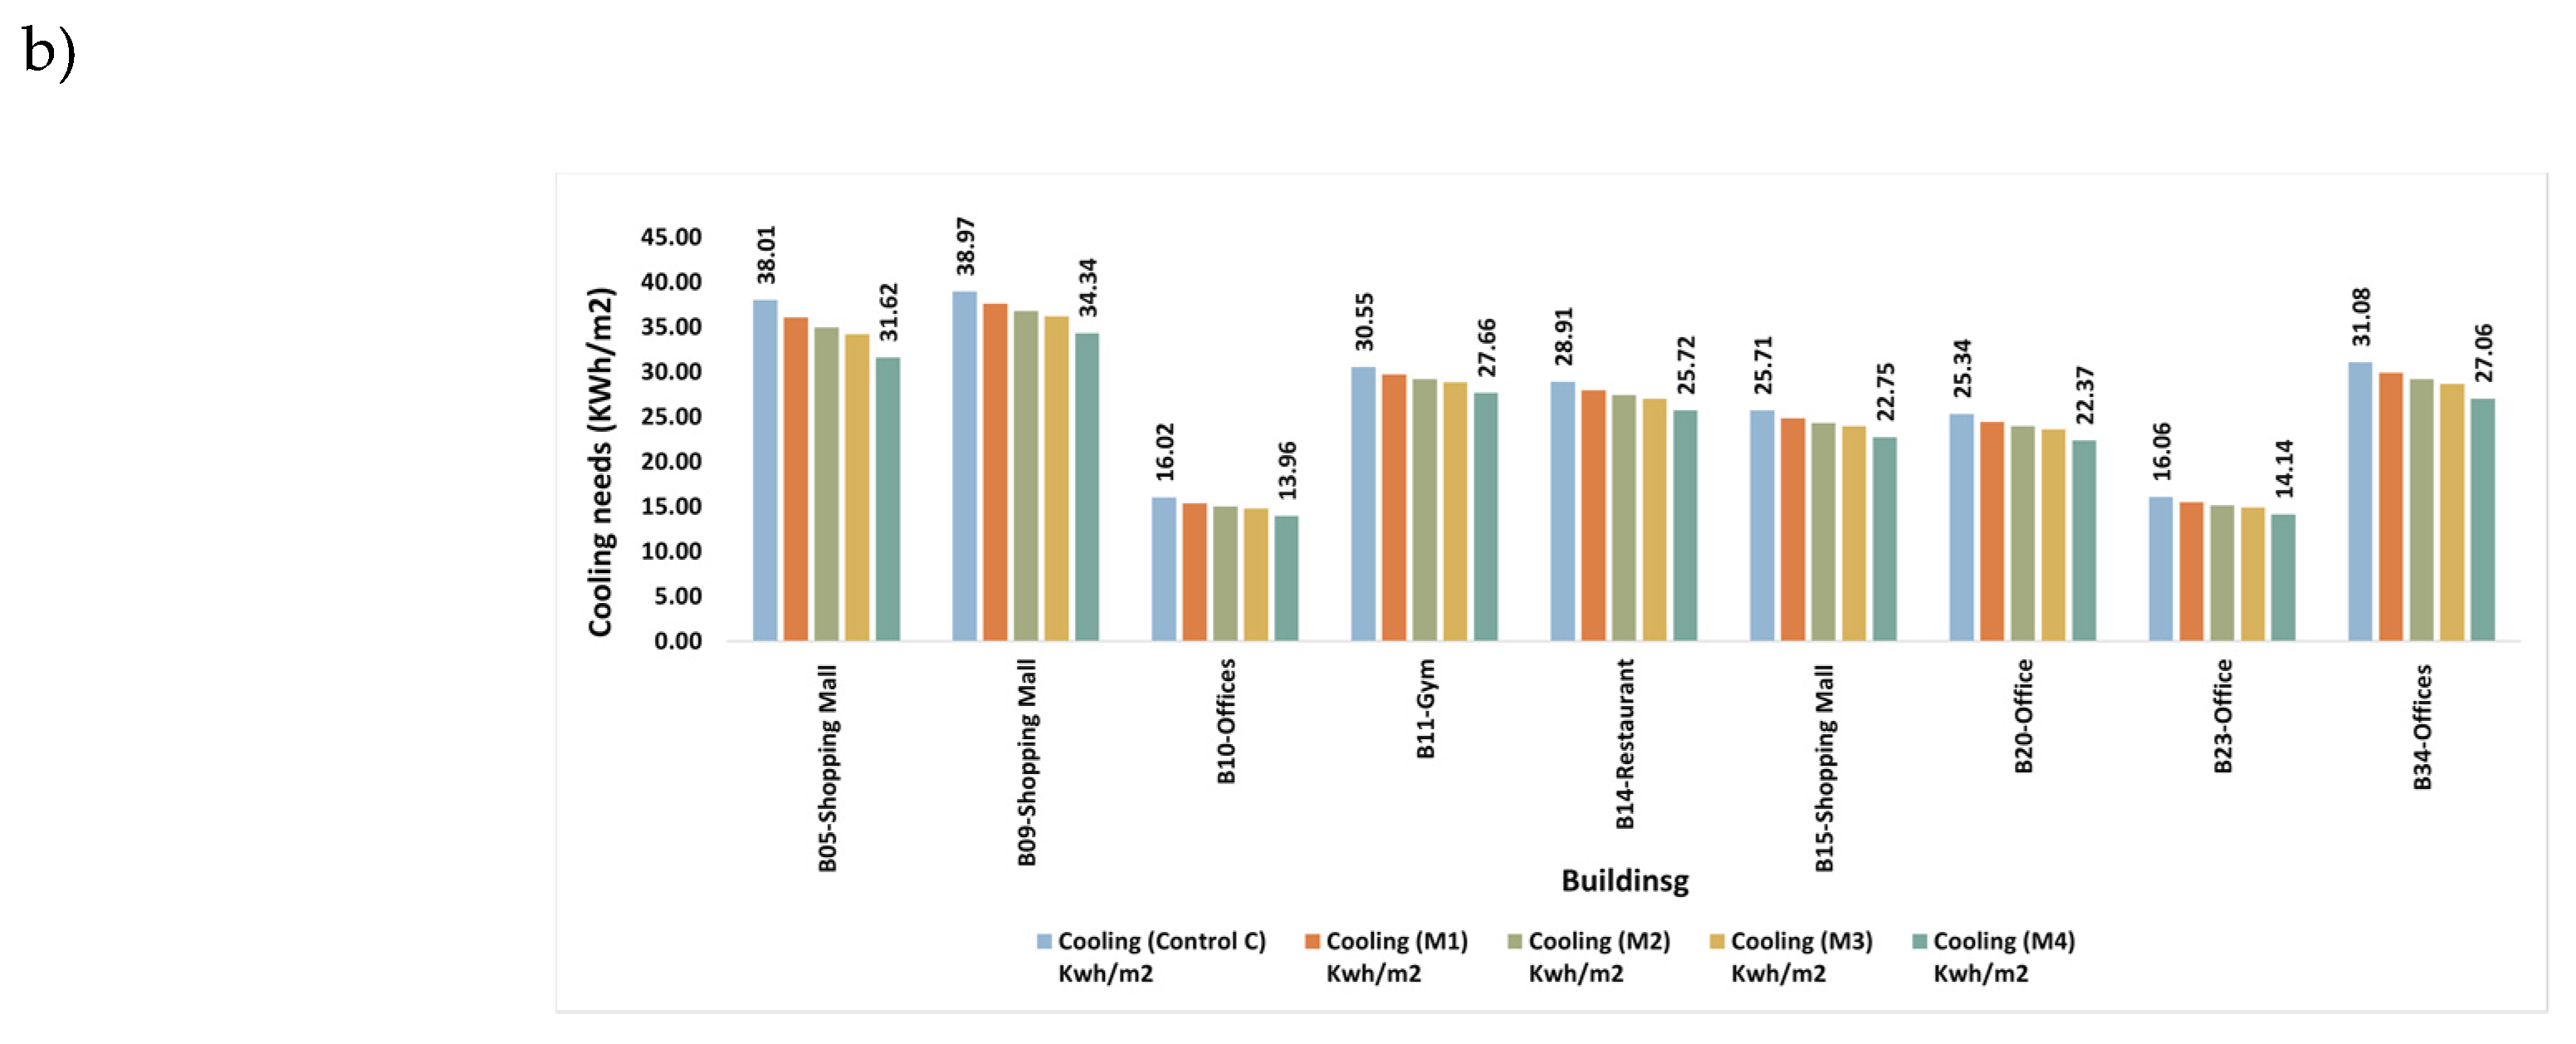
A high-rise building's cooling load, on the other hand, ranged from 25.43 to 48.84 kWh/m2 for the control case, 24.5 to 47.01 kWh/m2 for mitigation scenario M1, 23.98 to 45.95 kWh/m2 for mitigation scenario M2, 23.58 to 45.17 kWh/m2 for scenario M3, and 22.26 to 42.61 kWh/m2 for mitigation scenario M4, as shown in Figure 6. It follows that the mitigation scenario M4 has the least cooling load that has been observed across all building types. This is because more tree cover has increased shade, evapotranspiration, and wind modification.
The wind is directed in such a way by an additional tree cover that it has the greatest cooling impact on the buildings [56]. Additionally, compared to the commercial structures in our study, the residential buildings displayed a higher reduction in cooling demand. This might be because residential buildings in this study are taller than commercial ones. In comparison to the uninsulated mitigation scenarios, the results for the insulated buildings demonstrated lower cooling loads [57]. This is because the increase of insulation lowers the energy required for cooling loads.
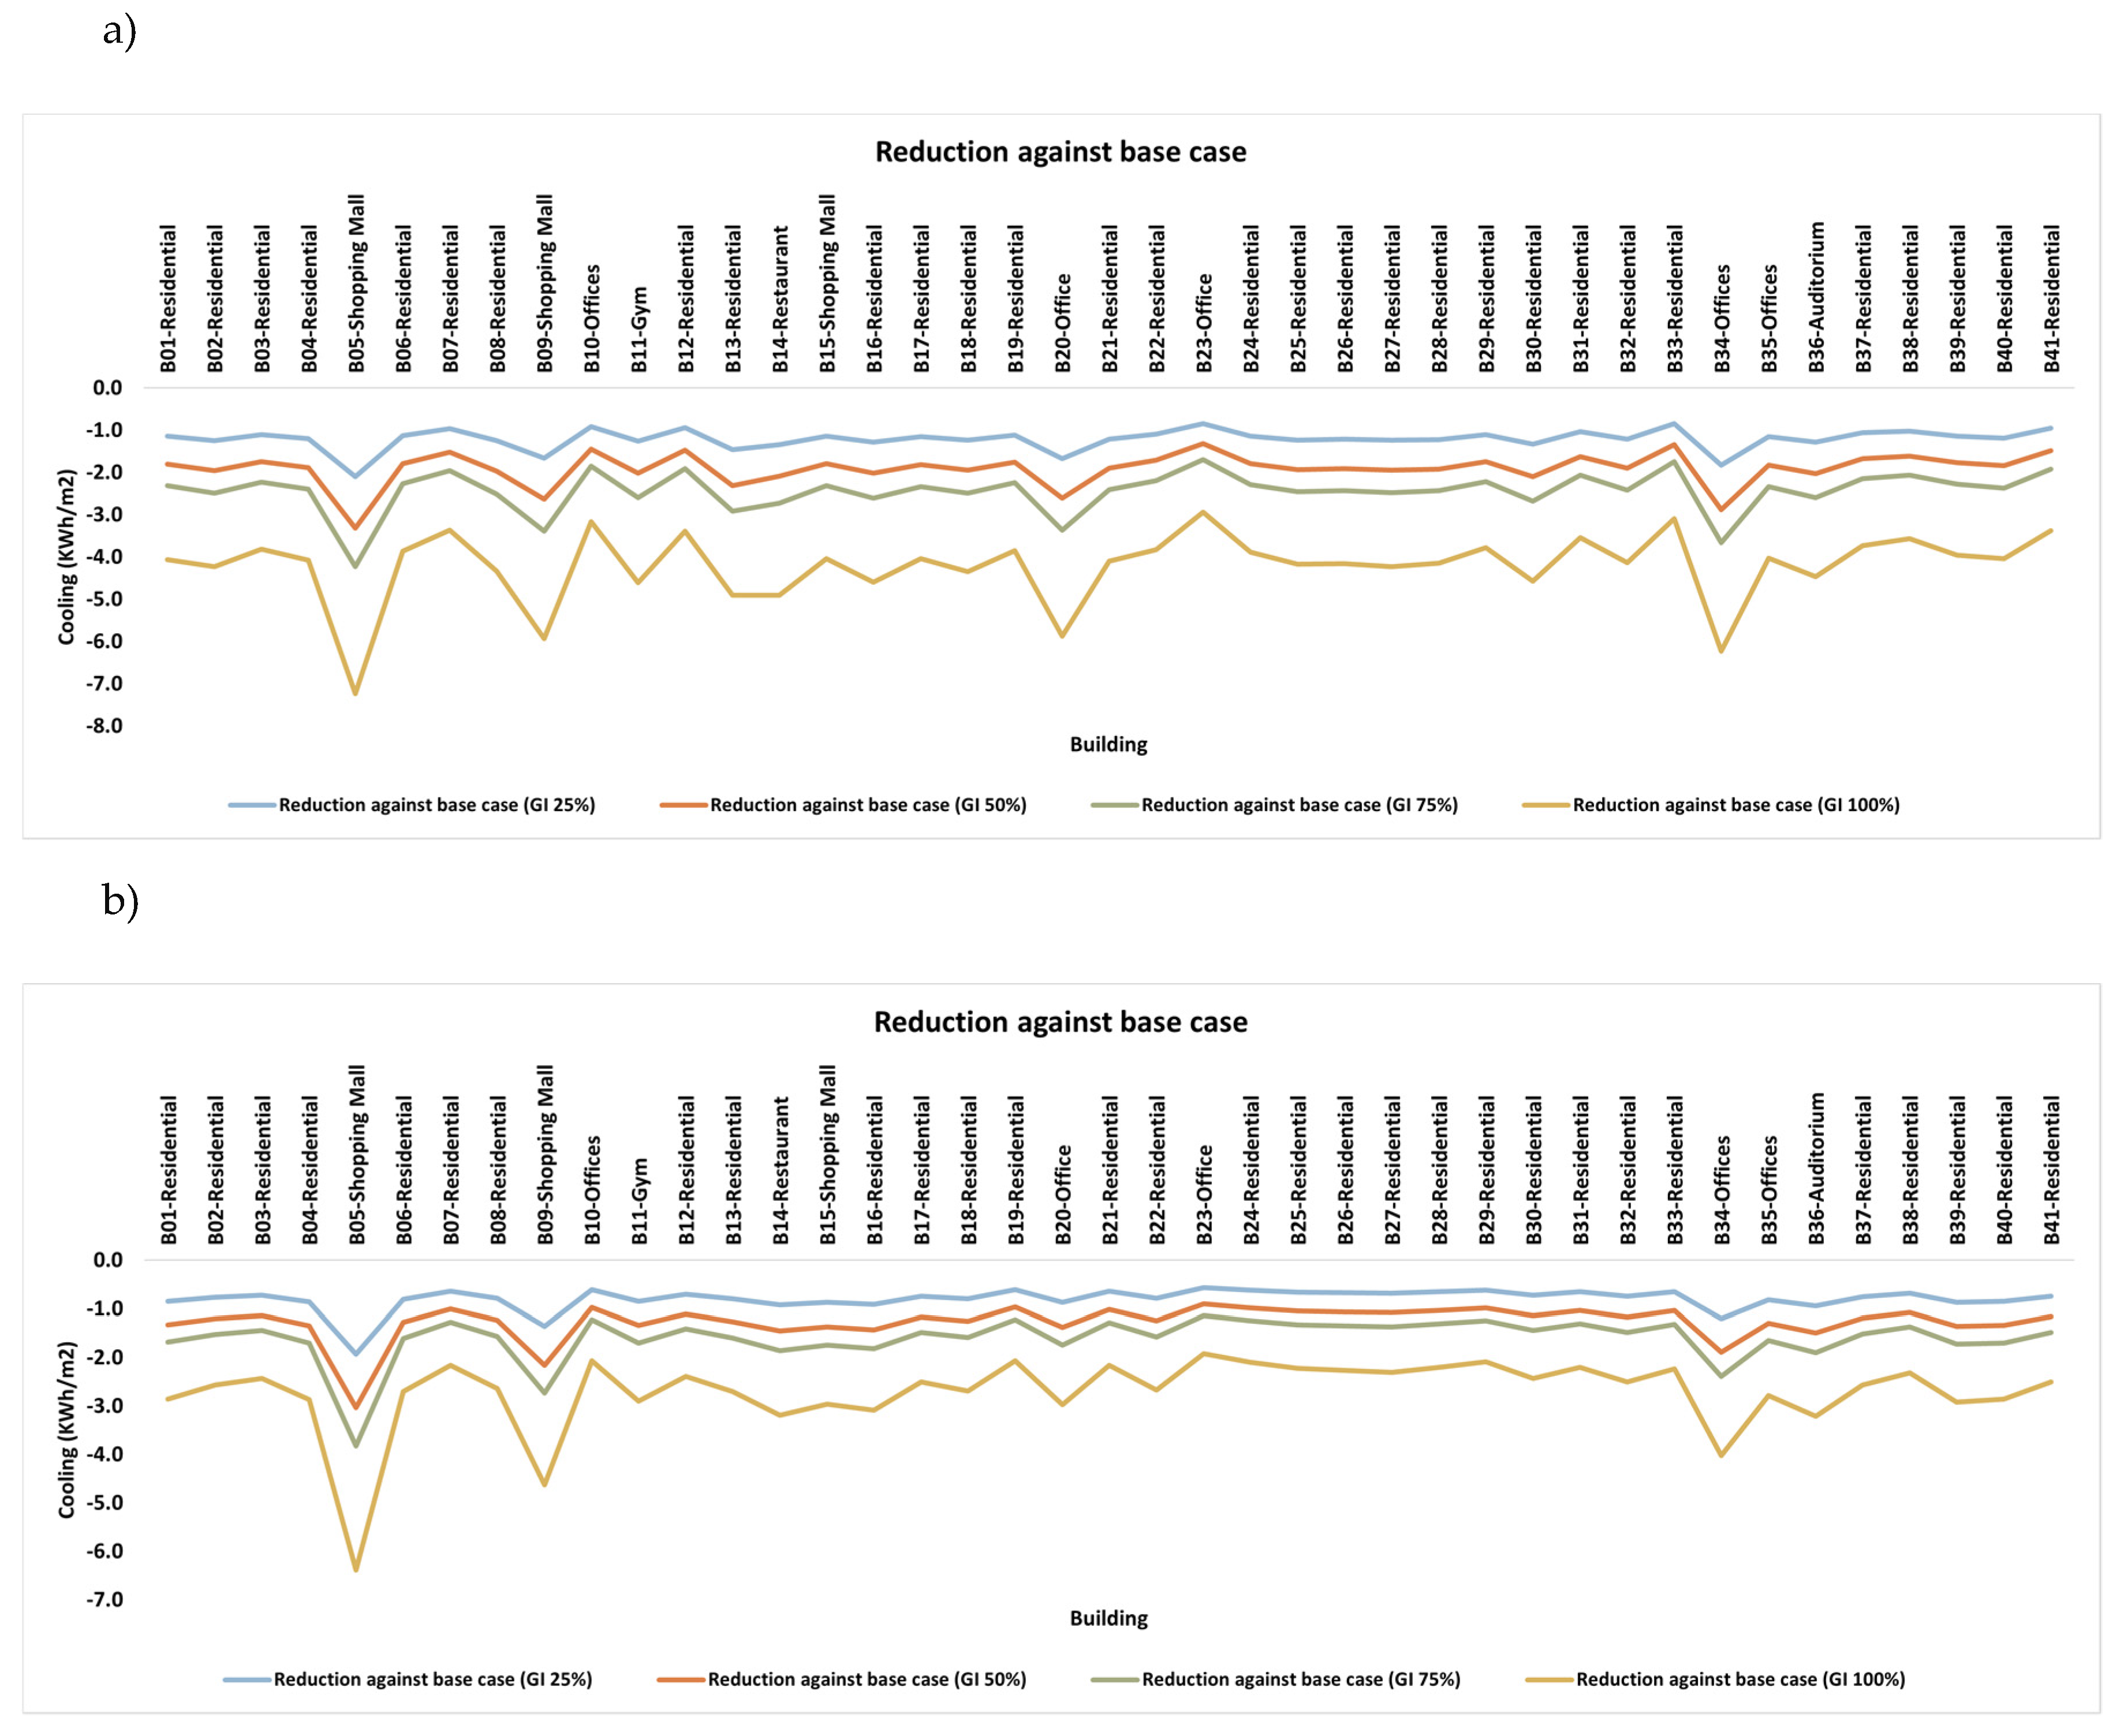
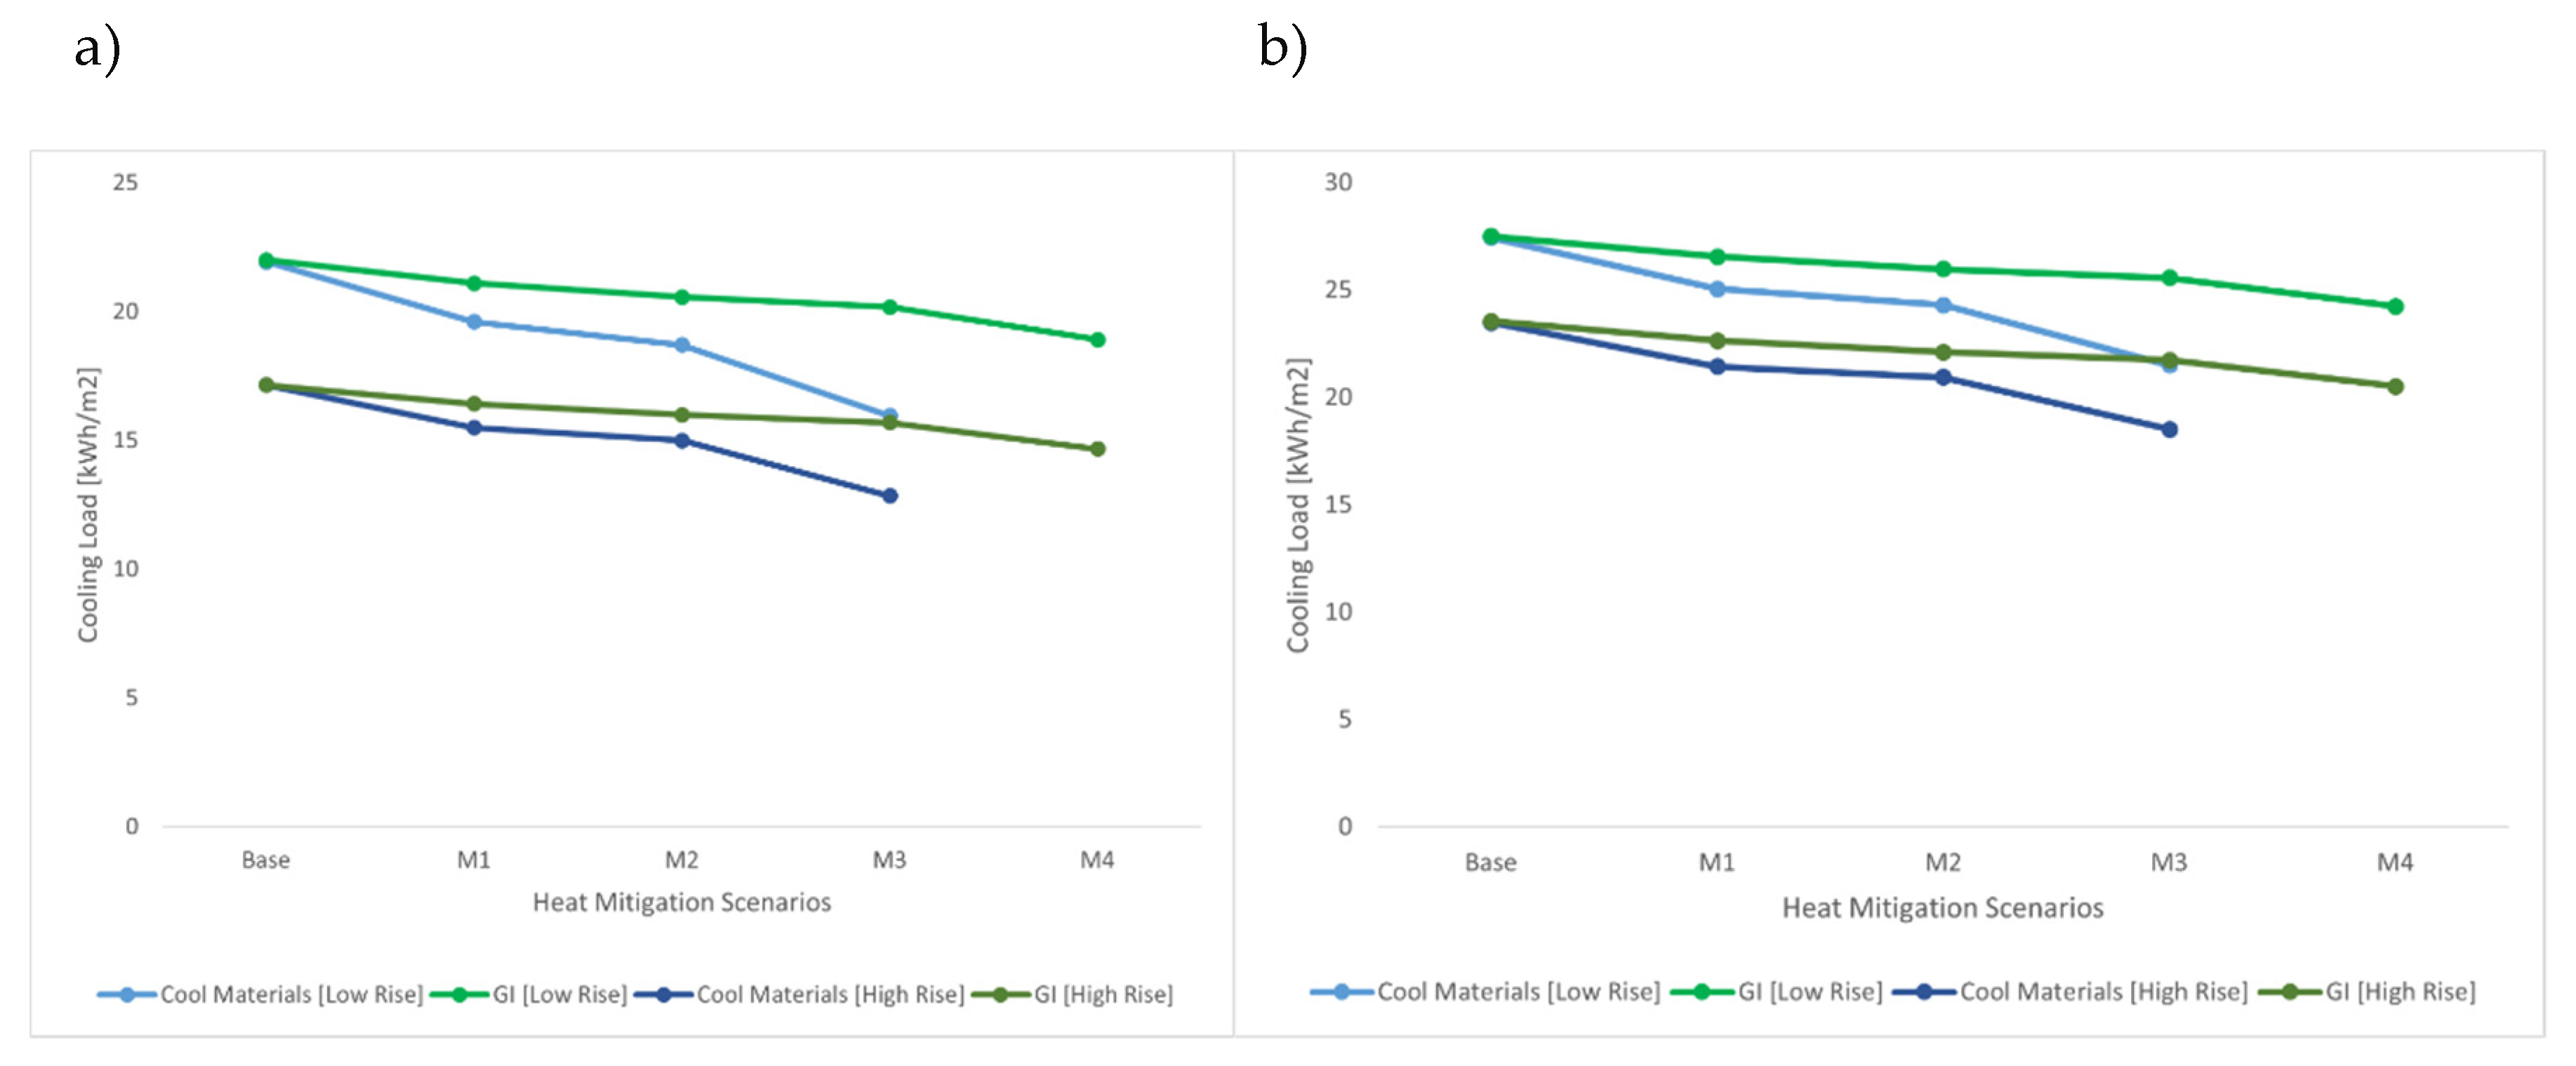
Insulated low-rise residential structures showed a cooling load of 22.01 kWh/m2 in the basic case, which decreased to 21.10 kWh/m2 , 20.57 kWh/m2, 20.18 kWh/m2 , and 18.92 kWh/m2 for the mitigation scenarios M1, M2, M3, and M4, respectively. On the other hand, cooling loads for high-rise buildings were observed to range from 13.72 to 20.58 kWh/m2 in the base case, which decreased to 13.10 to 19.74 kWh/m2 , 12.74 to 19.25 kWh/m2 , 12.48 to 18.90 kWh/m2 , and 17.73 to 11.62 kWh/m2 for mitigation scenarios M1, M2, M3, and M4, respectively. Urban areas could benefit from more vegetative patches by having fewer long-wave heat radiations emitted from the surface, which would further lower the ambient temperature and improve the thermal performance of buildings. For low-rise commercial buildings with insulation, the cooling load ranged from 16.06 to 38.97 kWh/m2 for the control case, and from 15.49 to 37.61 kWh/m2 , 15.16 to 36.81 kWh/m2 , 14.92 to 36.23 kWh/m2 , and 14.14 to 34.34 kWh/m2 for the four mitigation scenarios. As depicted in Figure 6, high-rise buildings, on the other hand, had cooling loads ranging from 16.02 to 31.08 kWh/m2 for the control case, 15.41 to 29.88 kWh/m2 for mitigation scenario M1, 15.05 to 29.19 kWh/m2 for mitigation scenario M2, 14.79 to 28.69 kWh/m2 for mitigation scenario M3, and 13.96 to 27.06 kWh/m2 for mitigation scenario M4. Building shape has a significant impact on how much cooling load is used. As a result of the inverse relationship between building height and cooling load requirements, high rise buildings, as opposed to low rise ones have significant reductions in cooling load [58]. Additionally, the results showed that the maximum cooling load reduction in the mitigation scenario corresponded to a 100% increase in GI since a greater amount of greenery would boost evapotranspiration, which lowers the ambient temperature [59]. For the mitigation scenarios M1, M2, M3, and M4, respectively, insulated buildings showed an average decrease of 4.11%, 6.49%, 8.23%, and 13.89%, whereas uninsulated buildings saw an average reduction of 3.89%, 6.12%, 7.84%, and 13.52%. In comparison to the control condition, Figure 7 shows the decrease in cooling load.
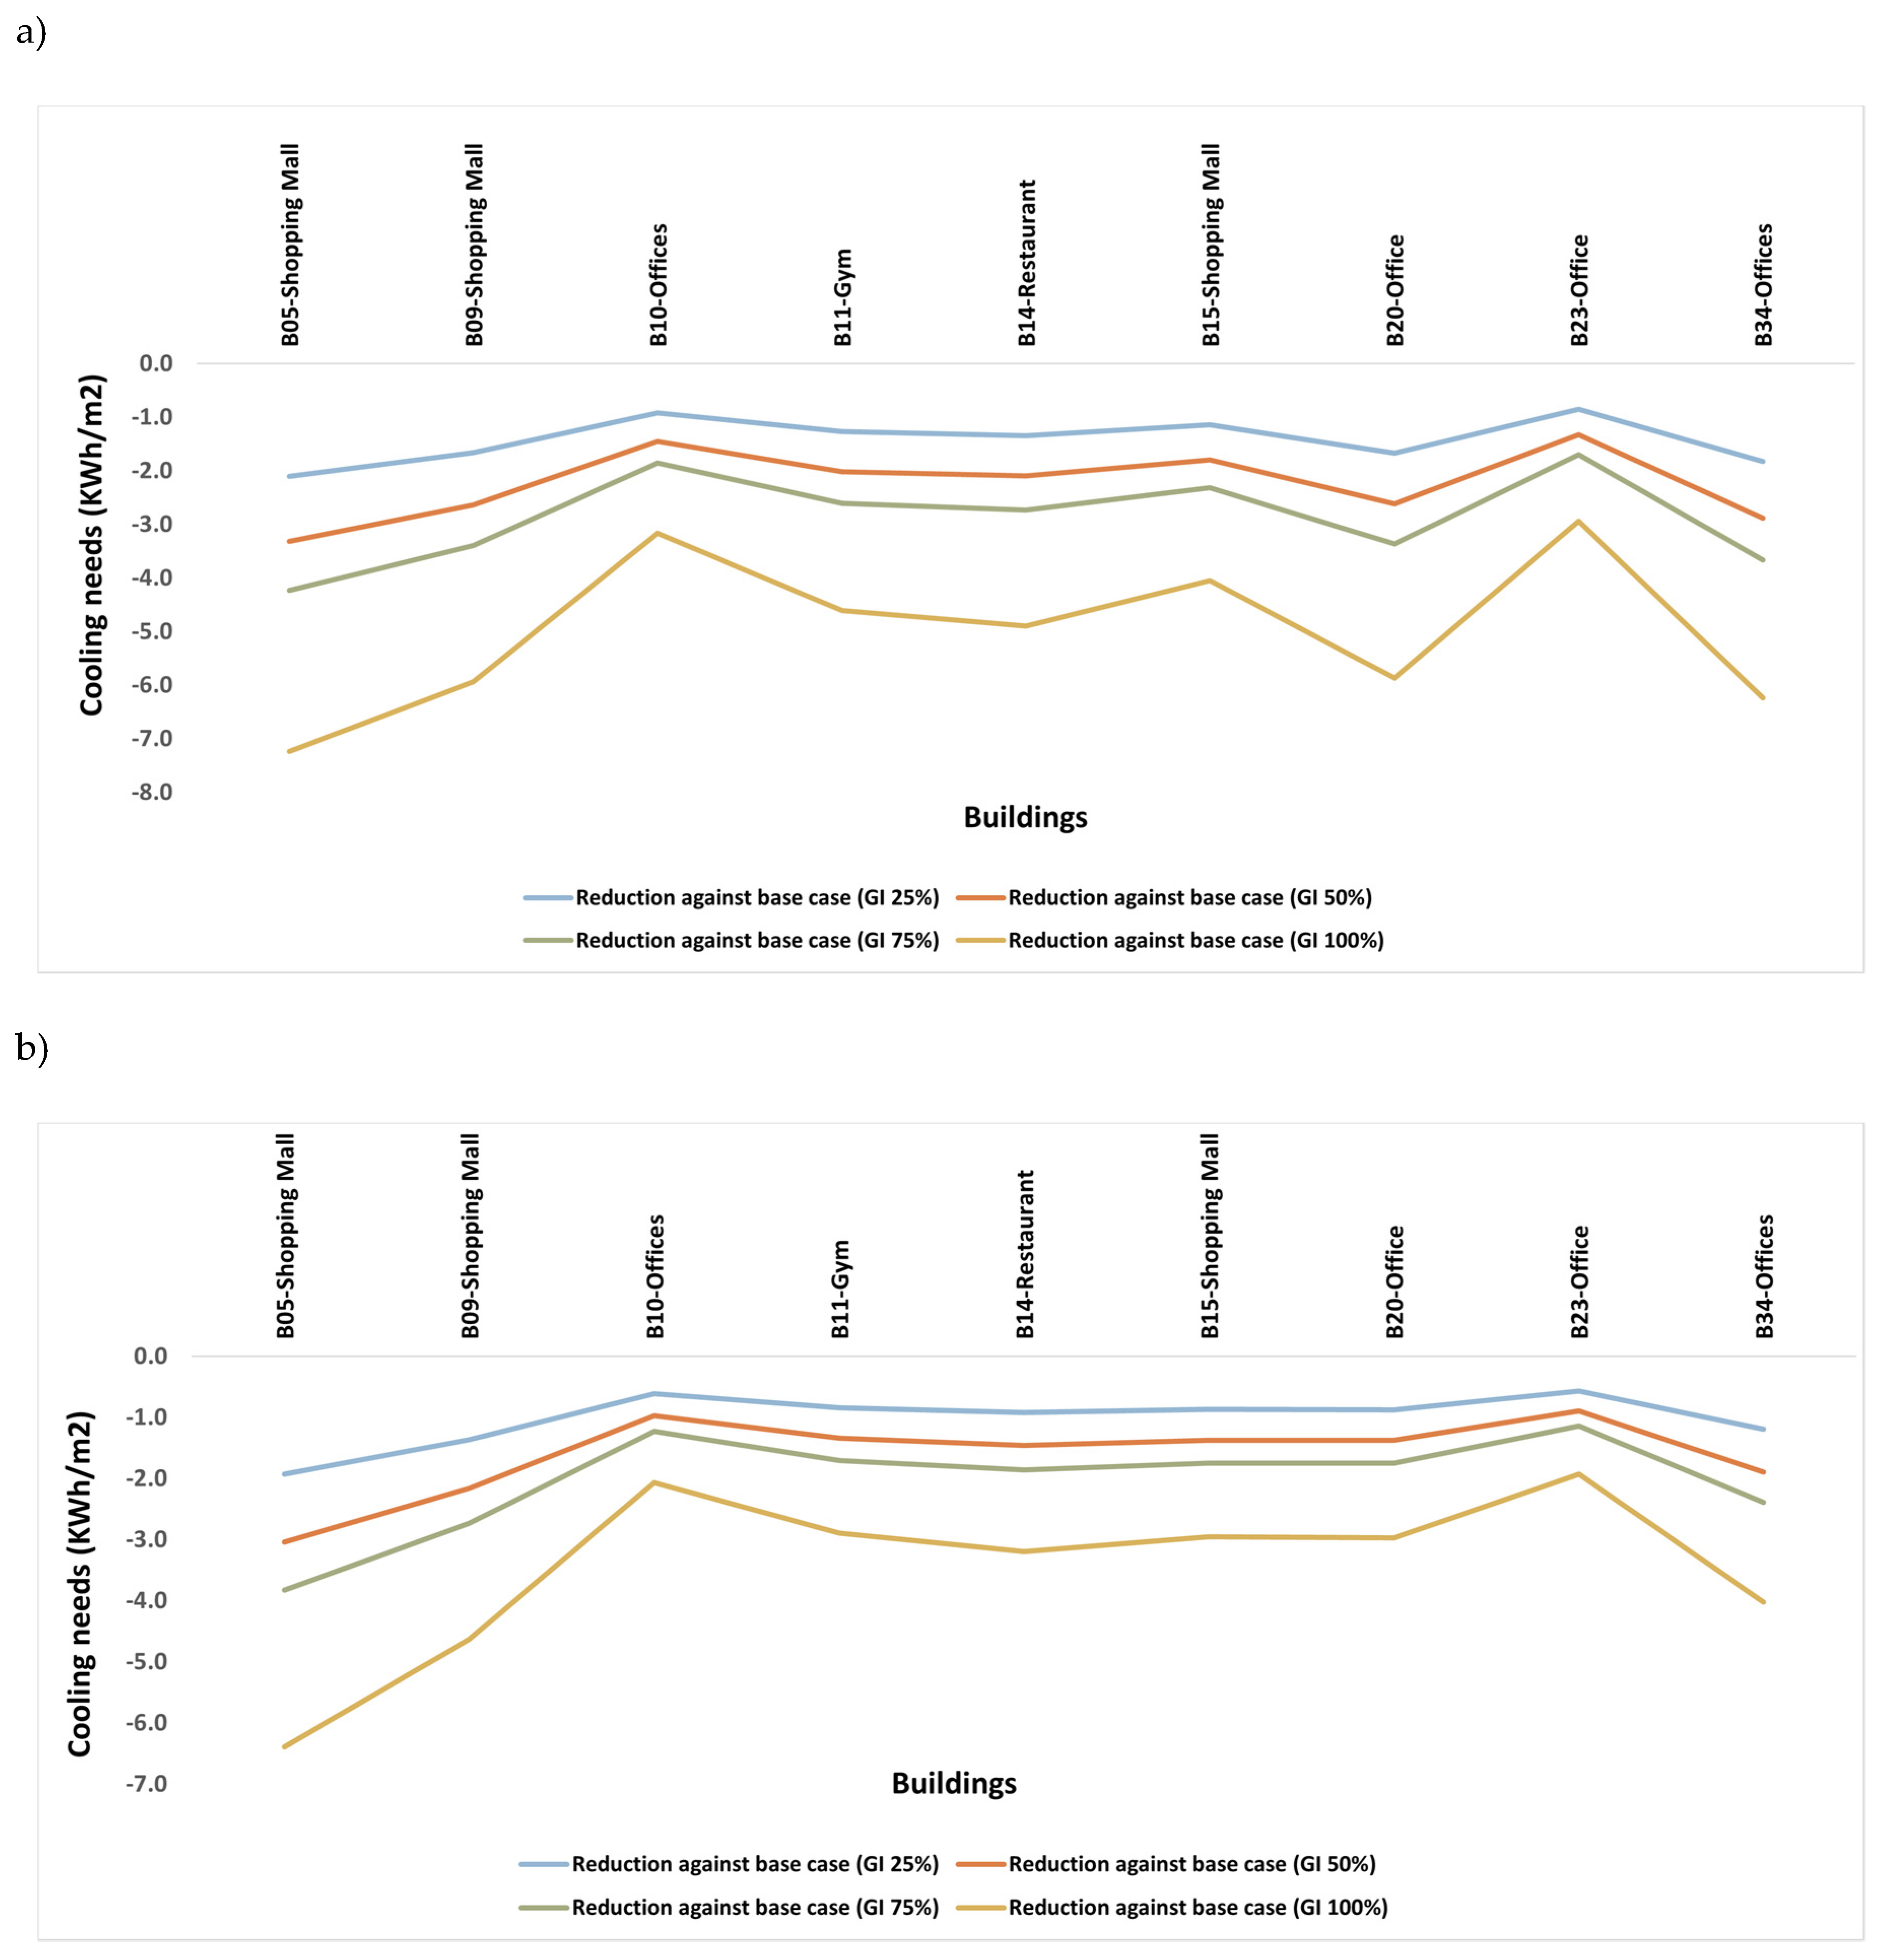
The reduction in cooling load for residential structures under various vegetation mitigation scenarios was shown in Figure 8. Low-rise buildings without insulation saw a decrease of 4.6 kWh/m2 , whereas high-rise buildings saw reductions ranging from 3.09 kWh/m2 to 4.91 kWh/m2 with the largest increase in GI, 100%. Similarly, insulation reduced energy use in buildings by 3.1 kWh/m2 for low-rise buildings and by 2.07 to 3.09 kWh/m2 for high-rise ones. In the case of noninsulated buildings, the cooling load reduction for commercial buildings, which corresponds to mitigation scenario M4, revealed a reduction value of between 2.94 and 7.24 kWh/m2 for low-rise structures and between 3.2 and 6.2 kWh/m2 for high-rise buildings. On the other hand, a decrease of 2.1 - 4 kWh/m2 for insulated high-rise structures and 1.92 - 6.39 kWh/m2 for insulated low-rise buildings. Figure 9 depicts the reduction in cooling load for commercial buildings under each scenario. It is important to take into account the fact that this study focused on the energy performance of both high- and low-rise structures with and without insulation. The study region might be viewed as a sample of Downtown Dubai, which is known for its hot and muggy climate.

5. Comparison of Cooling Benefits: Green Infrastructures and Cool Materials

The current study's findings were contrasted with those found in the literature, and comparisons were made. It has been found that comparable studies carried out by Tsoka et al. evaluated the impact of increasing urban greenery on cooling load reduction in urban city Thessaloniki, Greece, and found a reduction of 9% and 13% corresponding to the increase of vegetative fraction by 30% and 60% respectively [44]. In Rome and Milan, the two Italian cities, Barbera et al. reported an 8% and 11% reduction in cooling load in response to a 10% increase in vegetative area [60]. This is a lot higher than our results for the mitigation plan, which correspond to increases in vegetation of 25% and 50%, respectively, of 3.89% and 6.12%. It was found that an increase in tree cover in a subtropical region of Nanjing, China, might lead to a reduction in cooling demand of up to 15.2% [32]. Five million trees might be planted in Western Sydney, Australia, by 2050, which would reduce the cooling load requirements for homes, offices, and schools by 19.3%, 13.4%, and 19.0%, respectively [61].
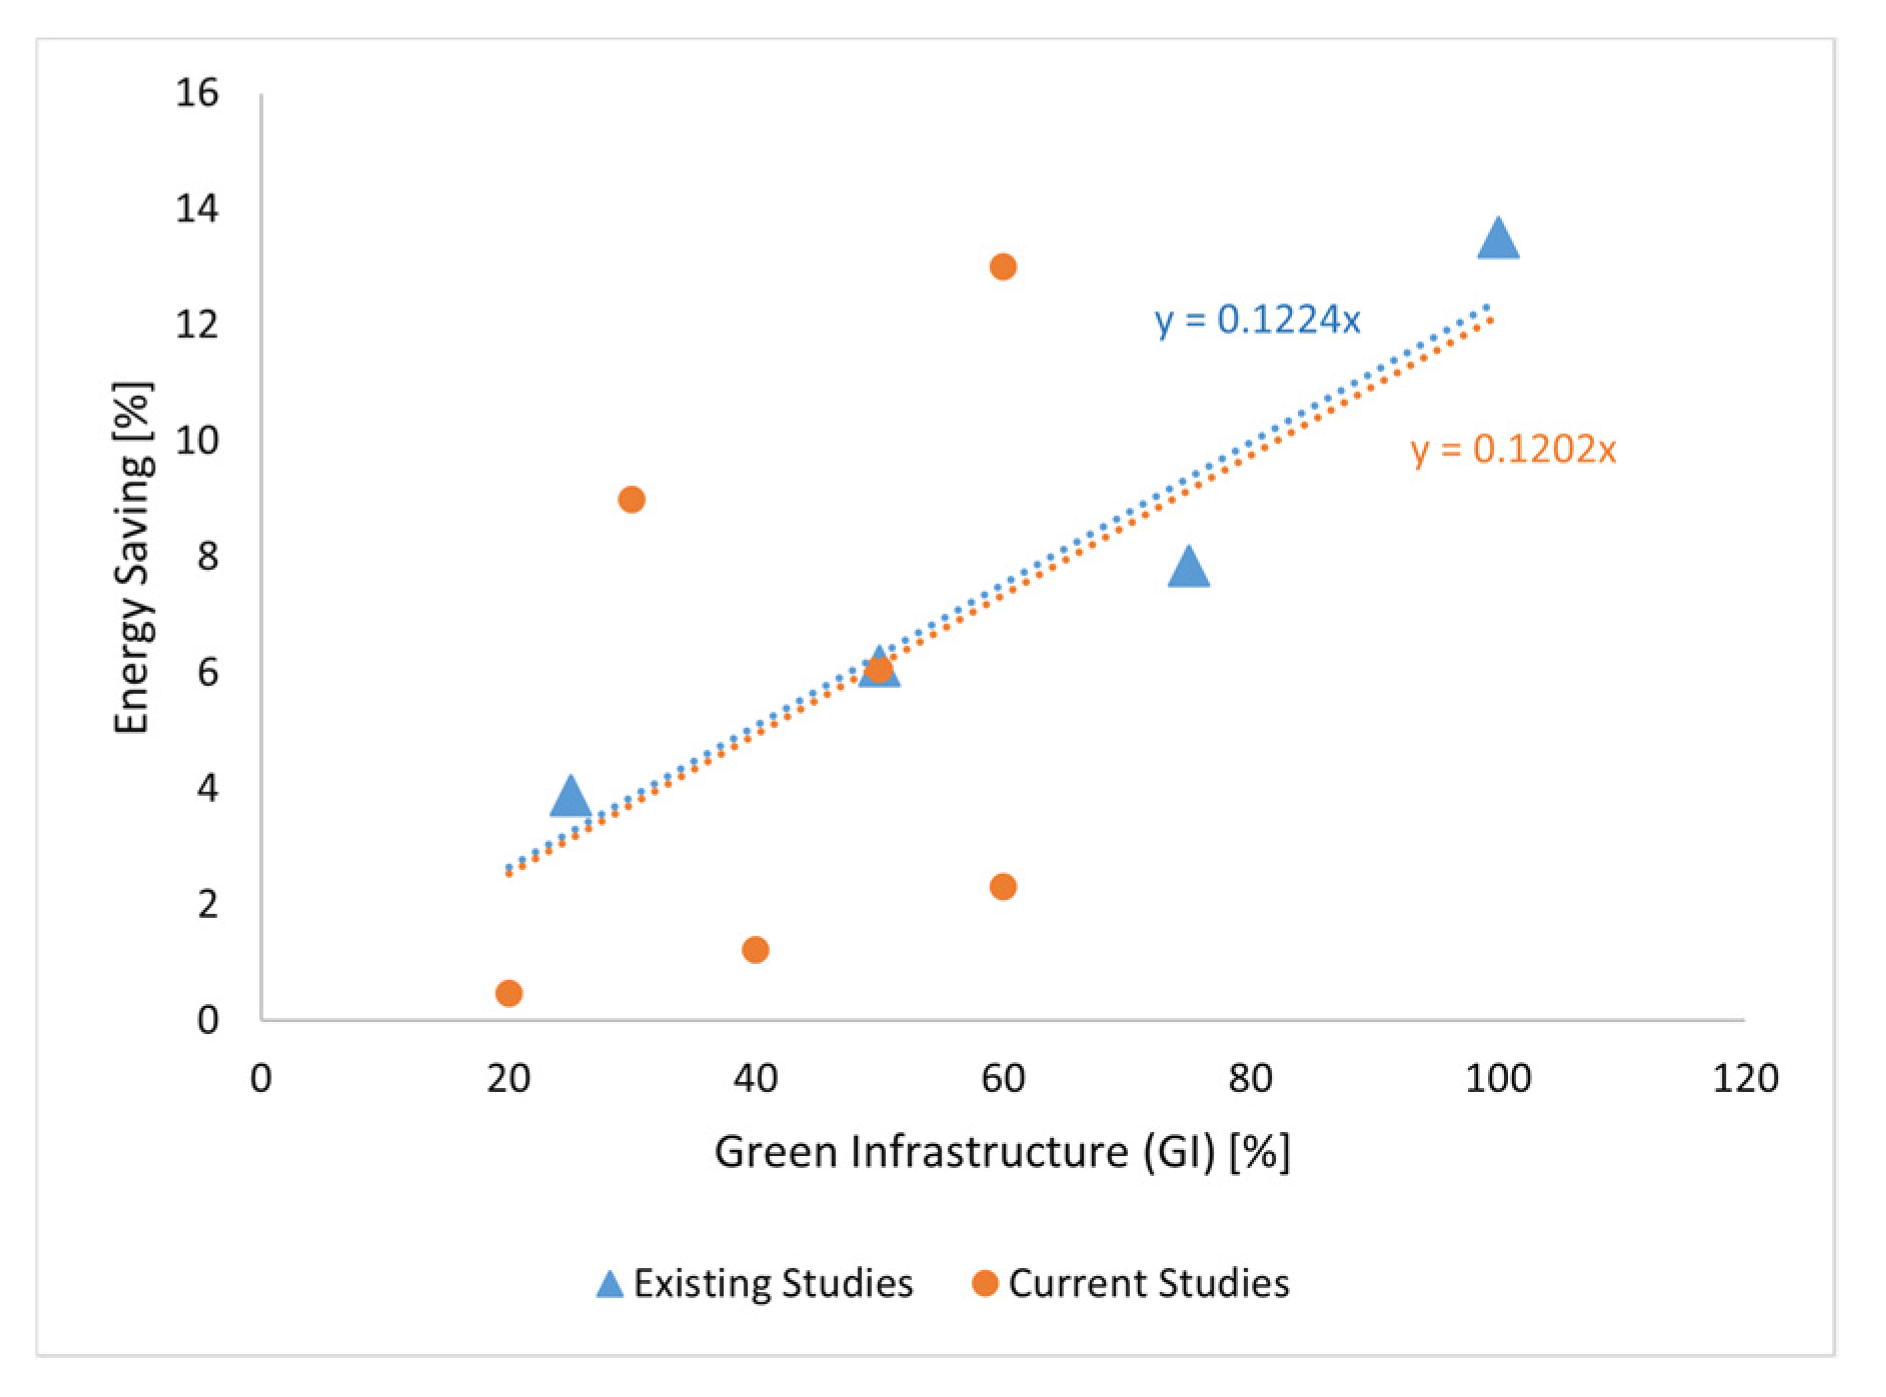
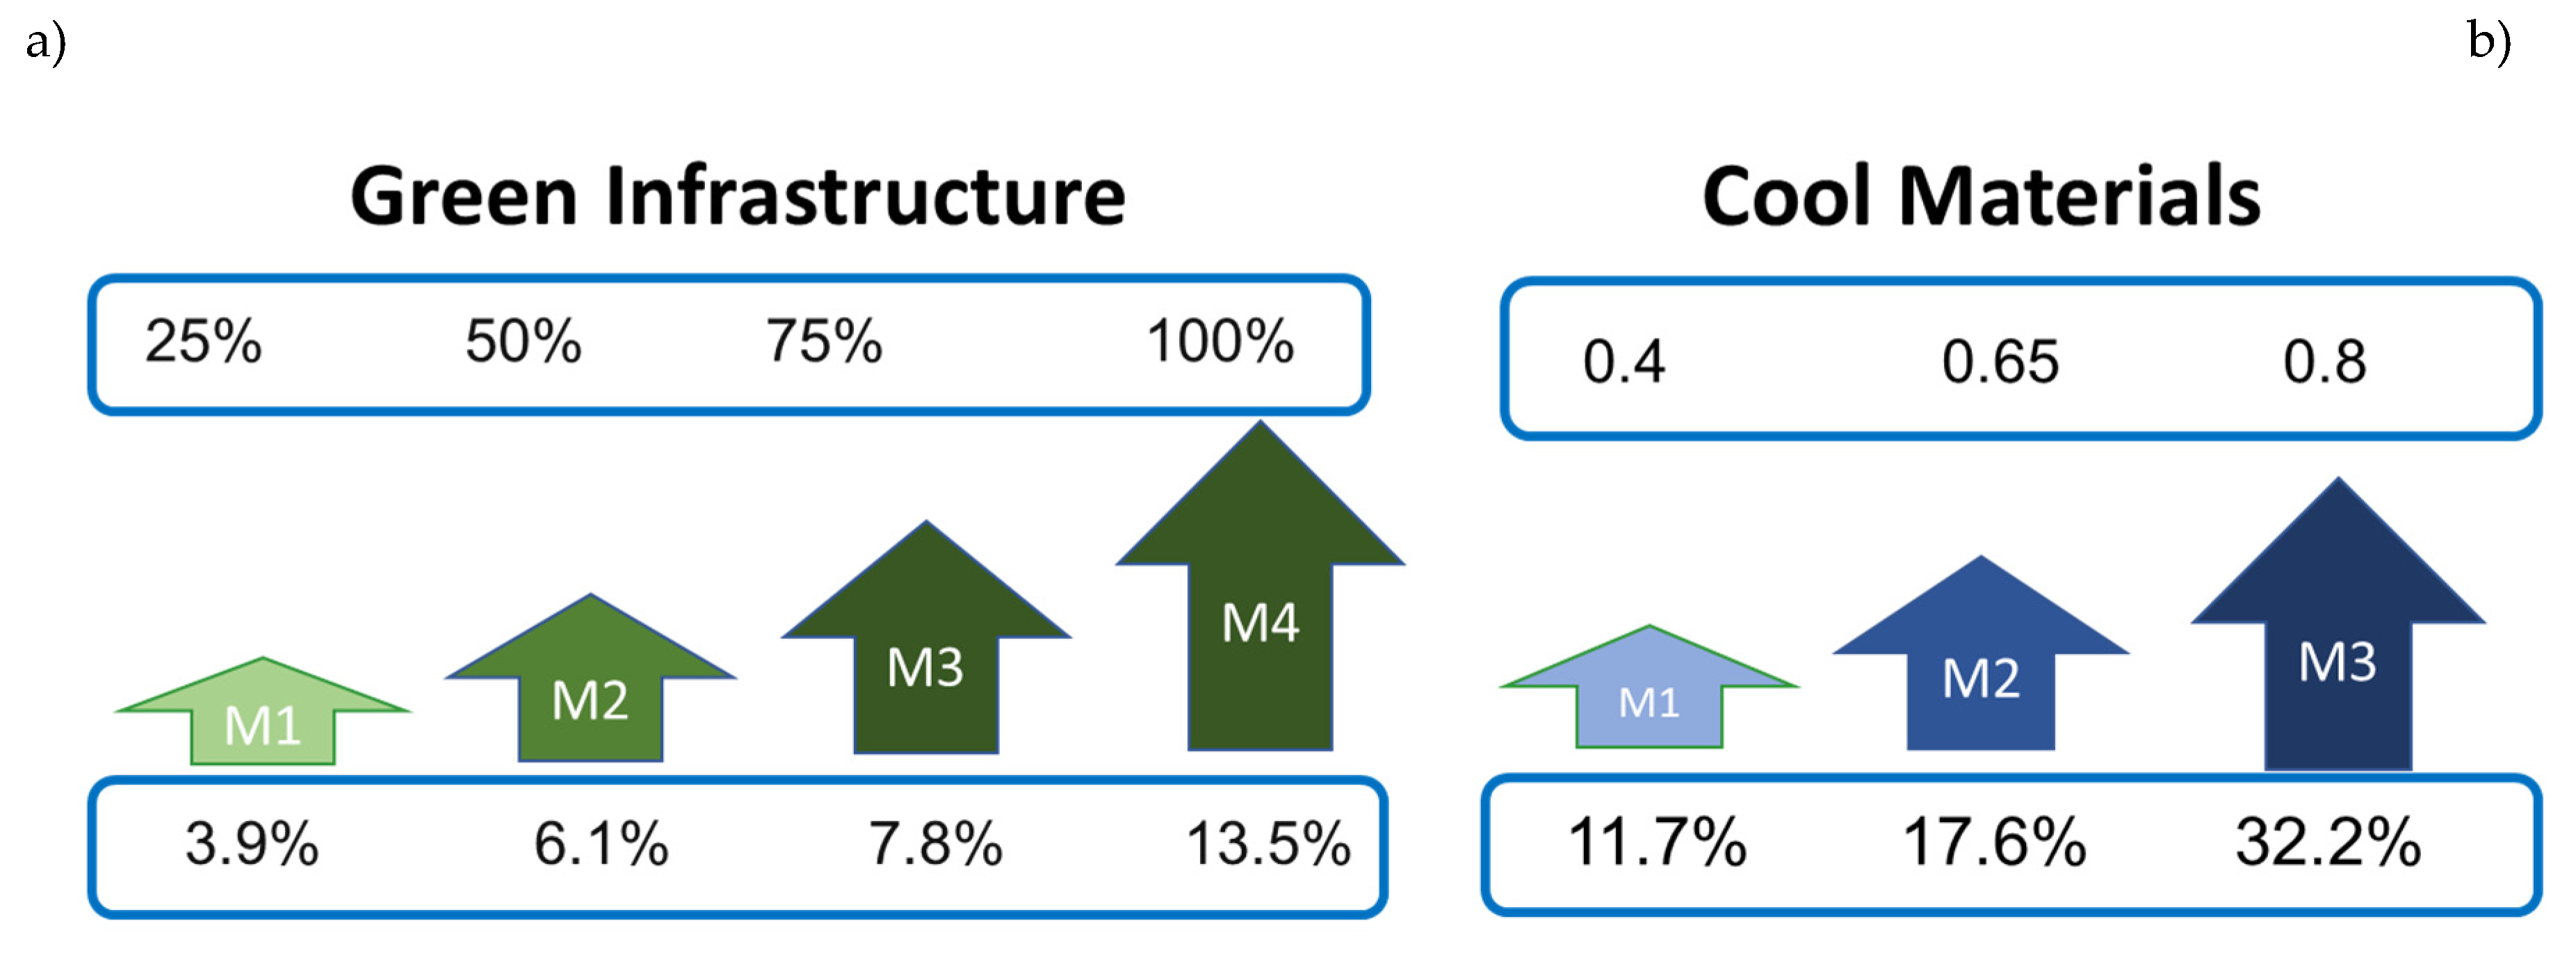
In Tel Aviv, Israel, Erell et al. looked at how different building types will be affected by increasing the greenery fraction. The cooling load for the various types of buildings may be decreased by between 5.04% and 6.06% with a 50% increase in plant cover, they found [62]. This reduction is nearly identical to the 6.12% decrease that was seen in our analysis for the mitigating scenario that corresponds to 50% greenery fraction. Santamouris et al. assessed the effects of mitigation strategies using enhanced albedo and vegetative fraction in Sydney, Australia, and proposed that increasing the urban greenery would result in a reduction of cooling load of 0.48%, 1.23%, and 2.31% for the enhanced vegetative fractions of 20%, 40%, and 60% respectively [63]. Comparing this decrease in cooling load demand to the decreases of 3.89% and 6.13% for mitigation scenarios M1 and M2, respectively, is a clear improvement. The difference in vegetation type, leaf area index (LAI), building morphology, indoor temperatures, and the local meteorological conditions may be the cause of the mismatch between the current literature and our results. In Figure 10, the contrast between the findings of the prior literature and our findings is represented visually. Slope, which measures the amount of cooling load demand that decreases for each 1% increase in greenery fraction, is approximately 0.1202% for the current study and 0.1224% for the body of previous literature. The two regression lines' slopes are nearly comparable, demonstrating a remarkable correlation between our findings and the available data. Results from the current study have also been compared to those from our prior study, in which changed albedo was used as a mitigation strategy for cooling energy demand with albedo fractions of 0.4 (M1), 0.65 (M2), and 0.8 (M3) in Dubai.
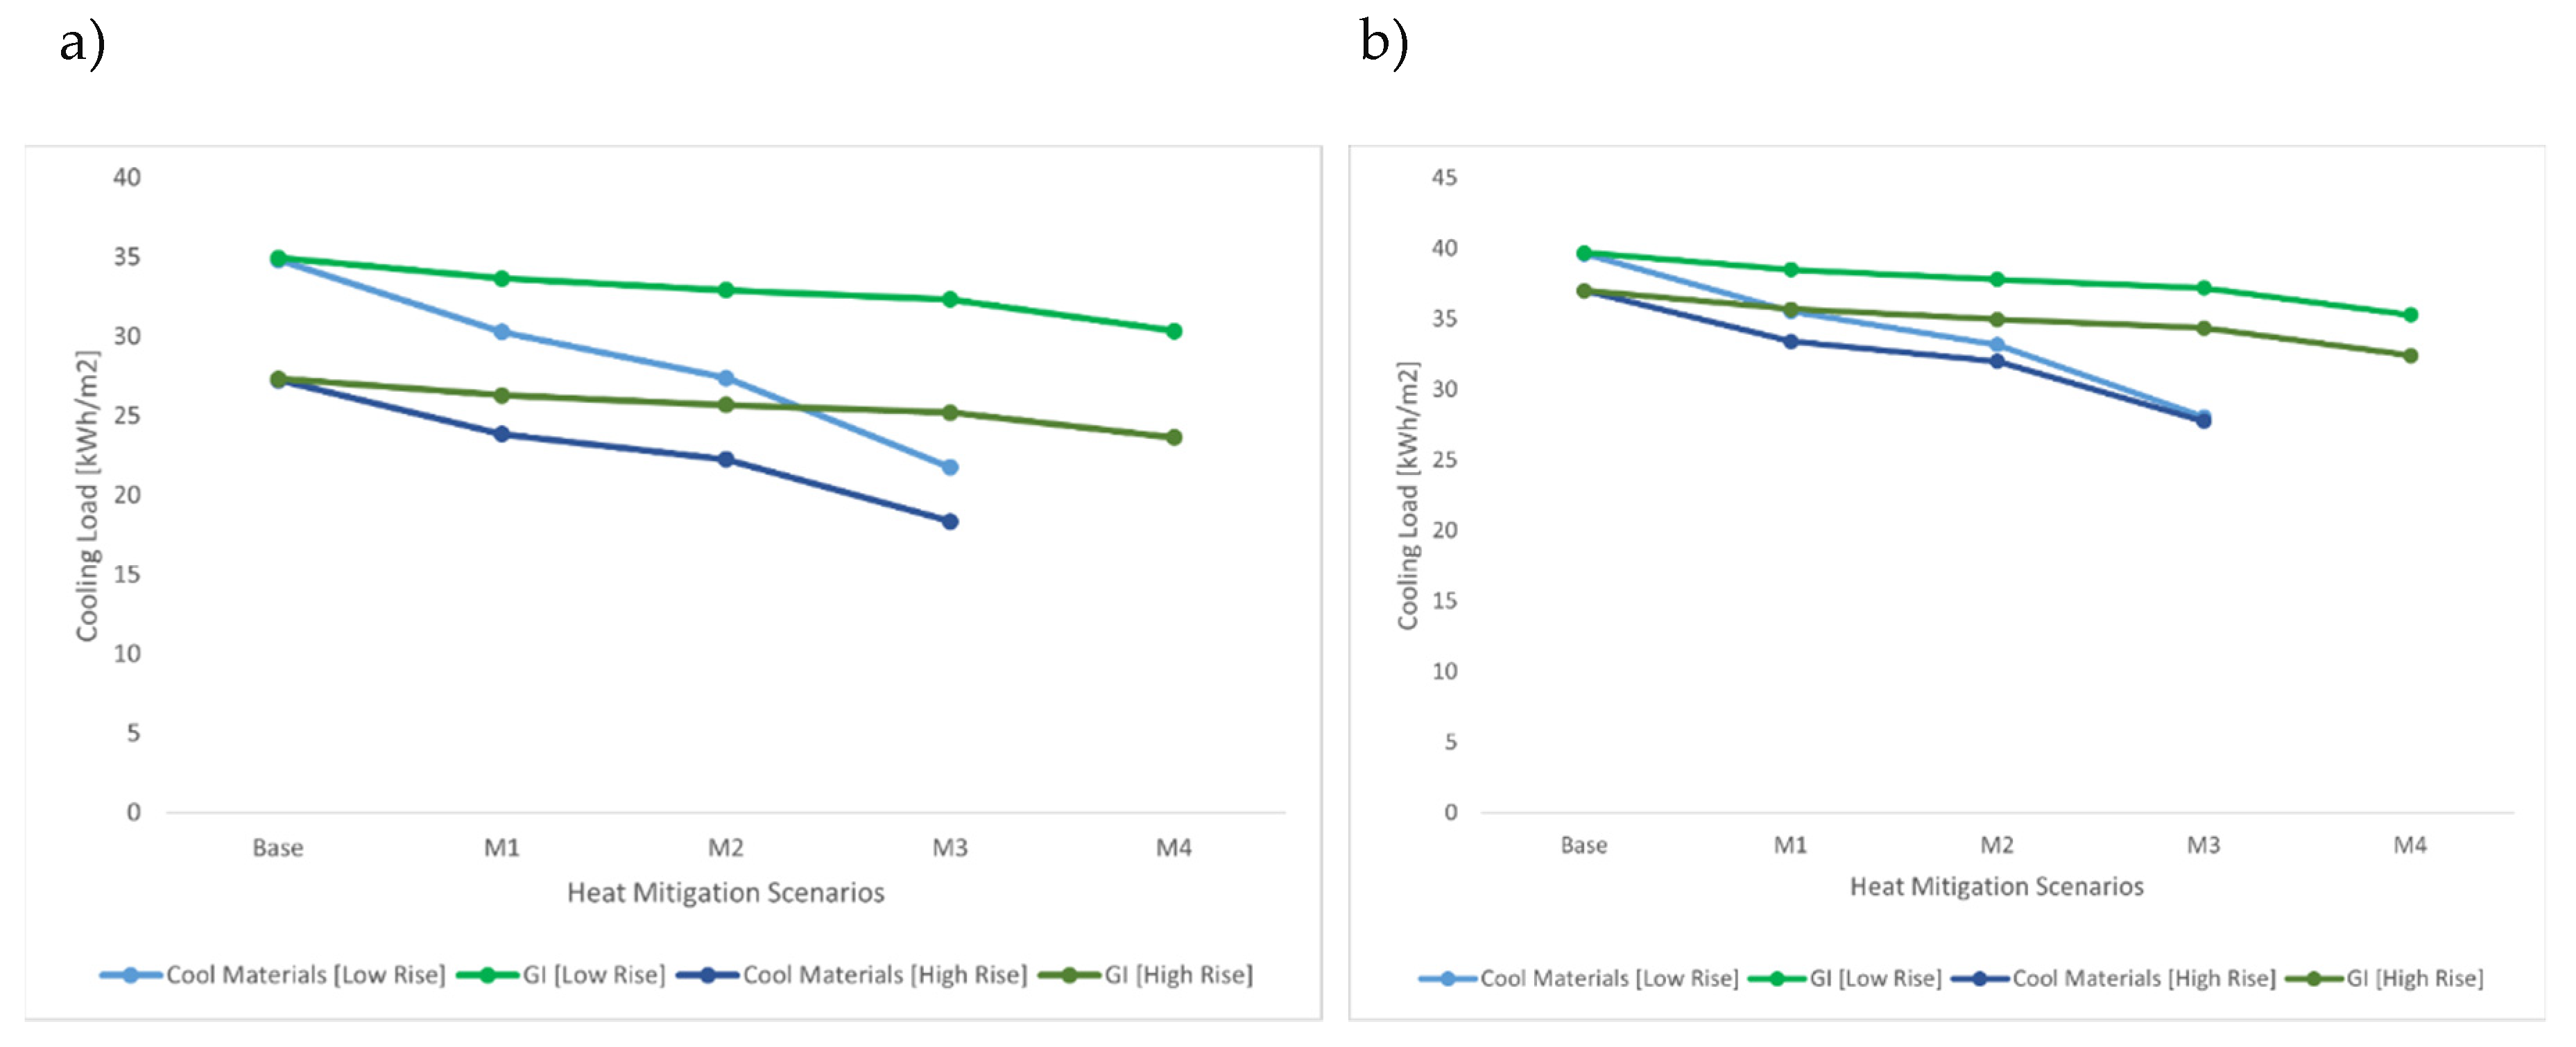
For the non-insulated lowrise residential buildings, it was found through investigation of both mitigation strategies that a cooling load similar to 34.9 kWh/m2 was seen in the base case. This cooling demand was lowered to a maximum of 21.7 kWh/m2 for mitigation scenario M3 in the sake of modified albedo and to 30.4 kWh/m2 for mitigation scenario M4 in the event of enhanced vegetation infrastructure. Similar results were found for non-insulated high-rise structures, which had cooling loads between 23 and 31.5 kWh/m2 in the base case, but between 15.1 and 21.6 kWh/m2 in the albedo mitigation scenario M3 and between 19.8 and 27.5 kWh/m2 in the greenery mitigation scenario M4. The results of the simulations for the commercial buildings pointed to a similar pattern, with non-insulated low-rise structures in both cases having a cooling load of about 25 to 53 kWh/m2 , which decreased to a maximum of 17.3 to 38.8 kWh/m2 corresponding to the mitigation scenario M3 for cool materials and 22.7 to 47.9 kWh/m2 for additional greenery scenario M4. High-rise buildings, on the other hand, had cooling loads that ranged from 25 to 48 kWh/m2 in the base case but dropped to 18.4 to 37 kWh/m2 and 22.3 to 42.6 kWh/m2 in albedo mitigation scenario M3 and GI mitigation scenario M4, respectively. Figure 11 shows the comparison findings for the non-insulated residential and commercial structures. When the results were examined, it became clear that insulated buildings had a lower overall cooling burden than non-insulated ones. Low-rise residential structures had cooling loads of about 22 kWh/m2 under the unmitigated scenario, which decreased to 16 kWh/m2 under the modified albedo scenario M3 and to 18.92 kWh/m2 in the enhanced GI scenario M4. Similar high-rise residential structures displayed cooling loads of 13 to 20 kWh/m2 in the base case, which decreased to 10.1 to 15.6 kWh/m2 for the M3 mitigation scenario of improved albedo and to 11.6 to 17.7 15.6 kWh/m2 for the M4 mitigation scenario corresponding to increased GI. Insulated commercial buildings, on the other hand, saw a similar pattern, with low rise buildings having a base case cooling load ranging from 16 to 38.9 kWh/m2, a mitigated cooling load of 30.7 kWh/m2 to 12.3 kWh/m2 , and a range of 14.9 to 36.2 kWh/m2 for a mitigation scenario involving a 100% increase in vegetation. Commercial high-rise structures displayed a control case cooling load of approximately 16–31 kWh/m2 , which was measured as 12.4–24.6 kWh/m2 for an albedo percentage of 0.65 and 14–27 kWh/m2 for GI100%.In comparison to the analogous scenario for more vegetation, other mitigating strategies for cool materials also have a reduced cooling burden.
In Figure 12, the comparison findings for insulated residential and commercial structures are shown. Overall, the average cooling load reduction for non-insulated buildings was found to be 11.7%, 17.6%, and 32.2% for the increased albedo fractions of 0.4, 0.65, and 0.8, respectively. As shown in Figure 13, a reduction of 3.9%, 6.1%, 7.8%, and 13.5% was noted for the enhanced vegetation corresponding to M1, M2, M3, and M4. The three changed albedo scenarios, however, showed a cooling load reduction of 9.3%, 12.5%, and 24.3% for insulated structures, respectively. Similar results were obtained by increasing the vegetative fraction to 25%, 50%, 75%, and 100%, which, as shown in Figure 14, decreased the average cooling load by 4.1%, 6.5%, 8.2%, and 13.9%, respectively.
A comparison of energy performance simulation results revealed that both improved albedo and higher GI had an important role in efficiently reducing cooling load needs. However, the use of cool materials proved beneficial because they produce a much higher reduction in cooling load demand when compared to additional GI because they offer high reflectance of solar radiations back to the atmosphere and reduce the amount of heat absorbed by the building materials. In contrast, the cooling load produced by greater vegetation is due to increased evaporation, which lowers the ambient temperature and increases the latent heat flux. In addition, the shadowing function of plants prevents heat storage in the urban built environment. The cooling energy demand is also affected by other building factors such as window-to-wall ratio, height, orientation, and building shapes. For example, high-rise buildings in both mitigation scenarios had a substantially lower cooling burden than the similar low-rise buildings in Dubai Downtown.

6. Conclusion

Climate change and global warming have significantly increased the amount of energy needed to cool buildings. GI, such as trees, shrubs, and green roofs, provide natural shading, reducing direct exposure to sunlight and lowering ambient temperatures. This shade can significantly reduce the cooling load on buildings and decrease the need for air conditioning, resulting in energy savings. Vegetation in GI releases moisture through a process called evapotranspiration. This evaporation cools the surrounding air, creating a microclimate with lower temperatures. As a result, buildings near GI experience decreased heat absorption and improved thermal comfort. GI helps mitigate this effect by absorbing and dissipating heat. Trees and vegetation act as natural air conditioners, reducing overall urban temperatures and relieving the strain on cooling systems. The effectiveness of expanding urban greenery on lowering cooling load demand for high- and low-rise, commercial and residential structures in Dubai Downtown has been investigated using simulations of the behaviour of a range of buildings. The simulations were run using the weather information provided by WRF to CitySim. The energy demand for the 40 buildings was significantly reduced in July 2019 according to the results of an energy simulation that increased the vegetation portion from 25% to 100%. In fact, for the insulated structures, the maximum average reduction of 13.89% was found to correlate to a 100% increase in the greenery fraction. The simulation results for mitigation scenario M4 (100% vegetation fractions) showed a reduction of 4.6 and 3.1 kWh/m2 for non-insulated and insulated low-rise residential buildings, respectively, and a reduction of 3.09 to 4.91 kWh/m2 for non-insulated and 2.07 to 3.09 kWh/m2 for insulated high-rise structures. Overall, it is clear from the results that regardless of the kind, material, and form of the buildings, an increase in plant cover might greatly reduce the urban heat. The degree of cooling load decrease can be affected by factors including synoptic meteorological conditions, type of vegetation, building characteristics, and other urban aspects. When combined with insulation, improved urban greenery is more efficient. The data also revealed a strong correspondence between this study's conclusions and those of other similar investigations. Better urban planning and architecture could also help to cut down on the amount of energy needed for cooling. A mitigation plan was now added to the list of potential remedies that policymakers could use to combat climate change and urban heating as a result of this study.

Author Contributions

The study has been contributed by all authors. Methods and Material, data collection and analysis were conducted by A.M.; and A.K.; M.S.; administered and supervised the project. H.S.; prepared the data file. Final manuscript has been reviewed and approved by all authors.

Funding

This research received no external funding.

Acknowledgments

All authors are grateful to the UAE National Center of Meteorology (NCM) for providing the data used in this study.

Conflicts of Interest

The authors declare no conflict of interest.

References

  1. Yu, C.; Hien, W.N. Thermal benefits of city parks. Energy and buildings 2006, 38, 105–120. [Google Scholar] [CrossRef]
  2. Santamouris, M. Recent progress on urban overheating and heat island research. Integrated assessment of the energy, environmental, vulnerability and health impact. Synergies with the global climate change. Energy and Buildings 2020, 207, 109482. [Google Scholar] [CrossRef]
  3. Santamouris, M. Cooling the buildings–past, present and future. Energy and Buildings 2016, 128, 617–638. [Google Scholar] [CrossRef]
  4. Kolokotroni, M.; Ren, X.; Davies, M.; Mavrogianni, A. London's urban heat island: Impact on current and future energy consumption in office buildings. Energy and buildings 2012, 47, 302–311. [Google Scholar] [CrossRef]
  5. Santamouris, M.; Cartalis, C.; Synnefa, A.; Kolokotsa, D. On the impact of urban heat island and global warming on the power demand and electricity consumption of buildings—A review. Energy and buildings 2015, 98, 119–124. [Google Scholar] [CrossRef]
  6. Santamouris, M.; Papanikolaou, N.; Livada, I.; Koronakis, I.; Georgakis, C.; Argiriou, A.; Assimakopoulos, D. On the impact of urban climate on the energy consumption of buildings. Solar energy 2001, 70, 201–216. [Google Scholar] [CrossRef]
  7. Zheng, Y.; Weng, Q. Modeling the effect of climate change on building energy demand in Los Angeles county by using a GIS-based high spatial-and temporal-resolution approach. Energy 2019, 176, 641–655. [Google Scholar] [CrossRef]
  8. Santamouris, M. On the energy impact of urban heat island and global warming on buildings. Energy and Buildings 2014, 82, 100–113. [Google Scholar] [CrossRef]
  9. Lipson, M.J.; Thatcher, M.; Hart, M.A.; Pitman, A.J.E.R.L. Climate change impact on energy demand in building-urban-atmosphere simulations through the 21st century. 2019, 14, 125014. [CrossRef]
  10. Bilardo, M.; Ferrara, M.; Fabrizio, E. Resilient optimal design of multi-family buildings in future climate scenarios. In Proceedings of E3S Web of Conferences; p. 06006. [CrossRef]
  11. Akbari, H.; Cartalis, C.; Kolokotsa, D.; Muscio, A.; Pisello, A.L.; Rossi, F.; Santamouris, M.; Synnefa, A.; Wong, N.H.; Zinzi, M. Local climate change and urban heat island mitigation techniques–the state of the art. Journal of Civil Engineering Management 2016, 22, 1–16. [Google Scholar] [CrossRef]
  12. Pisello, A.L.; Saliari, M.; Vasilakopoulou, K.; Hadad, S.; Santamouris, M. Facing the urban overheating: Recent developments. Mitigation potential and sensitivity of the main technologies. Wiley Interdisciplinary Reviews: Energy and Environment 2018, 7, e294. [Google Scholar] [CrossRef]
  13. Santamouris, M.; Vasilakopoulou, K. Recent progress on urban heat mitigation technologies. Science Talks 2022, 100105. [Google Scholar] [CrossRef]
  14. O’Malley, C.; Piroozfar, P.; Farr, E.R.; Pomponi, F. Urban Heat Island (UHI) mitigating strategies: A case-based comparative analysis. Sustainable cities and society 2015, 19, 222–235. [Google Scholar] [CrossRef]
  15. Loughner, C.P.; Allen, D.J.; Zhang, D.-L.; Pickering, K.E.; Dickerson, R.R.; Landry, L. Roles of urban tree canopy and buildings in urban heat island effects: Parameterization and preliminary results. Journal of Applied Meteorology and Climatology 2012, 51, 1775–1793. [Google Scholar] [CrossRef]
  16. Jacobs, S.J.; Gallant, A.J.; Tapper, N.J.; Li, D. Use of cool roofs and vegetation to mitigate urban heat and improve human thermal stress in Melbourne, Australia. Journal of Applied Meteorology and Climatology 2018, 57, 1747–1764. [Google Scholar] [CrossRef]
  17. Coutts, A.M.; White, E.C.; Tapper, N.J.; Beringer, J.; Livesley, S.J. Temperature and human thermal comfort effects of street trees across three contrasting street canyon environments. Theoretical and applied climatology 2016, 124, 55–68. [Google Scholar] [CrossRef]
  18. Santamouris, M.; Osmond, P. Increasing Green Infrastructure in Cities-Impact on Ambient Temperature. Air Quality Heat Related Mortality Morbidity Buildi 2020, 10, 233. [Google Scholar] [CrossRef]
  19. Santamouris, M. Cooling the cities–a review of reflective and green roof mitigation technologies to fight heat island and improve comfort in urban environments. Solar energy 2014, 103, 682–703. [Google Scholar] [CrossRef]
  20. Santamouris, M.; Ding, L.; Fiorito, F.; Oldfield, P.; Osmond, P.; Paolini, R.; Prasad, D.; Synnefa, A. Passive and active cooling for the outdoor built environment–Analysis and assessment of the cooling potential of mitigation technologies using performance data from 220 large scale projects. Solar Energy 2017, 154, 14–33. [Google Scholar] [CrossRef]
  21. Haddad, S.; Paolini, R.; Ulpiani, G.; Synnefa, A.; Hatvani-Kovacs, G.; Garshasbi, S.; Fox, J.; Vasilakopoulou, K.; Nield, L.; Santamouris, M. Holistic approach to assess co-benefits of local climate mitigation in a hot humid region of Australia. Scientific Reports 2020, 10, 14216. [Google Scholar] [CrossRef]
  22. Khan, H.S.; Paolini, R.; Caccetta, P.; Santamouris, M. On the combined impact of local, regional, and global climatic changes on the urban energy performance and indoor thermal comfort—The energy potential of adaptation measures. Energy and Buildings 2022, 267, 112152. [Google Scholar] [CrossRef]
  23. Falasca, S.; Zinzi, M.; Ding, L.; Curci, G.; Santamouris, M.; Society. On the mitigation potential of higher urban albedo in a temperate oceanic metropolis. Sustainable Cities and Society 2022, 81, 103850. [CrossRef]
  24. Mohammed, A.; Khan, A.; Santamouris, M.; Environment. On the mitigation potential and climatic impact of modified urban albedo on a subtropical desert city. Building and Environment 2021, 206, 108276. [CrossRef]
  25. Akbari, H.; Pomerantz, M.; Taha, H. Cool surfaces and shade trees to reduce energy use and improve air quality in urban areas. Solar energy 2001, 70, 295–310. [Google Scholar] [CrossRef]
  26. Kolokotsa, D.D.; Giannariakis, G.; Gobakis, K.; Giannarakis, G.; Synnefa, A.; Santamouris, M. Cool roofs and cool pavements application in Acharnes, Greece. Sustainable Cities and Society 2018, 37, 466–474. [Google Scholar] [CrossRef]
  27. Andersson, E.; Langemeyer, J.; Borgström, S.; McPhearson, T.; Haase, D.; Kronenberg, J.; Barton, D.N.; Davis, M.; Naumann, S.; Röschel, L.J.B. Enabling green and blue infrastructure to improve contributions to human well-being and equity in urban systems. 2019, 69, 566-574. [CrossRef]
  28. Infrastructure, E.G.; Cohesion, T. The concept of green infrastructure and its integration into policies using monitoring systems. European Environmental Agency: Copenhagen, Denmark. 2011.
  29. Connop, S.; Vandergert, P.; Eisenberg, B.; Collier, M.J.; Nash, C.; Clough, J.; Newport, D. Renaturing cities using a regionally-focused biodiversity-led multifunctional benefits approach to urban green infrastructure. Environmental Science & Policy 2016, 62, 99–111. [Google Scholar] [CrossRef]
  30. Tan, Z.; Lau, K.K.-L.; Ng, E. Planning strategies for roadside tree planting and outdoor comfort enhancement in subtropical high-density urban areas. Building and Environment 2017, 120, 93–109. [Google Scholar] [CrossRef]
  31. Goussous, J.; Siam, H.; Alzoubi, H.; Society. Prospects of green roof technology for energy and thermal benefits in buildings: Case of Jordan. Sustainable cities and Society 2015, 14, 425-440. [CrossRef]
  32. Hsieh, C.-M.; Li, J.-J.; Zhang, L.; Schwegler, B. Effects of tree shading and transpiration on building cooling energy use. Energy and Buildings 2018, 159, 382–397. [Google Scholar] [CrossRef]
  33. Mohammed, A.; Khan, A.; Santamouris, M. Numerical evaluation of enhanced green infrastructures for mitigating urban heat in a desert urban setting. In Proceedings of Building Simulation; pp. 1-22.
  34. Huang, Y.; Akbari, H.; Taha, H.; Rosenfeld, A.H. The potential of vegetation in reducing summer cooling loads in residential buildings. Journal of Applied Meteorology and Climatology 1987, 26, 1103–1116. [Google Scholar] [CrossRef]
  35. Morakinyo, T.E.; Kong, L.; Lau, K.K.-L.; Yuan, C.; Ng, E.J.B.; Environment. A study on the impact of shadow-cast and tree species on in-canyon and neighborhood's thermal comfort. 2017, 115, 1-17. [CrossRef]
  36. Wang, C.; Li, Q.; Wang, Z.-H. Quantifying the impact of urban trees on passive pollutant dispersion using a coupled large-eddy simulation–Lagrangian stochastic model. Building and Environment 2018, 145, 33–49. [Google Scholar] [CrossRef]
  37. Parker, J.H.J.J.o.F. Landscaping to reduce the energy used in cooling buildings. Journal of Forestry 1983, 81, 82–105. [Google Scholar] [CrossRef]
  38. Chagolla, M.; Alvarez, G.; Simá, E.; Tovar, R.; Huelsz, G. Effect of tree shading on the thermal load of a house in a warm climate zone in Mexico. In Proceedings of ASME International Mechanical Engineering Congress and Exposition; pp. 761-768. [CrossRef]
  39. Santamouris, M.; Ban-Weiss, G.; Osmond, P.; Paolini, R.; Synnefa, A.; Cartalis, C.; Muscio, A.; Zinzi, M.; Morakinyo, T.E.; Edward, N. Progress in urban greenery mitigation science–assessment methodologies advanced technologies and impact on cities. Journal of Civil Engineering and Management 2018, 24, 638–671. [Google Scholar] [CrossRef]
  40. Taleb, H. Effect of Adding Vegetation and Applying a Plants Buffer on Urban Community in Dubai. Spaces & Flows: An International Journal of Urban & Extra Urban Studies 2016, 7. [Google Scholar]
  41. Shashua-Bar, L.; Hoffman, M.E.J.E.; buildings. Vegetation as a climatic component in the design of an urban street: An empirical model for predicting the cooling effect of urban green areas with trees. 2000, 31, 221-235. [CrossRef]
  42. Jan, F.-C.; Hsieh, C.-M.; Ishikawa, M.; Sun, Y.-H. Influence of street tree density on transpiration in a subtropical climate. Environment and Natural Resources Research 2012, 2, 84. [Google Scholar] [CrossRef]
  43. Hitchin, R.; Knight, I. Daily energy consumption signatures and control charts for air-conditioned buildings. Energy and Buildings 2016, 112, 101–109. [Google Scholar] [CrossRef]
  44. Tsoka, S.; Leduc, T.; Rodler, A. Assessing the effects of urban street trees on building cooling energy needs: The role of foliage density and planting pattern. Sustainable Cities and Society 2021, 65, 102633. [Google Scholar] [CrossRef]
  45. Lin, M.; Afshari, A.; Azar, E. A data-driven analysis of building energy use with emphasis on operation and maintenance: A case study from the UAE. Journal of Cleaner Production 2018, 192, 169–178. [Google Scholar] [CrossRef]
  46. Shanks, K. Energy performance resilience of UAE buildings to climate change. International Journal of Environment and Sustainability 2018, 7. [Google Scholar] [CrossRef]
  47. Al-Sallal, K.A.; Al-Rais, L. Outdoor airflow analysis and potential for passive cooling in the modern urban context of Dubai. Renewable Energy 2012, 38, 40–49. [Google Scholar] [CrossRef]
  48. Haddad, S.; Barker, A.; Yang, J.; Kumar, D.I.M.; Garshasbi, S.; Paolini, R.; Santamouris, M. On the potential of building adaptation measures to counterbalance the impact of climatic change in the tropics. Energy and Buildings 2020, 229, 110494. [Google Scholar] [CrossRef]
  49. Pyrgou, A.; Castaldo, V.L.; Pisello, A.L.; Cotana, F.; Santamouris, M. On the effect of summer heatwaves and urban overheating on building thermal-energy performance in central Italy. Sustainable cities and society 2017, 28, 187–200. [Google Scholar] [CrossRef]
  50. Hong, T.; Chen, Y.; Luo, X.; Luo, N.; Lee, S.H. Ten questions on urban building energy modeling. Building and Environment 2020, 168, 106508. [Google Scholar] [CrossRef]
  51. Sola, A.; Corchero, C.; Salom, J.; Sanmarti, M. Multi-domain urban-scale energy modelling tools: A review. Sustainable Cities and Society 2020, 54, 101872. [Google Scholar] [CrossRef]
  52. Robinson, D.; Haldi, F.; Leroux, P.; Perez, D.; Rasheed, A.; Wilke, U. CitySim: Comprehensive micro-simulation of resource flows for sustainable urban planning. In Proceedings of Proceedings of the Eleventh International IBPSA Conference; pp. 1083-1090. [CrossRef]
  53. Judkoff, R.; Neymark, J. International Energy Agency building energy simulation test (BESTEST) and diagnostic method; National Renewable Energy Lab.(NREL), Golden, CO (United States): 1995. [CrossRef]
  54. Walter, E.; Kämpf, J.H. A verification of CitySim results using the BESTEST and monitored consumption values. In Proceedings of Proceedings of the 2nd Building Simulation Applications conference; pp. 215-222.
  55. Mohammed, A.; Pignatta, G.; Topriska, E.; Santamouris, M. Canopy urban heat island and its association with climate conditions in Dubai, UAE. Climate. 2020, 8, 81. [Google Scholar] [CrossRef]
  56. Misni, A.; Allan, P. Sustainable residential building issues in urban heat islands–the potential of albedo and vegetation. In Proceedings of Proceeding in Sustainable Building New Zealand Conference (SB10).
  57. Aktacir, M.A.; Büyükalaca, O.; Yılmaz, T. A case study for influence of building thermal insulation on cooling load and air-conditioning system in the hot and humid regions. Applied Energy 2010, 87, 599–607. [Google Scholar] [CrossRef]
  58. Pan, Y.; Yu, C.; Mao, J.; Long, W.; Chen, W. A study of Shanghai residential morphology and microclimate at a neighborhood scale based on energy consumption. In Proceedings of 14th conference of international building performance simulation association, Hyderabad, India, Dec; pp. 7-9.
  59. Takakura, T.; Kitade, S.; Goto, E. Cooling effect of greenery cover over a building. Energy and buildings 2000, 31, 1–6. [Google Scholar] [CrossRef]
  60. Barbera, G.; Pecorella, G.; Silvestrini, G. Reduction of cooling loads and CO2 emissions through the use of vegetation in Italian urban areas. 1991.
  61. Garshasbi, S.; Haddad, S.; Paolini, R.; Santamouris, M.; Papangelis, G.; Dandou, A.; Methymaki, G.; Portalakis, P.; Tombrou, M. Urban mitigation and building adaptation to minimize the future cooling energy needs. Solar Energy 2020, 204, 708–719. [Google Scholar] [CrossRef]
  62. Erell, E.; Zhou, B. The effect of increasing surface cover vegetation on urban microclimate and energy demand for building heating and cooling. Building and Environment 2022, 213, 108867. [Google Scholar] [CrossRef]
  63. Santamouris, M.; Haddad, S.; Saliari, M.; Vasilakopoulou, K.; Synnefa, A.; Paolini, R.; Ulpiani, G.; Garshasbi, S.; Fiorito, F. On the energy impact of urban heat island in Sydney: Climate and energy potential of mitigation technologies. Energy and Buildings 2018, 166, 154–164. [Google Scholar] [CrossRef]
Figure 1. Flowchart of steps involved in the study.
Preprints 80450 g001
Figure 2. Downtown Dubai Location (case study area) - Google Map.
Preprints 80450 g002
Figure 3. Schematic description of the workflow.
Preprints 80450 g003
Figure 4. a) Cooling demand (kWh/m2) in all non-insulated buildings (commercial and residential) for base case (0.2) and four heat mitigation technologies scenarios (M1, M2, M3 and M4) in the summer month. b) Cooling demand (kWh/m2) in all insulated buildings (commercial and residential) for base case (0.2) and four heat mitigation technologies scenarios (M1, M2, M3 and M4) in the summer month.
Preprints 80450 g004
Figure 5. a) cooling needs (kWh/m2) in high-rise (H) and low-rise (L) residential buildings without insulation for base case and four heat mitigation scenarios (M1, M2, M3 and M4) in the summer month. b) cooling needs (kWh/m2) in high-rise (H) and low-rise (L) residential buildings with insulation for base case and four heat mitigation scenarios (M1, M2, M3 and M4) in the summer month.
Preprints 80450 g005
Figure 6. a) cooling needs (kWh/m2) in high-rise (H) and low-rise (L) commercial buildings without insulation for base case and four heat mitigation scenarios (M1, M2, M3 and M4) in the summer month. b) cooling needs (kWh/m2) in high-rise (H) and low-rise (L) commercial buildings with insulation for base case and four heat mitigation scenarios (M1, M2, M3 and M4) in the summer month.
Preprints 80450 g006aPreprints 80450 g006b
Figure 7. a) Reduction in cooling load against reference case (kWh/m2) in all uninsulated buildings (commercial and residential) for base case and four heat mitigation scenarios (M1, M2, M3 and M4) in the summer month. b) Reduction in cooling load against reference case (kWh/m2) in all insulated buildings (commercial and residential) for base case and four heat mitigation scenarios (M1, M2, M3 and M4) in the summer month.
Preprints 80450 g007
Figure 8. a) Cooling load reduction against reference case (kWh/m2) in high-rise (H) and low-rise (L) residential buildings without insulation for control case and four heat mitigation scenarios (M1, M2, M3 and M4) in the summer month. b) Cooling load reduction against reference case (kWh/m2) in high-rise (H) and low-rise (L) residential buildings with insulation for control case and four heat mitigation scenarios (M1, M2, M3 and M4) in the summer month.
Preprints 80450 g008
Figure 9. a) Cooling load reduction against reference case (kWh/m2) in high-rise (H) and low-rise (L) commercial buildings without insulation for control case and four heat mitigation scenarios (M1, M2, M3 and M4) in the summer month. b) Cooling load reduction against reference case (kWh/m2) in high-rise (H) and low-rise (L) commercial buildings with insulation for control case and four heat mitigation scenarios (M1, M2, M3 and M4) in the summer month.
Preprints 80450 g009
Figure 10. Comparison between Energy savings for enhanced vegetation with literature results.
Preprints 80450 g010
Figure 11. a) Comparison between the energy performance of modified cool materials and green infrastructure for non-insulated residential buildings. b) Comparison between the energy performance of modified cool materials and green infrastructure for non-insulated commercial buildings.
Preprints 80450 g011
Figure 12. a) Comparison between the energy performance of modified cool materials and green infrastructure for insulated residential buildings. b) Comparison between the energy performance of modified cool materials and green infrastructure for insulated commercial buildings.
Preprints 80450 g012
Figure 13. a) Average percentage reduction in cooling load by employing green infrastructure as a mitigation technique in non-insulated buildings. b) Average percentage reduction in cooling load by employing cool materials as a mitigation technique in non-insulated buildings.
Preprints 80450 g013
Figure 14. a) Average percentage reduction in cooling load by employing green infrastructure as a mitigation technique in insulated buildings. b) Average percentage reduction in cooling load by employing cool materials as a mitigation technique in insulated buildings.
Preprints 80450 g014
Table 1. Building scale parameters for CitySim modelling.
Input Parameters Data
Temperatures Commercial buildings: 19.0 – 24.0 °C
Residential buildings: 20.0 – 26.0 °C
Infiltration 1.0
Shading device [λ] 0.2
Glazing U-value Insulation: 1.6, 1.9 and 2.1 W/m2K
Without insulation: 5.8 W/m2K
Cut-off irradiance 100 (W/m2)
Glazing g-value 0.85
Surface reflectance 0.2
Openable fraction 0.5
Commercial Residential
Gym Office Auditorium Shopping Mall Restaurant
Occupant density (m2/P) 10 9.3 1 5 1.4 18.6
Internal gains (W/P) Sensible Loads 388 246 84 268 103 90
Latent Loads 315 55 35 55 80 45
Table 2. Building features for modelling.
Building Type Height [m] Area [m2] WWR [%] No. of Storey Category
B01-Residential 56.0 46665.0 50.0 16.0 H
B02-Residential 192.0 61008.0 75.0 48.0 H
B03-Residential 151.0 44650.0 60.0 37.0 H
B04-Residential 190.0 352800.0 65.0 46.0 H
B05-Shopping Mall 25.0 1013379.0 35.0 4.0 L
B06-Residential 266.0 200087.0 70.0 62.0 H
B07-Residential 158.0 53760.0 60.0 42.0 H
B08-Residential 171.0 35244.0 50.0 41.0 H
B09-Shopping Mall 25.0 126367.0 50.0 4.0 L
B10-Offices 50.0 36150.0 65.0 13.0 H
B11-Gym 16.0 5683.0 60.0 4.0 L
B12-Residential 67.0 24842.0 50.0 18.0 H
B13-Residential 605.0 259748.0 95.0 162.0 H
B14-Restaurant 12.0 1248.0 25.0 3.0 L
B15-Shopping Mall 25.0 178594.0 40.0 5.0 L
B16-Residential 22.0 236924.0 40.0 6.0 L
B17-Residential 184.0 51905.0 65.0 51.0 H
B18-Residential 76.0 36549.0 40.0 20.0 H
B19-Residential 80.0 11856.0 60.0 20.0 H
B20-Office 18.0 1738.0 40.0 5.0 L
B21-Residential 115.0 18301.0 60.0 33.0 H
B22-Residential 70.0 42580.0 40.0 17.0 H
B23-Office 17.0 5787.0 40.0 5.0 L
B24-Residential 119.0 21280.0 70.0 34.0 H
B25-Residential 115.0 22095.0 70.0 33.0 H
B26-Residential 112.0 22107.0 65.0 34.0 H
B27-Residential 96.0 21588.0 70.0 29.0 H
B28-Residential 115.0 18445.0 70.0 33.0 H
B29-Residential 69.0 15673.0 70.0 19.0 H
B30-Residential 88.0 15237.0 70.0 25.0 H
B31-Residential 142.0 89334.0 60.0 39.0 H
B32-Residential 73.0 43498.0 60.0 19.0 H
B33-Residential 124.0 49011.0 40.0 34.0 H
B34-Offices 89.0 99106.0 90.0 21.0 H
B35-Offices 28.0 42182.0 80.0 6.0 M
B36-Auditorium 44.0 37688.0 95.0 7.0 M
B37-Residential 119.0 97767.0 60.0 34.0 H
B38-Residential 98.0 38039.0 55.0 28.0 H
B39-Residential 56.0 26771.0 30.0 16.0 H
B40-Residential 76.0 21066.0 30.0 19.0 H
B41-Residential 68.0 26820.0 30.0 17.0 H
* Building Category H=High-Rise Building, M=Medium-Rise Building, L=Low-Rise Building.
Table 3. Building composite properties.
Layers Features
Insulated Structure Non-Insulated Structure
Wall External mortar-cement and sand; Cement block; Rockwool Board/Slab; Cement board; Internal mortar; plaster (U-Value: 0.32 W/m2K) External mortar-cement and sand; Cement block; Internal mortar; plaster (U-Value: 2.53 W/m2K)
Glass (U-Value 1.6, 1.9, 2.1W/m2K) Glass ( U-Value 5.8 W/m2K)
Roof Concrete tiles; Polyurethane (PUR); Light weight concrete; Bitumen layer; Concrete (for residential 0.2 m and for commercial 0.3 m); Plaster.guifenU Value-residential: 0.34 W/m2K; guifenU Value-commercial: 0.33 W/m2K . Concrete tiles; Light weight concrete; Bitumen layer; Concrete (for residential 0.2 m and for commercial 0.3 m); Plaster.guifenU Value-residential: 2.34 W/m2K;guifenU Value-commercial: 1.91 W/m2K .
Roof metal (Steel sheet; Expanded polystyrene) guifenU Value: 2.11 W/m2K Roof metal (Steel sheet; Expanded polystyrene) U Value: 2.11 W/m2K
Floor Ceramic tiles; Light Weight mortar; Concrete; guifenU Value: 3.27 W/m2K. Ceramic tiles; Light Weight mortar; Concrete; U Value: 3.27 W/m2K.
Table 4. climate data parameters.
Climatic Elements Units
day -
month -
hour -
beam normal irradiance W/m2
air temperature °C
ground surface temperature °C
precipitation mm
nebulosity Octas
ambient temperature °C
relative humidity %
wind speed m/s
wind direction degree
global horizontal radiation W/m2
diffuse horizontal irradiance W/m2
solar normal irradiance W/m2
Disclaimer/Publisher’s Note: The statements, opinions and data contained in all publications are solely those of the individual author(s) and contributor(s) and not of MDPI and/or the editor(s). MDPI and/or the editor(s) disclaim responsibility for any injury to people or property resulting from any ideas, methods, instructions or products referred to in the content.
Copyright: This open access article is published under a Creative Commons CC BY 4.0 license, which permit the free download, distribution, and reuse, provided that the author and preprint are cited in any reuse.
Prerpints.org logo

Preprints.org is a free preprint server supported by MDPI in Basel, Switzerland.

Subscribe

© 2024 MDPI (Basel, Switzerland) unless otherwise stated