1. Introduction
With the exploration and exploitation of offshore oil and gas resources, underwater engineering has become increasingly diverse. Submarine landslides caused by earthquakes and other reasons have seriously threatened the safety of deep-sea oil and gas drilling platforms, submarine pipelines and other underwater oil production facilities. Evaluating the stability of submarine slopes is one of the important topics in marine geotechnical engineering. When analyzing the stability of marine slopes, the soil is usually regarded as a homogeneous material, and the strength parameters of the soil are taken as the average of the statistical data. The stability of the slope is evaluated through a safety factor. Due to the factors such as material composition, sedimentation history, and consolidation pressure, soil strength parameters exhibit spatial variability [
1,
2,
3,
4], which significantly affects the slope stability [
5,
6,
7,
8,
9,
10]. It is difficult to comprehensively reflect the reliability of submarine slopes by using safety factors to evaluate the stability of marine slopes.
The limit equilibrium method is widely used to analyze the stability of slope because of its simple principle and reliable results. Combining the limit equilibrium method with the random field theory, Cho. [
11] proposed the random limit equilibrium method to analyze the reliability of slopes. The random limit equilibrium method has been used by many scholars to analyze the reliability of slopes [
12,
13,
14,
15,
16]. When combining the random limit equilibrium method with Monte Carlo simulation to calculate the failure probability of slopes, the number of Monte Carlo simulations and the time required for each Monte Carlo simulation are key factors that affect the efficiency of slope reliability calculation. The number of critical slip surfaces analyzed during each Monte Carlo simulation is a key factor that affects the efficiency of the calculation. The traditional method of grid search [
17] is a type of violent search method, which can quickly search for a limited number of slip surfaces in grid points with a rough division form. But it is difficult to determine the true critical slip surface using this method. In order to obtain more accurate search results, it is usually necessary to exponentially increase the number of trial slip surfaces by reducing the spacing between grid points. However, this significantly increases computational costs. In order to improve search efficiency, Jiang et al. [
18] proposed the binary method based on the grid search method, which uses the previously searched objective function value information to find the possible positions of extreme points, in order to improve the descent speed of the function. Mo et al. [
19] used a similar method and pre-detected each search direction from the central point to determine the next center point movement direction, which overcame the limitations of the search area and improved the reliability of slope stability analysis. After using traditional methods to find the critical circular slip surface, Malkawi et al. [
20] simplified the second search process by changing the position of some points on the slip surface and using the random jumping method and two-point random walking method. It achieves optimized search for the critical slip surface, improving the accuracy of the safety factor. The traditional grid search method is independent of each trial slip surface [
21] and has strong adaptability. Zhang et al. [
22] used the grid search method to search for the critical slip surface of expansive soil slopes and established a reliability calculation model for expansive soil slopes. Wu et al. [
23] combines the grid search method with the pattern search method to search for non circular slip surfaces of complex soil slopes. Kostić et al. [
24] extended the grid search method for locating critical failure surfaces to predict the safety factor of slopes by deriving additional analytical expressions for the slip center grid. These traditional methods are widely used to determine the critical slip surface in the stability analysis of slope because of the simple principle and reliable results. However, if a high accuracy of the safety factor is required, these methods can be very time consuming. The contradiction between the accuracy and efficiency of traditional methods in searching for the minimum safety factor limits their application in slope reliability analysis. To overcome this problem, this paper proposes an improved entry and exit method to determine the critical slip surface. Meaningful comparisons are made to verify the performance of the proposed method.
2. Random field modeling of spatially variable soil properties
A prerequisite for realizing the slope reliability analysis is to characterise the soil spatial variability that is frequently simulated based on random field theory. In a two-dimensional (2-D) slope domain, the inherent spatial variability of a soil property can be mathematically represented by its autocorrelation function. In this paper, a squared exponential autocorrelation function is adopted with different autocorrelation distances in the horizontal and vertical directions as follows [
6]:
where (x, y) and (x′, y′) are the coordinates of two arbitrary points in a 2-D space; and
lx and
ly are the autocorrelation distances in the horizontal and vertical directions, respectively.
Lognormal random variable is a continuous random variable and strictly nonnegative values, which complies with the physical meaning of most geotechnical parameters (e.g.,
cu,
c, and
φ). In this study, lognormal random field is used to model the inherent spatial variability of geotechnical parameters. Then, under Karhunen-Loève (KL) expansion [
9,
25,
26], the lognormal random field is expressed as
Where
μln=ln
μ-(
σln)
2/2 is the mean of ln(
H) and
σln=(ln(1+(
σ/
μ)
2))
0.5 is the standard deviation of ln(
H),
χi(
θ) is a set of orthogonal random coefficients (uncorrelated random variables with zero mean and unit variance),
λi and
φi(
x) are the eigenvalues and eigenfunctions of the autocorrelation function, respectively.
M is the number of truncated terms of the series expansion, which highly depends on the desired accuracy and the autocorrelation function of the random field. However, the accuracy of the random field is measured by the ratio of the expected energy,
ε, which is defined as
The cohesion
c and friction angle
φ are usually considered as uncertain geotechnical parameters in slope reliability analysis. In the following, the cross-correlated random fields between cohesion
c and friction angle
φ are presented, and the cross-correlated lognormal random fields generated by using KL expansion method can be expressed [
6]:
where
χci(
θ) and
χφi(
θ) are independent random vectors,
ρc,φ is the cross correlation coefficient between
c and
φ.
3. Limit equilibrium method
3.1. Entry and exit method
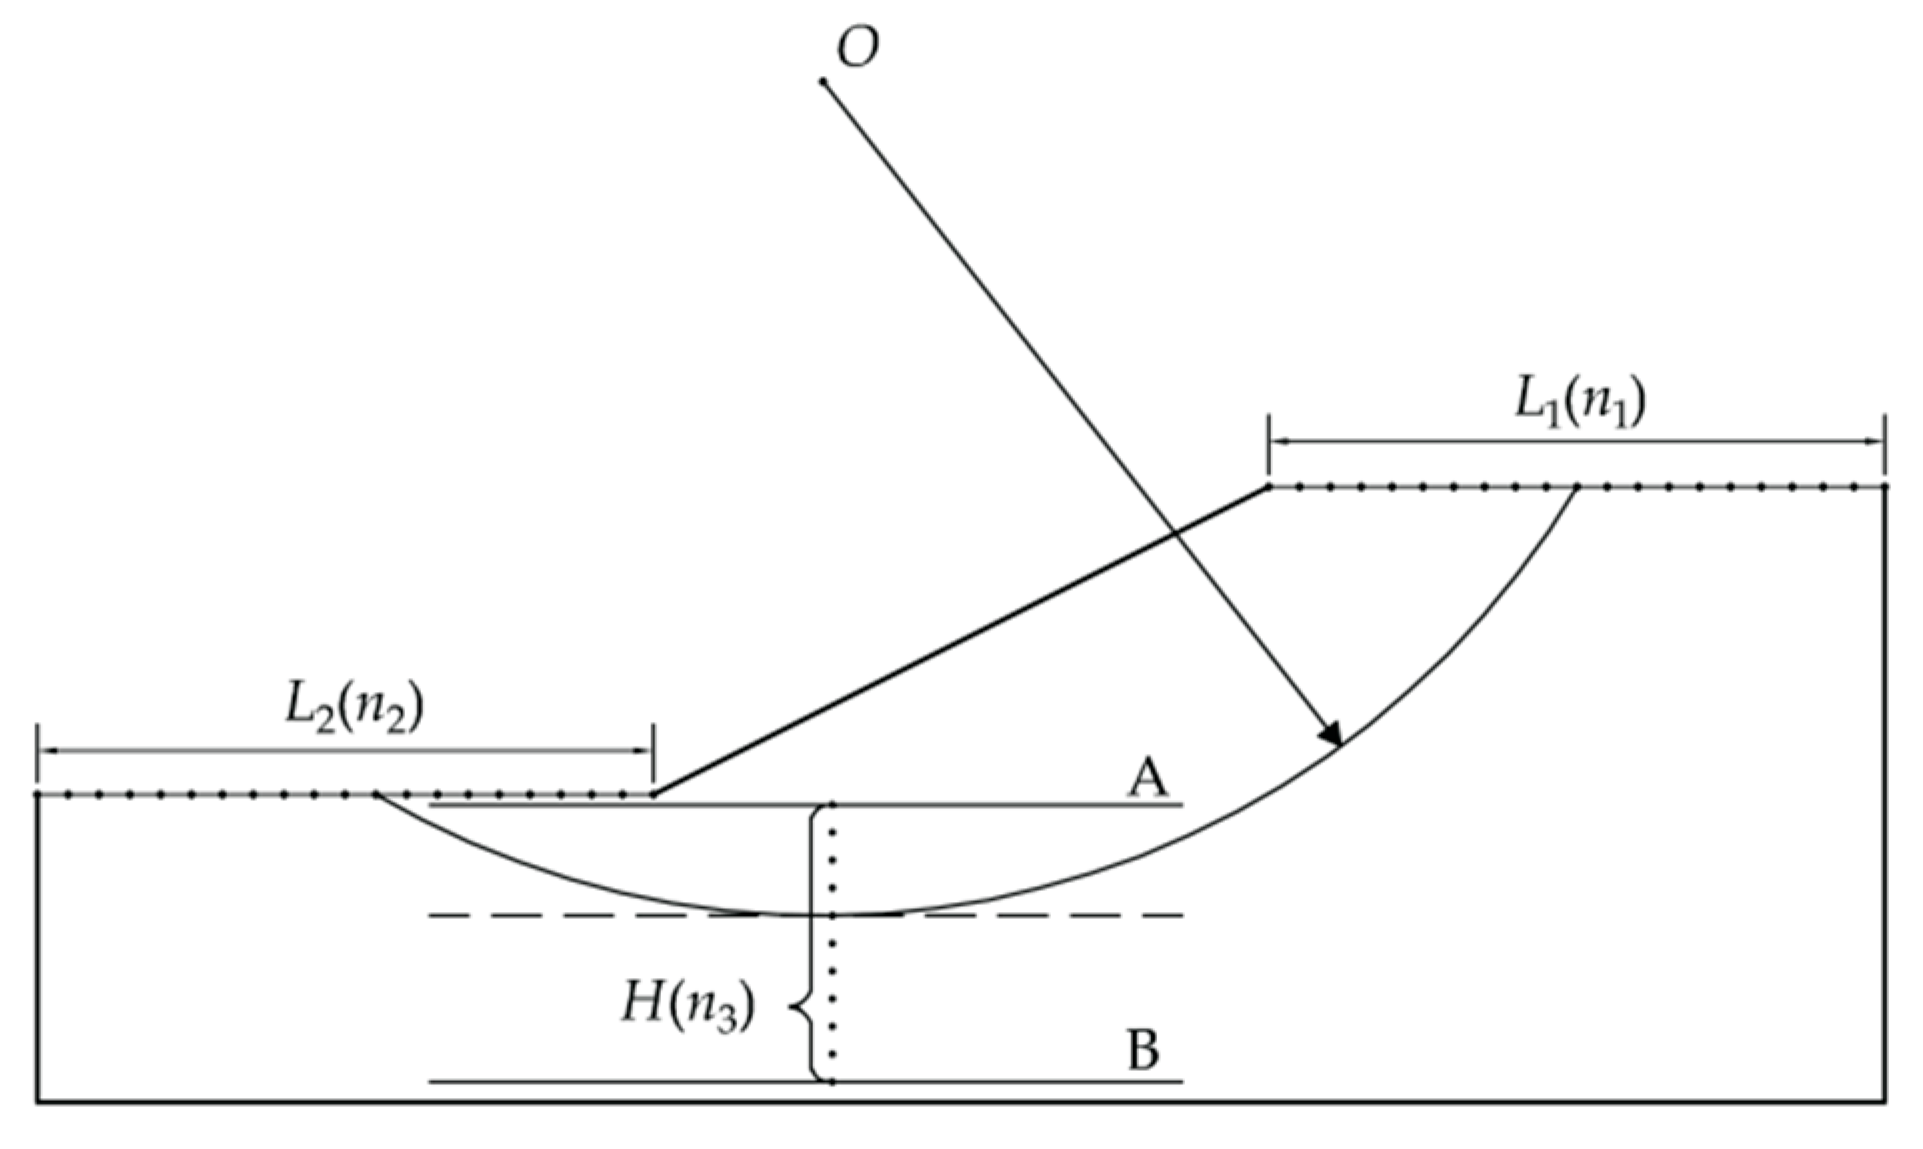
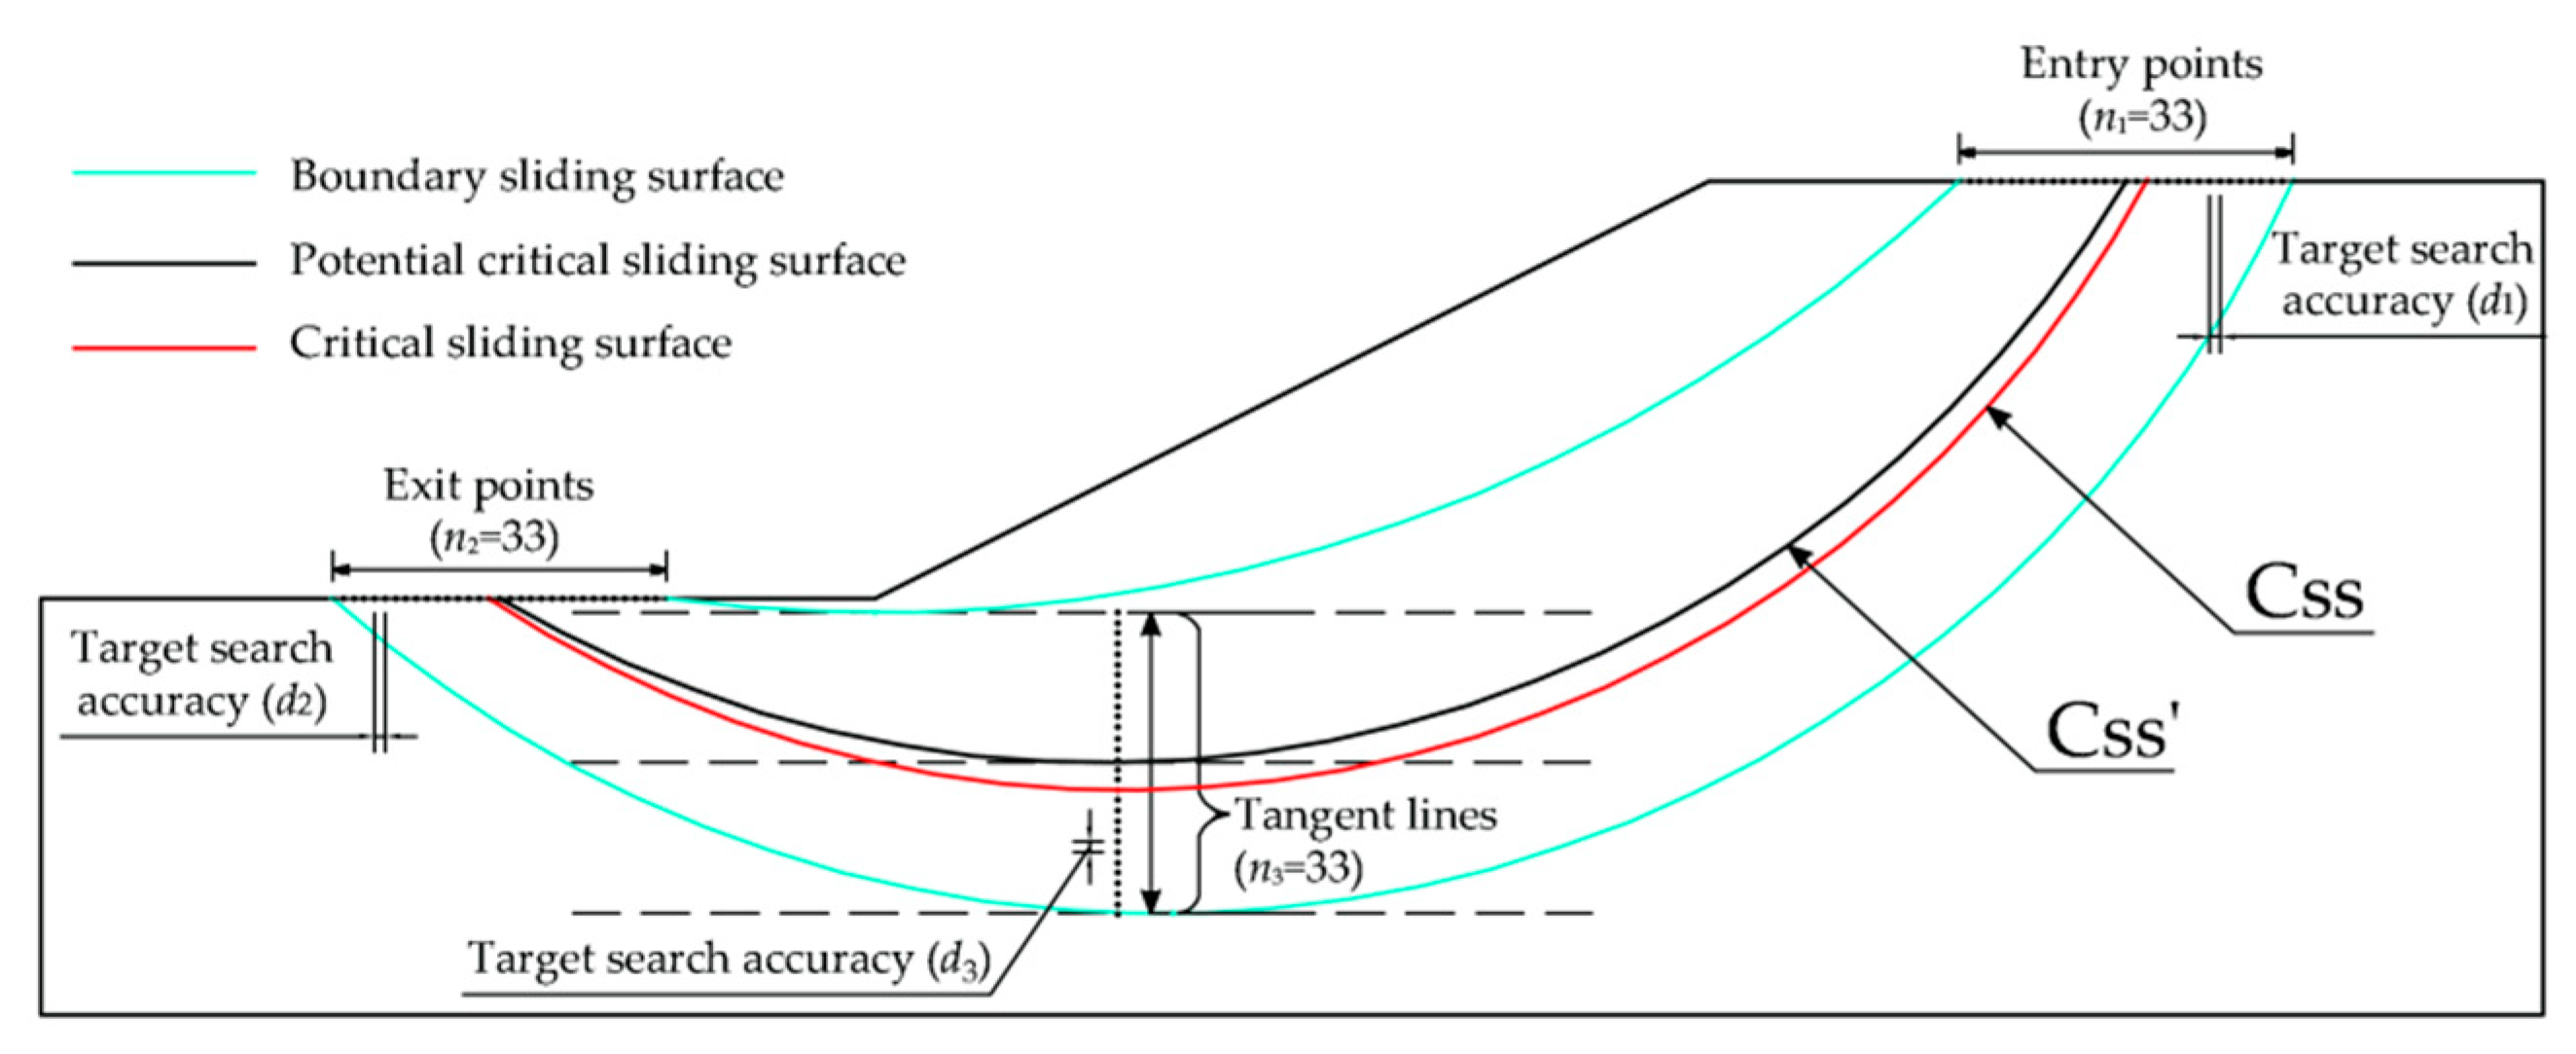
The critical slip surface is determined by analyzing a certain number of trial slip surfaces, and the one with the minimum safety factor is selected as the critical slip surface for the slope. The number of the trial slip surfaces has significant effect on the calculation accuracy. The entry and exit method generates a circular slip surface based on three parameters: entry point, exit point and tangent line (
Figure 1). By dividing the entry range
L1 into
n1 points, the exit range
L2 into
n2 points, and the vertical distance range between the line A and B into
n3 points,
n1×
n2×
n3 trial slip surfaces is generated.
3.2. Improved entry and exit method
The essence of the improved entry and exit method is to adjust the searching range according to the previous search results, and then perform a second search to determine the critical slip surface of slope. The general steps are:
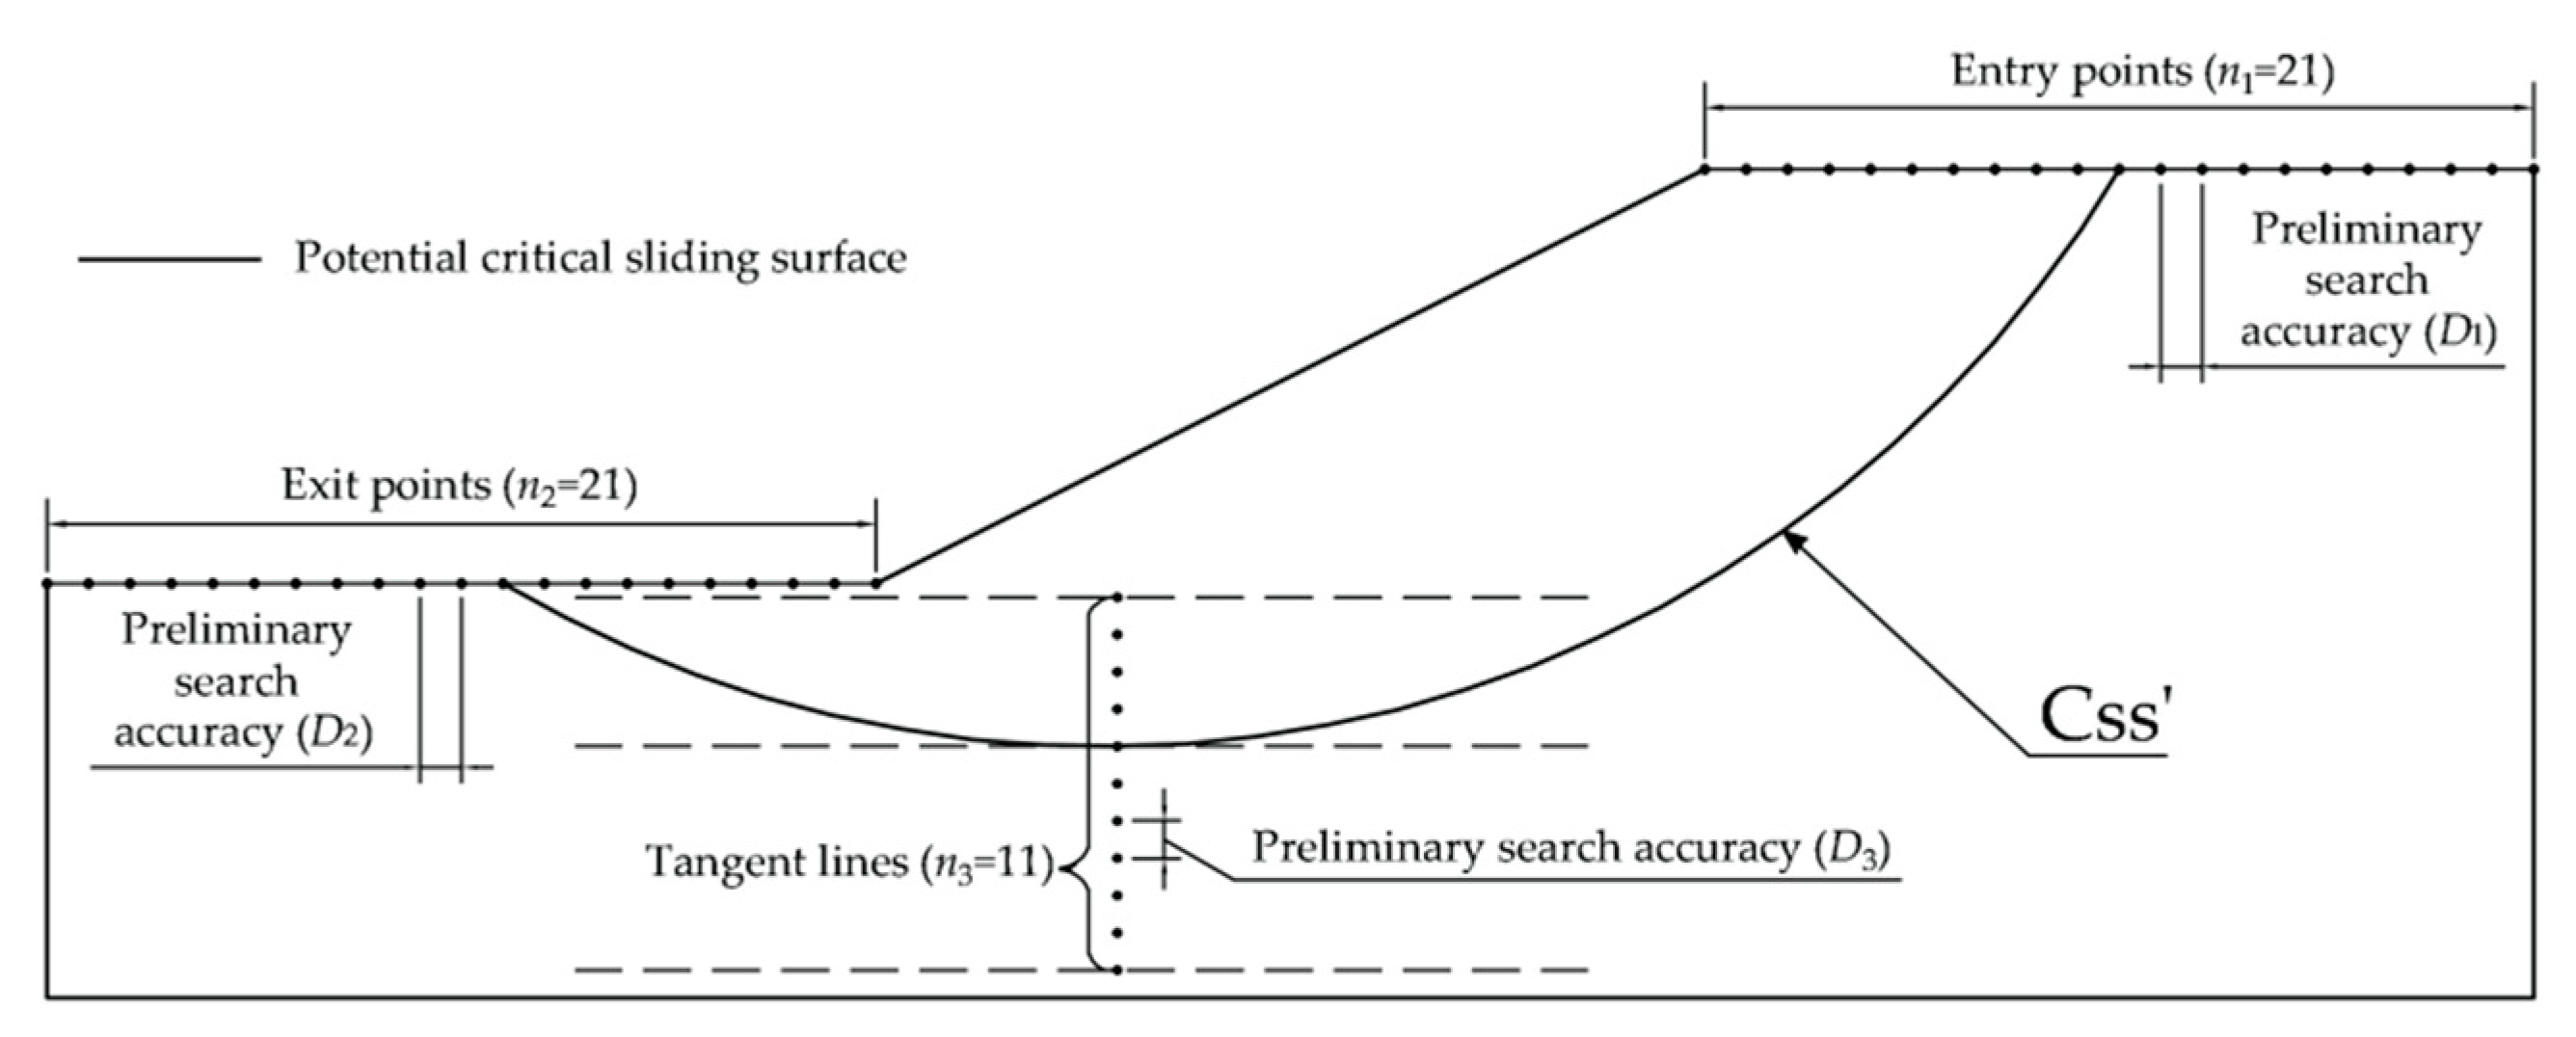
The entry and exit method is used to search for the potential critical slip surface. The distances of adjacent two entry points, adjacent two exit points, and adjacent two tangent lines are
D1 (
D1=
L1/20),
D2 (
D2=
L2/20), and
D3 (
D3=
H/10), respectively. The simplified Bishop method is used to calculated the safety factors of all trial slip surface. The slip surface with the minimum factor of safety is taken as ‘the potential critical slip surface (Css')’, as shown in
Figure 2.
- 2.
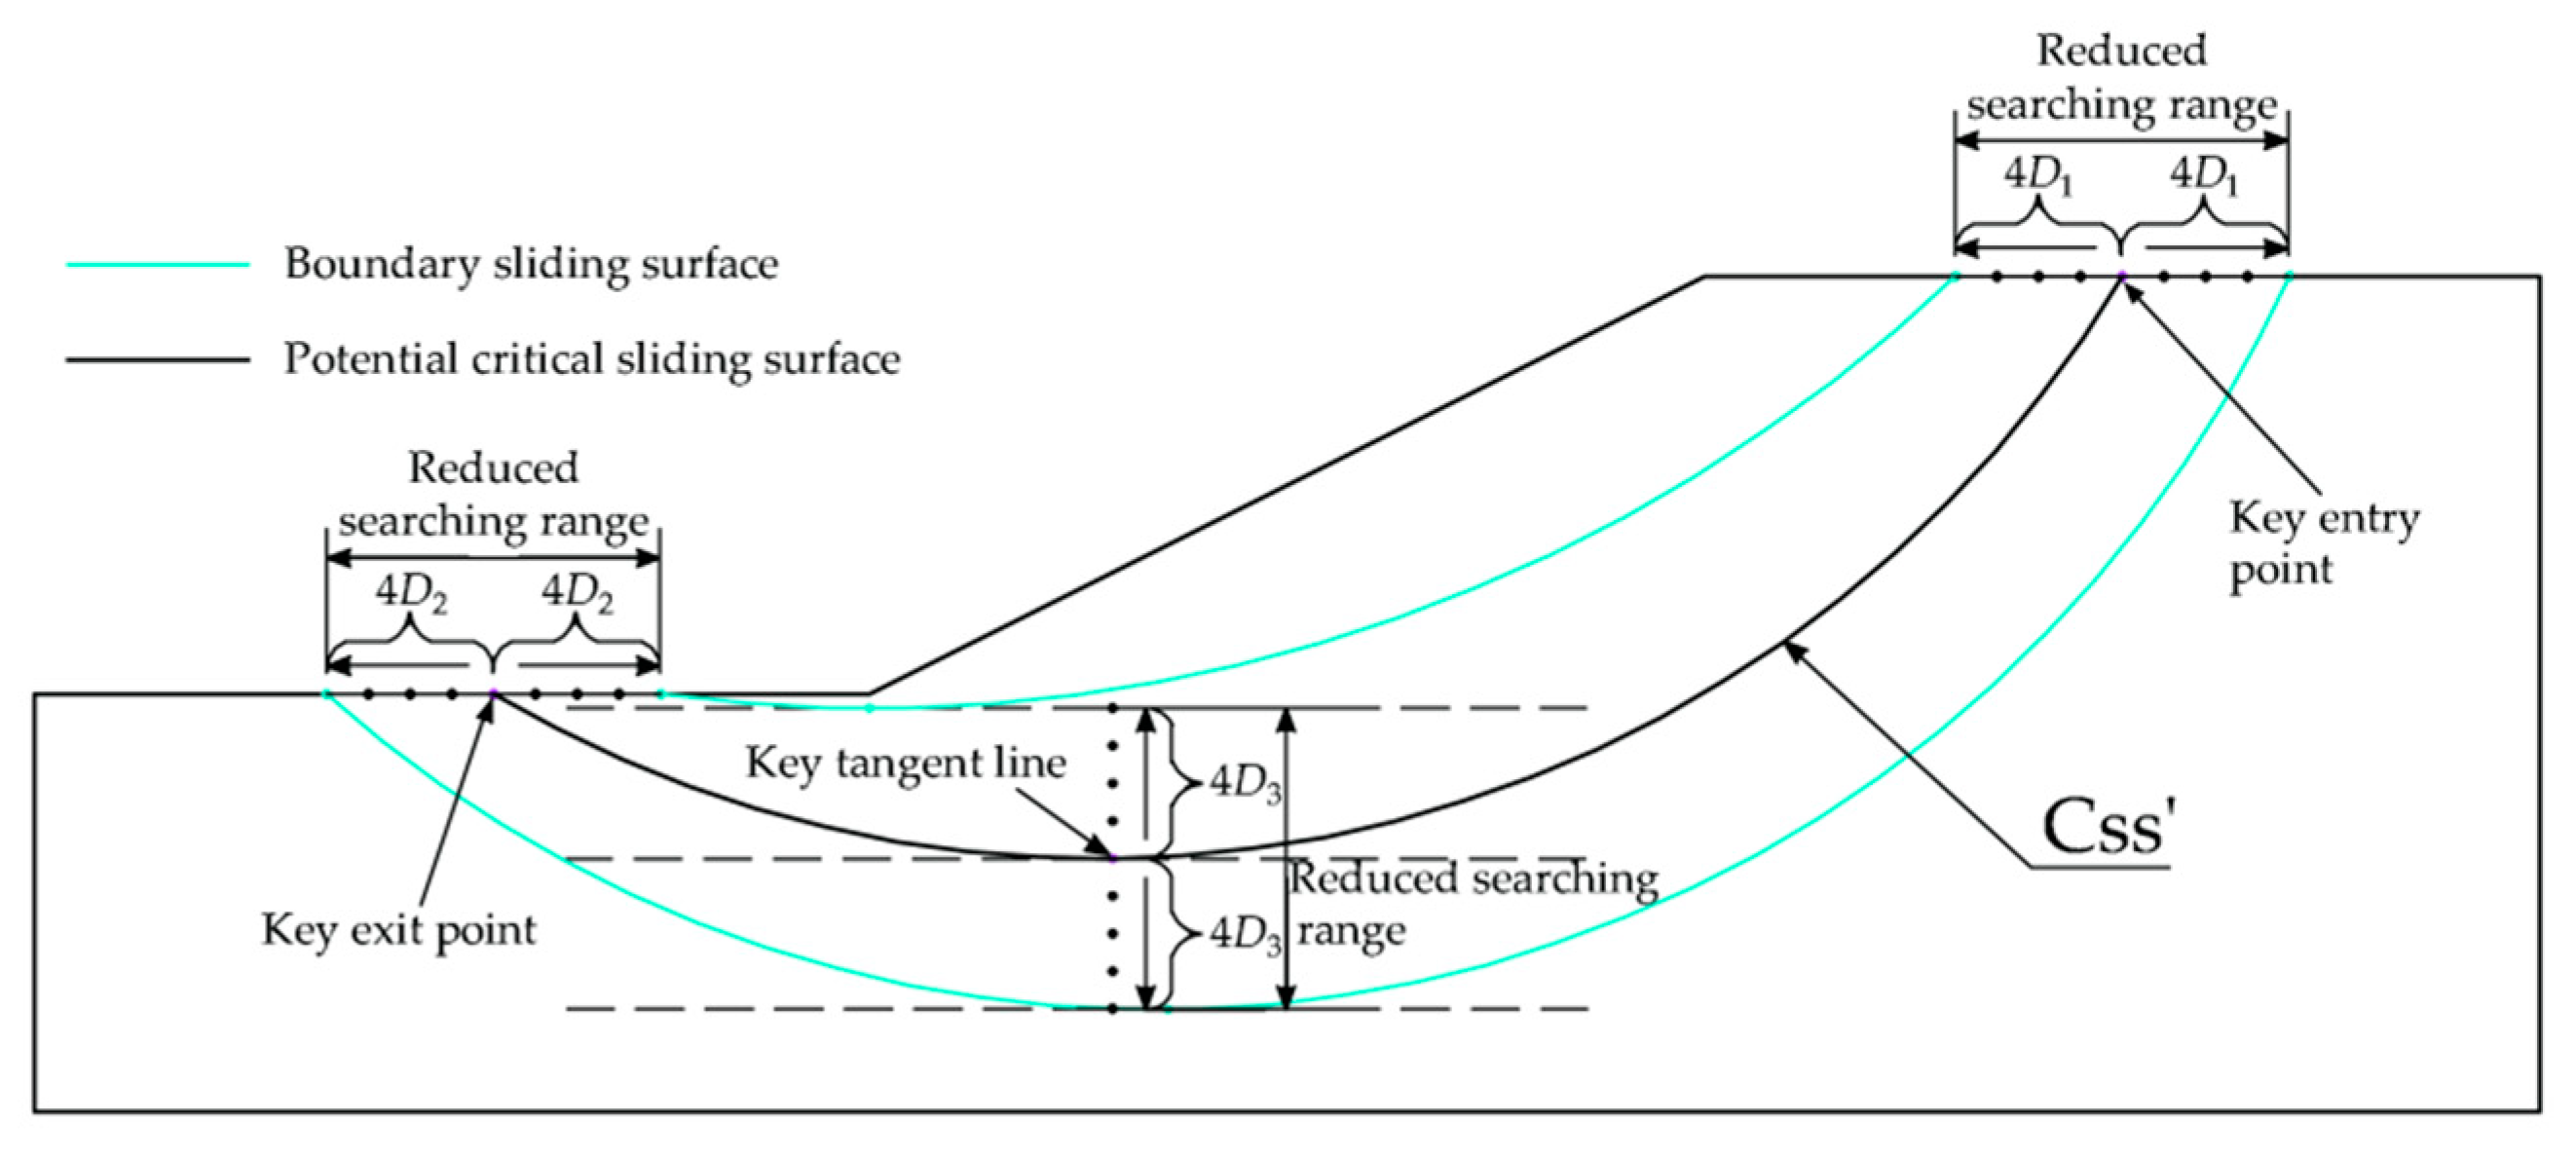
The key points (key entry point, key exit point, and key tangent line ) is determined according to the location of the potential critical slip surface (Css') and the searching range is reduced. Based on the reduced searching range, the entry and exit method is used again to determine the critical slip surface (Css) of slope. The reduced searching range is set to unilateral 4
D1, 4
D2 and 4
D3, as shown in
Figure 3.
Based on the reduced searching range, increasing the multiple of points within the reduced searching range according to the requirements of target search accuracy, as shown in
Figure 4. In this paper, the factor of safety obtained by analyzing 81×81×41=269001 trial slip surfaces is used as the target accuracy. The distances of adjacent two entry points, adjacent two exit points, and adjacent two tangent lines are
L1/80,
L2/80, and
H/40, respectively.
It can be seen that when using traditional methods to achieve target search accuracy, it is necessary to analyze 81×81×41=269001 trial slip surfaces. When using the improved entry and exit method to achieve target search accuracy, {21×21×11(first search)+33×33×33(second search)}=40788 trial slip surfaces need to be analyzed (reduced searching range equal to unilateral 4D). The number of trial slip surfaces calculated by the improved entry and exit method is 15% of the traditional entry and exit method, and its calculation efficiency is significantly better than traditional entry and exit method.
3.3. Simplified Bishop method and failure probability
The simplified Bishop method proposed by [
27] is considered one of the best limit equilibrium method for calculating the safety factor of circular slip surfaces in slope stability analysis [
28]. The safety factor is calculated based on the overall moment equilibrium condition of the soil on the upper part of the slip surface. The factor of safety
Fs can be expressed as:
where
Wi is gravity;
c′ is the cohesive of the soil;
φ′ is the internal friction angle of soil;
μi is the pore water pressure;
b is the width of the soil strip;
αi is the inclination of the bottom of the ith soil strip;
mαi=cos
αi+tan
φsin
αi/
Fs.
In this paper, the Karhunen-Loève (K-L) expansion method [
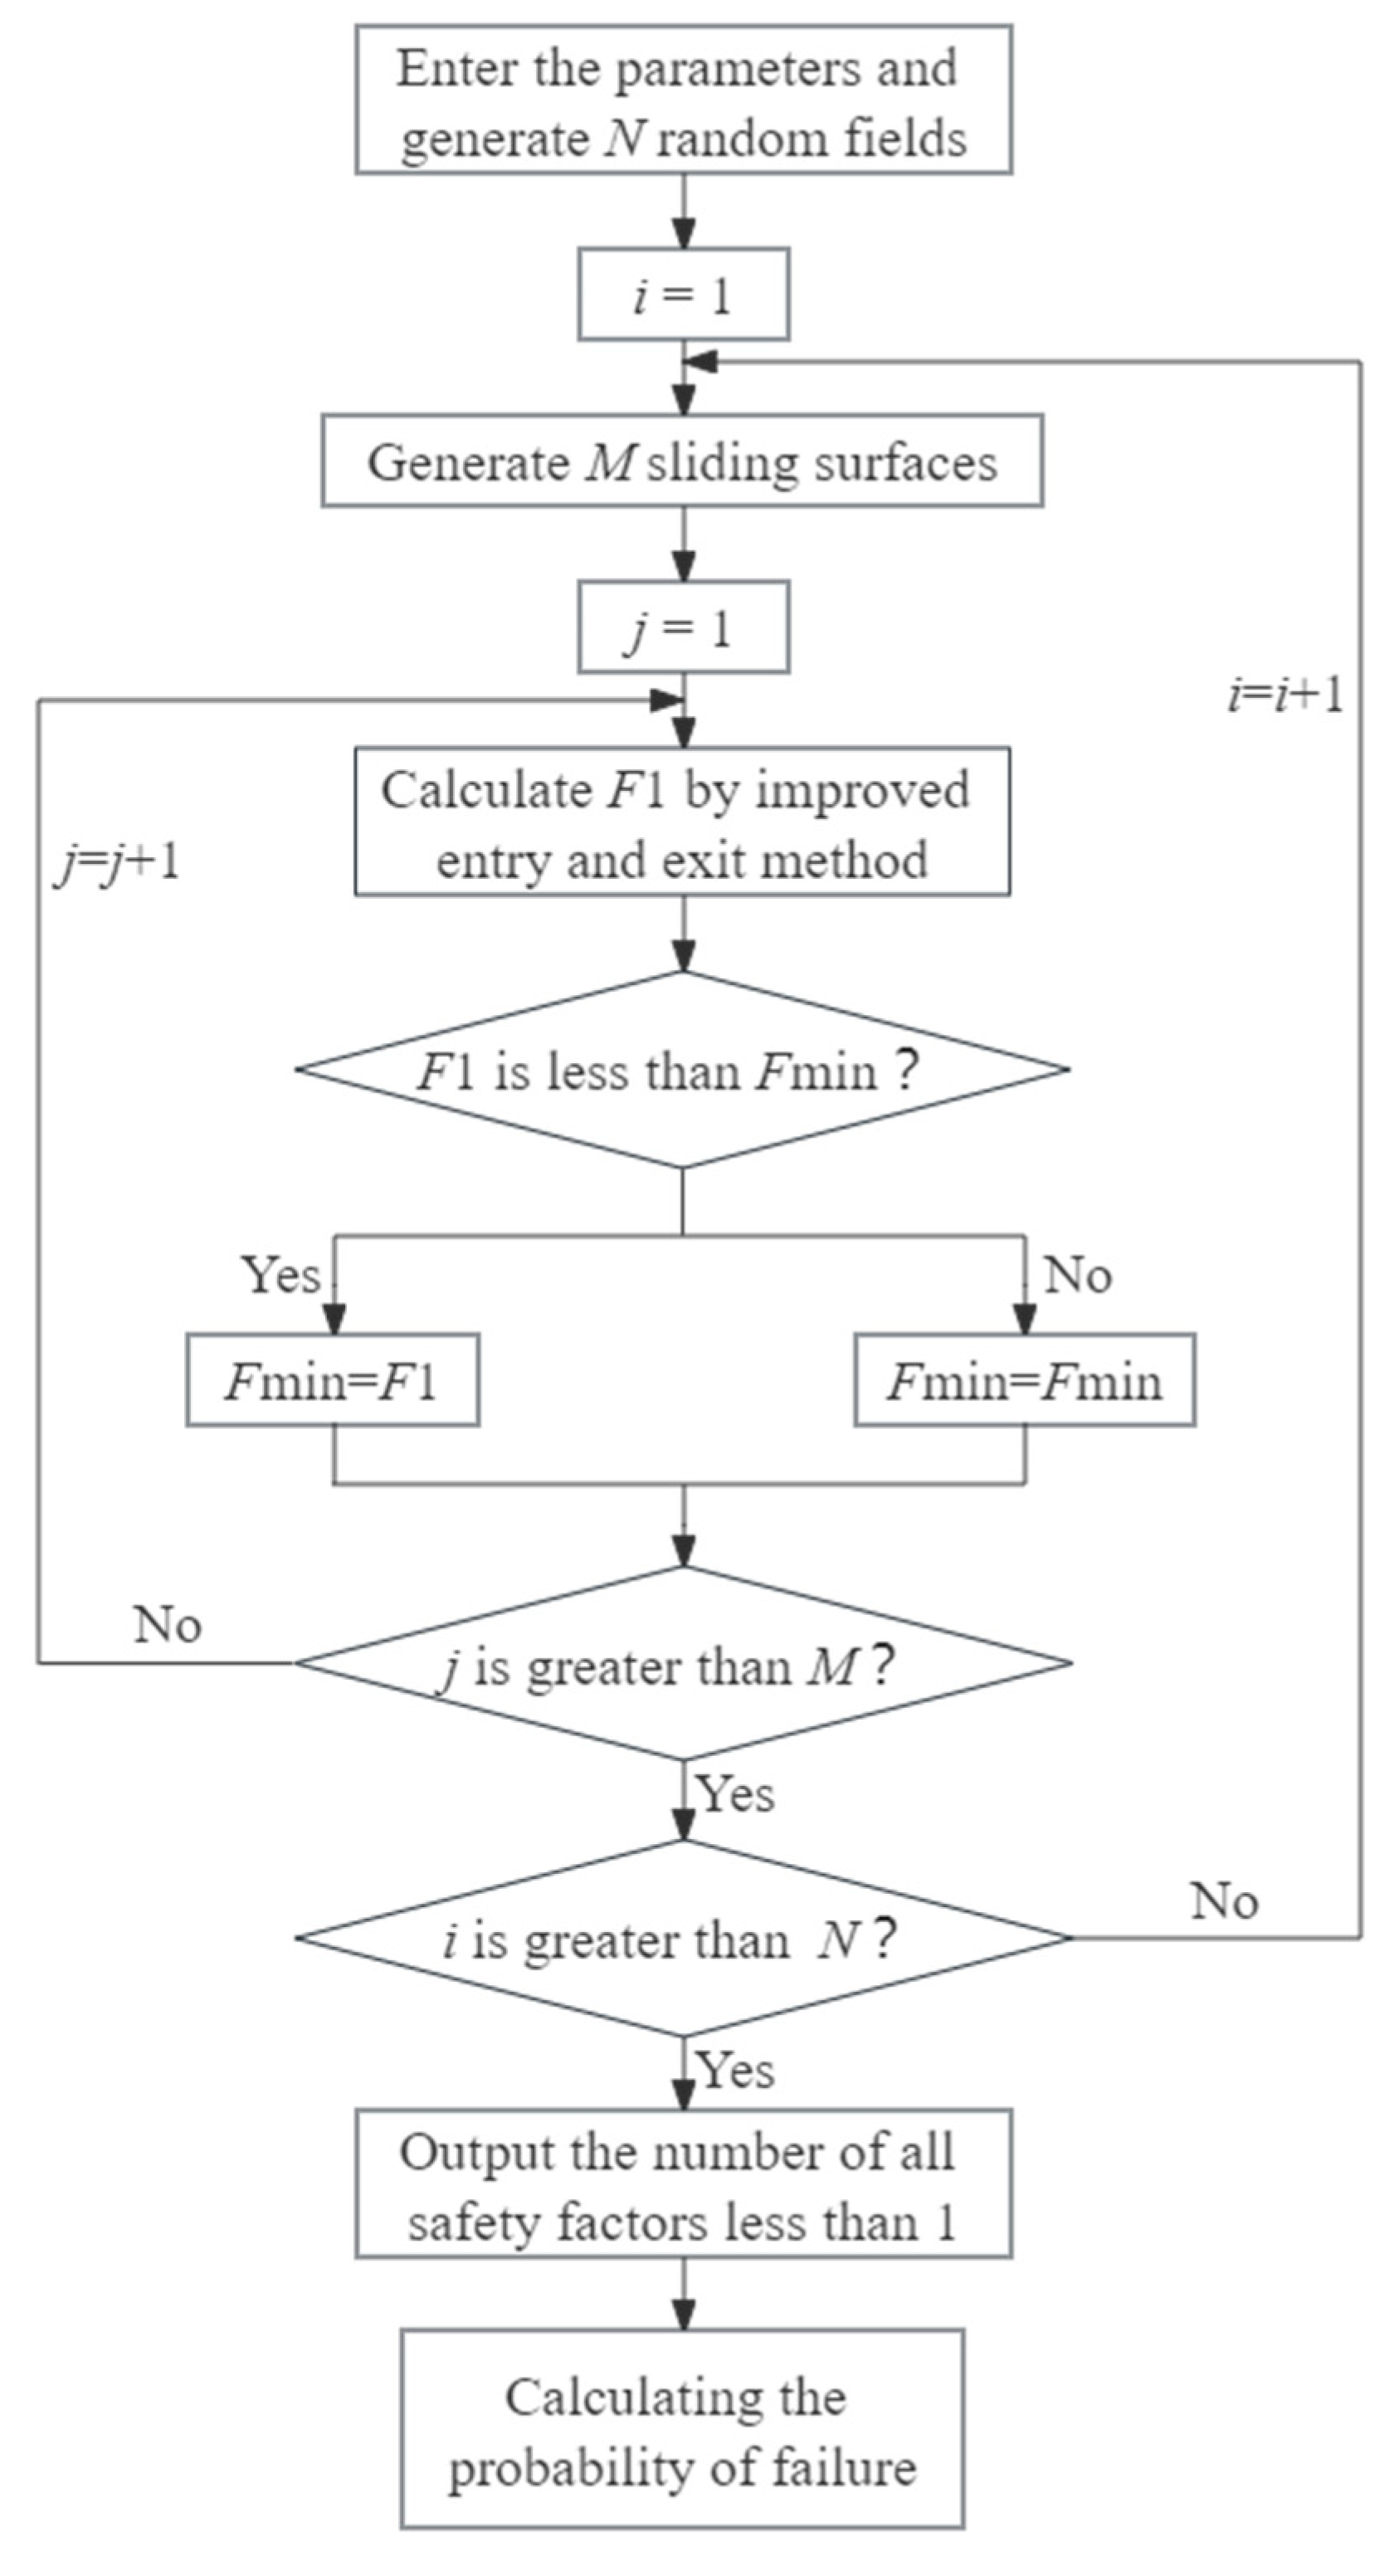
26] is used to generate two-dimensional random fields. The improved entry and exit method is used to determine the critical slip surface and the minimum factor of safety. The failure probability is obtained by using Monte Carlo simulations. The failure probability of slope is defined as
Nf/
N, where
Nf is the number of failure samples and
N is the sample size of Monte Carlo simulations. The flowchart for calculating the probability of failure is as follows:
Figure 5.
Process for calculating the probability of failure
Figure 5.
Process for calculating the probability of failure
4. Example analysis
4.1. Illustrative Example 1: Cohesive slope
Example 1 is a cohesive soil slope, which has been used by several scholars to verify the application of their methods [
11,
29,
30,
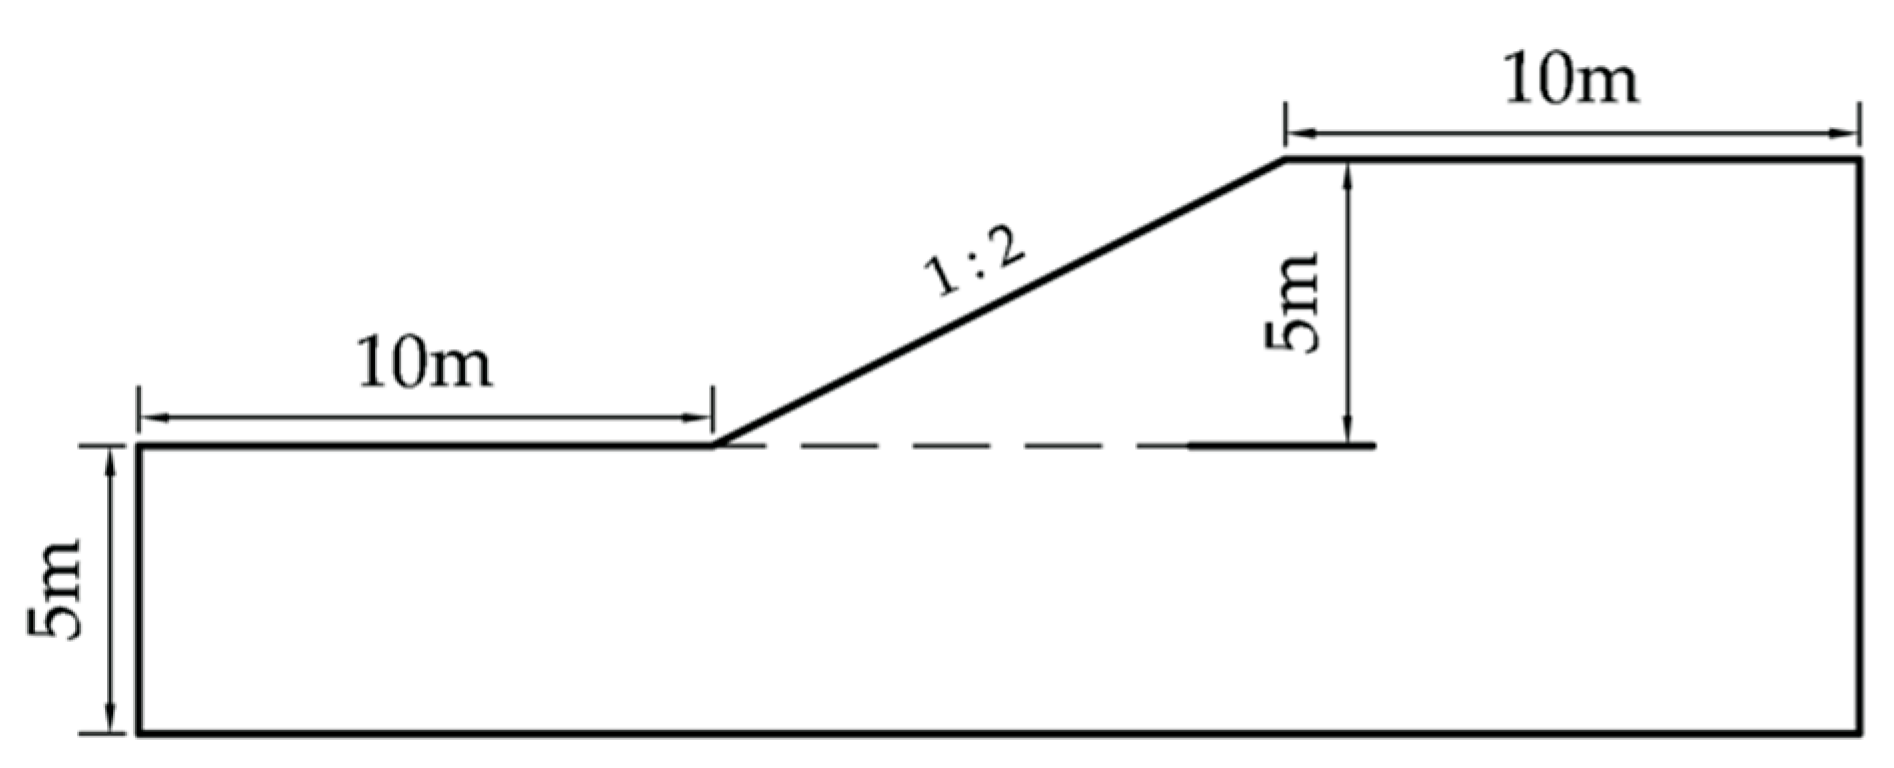
31] The same example is reanalyzed in this paper to verify the feasibility of the proposed method. The soil parameters of Example 1 are shown in
Table 1 and the geometry of Example 1 is shown in
Figure 6.
In Example 1, the number of random field samples used to perform Monte Carlo simulation is 50000. In
Table 2, the failure probability obtained by using the traditional entry and exit method is 7.84×10
-2, which is reasonable close to the calculation results of other scholars [
11,
29,
30,
31]. The minimum relative difference between the calculated failure probability in this article and those from other scholars is about 0.76%.
The failure probability of Example 1 are calculated by using the traditional entry and exit method and the improved entry and exit method with the same search accuracy. The calculated results are shown in
Table 3. As can be seen form
Table 3, failure probability increases with the increasing reduced searching range. When the reduced searching range is equal to unilateral 2
D, the calculated failure probability by using the improved entry and exit method is close to the target value. The relative difference between the failure probabilities obtained by using the traditional entry and exit method (81×81×41 trial slip surfaces is analyzed) and the improved entry and exit method (the reduced searching range is equal to unilateral 2
D) is 1.1%. When the reduced searching range is equal to unilateral 4
D, the failure probability obtained by using the improved entry and exit method is slightly smaller (0.33%) than the target value. Furthermore, when using the improved entry and exit method (the reduced searching range is equal to unilateral 2
D) to determine the critical slip surfaces, the number of slip surfaces (9764 trial slip surfaces) is about 3.6% of the traditional entry and exit method (269001 trial slip surfaces) in each simulation. When using the improved entry and exit method (the reduced searching range is equal to unilateral 4
D) to determine the critical slip surfaces, the number of slip surfaces (40788 trial slip surfaces) is about 15% of the traditional entry and exit method (269001 trial slip surfaces) in each simulation. The calculation efficiency of the improved entry and exit method is significantly better than traditional entry and exit method.
4.2. Illustrative Example 2:c-φ Slope
Example 2 is a
c-φ slope, which has been used by several scholars to verify the application of their method [
11,
30,
31,
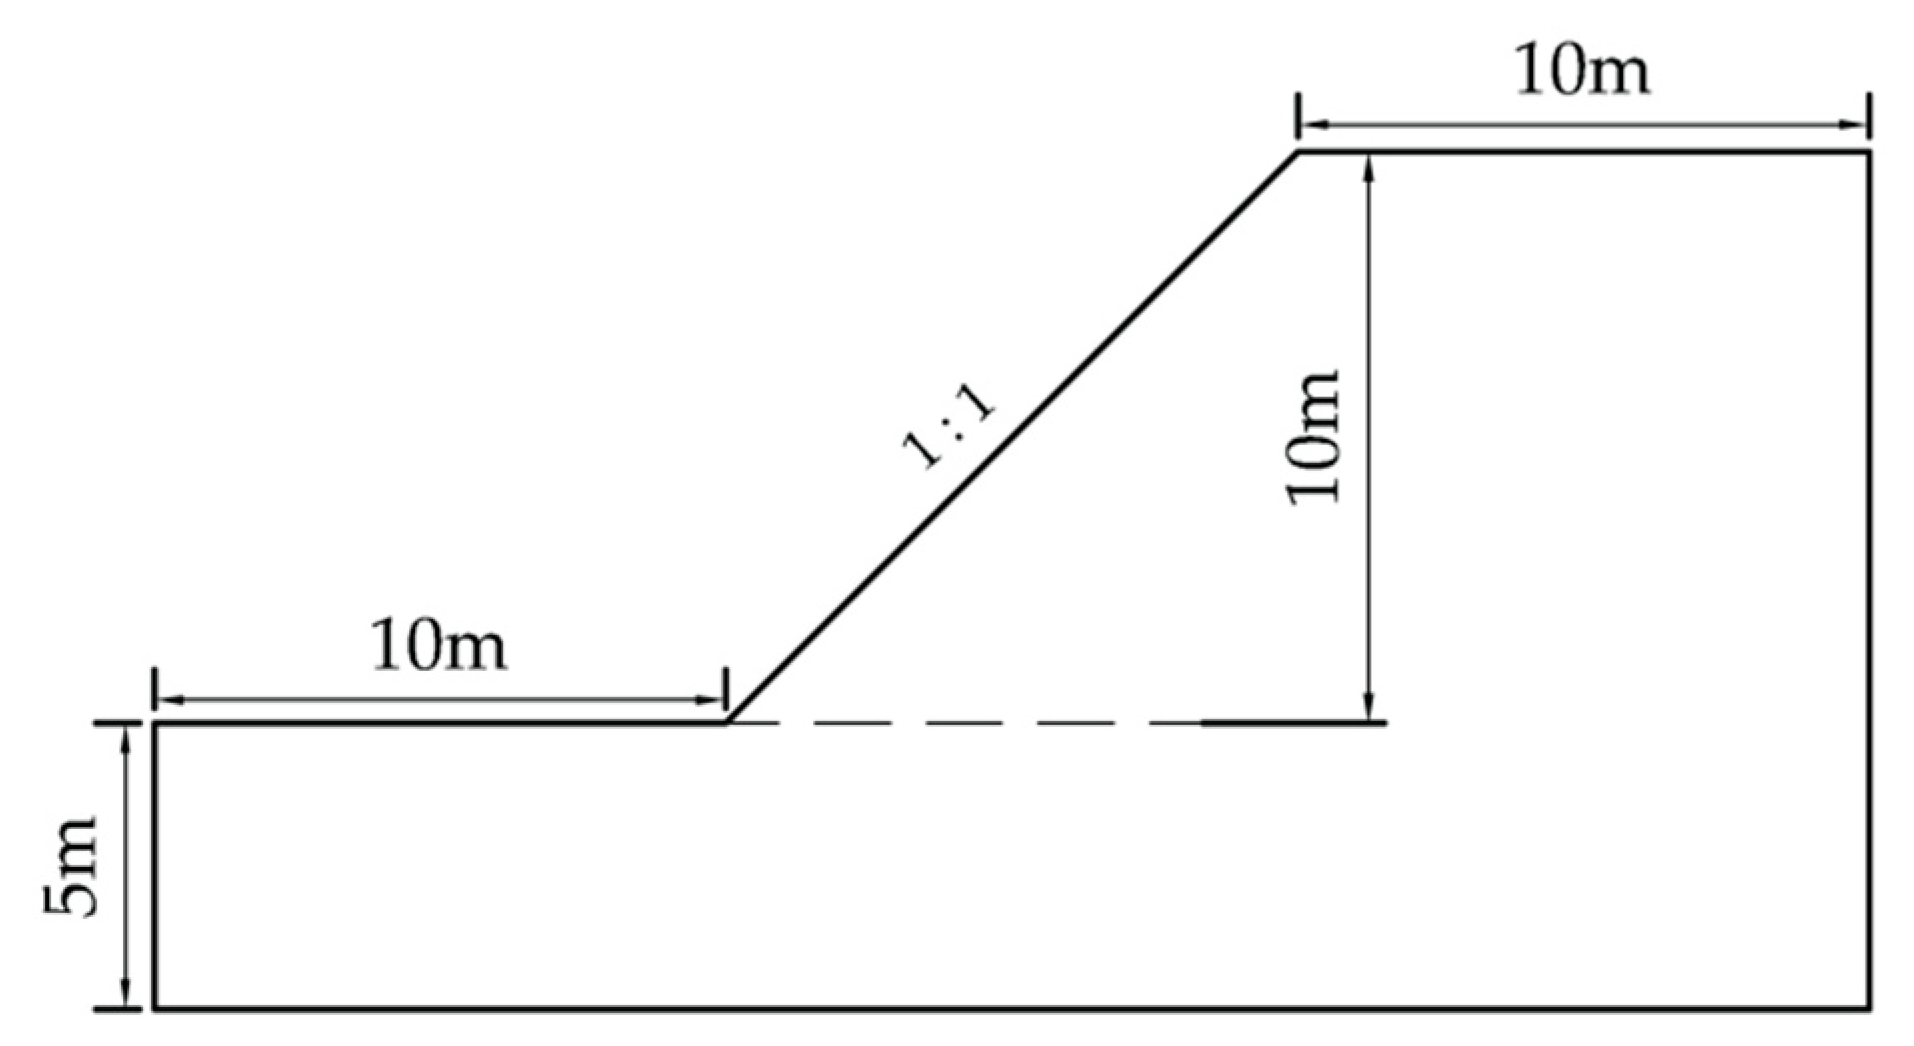
32]. The same example is reanalyzed in this paper to verify the feasibility of the proposed method. The soil parameters of Example 2 are shown in
Table 4 and the geometry of Example 2 is shown in
Figure 7.
The number of random field samples used to perform the Monte Carlo simulation in Example 2 is 50,000. In
Table 5, the failure probability obtained by using the traditional entry and exit method is 1.81×10
-2, which is reasonable close to the calculation results of other scholars [
11,
30,
31,
32]. The minimum relative difference between the calculated results in this article and those from other scholars is about 3.2%.
The failure probability of Example 2 are calculated by using the traditional entry and exit method and the improved entry and exit method with the same search accuracy. The calculated results are shown in
Table 6. As can be seen form
Table 6, failure probability increases with the increasing reduced searching range. When the reduced searching range is equal to unilateral 2
D, the calculated failure probability by using the improved entry and exit method is close to the target value. The relative difference between the failure probabilities obtained by using the traditional entry and exit method (81×81×41 trial slip surfaces is analyzed) and the improved entry and exit method (the reduced searching range is equal to unilateral 2
D) is 2.0%. When the reduced searching range is equal to unilateral 4
D, the failure probability obtained by using the improved entry and exit method is almost equal with that obtained by using the traditional entry and exit method. Furthermore, when using the improved entry and exit method (the reduced searching range is equal to unilateral 2
D) to determine the critical slip surfaces, the number of slip surfaces (9764 trial slip surfaces) is about 3.6% of the traditional entry and exit method (269001 trial slip surfaces) in each simulation. When using the improved entry and exit method (the reduced searching range is equal to unilateral 4
D) to determine the critical slip surfaces, the number of slip surfaces (40788 trial slip surfaces) is about 15% of the traditional entry and exit method (269001 trial slip surfaces) in each simulation.
Therefore, using the improved entry and exit method to search for the critical slip surface, the calculated failure probabilities are very close to the target value and greatly improve the calculation efficiency. The safety factor search method for improved entry and exit is an effective and suitable method to solve the low computational efficiency of traditional method in slope stability analysis.
4.3. Discussion on reduced searching range
4.3.1. The difference of the location between critical slip surface and potential critical slip surface
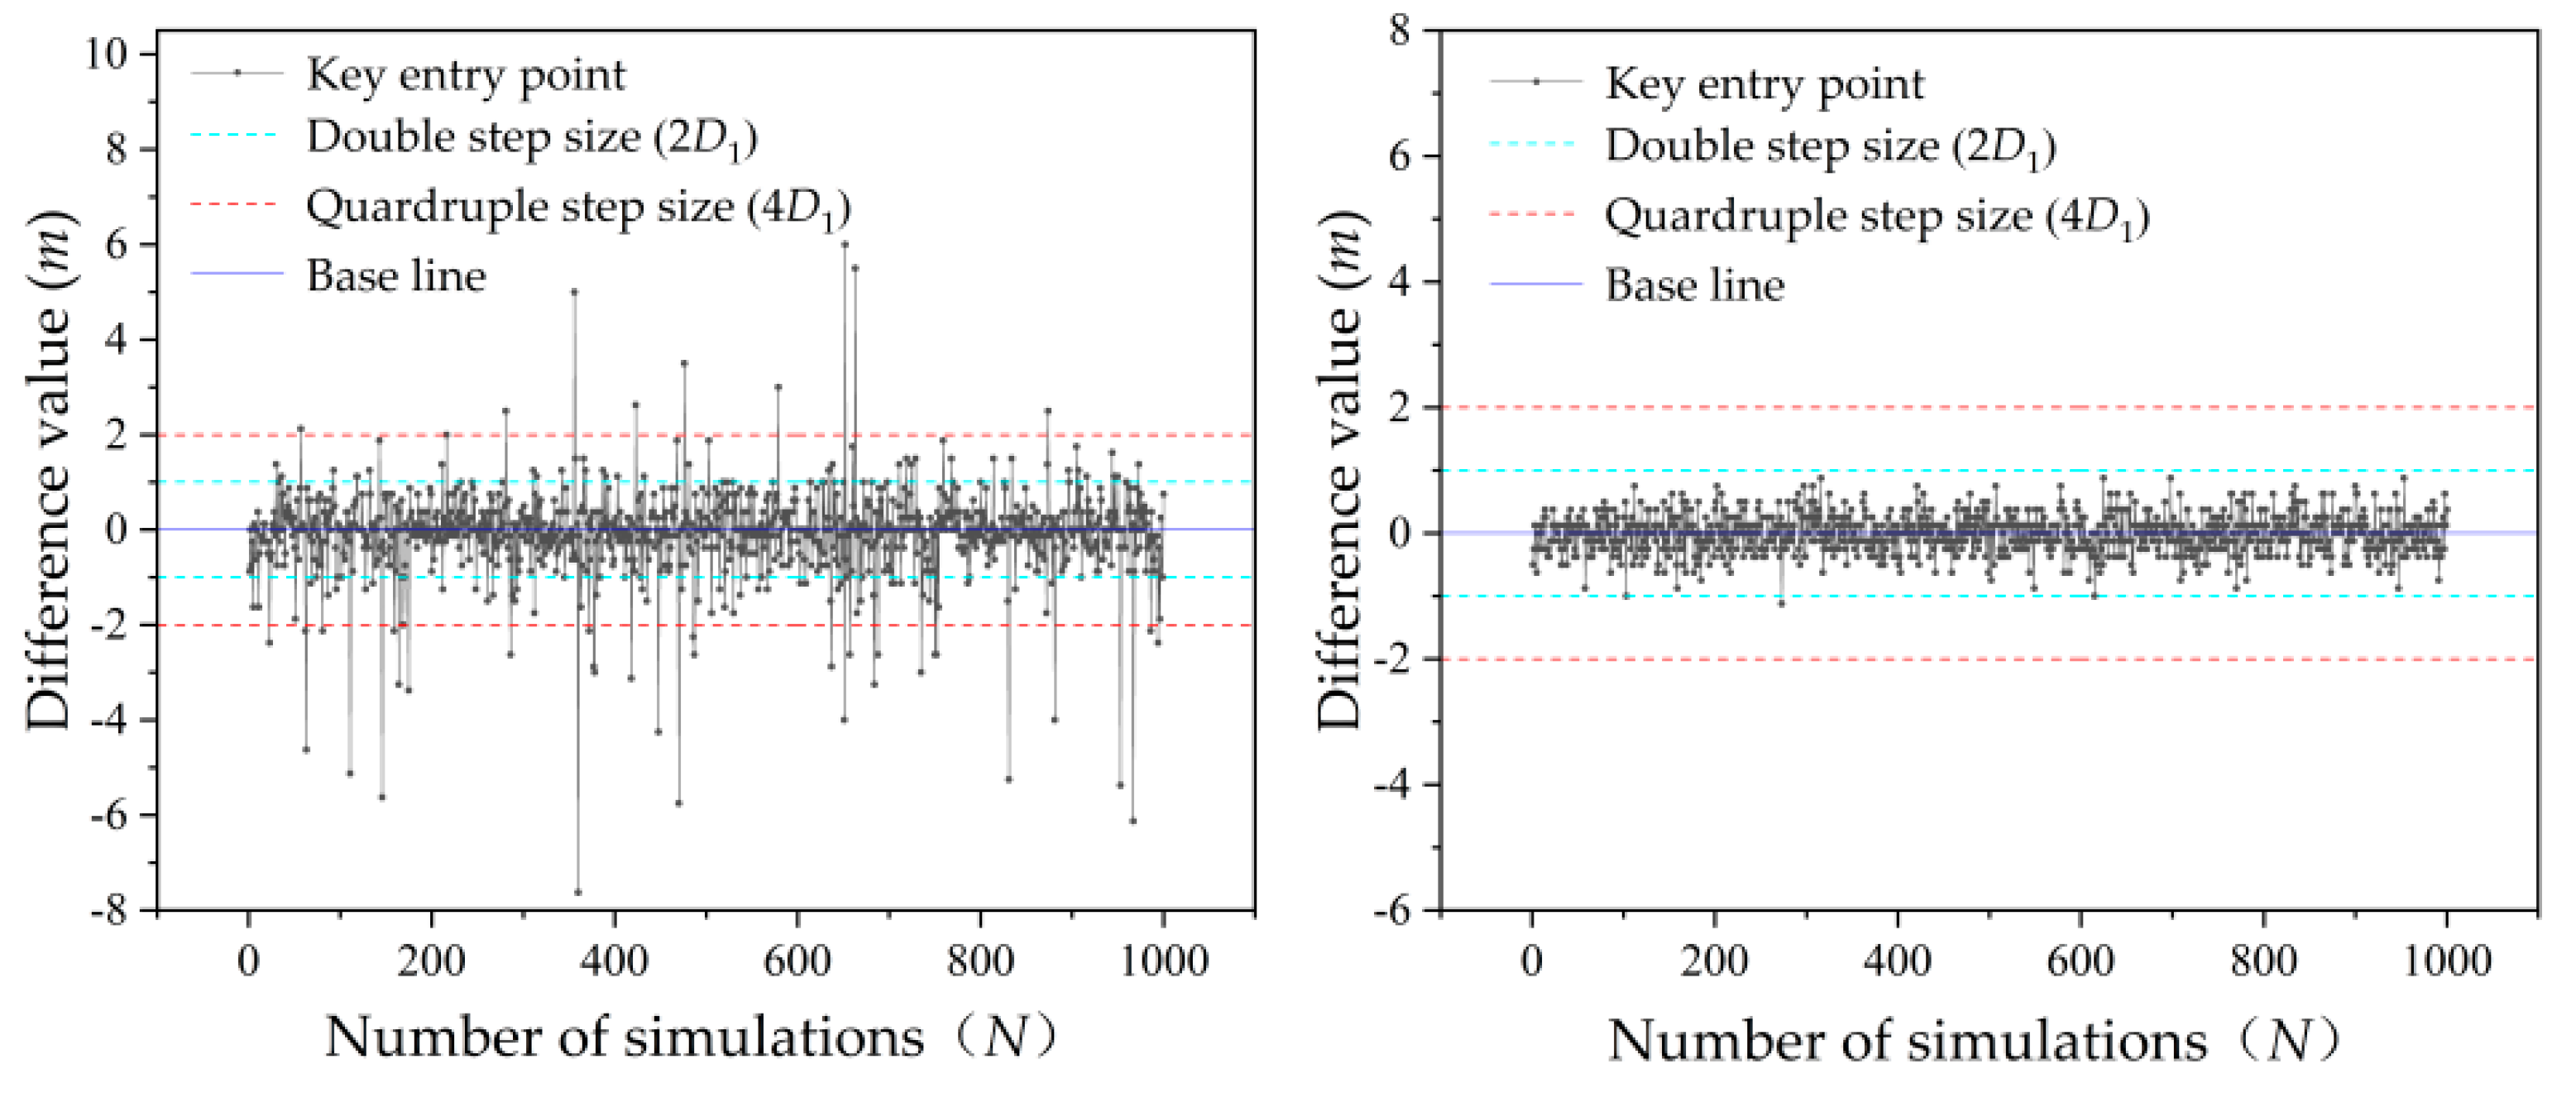
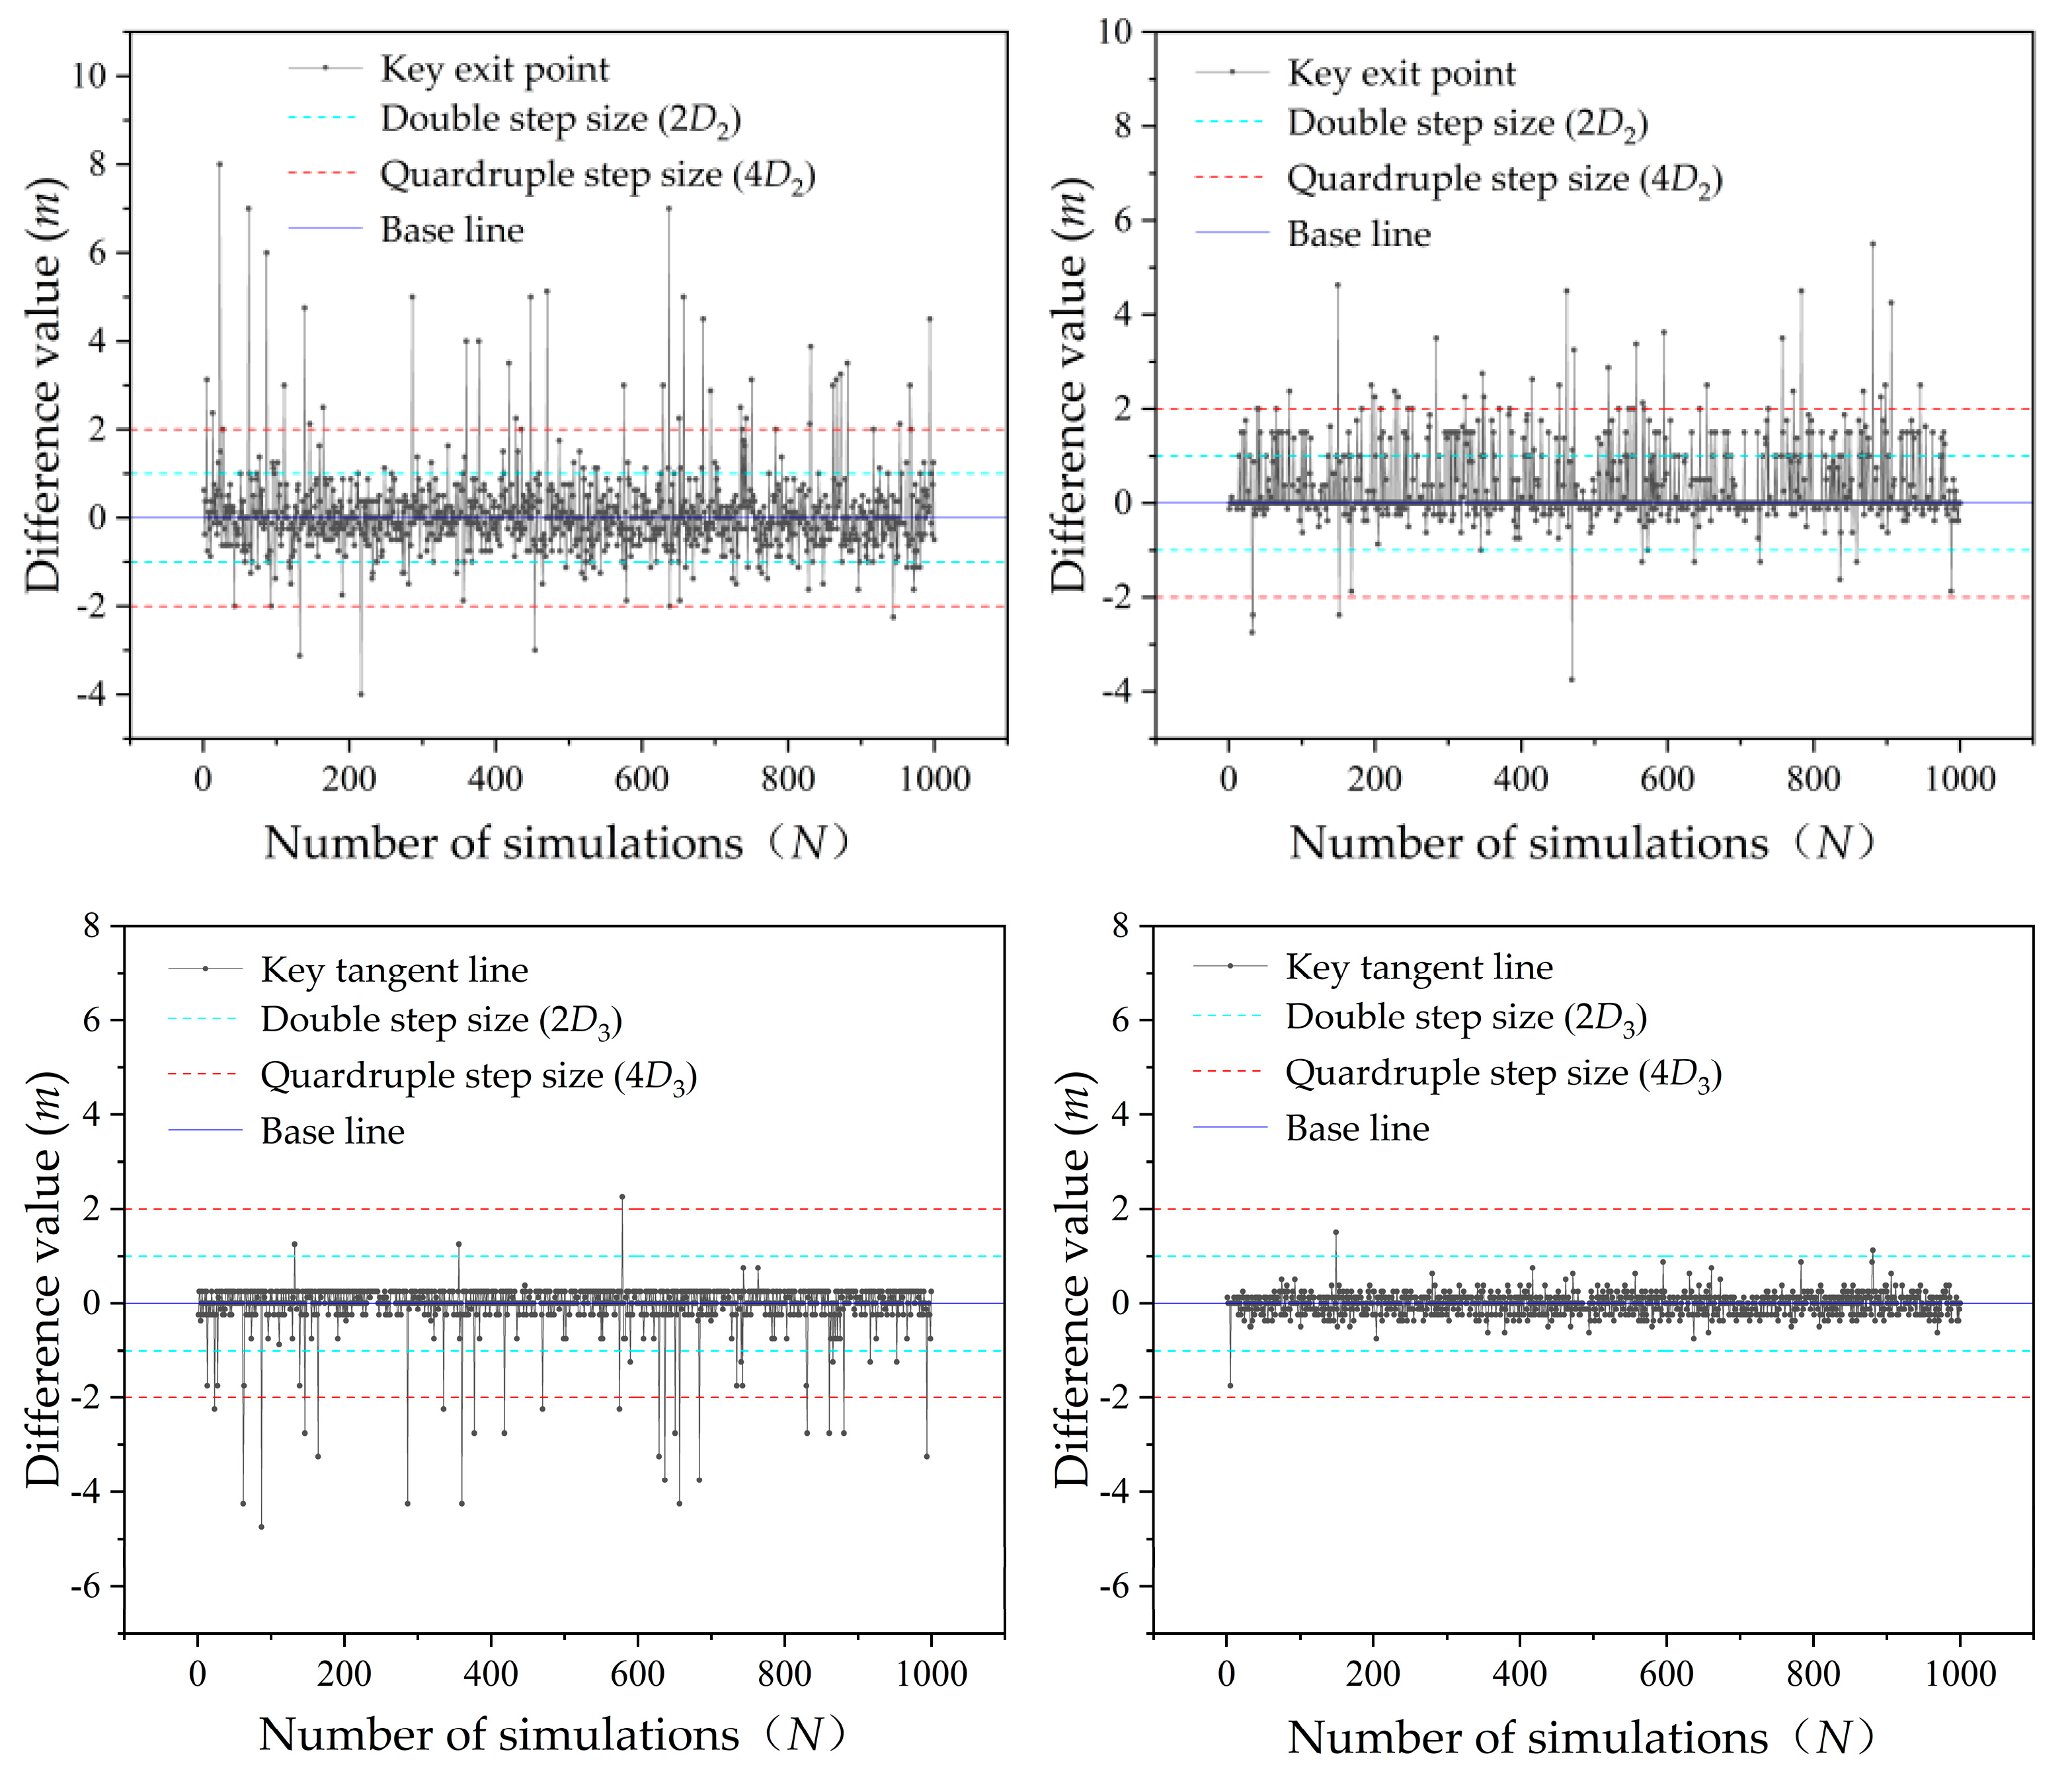
Traditional entry and exit method is used to analyze the reliability of Example 1 and Example 2. The slip surface with minimum factor of safety calculated by analyzing 81×81×41 =269001 trial slip surfaces is the critical slip surface. The slip surface with minimum factor of safety calculated by analyzing 21×21×11 = 4851 trial slip surfaces is described by using the term ‘potential critical slip surface’. The number of random field samples used to perform the Monte Carlo simulation in two Examples is 1000. The potential critical slip surface key points (key entry point, key exit point and key tangent line) position are subtracted by the critical slip surface key points(key entry point, key exit point and key tangent line) position, and the difference value is obtained as show in
Figure 8.
In the calculation results of Example 1 in
Figure 8, there are 123 exit points, 135 entry points and 36 tangent lines whose difference values exceeded the length of 2
D. There are 39 exit points, 42 entry points and 22 tangent lines whose difference values exceeded the length of 4
D. In the calculation results of Example 2 in
Figure 8, there are 163 exit points, 1 entry point,and 3 tangent lines whose difference values exceeded the length of 2
D. There are only 32 exit points whose difference values exceeded the length of 4
D. The results indicate that the most difference values do not exceed the range of 2
D, and fewer exceeded 4
D. It means that when using the improved entry and exit method, compared with the reduced searching range based on unilateral 2
D, the critical slip surface each obtained for unilateral 4
D is closer to the accurate results on global range search situation. However, the search results for critical slip surface based on unilateral 2
D are also good.
4.3.2. Further verify the reliability of the reduced searching range
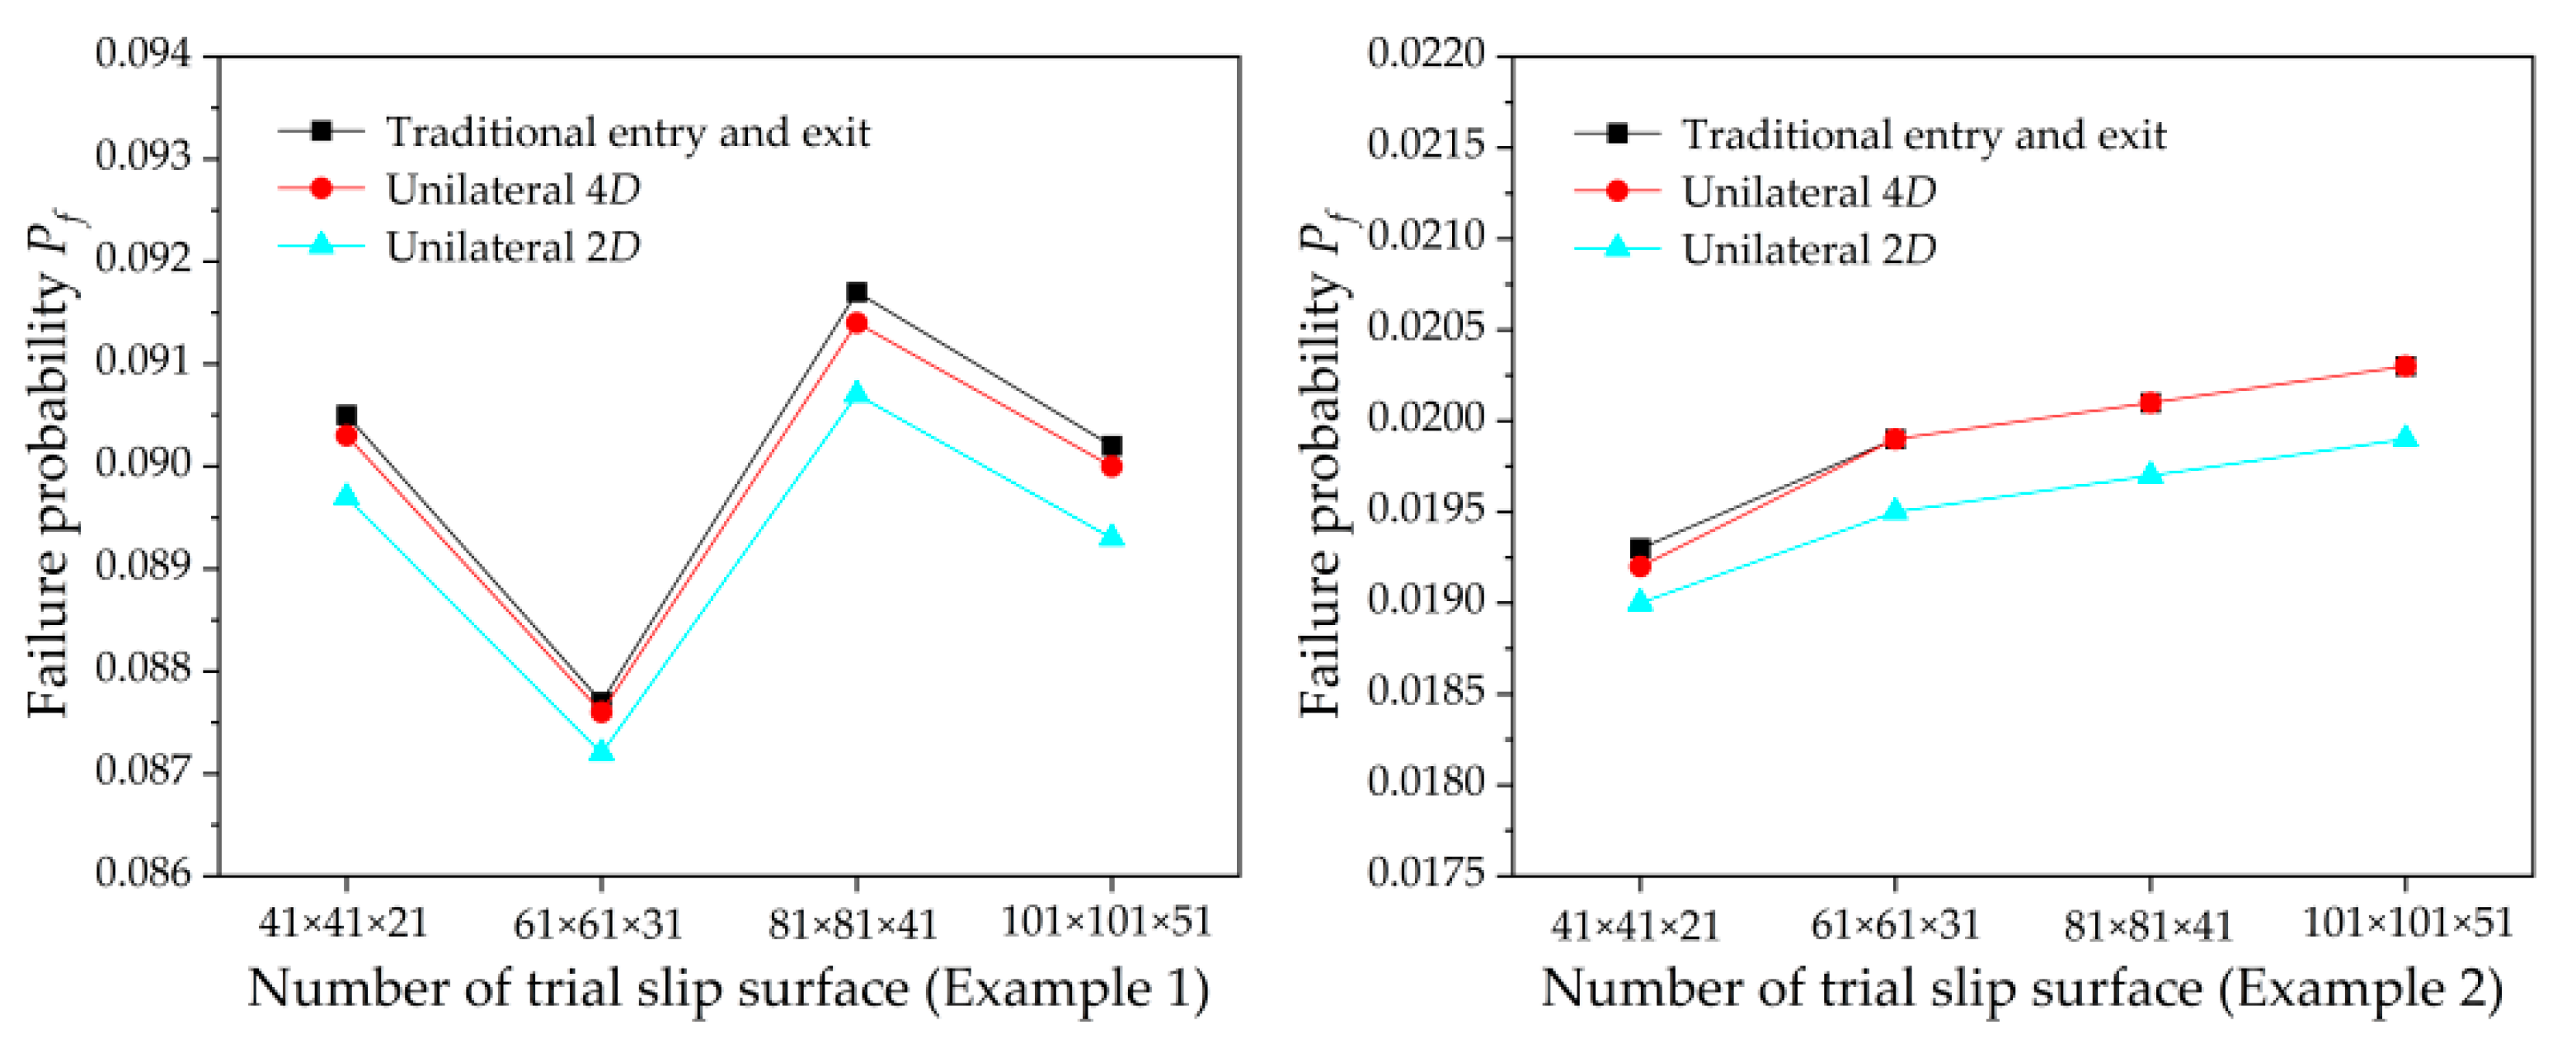
The traditional entry and exit method with different trial slip surfaces is used to calculate the failure probabilities of Example 1 and Example 2. The calculated results are shown in
Table 7. As can be seen from
Table 7, the failure probabilities increase with the number of increasing trial slip surfaces. However, the calculated failure probabilities obtained with 61×61×31 trial slip surfaces and 101×101×51 trial slip surfaces is anomalous. This is because the trial slip surfaces used to determine the critical slip surface is different. For example, the
Pf,
61×61×31 is larger than
Pf,
21×21×11 but smaller than
Pf,
41×41×21 because the set of the trial slip surfaces with 61×61×31 trial slip surfaces contains the set of the trial slip surfaces with 21×21×11 trial slip surfaces contains but intersects with the set of the trial slip surfaces with 41×41×21 trial slip surfaces. In addition, failure probabilities of Example 1 obtained by analyzing 81×81×41 trial slip surfaces is 0.0917, which is 16.9% larger than that obtained by analyzing 21×21×11 trial slip surfaces. The failure probabilities of Example 2 obtained by analyzing 81×81×41 trial slip surfaces is 0.0201, which is 11.0% larger than that obtained by analyzing 21×21×11 trial slip surfaces. This is because the more trial the sliding surfaces is analyzed under the higher the calculation accuracy, the smaller the safety factors will be. These results indicates that the calculation accuracy of the safety factor has effect on the failure probability of slope.
The failure probabilities obtained by using the improved entry and exit method with a fixed reduced searching range (unilateral 2
D and unilateral 4
D) are compared with failure probabilities obtained by using the traditional entry and exit method, as show in
Figure 9. It can be seen that when reduced searching range is equal to unilateral 2
D and unilateral 4
D, the failure probabilities is reasonable close to those obtained by using the traditional entry and exit method. The relative difference for unilateral 2
D in the results of Example 1 and Example 2 are about below 1.1% and 2.0%, respectively. The relative difference for unilateral 4
D in the results of Example 1 and Example 2 are about below 0.3% and 0.5%, respectively. These results further demonstrate the rationality of the given reduced searching range.
Note that with the aid of the improved computational efficiency offered by the proposed approach, in the practice of slope reliability analysis, the reduced searching range for the second search calculation can be reasonably selected based on the requirements of calculation accuracy.
5. Conclusions
This paper proposes an improved entry and exit method to determine the critical sliding surface and the minimum factor of safety. The improved entry and exit method is combined with the Monte Carlo simulation to calculate the failure probability of slope considering the spatially variable soils. Based on the results presented, the following conclusions can be made:
The improved entry and exit method, compared with the traditional entry and exit method, can achieve high calculation efficiency because the searching range is significantly reduced according the location of the potential critical slip surface.
The failure probability increases with the increasing reduced searching range. When reduced searching range is equal to unilateral 2D, the improved entry and exit method can obtain reasonable results in the slope reliability analysis.
The calculation accuracy of the safety factor has effect on the failure probability of slope. The failure probabilities of Example 1 and Example 2 obtained by analyzing 81×81×41 trial slip surfaces are 16.9% and 11.0% higher than those obtained by analyzing 21×21×11 trial slip surfaces, respectively.
Author Contributions
Conceptualization, R.Y. and Y.W.; methodology, R.Y.; software, B.S.; validation, R.Y., Y.W. and X.G.; formal analysis, Y.W.; resources, B.S.; data curation, X.G.; writing—original draft preparation, R.Y.; writing—review and editing, R.Y.; supervision, Y.W.; funding acquisition, Y.W. All authors have read and agreed to the published version of the manuscript.
Funding
This research was financially supported by grants of the Natural Science Foundation of Ningxia (Nos. 2020BEB04004) and the First Class Discipline Construction in Ningxia (No. NXYLXK2021A03).
Institutional Review Board Statement
Not applicable.
Informed Consent Statement
Informed consent was obtained from all subjects involved in the study.
Data Availability Statement
The date that support the findings of this study are available from the corresponding author, Yukuai Wan, upon reasonable request.
Conflicts of Interest
The authors declare no conflict of interest.
References
- Zhao, H.; Zhang, L.; Xu, L.; Chang, D. Variability of geotechnical properties of a fresh landslide soil deposit. Engineering Geology 2013, 166, 1–10. [Google Scholar] [CrossRef]
- Zhu, H.; Zhang, L.M.; Xiao, T. Evaluating stability of anisotropically deposited soil slopes. Canadian Geotechnical Journal 2019, 56, 753–760. [Google Scholar] [CrossRef]
- Bai, T.; Huang, X.M.; Li, C. Slope stability analysis considering spatial variability of soil properties. Journal of Zhejiang University (Engineering Science) 2013, 47, 2221–2226. [Google Scholar] [CrossRef]
- Ching, J.; Phoon, K. Georisk: assessment and management of risk for engineered systems and geohazards. Georisk-Assessment and Management of Risk for Engineered Systems and Geohazards 2013, 7, 209–224. [Google Scholar] [CrossRef]
- Ji, J.; Liao, H.J.; Low, B.K. Modeling 2-d spatial variation in slope reliability analysis using interpolated autocorrelations. Computers and Geotechnics 2012, 40, 135–146. [Google Scholar] [CrossRef]
- Jiang, S.; Li, D.; Zhang, L.; Zhou, C. Slope reliability analysis considering spatially variable shear strength parameters using a non-intrusive stochastic finite element method. Engineering Geology 2014, 168, 120–128. [Google Scholar] [CrossRef]
- Li, D.; Qi, X.; Phoon, K.; Zhang, L.; Zhou, C. Effect of spatially variable shear strength parameters with linearly increasing mean trend on reliability of infinite slopes. Structural Safety 2014, 49, 45–55. [Google Scholar] [CrossRef]
- Li, X.; Zhang, L.; Gao, L.; Zhu, H. Simplified slope reliability analysis considering spatial soil variability. Engineering Geology 2016, 216, 90–97. [Google Scholar] [CrossRef]
- Cho, S.E. Effects of spatial variability of soil properties on slope stability. Engineering Geology 2007, 92, 97–109. [Google Scholar] [CrossRef]
- Shu, S.; Ge, B.; Wu, Y.; Zhang, F. Probabilistic assessment on 3d stability and failure mechanism of undrained slopes based on the kinematic approach of limit analysis. American Society of Civil Engineers 2023, 21. [Google Scholar] [CrossRef]
- Cho, S.E. Probabilistic assessment of slope stability that considers the spatial variability of soil properties. Journal of Geotechnical and Geoenvironmental Engineering 2010, 136, 975–984. [Google Scholar] [CrossRef]
- Bai, T.; Huang, X.M. Limit Equilibrium Method of Slope Stability Analysis Considering Spatial Variability of Soil Properties. Journal of Southwest Jiaotong University 2014, 49, 662–667. [Google Scholar] [CrossRef]
- Jiang, S.; Huang, J.; Yao, C.; Yang, J. Quantitative risk assessment of slope failure in 2-d spatially variable soils by limit equilibrium method. Applied Mathematical Modelling 2017, 47, 710–725. [Google Scholar] [CrossRef]
- Johari, A.; Mousavi, S. An analytical probabilistic analysis of slopes based on limit equilibrium methods. Bulletin of Engineering Geology and the Environment 2019, 78, 4333–4347. [Google Scholar] [CrossRef]
- Liu, X.; Li, D.; Cao, Z. Adaptive monte carlo simulation method for system reliability analysis of slope stability based on limit equilibrium methods. Engineering Geology 2019, 264. [Google Scholar] [CrossRef]
- Ching, J.; Phoon, K.; Hu, Y. Observations on limit equilibrium–based slope reliability problems with inclined weak seams. Journal of Engineering Mechanics 2010, 136, 1220–1233. [Google Scholar] [CrossRef]
- Siegel. Computer analysis of general slope stability problems. Purdue University 1975.
- Jiang, J.; Song, K.; Fu, D. Compilation of microcomputer programs commonly used in civil engineering. Water Resources and Electricity Publishing House 1987. [Google Scholar]
- Mo, H.H.; Tang, C.H.; Liu, S.Y. Determination of the most dangerous slip surface with pattern search method. Chinese Journal of Geotechnical Engineering 1999, 21, 696–699. [Google Scholar]
- Malkawi, A.I.H.; Hassan, W.F.; Sarma, S.K. An efficient search method for finding the critical circular slip surface using the monte carlo technique. Canadian Geotechnical Journal 2001, 38, 1081–1089. [Google Scholar] [CrossRef]
- Zhang, L.Y.; Zhang, J.M. Extended algorithm using Monte Carlo techniques for searching general critical slip surface in slope stability analysis. Chinese Journal of Geotechnical Engineering 2006, 28, 857–862. [Google Scholar] [CrossRef]
- Zhang, G.Q.; Song, B.; Zhou, S.D.; Weng, J.L.; Yang, Y.H. Landslide genesis of expansive soil slope and slope stability analysis method. Yangtze River 2014, 20–23. [Google Scholar] [CrossRef]
- Wu, W.Y.; Chen, Z.Z.; Huang, L.M. A New Method for Searching Critical Folding Line Sliding Surface. China Water Transport, 95.
- Kostić, S.; Vasović, N.; Sunarić, D. A new approach to grid search method in slope stability analysis using box–behnken statistical design. Applied Mathematics and Computation 2015, 256, 425–437. [Google Scholar] [CrossRef]
- Tan, X.; Dong, X.; Fei, S.; Gong, W.; Xiu, L.; Hou, X. Reliability analysis method based on KL expansion and its application. Journal of Geotechnical Engineering 2020, 42, 808–816. [Google Scholar] [CrossRef]
- Wan, Y.; Gao, X.; Wu, D.; Zhu, L. Reliability of spatially variable soil slope based on nonlinear failure criterion. Natural Hazards 2023. [Google Scholar] [CrossRef]
- Bishop, A.W. The use of the slip circle in the stability analysis of earth slo pes. Geotechnique 1955, 5, 7–17. [Google Scholar] [CrossRef]
- Duncan, J.M. State of the art: limit equilibrium and finite-element analysis of slopes. Journal of Geotechnical Engineering 1996, 122. [Google Scholar] [CrossRef]
- Jiang, S.; Li, D.; Cao, Z.; Zhou, C.; Phoon, K. Efficient system reliability analysis of slope stability in spatially variable soils using monte carlo simulation. Journal of Geotechnical and Geoenvironmental Engineering 2015, 141. [Google Scholar] [CrossRef]
- Liu, L.; Deng, Z.; Zhang, S.; Cheng, Y. Simplified framework for system reliability analysis of slopes in spatially variable soils. Engineering Geology 2018, 239, 330–343. [Google Scholar] [CrossRef]
- Wang, B.; Liu, L.; Li, Y.; Jiang, Q. Reliability analysis of slopes considering spatial variability of soil properties based on efficiently identified representative slip surfaces. Journal of Rock Mechanics and Geotechnical Engineering 2020, 12, 642–655. [Google Scholar] [CrossRef]
- Li, D.; Jiang, S.; Cao, Z.; Zhou, W.; Zhou, C.; Zhang, L. A multiple response-surface method for slope reliability analysis considering spatial variability of soil properties. Engineering Geology 2015, 187, 60–72. [Google Scholar] [CrossRef]
|
Disclaimer/Publisher’s Note: The statements, opinions and data contained in all publications are solely those of the individual author(s) and contributor(s) and not of MDPI and/or the editor(s). MDPI and/or the editor(s) disclaim responsibility for any injury to people or property resulting from any ideas, methods, instructions or products referred to in the content. |
© 2023 by the authors. Licensee MDPI, Basel, Switzerland. This article is an open access article distributed under the terms and conditions of the Creative Commons Attribution (CC BY) license (http://creativecommons.org/licenses/by/4.0/).
