Preprint
Article

Study of Bottom-Up and Top-Down Influences in the Reading Task in Arabic

Altmetrics

Downloads

147

Views

256

Comments

0

Submitted:

25 July 2023

Posted:

26 July 2023

You are already at the latest version

Alerts
Abstract
The visual span refers to the number of letters readers can identify in a single fixation without using linguistic skills. Proponents of the visual span hypothesis postulate an influence of early visual processing on reading speed. Given the slowness of reading Arabic texts, the present work aims to study the development of the visual span and its effects on reading speed in the Arabic-speaking context. Thirty-four subjects participated in the study. The trigram task and the rapid serial visual presentation (RSVP) paradigm were used to estimate visual span size and reading speed. In line with our initial assumptions, the results showed a significant effect of grade level on reading speed (F(2,31) = 30.93, p<0.001), visual span size (F(2,31) = 20.57, p<0.001). In good alignment with previous work, our results show that visual span size could explain around 40% of the reading speed variability. Interestingly, our analyses revealed a narrowing of visual span size in our Arabic sample. The results of study 2, suggest that the poor performance in the trigram task is due to poor visual attention capacities in our Arabic readers
Keywords: 
Subject: Biology and Life Sciences  -   Behavioral Sciences

1. Introduction

The visual span[1,2] has been introduced in the reading literature as the number of adjacent letters a reader can identify without moving the eyes [3,4,5]. To measure its size, the founders were based on the recognition rates of the median letters of trigrams (random strings of three letters) presented at different eccentricities (trigram task) [4]. Numerous studies have highlighted certain factors influencing visual span size, such as visual acuity [4], letter spatial coding errors [6,7], spatial distribution [8,9], letter-spacing [10], contrast, letter size [11] and letter complexity [12]. It has also been shown that report type can influence visual span size. He et.al [13] showed a relatively larger size when using a partial report than a full report. Other studies have introduced crowding as the factor with the most significant impact on visual span size [9,14,15]. For example, Yu et al. [9] propose that 75% of information loss is due to crowding. Crowding is defined as the difficulty of identifying a target when it is surrounded or flanked by other objects. Bouma’s early work [16,17] showed that identification rates for letters flanked on both sides were lower than for letters presented in isolation (at some distance from fixation), and introduced, therefore, clutter as one of the limits of the peripheral visual field.
Several studies on crowding show that the most eccentric flankers exert a more significant effect on the target than those close to the fixation [16,18,19,20,21] and indicate an asymmetry in the interference zone. Bouma [17] explains the advantage of outer letters by the elongation of the receptive fields to the right in the right visual field (RVF), and to the left in the left visual field (LVF). Based on Bouma’s proposals, further work suggest that learning to read contributes to the elongation of receptive fields to the left and therefore propose the modified receptive fields hypothesis (MRF) as an explanation for the first letter advantage. In a series of studies on letters and symbols, the MRF hypothesis proponents suggests that the initial letter advantage appears to be letter-specific [22,23,24]. For example, Tydgat and Grainger [23] revealed significant differences in performance between letters and symbols at the initial position of sequences presented in the central vision. Similarly, Chanceaux and Graigner [22] show that letter identification performance was better than that obtained for symbols at the most eccentric position in the left visual field (LVF). In the same vein, other results [24] supported the superiority of letters over symbols and indicated that increasing the spacing between symbols contributes to improved target identification rates. It is worth mentioning that the debate surrounding the nature of the first-letter advantage is still open. Indeed, other studies using the global word paradigm [25] have shown that the first-letter advantage remains valid even when words have been presented vertically and have proposed the redirection of attention to the beginning of the word as a possible explanation for the first-letter advantage.
Given the contribution of low-level influences in the reading task, many works suggest a strong relationship between visual span size and reading speed [3,4,5,26,27,28]. Other evidence has also been proposed by perceptual learning studies [26,29]. For example, Chung et al.[29] suggest that training on the trigram task increases visual span size by around 6 bits and average reading speed by around 41%. A meta-analysis of a body of work showed a robust invariant relationship between visual span size and reading speed. Outside the alphabetic context, Chinese studies [26,30,31] similarly suggest a good correlation between visual span size and reading speed. In a recent investigation, Kwon, Legge, and Dubbels [6] highlight developmental changes in visual span size and reading speed and suggest that visual span size explains 40% of the variance in reading speed. In contrast, given the contribution of high-level influences in the reading task, the work of Awadah and colleagues also suggests a strong correlation between visual attention span (VAS) size and reading speed in young Arab readers. Note that the visual attention span refers to the number of distinct elements an observer can process simultaneously during a single fixation [32]. The VAS paradigm is based on two tasks. In the free recall task, participants are asked to report letters regardless of location. In the partial report task [33], participants must report only the cued letter after the stimulus has disappeared. Awadah and colleagues [32] show that the size of the visual attention span (VAS) in good readers was greater than that in poor readers. It is worth mentioning that the relationship between visual attention span size and reading speed was only significant in young readers [32,34].In expert reading [35], the results indicate a narrowing of the visual attention window size and slower reading in Arabic readers compared to French and Spanish readers. No significant relationship was revealed between the observed narrowing of the visual attention window size and slower reading in Arabic.
As indicated in a body of previous work, the reading speeds of Semitic Arabic texts appear to be relatively low compared to those obtained when reading alphabetic texts. For example, the results of the IReST24 group study highlight differences in average reading speeds between Arabic texts and English texts [36]. Many lines have interpreted the slowness of Arabic readers [37,38] as a result of context dependence [39], letter complexity [40], lack of global reading strategy [41], and effect of morphology [42,43]. Based on previous work proposals suggesting influences of Arabic letter visual complexity[40], on the one hand, and the low visual attention abilities[35], on the other, on letter identification and recall rates in Arabic readers, the present study aims to investigate the contribution of bottom-up and top-down processing in modulating letter identification performances and reading speed.

2. Study 1: Relationship between reading speed, visual span, crowding effect and free recall rate

2.1. Participants

Thirty-four subjects (14 Males and 20 Females) aged 8 to 14 years (11.56 ± 2.07) participated in letter identification task (Trigram task) and reading (Rapid Serial Visual Presentation - RSVP paradigm) experiments. The order of the experiments was counterbalanced between subjects. The thirty-four students were divided according to their grade level and formed three groups, 3rd grade (10 participants), 5th grade(14 participants), and 8th-grade level(10 participants). All participants had a normal or corrected-to-normal vision.

2.2. Appartus and procedure

2.2.1. Task 1: The Rapid Serial Visual Presentation (RSVP) paradigm

Reading speed was estimated by Rapid Serial Visual Presentation paradigm (RSVP). Short sentences with an average length of 5 words (average word length = 4.3 letters) were presented sequentially, and the words appeared in the same place. The experiment began with a mask of 7 hash signs (#) displayed for 1000 ms at the location where the words were presented. The first letter of the words was consistently displayed at the same position. After all, the words in the sentence had been presented, and the same mask was presented again. The participants were asked to go through a training phase before moving on to the test phase. In the test phase, the presentation of the sentences and the choice of exposure time were randomized. For each exposure time, five sentences were tested.

2.2.2. Task2: The trigram task

The measure of visual span was based on the recognition rates of the central letter of the trigrams in the letter recognition task (trigram task). The trigrams were randomly generated from 28 Arabic alphabet letters and were presented at 13 positions. The presentation positions were based on the central letters of the trigrams. For example, the letters Preprints 80457 i001 and Preprints 80457 i002 would occupy positions (-2) and (0), respectively, when displaying a trigram "Preprints 80457 i003" at location (-1), The presentation of the trigrams at different locations was random, and the exposure time for each trigram was 100 ms. The total number of trials was 130 (10 trials for each location). At the beginning of the experiment, a mask consisting of 15-hash signs (#) covering the different locations was displayed for 500 ms. The mask was followed directly by the trigram display. After the trigram was presented, a visual keyboard was displayed to allow the experimenter to enter the participant’s response.
Figure 1. A figure caption is always placed below the illustration. Shematic diagram of the trigram task and the rapid serial visual presentation(RSVP).
Preprints 80457 g001

2.2.3. Monitor, letter size and viewing distance

In both tasks, the viewing distance was 50 cm, and letters were presented in black on a white background by a Courier bold font. Letters, letter-spacing, and trigrams subtended approximately visual angles ≈ 0.27°, 0.04°, and 0.85°, respectively. Note that the shape of the letters in Arabic did not allow to fix letters ‘x-height’ (i.g. ’Preprints 80457 i004’ and ’Preprints 80457 i005’). The stimuli were presented on a Lenovo monitor (Model: ideopad100; VGA: Intel(R) Iris (TM) Graphics 5100; refresh rate: 60.003 Hz; resolution: 1366 - 768). For the trigram task, participants had to report letters while reading aloud in the reading task (RSVP). The tests were administered in a dark room.

2.3. Measures

2.3.1. The visual span measurement

The recognition rate was based on 30 observations per position [-5:5][15]. Participants were asked to recall letters according to their position in the trigram. If a letter was not reported in the correct order in the trigram, the identification was considered incorrect. The visual span size in bits was calculated by summing transmitted information in each slot. Transmitted information values range from 0 bits for a random accuracy of 3.8% (the probability of correctly guessing one of the 28 letters) to 4.8 bits for 100% accuracy.

2.3.2. Free recall (FR) and seriel recall (SR) rates

The serial recall score (SR) corresponds to performances at the level of the median trigram (obtained in the trigram task). In addition to the serial recall score (SR), a free recall score (FR) was also used. The free recall (FR) rate measurement was based on letters identity recall at the level of the median trigram (i.e., the trigram where the median letter of the trigram was displayed at position 0).

2.3.3. Crowding effect measurement

According to previous studies [15,16], the crowding effect is estimated by the difference between the recognition performance of the outer and middle letters of the trigrams. In our case, we took the difference between the initial and middle letters of the trigrams.

2.3.4. Reading speed measurement

The percentage of correct word recognition was measured for each exposure time. Reading speed was estimated based on the exposure time that allowed participants to read 80% of the words correctly. The exposure time was estimated using a cumulative function fit (glmer -R Language). Reading speed was calculated using the following formula:
R s = 60 / E x p ,
where Rs is reading speed (in words per minute), and Exp is the exposure time to the criterion word (in seconds).

3. Results

3.1. Reading rate analysis

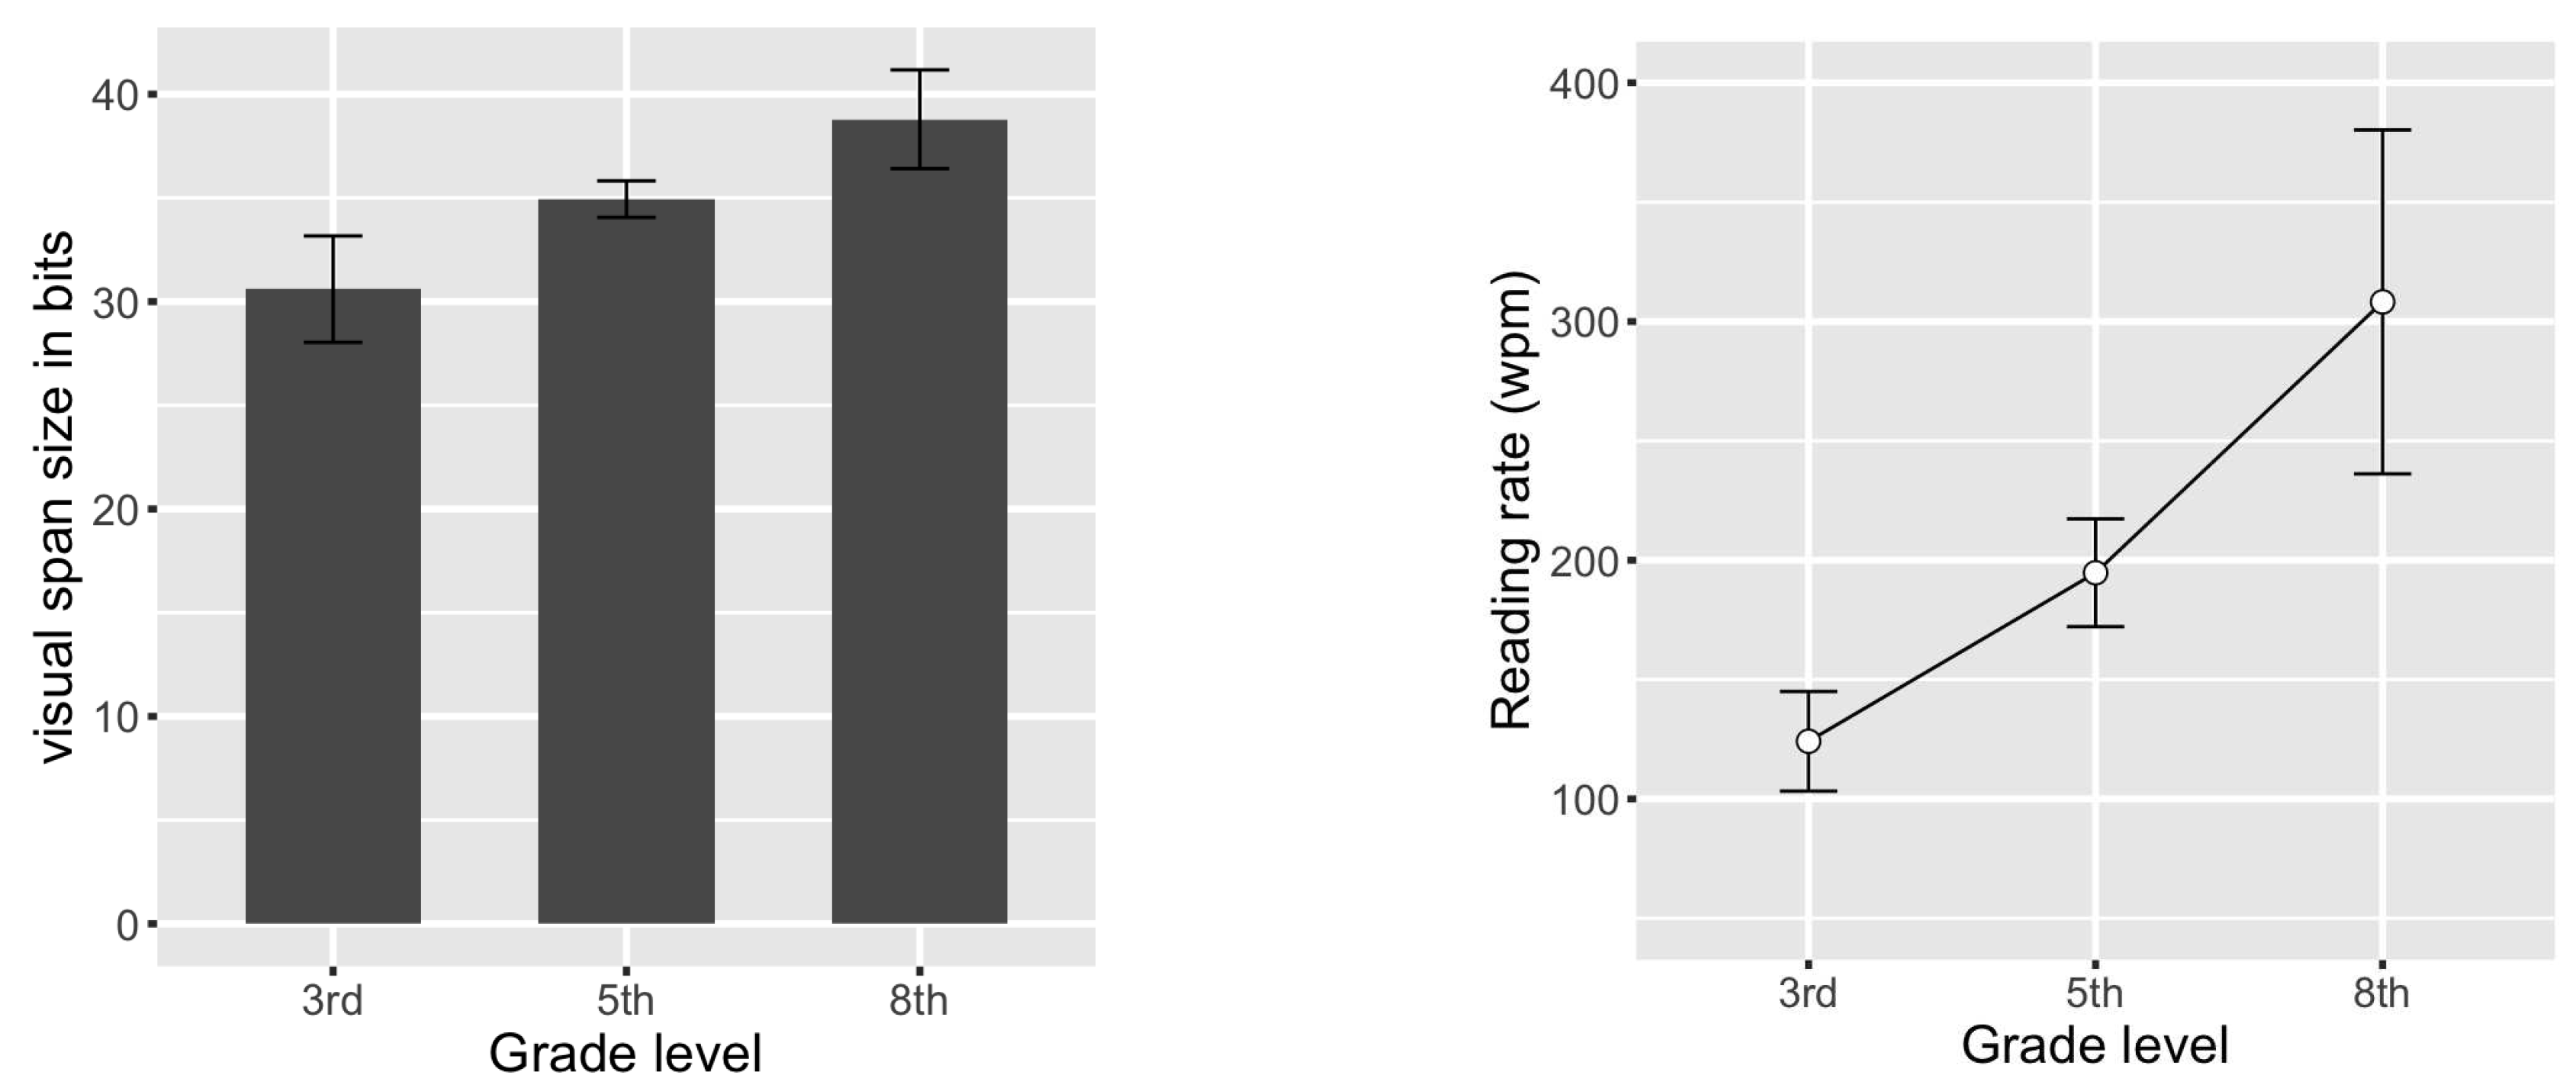
A one-way analysis of variance (ANOVA)with the grade level as between factor showed significant effect of grade-level on reading performance (F(2,31) = 30.93, p <0.001). Reading speed average (expressed in milliseconds) of the third-grade level (M=124.14, SD=31.06) was lower in comparison with those of the fifth (M=194.73, SD=37.33) and the eighth-grade levels (M=308.21, SD=100.71). Pairwise comparisons using Tukey test showed significant differences between all pairs(p<.001).

3.2. Visual span analysis

A one-way analysis of variance (ANOVA) with the grade level as between factor showed significant effect of grade-level on visual span size (F(2,31) = 20.57, p <0.001). The eight-grade students had a large visual span compared to that in the fifth-grade (Estimate=-4.09, SE=1.23, t=-3.327) and the in the third-grade (Estimate=-8.19 , SE=1.28, t=-6.411). The third grade students showed a narrower visual span in comparison with that of the fifth grade (Estimate=-4.10, SE=1.20, t=-3.422). A paired-samples t-test showed that the difference between the right (M = 13.45, SD = 2.73 bits) and the left (M = 12.79, SD = 2.56 bits) areas, was not statistically significant (t(33)=1.60,p>0.05).
Figure 2. Visual span size and reading speed as a function of grade level. Error bars indicate 95% confidence intervals.
Preprints 80457 g002
Table 1. The visual span size as function of grade level
Grade level Mean (SD)
Third grade 29.54 (4.54) bits
Fifth grade 34.19 (3.25) bits
Eight grade 39.06 (5.79) bits

3.3. Free recall (FR) and serial recall (SR) rates analysis

Kruskal Wallis test results showed a significant effect of grade level on free recall (H(2)=16.33, p<0.01) and serial recall (H(2)=8.57, p<0.05) rates. Pairwise comparisons using the Wilcoxon rank sum test with Bonferroni correction showed significant differences in the free recall rates between the three grade levels. While for the serial recall, significant differences were revealed only between the third and eighth graders.
Table 2. Recall rate across the tree languages
3rd 5th 8th
Recall type Mean (SD) Mean (SD) Mean (SD)
Free recall (FR) 2.50 (0.31) 2.73 (0.09) 2.91 (0.11)
Serial recall (SR) 2.45 (0.36) 2.66 (0.14) 2.81 (0.21)

3.4. The crowding effect analysis

Our analysis reports a decrease in the crowding effect when increasing grade level. Results show that the third (M=12.29, SD=2.44) and fifth graders (M=11.94, SD=1.91), suffer from crowding more then the 8th graders (M =9.02, SD=2.48). Analysis of variance (ANOVA) showed an effect of grade level on the crowding effect (F(2,31) = 6.56, p <.001). Pairwise comparison using the Tukey test indicated a significant difference between the eighth and the third grade (Estimate=3.274, SE=0.99, t=3.299), and between the eighth and the fifth grade (Estimate=2.918, SE=0.95, t=3.054 ). No difference was found between the fifth and the third-grade levels (Estimate=0.356, SE=0.93, t=0.382).

3.5. Relationship between reading rate, visual span, Recall rate, and crowding effect

Reading speed showed a good relationship with visual span size (r = 0.63, p <.01) and free recall rate ( ρ = 0.53, p <.01 ). In contrast, no relationship has been established between reading speed and crowding effect (r = -0.27, p >.05). At the same time, correlational analyses show that the visual span size was strongly correlated with the free recall rate (FR) ( ρ =-0.60, p<.01) and the crowding effect size (r = -0.70, p <.05). In addition, analyses showed a moderate correlation between the crowding effect size and the free recall rate (FR) ( ρ =-0.35, p<.01). Data fit using a linear regression model suggests that visual span size could explain approximately 40% of the variability in reading speed ( R 2 = 0.40, p < 0.01 ). Similarly, a linear regression model suggests that the crowding effect could explain about 49% of the variability in the visual span size. Data fit using a model with free recall rate and crowding effect as predictors explains approximately 0.72% of the variability in the visual span size.
Table 3. Relationship between variables
Variables VSpan FR SR Crowding log reading rate
VSpan 1
FR 0.60** 1
SR 0.52** 0.82** 1
Crowding -0.70** -0.35* -0.18 1
log Rd rate 0.63** 0.53** 0.27 -0.27 1
Figure 3. Relationship between reading rate, visual span size, and the crowding effect.
Preprints 80457 g003

4. Discussion

In line with the findings of Kwon, Legge, and Dubbels [6], our data revealed developmental changes in visual span size in Arabic readers. As the results show, third-grade subjects showed a narrower visual span compared with those obtained in fifth grade and eighth grade. In agreement with the results of previous work, our data emphasized the effect of grade and age on reading speed [6,44,45], memory capacity [46,47] and crowding [15]. In line with our previous assumptions, our findings supports the close relationship between visual span size and reading speed [3,4,6,27], and indicate that visual span size contributes to an explanation of 40% of the variability in reading speed in our Arabic sample. In good alignment with the proposals of Kwon et al. [15] suggesting the absence of a relationship between reading speed and the effect of clutter, our analyses revealed no significant correlation. Interestingly, our analyses revealed strong correlations between reading speed and free recall rate (FR). In the first instance, this result can be interpreted by the proposals of proponents of the visual attention span [32,34]. For example, the results of Awadah et al.[32] emphasized a significant relationship between free recall rate (FR) and reading speed.On the other hand, given the display of words in the rapid visual serial presentation task, the significant relationship between reading speed and free recall rate (FR) is likely a direct contribution from visual short-term memory [48,49]. In the rapid serial visual presentation (RSVP) paradigm, the presentation of sentence words was very brief and ended before participants finalized their reading. Similar to the free recall (FR) task, the order of the words read in the RSVP task was not considered. In other words, word transpositions within the sentence during reading were not considered. We suggest that Rapid Serial Visual Presentation (RSVP) solicited information (words) retention in visual short-term memory. Another result that requires particular attention in future work is the relationship between clutter size and free recall rate. Even though the performances obtained in the free report (FR) and serial report (SR) (at the median trigram level) were highly correlated, only the relationship between the free report (FR) score and the crowding effect was significant. Not far from what our results suggest, we point to the results of a recent work indicating the contribution of visual memory in the crowding phenomenon [50] .
On the other hand, our analyses revealed a significant relationship between visual span size and free recall rate (FR). Note that the present study’s visual span size estimation was based on the recall of the three trigram letters [6] and not only on the central letter [4]. In a study by He et al.[13], the authors compared the visual span sizes obtained from two recall methods. The first method is based on the partial recall rate (of the central trigram letter). The second method considers the serial recall rate (SR) of the three trigram letters. The results showed that the size of the visual span was larger when using the partial report. In light of this, the authors suggest that the reduction in visual span in the second method (serial recall of the three-letter trigram) appears to be related to visual memory influences. We suggest that the well-established relationship between free recall rate (FR) and visual span size makes explicit high-level influences in the trigram task. Indeed, the results of Awadah et al. [32] show that the free recall rate (FR) for four-letter sequences in young Arabic readers (fourth and fifth levels) varied between 2.53 and 3.37. We suppose that the narrowing revealed in visual attention span size in Arabic readers [35] could explain our sample’s narrowing visual span size. For example, the results of the latter study [35] show that the performance of expert Arabic readers was lower than that of French and Spanish readers in the free recall (FR) task, while no effect of the visual complexity of Arabic letters [40,51] was revealed. For more visibility, we conducted additional studies to investigate our sample’s observed narrowing of visual span size.

5. Study 2: Factors influencing letter identification in the trigram task

5.1. Material and methods

5.1.1. Participants

Same as study 1

5.1.2. Measures and data analysis

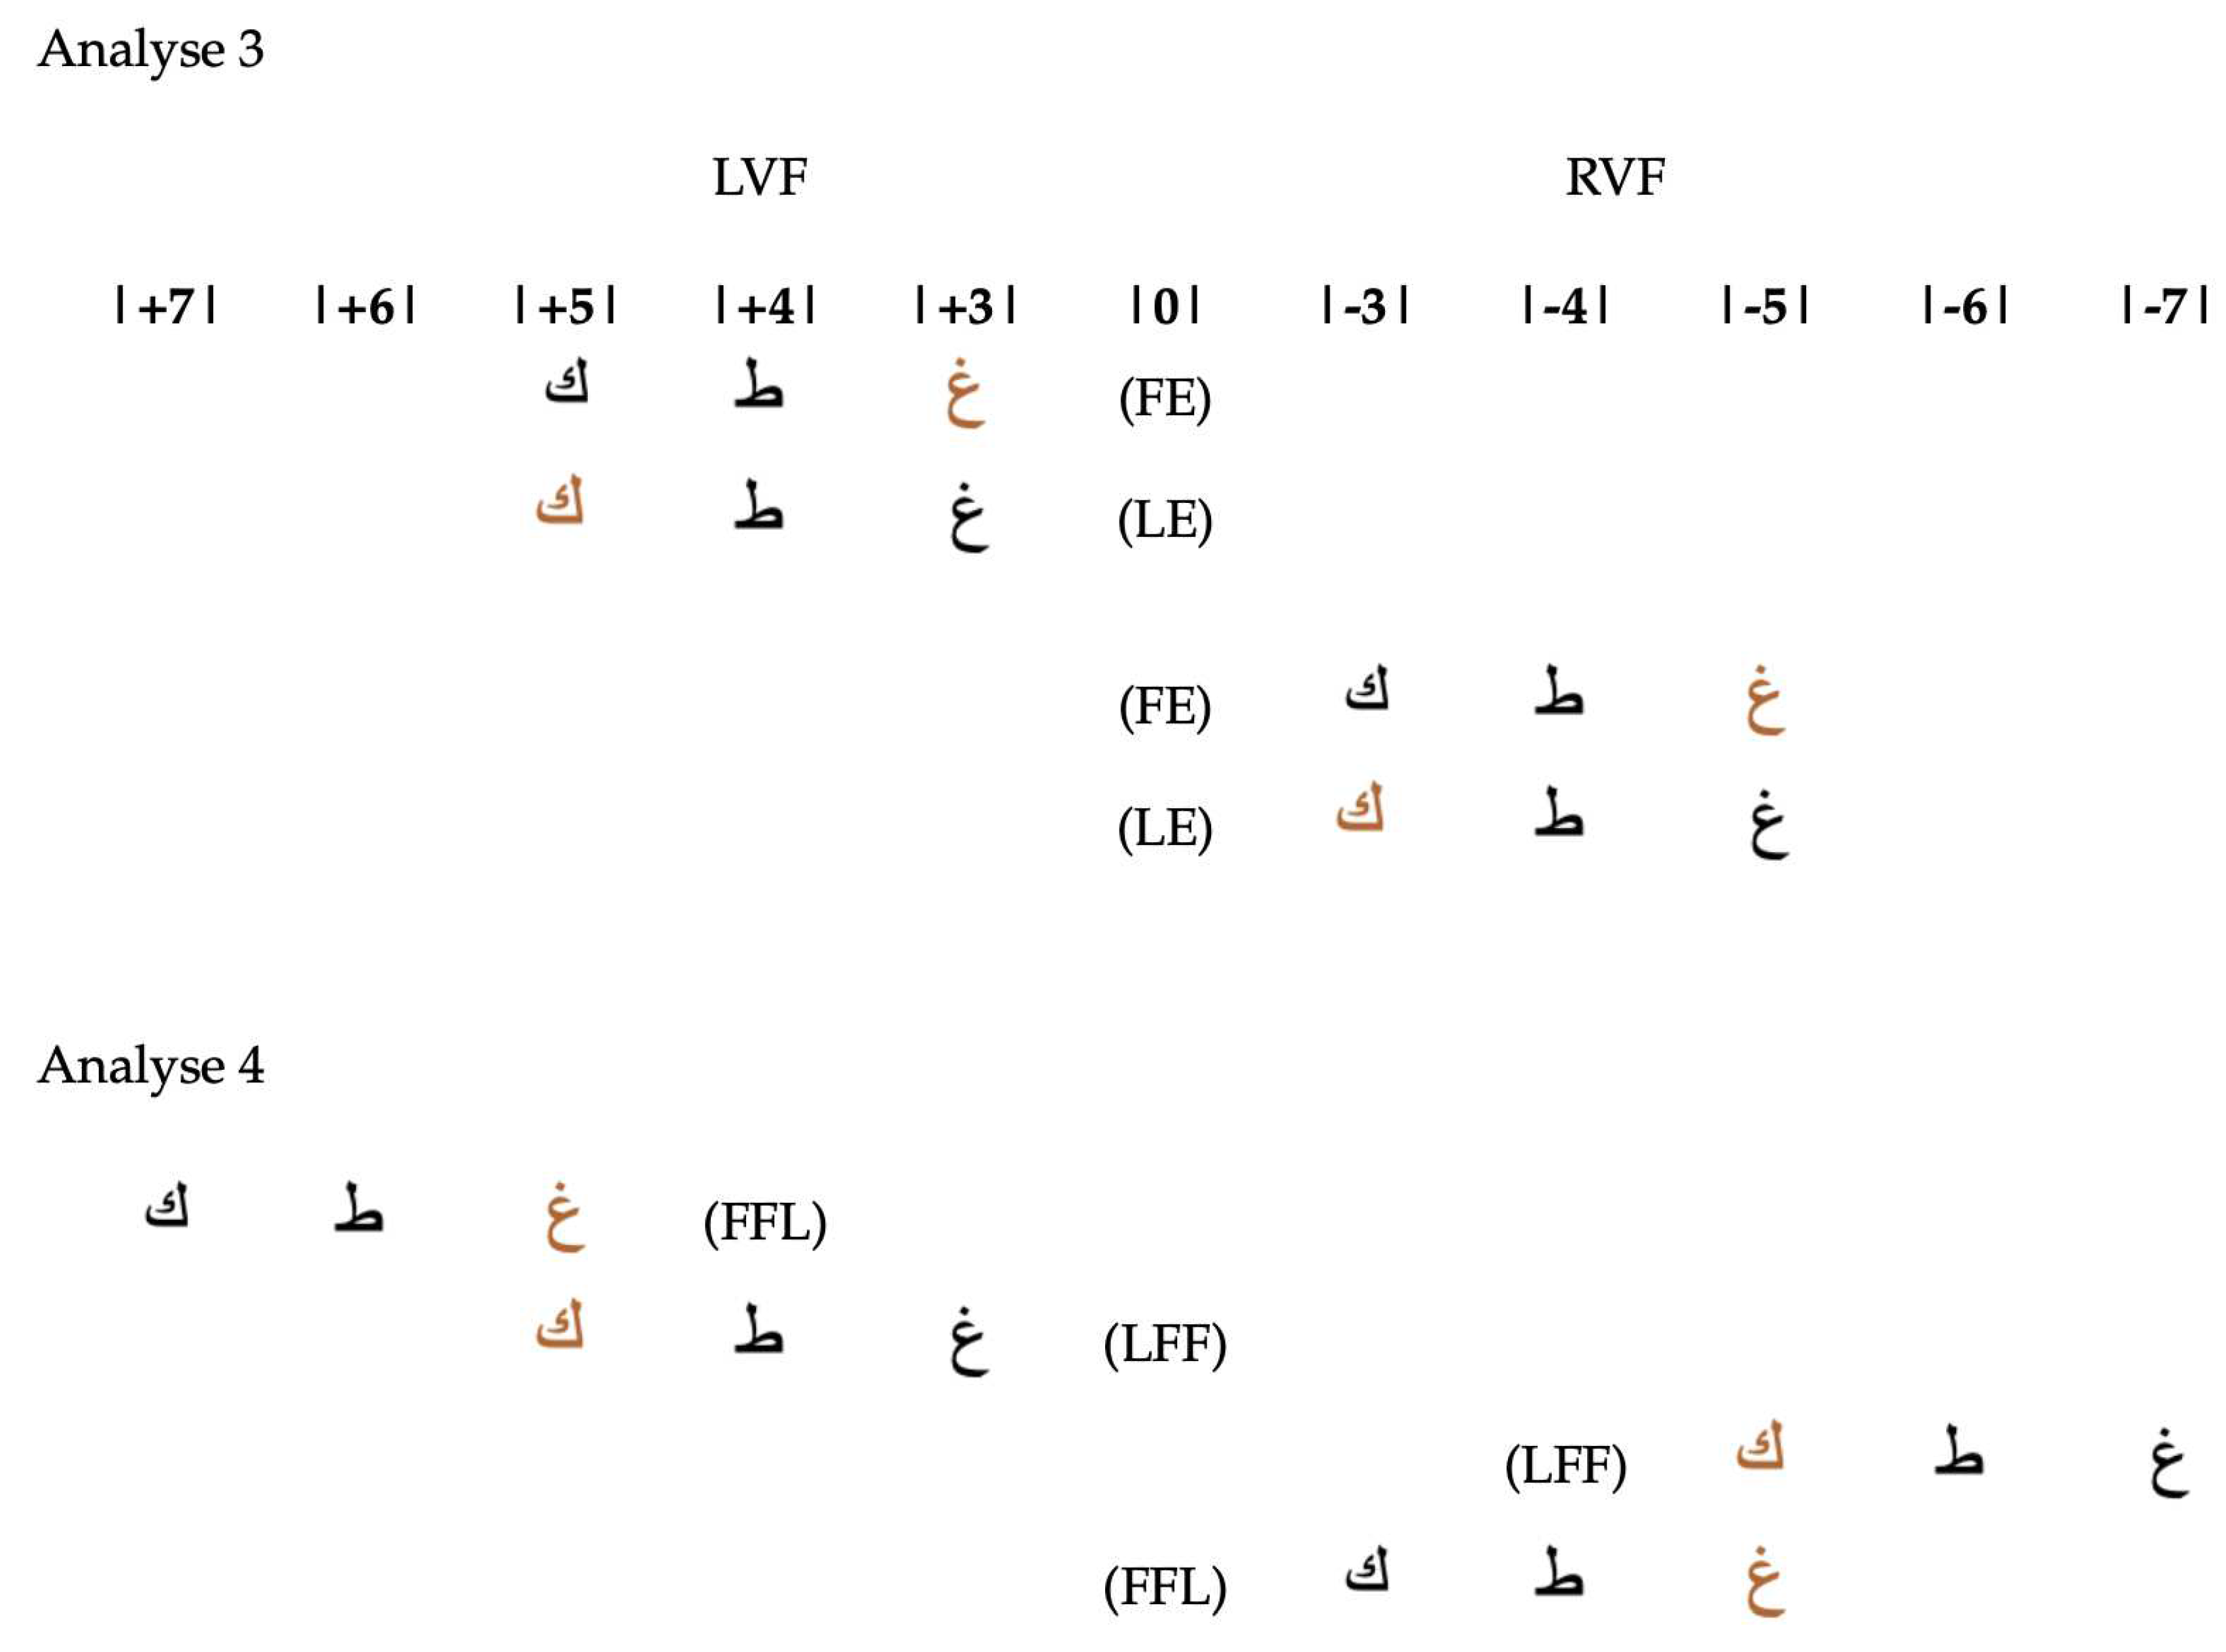
In this study, our analyses focused on participants’ performance in the central vision (trigram located at position 0°) and in the parafoveal regions (trigrams occupying positions -4/+4 of the horizontal meridian line). In the first analysis, we studied the modulation of the probability of correct response (SR) as a function of the visual field (CENTER, LVF, and RVF) and letter position in trigrams (P1, P2, and P3). In the second analysis, we compared the performances obtained from the two types of report (SR) and (FR). We recall that the serial report (SR) considers the letter’s identity and location. While the free recall (FR) only takes into account the identity of the letters. In the third analysis, we analyzed the partially correct answers. These responses were segmented into two categories: (a) first item error (FE), in which the first item was reported incorrectly while the last item was reported correctly, (b) last item error (LE), in which the last item was reported incorrectly while the first item was reported correctly. The normalized frequencies of the FEs or LEs responses were calculated in both visual fields (LVF and RVF) by combining the trigram data (at locations -4/-6 and +4/+6) as follows:
N o r m a l i s e d ( F E ) = F E / ( F E + L E )
N o r m a l i s e d ( L E ) = L E / ( F E + L E )
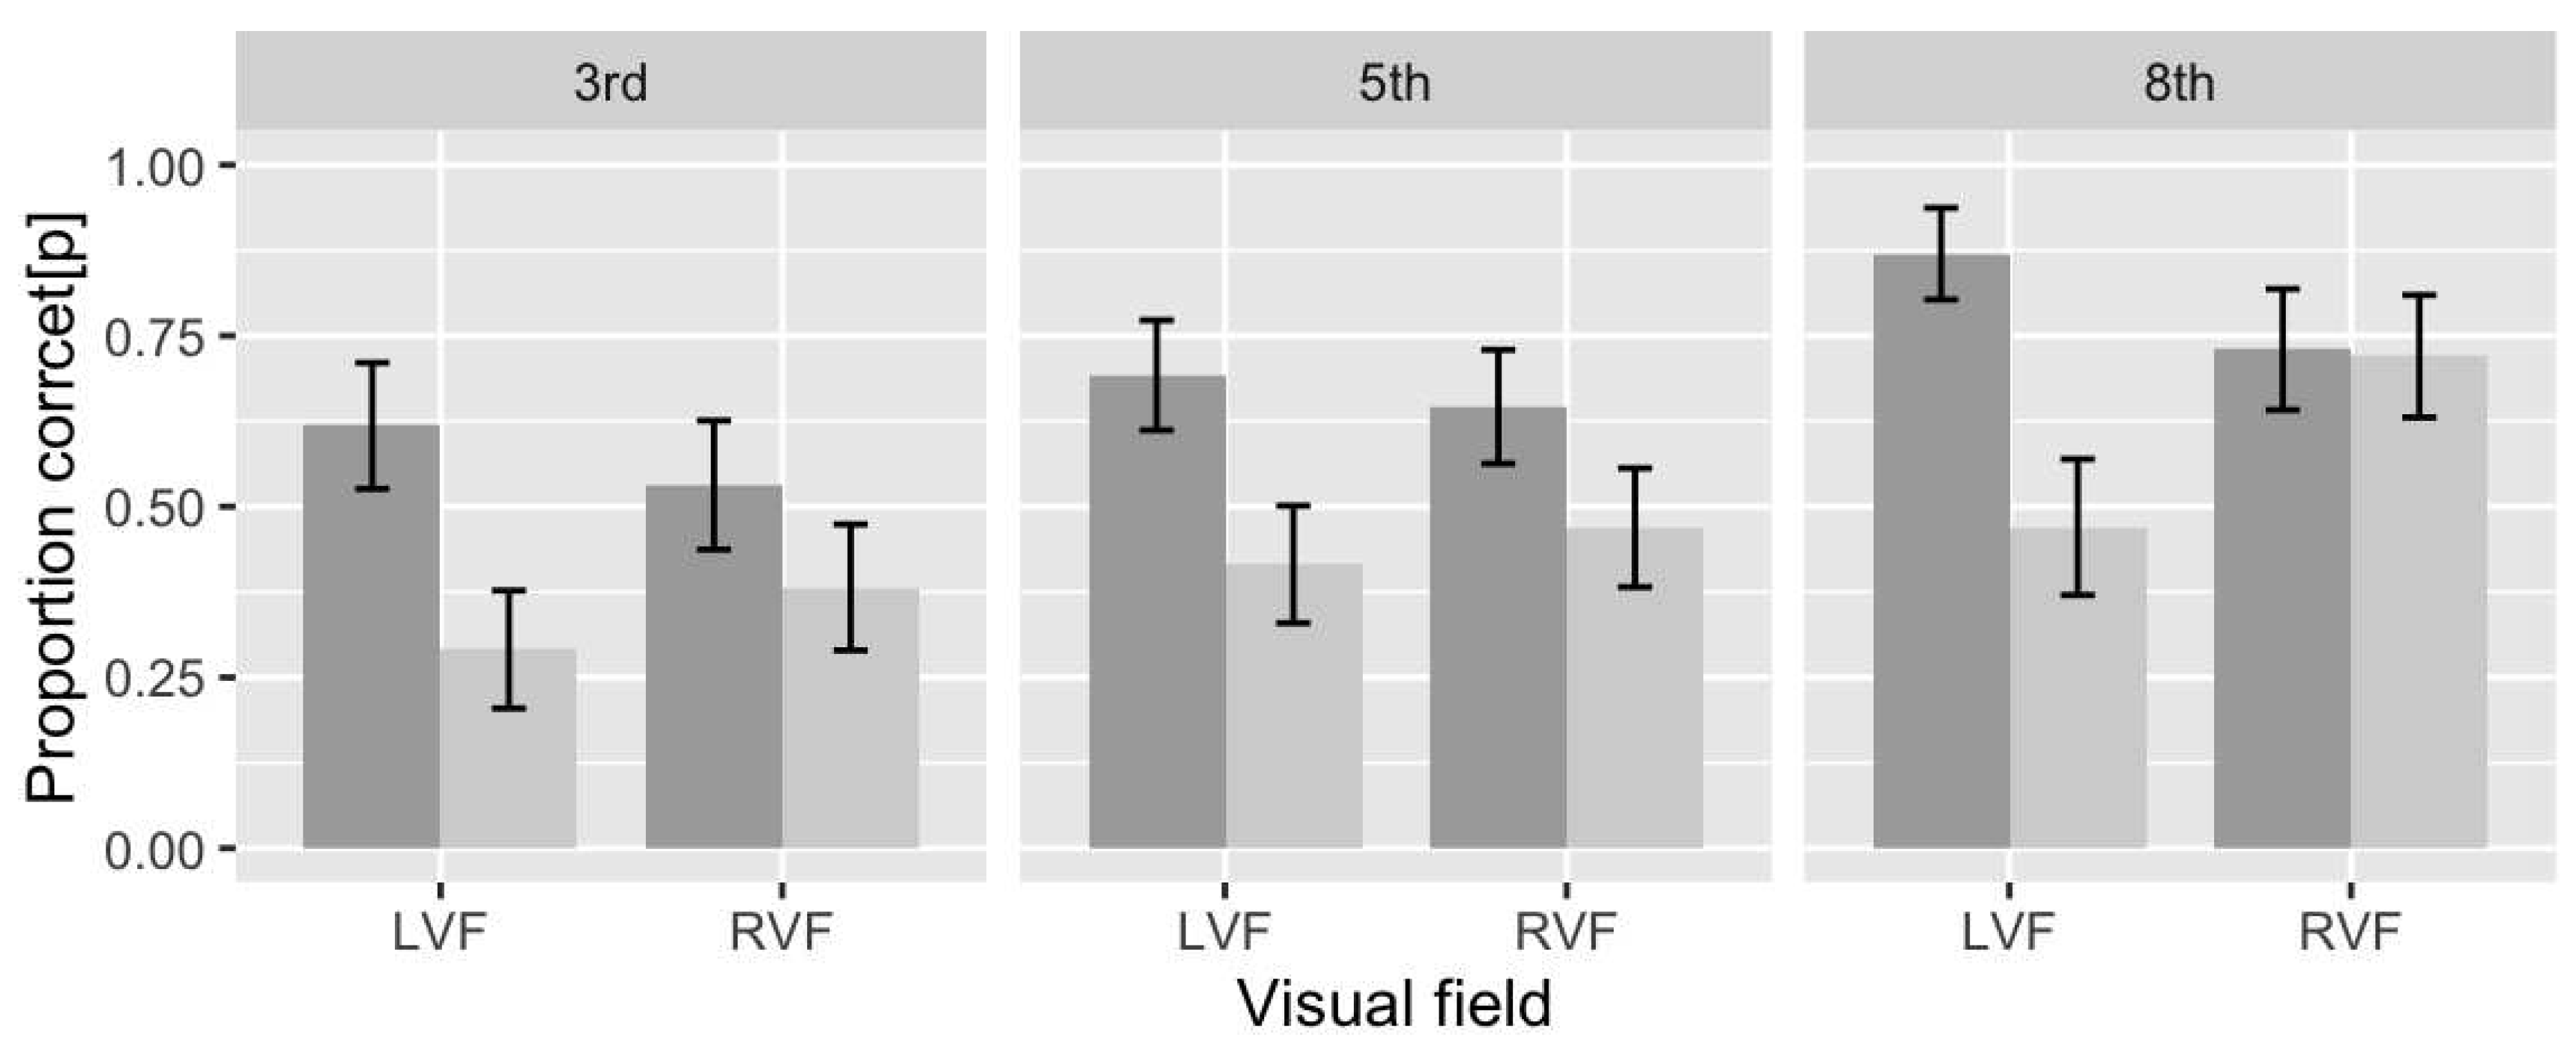
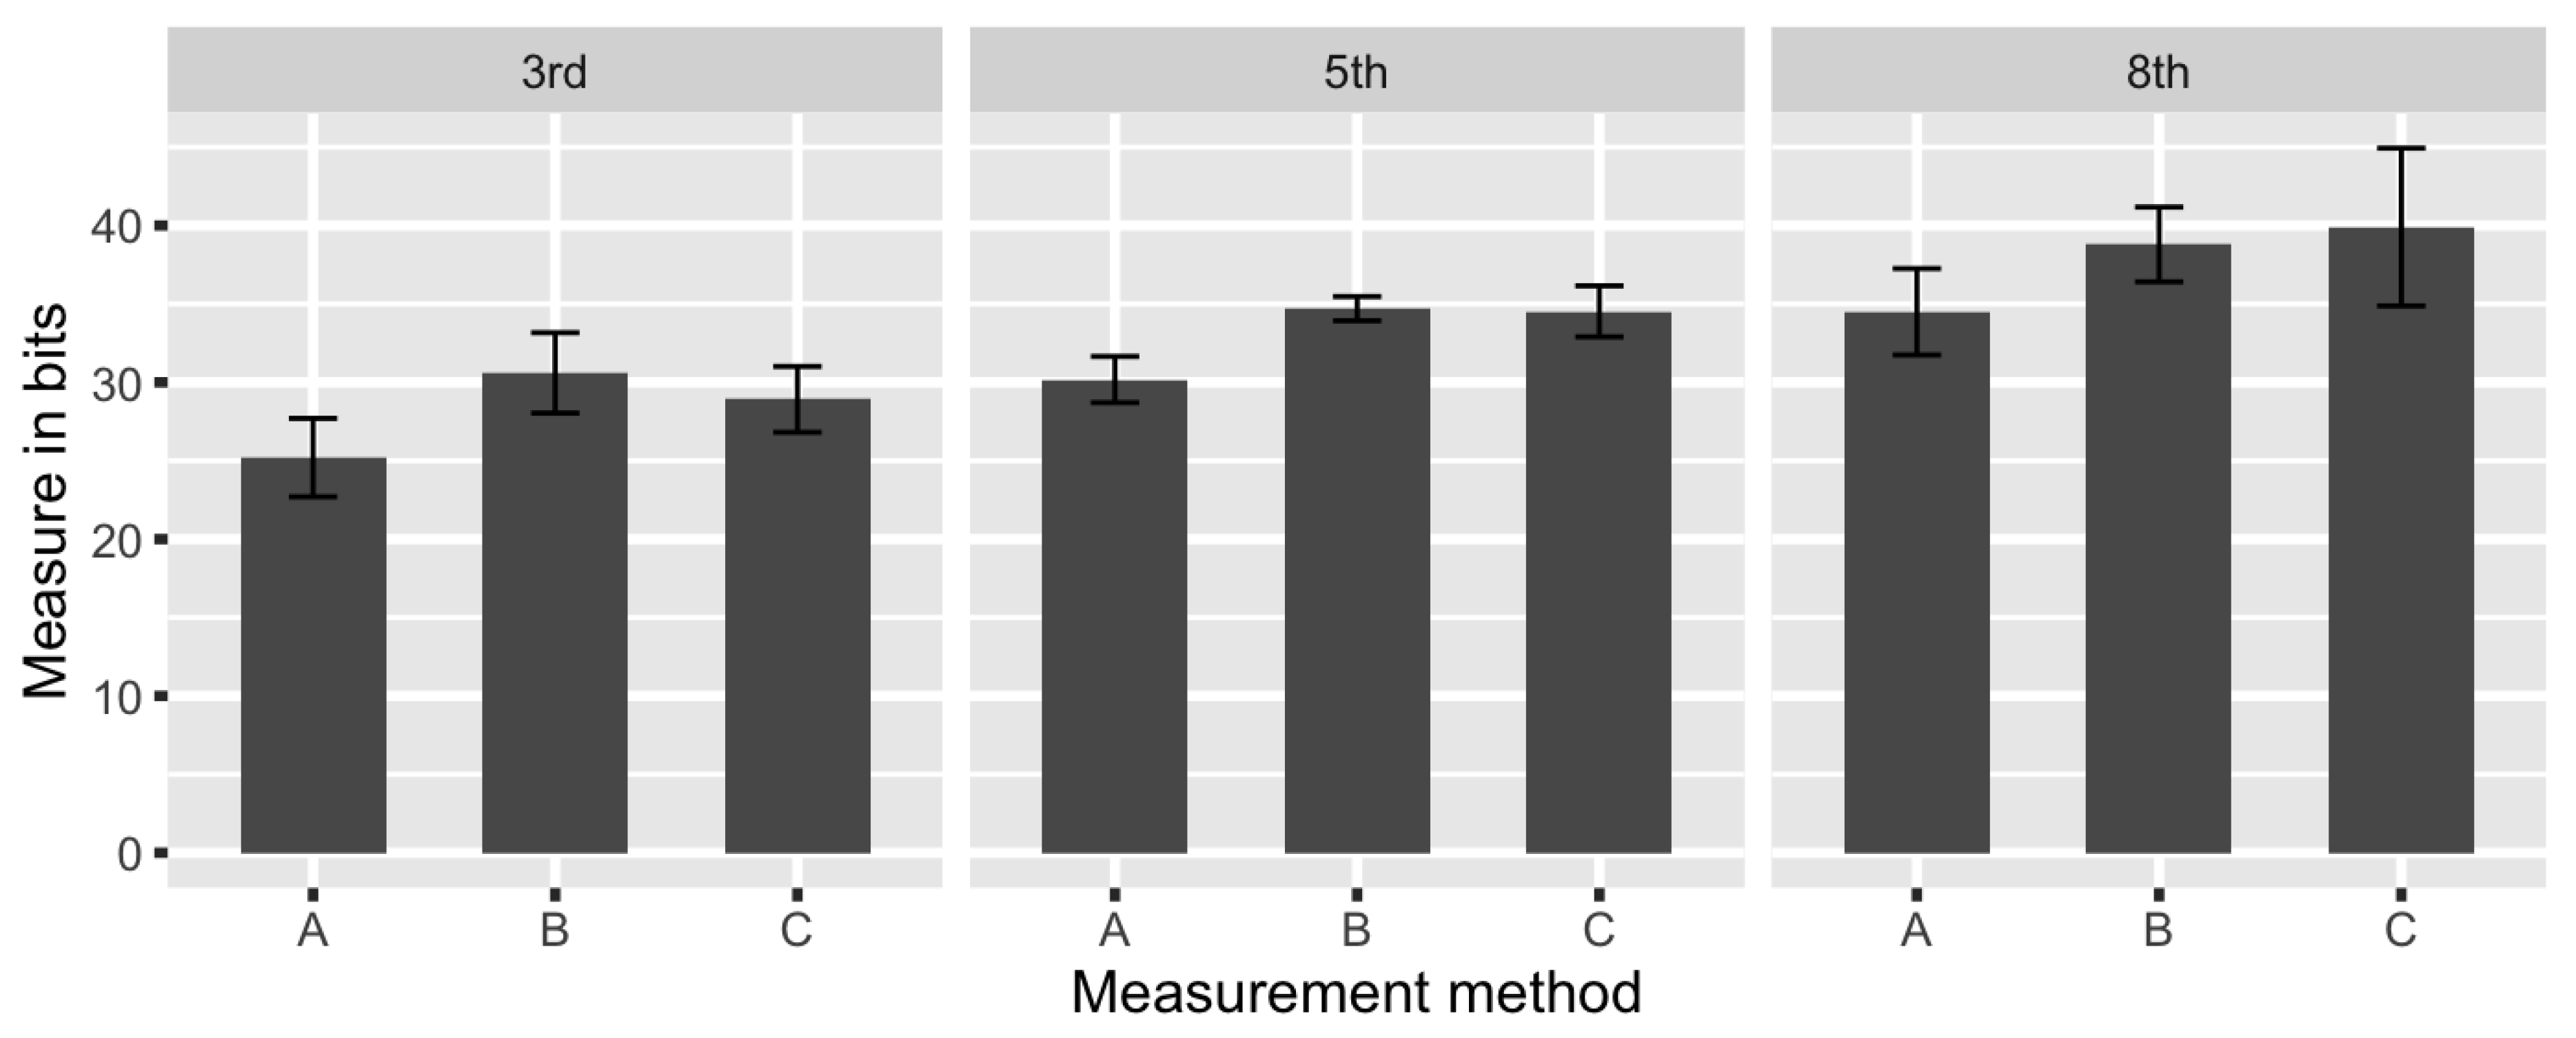
In the fourth analysis, we compared the probability correct response of the target letters occupying the positions +5/-5. Two conditions were tested. In the (FFL) condition, the target letter was flanked from the left. In the (LFF) condition, the target letter was flanked from the right. In the fifth analyses, we compared three methods of measurement. The first method (A) is based on the serial recall rate (SR) of the central trigram letter [4]. The second method (B) is based on the serial recall rate (SR) of the three trigram letters[6]. The third method (C) is based on the free recall rate (FR) of the central letter of the trigram.
Figure 4. Schematic Diagrams of the third analysis (Top) and the fifth analysis (bottom).
Preprints 80457 g004

5.2. Results

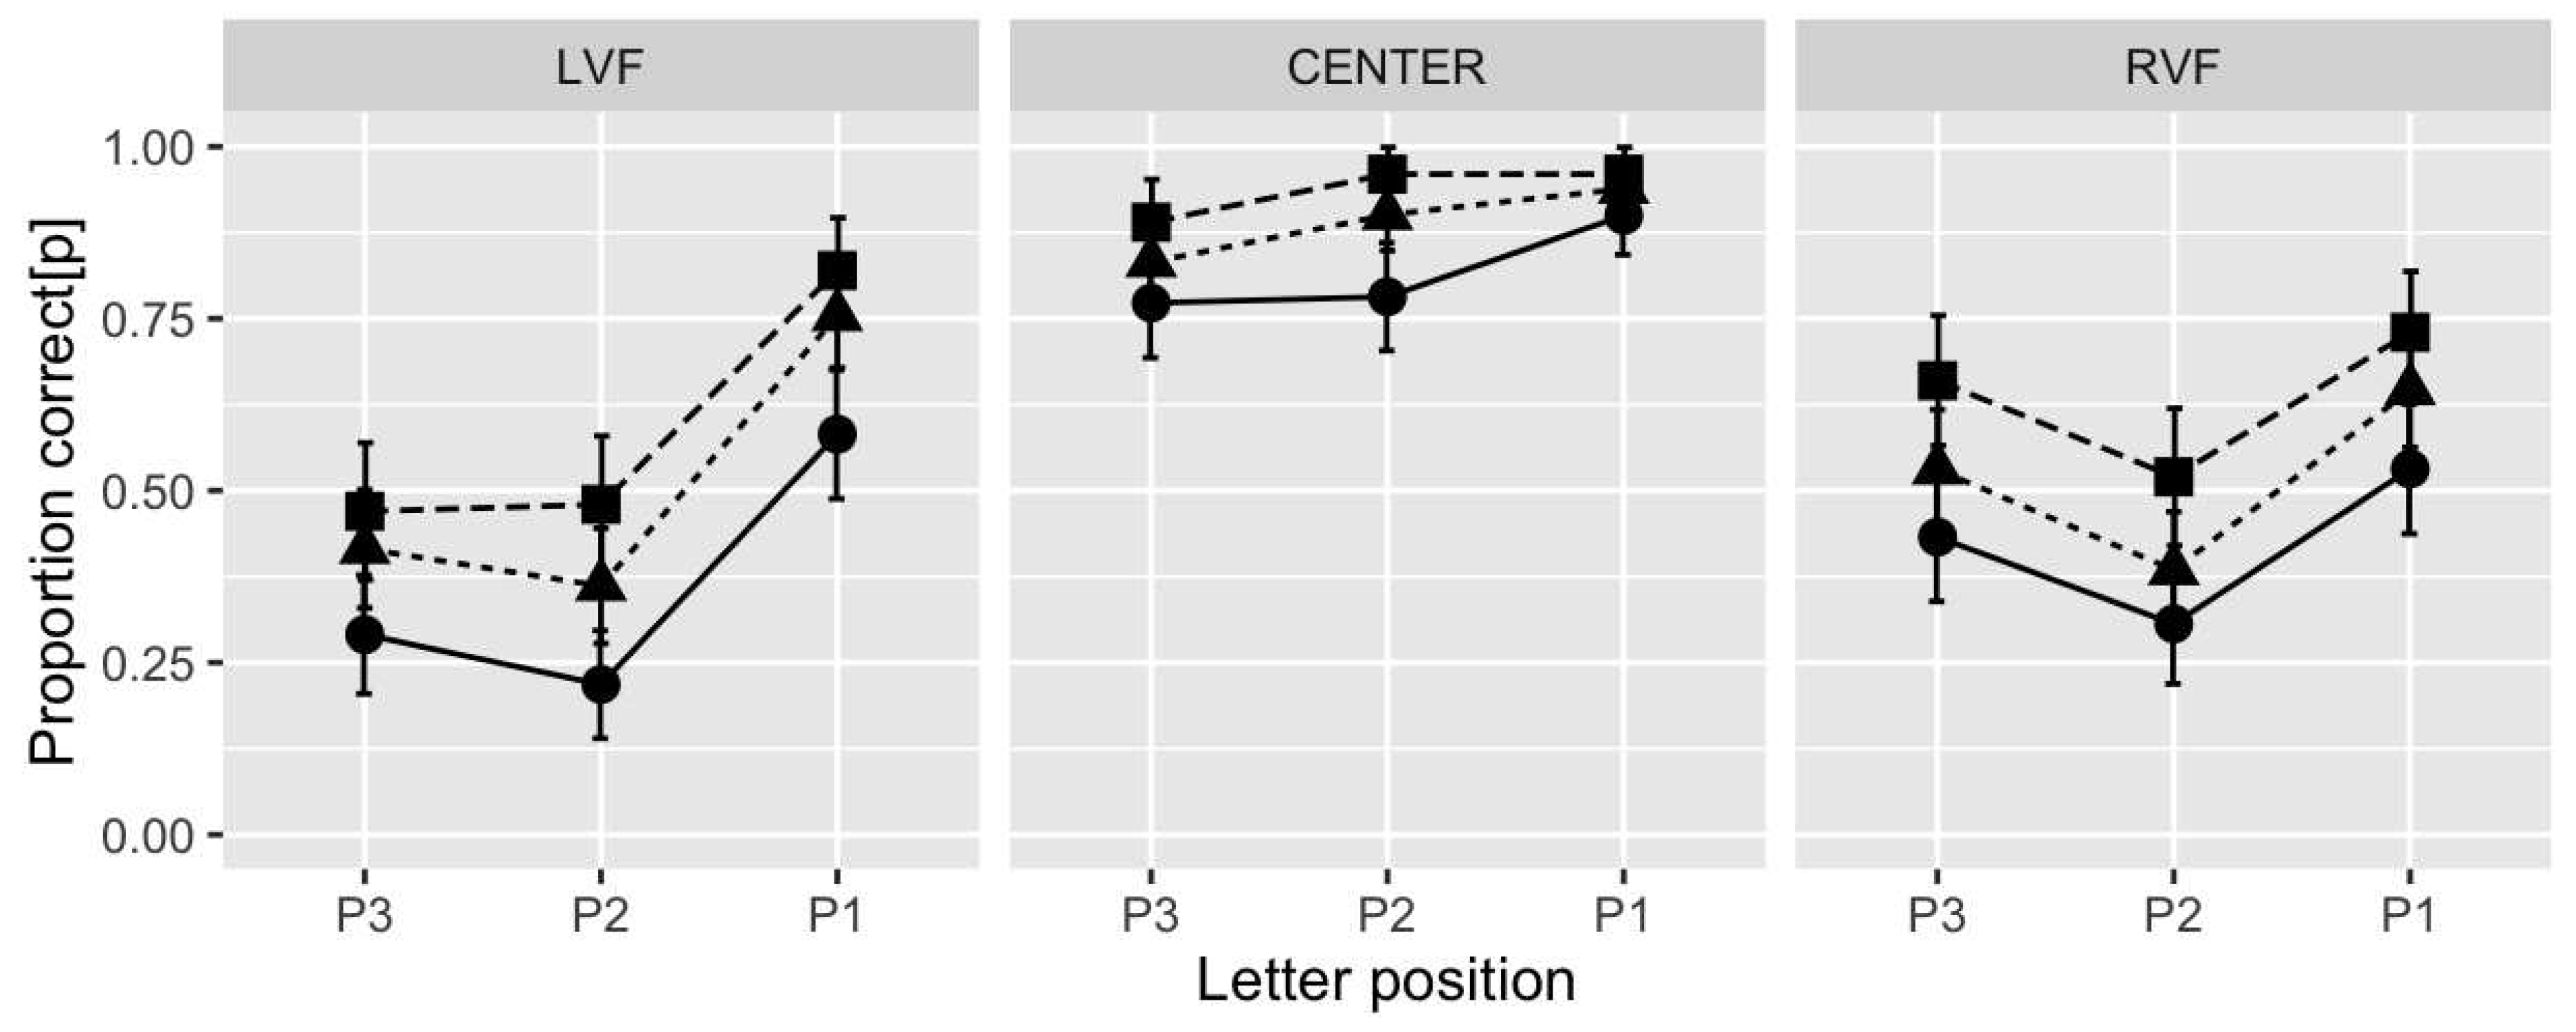
5.2.1. Analysis 1: Effects of grade level, trigram position and letter position in the trigram

A General Linear Mixed Effect Model (GLMM) using the glmer function(R Core Team, 2020) with grade level (3rd vs. 5th vs. 8th) and letter position within the trigram (P1, P2, P3) as fixed effects and the participants as random effect show significant effects of grade level ( χ 2 ( 2 ) = 11.77 , p < 0.001 ) and letter position within the trigram ( χ 2 ( 2 ) = 17.40 , p < 0.001 ). Pairwise comparisons showed a significant difference in performance between the third and eighth levels (Estimate=-0.623, SE=0.287, z= -2.175 ). On the other hand, the analyses revealed no significant difference in performance between the eighth and fifth levels (Estimate= -0.673, SE= 0.373, z=-1.804) and between the fifth and third levels (Estimate= -1.259, SE= 0.371, z= -3.392). Regarding the position effect, Pairwise comparisons suggest that the letter occupying position P1 was better recognized than those occupying positions P2 (Estimate=0.665, SE=0.276, z= 2.408) and P3 (Estimate=1.097, SE=0.264, z=4.153). No significant difference in performance was found between positions P2 and P3 (Estimate=0.431, SE=0.226, z= 1.913). Contrast analyses using the Tukey method were reported (see Table 4)
Table 4. Parameters of the pairwise comparisons conducted across the three letter positions (P1, P2, P3) of the median trigram separately for the third, fifth, and eight grade levels
Third grade(3rd) Fifth grade (5th) Eight grade (8th)
Letter pos Estimate SE z Estimate SE z Estimate SE z
P1 - P2 0.972 0.400 2.431 0.527 0.467 1.127 0.001 0.735 0.000
P1 - P3 1.028 0.398 2.584 1.132 0.433 2.613 0.001 0.619 1.860
P2 - P3 0.056 0.333 0.169 0.605 0.374 1.618 0.001 0.619 1.860
*Fixed effects were deemed reliable if t and z values are greater than 1.96.
A general linear mixed effects model (GLMMs), using the glmer function (R Core Team, 2020) with grade level (3rd vs. 5th vs. 8th), visual field (LVF vs. RVF), and letter position (P1 vs. P2 vs. P3) as fixed effects, and participants as a random effect, shows significant effects of grade level ( χ 2 ( 2 ) = 37.75 , p < 0.001 ), letter position in the trigram ( χ 2 ( 2 ) = 126.52 , p < 0.001 ), and the interaction between position and visual field( χ 2 ( 2 ) = 19.57 , p < 0.001 ). No significant effect of the visual field was found ( χ 2 ( 2 ) = 3.08 , p > 0.05 ). Subjects in the eighth level performed better than those in the fifth (Estimate= -0.439, SE= 0.153, z=-2.862). Similarly, a significant difference was found between the third and fifth levels (Estimate=-0.543, SE=0.149, z= -3.639).
Figure 5. Proportion correct as a function of grade level (3rd, 5th and 8th), visual field (CENTER, LVF and RVF) and letter position in trigrams. Edges, triangles and squares represent eight (8th), fifth (5th) and third (3rd) grade levels, respectively
Preprints 80457 g005
The decomposition of the interaction effect by contrast analysis using the Tukey method shows that at the right visual field (RVF) level, the differences in performance were significant between the three positions (P1, P2, P3). On the other hand, at the level of the left visual field (LVF), the analyses suggest that only the differences between positions P1 and P2 (Estimate=1.642, SE=0.172, z=9.525) and between positions P1 and P3 (Estimate=-1.455, SE=0.170, z=8.551), were significant. No significant difference was revealed between positions P2 and P3 (Estimate=-0.186, SE=0.163, z=-1.142). Contrast analyses using the Tukey method were reported (see Table 5).

5.2.2. Analysis 2: Visual acuity, crowding, attention and memory

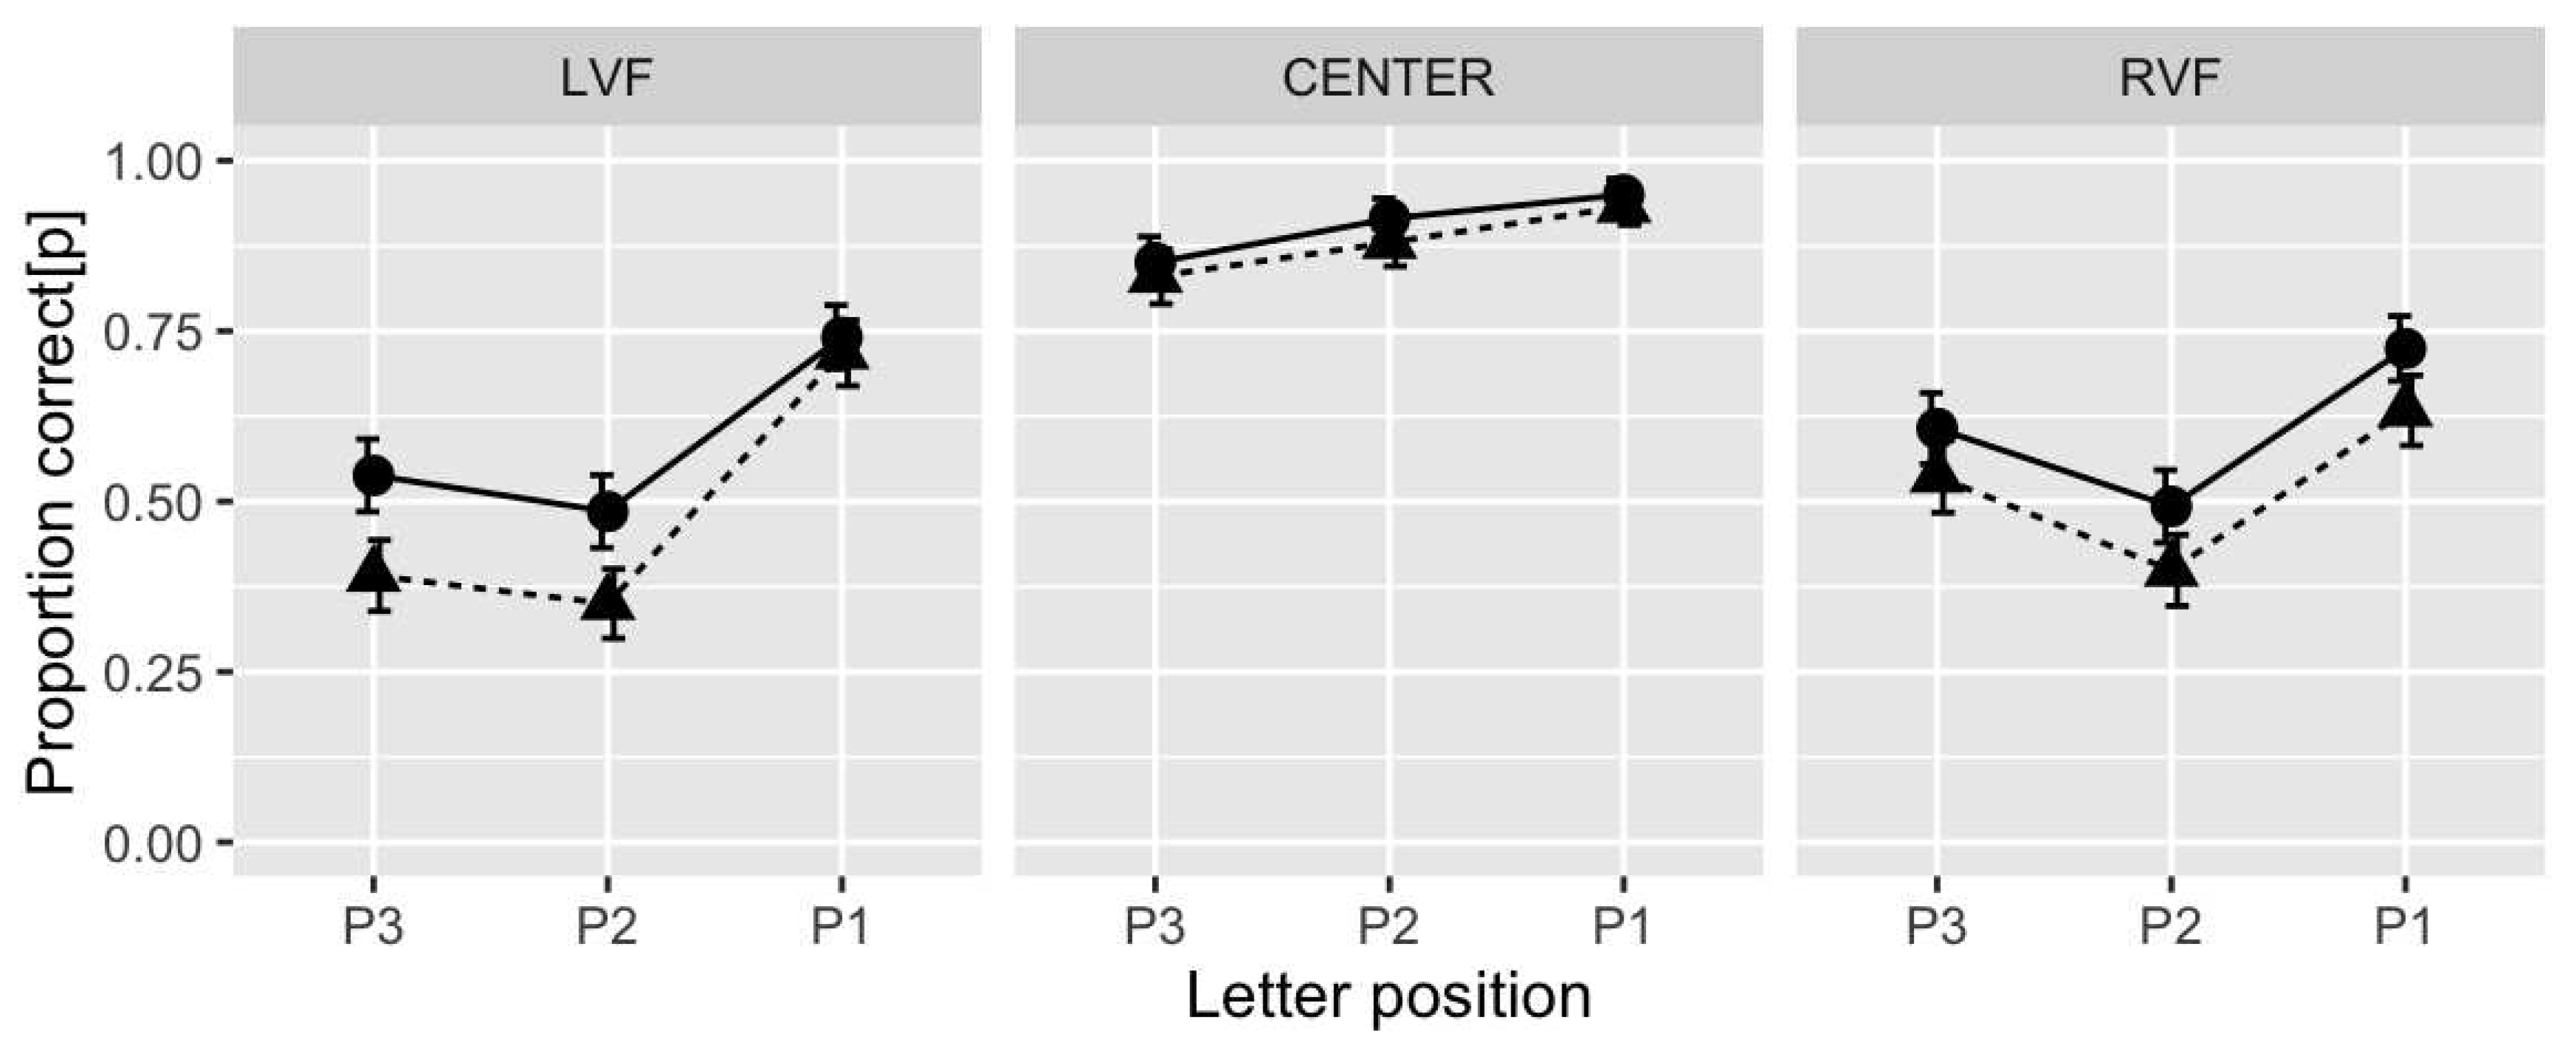
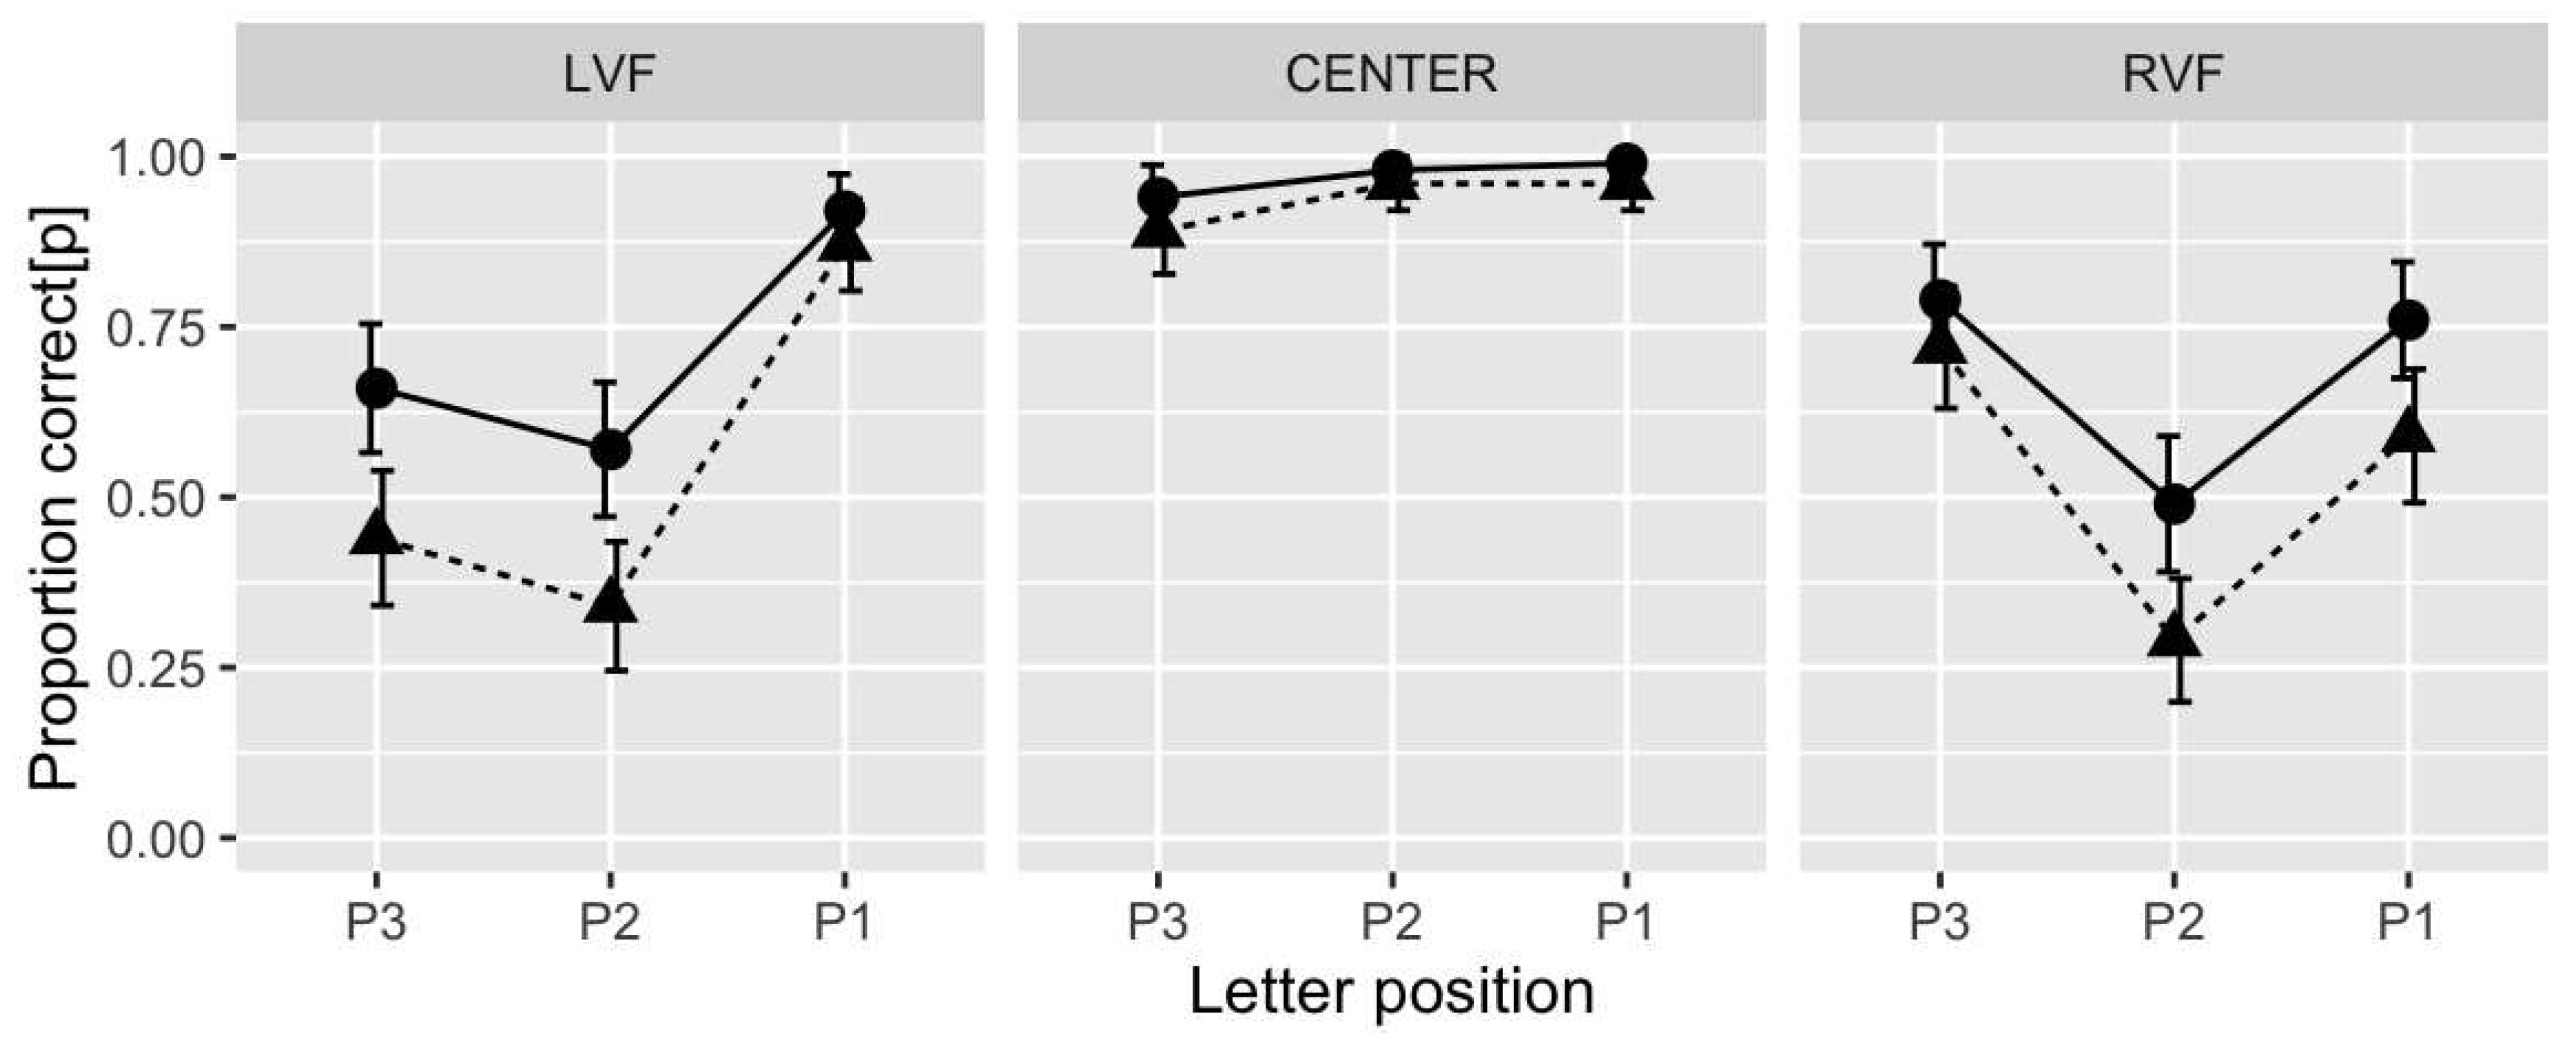
A General Linear Mixed Effects Model (GLMM), using glmer function (R Core Team, 2020), recall type (FR v.s SR), and visual field (CENTER vs. LVF vs. RVF) as fixed effects, and participants as a random effect, shows an effect of visual field ( χ 2 ( 2 ) = 633.06 , p < 0.001 ), and report type ( χ 2 ( 2 ) = 40.72 , p < 0.001 ). At the level of central vision (CENTER), no significant difference was found between the scores obtained from the two types of report (FR and SR) (Estimate= 0.273, SE=0.146, z= 1.867). On the other hand, significant differences between the (FR) and (SR) scores were found in the right (RVF) (Estimate= 0.375, SE= 0.093, z= 4.025) and left (LVF) visual fields (Estimate= 0.444, SE= 0.092, z= 4.783). Our analyses also suggest that performance at the central vision level (CENTER) was better than that found at the left visual field (LVF) (Estimate= 2.073, SE= 0.086, z= 23.95) and right visual field (RVF) (Estimate= 1.95, SE= 0.086, z= 22.53). No difference was revealed in performance between the left (LVF) and right visual field (RVF) (Estimate= -0.123, SE= 0.065, z= -1.89). Pairwise comparisons between the performances obtained from the two measures (FR and SR), separately for each of the positions (P2, P2, and P3), were also reported (see Table 6).
Figure 6. Proportion correct as a function of visual field (CENTER, LVF and RVF) and recall type. Edges, triangles represent free recall (FR) and serial recall (SR), respectively
Preprints 80457 g006

5.2.3. Analyse 3 : The right visual field advantage (RVFA)

Since the quantitative analyses did not emphasize the advantage of the right visual field (RVFA), we decided to conduct qualitative analyses on the rate of normalized errors (LEs and FEs) at the level of the right visual field (RVF) and left visual field (LVF). A General Linear Mixed Effects Model (GLMMs), using the glmer function (R Core Team, 2020) with grade (3rd vs. 5th vs. 8th), error type (LEs vs. FEs), and visual field (LVF vs. RVF) as fixed effects, and participants as a random effect, shows significant effects of error type ( χ 2 ( 1 ) = 10.259 , p < 0.01 ) and interaction of error type by visual field ( χ 2 ( 1 ) = 4.529 , p < 0.05 ). On the other hand, no significant effect of grade level or visual field ( p > 0.05 ) was revealed. The interaction decomposition shows that the differences between the normalized LEs and FEs were only significant (Estimate=1.06, SE=0.282, z=3.766) on the left visual field (LVF). On the other hand, no significant difference was found between the normalized LEs and FEs (Estimate=0.240, SE=0.262, z=0.915) in the right visual field (RVF). Contrast analyses separately for each grade level at the two visual fields (LVF and RVF) were also reported (see Table 7).

5.2.4. Analysis 4 : The first letter advantage

A General Linear Mixed Effects Model (GLMM), using the glmer function (R Core Team, 2020) with grade level (3rd vs. 5th vs. 8th), masking condition (LFF vs. FFL), and visual field (LVF vs. RVF) as fixed effects, and participants as a random effect, shows an effect of grade level ( χ 2 ( 2 ) = 33.11 , p < 0.001 ), masking condition ( χ 2 ( 2 ) = 157.06 , p < 0.001 ), and an interaction between masking condition and visual field ( χ 2 ( 1 ) = 71.36 , p < 0.001 ). No effect of the visual field was found ( χ 2 ( 1 ) = 0.51 , p > 0.05 ). The performance of the eighth-level subjects was better than the fifth level (Estimate= -0.657, SE= 0.183, z= -3.59) and the third level (Estimate= -1.091, SE= 0.190, z= -5.742). The performance of the fifth-level subjects was superior to that of the third level (Estimate= -0.433, SE= 0.173, z= -2.505). The decomposition of the interaction effect using pairwise comparisons was also reported (see Table 8).
Figure 7. Proportion correct for the target letter in the tree condition. Gray and light Gray bars correpsond to FFL condition (flanked on the left side) and LFF condition (flanked on the right side). Error bars indicate 95% confidence intervals.
Preprints 80457 g007

5.2.5. Analysis 5: Comparison between measurement methods

A linear mixed effects model (LMM), using the lmer function (R Core Team, 2020) with grade level (3rd vs. 5th vs. 8th) and measurement method (A vs. B vs. C) as fixed effects and participants as a random effect, shows significant effects of grade level ( χ 2 ( 2 ) = 47.93 , p < 0.001 ), measurement method ( χ 2 ( 2 ) = 92.94 , p < 0.001 ). For grade, all pairwise comparisons were significant (t>1.96). For the measurement method, all pairwise comparisons were significant (t>1.96), except between methods (B) and (C) (Estimate=0.285, SE=0.551, t=0.863).
Figure 8. Measure in bits as a function of measurement method (A, B and C) and grade level (3rd, 5th and 8th). Error bars indicate 95% confidence intervals.
Preprints 80457 g008
Table 9. Measure as function of grade level and measurement method
Measurement method Third grade Fifth grade Eight grade
Mean(SD) Mean(SD) Mean(SD)
Method A 25.19 (3.72) bits 30.17 (2.43) bits 34.49 (3.85) bits
Method B 30.59 (3.81) bits 34.69 (2.27) bits 38.79 (3.32) bits
Method C 28.91 (3.12) bits 34.52 (2.69) bits 39.90 (7.03) bits

5.2.6. Discussion

In this study, we focused on participants’ performance at the level of central vision (central trigram presented in the 0° position) and the right (RVF) and left (LVF) parafoveal regions (trigrams presented in positions +4/-4). Although the trigram task was designed to eliminate high-level influences [4,6], the results point to a decrease in the recall rate at the final position (P3) compared to that obtained at the initial position (P1), at the central vision (CENTER) (see Table 3). The right-to-left fashion (for Arabic letters) has emerged in our data, and the performance patterns (see Figure 5) were similar to those found in previous work[32,35]. Consistent with a body of work suggesting a developmental change in memory capacity [46,47], our results suggest a significant grade level effect on the recall rate. On the other hand, if we consider the number of letters in the trigram, our results are at odds with the proposals of Kwon and collegues [6]. In their paper, the authors dismiss the effects of visual memory on the trigram task and therefore suggest that the decrease in performance in the third-level subjects may be due to transposition errors. This proposal by the authors is supported by previous work [52,53] suggesting that 9-year-olds can retain an average of 5 to 6 digits or spatial symbols in their visual memory. We conducted additional analyses of error types (for the third-level group) to test this proposition. Note that localization errors occur when the recall order does not match the serial order of letters in trigrams. Intrusion errors occur when participants report letters that do not exist in the trigrams. The results revealed significant differences in the rate of intrusion errors between the initial (P1) and final (P3) positions (Estimate=1.241, SE=0.22, z=5.62), while no significant differences in the rate of mislocation errors between the two positions (Estimate=1.241, SE=0.22, z=5.62), were revealed. In light of this, our findings indicate that the decrease in performance in the final position (P3) was not due to a positional encoding defect (transposition) but to limitations in visual short-term memory.
In good agreement with a body of work [4,16,17] suggesting that the decrease in visual acuity contributes to the decrease in letter identification performance (see Figure 6), our analyses show that recall performance at the central vision (CENTER) was better than that found at the level of the right (RVF) and left (LVF) parafoveal regions. On the other hand, based on free recall (FR) scores and eccentricity, our results (Analysis 3) supported Bacigalupo and Luck’s proposals [50] suggesting distinct effects of visual attention and visual memory in the Crowding phenomenon. As shown in Table 5, the differences in the recall rate between the two measurements (FR and SR) were found only at the central (P2) and eccentric (P1/RVF and P3/LVF) positions on both sides of the fixation. As shown in Figure 6, the lack of difference between SR and FR scores did not allow for a clear distinction between visual attention and visual memory at the central vision level. On the other hand, when moving away from fixation, the difference between free recall (FR) and serial recall (SR) scores started to increase[7].
Contrary to a body of work supporting the right visual field advantage (RVF) [4], our quantitative analyses revealed no significant difference in performance between right (RVF) and left (LVF) visual fields. For example, Scaltritti and colleagues [54] propose that the right visual field advantage (RVFA) observed in the letter identification task was manifested by better identification performance at positions closest to fixation (P1/RVF and P2/RVF) in the right visual field (RVF), compared with those obtained at the corresponding positions (P2/LVF and P3/LVF) in the left visual field (LVF), and indicate that eccentric letter recall performance on both sides of fixation supported the MRF hypothesis. In this study, the authors simultaneously presented three trigrams in central vision (CENTER) and the right (RVF), and left (LVF) parafoveal regions. To test this proposition, we also carried out additional analyses. The results showed significant differences in performance between positions (P3/RVF) and (P1/LVF) (Estimate=-0.8017, SE=0.121, z=-6.632), while no difference in performance between positions (P2/LVF) and (P2/RVF) (Estimate=-0.2263, SE=0.121, z=-1.870), was revealed. By comparing the present results and those of Scaltritti and colleagues[54], our analyses highlight two observations of great importance. The first one is the lack of performance difference between the trigrams’ central letters (P2/LVF and P2/RVF). In this respect, we report that the results of a body of work [55] suggest similar target letter identification performance (masked on both sides) in both right (RVF) and left (LVF) visual fields. Based on the proposals of Scaltritti and colleagues [54], and given the direction of reading in Arabic, we will therefore be invited to deduce an advantage of the left visual field (LVFA). A deduction contradicts the results of a body of work carried out in the Arabic context [41,56,57]. The right visual field (RVFA) revelead by our analysis, align a body of work [58,59,60] suggesting an asymmetry of qualitative aspects in string processing. In agreement, our results show that the difference between the percentage of standardized FEs and LEs was significant only in the LVF/RH trials (see Table 6). Although the trigrams were presented horizontally in the present study, the right visual field advantage (RVFA) remains valid. This observation corroborates previous work using horizontally presented words [61,62,63]. For example, Ellis, Young, & Anderson [62] showed that word length affected only the right hemisphere (RH/LVF) performance, while no effect was revealed on the left hemisphere (LH/RVF) performance.
The second observation is the poor performance obtained in the most eccentric position in the left visual field (P3/LVF). Taking into account the proposals of Bouma [16,17] as well as those of the work on the visual span suggesting better performance at the outer letters [4], we expected better identification performance in the most eccentric positions of trigrams taken in both the right (RVF) and left (LVF) visual fields. In the same vein, and given the proposals of the hypothesis of the modification of the receptive fields (MRF), on the one hand, and of the direction of reading in the Arabic language, on the other hand, we expected that exaggerated performances at the level of the initial position (P1) in the right visual field (RVF) would be revealed. Controversially, pairwise comparisons show no difference in performance between positions (P1) and (P3) in the right visual field (RVF) and similar performance in positions P2 and P3 in the left visual field (LVF). We decided to conduct an additional analysis (Analysis 4) for more visibility. We were inspired by Grainger et al.’s experimentation design[24]. Analyzing performance in the right visual field (RVF) offers two critical results.The first result shows that the differences in performance between the two masking conditions (FFL and LFF) were only observed in the third and fifth-level subjects. Although this result aligns with those of Grainger et al.[24], it could not support the MRF hypothesis. Based on previous results (see Table 3), these findings support the contribution of high-level attentional processes to the drop in performance in the free recall task in third- and fifth-graders [32]. The second result lies in the similar performance patterns of the eighth-level subjects to those observed in the study by Grainger et al. [24] at the right visual field (RVF). No difference in performance was revealed between the two masking conditions (FFL and LFF) at the right visual field (RVF). Given the direction of reading in Arabic, the present results contradict the proposals of the MRF hypothesis suggesting a leftward elongation of receptive fields for languages read from left to right.

6. General discussion

As indicated in a body of previous work, the reading speeds of Semitic Arabic texts appear to be relatively low compared to those obtained when reading alphabetic texts. For example, the results of the IReST24 group study highlight differences in average reading speeds between Arabic texts and English texts [36]. Awadah et al.’s [35] results also highlights a difference between the average reading speeds in Arabic, Spanish, and French. In the same vein, our findings and those of Known, Legge, and Dubbels [6] showed that Arabic readers were slower than English readers in the Rapid Visual Serial Presentation (RSVP) task. It is worth mentioning that the debate around the observed differences in reading speed between Semitic Arabic and the different alphabetic languages is still open. Many lines have interpreted the slowness of Arabic readers [37,38] as a result of context dependence [39], letter complexity [40], lack of global reading strategy [41], and effect of morphology [42,43]. In parallel with these various hypotheses, the first study (study 1) explains a non-negligible part of reading slowness in Arabic while proposing that a narrowing of visual span size may be responsible for the observed differences in reading speed between Arabic and English readers.
Given the decrease in visual span observed in our sample, we hypothesized that the low visual attention capacities of Arab readers might explain the narrowing of the visual span. In support of this, the results showed significant differences in free recall (FR) between positions P1 and P3 in central vision (CENTER) and the left visual field (LVF) (see Figure 5). In central vision, this difference can be explained by a narrowing in the size of the visual span. The difference in the left visual field (LVF) refers to a sequential (i.e., letter-by-letter) processing of the three trigram letters. On the other hand, given the differences in visual span size observed between the three school levels, we report two crucial observations. The first is the significant differences in performance in central vision (where low-level influences are weak) between the three grade levels. For serial recall (SR), performance differences were significant between eighth- and third-graders. For free recall (FR), performance differences were significant between the three grade levels. The second observation is the differences observed in crowding size. Pairwise comparisons show that all comparisons were significant except between the fifth and third levels. On the other hand, our results highlight that only the relationship between free recall (FR) performance and crowding size was significant. No relationship between clutter size and serial recall (SR) performance was revealed. This significant result highlights the interaction between high-level processes (i.e., visual attention and visual memory) and low-level processes (i.e., clutter) in the trigram task. Finally, the results of the fifth analysis showed no measurement difference between methods (B) and (C). In light of these observations, we suggest the contribution of high-level attentional processes to our sample’s visual span measurement.
It is known that the debate about the nature of the first letter advantage is still open. In this respect, the literature has proposed two explanations. The first explanation suggests a modification of the visual receptive fields for alphabetic stimuli [22], while the second supports the contribution of visual attention processes [25]. The hypothesis (MRF) suggests that learning to read contributes to a leftward elongation of receptive fields in the left visual field (LVF) [22,24]. For example, Chanceaux and colleagues showed that symbols were misidentified as letters at the most eccentric position in the left visual field (LVF) . In contrast, Aschenbrenner et al. [25] have used the global word paradigm, and showed that the first letter advantage remains valid during vertical word presentation and proposed rapid deployement of visuospatial attention to the begining of the word as a possible explanation for this advantage. In a series of studies [22,23,24,55], proponents of the MRF hypothesis showed that performance for letters was superior to that found for symbols in the most eccentric position in the left visual field (LVF). The comparison between the data from the present study (from the eighth graders) and that of Grainger et al.[24] highlights two critical points. The first is the similarity of performance patterns in the right visual field (RVF). The second is the opposite performance patterns in the left visual field (LVF). Apart from the direction of reading, these observations support the proposals of a body of previous work [58,59,60,64,65,66] on the qualitative hemispheric difference. Given the direction of reading in Arabic (right to left), on the other hand, our findings suggest that the emergence of the first-letter advantage in the left visual field (LVF) in the data from previous studies [22,23,24] is likely due to the contribution of high-level attentional processes. In a general framework, Bouma [17] shows that the most eccentric letters were better identified than those close to fixation and explains this inward-outward asymmetry in letter identification performance by an elongation of receptive fields to the right in the right visual field (RVF) and the left in the left visual field (LVF). Numerous studies have supported this proposition, showing that the outer flanker exerts more influence than the inner flanker on the target letter [18,19,21]. Similarly, the results of the visual span study [4] show that the most eccentric letters on both sides of fixation were better identified. Controversially, our results (Study 2 - Analysis 1) revealed no inward-outward asymmetry (see Figure 5) in the right (RVF) and left (LVF) visual fields. Furthermore, the performance patterns indicate that the crowding signature emerged only in the right visual field (RVF) (see Figure 5). There was no difference in recall performance between positions P2 and P3 at the visual field level (LVF). For more visibility, we conducted an additional analysis (see Appendix A).
In additional analyses (see Appendix A), only eighth-grade subjects were selected to eliminate memory-related effects (see Table 3). Similar to previous results (see Figure 5), no significant difference in performance was observed between positions (P2) and (P3) in free (FR) and serial (SR) recall scores in the left visual field (LVF). Also, no significant difference in the free report (FR) performance between positions (P1) and (P3) was revealed at the right visual field (RVF). This result is prominent, showing that the initial letter (P1) was visible at this distance from fixation. In contrast, results showed a dramatic drop in recall performance (SR) in the initial position (P1) compared with that obtained in the final position (P3) (see Figure A1) at the right visual field (RVF). Based on previous proposals [4,17], we expected that an increase in eccentricity would increase the difference in recall performance between eccentric and median positions of trigrams on either side of fixation (RVF and LVF). However, no significant difference in performance was found between eccentric (P3) and medial (P2) positions to the left of fixation (LVF). These observation, therefore, runs counter to the proposals of Bouma [17] and Legge et al. [4] and consequently may support the contribution of visual attention to the emergence of inward-outward asymmetry [20]. In the latter study, the authors [20] show that random presentation of stimuli in the horizontal meridian line reduces the inward-outward asymmetry, while redirecting attention to the fovea outright reverses the inward-outward asymmetry (i.e., the inner flank generates more interference than the outer flank). Note that in the trigram task, the trigrams were presented randomly, and participants were asked to spread their attention to both sides of the fixation. In light of this, and considering Arabic readers’ low visual attention abilities, the present results favor the contribution of high-level attentional processes in the emergence of first-letter advantage and inward-outward asymmetry. Taken together, our findings suggest that the observed narrowing in visual span size occurs outside the visual complexity of Arabic letters and is strongly related to low attentional abilities in Arabic readers.

Institutional Review Board Statement

The study was conducted in accordance with the Declaration of Helsinki, and approved by the Institutional Review Board (or Ethics Committee) of Comité d’Ethique pour la Recherche Biomédicale Université Mohammed V – Rabat Faculté de Médecine et de Pharmacie de Rabat Faculté de Médecine Dentaire de Rabat (protocol code CERB 61-22 and date of approval: February 20, 2023)

Informed Consent Statement

Informed consent was obtained from all subjects involved in the study to publish this paper

Acknowledgments

The authors wish to thank the people that participated in the current studies.

Conflicts of Interest

The authors declare no conflict of interest.

Abbreviations

The following abbreviations are used in this manuscript:
MRF Modified receptive fields
Vspan Visual span
VAS Visual attention span
RSVP Rapid serial visual presentation
FR Free recall
SR Serial recall
FE First item error
LE Last item error
FFL Right Flanker
LFF Left Flanker

Appendix A

Appendix A.1

A general linear mixed effects model (GLMMs), using the glmer function (R Core Team, 2020) with visual field (LVF vs. RVF), letter position (P1 vs. P2 vs. P3), and recall type (FR vs. SR) as fixed effects, and participants as a random effect, shows significant effects of recall type ( χ 2 ( 1 ) = 40.743 , p < 0.001 ), letter position in the trigram ( χ 2 ( 2 ) = 98.824 , p < 0.001 ), and the interaction between position and visual field( χ 2 ( 2 ) = 52.985 , p < 0.001 ). No significant effect of the visual field was found ( χ 2 ( 1 ) = 0.655 , p > 0.05 ). Decomposition of the interaction effect shows that the interaction effect was only significant in the right visual field (RVF). In the right visual field (RVF), performance differences were significant between the three positions (P1, P2, P3). In contrast, in the left visual field (LVF), no significant differences were revealed between positions (P2) and (P3) (estimate=-0.186, SE=0.163, z=-1.142). Only the differences between positions (P1) and (P2) (Estimate=1.642, SE=0.172, z=9.525) and between positions (P1) and (P3) (Estimate=-1.455, SE=0.170, z=8.551), were significant. Pairwise comparisons for each recall type (FR and SR) were also reported (see Table 4).
As shown in Figure A1, the same patterns of recall performance were found in the left visual field (LVF) for both serial (SR) and free (FR) reports. This result confirms work suggesting a serial processing mode in the left fixation field (LVF) [59,60,64,65,66]. Despite the increase in eccentricity, no significant difference in performance was revealed between positions P2 and P3 in the left visual field (LVF). Consequently, no crowding signature was observed (i.e., the advantage of the outer letter of the trigram -6). On the other hand, and in line with previous results (see Figure 13), no difference in free recall (FR) performance between positions P1 and P3 was revealed in the right visual field (RVF). Surprisingly, in the right visual field (RVF), pairwise comparisons indicated that increasing eccentricity (-6) contributed enormously to the decrease in serial recall (SR) performance in the initial position (P1) of the trigram (-6). Given the symmetry of the serial recall (SR) curves in the right (RVF) and left (LVF) visual fields, we suspect the involvement of Arab readers’ low visual attention capacities in the non-appearance of the inward-outward asymmetry.
Figure A1. Proportion correct as a function of the visual field (CENTER, LVF, and RVF) and letter position in trigrams. Triangles and squares represent eighth graders’ performance in the serial (SR) and free (FR) recall.
Preprints 80457 g0a1
Table A1. Parameters of the pairwise comparisons conducted across the three letter positions (P1, P2, P3) separately for the third, fifth, and eight grade levels in right (RVF) and left (LVF) visual fields
Condition LVF RVF
Recall type Letter pos Estimate SE z Estimate SE z
SR P1 - P2 2.915 0.402 7.245 1.419 0.324 4.384
P1 - P3 2.419 0.390 6.207 -0.642 0.317 -2.023
P2 - P3 -0.496 0.317 -1.566 -2.061 0.341 -6.046
FR P1 - P2 2.751 0.476 5.775 1.512 0.352 4.296
P1 - P3 2.190 0.469 4.674 -0.201 0.364 -0.551
P2 - P3 -0.561 0.352 -1.593 -1.713 0.361 -4.750
*Fixed effects were deemed reliable if t and z values are greater than 1.96.

References

  1. O’Regan, J.K.; Lévy-Schoen, A.; Jacobs, A.M. The effect of visibility on eye-movement parameters in reading. Perception & Psychophysics 1983, 34, 457–464. [Google Scholar]
  2. Amer, J.O.S. Elsendoorn and Bouma [3], pages 261–292.[12] J. Kevin O’Regan. Eye Movements and Read-ing, volume 4 of Reviews of Oculomotor Research, pages 395–453. Elsevier, Amsterdam, 1990.[13] Keith Rayner and Alexander Pollatsek. The Psy. Jour. Opt. Soc. Amer 1990, 7, 152–159. [Google Scholar]
  3. Legge, G.E.; Ahn, S.J.; Klitz, T.S.; Luebker, A. Psychophysics of reading—XVI. The visual span in normal and low vision. Vision Research 1997, 37, 1999–2010. [Google Scholar] [CrossRef]
  4. Legge, G.E.; Mansfield, J.S.; Chung, S.T. Psychophysics of reading: XX. Linking letter recognition to reading speed in central and peripheral vision. Vision research 2001, 41, 725–743. [Google Scholar] [PubMed]
  5. Legge, G.E.; Klitz, T.S.; Tjan, B.S. Mr. Chips: an ideal-observer model of reading. Psychological review 1997, 104, 524. [Google Scholar] [CrossRef] [PubMed]
  6. Kwon, M.; Legge, G.E.; Dubbels, B.R. Developmental changes in the visual span for reading. Vision research 2007, 47, 2889–2900. [Google Scholar] [CrossRef]
  7. Estes, W. Perceptual processing in letter recognition and reading. In Perceptual processing; Elsevier, 1978; pp. 163–220. [Google Scholar]
  8. Yu, D.; Park, H.; Gerold, D.; Legge, G.E. Comparing reading speed for horizontal and vertical English text. Journal of vision 2010, 10, 21–21. [Google Scholar] [CrossRef]
  9. Yu, D.; Legge, G.E.; Wagoner, G.; Chung, S.T. Sensory factors limiting horizontal and vertical visual span for letter recognition. Journal of vision 2014, 14, 3–3. [Google Scholar] [CrossRef]
  10. Yu, D.; Cheung, S.H.; Legge, G.E.; Chung, S.T. Effect of letter spacing on visual span and reading speed. Journal of vision 2007, 7, 2–2. [Google Scholar] [CrossRef]
  11. Legge, G.E.; Bigelow, C.A. Does print size matter for reading? A review of findings from vision science and typography. Journal of vision 2011, 11, 8–8. [Google Scholar] [CrossRef]
  12. Wang, H.; He, X.; Legge, G.E. Effect of pattern complexity on the visual span for Chinese and alphabet characters. Journal of vision 2014, 14, 6–6. [Google Scholar] [CrossRef] [PubMed]
  13. He, Y.; Scholz, J.M.; Gage, R.; Kallie, C.S.; Liu, T.; Legge, G.E. Comparing the visual spans for faces and letters. Journal of vision 2015, 15, 7–7. [Google Scholar] [CrossRef] [PubMed]
  14. Pelli, D.G.; Tillman, K.A.; Freeman, J.; Su, M.; Berger, T.D.; Majaj, N.J. Crowding and eccentricity determine reading rate. Journal of vision 2007, 7, 20–20. [Google Scholar] [CrossRef] [PubMed]
  15. Kwon, M.; Legge, G.E. Developmental changes in the size of the visual span for reading: Effects of crowding. Journal of Vision 2006, 6, 997. [Google Scholar] [CrossRef]
  16. Bouma, H. Interaction effects in parafoveal letter recognition. Nature 1970, 226, 177–178. [Google Scholar] [CrossRef]
  17. Bouma, H. Visual interference in the parafoveal recognition of initial and final letters of words. Vision research 1973, 13, 767–782. [Google Scholar] [CrossRef]
  18. Petrov, Y.; Popple, A.V. Crowding is directed to the fovea and preserves only feature contrast. Journal of Vision 2007, 7, 8–8. [Google Scholar] [CrossRef]
  19. Petrov, Y.; Meleshkevich, O. Asymmetries and idiosyncratic hot spots in crowding. Vision research 2011, 51, 1117–1123. [Google Scholar] [CrossRef]
  20. Petrov, Y.; Meleshkevich, O. Locus of spatial attention determines inward–outward anisotropy in crowding. Journal of Vision 2011, 11, 1–1. [Google Scholar] [CrossRef]
  21. Farzin, F.; Rivera, S.M.; Whitney, D. Holistic crowding of Mooney faces. Journal of vision 2009, 9, 18–18. [Google Scholar] [CrossRef]
  22. Chanceaux, M.; Grainger, J. Serial position effects in the identification of letters, digits, symbols, and shapes in peripheral vision. Acta psychologica 2012, 141, 149–158. [Google Scholar] [CrossRef] [PubMed]
  23. Tydgat, I.; Grainger, J. Serial position effects in the identification of letters, digits, and symbols. Journal of Experimental Psychology: Human Perception and Performance 2009, 35, 480. [Google Scholar] [PubMed]
  24. Grainger, J.; Tydgat, I.; Isselé, J. Crowding affects letters and symbols differently. Journal of Experimental Psychology: Human Perception and Performance 2010, 36, 673. [Google Scholar] [PubMed]
  25. Aschenbrenner, A.J.; Balota, D.A.; Weigand, A.J.; Scaltritti, M.; Besner, D. The first letter position effect in visual word recognition: The role of spatial attention. Journal of Experimental Psychology: Human Perception and Performance 2017, 43, 700. [Google Scholar] [CrossRef]
  26. Lee, H.W.; Kwon, M.; Legge, G.E.; Gefroh, J.J. Training improves reading speed in peripheral vision: Is it due to attention? Journal of vision 2010, 10, 18–18. [Google Scholar] [CrossRef]
  27. Legge, G.E.; Cheung, S.H.; Yu, D.; Chung, S.T.; Lee, H.W.; Owens, D.P. The case for the visual span as a sensory bottleneck in reading. Journal of vision 2007, 7, 9–9. [Google Scholar] [CrossRef]
  28. Chung, S.T.; Mansfield, J.S.; Legge, G.E. Psychophysics of reading. XVIII. The effect of print size on reading speed in normal peripheral vision. Vision research 1998, 38, 2949–2962. [Google Scholar] [CrossRef]
  29. Chung, S.T.; Legge, G.E.; Cheung, S.h. recognition and reading speed in peripheral vision benefit from perceptual learning. Vision research 2004, 44, 695–709. [Google Scholar] [CrossRef]
  30. Zhu, Z.; Hu, Y.; Liao, C.; Keel, S.; Huang, R.; Liu, Y.; He, M. Visual span and cognitive factors affect Chinese reading speed. Journal of Vision 2019, 19, 17–17. [Google Scholar] [CrossRef]
  31. Zhu, Z.; Hu, Y.; Liao, C.; Huang, R.; Keel, S.; Liu, Y.; He, M. Perceptual learning of visual span improves Chinese reading speed. Investigative ophthalmology & visual science 2019, 60, 2357–2368. [Google Scholar]
  32. Awadh, F.H.R. Caractérisation et rôle de l’empan visuo-attentionnel chez les lecteurs arabophones adultes et enfants (experts et dyslexiques développementales). Theses, Université Grenoble Alpes, 2016. [Google Scholar]
  33. Averbach, E.; Coriell, A.S. Short-term memory in vision. The Bell System Technical Journal 1961, 40, 309–328. [Google Scholar] [CrossRef]
  34. Awadh, F.; Zoubrinetzky, R.; Zaher, A.; Valdois, S. Visual attention span as a predictor of reading fluency and reading comprehension in Arabic. Frontiers in Psychology 2022. [Google Scholar] [CrossRef]
  35. Awadh, F.H.; Phénix, T.; Antzaka, A.; Lallier, M.; Carreiras, M.; Valdois, S. Cross-language modulation of visual attention span: an Arabic-French-Spanish comparison in skilled adult readers. Frontiers in psychology 2016, 7, 307. [Google Scholar] [CrossRef]
  36. Trauzettel-Klosinski, S.; Dietz, K.; Group, I.S.; et al. Standardized assessment of reading performance: The new international reading speed texts IReST. Investigative ophthalmology & visual science 2012, 53, 5452–5461. [Google Scholar]
  37. Abu-Rabia, S. The role of vowels in reading Semitic scripts: Data from Arabic and Hebrew. Reading and Writing 2001, 14, 39–59. [Google Scholar] [CrossRef]
  38. Abu Ahmad, H.; Ibrahim, R.; Share, D.L. Cognitive predictors of early reading ability in Arabic: A longitudinal study from kindergarten to grade 2. In Handbook of Arabic literacy; Springer, 2014; pp. 171–194. [Google Scholar]
  39. Abu-Rabia, S. Reading in Arabic orthography: The effect of vowels and context on reading accuracy of poor and skilled native Arabic readers. Reading and Writing 1997, 9, 65–78. [Google Scholar] [CrossRef]
  40. Pelli, D.G.; Burns, C.W.; Farell, B.; Moore-Page, D.C. Feature detection and letter identification. Vision research 2006, 46, 4646–4674. [Google Scholar] [CrossRef] [PubMed]
  41. Eviatar, Z.; Ibrahim, R.; Ganayim, D. Orthography and the hemispheres: visual and linguistic aspects of letter processing. Neuropsychology 2004, 18, 174. [Google Scholar] [CrossRef]
  42. Farid, M.; Grainger, J. How initial fixation position influences visual word recognition: A comparison of French and Arabic. Brain and Language 1996, 53, 351–368. [Google Scholar] [CrossRef] [PubMed]
  43. Boudelaa, S. Is the Arabic mental lexicon morpheme-based or stem-based? Implications for spoken and written word recognition. In Handbook of Arabic literacy; Springer, 2014; pp. 31–54. [Google Scholar]
  44. Carver, R.P. Reading rate: A review of research and theory; Academic Press, 1990. [Google Scholar]
  45. Alabdulkader, B.; Leat, S.J. Toward developing a standardized Arabic continuous text reading chart. Journal of optometry 2017, 10, 84–94. [Google Scholar] [CrossRef]
  46. Dempster, F.N. Memory span and short-term memory capacity: A developmental study. Journal of Experimental Child Psychology 1978, 26, 419–431. [Google Scholar] [CrossRef]
  47. Ross-sheehy, S.; Oakes, L.M.; Luck, S.J. The development of visual short-term memory capacity in infants. Child development 2003, 74, 1807–1822. [Google Scholar] [CrossRef] [PubMed]
  48. Luck, S.J.; Vogel, E.K. The capacity of visual working memory for features and conjunctions. Nature 1997, 390, 279–281. [Google Scholar] [CrossRef] [PubMed]
  49. Alvarez, G.A.; Cavanagh, P. The capacity of visual short-term memory is set both by visual information load and by number of objects. Psychological science 2004, 15, 106–111. [Google Scholar] [CrossRef]
  50. Bacigalupo, F.; Luck, S.J. The allocation of attention and working memory in visual crowding. Journal of cognitive neuroscience 2015, 27, 1180–1193. [Google Scholar] [CrossRef]
  51. Ibrahim, R.; Eviatar, Z.; Aharon-Peretz, J. The characteristics of arabic orthography slow its processing. Neuropsychology 2002, 16, 322. [Google Scholar] [CrossRef]
  52. Miles, C.; Morgan, M.J.; Milne, A.B.; Morris, E.D. Developmental and individual differences in visual memory span. Current Psychology 1996, 15, 53–67. [Google Scholar] [CrossRef]
  53. Wilson, J.L.; Scott, J.H.; Power, K.G. Developmental differences in the span of visual memory for pattern. British Journal of Developmental Psychology 1987, 5, 249–255. [Google Scholar] [CrossRef]
  54. Scaltritti, M.; Grainger, J.; Dufau, S. Letter and word identification in the fovea and parafovea. Attention, Perception, & Psychophysics 2021, 83, 2071–2082. [Google Scholar]
  55. Chanceaux, M.; Grainger, J. Constraints on letter-in-string identification in peripheral vision: Effects of number of flankers and deployment of attention. Frontiers in Psychology 2013, 4, 119. [Google Scholar] [CrossRef]
  56. Ibrahim, R.; Eviatar, Z. The contribution of the two hemispheres to lexical decision in different languages. Behavioral and Brain Functions 2012, 8, 1–7. [Google Scholar] [CrossRef] [PubMed]
  57. Eviatar, Z.; Ibrahim, R. Morphological and orthographic effects on hemispheric. Reading and Writing 2004, 17, 691–705. [Google Scholar] [CrossRef]
  58. Hellige, J.B.; Taylor, A.K.; Eng, T.L. Interhemispheric interaction when both hemispheres have access to the same stimulus information. Journal of Experimental Psychology: Human Perception and Performance 1989, 15, 711. [Google Scholar] [CrossRef] [PubMed]
  59. Hellige, J.B.; Cowin, E.L.; Eng, T.; Sergent, V. Perceptual reference frames and visual field asymmetry for verbal processing. Neuropsychologia 1991, 29, 929–939. [Google Scholar] [CrossRef] [PubMed]
  60. Levy, J.; Heller, W.; Banich, M.T.; Burton, L.A. Are variations among right-handed individuals in perceptual asymmetries caused by characteristic arousal differences between hemispheres? Journal of Experimental Psychology: Human Perception and Performance 1983, 9, 329. [Google Scholar] [CrossRef] [PubMed]
  61. Young, A.W.; Ellis, A.W. Different methods of lexical access for words presented in the left and right visual hemifields. Brain and language 1985, 24, 326–358. [Google Scholar] [CrossRef] [PubMed]
  62. Ellis, A.W.; Young, A.W.; Anderson, C. Modes of word recognition in the left and right cerebral hemispheres. Brain and language 1988, 35, 254–273. [Google Scholar] [CrossRef]
  63. Bub, D.N.; Lewine, J. Different modes of word recognition in the left and right visual fields. Brain and Language 1988, 33, 161–188. [Google Scholar] [CrossRef]
  64. Kitterle, F.L.; Hellige, J.B.; Christman, S. Visual hemispheric asymmetries depend on which spatial frequencies are task relevant. Brain and cognition 1992, 20, 308–314. [Google Scholar] [CrossRef]
  65. Lamb, M.R.; Robertson, L.C.; Knight, R.T. Attention and interference in the processing of global and local information: Effects of unilateral temporal-parietal junction lesions. Neuropsychologia 1989, 27, 471–483. [Google Scholar] [CrossRef]
  66. Van Kleeck, M.H. Hemispheric differences in global versus local processing of hierarchical visual stimuli by normal subjects: New data and a meta-analysis of previous studies. Neuropsychologia 1989, 27, 1165–1178. [Google Scholar] [CrossRef] [PubMed]
Table 5. Parameters of the pairwise comparisons conducted across the three letter positions (P1, P2, P3) separately for the third, fifth, and eight grade levels in right (RVF) and left (LVF) visual fields
Condition LVF RVF
Grade level Letter pos Estimate SE z Estimate SE z
3rd P1 - P2 1.63 0.305 5.344 0.979 0.286 3.419
P1 - P3 1.24 0.289 4.294 0.413 0.275 1.502
P2 - P3 -0.39 0.314 -1.242 -0.565 0.286 -1.973
5th P1 - P2 1.688 0.273 6.173 1.127 0.265 4.254
P1 - P3 1.461 0.270 5.403 0.503 0.260 1.931
P2 - P3 -0.227 0.255 -0.890 -0.624 0.259 -2.414
8th P1 - P2 1.693 0.341 4.963 0.921 0.303 3.042
P1 - P3 1.736 0.342 5.083 0.334 0.310 1.077
P2 - P3 0.042 0.293 0.146 -0.588 0.292 -2.011
*Fixed effects were deemed reliable if t and z values are greater than 1.96.
Table 6. Parameters of the pairwise comparisons conducted across the three flanker conditions (FFL, LFF, FLF) separately for the third, fifth, and eight grade levels, in right and left visual fields
Left visual field (LVF) Right visual field (RVF)
Position Condition Estimate SE z Estimate SE z
P1 FR vs SR 0.133 0.181 0.733 0.486 0.177 2.740
P2 FR vs SR 0.616 0.165 3.728 0.434 0.165 2.629
P3 FR vs SR 0.672 0.166 4.052 0.32 0.164 1.96
*Fixed effects were deemed reliable if z value is greater than 1.96.
Table 7. Parameters of the pairwise comparisons conducted across the three flanker conditions (FFL, LFF, FLF) separately for the third, fifth, and eight grade levels, in right and left visual fields
Left visual field (LVF) Right visual field (RVF)
grade level Condition Estimate SE z Estimate SE z
3rd LE vs FE 0.766 0.474 1.618 0.325 0.467 0.697
5th LE vs FE 0.971 0.449 2.161 0.349 0.419 0.833
8th LE vs FE 1.600 0.568 2.813 0.000 0.485 0.000
*Fixed effects were deemed reliable if z value is greater than 1.96.
Table 8. Parameters of the pairwise comparisons conducted across the two flanker conditions (FFL, LFF, FLF) separately for the third, fifth, and eight grade levels, in right (RVF) and left (LVF) visual fields
Left visual field (LVF) Right visual field (RVF)
Condition Estimate SE z Estimate SE z
3rd
FFL vs LFF 1.46 0.301 4.836 0.637 0.28 2.270
5th
FFL vs LFF 1.16 0.262 4.414 0.736 0.257 2.870
8th
FFL vs LFF 2.104 0.262 5.709 0.052 0.322 0.162
*Fixed effects were deemed reliable if z value is greater than 1.96.
Disclaimer/Publisher’s Note: The statements, opinions and data contained in all publications are solely those of the individual author(s) and contributor(s) and not of MDPI and/or the editor(s). MDPI and/or the editor(s) disclaim responsibility for any injury to people or property resulting from any ideas, methods, instructions or products referred to in the content.
Copyright: This open access article is published under a Creative Commons CC BY 4.0 license, which permit the free download, distribution, and reuse, provided that the author and preprint are cited in any reuse.
Prerpints.org logo

Preprints.org is a free preprint server supported by MDPI in Basel, Switzerland.

Subscribe

© 2024 MDPI (Basel, Switzerland) unless otherwise stated