Submitted:
19 July 2023
Posted:
26 July 2023
You are already at the latest version
Abstract
Keywords:
1. Introduction
2. Materials and Methods
2.1. Animals and Diets
2.2. Blood Collection
2.3. Serum Detection
2.4. Sample Preparation
2.5. NMR Measurements
2.6. Data Preprocessing
2.7. Multivariate Statistical Analysis
2.8. The Differential Metabolites Identification and the Analysis of the Metabolic Pathway
2.9. Statistical Analysis
3. Results
3.1. Background Characteristics
3.2. Serum Biochemical Measurements
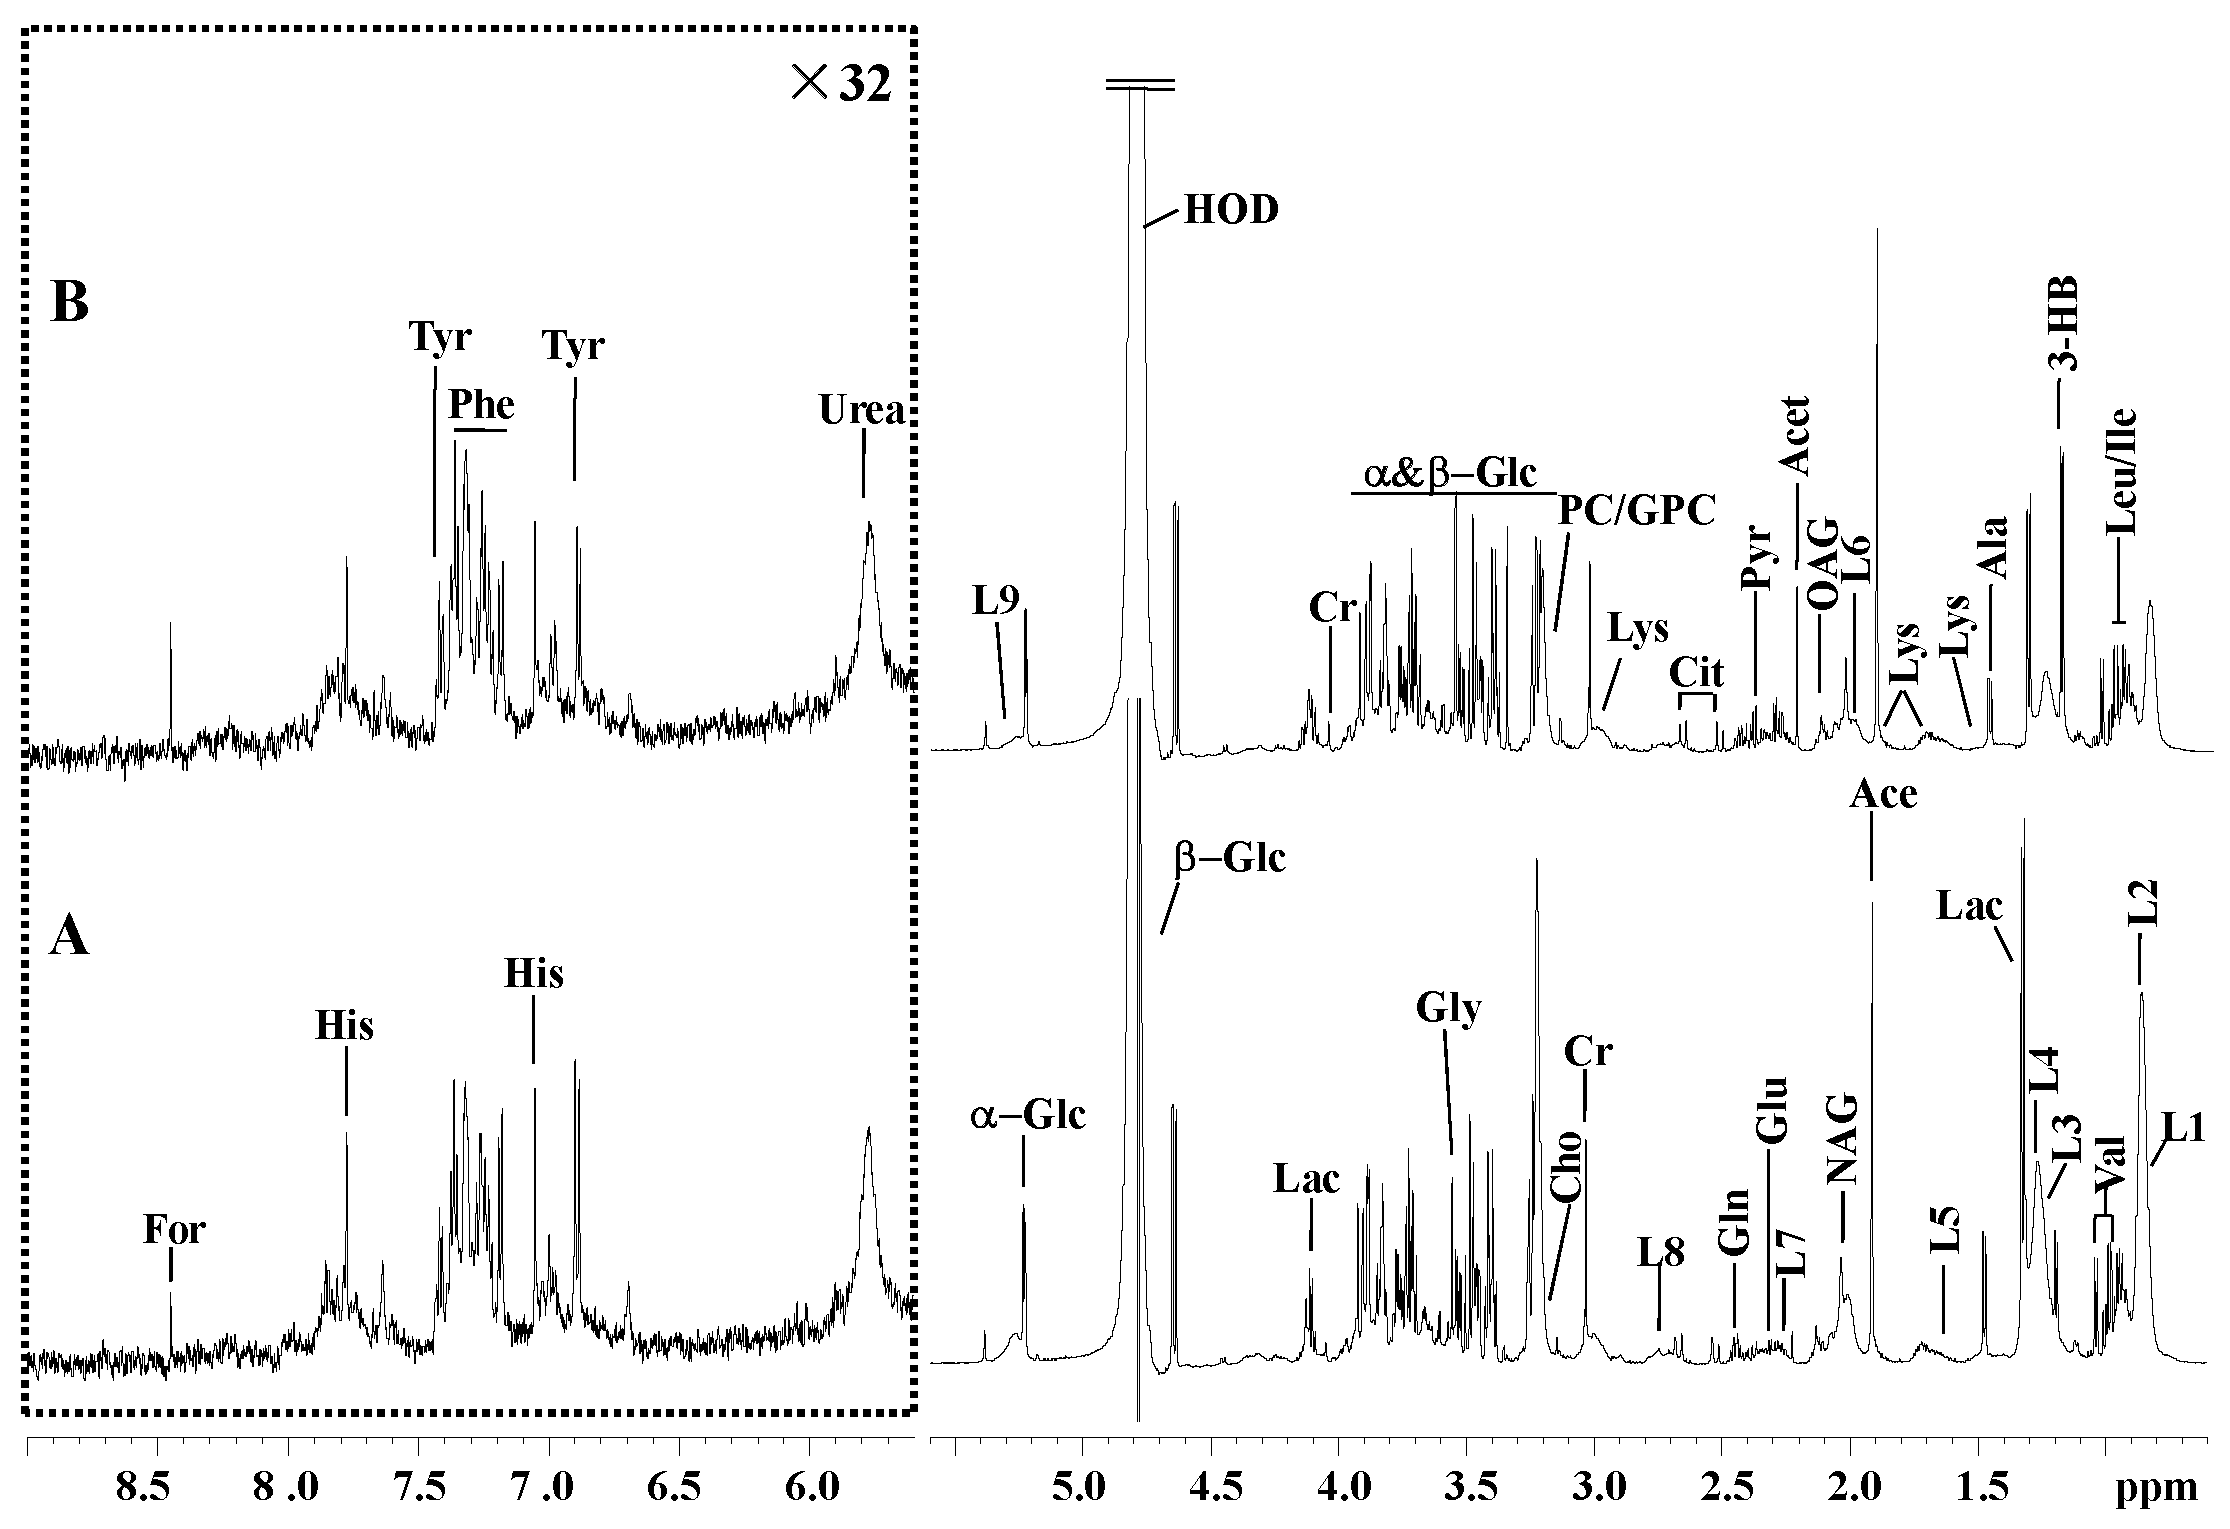
3.3.1. H NMR Spectra
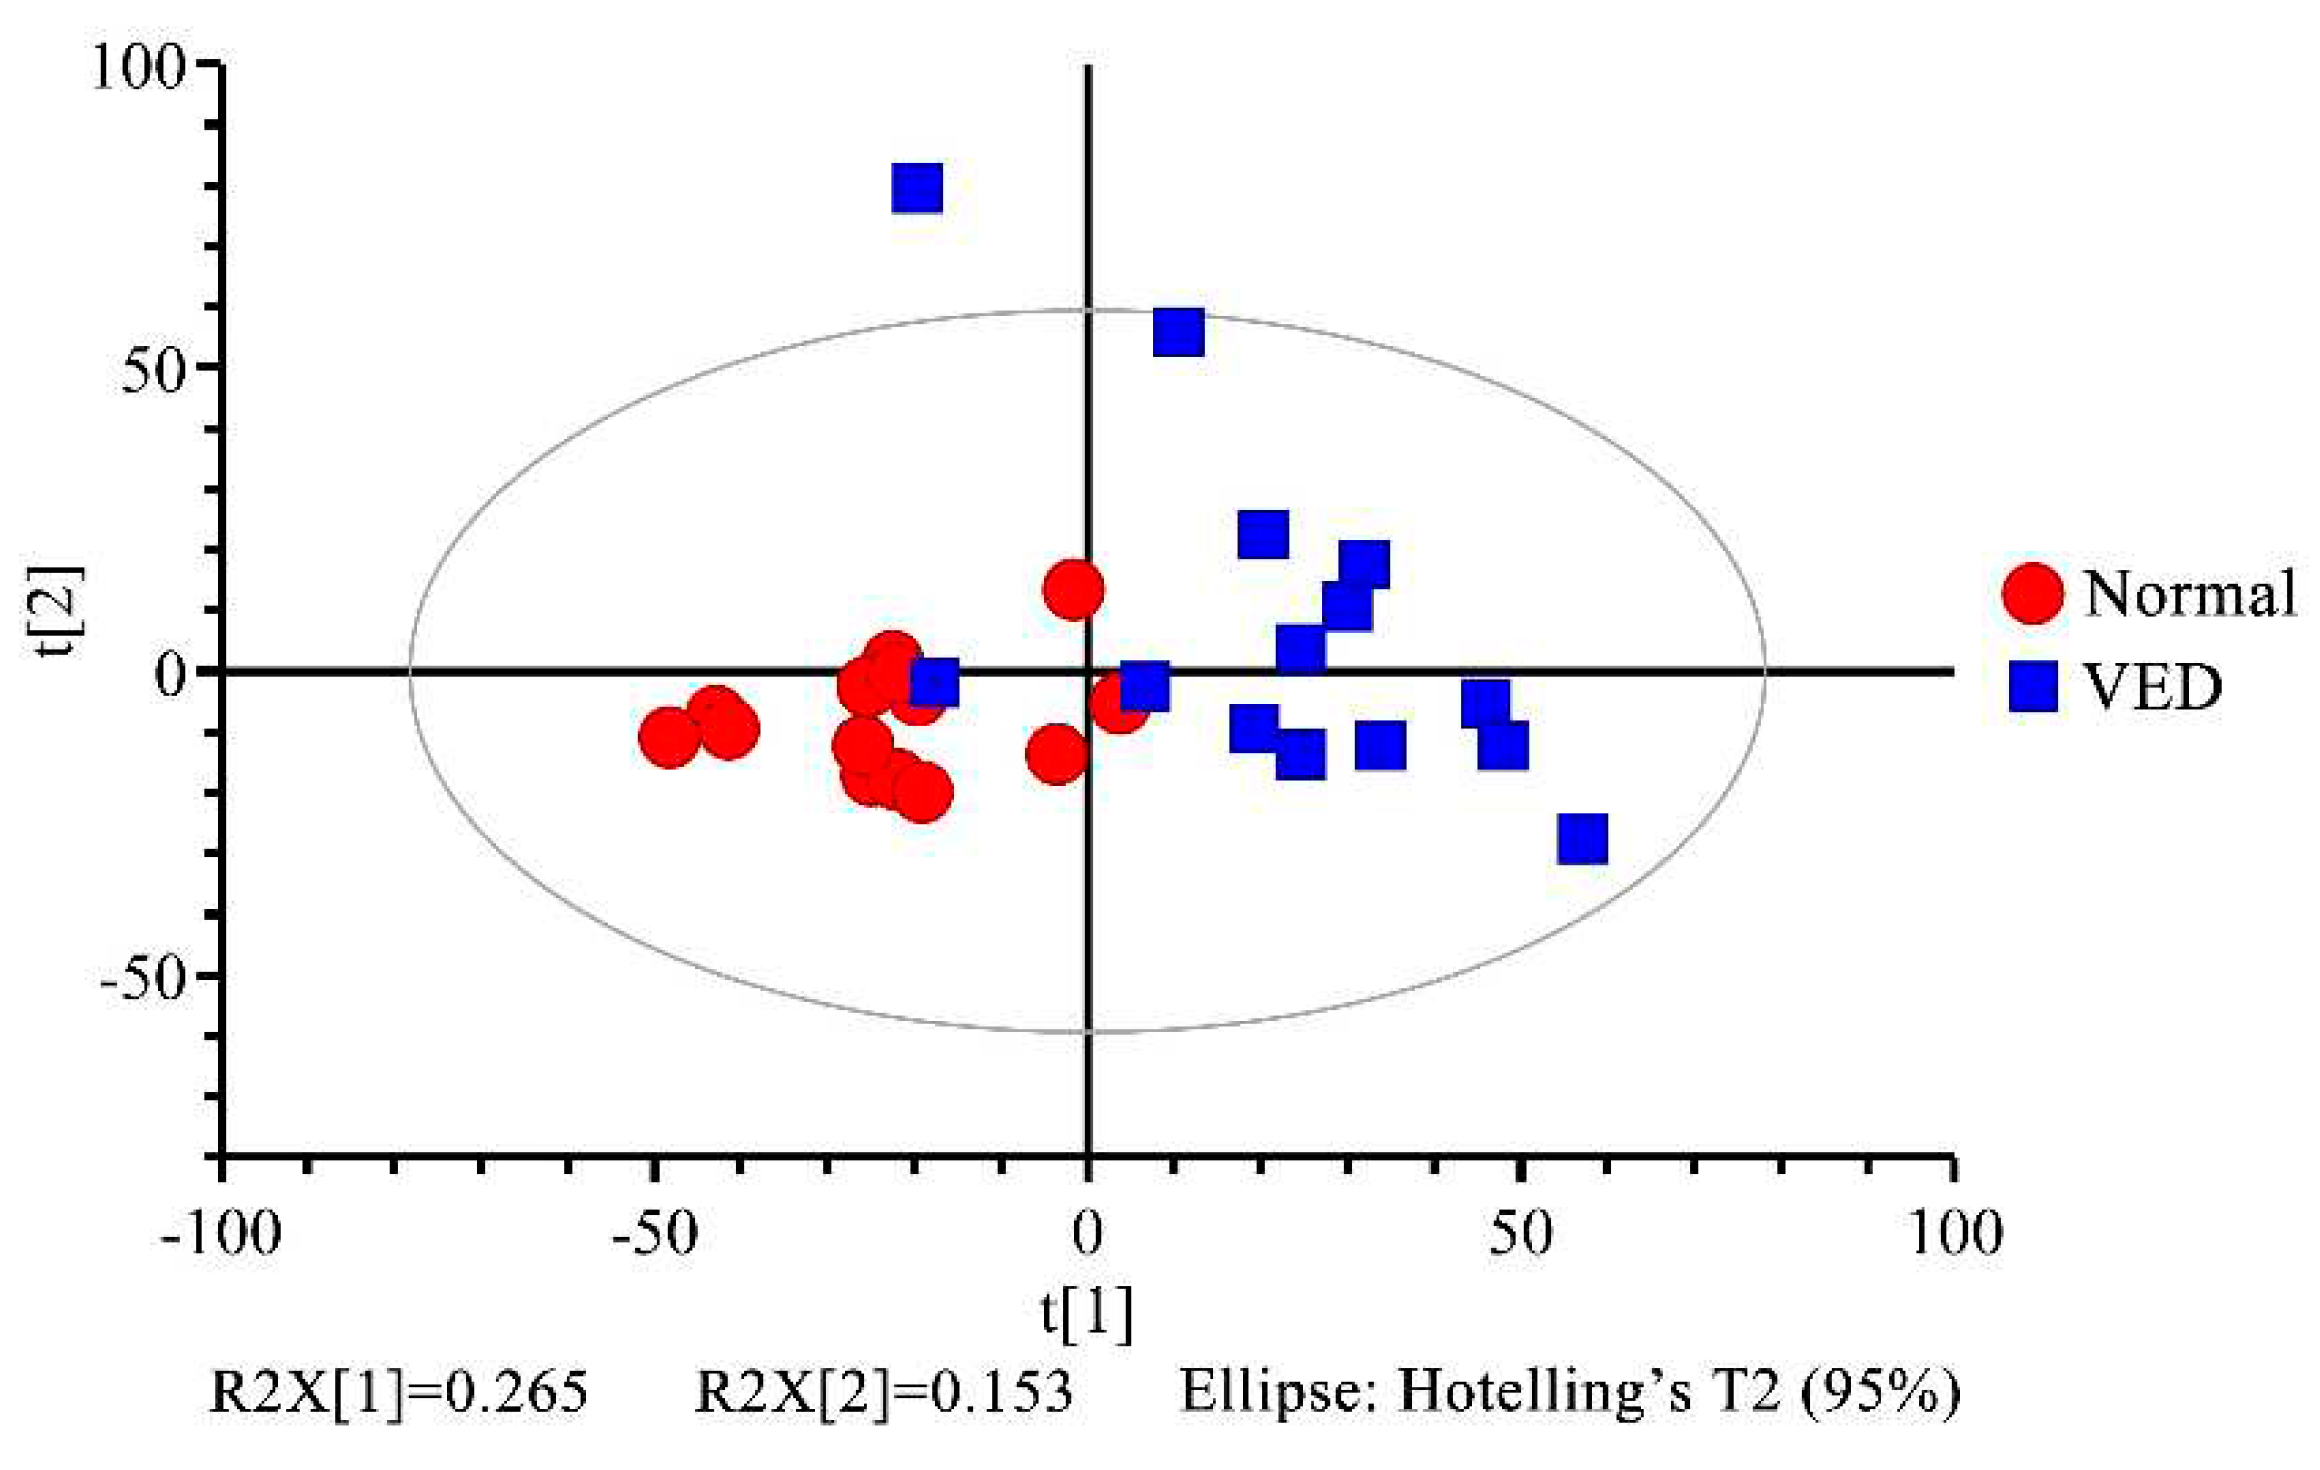
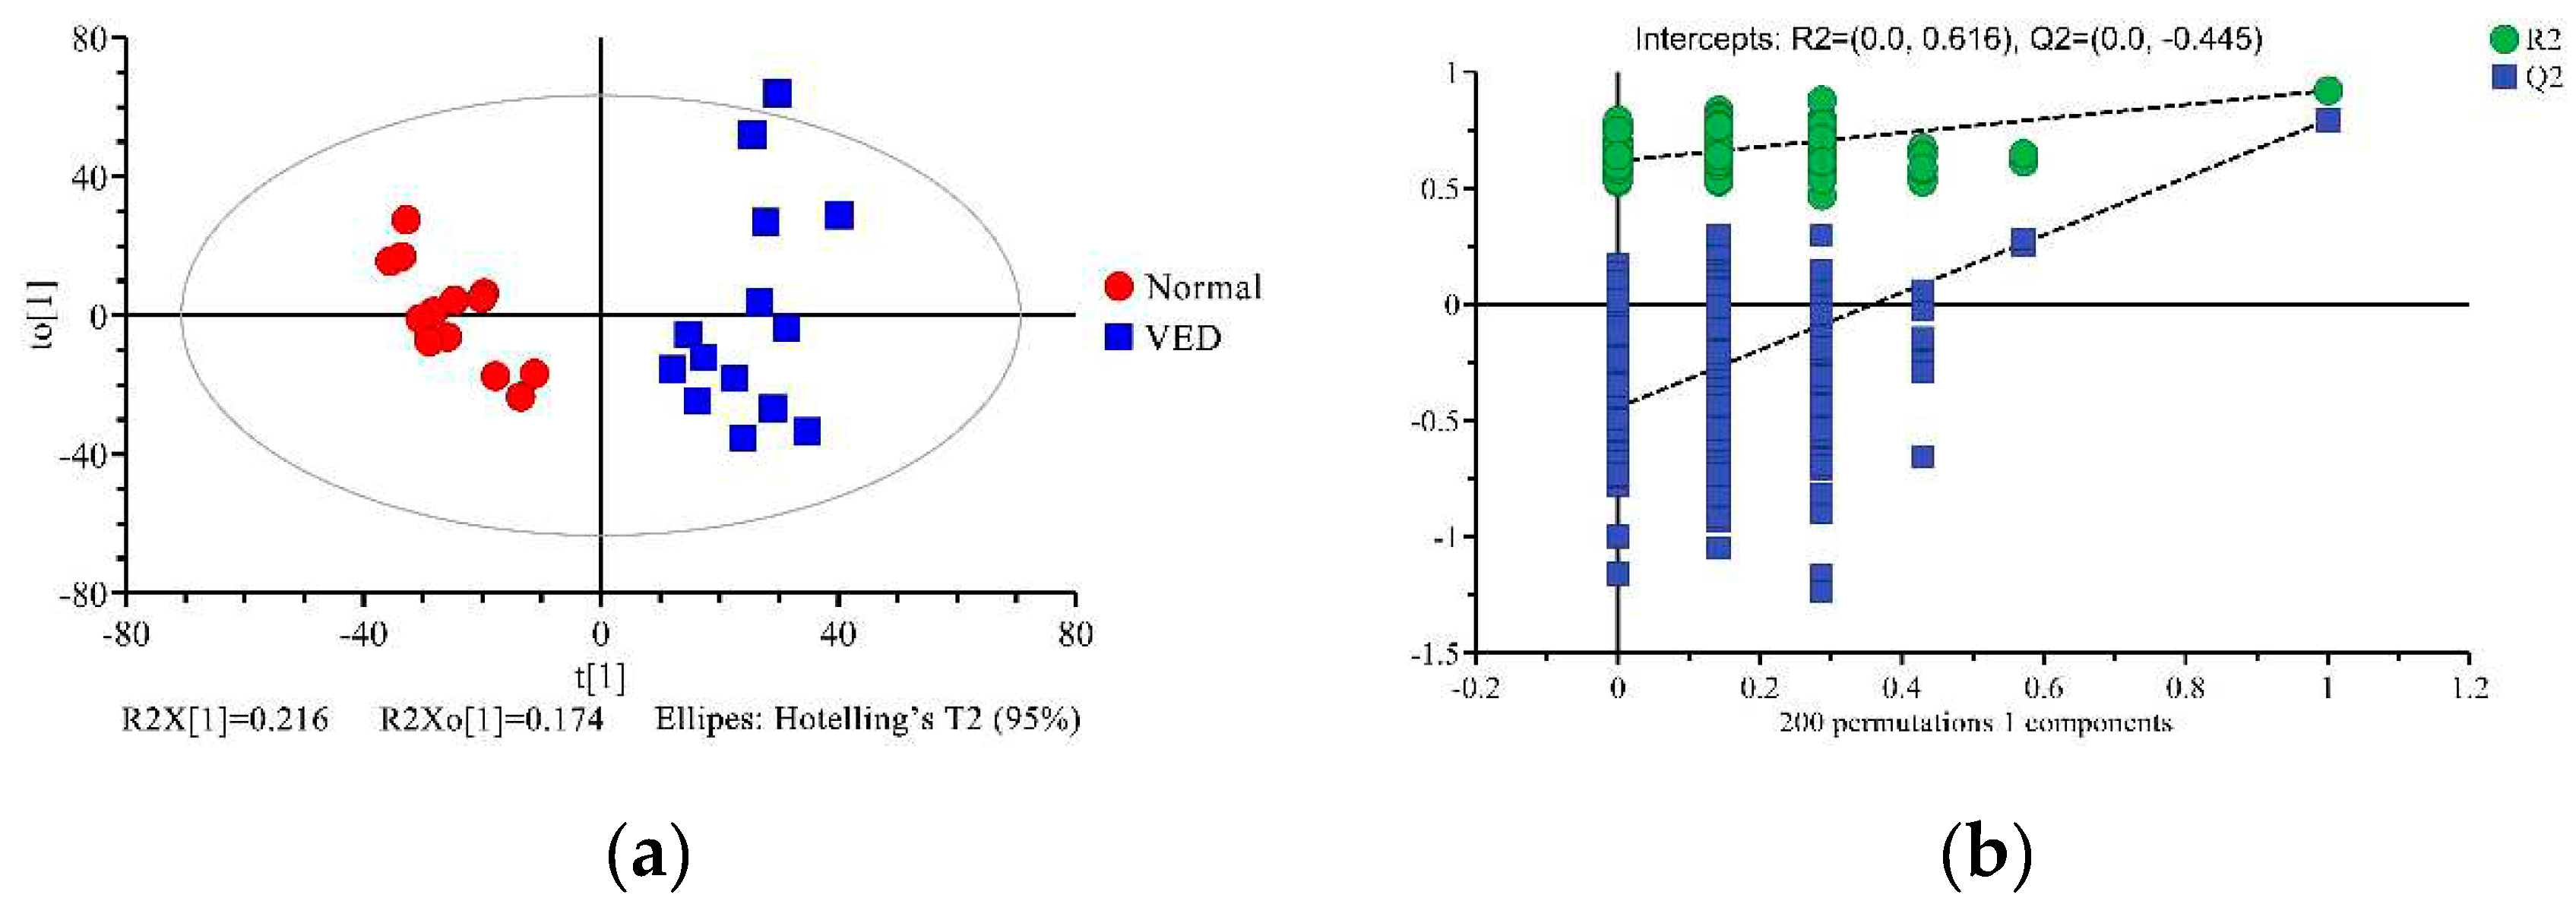
3.4. Multivariate Statistical Analysis
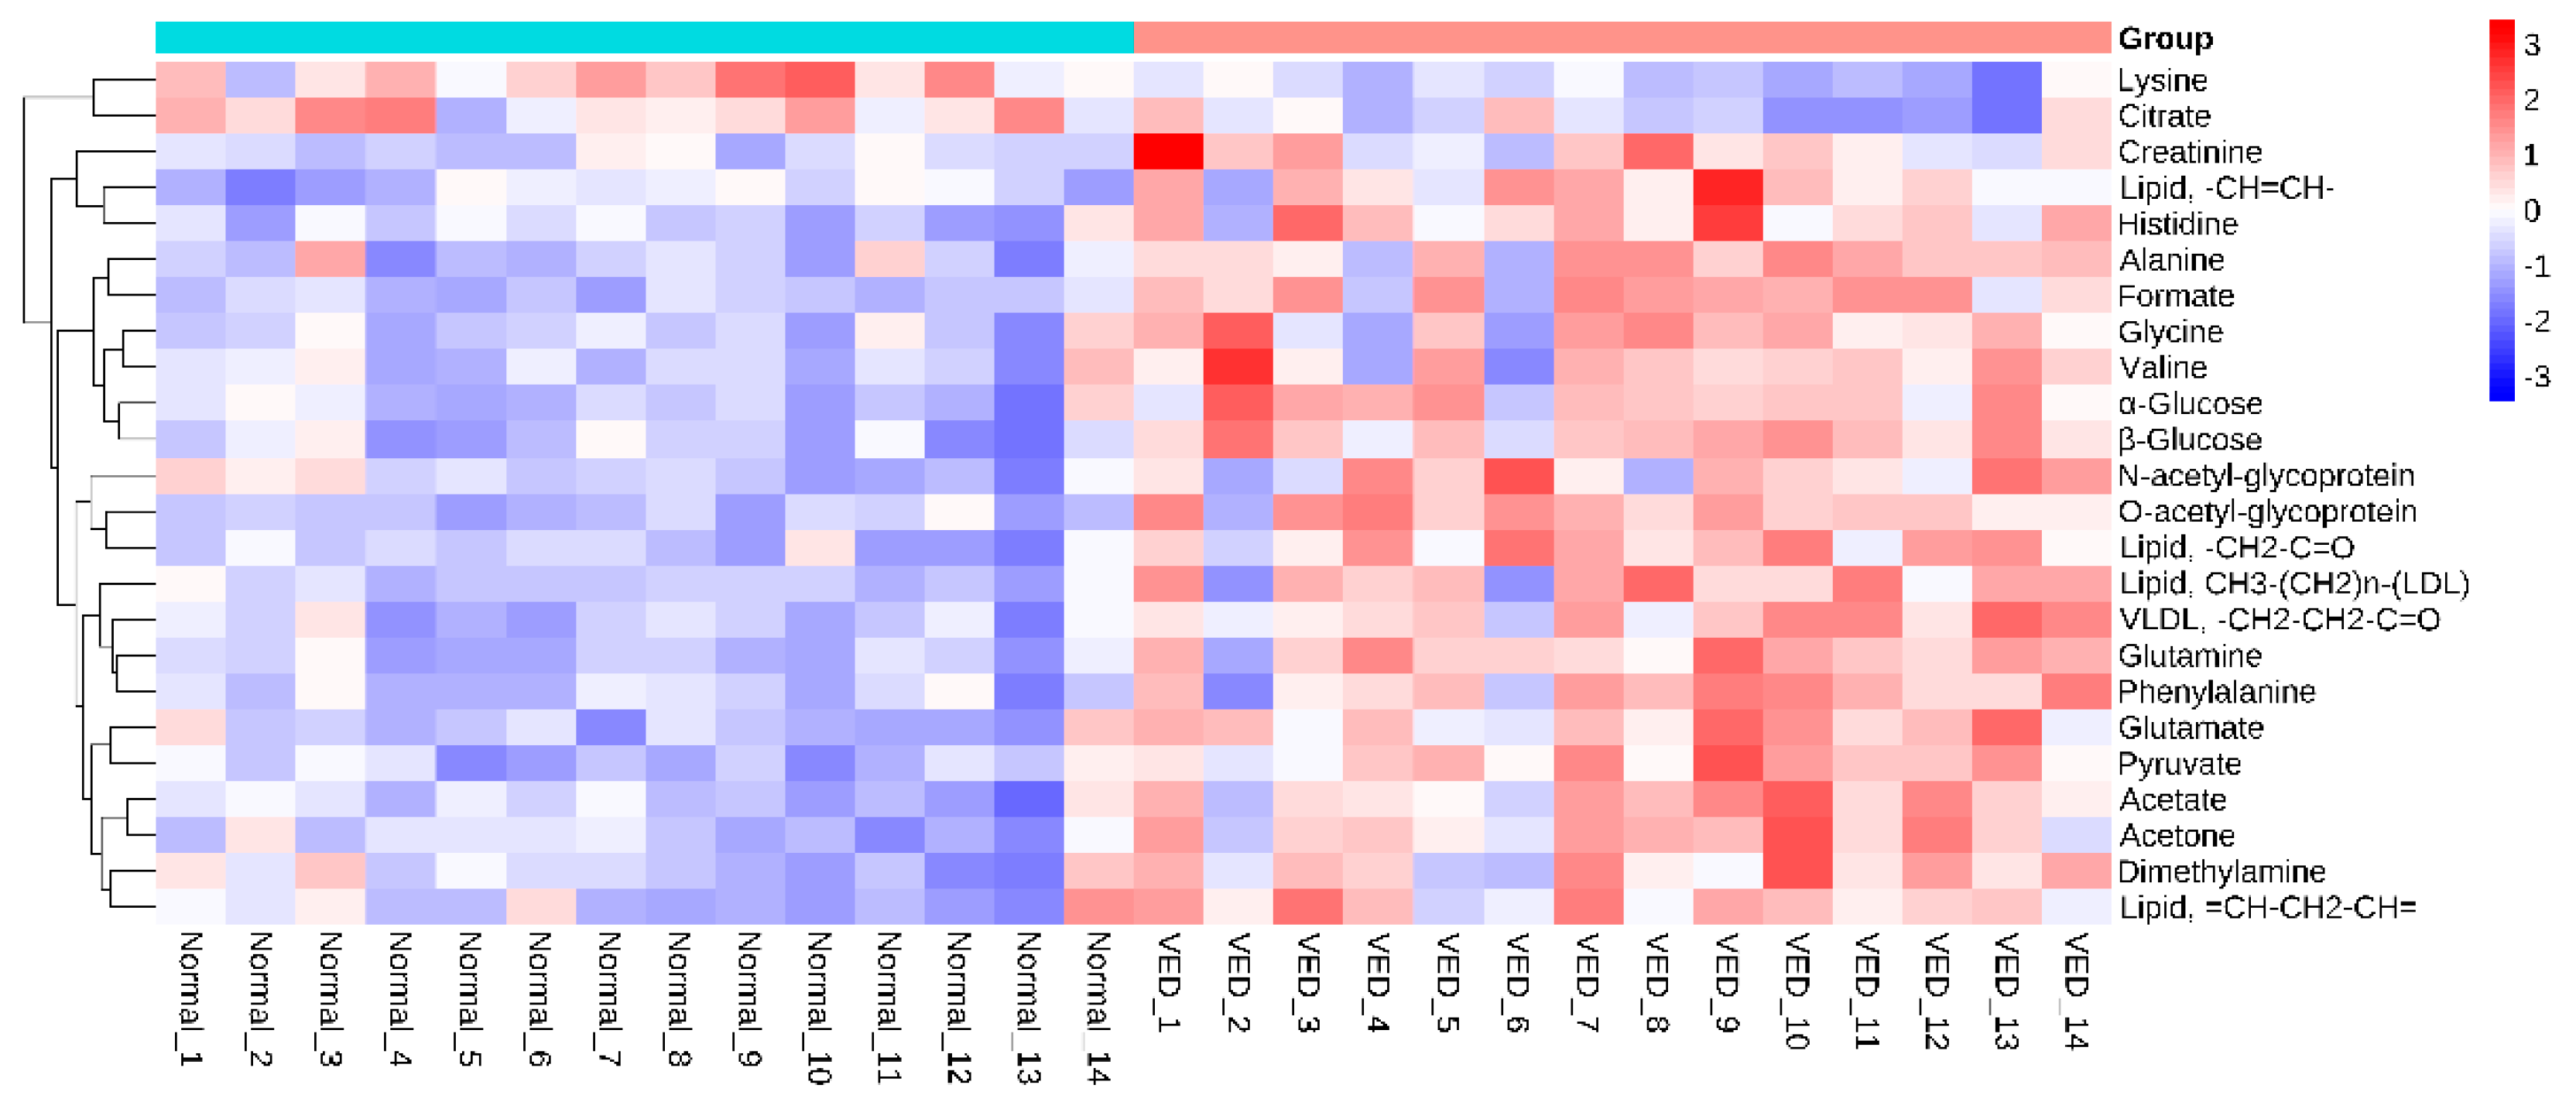
3.5. Differential Metabolites Between the VED and Normal Groups
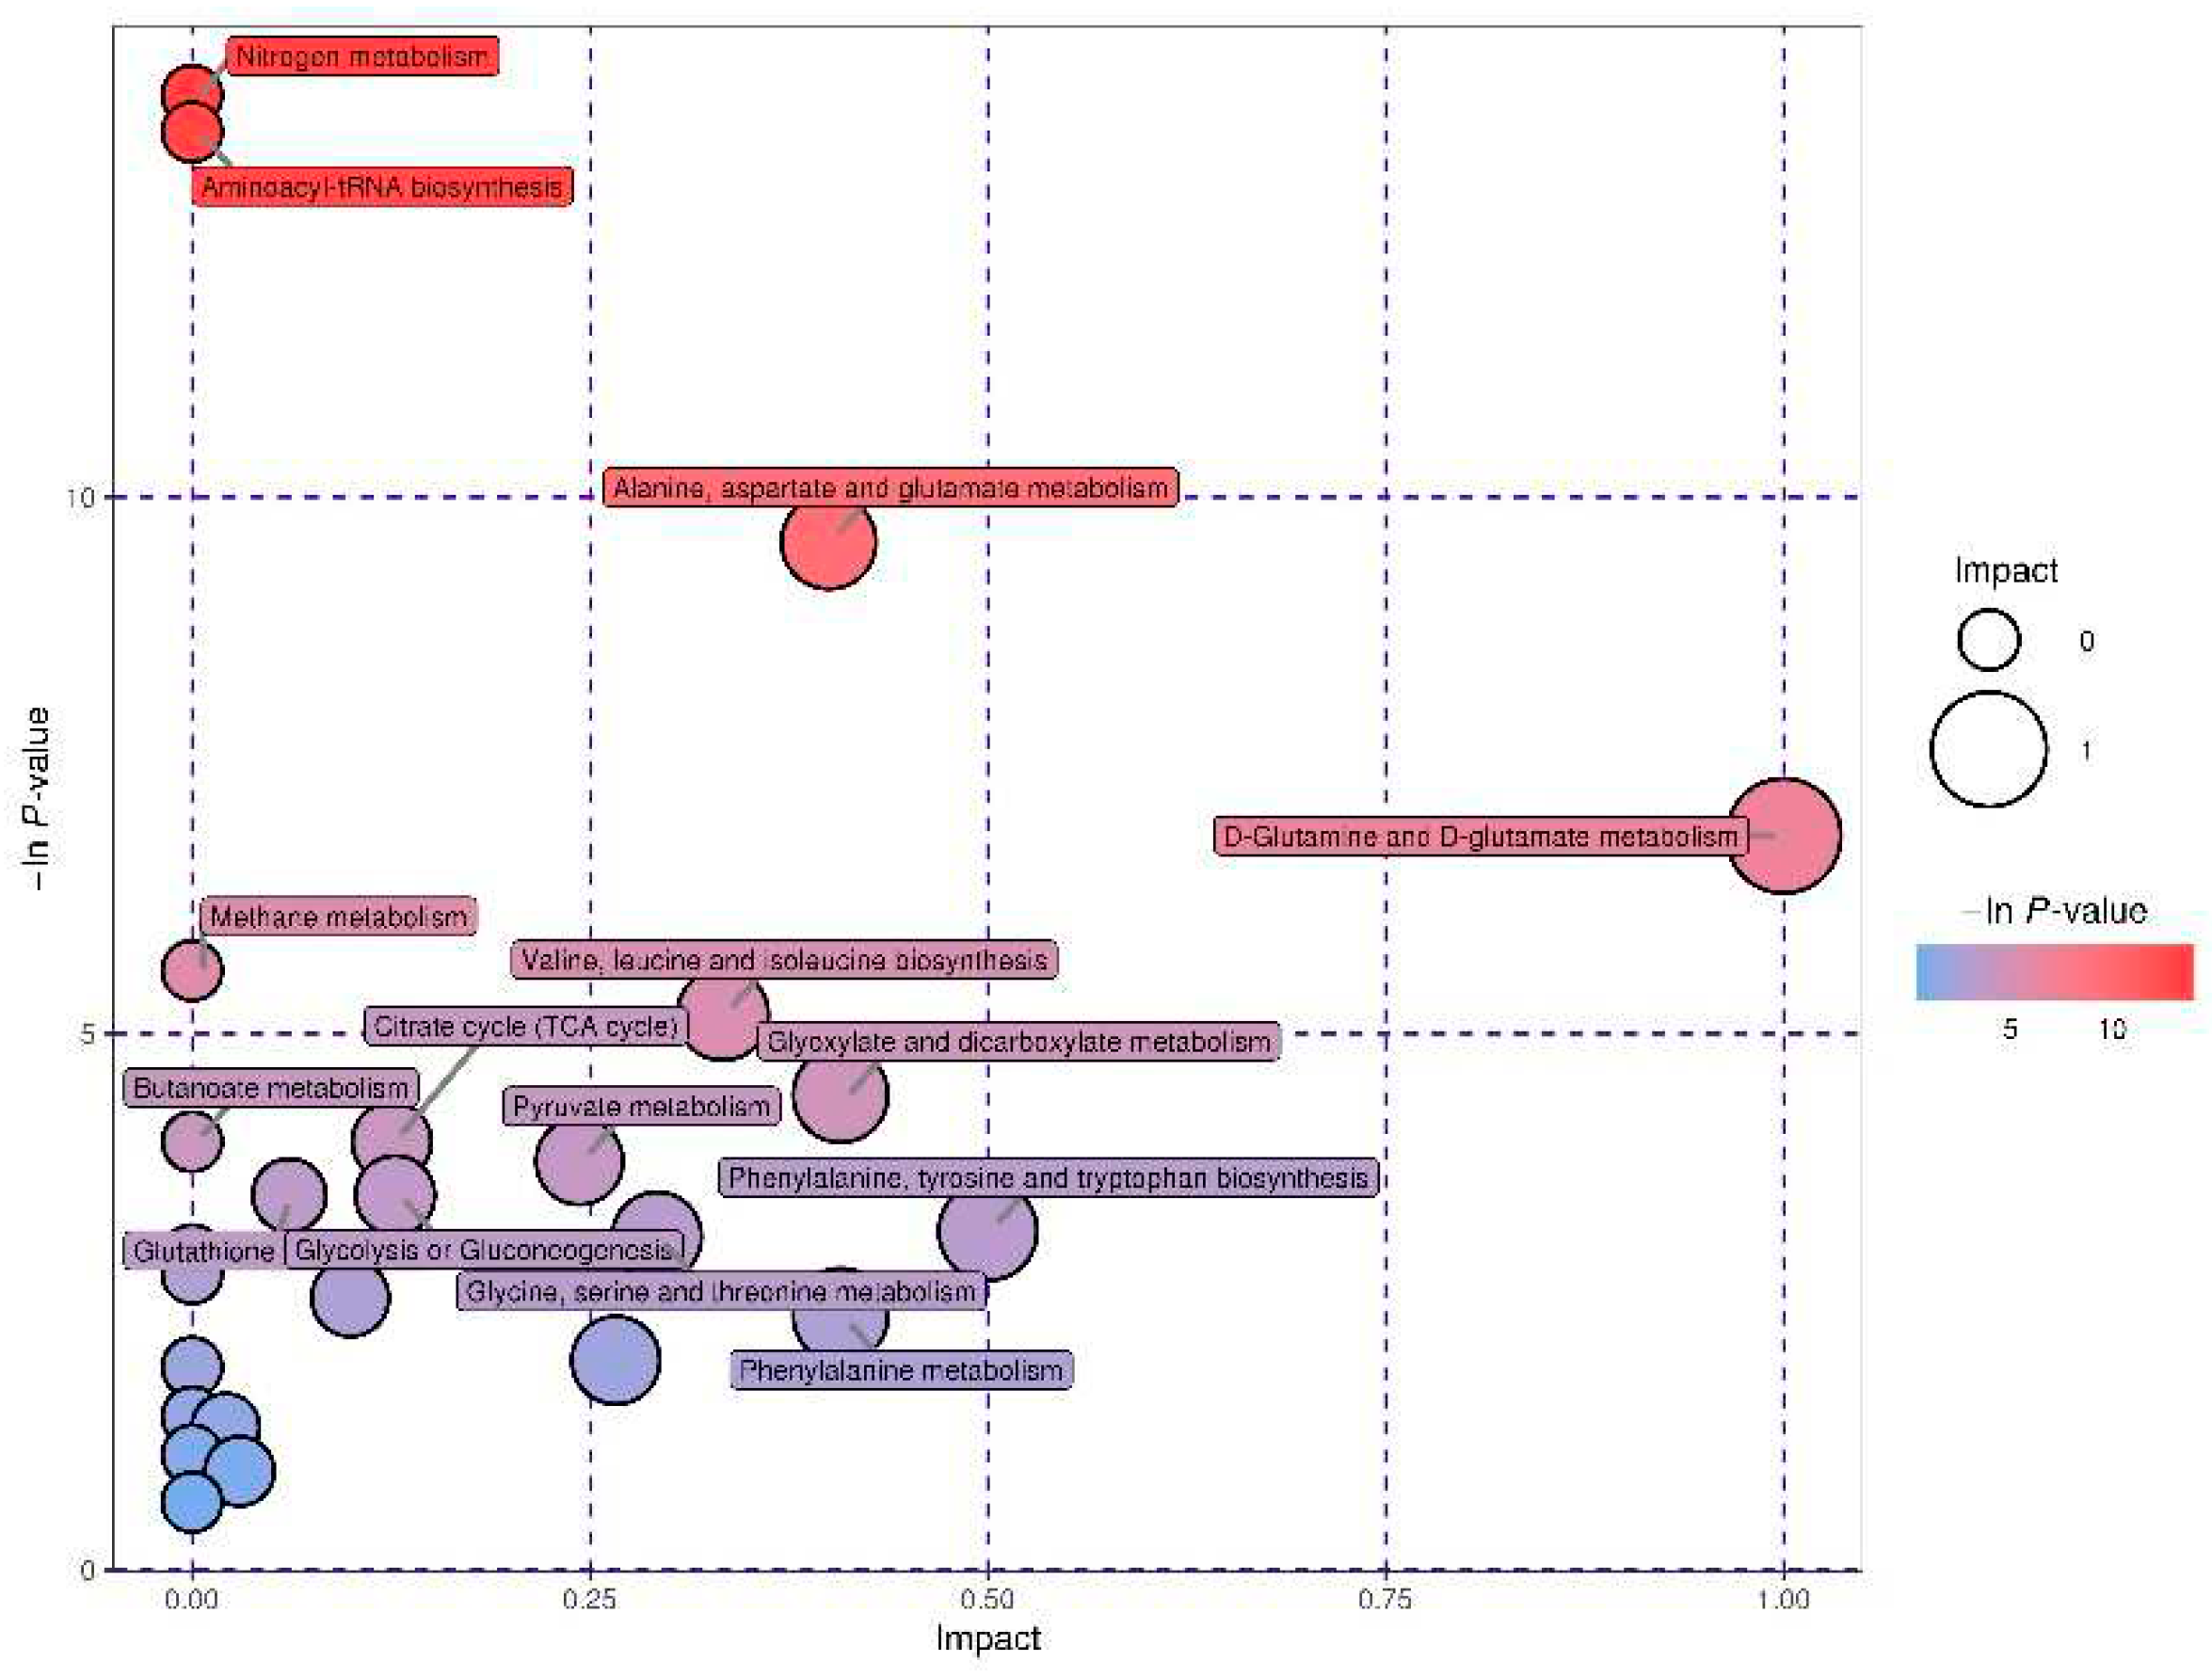
3.6. Characterization and Functional Analysis of the Key Metabolic Pathways
4. Discussion
5. Conclusions
Supplementary Materials
Author Contributions
Funding
Institutional Review Board Statement
Informed Consent Statement
Data Availability Statement
Acknowledgments
Conflicts of Interest
References
- Beeckman, A.; Vicca, J.; Van Ranst, G.; Janssens, G.P.; Fievez, V. Monitoring of vitamin E status of dry, early and mid-late lactating organic dairy cows fed conserved roughages during the indoor period and factors influencing forage vitamin E levels. J. Anim. Physiol. Anim. Nutr. 2010, 94, 736–746. [Google Scholar] [CrossRef] [PubMed]
- Weiss, W.P. A 100-year review: From ascorbic acid to zinc—Mineral and vitamin nutrition of dairy cows. J. Dairy Sci. 2017, 100, 10045–10060. [Google Scholar] [CrossRef]
- Haga, S.; Ishizaki, H.; Roh, S. The physiological roles of vitamin E and hypovitaminosis E in the transition period of high-yielding dairy cows. Animals 2021, 11, 1088. [Google Scholar] [CrossRef] [PubMed]
- Kuhn, M.J.; Sordillo, L.M. Vitamin E analogs limit in vitro oxidant damage to bovine mammary endothelial cells. J. Dairy Sci. 2021, 104, 7154–7167. [Google Scholar] [CrossRef] [PubMed]
- Moghimi-Kandelousi, M.; Alamouti, A.A.; Imani, M.; Zebeli, Q. A meta-analysis and meta-regression of the effects of vitamin E supplementation on serum enrichment, udder health, milk yield, and reproductive performance of transition cows. J. Dairy Sci. 2020, 103, 6157–6166. [Google Scholar] [CrossRef]
- Strickland, J.M.; Wisnieski, L.; Herdt, T.H.; Sordillo, L.M. Serum retinol, β-carotene, and α-tocopherol as biomarkers for disease risk and milk production in periparturient dairy cows. J. Dairy Sci. 2021, 104, 915–927. [Google Scholar] [CrossRef]
- Haga, S.; Miyaji, M.; Nakano, M.; Ishizaki, H.; Matsuyama, H.; Katoh, K.; Roh, S. Changes in the expression of α-tocopherol–related genes in liver and mammary gland biopsy specimens of peripartum dairy cows. J. Dairy Sci. 2018, 101, 5277–5293. [Google Scholar] [CrossRef]
- Goff, J.P.; Stabel, J.R. Decreased plasma retinol, α-tocopherol, and zinc concentration during the periparturient period: Effect of milk fever. J. Dairy Sci. 1990, 73, 3195–3199. [Google Scholar] [CrossRef]
- Weiss, W.P.; Todhunter, D.A.; Hogan, J.S.; Smith, K.L. Effect of duration of supplementation of selenium and vitamin E on periparturient dairy cows. J. Dairy Sci. 1990, 73, 3187–3194. [Google Scholar] [CrossRef]
- Weiss, W.P.; Hogan, J.S.; Smith, K.L.; Hoble, K.H. Relationships among selenium, vitamin E, and mammary gland health in commercial dairy herds. J. Dairy Sci. 1990, 73, 381–390. [Google Scholar] [CrossRef]
- Kumagai, H.; Chaipan, Y. Changes of vitamin E status of periparturient dairy cows and newborn calves. Anim. Sci. J. 2004, 75, 541–547. [Google Scholar] [CrossRef]
- NRC. Nutrient Requirements of Dairy Cattle, 7th ed.; The National Academies Press: Washington, DC, USA, 2001. [Google Scholar]
- Qian, W.; Yu, H.; Zhang, C.; Zhang, H.; Fu, S.; Xia, C. Plasma proteomics characteristics of subclinical vitamin E deficiency of dairy cows during early lactation. Front. Vet. Sci. 2021, 8, 723898. [Google Scholar] [CrossRef] [PubMed]
- Rodriguez-Martinez, A.; Ayala, R.; Posma, J.M.; Harvey, N.; Jiménez, B.; Sonomura, K.; Sato, T.A.; Matsuda, F.; Zalloua, P.; Gauguier, D.; et al. pJRES binning algorithm (JBA): A new method to facilitate the recovery of metabolic information from pJRES 1H NMR spectra. Bioinformatics 2019, 35, 1916–1922. [Google Scholar] [CrossRef]
- Wei, T.; Shu, Q.; Ning, J.; Wang, S.; Li, C.; Zhao, L.; Zheng, H.; Gao, H. The protective effect of basic fibroblast growth factor on diabetic nephropathy through remodeling metabolic phenotype and suppressing oxidative stress in mice. Front. Pharmacol. 2020, 11, 66. [Google Scholar] [CrossRef] [PubMed]
- Xu, W.; van Knegsel, A.; Saccenti, E.; van Hoeij, R.; Kemp, B.; Vervoort, J. Metabolomics of milk reflects a negative energy balance in cows. J. Proteome Res. 2020, 19, 2942–2949. [Google Scholar] [CrossRef] [PubMed]
- Zhao, C.; Bai, Y.; Fu, S.; Wu, L.; Xia, C.; Xu, C. Comparison of metabolic alterations in serum and milk whey between inactive ovaries and estrus dairy cows. Front. Vet. Sci. 2021, 7, 609391. [Google Scholar] [CrossRef]
- Basoglu, A.; Baspinar, N.; Tenori, L.; Licari, C.; Gulersoy, E. Nuclear magnetic resonance (NMR)-based metabolome profile evaluation in dairy cows with and without displaced abomasum. Vet. Q. 2020, 40, 1–15. [Google Scholar] [CrossRef]
- Sun, Y.; Xu, C.; Li, C.; Xia, C.; Xu, C.; Wu, L.; Zhang, H. Characterization of the serum metabolic profile of dairy cows with milk fever using 1H-NMR spectroscopy. Vet. Q. 2014, 34, 159–163. [Google Scholar] [CrossRef] [PubMed]
- Zhu, C.; Tang, K.; Lu, X.; Tang, J.; Laghi, L. An untargeted metabolomics investigation of milk from dairy cows with clinical mastitis by 1H-NMR. Foods 2021, 10, 1707. [Google Scholar] [CrossRef]
- Zhao, C.; Bai, Y.; Fu, S.; Wu, L. , Xia, C.; Xu, C. Metabolic alterations in dairy cows with subclinical ketosis after treatment with carboxymethyl chitosan-loaded, reduced glutathione nanoparticles. J. Vet. Intern. Med. 2020, 34, 2787–2799. [Google Scholar] [CrossRef]
- Eom, J.S.; Lee, S.J.; Kim, H.S.; Choi, Y.; Jo, S.U.; Lee, S.S.; Kim, E.T.; Lee, S.S. Metabolic profiling of serum and urine in lactating dairy cows affected by subclinical ketosis using proton nuclear magnetic resonance spectroscopy. J. Anim. Sci. Technol. 2022, 64, 247–261. [Google Scholar] [CrossRef]
- Lisuzzo, A.; Laghi, L.; Faillace, V.; Zhu, C.; Contiero, B.; Morgante, M.; Mazzotta, E.; Gianesella, M.; Fiore, E. Differences in the serum metabolome profile of dairy cows according to the BHB concentration revealed by proton nuclear magnetic resonance spectroscopy (1H-NMR). Sci. Rep. 2022, 12, 2525. [Google Scholar] [CrossRef]
- Eom, J.S.; Kim, H.S.; Lee, S.J.; Choi, Y.Y.; Jo, S.U.; Kim, J.; Lee, S.S.; Kim, E.T.; Lee, S.S. Metabolic profiling of rumen fluid and milk in lactating dairy cattle influenced by subclinical ketosis using proton nuclear magnetic resonance spectroscopy. Animals 2021, 11, 2526. [Google Scholar] [CrossRef]
- Sun, L.W.; Zhang, H.Y.; Wu, L.; Shu, S.; Xia, C.; Xu, C.; Zheng, J.S. (1)H-Nuclear magnetic resonance-based plasma metabolic profiling of dairy cows with clinical and subclinical ketosis. J. Dairy Sci. 2014, 97, 1552–1562. [Google Scholar] [CrossRef] [PubMed]
- Putman, A.K.; Brown, J.L.; Gandy, J.C.; Wisnieski, L.; Sordillo, L.M. Changes in biomarkers of nutrient metabolism, inflammation, and oxidative stress in dairy cows during the transition into the early dry period. J. Dairy Sci. 2018, 101, 9350–9359. [Google Scholar] [CrossRef] [PubMed]
- Edmonson, A.J.; Lean, I.J.; Weaver, L.D.; Farver, T.; Webster, G. A body condition scoring chart for Holstein dairy cows. J. Dairy Sci. 1989, 72, 68–78. [Google Scholar] [CrossRef]
- Siomek, A.; Gackowski, D.; Rozalski, R.; Dziaman, T.; Szpila, A.; Guz, J.; Olinski, R. Higher leukocyte 8-oxo-7,8-dihydro-2'-deoxyguanosine and lower plasma ascorbate in aging humans? Antioxid. Redox Signal. 2007, 9, 143–150. [Google Scholar] [CrossRef] [PubMed]
- Meyer, S.; Markova, M.; Pohl, G.; Marschall, T.A.; Pivovarova, O.; Pfeiffer, A.F.H.; Schwerdtle, T. Development, validation and application of an ICP-MS/MS method to quantify minerals and (ultra-)trace elements in human serum. J. Trace Elem. Med. Biol. 2018, 49, 157–163. [Google Scholar] [CrossRef] [PubMed]
- Wang, Q.; Zhang, Y.; Zheng, N.; Guo, L.; Song, X.; Zhao, S.; Wang, J. Biological system responses of dairy cows to aflatoxin B1 exposure revealed with metabolomic changes in multiple biofluids. Toxins 2019, 11, 77. [Google Scholar] [CrossRef]
- Wathes, D.C.; Fenwick, M.; Cheng, Z.; Bourne, N.; Llewellyn, S.; Morris, D.G.; Kenny, D.; Murphy, J.; Fitzpatrick, R. Influence of negative energy balance on cyclicity and fertility in the high producing dairy cow. Theriogenology 2007, 68, S232–241. [Google Scholar] [CrossRef]
- Lopreiato, V.; Mezzetti, M.; Cattaneo, L.; Ferronato, G.; Minuti, A.; Trevisi, E. Role of nutraceuticals during the transition period of dairy cows: A review. J. Anim. Sci. Biotechnol. 2020, 11, 96. [Google Scholar] [CrossRef] [PubMed]
- Morris, D.G.; Waters, S.M.; McCarthy, S.D.; Patton, J.; Earley, B.; Fitzpatrick, R.; Murphy, J.J.; Diskin, M.G.; Kenny, D.A.; Brass, A.; et al. Pleiotropic effects of negative energy balance in the postpartum dairy cow on splenic gene expression: Repercussions for innate and adaptive immunity. Physiol. Genomics 2009, 39, 28–37. [Google Scholar] [CrossRef]
- Safa, S.; Soleimani, A.; Heravi Moussavi, A. Improving productive and reproductive performance of Holstein dairy cows through dry period management. Asian-Australas. J. Anim. Sci. 2013, 26, 630–637. [Google Scholar] [CrossRef] [PubMed]
- Hare, K.S.; Wood, K.M.; Fitzsimmons, C.; Penner, G.B. Oversupplying metabolizable protein in late gestation for beef cattle: Effects on postpartum ruminal fermentation, blood metabolites, skeletal muscle catabolism, colostrum composition, milk yield and composition, and calf growth performance. J. Anim. Sci. 2019, 97, 437–455. [Google Scholar] [CrossRef]
- Nanashima, N.; Horie, K.; Kitajima, M.; Takamagi, S.; Mikami, K.; In, N.; Tomisawa, T. Hypocholesterolemic effect of Blackcurrant (Ribes nigrum) extract in healthy female subjects: A pilot study. Molecules 2021, 26, 4085. [Google Scholar] [CrossRef]
- Kiyose, C. Absorption, transportation, and distribution of vitamin E homologs. Free. Radic. Biol. Med. 2021, 177, 226–237. [Google Scholar] [CrossRef] [PubMed]
- Naidoo, N.; van Dam, R.M.; Koh, W.P.; Chen, C.; Lee, Y.P.; Yuan, J.M.; Ong, C.N. Plasma vitamin E and coenzyme Q10 are not associated with a lower risk of acute myocardial infarction in Singapore Chinese adults. J. Nutr. 2012, 142, 1046–1052. [Google Scholar] [CrossRef]
- Kusmayadi, A.; Bachtiar, K.R.; Prayitno, C.H. The effects of mangosteen peel (Garcinia mangostana L.) and Turmeric (Curcuma domestica Val) flour dietary supplementation on the growth performance, lipid profile, and abdominal fat content in Cihateup ducks. Vet. World. 2019, 12, 402–408. [Google Scholar] [CrossRef]
- Graf, D.; Weitkunat, K.; Dötsch, A.; Liebisch, G.; Döring, M.; Krüger, R.; Vatareck, E.; von Coburg, E.; Loh, G.; Watzl, B. Specific wheat fractions influence hepatic fat metabolism in diet-induced obese mice. Nutrients 2019, 11, 2348. [Google Scholar] [CrossRef]
- Yang, Y.; Ding, Z.; Wang, Y.; Zhong, R.; Feng, Y.; Xia, T.; Xie, Y.; Yang, B.; Sun, X.; Shu, Z. Systems pharmacology reveals the mechanism of activity of Physalis alkekengi L. var. franchetii against lipopolysaccharide-induced acute lung injury. J. Cell. Mol. Med. 2020, 24, 5039–5056. [Google Scholar]
- Guo, P.; Wang, J.; Dong, G.; Wei, D.; Li, M.; Yang, M.; Kong, L. NMR-based metabolomics approach to study the chronic toxicity of crude ricin from castor bean kernels on rats. Mol. Biosyst. 2014, 10, 2426–2440. [Google Scholar] [CrossRef]
- Li, P.; Liao, S.; Wang, J.; Xu, D.; Zhang, Q.; Yang, M.; Kong, L. NMR metabolic profiling of lipopolysaccharide-induced mice sepsis and the treatment effects of berberine. RSC Advances 2016, 6, 47474–47485. [Google Scholar] [CrossRef]
- Fu, X.; Wang, J.; Liao, S.; Lv, Y.; Xu, D.; Yang, M.; Kong, L. 1H NMR-based metabolomics reveals refined-Huang-Lian-Jie-Du-Decoction (BBG) as a potential ischemic stroke treatment drug with efficacy and a favorable therapeutic window. Front. Pharmacol. 2019, 10, 337. [Google Scholar] [CrossRef] [PubMed]
- He, D.T.; Gai, X.R.; Yang, L.B.; Li, J.T.; Lai, W.Q.; Sun, X.L.; Zhang, L.Y. Effects of guanidinoacetic acid on growth performance, creatine and energy metabolism, and carcass characteristics in growing-finishing pigs. J. Anim. Sci. 2018, 96, 3264–3273. [Google Scholar] [CrossRef]
- Forni Ogna, V.; Ogna, A.; Vuistiner, P.; Pruijm, M.; Ponte, B.; Ackermann, D.; Gabutti, L.; Vakilzadeh, N.; Mohaupt, M.; Martin, P.Y.; Péchère-Bertschi, A.; Paccaud, F.; Bochud, M.; Burnier, M.; et al.; Swiss Survey on Salt Group New anthropometry-based age- and sex-specific reference values for urinary 24-hour creatinine excretion based on the adult Swiss population. BMC Med. 2015, 13, 40. [Google Scholar] [CrossRef]
- Takeuchi, F.; Nishikata, N.; Nishimura, M.; Nagao, K.; Kawamura, M.Jr. Leucine-enriched essential amino acids enhance the antiseizure effects of the ketogenic diet in rats. Front. Neurosci. 2021, 15, 637288. [Google Scholar] [CrossRef]
- Taherizadeh, M.; Khoshnia, M.; Shams, S.; Hesari, Z.; Joshaghani, H. Clinical significance of plasma levels of gluconeogenic amino acids in esophageal cancer patients. Asian. Pac. J. Cancer Prev. 2020, 21, 2463–2468. [Google Scholar] [CrossRef]
- Sajitz-Hermstein, M.; Nikoloski, Z. A novel approach for determining environment-specific protein costs: The case of Arabidopsis thaliana. Bioinformatics 2010, 26, i582–588. [Google Scholar] [CrossRef]
- Liu, G.; Yan, T.; Wang, J.; Huang, Z.; Chen, X.; Jia, G.; Wu, C.; Zhao, H.; Xue, B.; Xiao, L.; et al. Biological system responses to zearalenone mycotoxin exposure by integrated metabolomic studies. J. Agric. Food Chem. 2013, 61, 11212–11221. [Google Scholar] [CrossRef]
- Ore, A.; Olayinka, E.T. Influence of moxifloxacin on hepatic redox status and plasma biomarkers of hepatotoxicity and nephrotoxicity in rat. Biochem. Res. Int. 2015, 192724. [Google Scholar] [CrossRef]
- Zhang, J.; Head, B.; Leonard, S.W.; Choi, J.; Tanguay, R.L.; Traber, M.G. Vitamin E deficiency dysregulates thiols, amino acids and related molecules during zebrafish embryogenesis. Redox. Biol. 2021, 101784. [Google Scholar] [CrossRef] [PubMed]
- Carracedo, J.; Ramírez-Carracedo, R.; Martínez de Toda, I.; Vida, C.; Alique, M.; De la Fuente, M.; Ramírez-Chamond, R. Protein carbamylation: A marker reflecting increased age-related cell oxidation. Int. J. Mol. Sci. 2018, 19, 1495. [Google Scholar] [CrossRef] [PubMed]
- He, B.; Li, H.; Hu, M.; Dong, W.; Wei, Z.; Li, J.; Yao, W.; Guo, X. Association between serum interleukin-17A level and high-altitude deacclimatization syndrome. Mediators Inflamm. 2016, 1732352. [Google Scholar] [CrossRef] [PubMed]
- Zhou, X.Q.; Yao, Z.W.; Peng, Y.; Mao, S.S.; Xu, D.; Qin, X.F.; Zhang, R.J. PQQ ameliorates D-galactose induced cognitive impairments by reducing glutamate neurotoxicity via the GSK-3β/Akt signaling pathway in mouse. Sci. Rep. 2018, 8, 8894. [Google Scholar] [CrossRef] [PubMed]
- Liu, X.W.; Tang, C.L.; Zheng, H.; Wu, J.X.; Wu, F.; Mo, Y.Y.; Liu, X.; Zhu, H.J.; Yin, C.L.; Cheng, B.; et al. Investigation of the hepatoprotective effect of Corydalis saxicola Bunting on carbon tetrachloride-induced liver fibrosis in rats by 1H-NMR-based metabonomics and network pharmacology approaches. J. Pharm. Biomed. Anal. 2018, 159, 252–261. [Google Scholar] [CrossRef]
- Guo, Y.S.; Tao, J.Z. 1H nuclear magnetic resonance-based plasma metabolomics provides another perspective of response mechanisms of newborn calves upon the first colostrum feeding. J. Anim. Sci. 2018, 96, 1769–1777. [Google Scholar] [CrossRef]
- Drackley, J.K. Biology of dairy cows during the transition period: The final frontier? J. Dairy Sci. 1999, 82, 2259–2273. [Google Scholar] [CrossRef]
- Trevisi, E.; Amadori, M.; Cogrossi, S.; Razzuoli, E.; Bertoni, G. Metabolic stress and inflammatory response in high-yielding, periparturient dairy cows. Res. Vet. Sci. 2012, 93, 695–704. [Google Scholar] [CrossRef]
- Couperus, A.M.; Schroeder, F.; Klukas, R.; Huber, J.; Wittek, T.; Peham, J.R. Influence of different lactation stages on circadian rhythmicity of metabolic biomarkers in dairy cows: A pilot study. Animals 2021, 11, 1043. [Google Scholar] [CrossRef]
- Liu, X.; Guo, X.; Zhang, Z. Preoperative serum hypersensitive-c-reactive-protein (Hs-CRP) to albumin ratio predicts survival in patients with luminal B subtype breast cancer. Onco. Targets Ther. 2021, 14, 4137–4148. [Google Scholar] [CrossRef]
- Zhou, W.; Fang, Y.; Han, X.; Kuang, T.; Xu, X.; Lou, W.; Wang, D. The value of alkaline phosphatase-to-albumin ratio in detecting synchronous metastases and predicting postoperative relapses among patients with well-differentiated pancreatic neuroendocrine neoplasms. J. Oncol. 2020, 8927531. [Google Scholar] [CrossRef] [PubMed]
- Esmaeilnejad, B.; Dalir-Naghadeh, B.; Tavassoli, M.; Asri-Rezaei, S.; Mahmoudi, S.; Rajabi, S.; Aligolzadeh, A.; Akbari, H.; Morvaridi, A. Assessment of hepatic oxidative damage, paraoxonase-1 activity, and lipid profile in cattle naturally infected with Babesia bigemina. Trop. Anim. Health Prod. 2021, 53, 219. [Google Scholar] [CrossRef] [PubMed]
- Morgavi, D.P.; Forano, E.; Martin, C.; Newbold, C.J. Microbial ecosystem and methanogenesis in ruminants. Animal 2010, 4, 1024–1036. [Google Scholar] [CrossRef] [PubMed]
- Yanibada, B.; Hohenester, U.; Pétéra, M.; Canlet, C.; Durand, S.; Jourdan, F.; Boccard, J.; Martin, C.; Eugène, M.; Morgavi, D.P.; et al. Inhibition of enteric methanogenesis in dairy cows induces changes in plasma metabolome highlighting metabolic shifts and potential markers of emission. Sci. Rep. 2020, 10, 15591. [Google Scholar] [CrossRef] [PubMed]
- Yang, Y.; Liu, Y.; Zheng, L.; Zhang, Q.; Gu, Q.; Wang, L.; Wang, L. 1H NMR based serum metabolic profiles associated with pathological progression of pancreatic islet β cell tumor in Rip1-Tag2 mice. Int. J. Biol. Sci. 2015, 11, 595–603. [Google Scholar] [CrossRef]

| Ingredient | Content (g/kg DM) |
|---|---|
| Corn silage | 250 |
| Alfalfa hay | 120 |
| Oat hay | 130 |
| Corn grain, ground | 251 |
| Wheat bran | 55 |
| Soybean meal | 106 |
| Rapeseed meal | 25 |
| Cottonseed cake | 45 |
| Calcium carbonate | 5 |
| Salt | 5 |
| Calcium phosphate | 3 |
| Mineral and vitamin premix1 | 5 |
| Chemical composition | |
| Organic matter | 919.3 |
| CP | 176.4 |
| Ether extract | 31.3 |
| NDF | 353.1 |
| ADF | 191.0 |
| Non-fiber carbohydrate2 | 358.7 |
| Ca | 8.3 |
| P | 4.2 |
| Parameters | Normal (n = 14) | VED (n = 14) | p-Value |
|---|---|---|---|
| Age | 3.16 ± 0.27 | 3.22 ± 0.13 | 0.230 |
| Parity | 2.22 ± 0.64 | 2.14 ± 0.55 | 0.363 |
| BCS | 3.29 ± 0.24 | 3.06 ± 0.27 | 0.012 |
| Milk yield (kg/d) | 35.98 ± 2.54 | 33.23 ± 2.37 | 0.003 |
| DMI (kg/d) | 15.24 ± 0.34 | 14.61 ± 0.49 | < 0.001 |
| Vitamin E (μg/mL) | 7.33 ± 1.38 | 2.59 ± 0.77 | < 0.001 |
| Vitamin A (μg/mL) | 0.19 ± 0.06 | 0.18 ± 0.05 | 0.318 |
| Vitamin C (μg/mL) | 2.66 ± 0.34 | 2.45 ± 0.67 | 0.153 |
| Selenium (μg/mL) | 0.05 ± 0.01 | 0.05 ± 0.01 | 0.683 |
| Zinc (μg/mL) | 1.22 ± 0.26 | 1.28 ± 0.23 | 0.262 |
| Copper (μg/mL) | 0.98 ± 0.31 | 0.96 ± 0.24 | 0.425 |
| Calcium (mmol/L) | 2.08 ± 0.69 | 2.07 ± 0.93 | 0.487 |
| Phosphorus (mmol/L) | 2.72 ± 0.38 | 2.60 ± 0.29 | 0.178 |
| Magnesium (mmol/L) | 1.54 ± 0.31 | 1.43 ± 0.46 | 0.232 |
| Parameters | Normal (n = 14) | VED (n = 14) | p-Value |
|---|---|---|---|
| BHB (mmol/L) | 1.02 ± 0.34 | 1.14 ± 0.39 | 0.197 |
| NEFA (mmol/L) | 0.51 ± 0.18 | 0.78 ± 0.18 | < 0.001 |
| Glucose (mmol/L) | 5.90 ± 2.59 | 6.84 ± 2.38 | 0.163 |
| AST (U/L) | 74.06 ± 3.62 | 95.46 ± 7.10 | < 0.001 |
| ALT (U/L) | 43.60 ± 8.30 | 42.76 ± 8.86 | 0.399 |
| Albumin (g/L) | 58.01 ± 8.62 | 46.87 ± 7.69 | < 0.001 |
| TC (mmol/L) | 5.65 ± 1.45 | 5.98 ± 1.84 | 0.301 |
| LDL (mmol/L) | 3.93 ± 0.94 | 5.05 ± 0.82 | 0.001 |
| HDL (mmol/L) | 1.51 ± 0.21 | 1.13 ± 0.22 | < 0.001 |
| TAC (mmol/L) | 0.54 ± 0.17 | 0.24 ± 0.10 | < 0.001 |
| SOD (U/mL) | 114.30 ± 14.67 | 122.20 ± 15.32 | 0.088 |
| GSH-Px (U/mL) | 31.65 ± 8.05 | 29.08 ± 8.49 | 0.209 |
| Catalase (U/mL) | 21.75 ± 1.64 | 22.57 ± 1.19 | 0.071 |
| MDA (mmol/L) | 9.84 ± 1.51 | 12.59 ± 2.04 | < 0.001 |
| No. | Metabolites | ra | Trendb | p-Value |
|---|---|---|---|---|
| 1 | Acetate | 0.7093 | ↑ | 0.0001 |
| 2 | Acetone | 0.7099 | ↑ | < 0.0001 |
| 3 | Alanine | 0.6812 | ↑ | 0.0003 |
| 4 | Citrate | 0.5886 | ↑ | 0.0023 |
| 5 | Creatinine | 0.5632 | ↑ | 0.0046 |
| 6 | Dimethylamine | 0.5760 | ↑ | 0.0016 |
| 7 | Formate | 0.7439 | ↑ | < 0.0001 |
| 8 | Glutamate | 0.7495 | ↑ | < 0.0001 |
| 9 | Glutamine | 0.8136 | ↑ | < 0.0001 |
| 10 | Glycine | 0.6464 | ↑ | 0.0015 |
| 11 | Histidine | 0.6720 | ↑ | 0.0001 |
| 12 | Lipid, CH3-(CH2)n-(LDL) | 0.6718 | ↑ | 0.0004 |
| 13 | VLDL, -CH2-CH2-C=O | 0.7018 | ↑ | < 0.0001 |
| 14 | Lipid, -CH2-C=O | 0.7270 | ↑ | < 0.0001 |
| 15 | Lipid, =CH-CH2-CH= | 0.6644 | ↑ | 0.0005 |
| 16 | Lipid, -CH=CH- | 0.5873 | ↑ | 0.0005 |
| 17 | Lysine | 0.7403 | ↑ | < 0.0001 |
| 18 | N-acetyl-glycoprotein | 0.5738 | ↑ | 0.0034 |
| 19 | O-acetyl-glycoprotein | 0.8071 | ↑ | < 0.0001 |
| 20 | Phenylalanine | 0.7010 | ↑ | 0.0001 |
| 21 | Pyruvate | 0.7923 | ↑ | < 0.0001 |
| 22 | Valine | 0.5915 | ↑ | 0.0025 |
| 23 | α-Glucose | 0.7466 | ↑ | < 0.0001 |
| 24 | β-Glucose | 0.7968 | ↑ | < 0.0001 |
| Main pathway | Totala | Hitsb | Raw pc | Holm pd | -ln(p)e | Impactf |
|---|---|---|---|---|---|---|
| Nitrogen metabolism | 9 | 4 | < 0.001 | < 0.001 | 13.75 | 0 |
| Aminoacyl-tRNA biosynthesis | 64 | 7 | < 0.001 | < 0.001 | 13.40 | 0 |
| Alanine, aspartate, and glutamate metabolism | 23 | 4 | < 0.001 | 0.005 | 9.58 | 0.40 |
| D-Glutamine and D-glutamate metabolism | 5 | 2 | 0.001 | 0.083 | 6.84 | 1.00 |
| Valine, leucine, and isoleucine biosynthesis | 11 | 2 | 0.006 | 0.429 | 5.18 | 0.33 |
| Glyoxylate and dicarboxylate metabolism | 16 | 2 | 0.012 | 0.896 | 4.43 | 0.41 |
| Citrate cycle | 20 | 2 | 0.018 | 1 | 3.99 | 0.13 |
| Pyruvate metabolism | 22 | 2 | 0.022 | 1 | 3.81 | 0.24 |
| Glycolysis or gluconeogenesis | 26 | 2 | 0.030 | 1 | 3.49 | 0.13 |
| Phenylalanine, tyrosine, and tryptophan biosynthesis | 4 | 1 | 0.043 | 1 | 3.16 | 0.50 |
| Glycine, serine, and threonine metabolism | 32 | 2 | 0.045 | 1 | 3.11 | 0.29 |
Disclaimer/Publisher’s Note: The statements, opinions and data contained in all publications are solely those of the individual author(s) and contributor(s) and not of MDPI and/or the editor(s). MDPI and/or the editor(s) disclaim responsibility for any injury to people or property resulting from any ideas, methods, instructions or products referred to in the content. |
© 2023 by the authors. Licensee MDPI, Basel, Switzerland. This article is an open access article distributed under the terms and conditions of the Creative Commons Attribution (CC BY) license (http://creativecommons.org/licenses/by/4.0/).


