Submitted:
25 July 2023
Posted:
26 July 2023
You are already at the latest version
Abstract
Keywords:
1. Introduction
2. Theoretical basis
3. Research on RGB LED dimming
3.1. Dimming method and calculation method
3.2. Simulation analysis of dimming
3.3. Dimming experiment
4. Design and Experiment of RGB LEDs Visible Light Communication System
4.1. System working principle and experimental device
4.2. Analysis of experimental results
4.3. Discussion
5. Conclusions
Author Contributions
Institutional Review Board Statement
Informed Consent Statement
Data Availability Statement
Conflicts of Interest
References
- Borisuit A; Linhart F; Scartezzini J L; Munch, M. Effects of realistic office daylighting and electric lighting conditions on visual comfort, alertness and mood. Lighting Research &Technology. 2014, 47,192-209. [CrossRef]
- Gu F B; Zhu T F; Qian F. Analysis of photobiological safety of indoor LED spotlights. Journal of China University of Metrology. 2014, 25, 332-336.
- Liu W, Wang X J. The impact of lighting on human physiology and psychology. Lamps and Lighting. 2002,26,31-34.
- Bommel W J M, V. Non-visual biological effect of lighting and the practical meaning for lighting for work. Applied Ergonomics. 2006, 37, 37,461–466. [Google Scholar] [PubMed]
- Shi, L. The effect of color temperature of lighting sources on the physiological function of the human central nervous system. Ergonomics. 2006, 12, 59–61. [Google Scholar]
- Gillette M U; Tischkau S A. Suprachiasmatic nucleus: The brain's circadian clock. Recent Progress in Hormone Research. 1999, 54, 33-58.
- Ju J Q; Chen D H; Lin Y D. The non visual biological effects of lighting and their practical significance. Journal of Lighting Engineering.2009,20,25-28.
- Matheus L E M; Vieira A B; Vieira L F M. Visible Light Communication: Concepts, Applications and Challenges. IEEE Communications Surveys & Tutorials. 2019, 21, 3204-3237.
- Kottke C; Hilt J; Kai H. 1.25 Gbit/s visible light WDM link based on DMT modulation of a single RGB LED luminary. 2014 38th European Conference and Exhibition on Optical Communications, Amsterdam, Netherlands, 16-, pp.3-4. 20 September. [CrossRef]
- Cossu G; Wajahat A; Corsini R. 5.6 Gbit/s downlink and 1.5 Gbit/s uplink optical wireless transmission at indoor distances (≥ 1.5 m). 2014 The European Conference on Optical Communication (ECOC), Cannes, France, 21-, pp. 26-29. 25 September.
- Cossu G; Ali W; Corsini R. Gigabit-class optical wireless communication system at indoor distances (1.5-4 m). Optics Express. 2015, 23, 15700-15705. [CrossRef]
- Kang Y, Ke X Z. Multidimensional coding in visible light communication. China Laser. 2015,42,138-144.
- Bian R; Tavakkolnia I; Haas H. 10.2 Gb/s visible light communication with off-the-shelf LEDs. 2018 European Conference on Optical Communication (ECOC), Rome, Italy ,23-27 September 2018, pp. 1-3. 27 September. [CrossRef]
- Bian R; Tavakkolnia I; Haas H. 15.73 Gb/s visible light communication with off-the-shelf LEDs. Journal of Lightwave Technology. 2019, 37, 2418-2424. [CrossRef]
- Qiu P; Zhu S; Jin Z. Beyond 25 Gbps optical wireless communication using wavelength division multiplexed LEDs and micro-LEDs. Optics letters. 2022, 47, 317-320. [CrossRef]
- Peng S F; Han Q H; Li L H. The effect of LED light source on the secretion of Monocyte chemoattractant factor-1 and Interleukin-8 by human Retinal pigment epithelium cells. New Advances in Ophthalmology. 2016, 36,201-205.
- Wei S J; Nan L; Wang X. Study on the Effect of Danshensu on Light Damage of Human Lens Epithelial Cells Induced by LED Light Source. Chinese Journal of Practical Ophthalmology. 2015,33,937-942.
- Guo Y; Zeng S S; Hao W T. The effect of LED classroom lighting fixtures on the physiological characteristics of the human eye. Journal of Lighting Engineering. 2019,30,7-14.
- Ohno, Y. Color rendering and luminous efficacy of white LED spectra. Optics letters. 2004, 5530, 88–98. [Google Scholar] [CrossRef]
- Hu Y B; Zhuang Q R; Liu S W. on synthetic white light source with high Color index LED. Journal of optics. 2016,36,216-225.
- Zhang X; Wang Q; Li J. Estimating spectral reflectance from camera responses based on CIE XYZ tristimulus values under multi-illuminants. Color Research & Application. 2017, 42, 68-77.
- Robertson A, R. Computation of Correlated Color Temperature and Distribution Temperature. Journal of the Optical Society of America. 1968, 58, 1528–1535. [Google Scholar] [CrossRef]
- Chen J B; Yu J H; Gao Y F. Research on LED white light source with ultra-high Color index and adjustable color temperature. Journal of Optics. 2015, 35, 252-258.
- Xia L. Design of intelligent LED lighting system. Master's thesis, Xidian University, Xi'an,2014.
- Dyble M; Narendran N; Bierman A. Impact of dimming white LEDs: chromaticity shifts due to different dimming methods. Optics Communications. 2005, 5941, 291-299. [CrossRef]
- 26. Xiong C Y; Wu Y X; L Y. Application of RGBW four-color LED mixing optimization in solar simulation. Journal of Photonics. 2017, 46, 43-52.
- Beczkowski S; Munk-Nielsen S.LED spectral and power characteristics under hybrid PWM/AM dimming strategy. IEEE Energy Conversion Congress and Exposition (ECCE 2010), Atlanta, Georgia, USA ,1-10 January 2010; pp.731-735. 10 January. [CrossRef]
- Colaco A M; Kurian C P; Kini S G; Johny C. Thermal characterization of multicolor LED luminaire. Microelectronics Reliability. 2017,78,379-388. [CrossRef]
- Xu D S; Chen X; Zhu X; Zheng L H. Adjustable color temperature adjustable lighting source based on cold and warm white LED. Journal of Optics. 2014,34,226-232.
- Song P C; Wen S S; Chen Y C. Research on Mixing Light Based on RGBW Four Color LED. Journal of Optics. 2015,35,313-321.
- Song P C; Wen S S; S J. Dimming and color adjustment method for three primary color LED based on PWM. Journal of Optics. 2015,35,293-300.
- Wang J; Mou T; Wang J. A quantitative dimming method for LED based on PWM. Optical Engineering. 2012, 8484,1-8.
- Xu X; Chen G;Gao Y. esearch on Four Primary Color LED Hybrid White Light with Brightness Continuous Adjustable under Different Color Temperature. Imaging Science and Photochemistry. 2018, 36,507-513.
- Tian H; Liu J; Zhen H. Dimming Method for R/G/B/WW Light Emitting Diode Based on Four Channels' Pulse Width Modulation. Acta Optica Sinica. 2018, 38, 0423001-0423002.
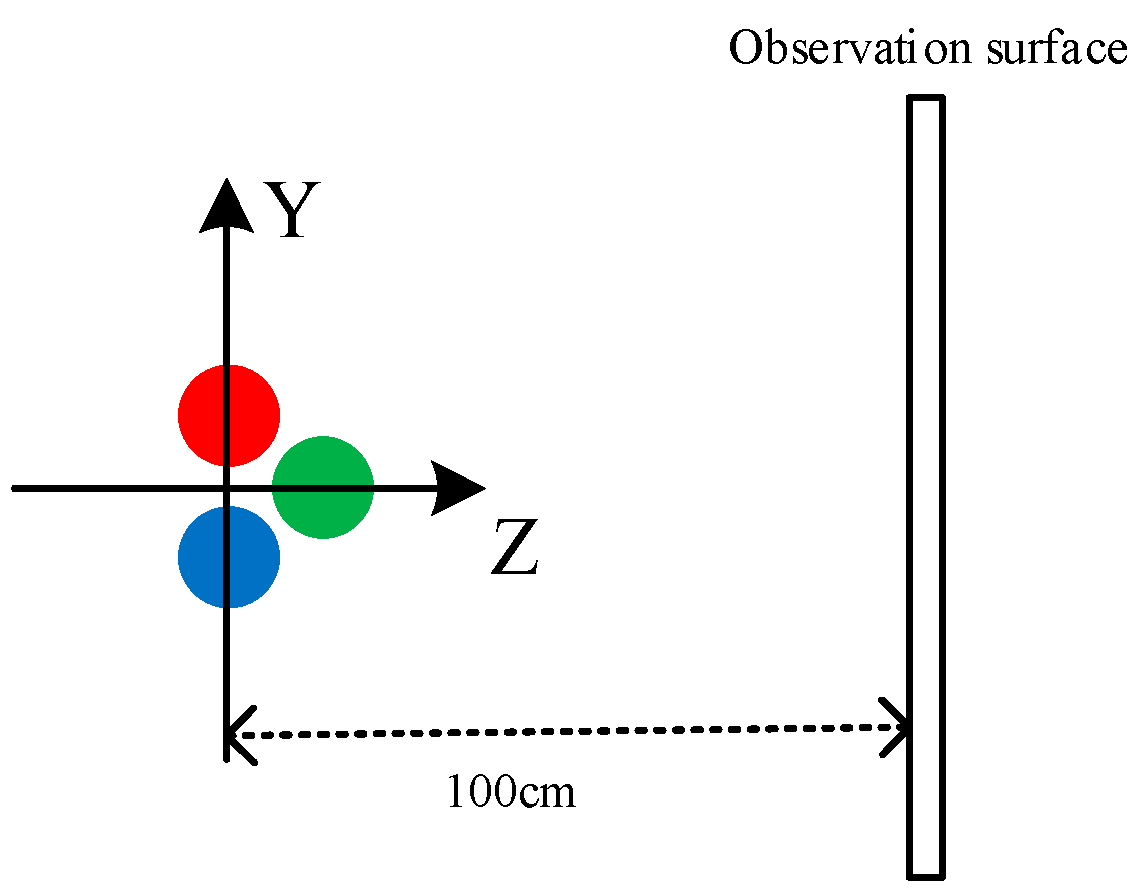
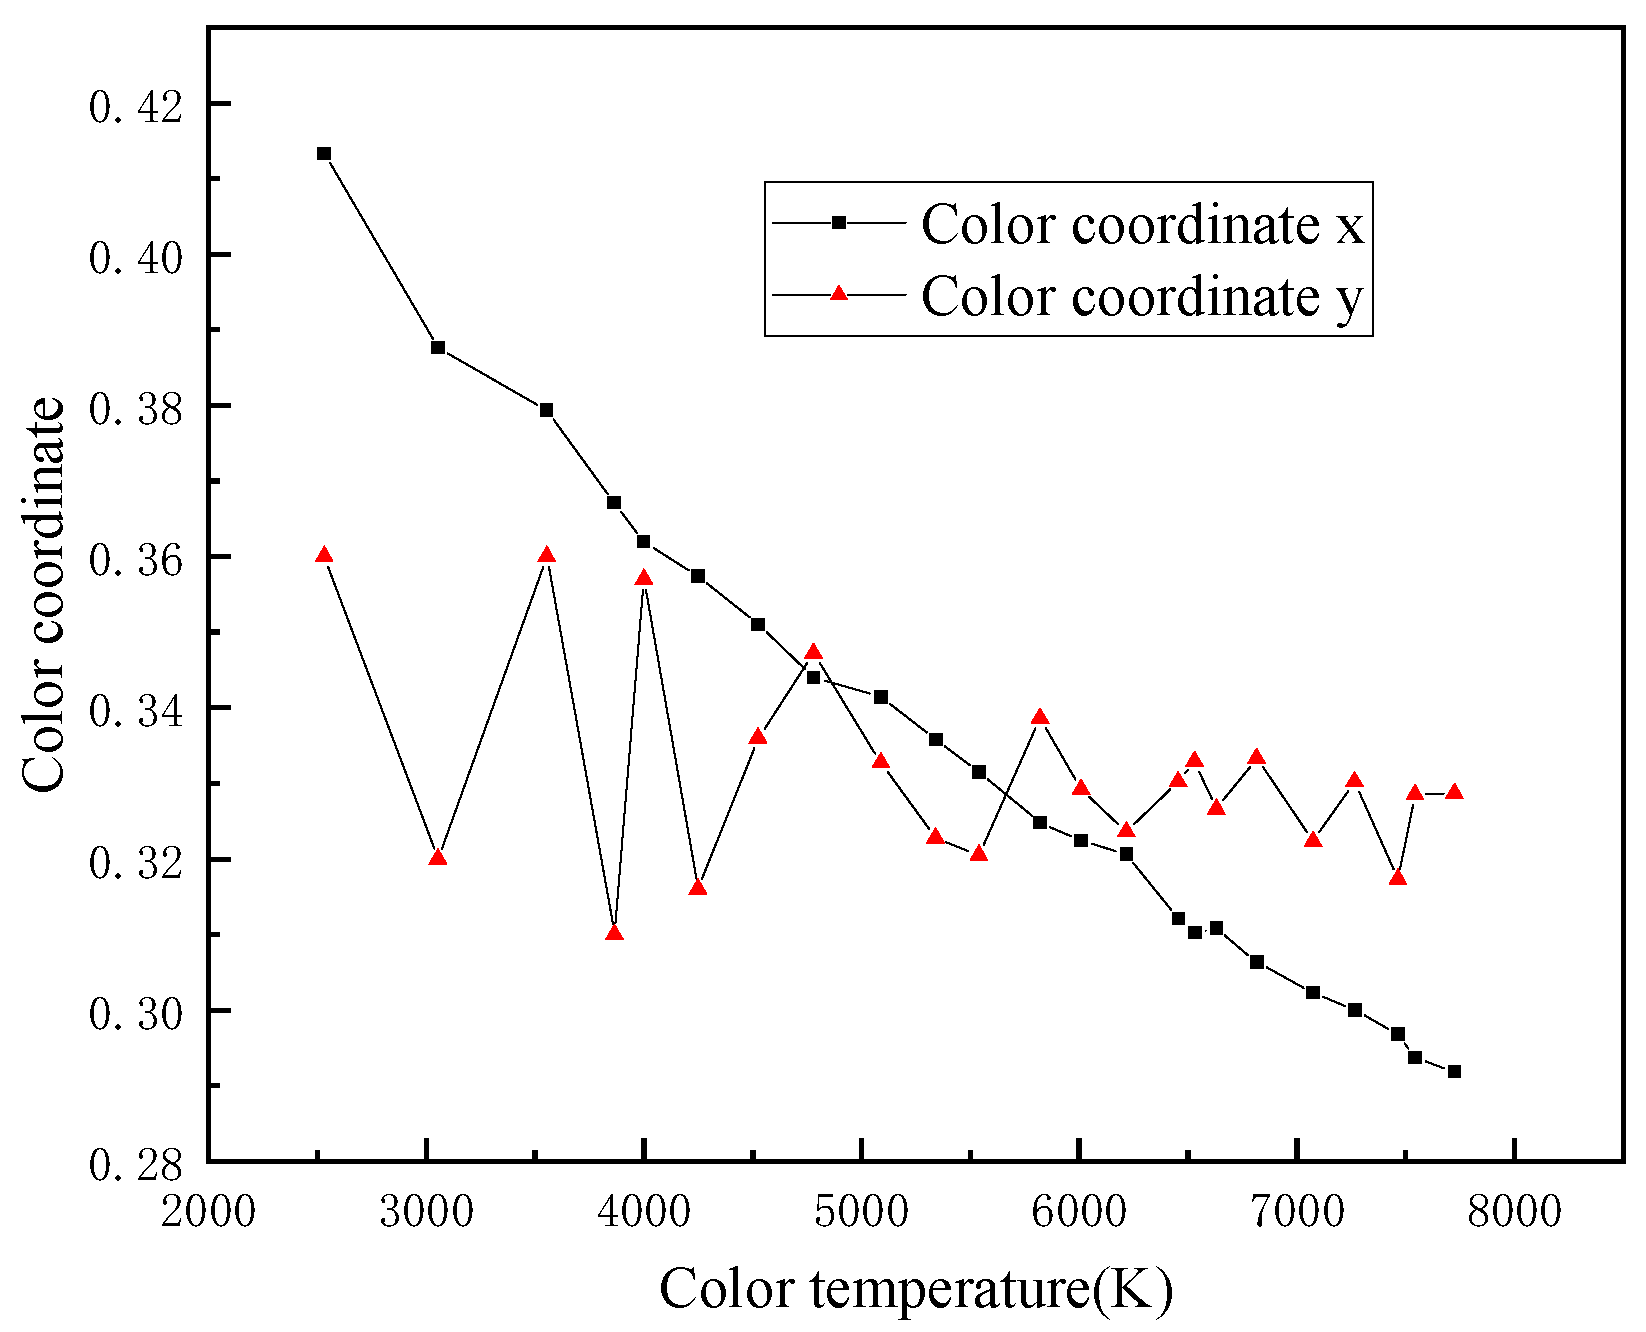

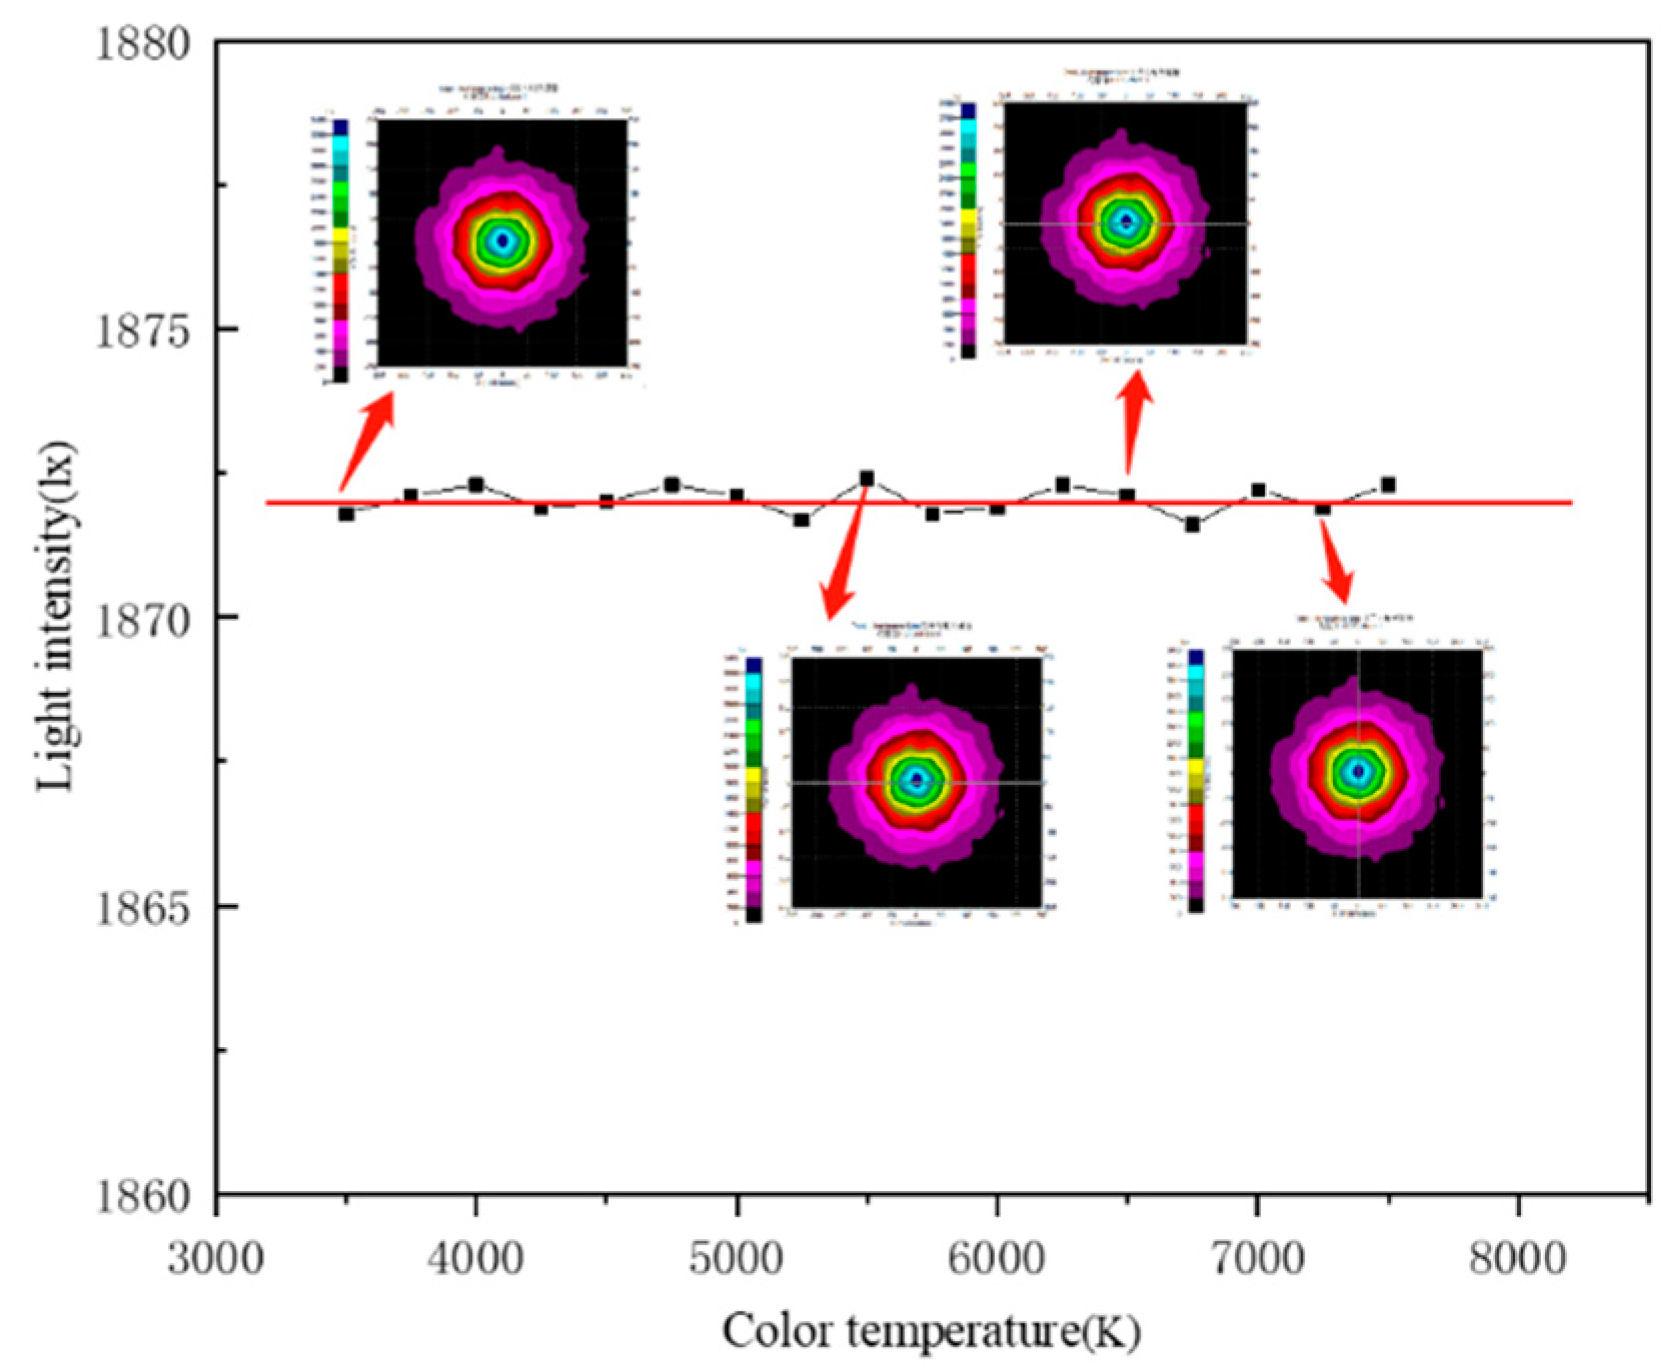
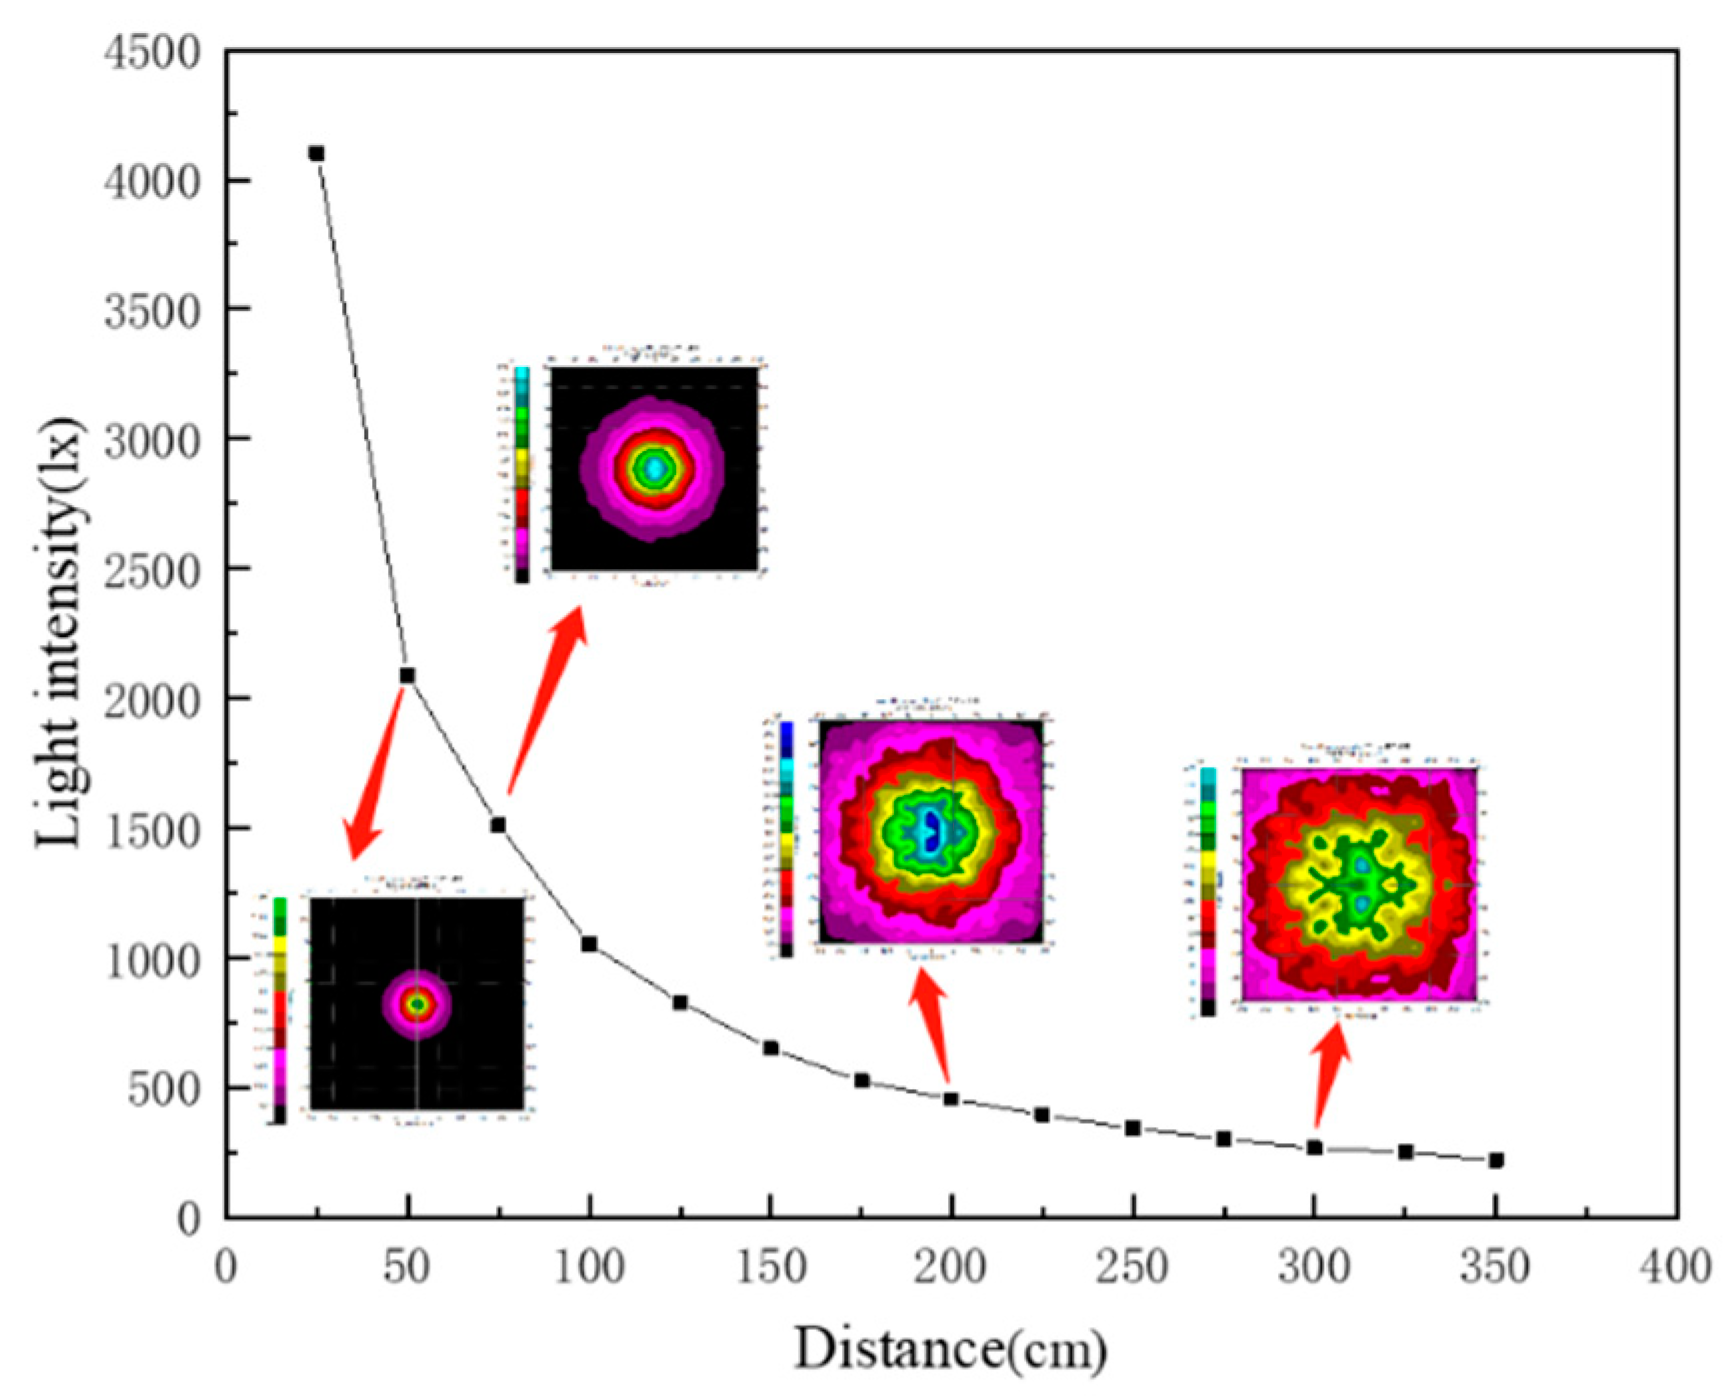
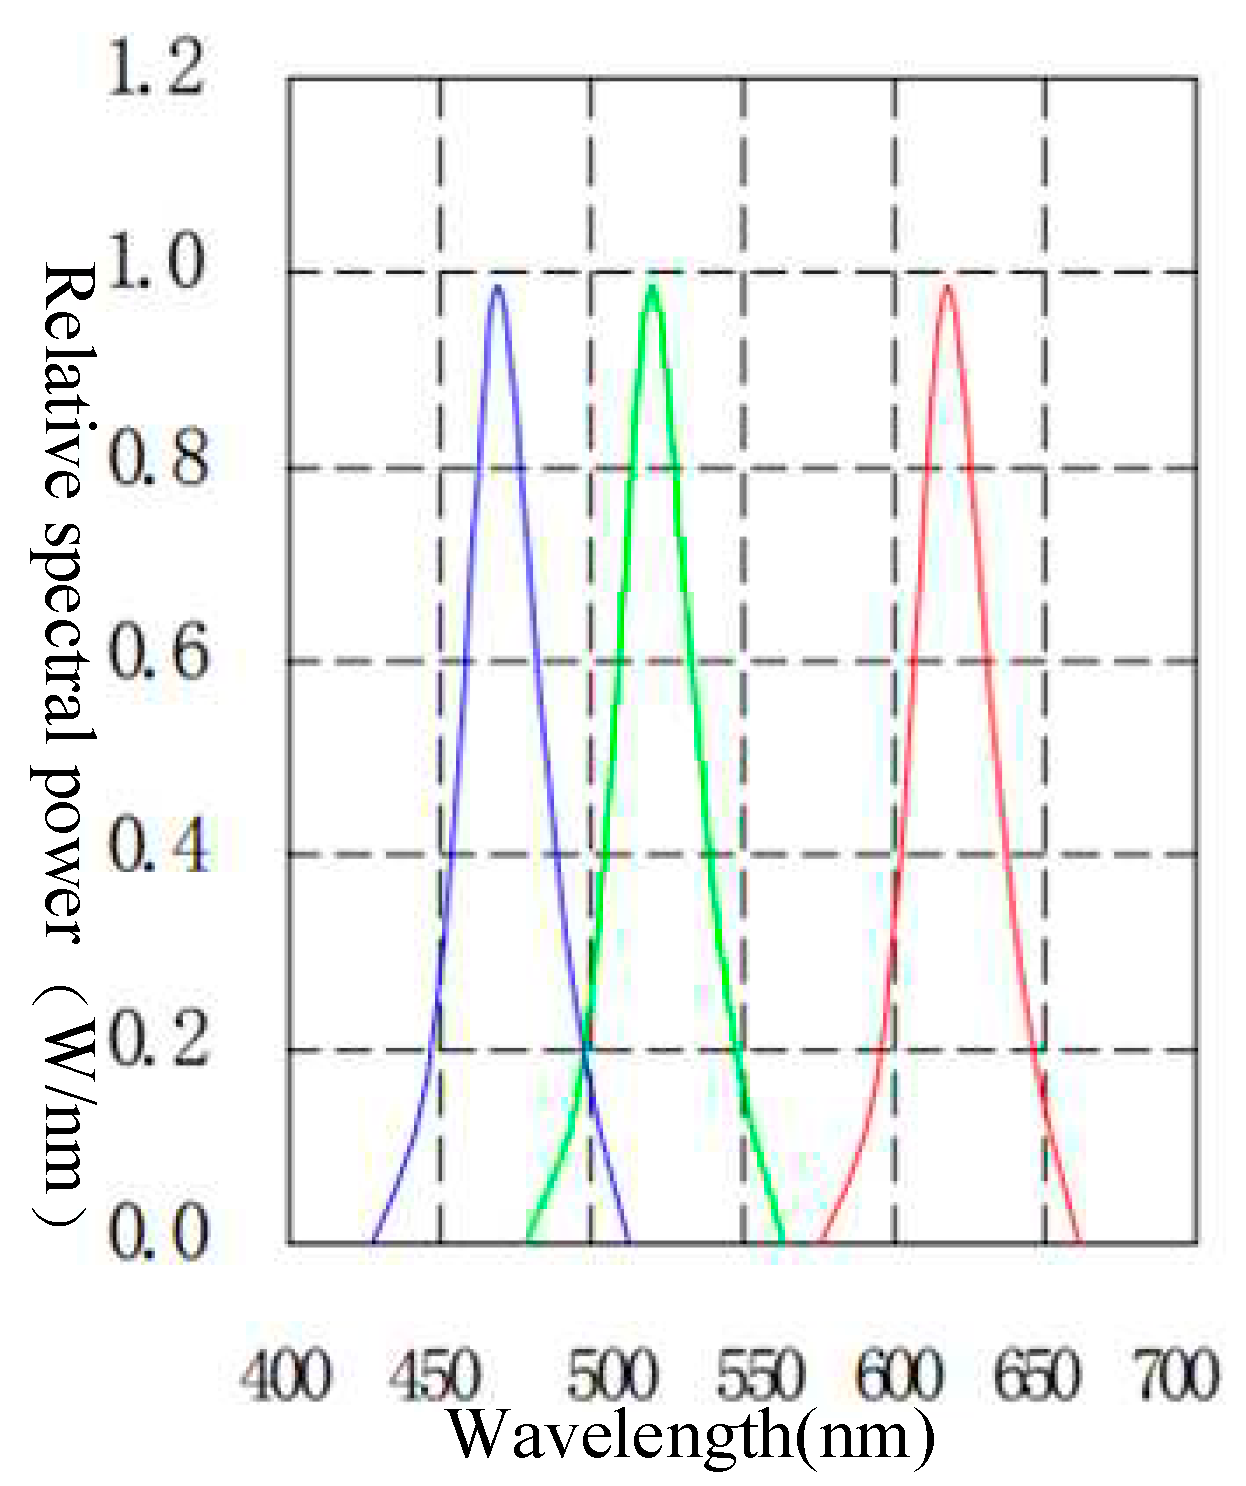
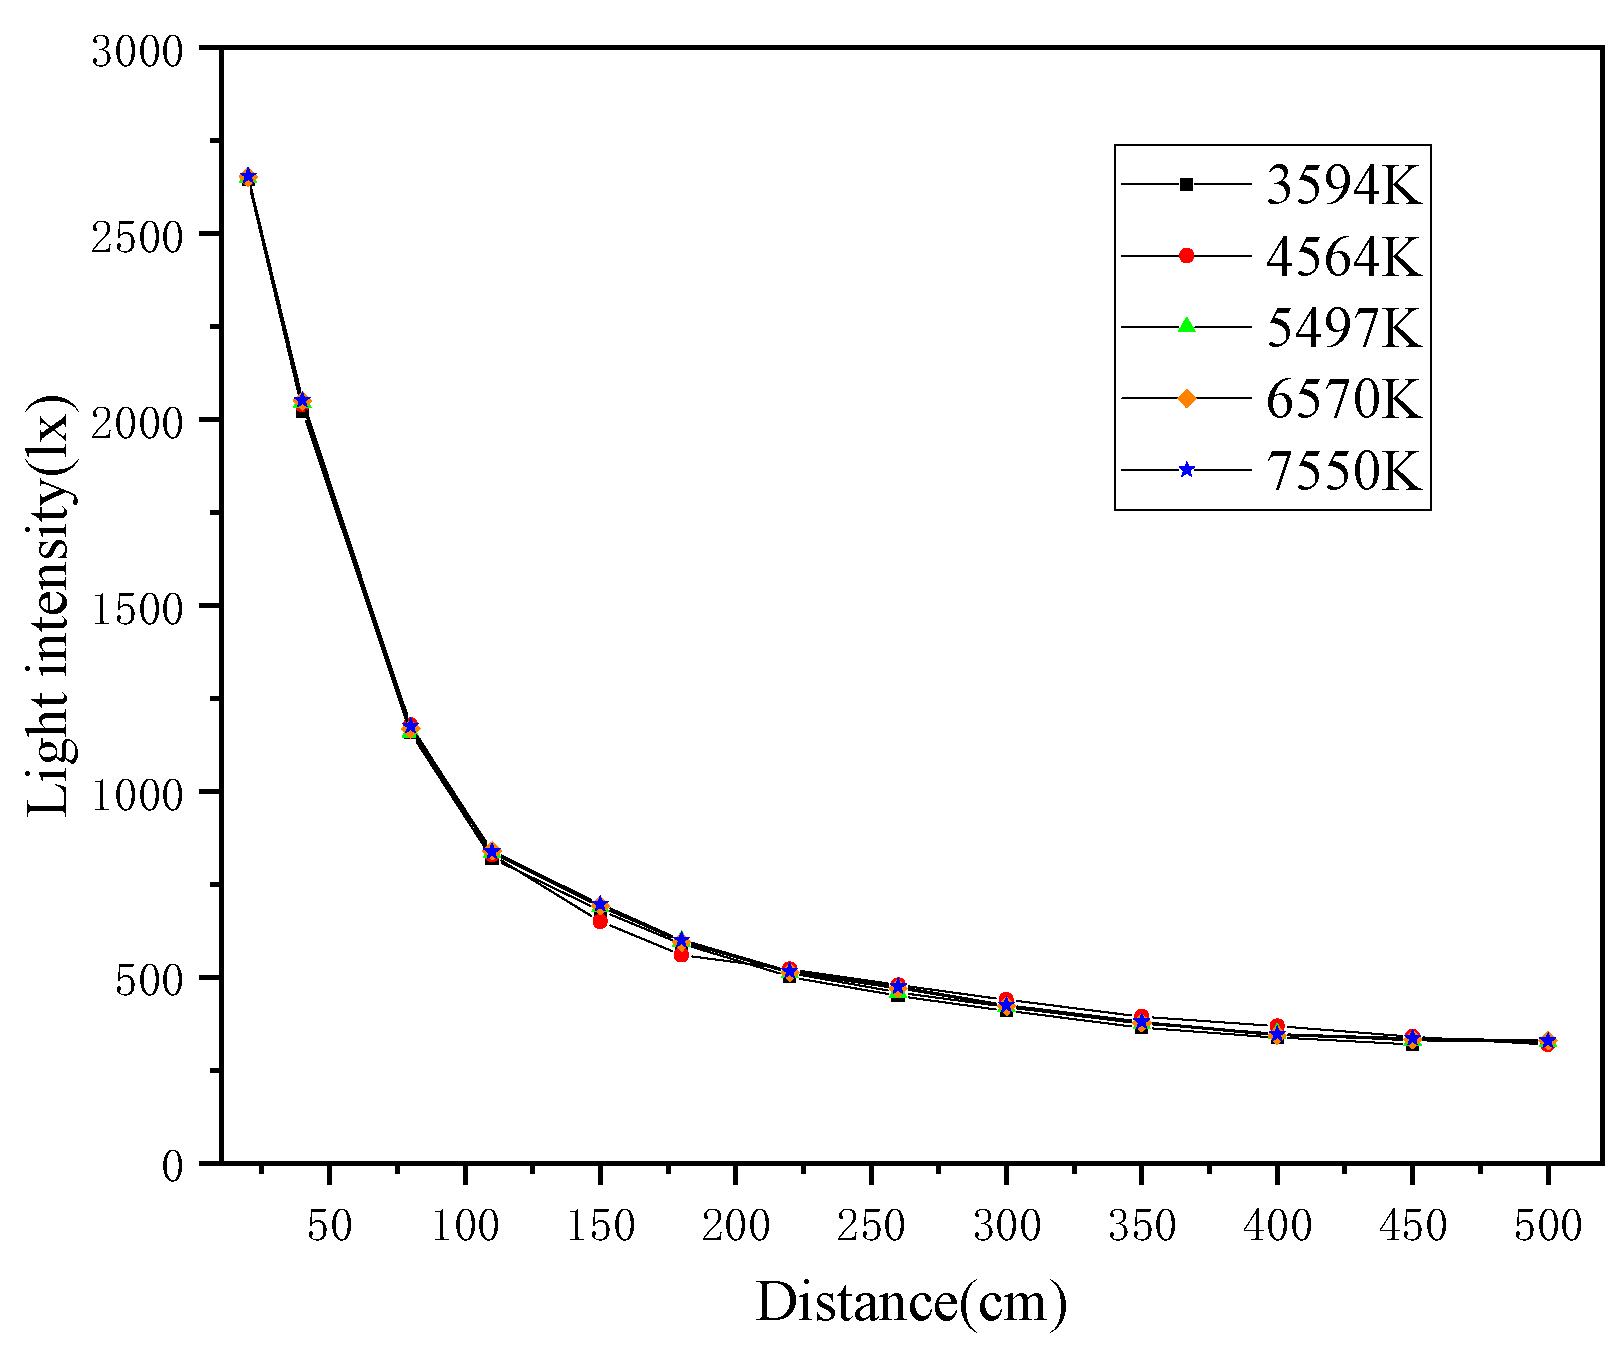
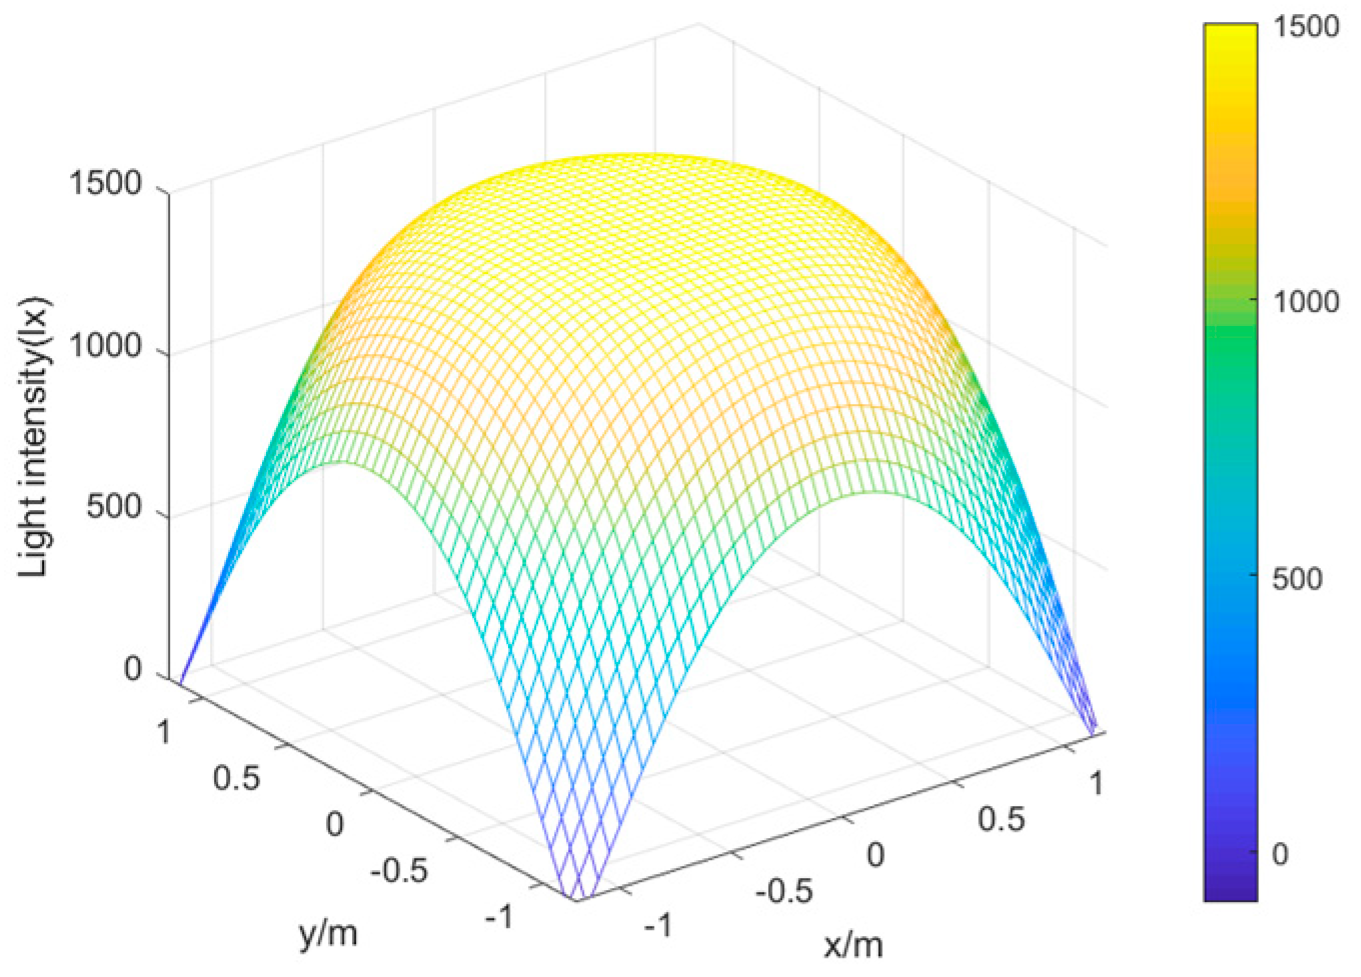


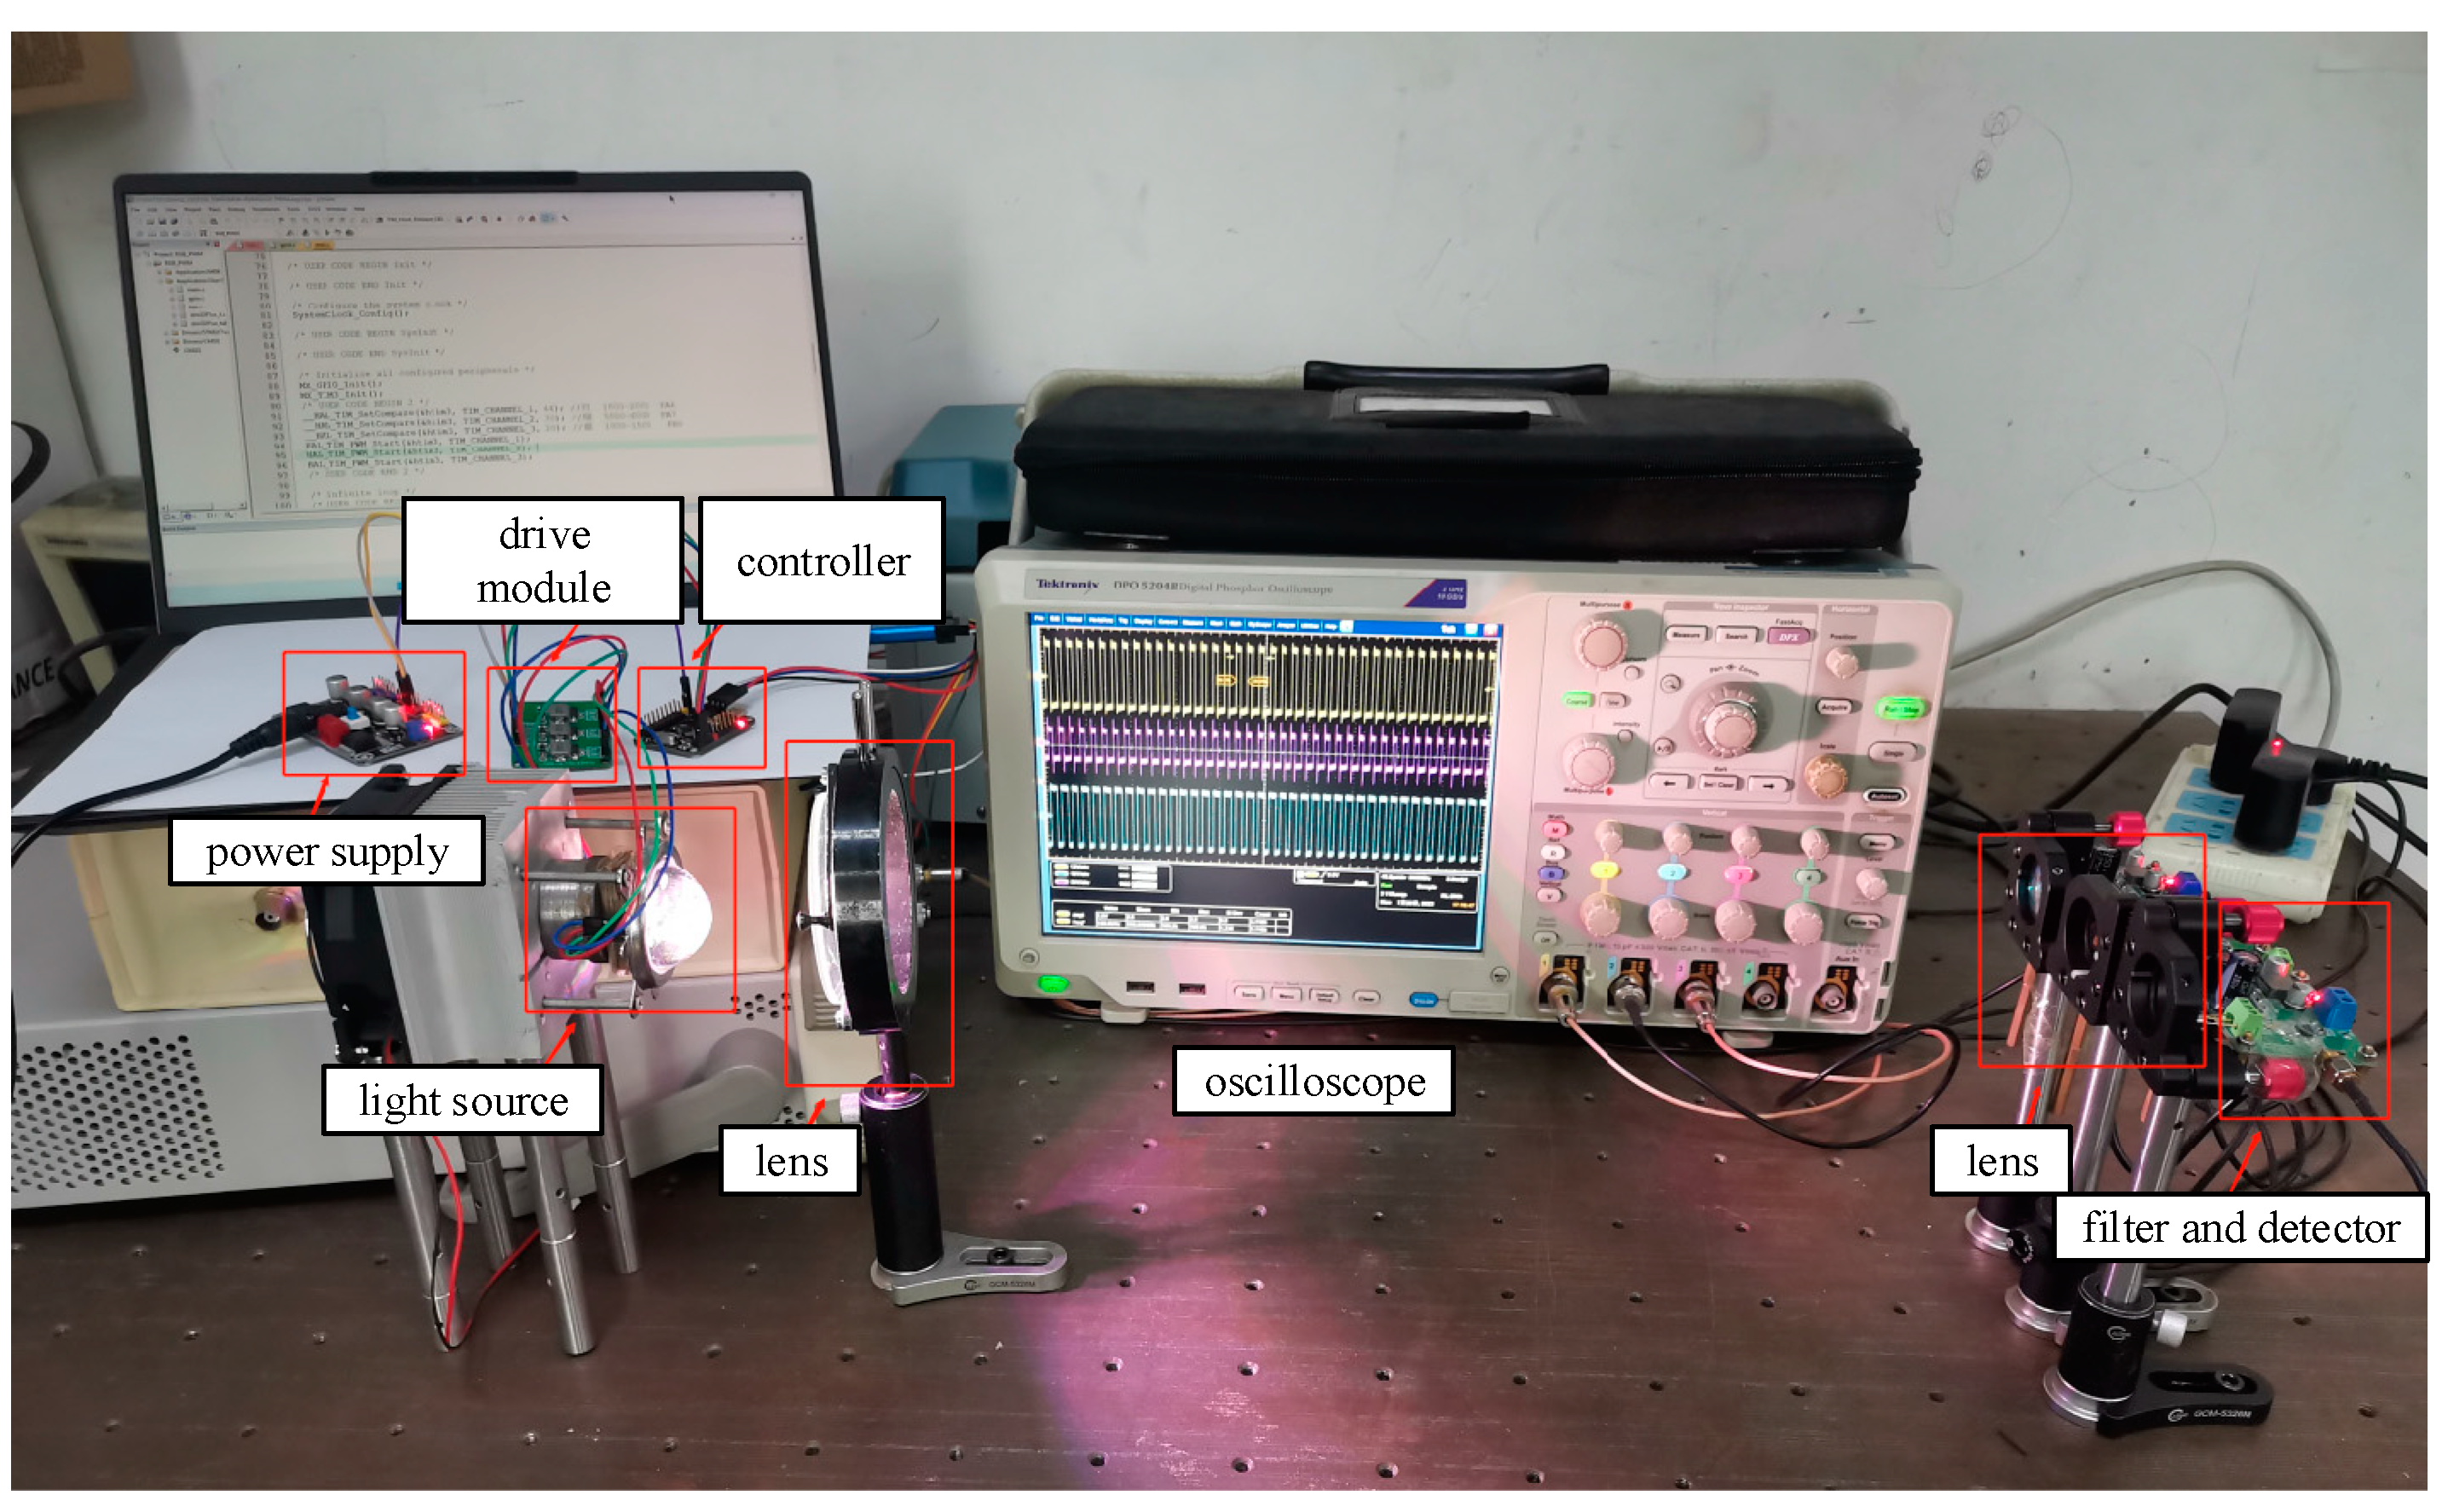
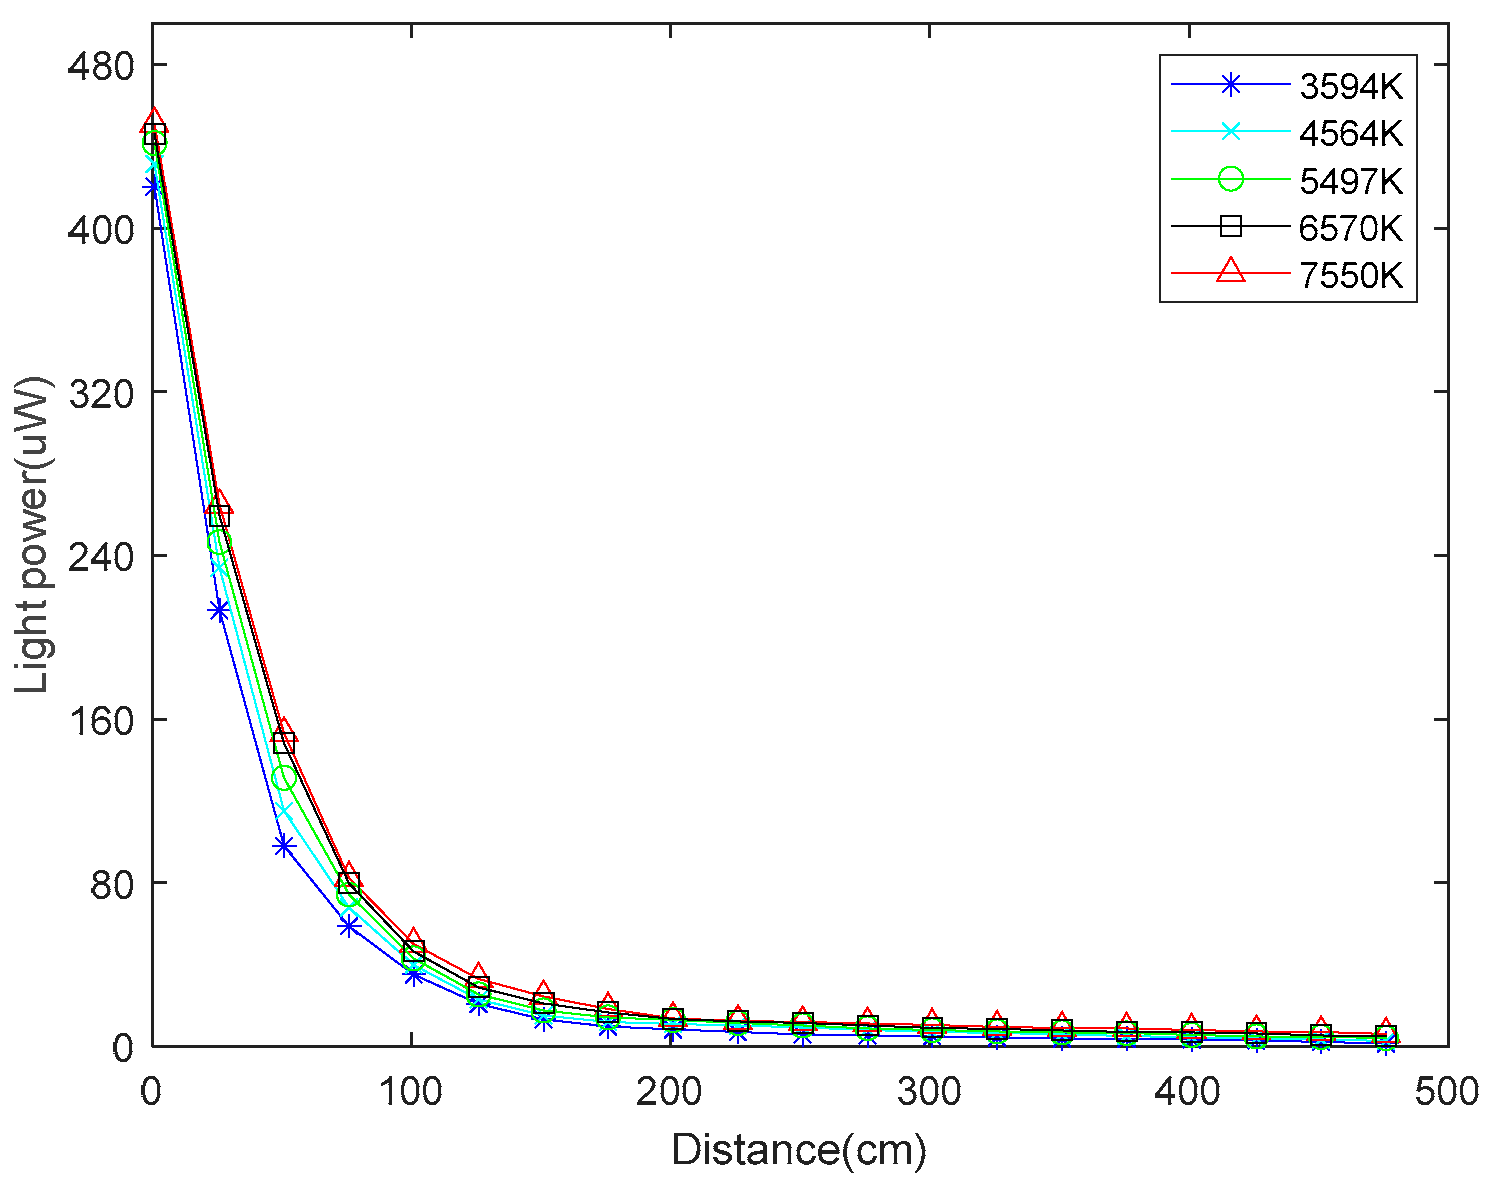
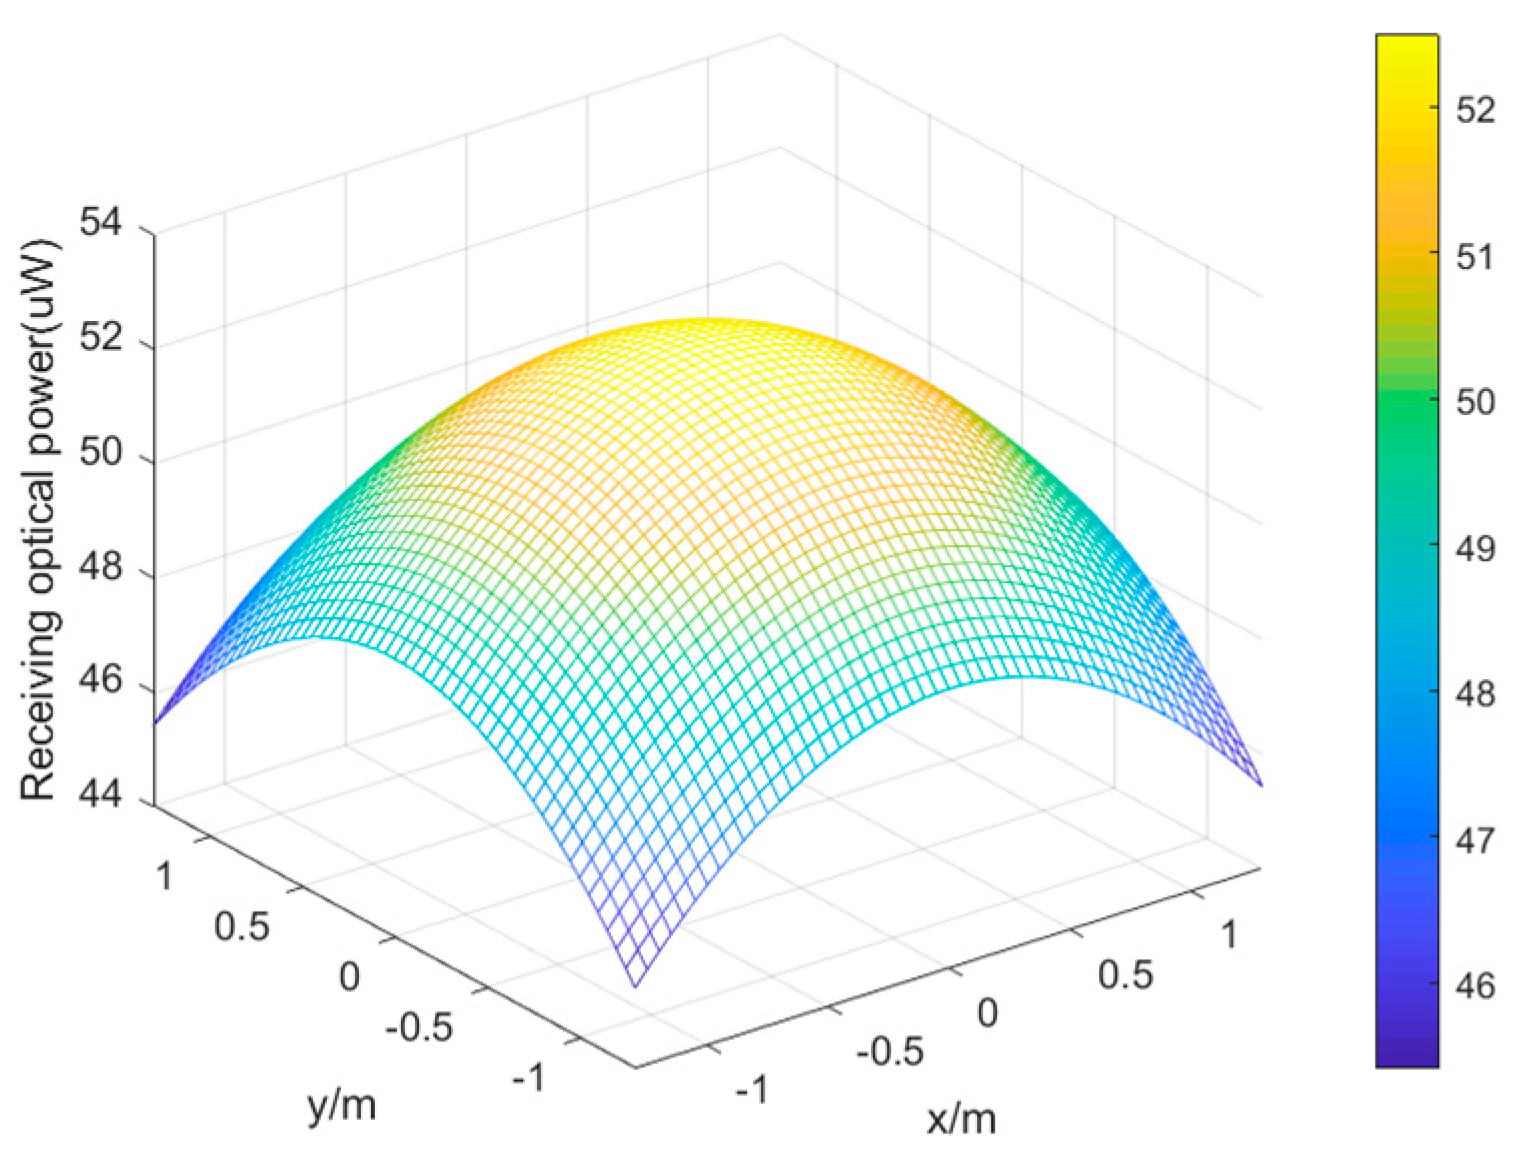
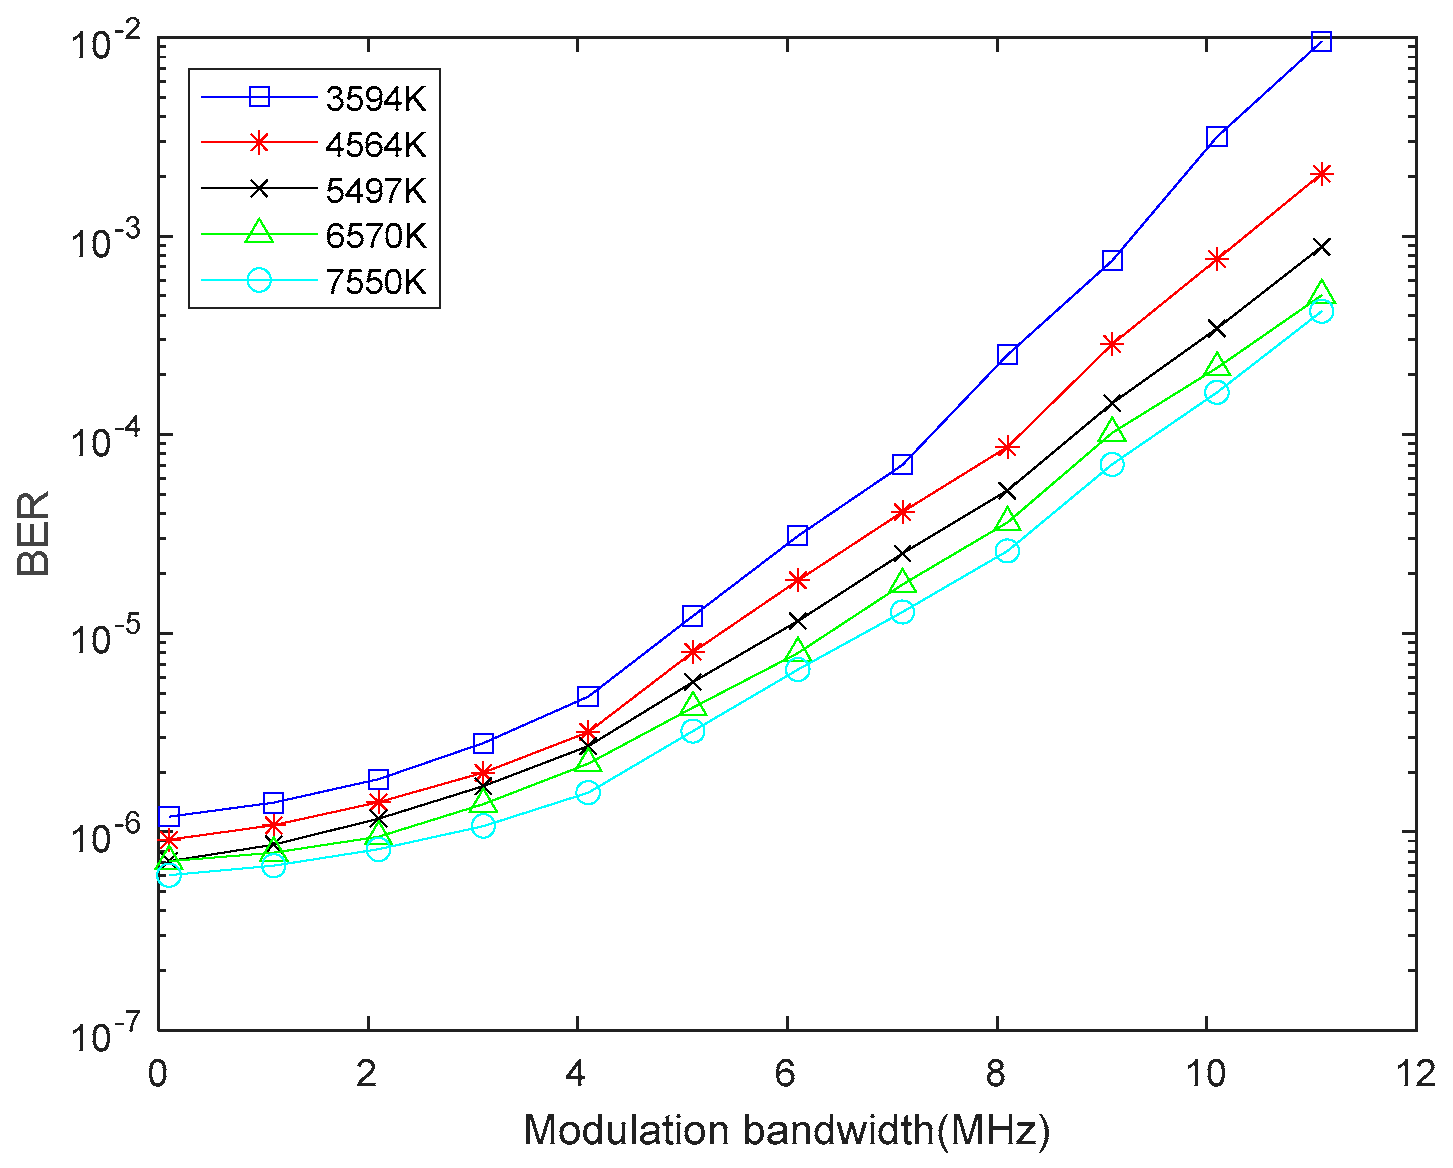
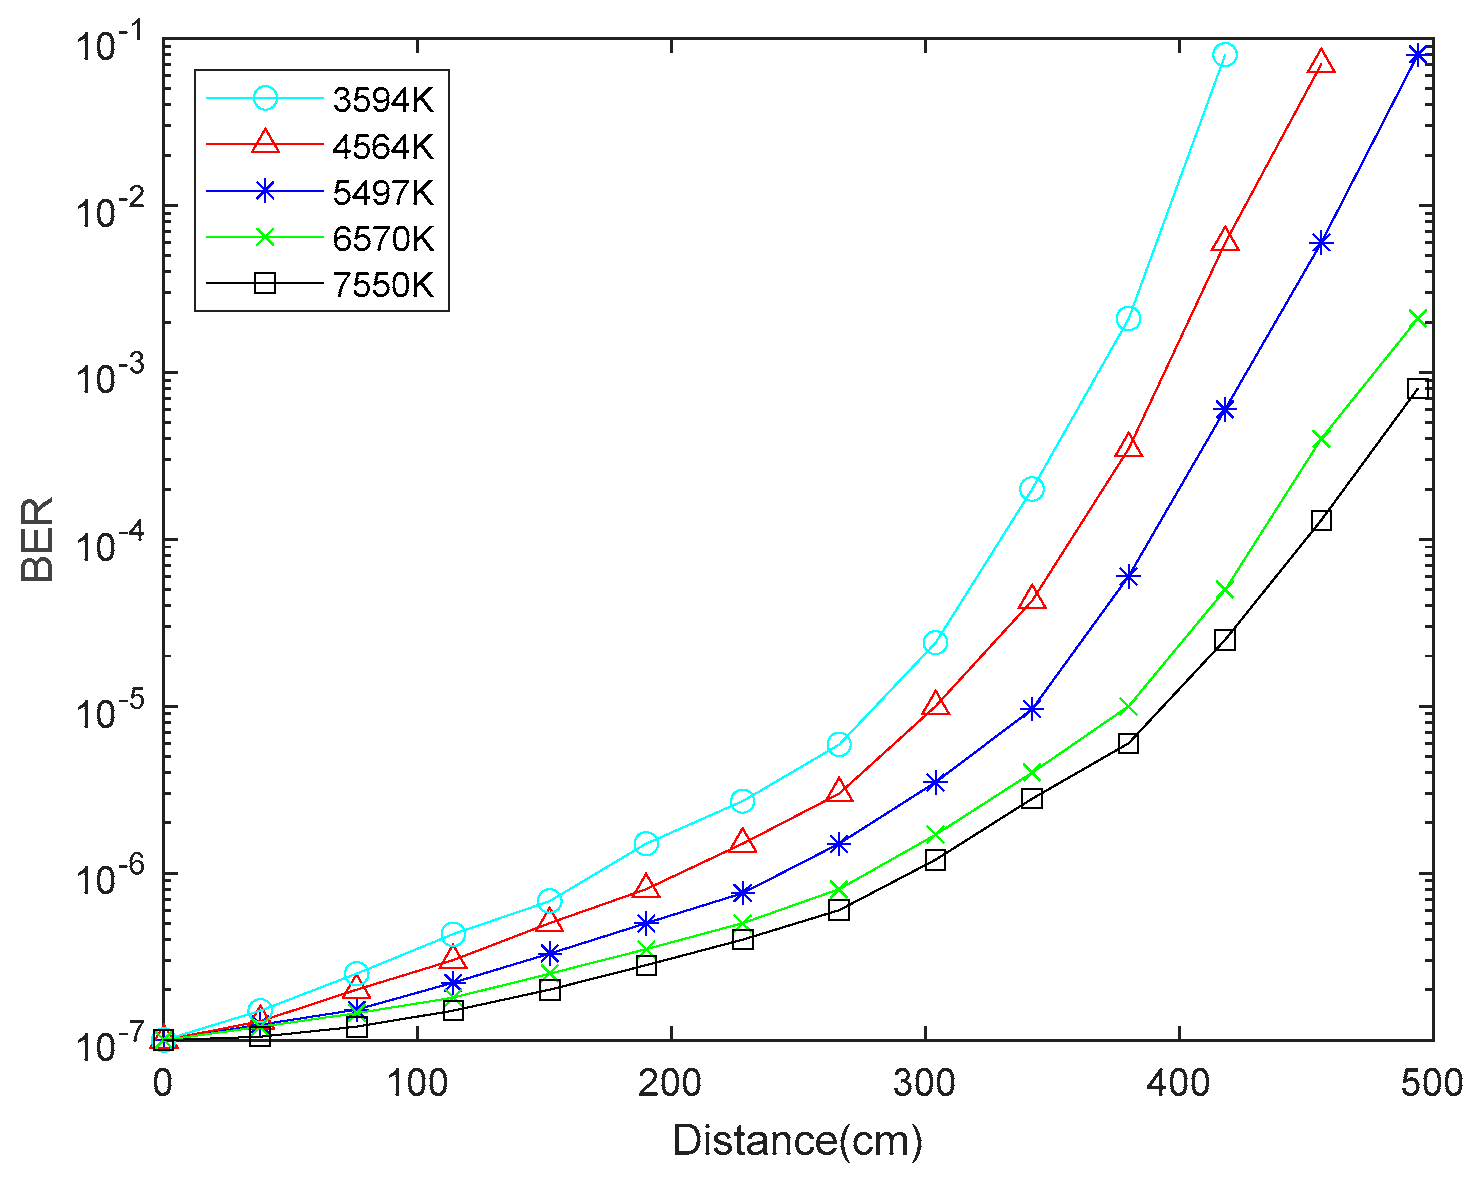
| LED Type | Chromatic coordinates | Peak wavelength (nm) | FWHM (nm) | Luminous in-tensity (cd) | luminous flux (lm) |
|---|---|---|---|---|---|
| Red LED | (0.6894,0.3099) | 630 | 20 | 1.8~2.0 | 67.9 |
| Green LED | (0.1689,0.7232) | 520 | 20 | 5.0~6.0 | 178.1 |
| Blue LED | (0.1434,0.0416) | 460 | 20 | 1.0~1.5 | 29.0 |
| RGB proportion | Measured color temperature(K) | Calculate color temperature(K) | Color temperature difference(K) |
|---|---|---|---|
| 0.557:0.301:0.142 | 2539 | 2500 | 39 |
| 0.502:0.280:0.218 | 3030 | 3000 | 30 |
| 0.476:0.347:0.177 | 3525 | 3500 | 25 |
| 0.439:0.304:0.257 | 4012 | 4000 | 12 |
| 0.417:0.370:0.213 | 4532 | 4500 | 32 |
| 0.405:0.323:0.272 | 5023 | 5000 | 23 |
| 0.382:0.361:0.257 | 5510 | 5500 | 10 |
| 0.364:0.356:0.281 | 6032 | 6000 | 32 |
| 0.347:0.363:0.290 | 6526 | 6500 | 26 |
| 0.336:0.355:0.308 | 7036 | 7000 | 36 |
| 0.313:0.382:0.305 | 7540 | 7500 | 40 |
| 0.302:0.381:0.317 | 8032 | 8000 | 32 |
Disclaimer/Publisher’s Note: The statements, opinions and data contained in all publications are solely those of the individual author(s) and contributor(s) and not of MDPI and/or the editor(s). MDPI and/or the editor(s) disclaim responsibility for any injury to people or property resulting from any ideas, methods, instructions or products referred to in the content. |
© 2023 by the authors. Licensee MDPI, Basel, Switzerland. This article is an open access article distributed under the terms and conditions of the Creative Commons Attribution (CC BY) license (http://creativecommons.org/licenses/by/4.0/).


