2. Materials and Methods
Verification of the accuracy of the 3d MLP-FE ecosystem model in terms of temperature prediction in a stored grain mass during aerated periods
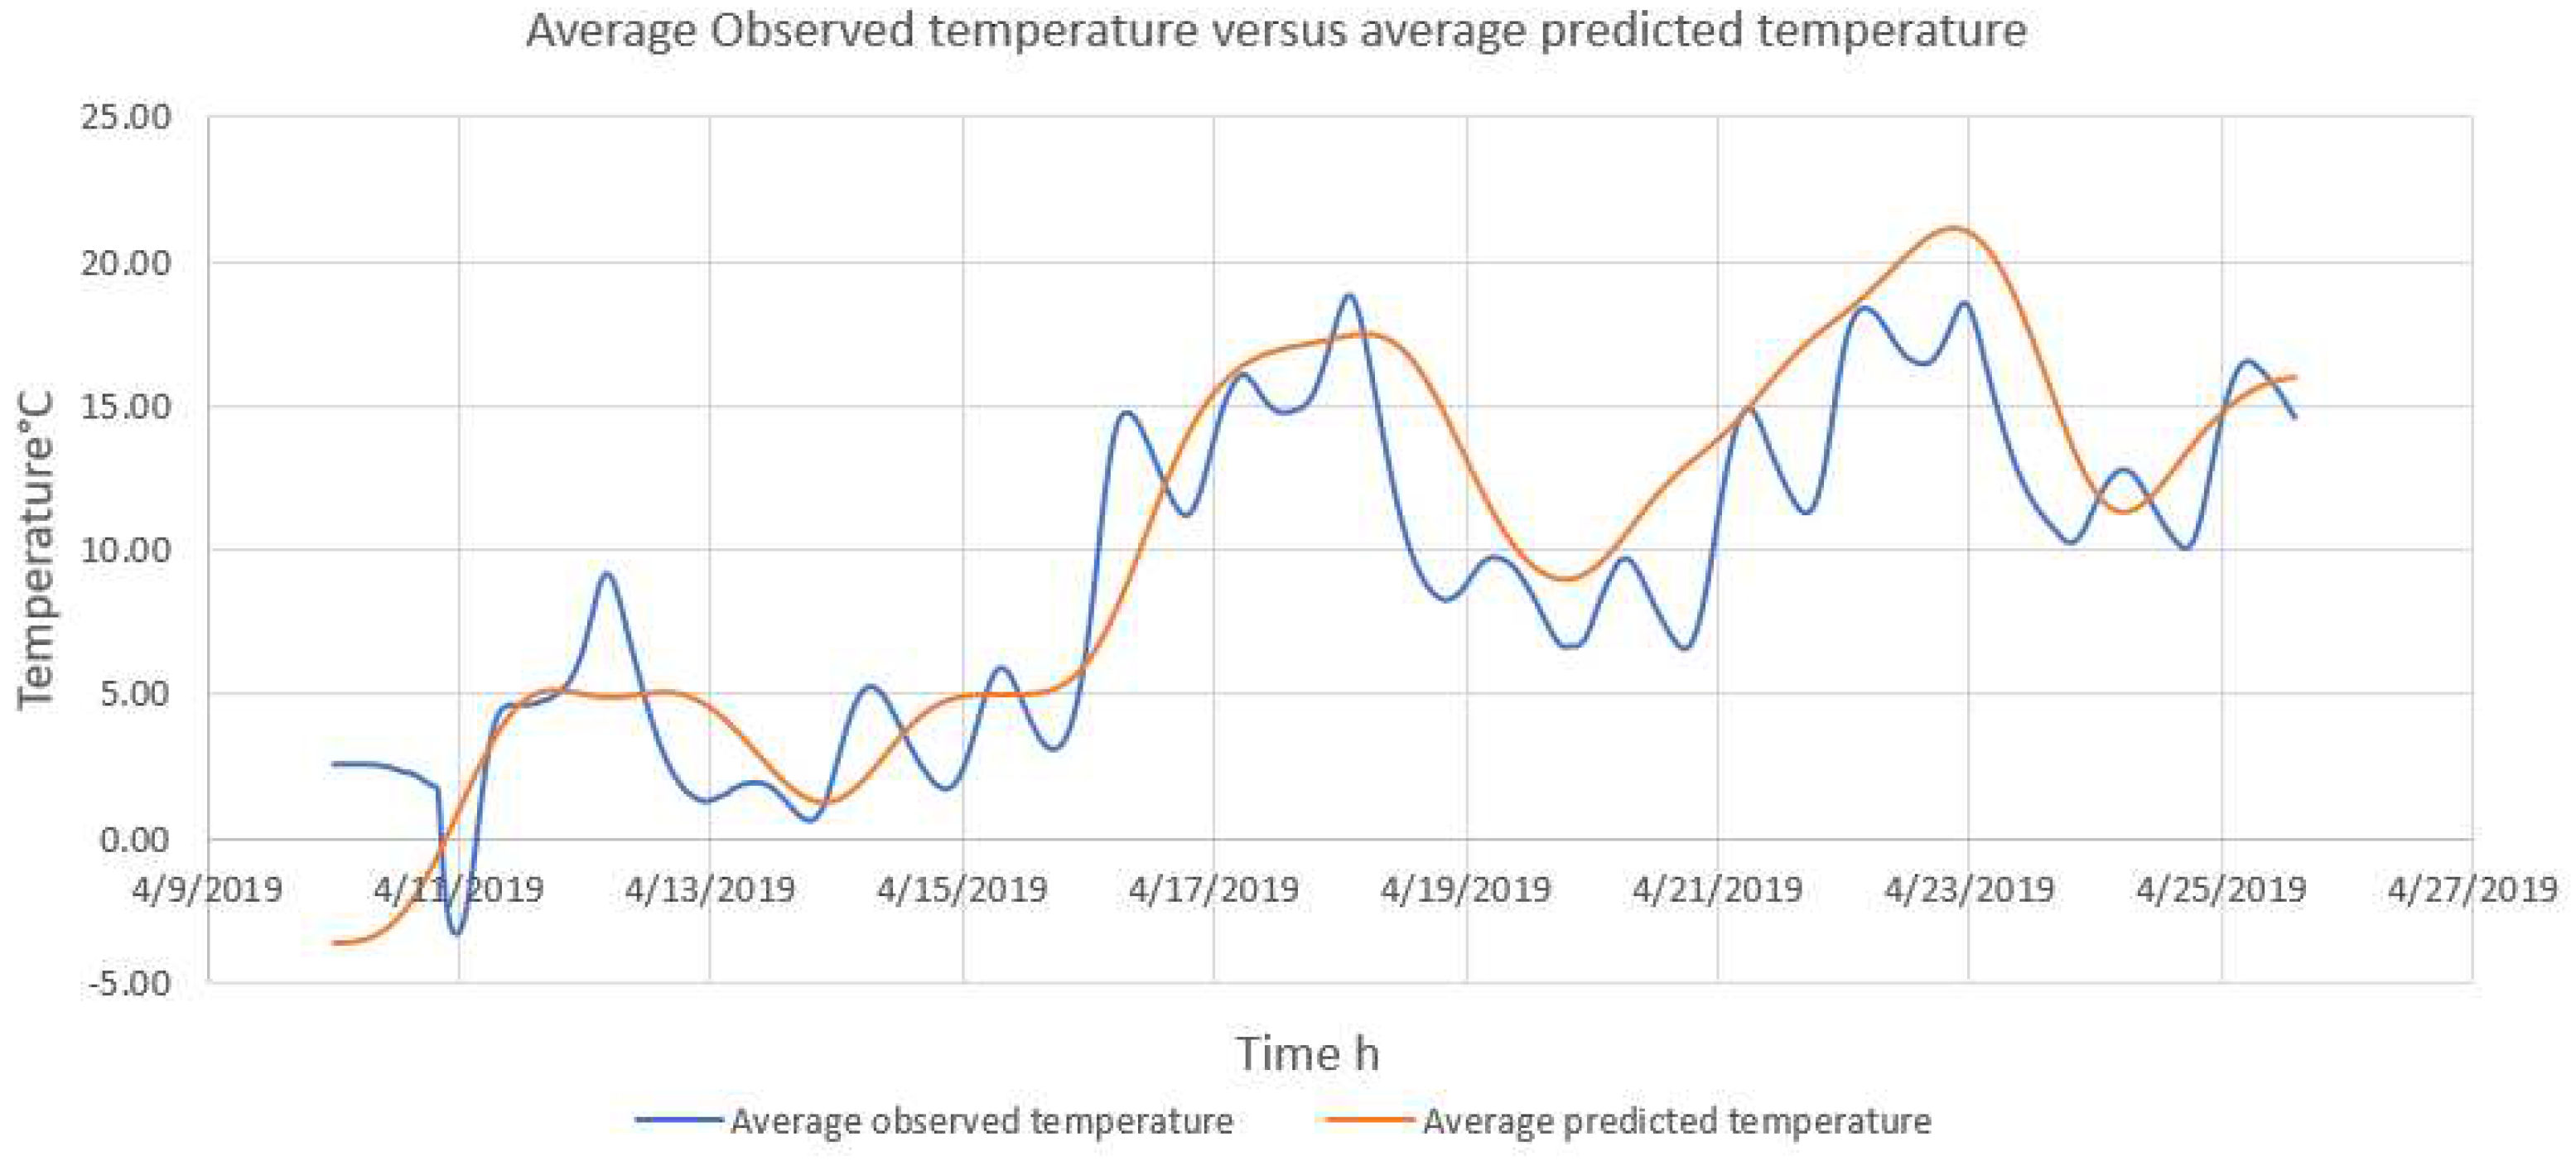
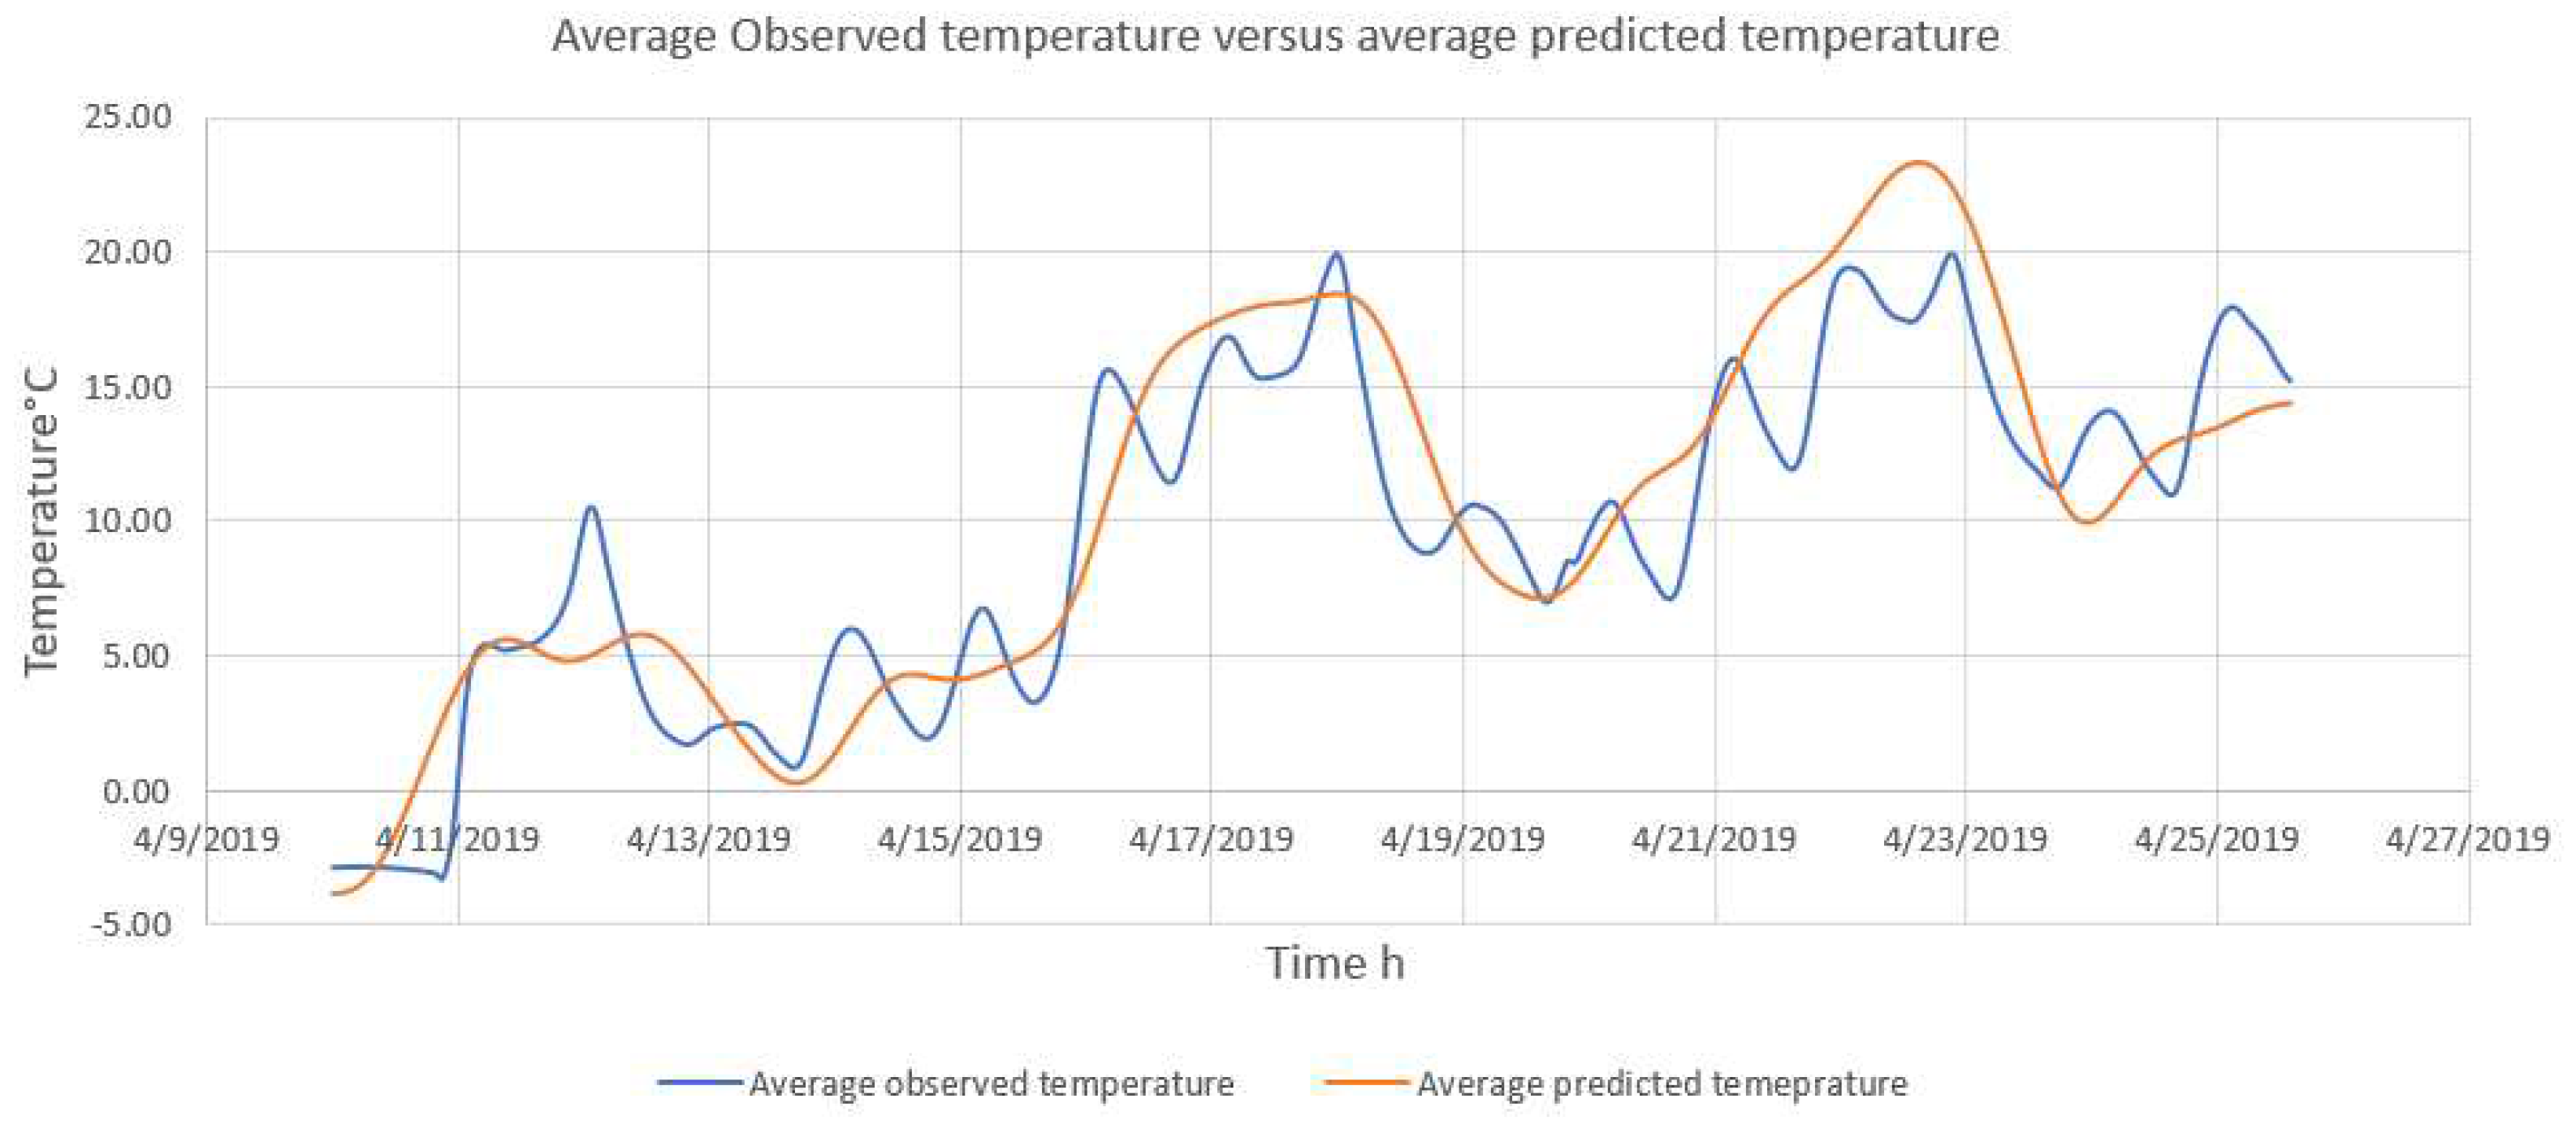
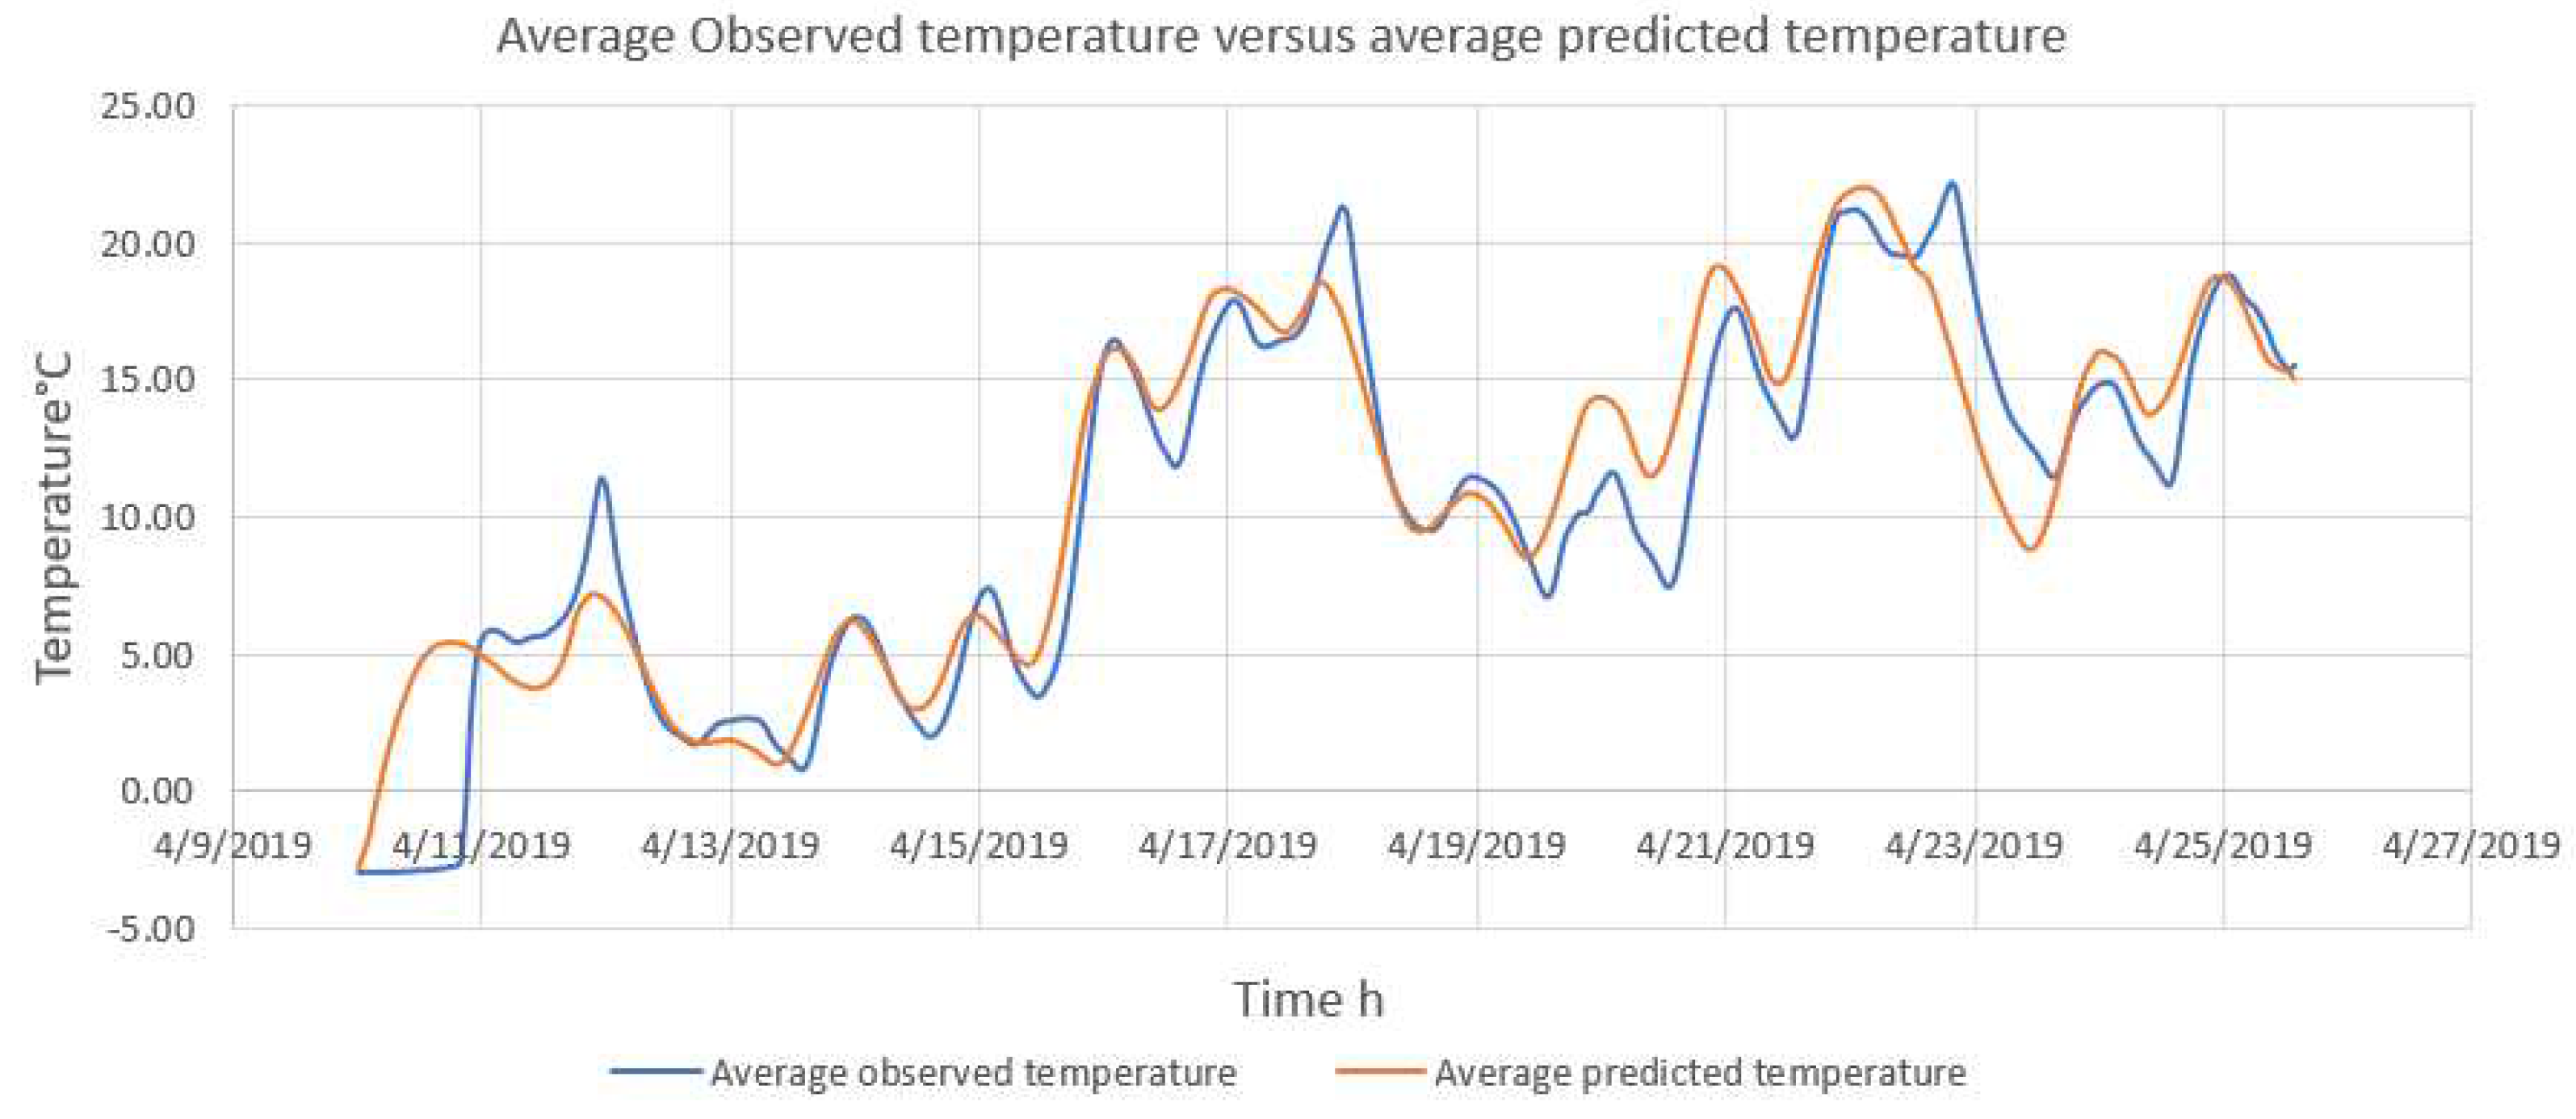
Data collection for verification of the 3D MLP-FE ecosystem model was carried out in a silo filled with about 228.6 Mg (9000 bushels) of maize at the ISU Agricultural Engineering and Agronomy Research Farm on November 1, 2018, for long-term storage into the summer of 2019. Six cables equipped with temperature and RH sensors were installed, probed, and left in the grain mass after in-bin stir-drying had been completed. The custom-made cables had digital thermistor and RH sensors installed every 1.2 m (4 ft) that measure temperature and RH of the interstitial air inside the grain mass. The monitoring system collected data hourly, sent data to a gateway, and from there via cellphone modem to a cloud-based server. A total of 18 cable sensors were located in the grain mass at three grain depths (1.3, 2.5, and 3.7 m) with 6 sensors per layer, respectively. The vertical and horizontal locations of the sensors were determined and recorded. The drying fan was turned on April 10, 2019, and operated continuously until April 25, 2019. The airflow rate through the grain mass was determined based on measuring a static pressure drop in the plenum of 30 cm (2.7 inches) of water and the known performance curve of the fan, i.e., 1.4 m3/min/Mg (1.4 cfm/bu). This resulted in a calculated air velocity of 0.215 m/s through the stored maize assuming 40% porosity in the grain mass.
The simulation model requires a total of seven input files. One of these is the mesh which depicts the grain mass inside the silo to be modeled (
Figure 1). The silo specifications enclosing the grain mass of 4.87 m diameter and 4.30 m grain depth were used to create a mesh of elements for a level stored grain mass using the Abaqus software which resulted in 1062 nodes and 785 elements. Hourly weather data from April 10 to April 25, 2019 consisting of hourly solar radiation, temperature, RH, and wind speed was downloaded from the Iowa State University Mesonet system (
https://mesonet.agron.iastate.edu), representing the aerated grain storage period in Ames, Iowa, USA. The 18 nodes out of 1062 nodes that matched the location of the 18 cable-based sensors were used to verify the observed versus predicted temperature results of the 3D MLP-FE model by statistical means (i.e., the temperature of the output of the 18 nodes versus the temperatures recorded by the 18 cable-based sensors) from April 10 to April 25, 2019.
The most common method of model verification is to quantify the error, or difference, between measured and predicted values by calculating the standard error of prediction [
9,
10]. In this study, the standard error of prediction was used to verify the previously developed 3D stored grain ecosystem model, i.e., the standard error of the estimate (SE) between each pair of predicted values (node outputs) and observed values (cable-based temperature values) was calculated and evaluated (Eq .1). The standard error of the estimate gives a measure of the accuracy of predictions (i.e., the mean standard deviation between the observed and predicted values).
where
Application of the 3d MLP-FE ecosystem model to determine the number of wireless sensors needed to achieve reliable aeration cooling and monitoring stored grain quality
To determine the number of sensors needed to achieve sufficient reliability for stored grain quality monitoring based on predicted temperatures, three different silo dimensions were evaluated. The silo sizes were 11 m in diameter by 11 m eave height (and level grain depth), 14.6 m in diameter and 14.6 m eave height (and level grain depth), and 14.6 m in diameter and 18.3 m eave height (and level grain depth). The three silo specifications were used to create three mesh sets of elements (1968, 3052 and 3204 nodes) for 3D simulation of a cylindrical stored grain mass using the Abaqus software. For each silo dimension, a set of 30 nodes was initially used to simulate the placement of cable-based or wireless temperature sensors to monitor the grain mass, and then the number of nodes/sensors was decreased by half (i.e., 15). The placement of the nodes/sensors within the grain mass were adapted based on the configurations of a commercial temperature and moisture cable supplier, i.e., OPI Blue Advanced Grain Storage Management (Calgary, Canada) for the silo sizes investigated.
For the first silo with a capacity of 745 Mg (29,315 bushels), the recommendation is to place three temperature cables evenly spaced radially and 2/3 of the distance between the center and the wall of the silo (7.3 m from the center) with sensors spaced 1.83 m vertically on each cable. For the simulated silo, the same pattern for three temperature cables was followed. However, the spacing between nodes on each cable was reduced to about 1 m in the case of 30 nodes and increased to about 2 m in the case of 15 nodes. The bottom node of each cable was 0 m above the perforated plenum floor, and the top node of each cable was 0.01 m below the grain surface for 30 nodes and 2.4 m for 15 nodes.
For the second silo with a capacity of 1765 Mg (69,487 bushels), the manufacturer recommendation is to place six temperature cables in the grain mass with five cables evenly spaced radially and 2/3 of the distance between the center and the wall of the silo (i.e., 9.7 m from the center) plus one cable in the center. For the simulated silo, the same pattern for six temperature cables was followed. However, the spacing between nodes on each cable was increased to about 2.3 m in the case of 30 nodes and about 4.5 m in the case of 15 nodes. The locations of the bottom and top nodes were respectively 0 m above the perforated floor and 0.1 m below the grain mass surface.
For the third silo with a capacity of 2206 Mg (86,589 bushels), the recommendation is the same as for the second silo given the same diameter. Given the greater depth, the spacing between nodes on each cable was increased to about 3.2 m in the case of 30 nodes and about 6.5 m in the case of 15 nodes. The locations of the bottom and top nodes were respectively 0 m above the perforated floor and 0 m below the grain mass surface.
To determine whether 15 or 30 nodes are sufficient to monitor grain temperatures during aerated versus non-aerated storage, the average grain temperatures were calculated based on 15 and 30 nodes during the two distinct periods and then compared to the respective average grain temperatures calculated based on the total number of mesh nodes of each silo size simulated for both periods. A difference of 5°C or less between the average temperatures (i.e., 15 versus 30 nodes, or 15 versus total nodes, or 30 versus total nodes) was considered sufficiently reliable to make grain quality management decisions based on monitoring stored grain temperatures during the critical fall harvest cool-down period, or the non-aerated storage period.
Figure 1.
Discretized grain mass within the silo domain (mesh) used to verify the grain temperature predictions by the 3D MLP-FE simulation model.
Figure 1.
Discretized grain mass within the silo domain (mesh) used to verify the grain temperature predictions by the 3D MLP-FE simulation model.
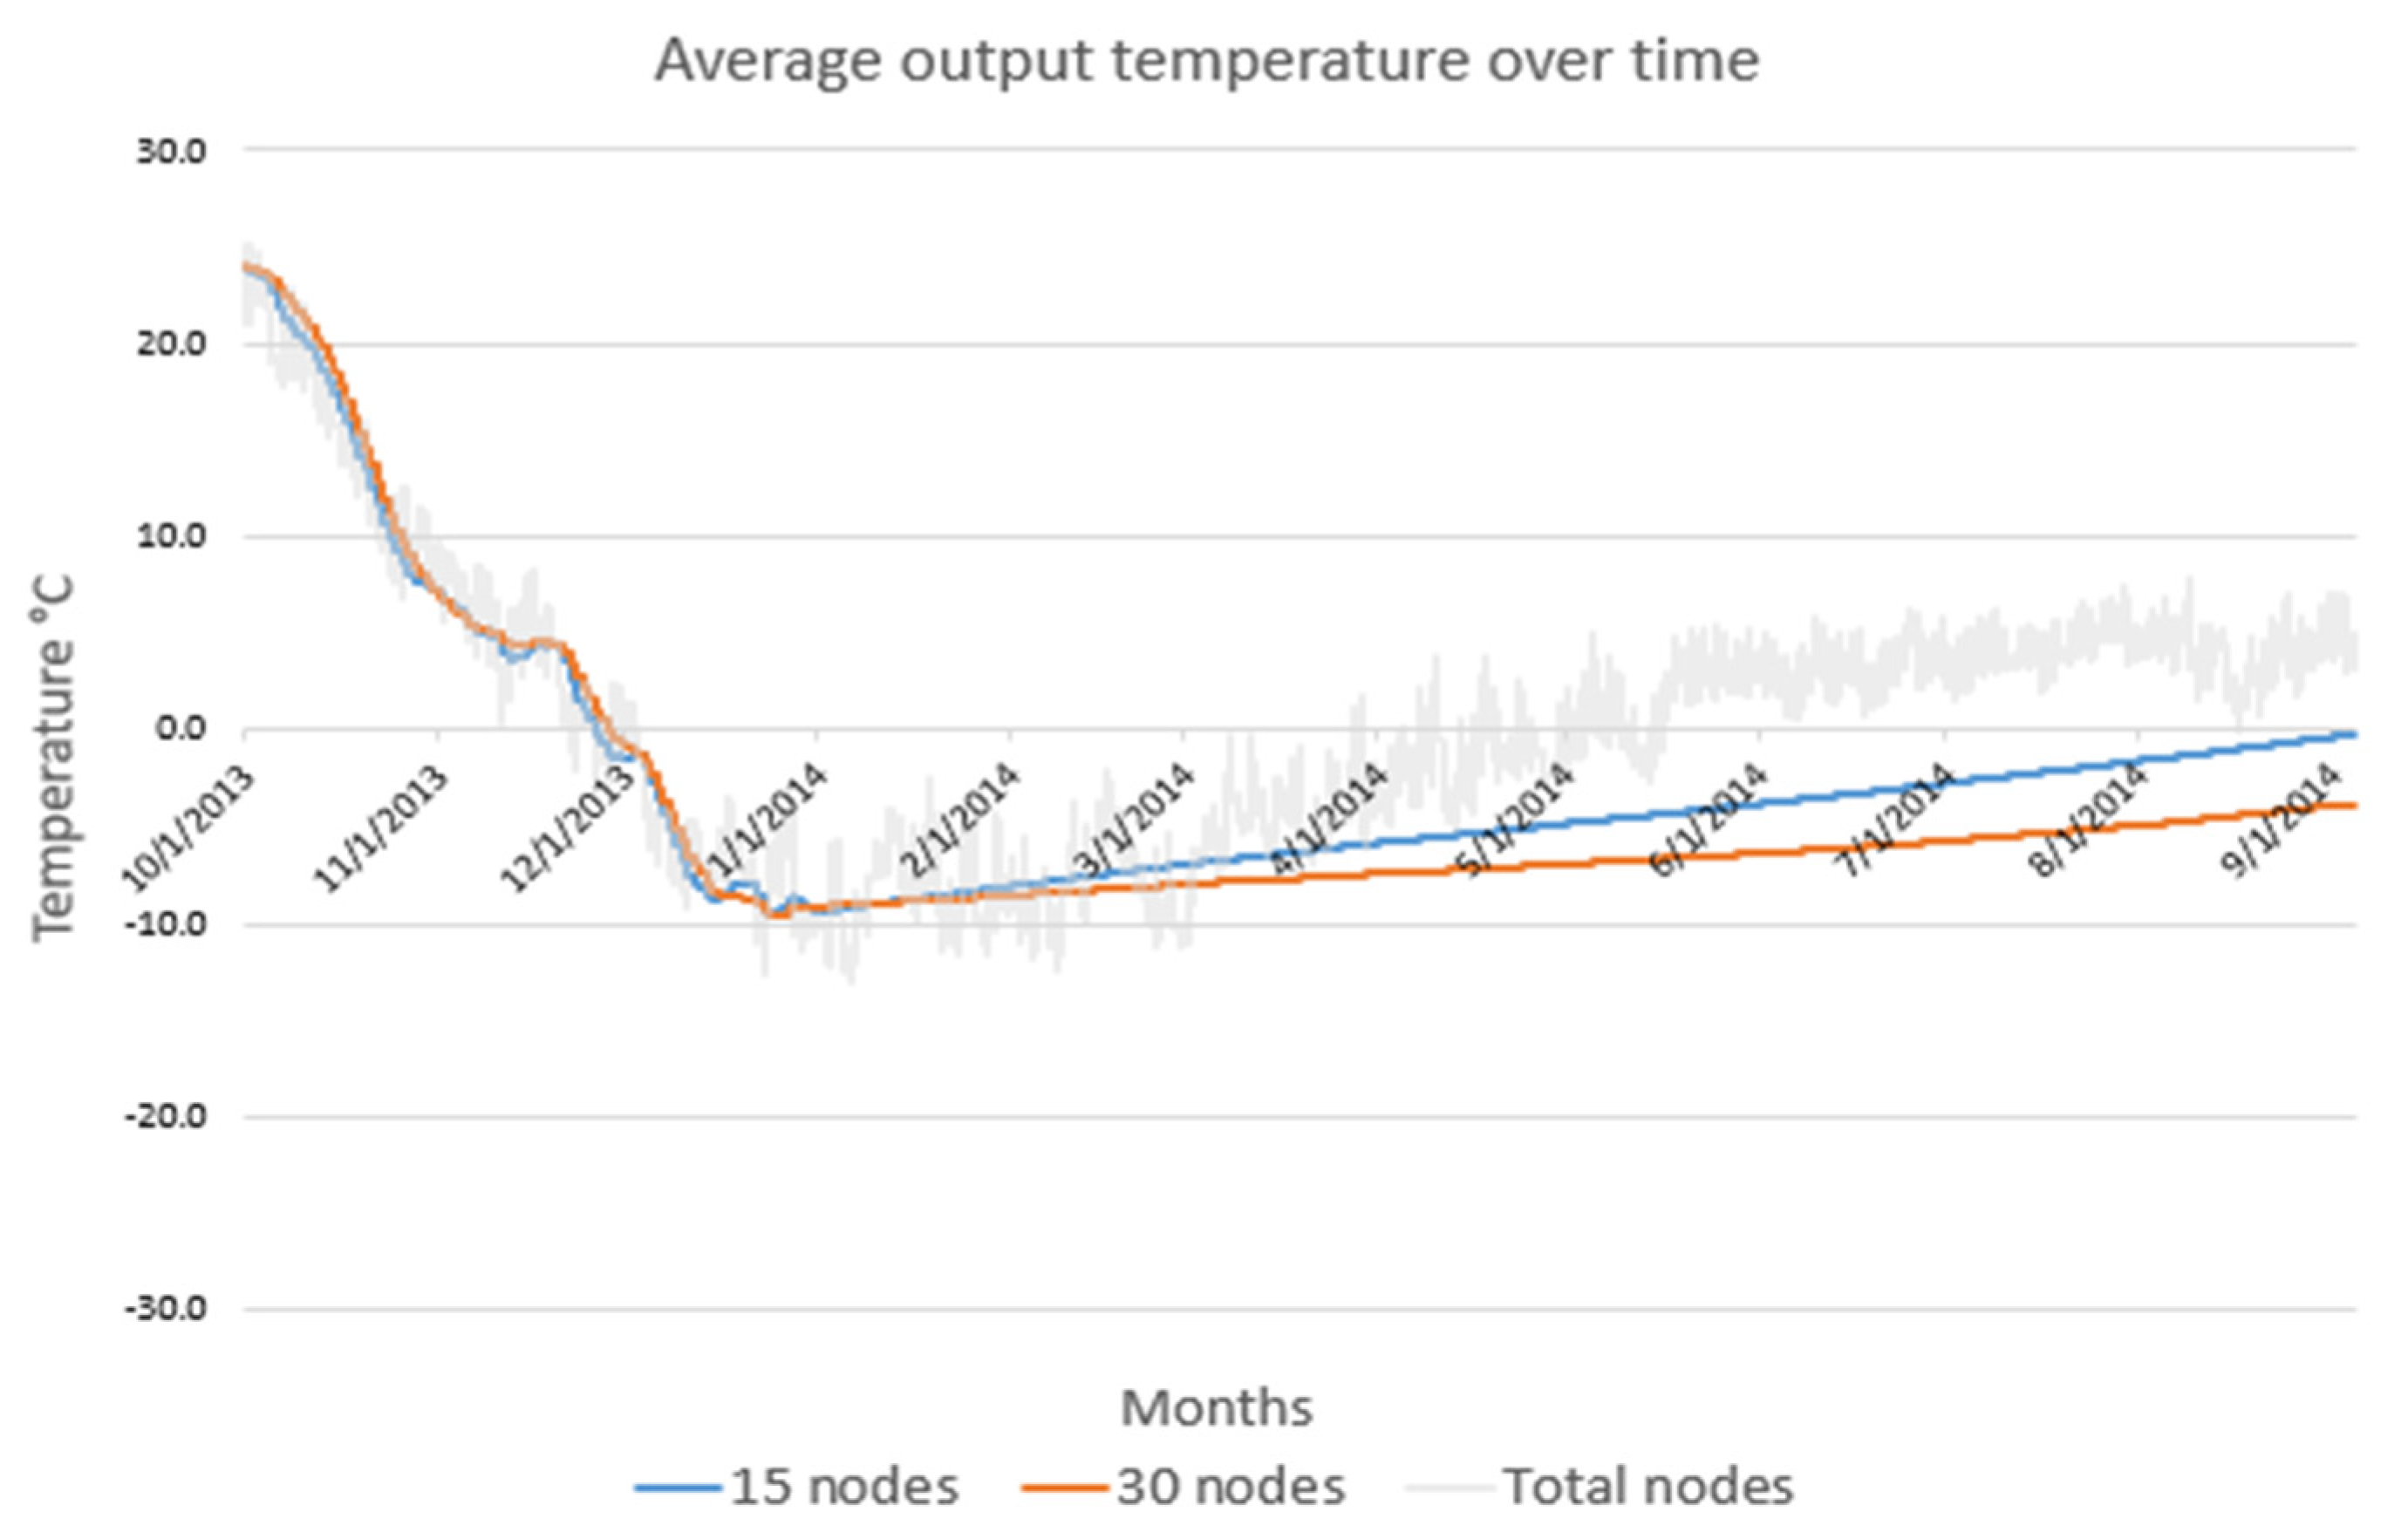
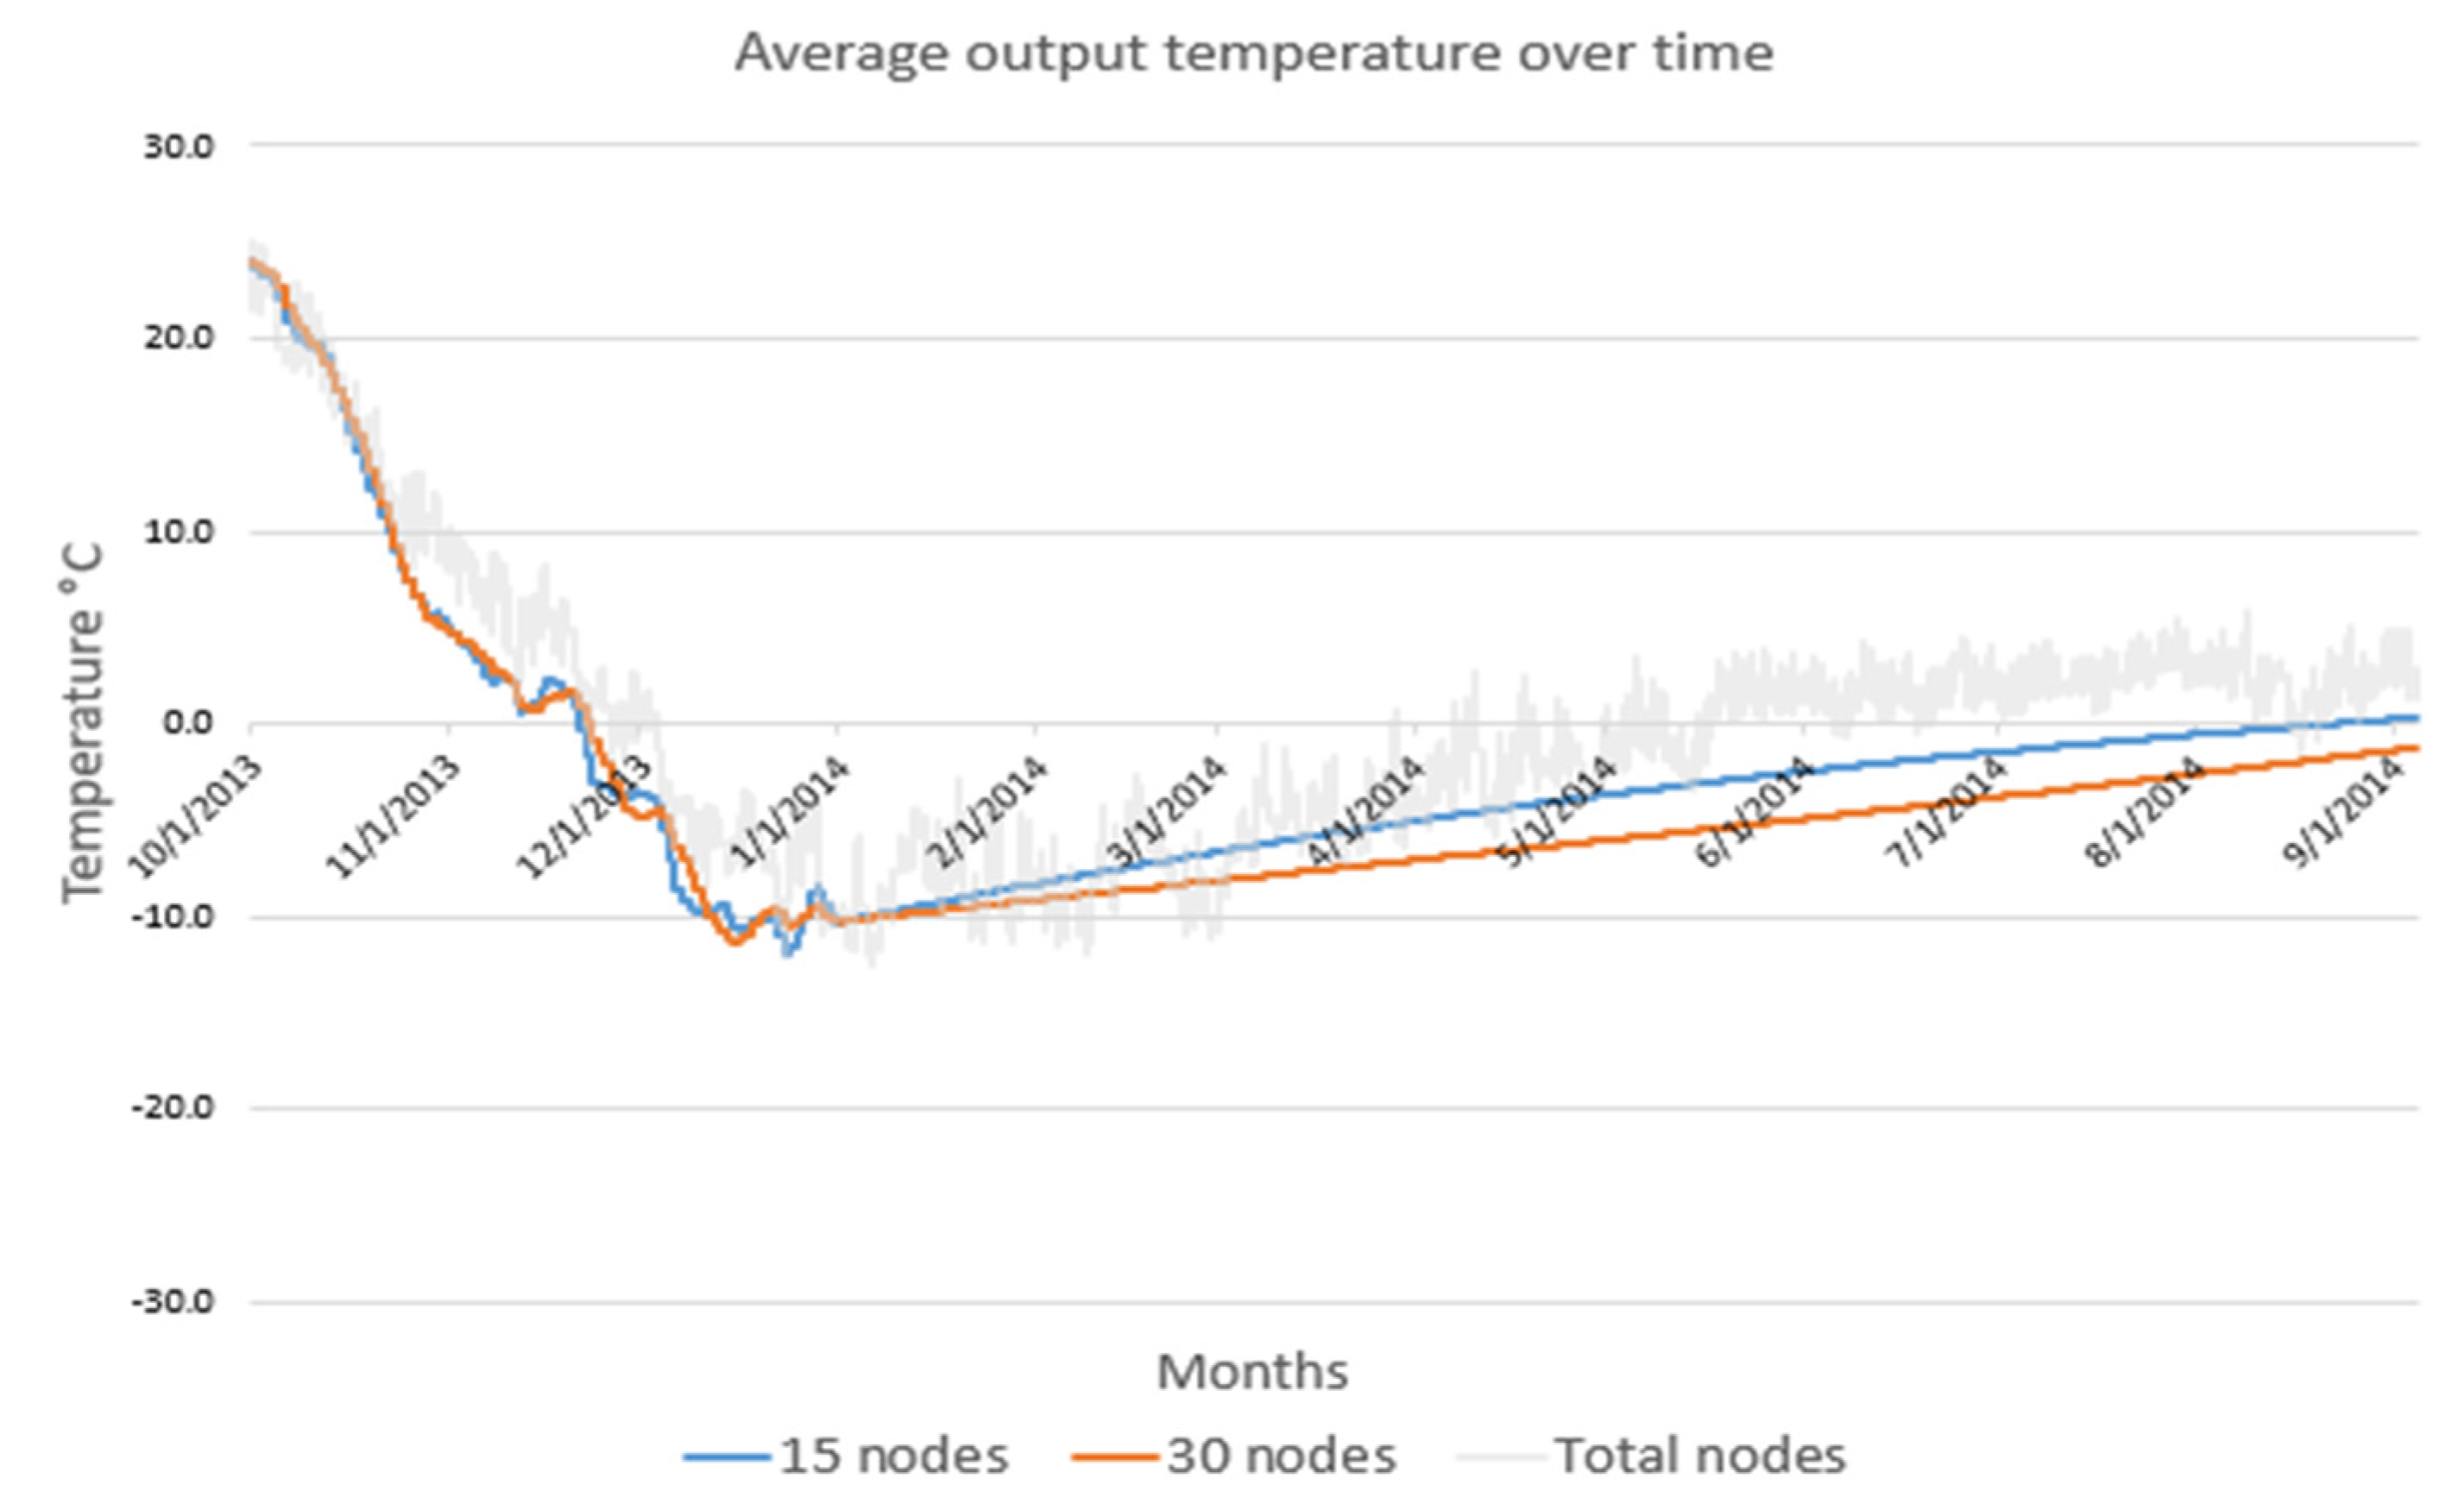
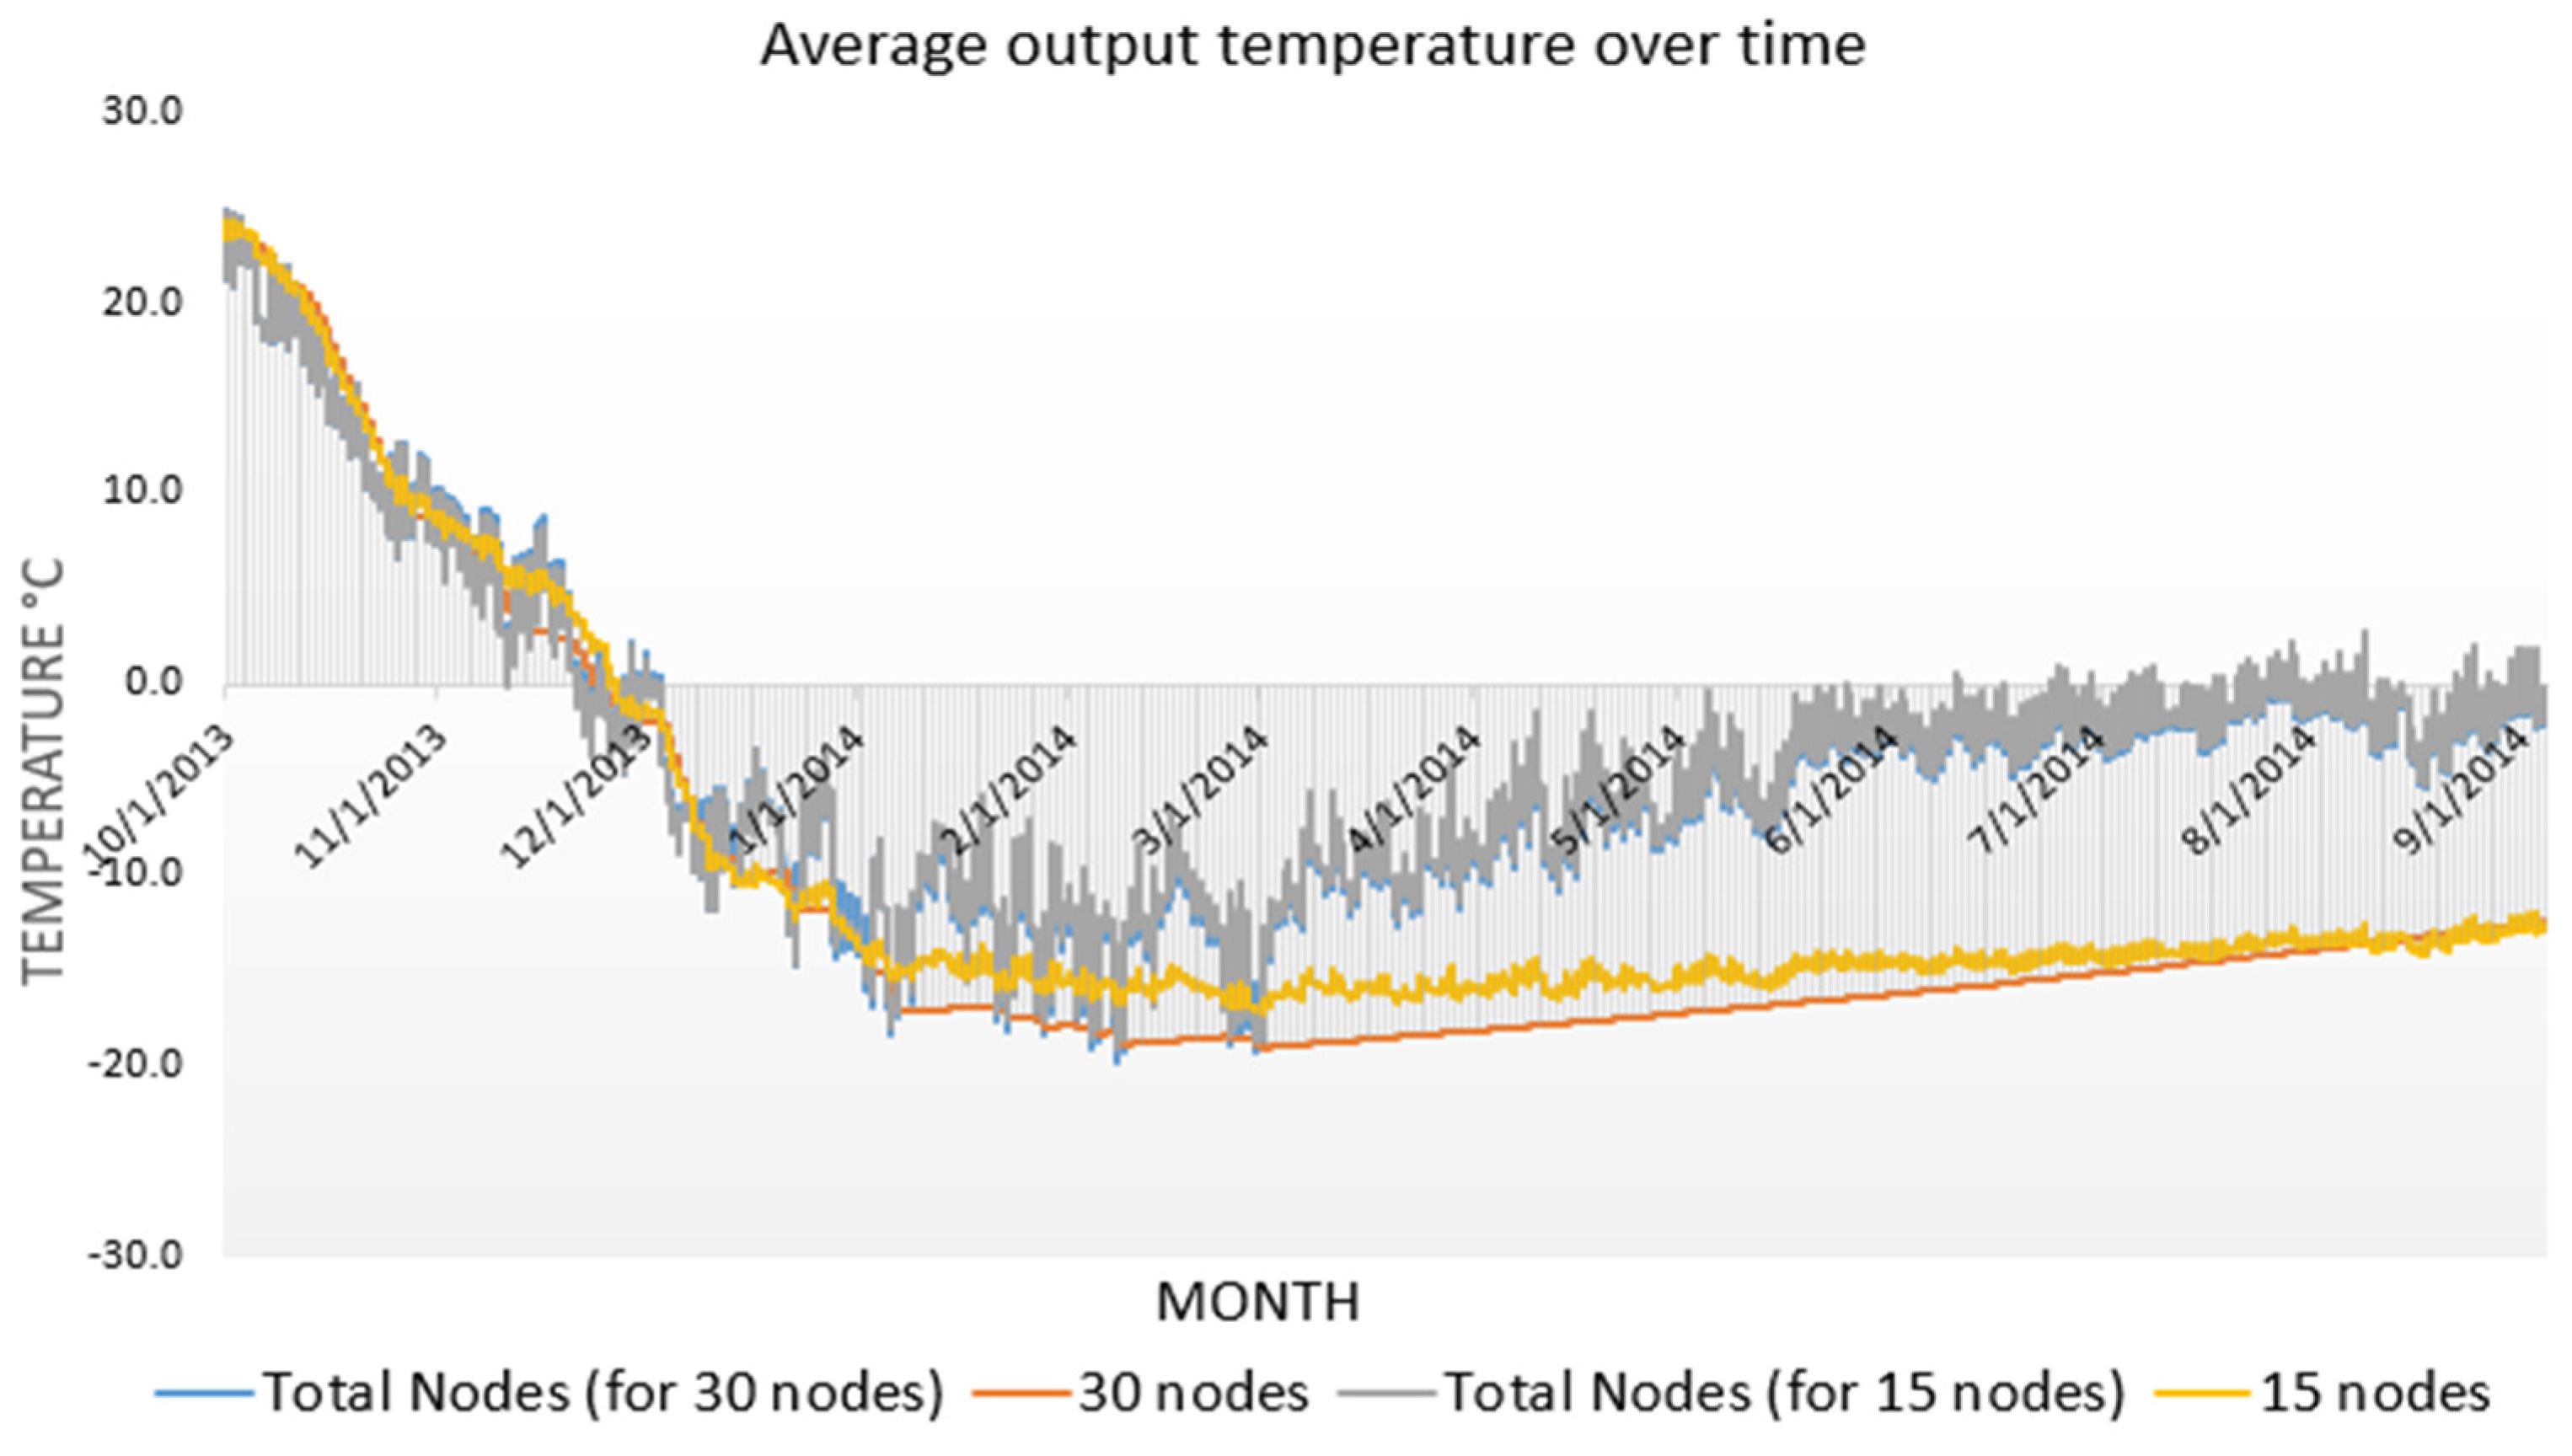
Figure 5.
Average temperature values for 15 and 30 nodes versus the average temperature calculated for the numerical solution (total) for a one-year controlled aeration and storage simulation of 745 Mg of maize in a 11x11 m silo beginning October 1, 2013. The fan was on only from October 1 to December 31, 2013.
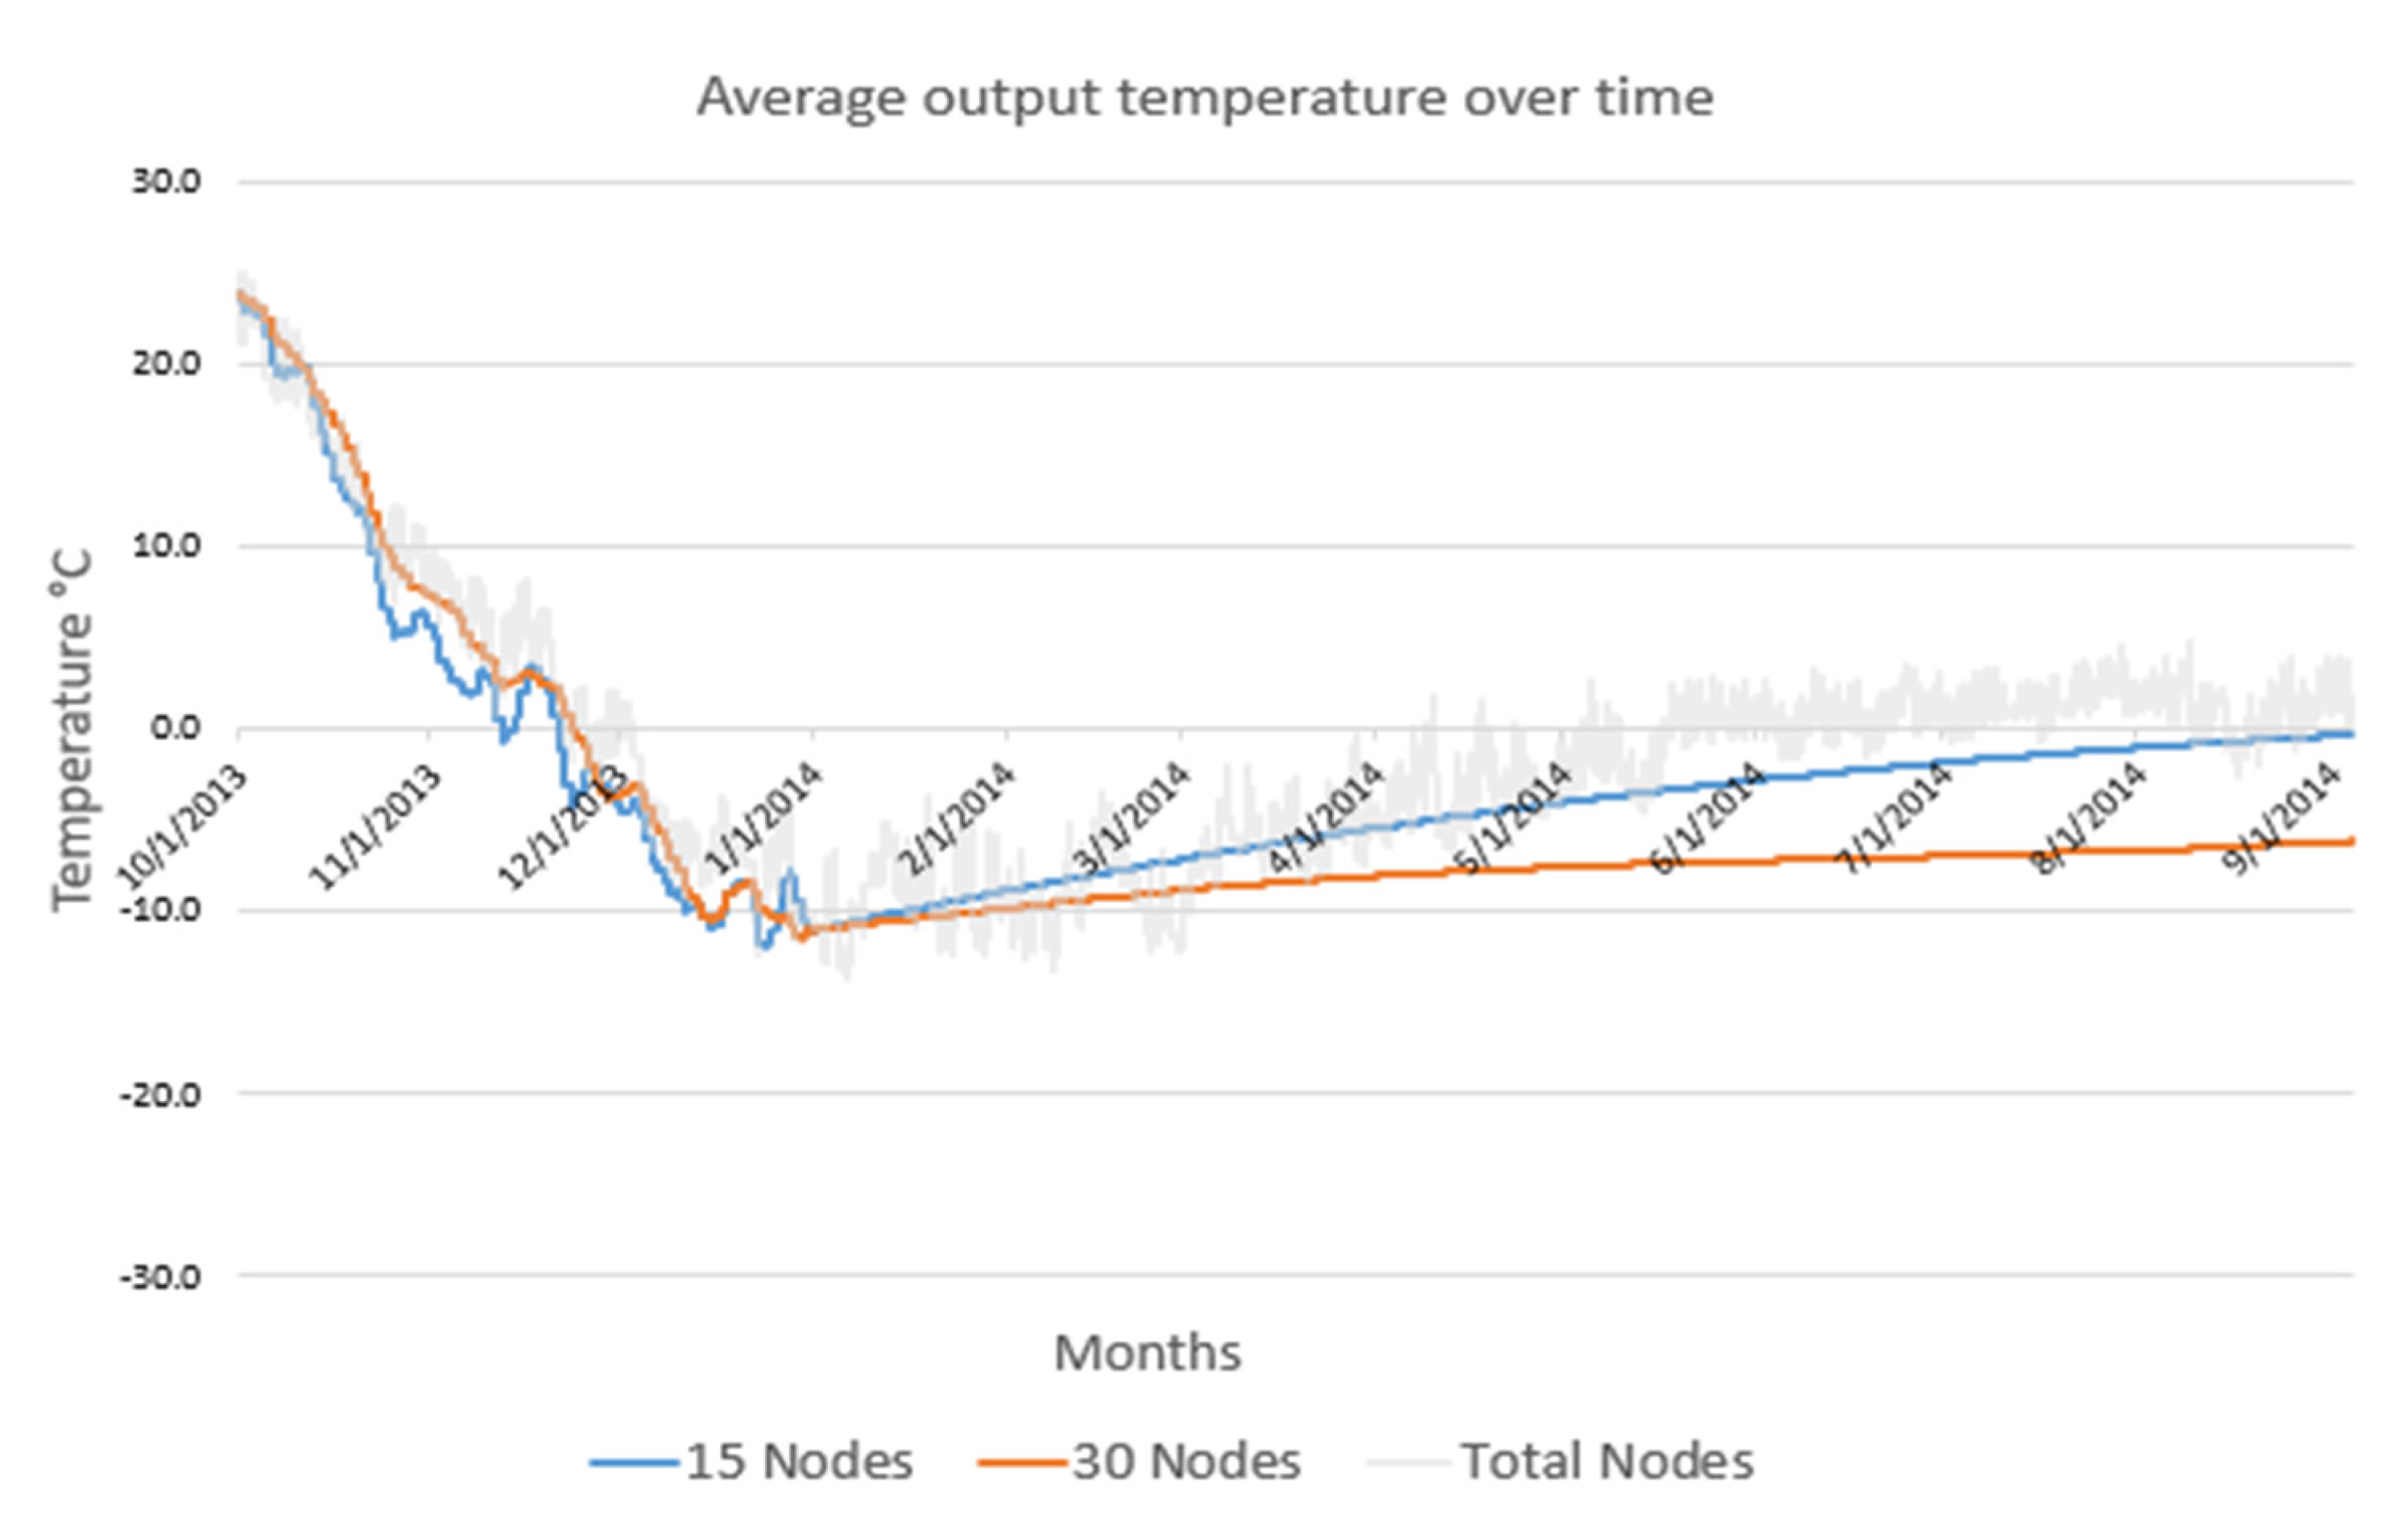
Figure 6.
Average temperature values for 15 and 30 nodes versus the average temperature calculated for the numerical solution (total) for a one-year controlled aeration and storage simulation of 1765 Mg of maize in a 14.6x14.6 m silo beginning October 1, 2013. The fan was on only from October1 to December 31, 2013.
Figure 7.
Average temperature values for 15 and 30 nodes versus the average temperature calculated for the numerical solution (total) for a one-year controlled aeration and storage simulation of 2206 Mg of maize in a 14.6x18.3 m silo beginning October 1, 2013. The fan was on only from October1to December 31, 2013.
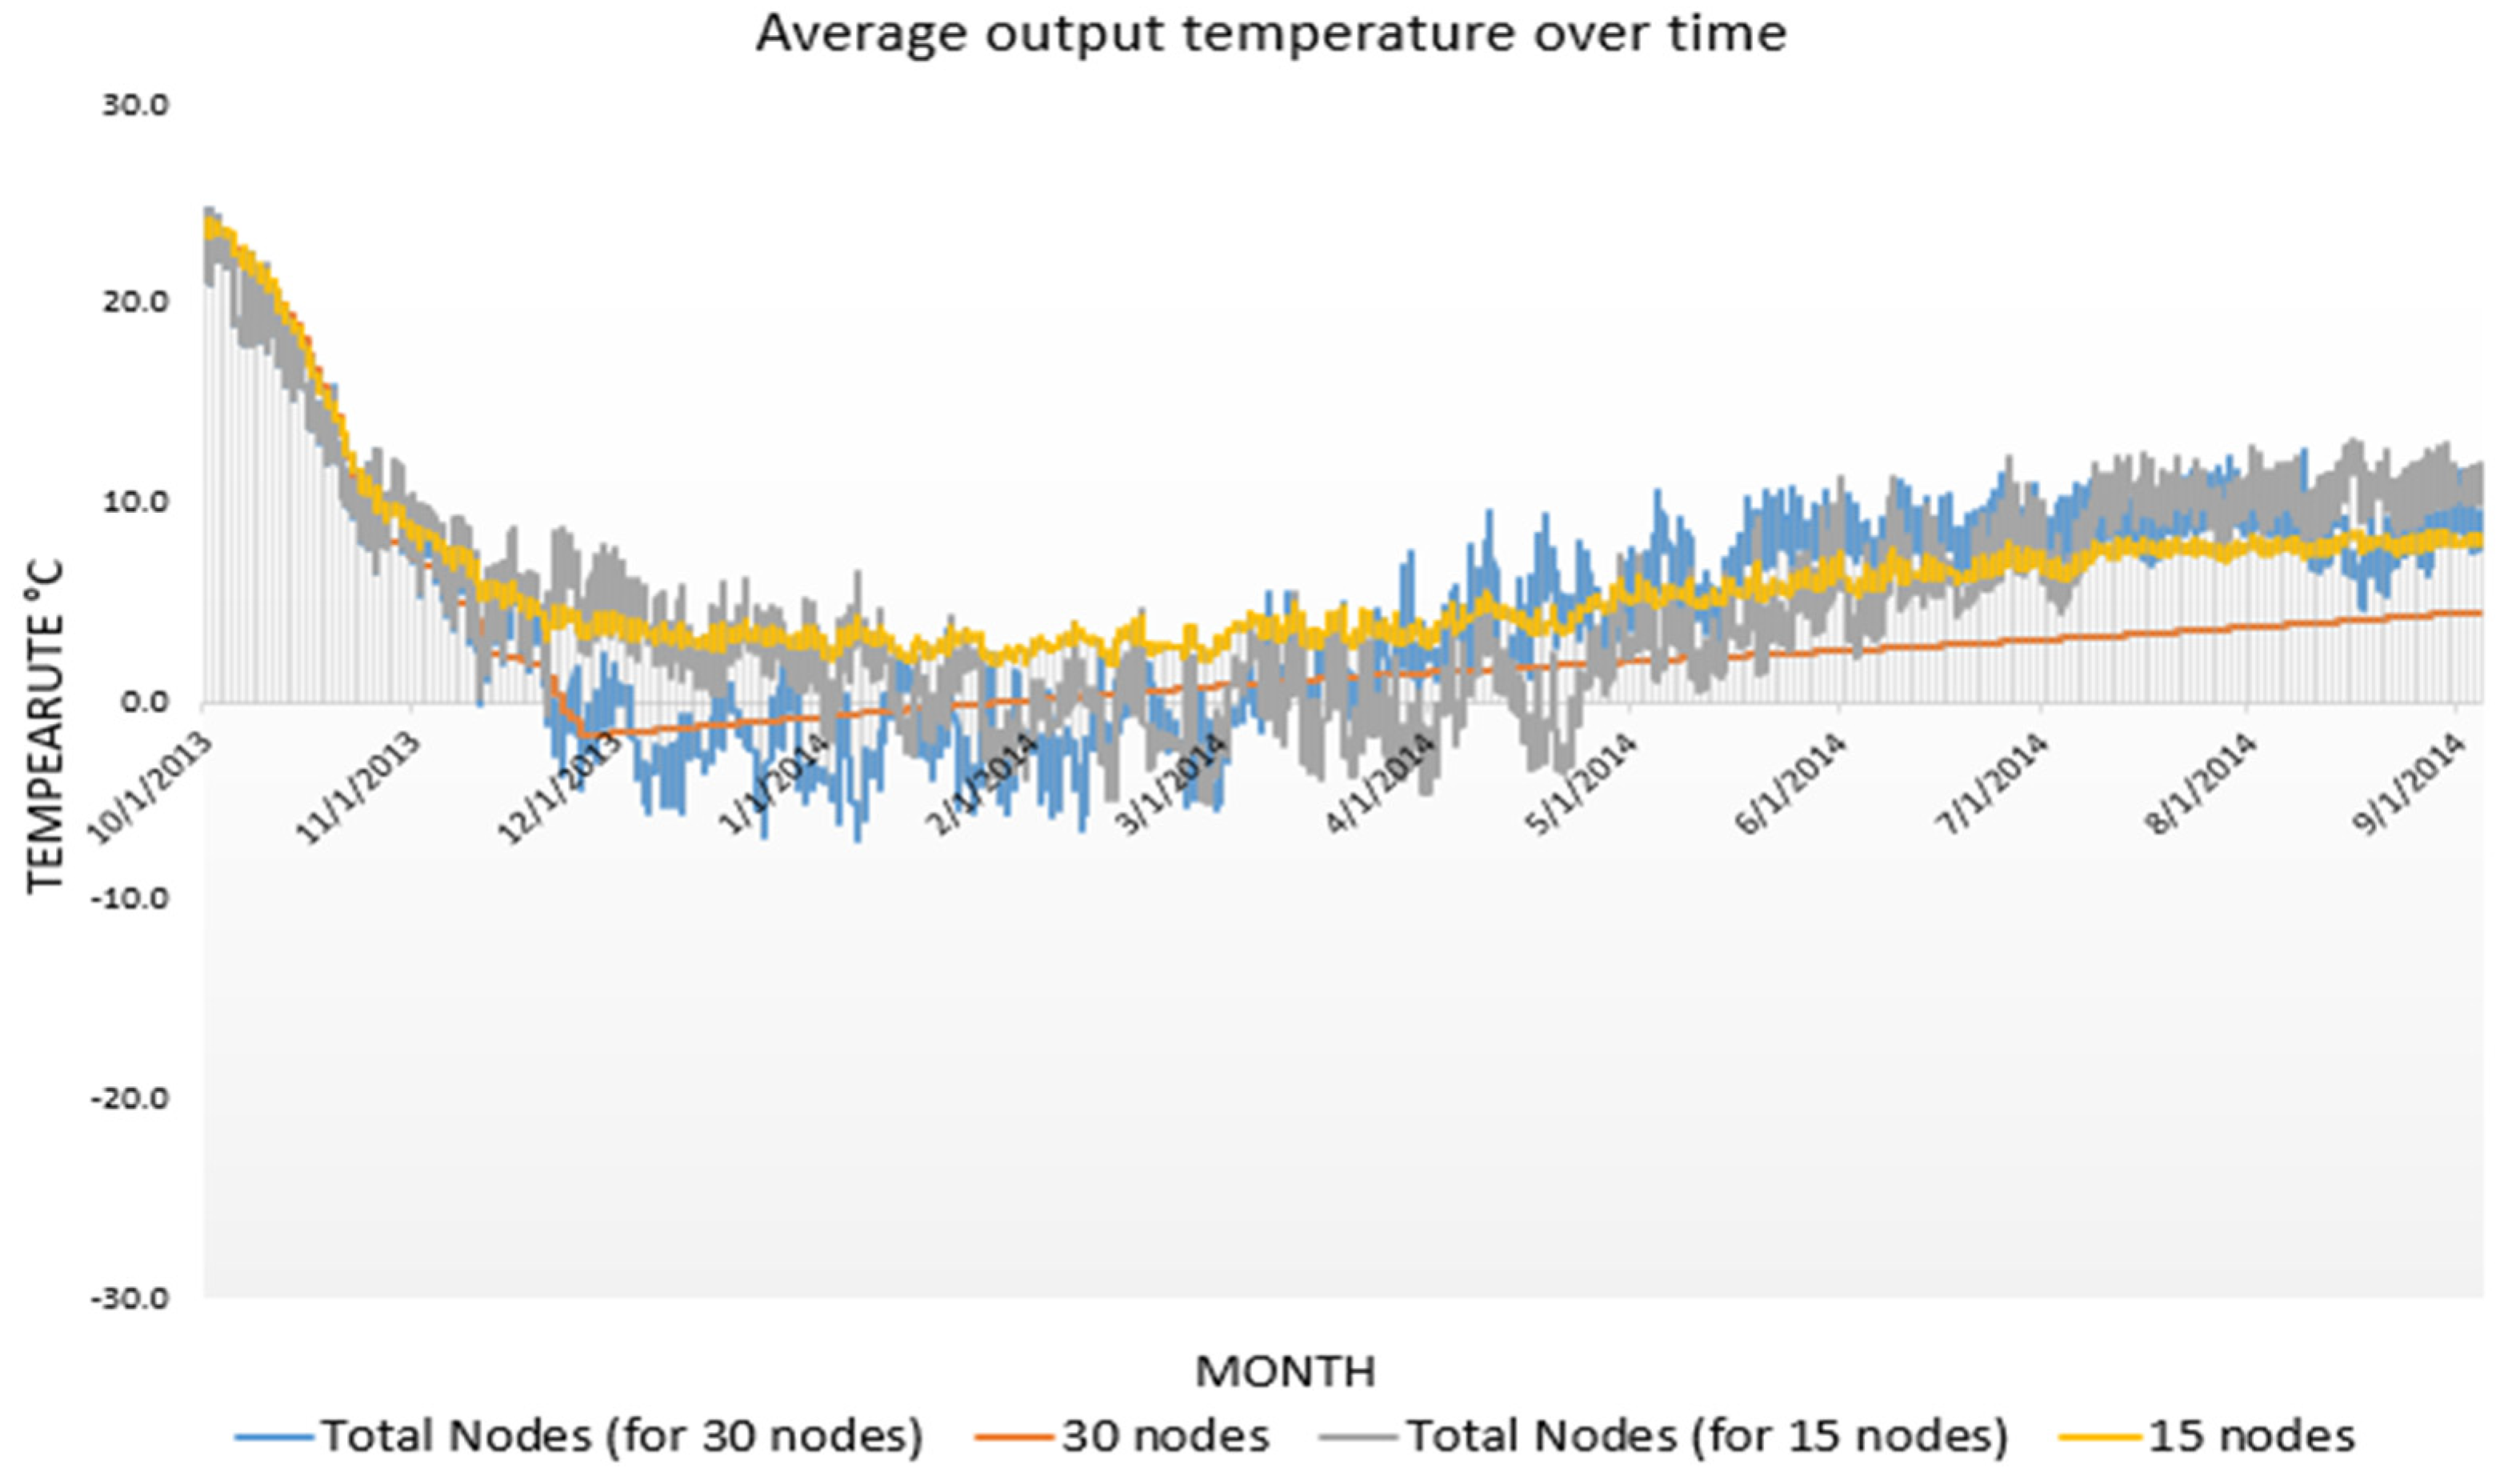
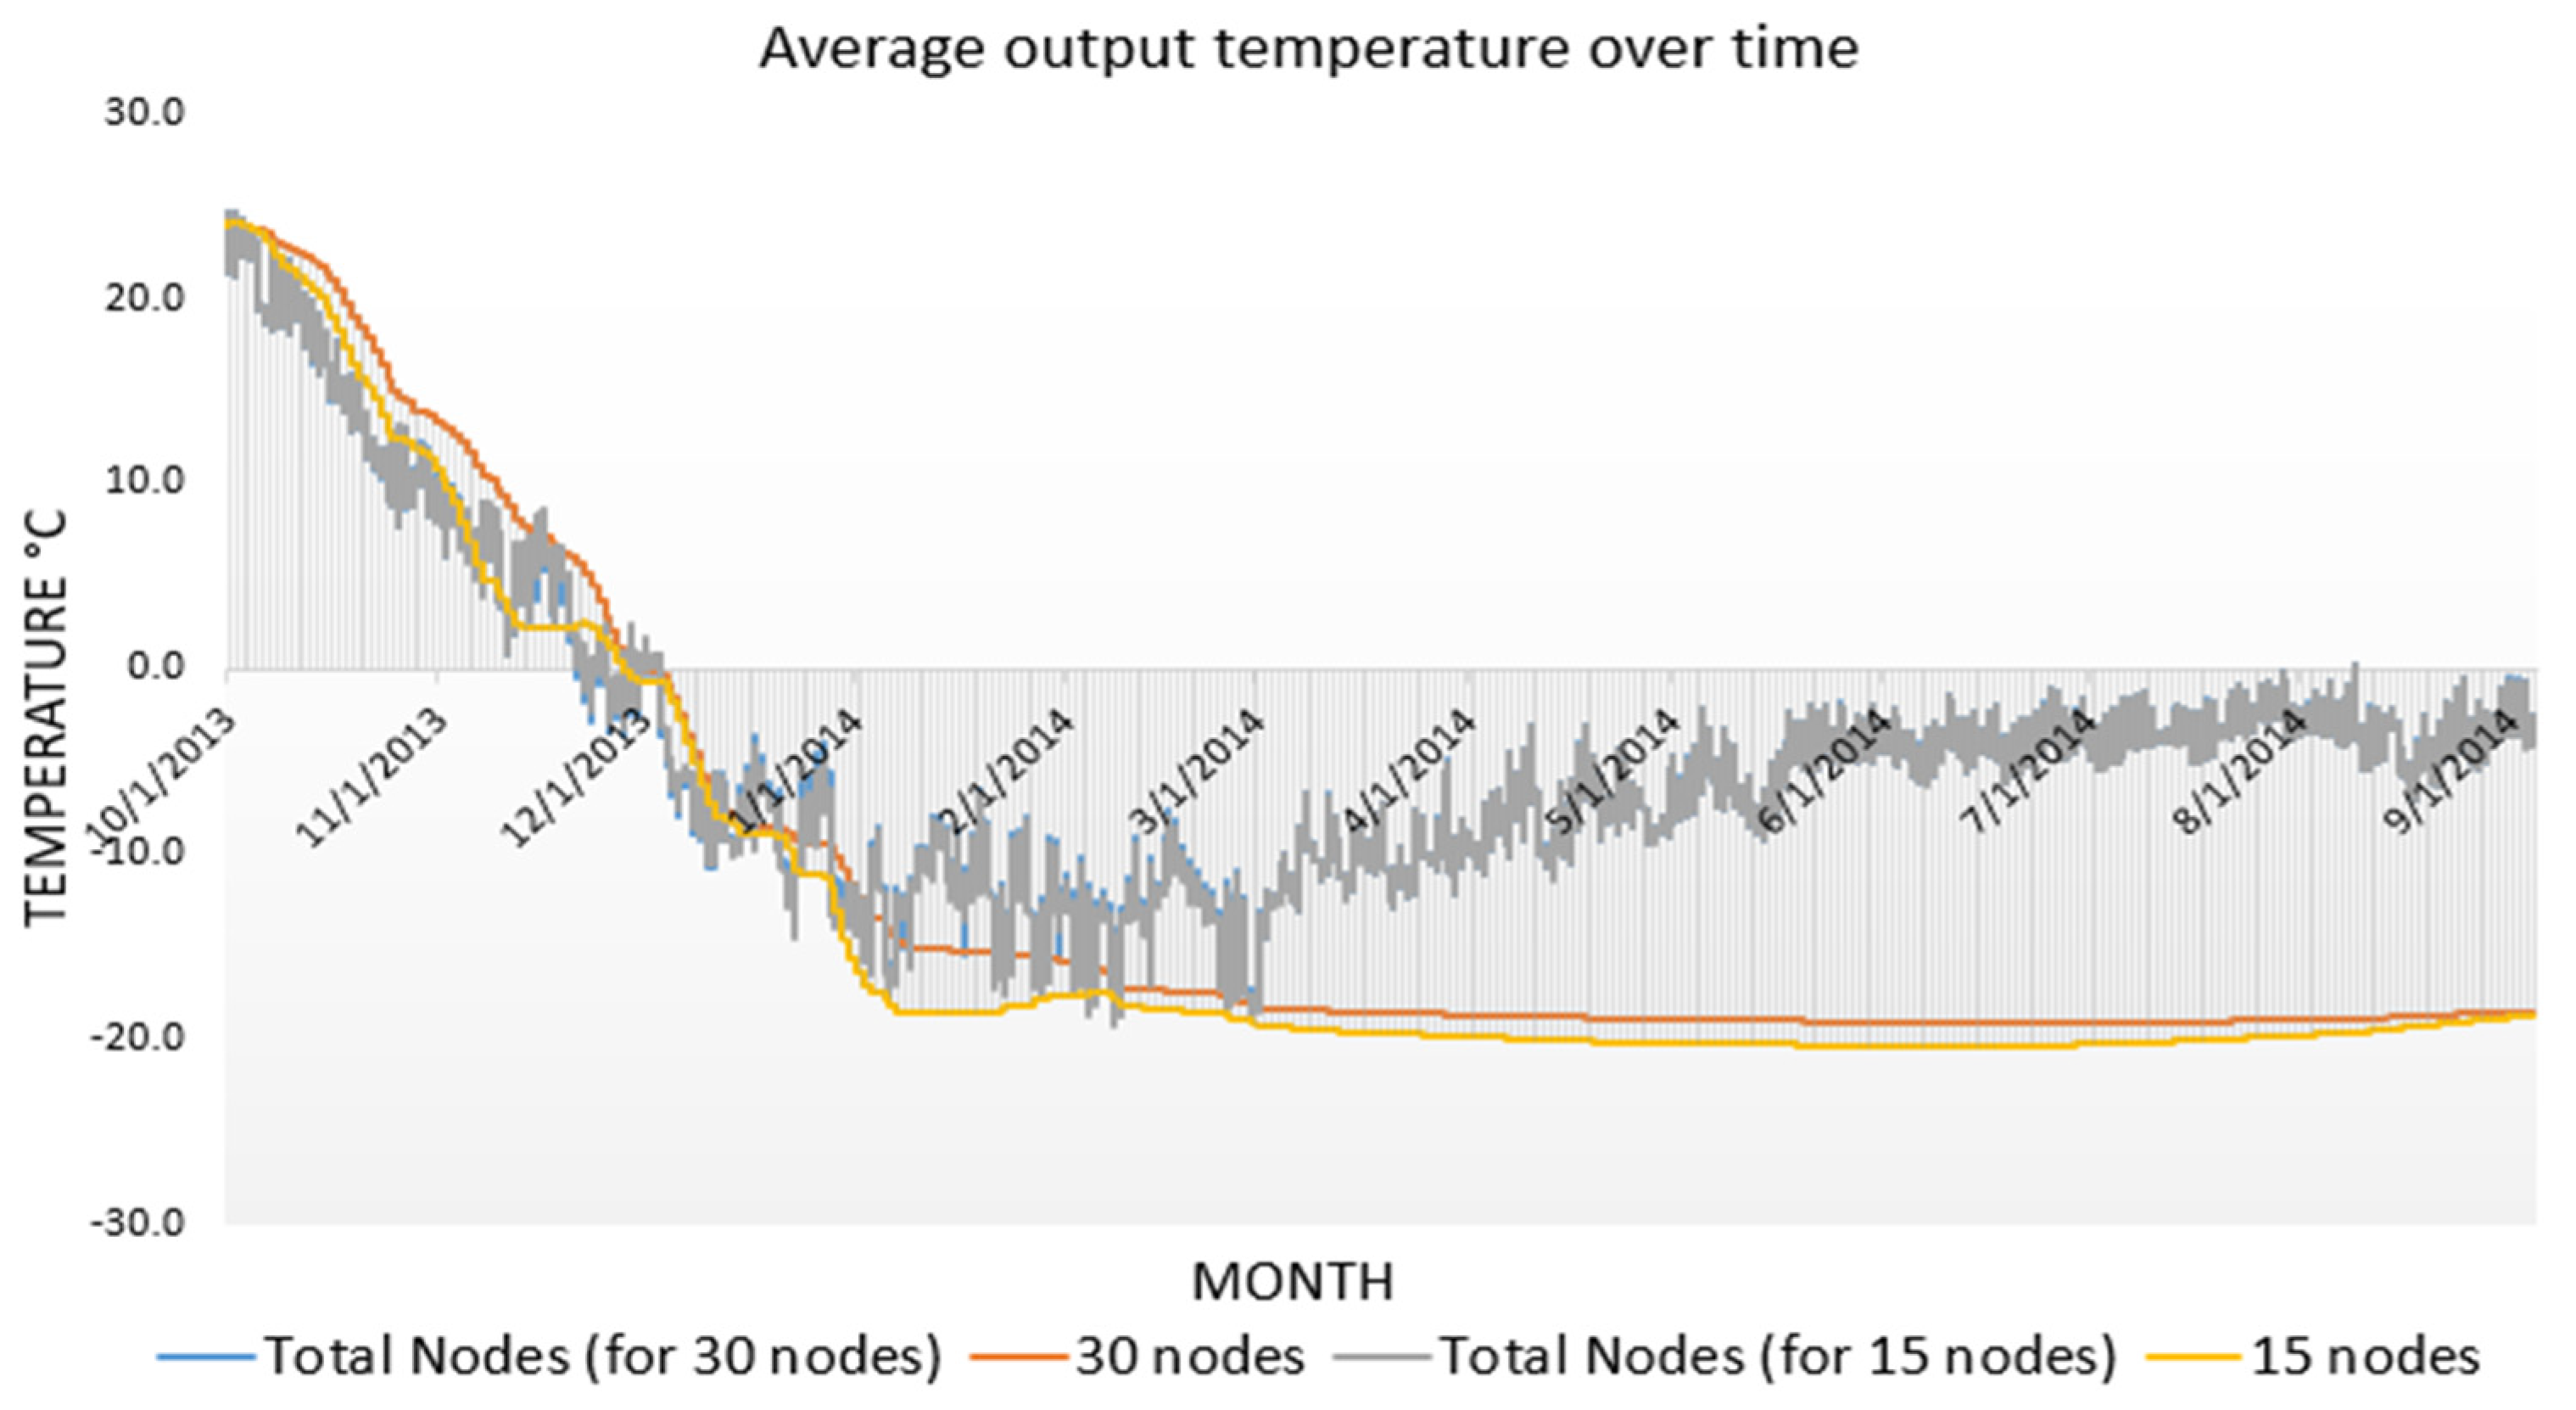
Figure 8.
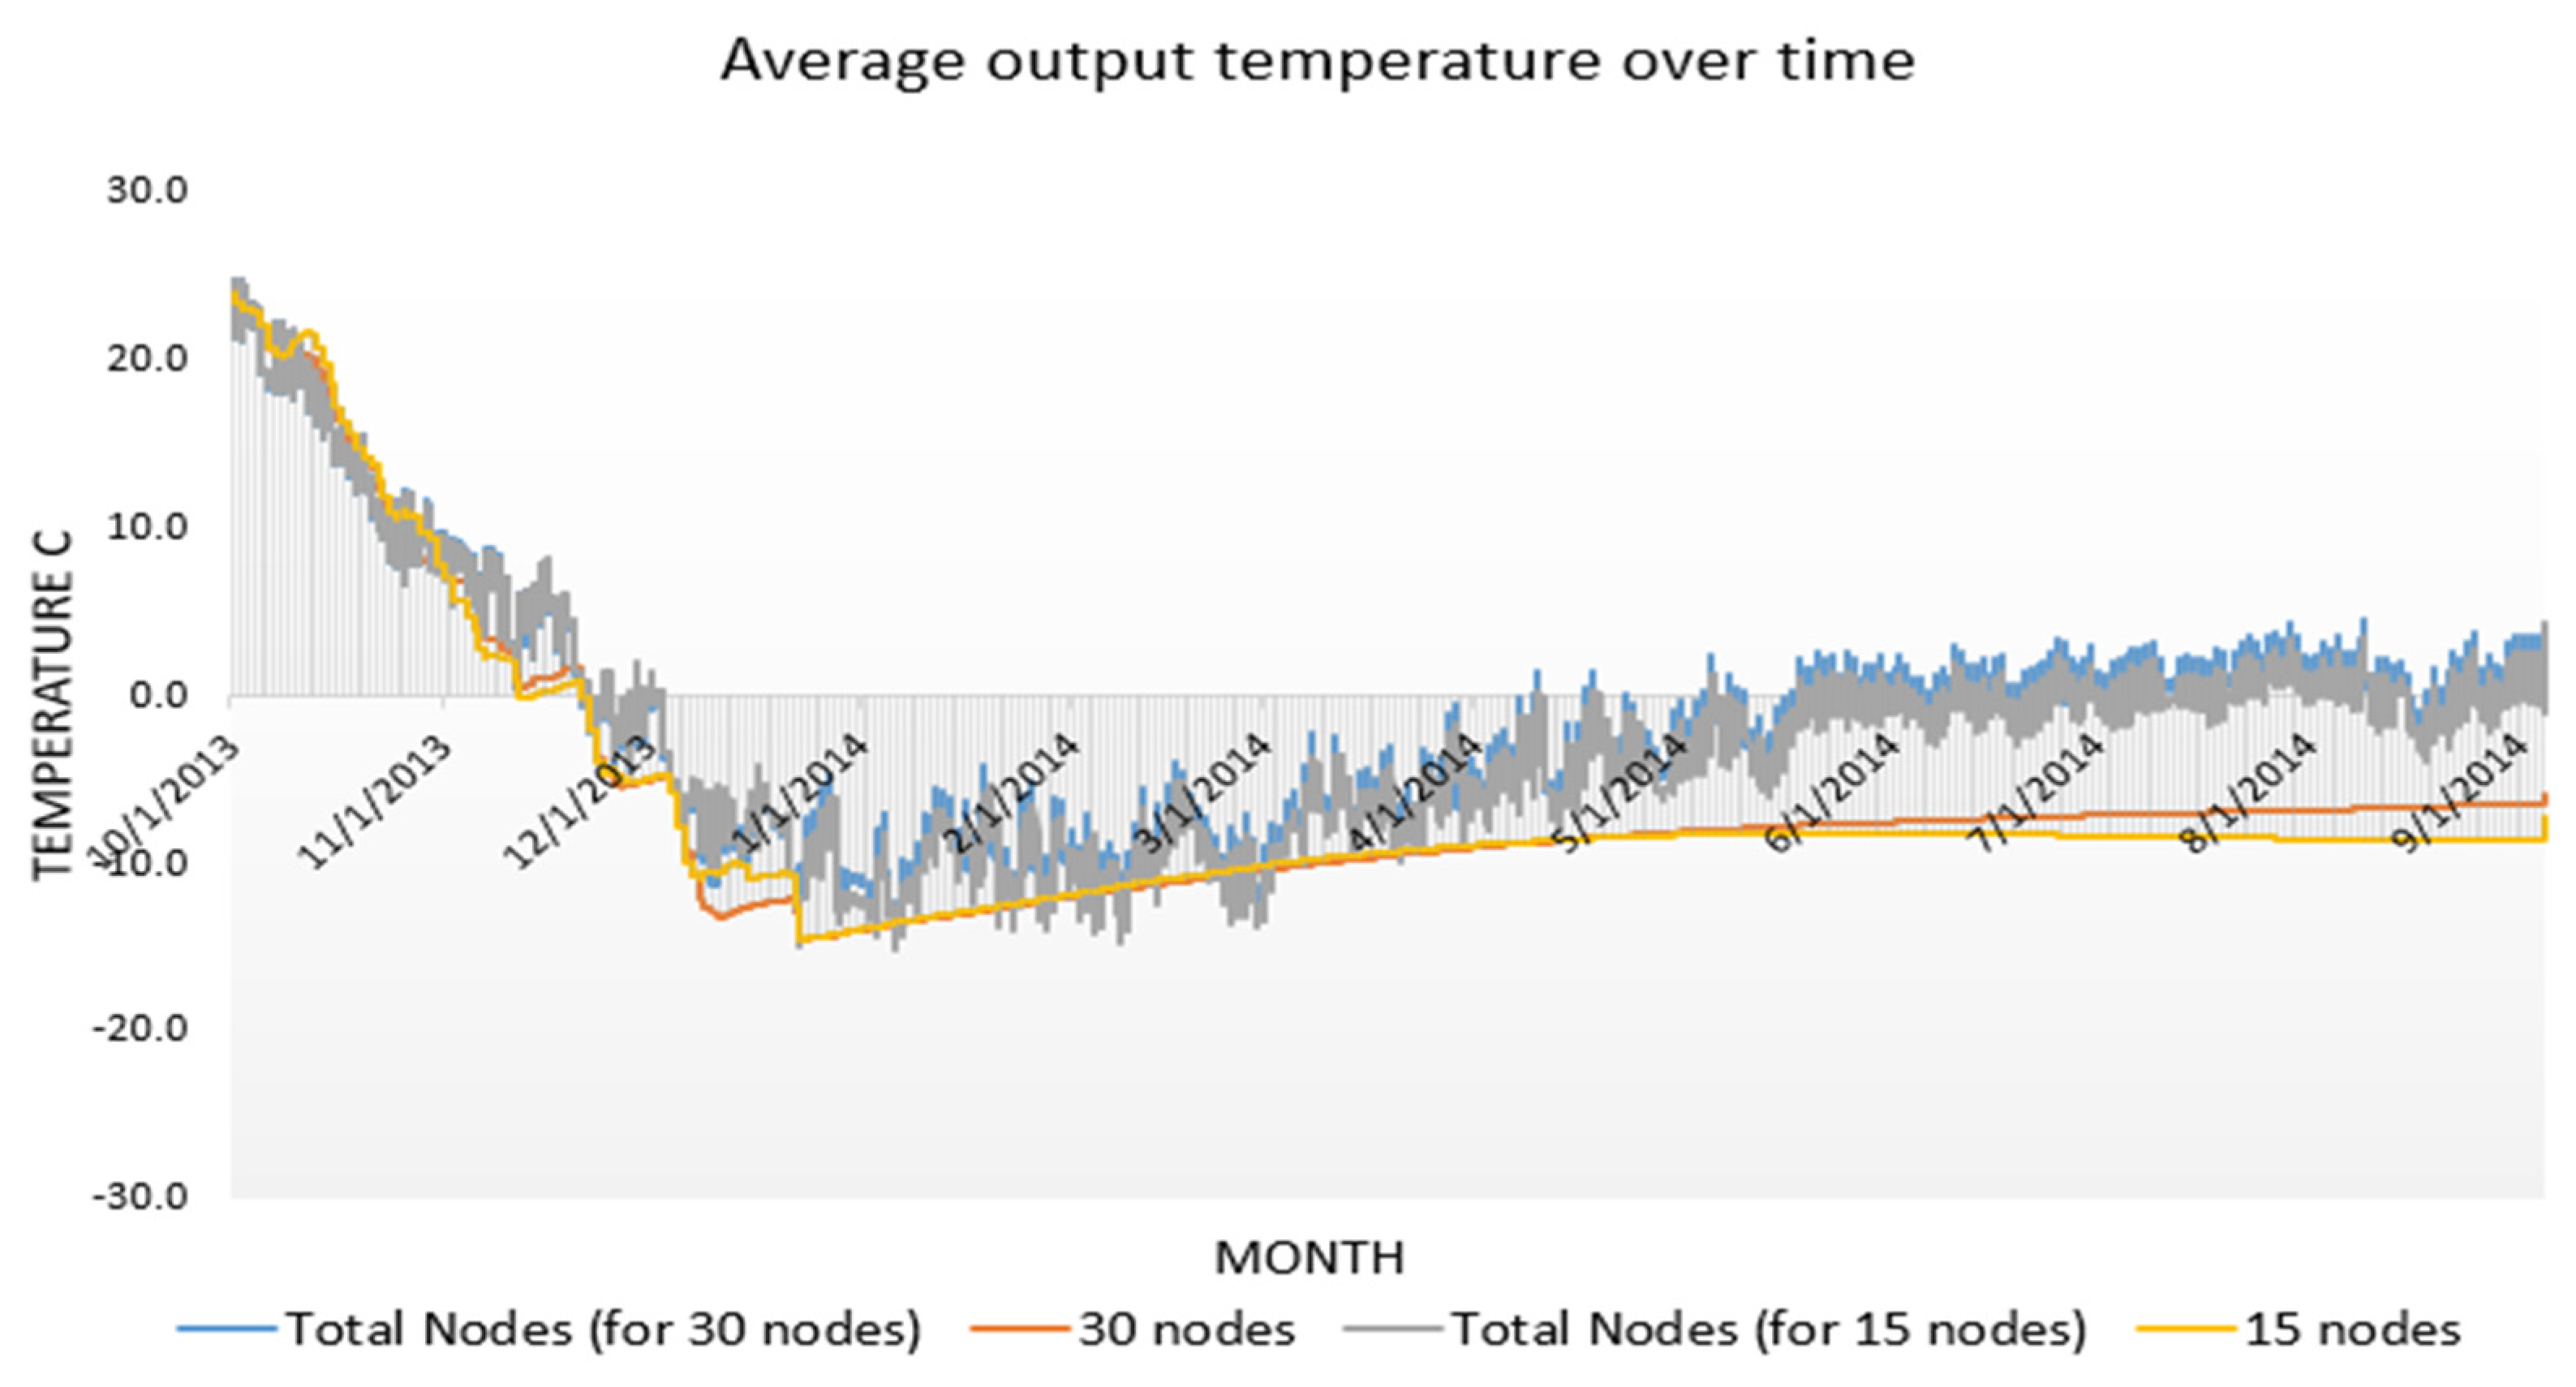
Average temperature values for 15 and 30 nodes versus the average temperature calculated for the numerical solution (total) when the fan was controlled by either 15 or 30 nodes for a one-year controlled aeration and storage simulation of 745 Mg of maize in a 11x11 m silo beginning October 1, 2013. The fan was turned on whenever the ambient air temperature was cooler than the average temperature of either the 15 or 30 nodes in the grain mass. Additionally, when the average temperature of the top layer nodes reached 0°C, the fan was turned off and sealed for the rest of the simulation period. The aeration cool-down period ended on November 21, 2013.
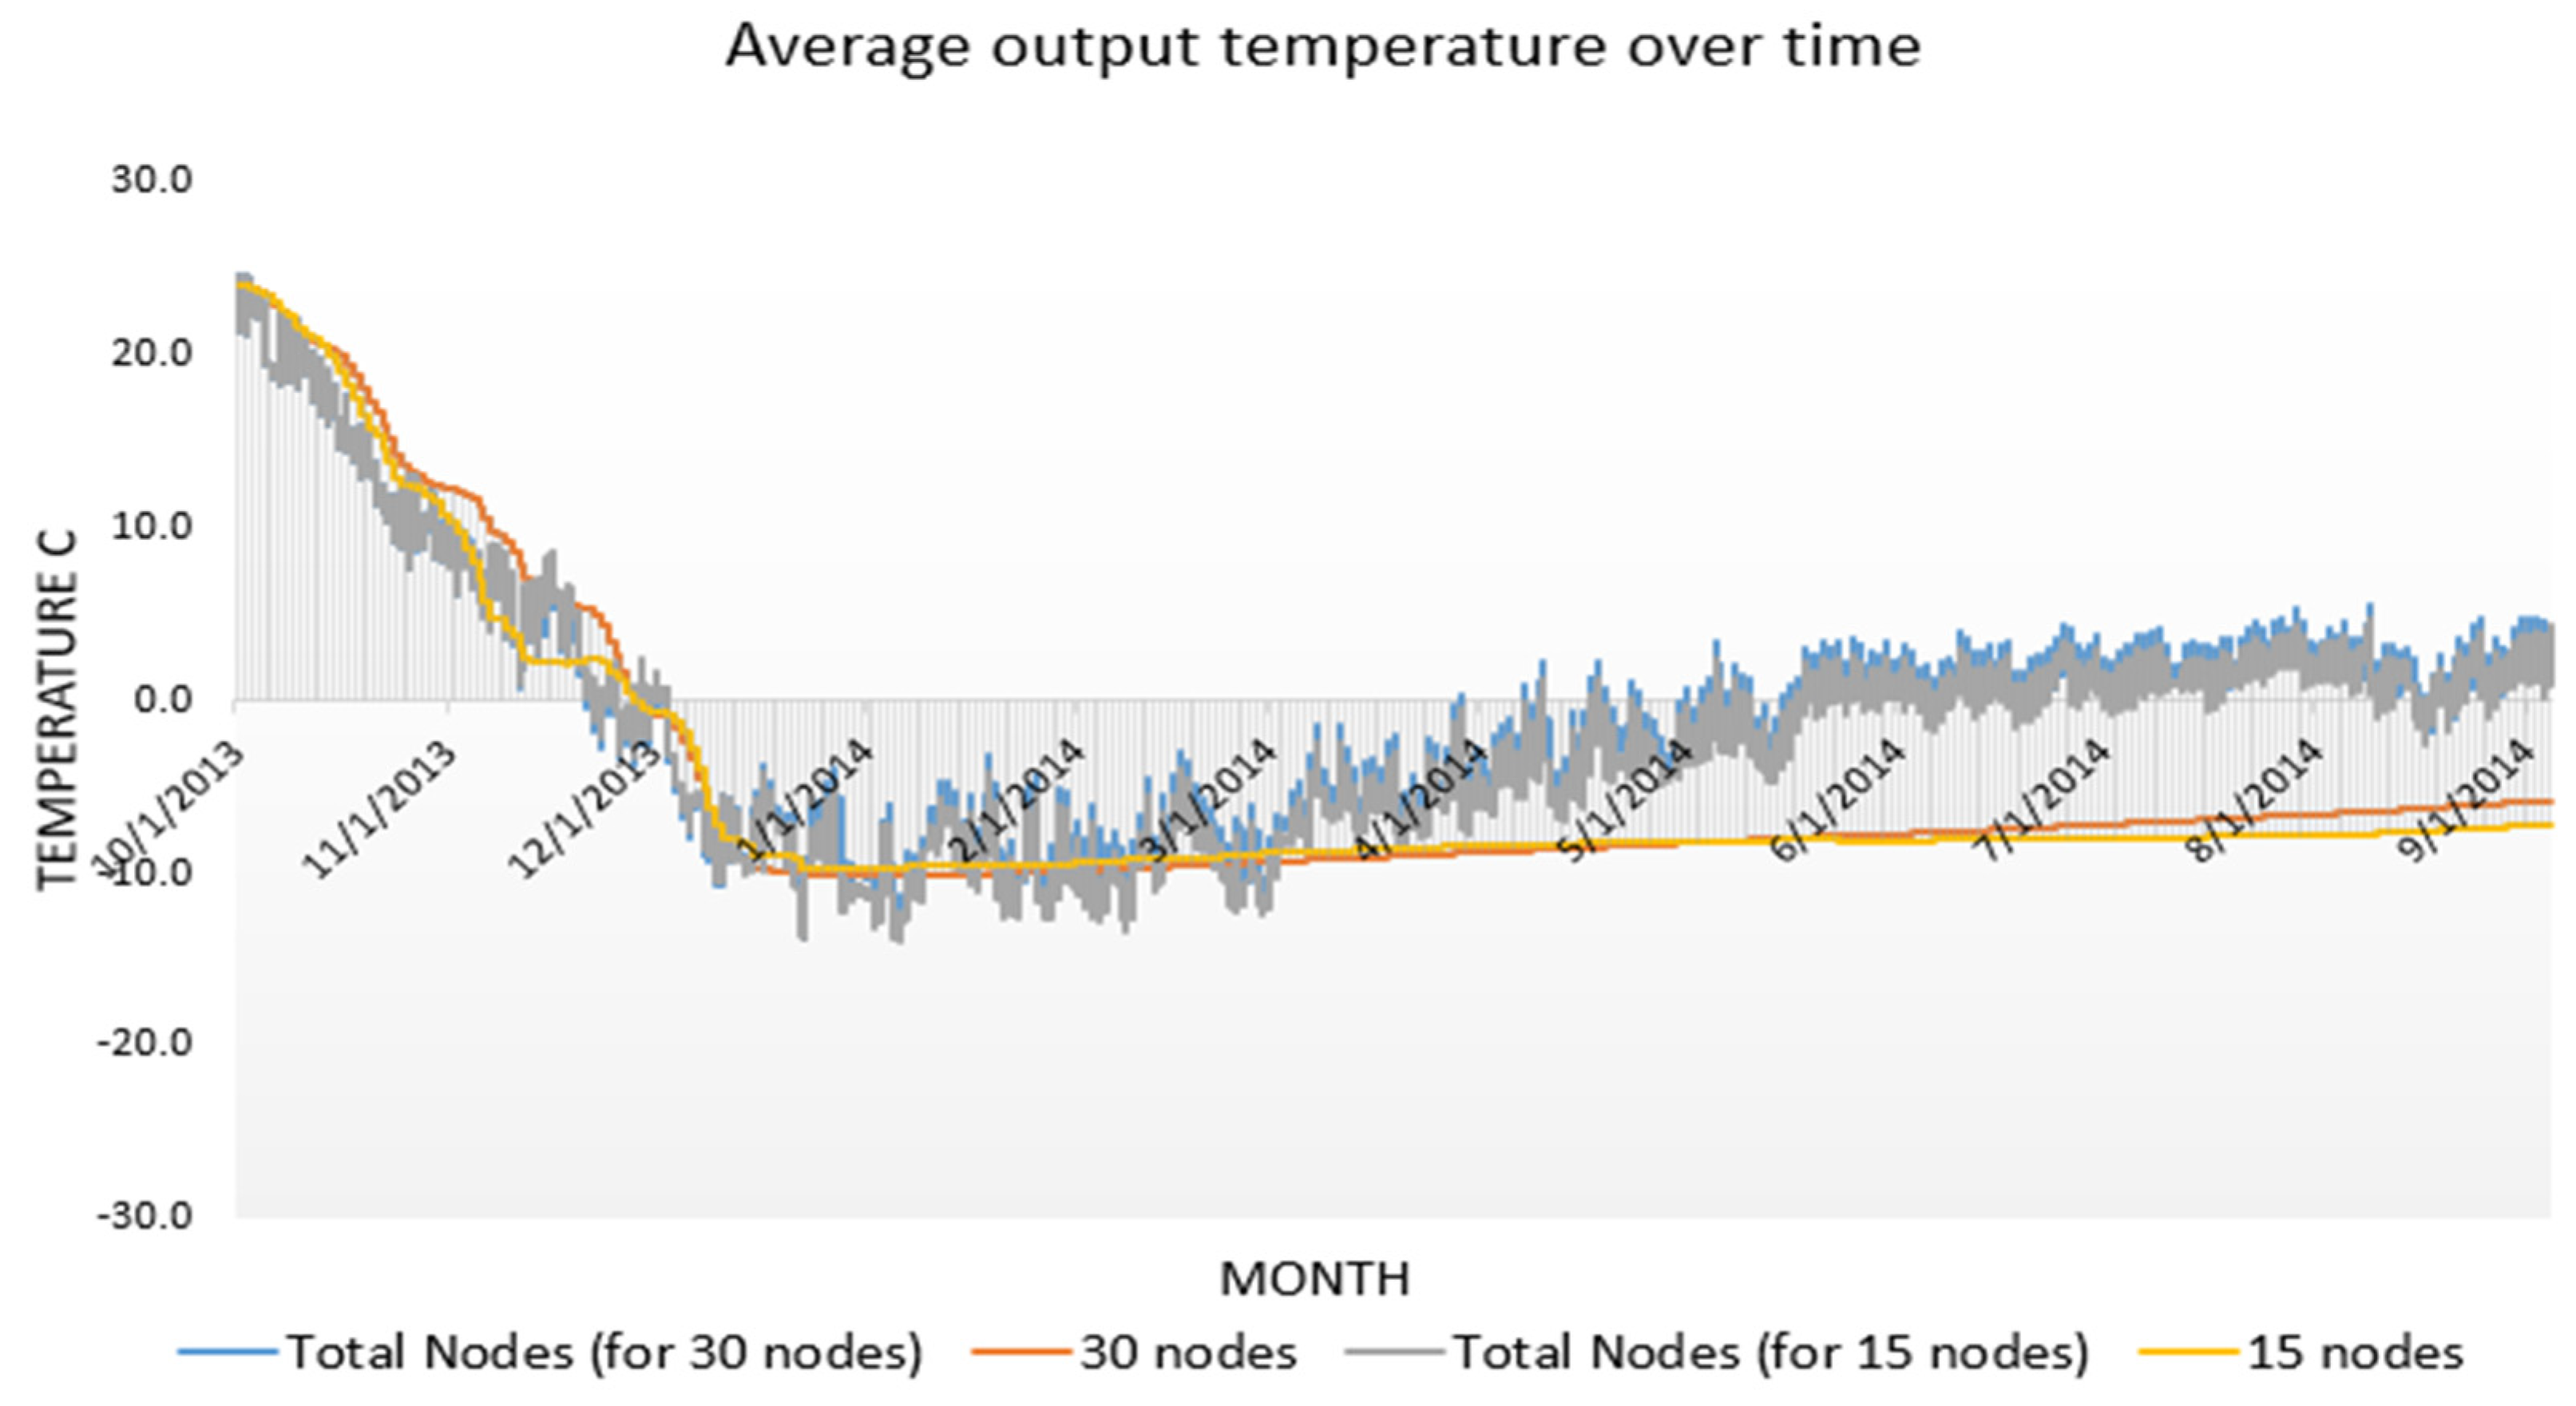
Figure 9.
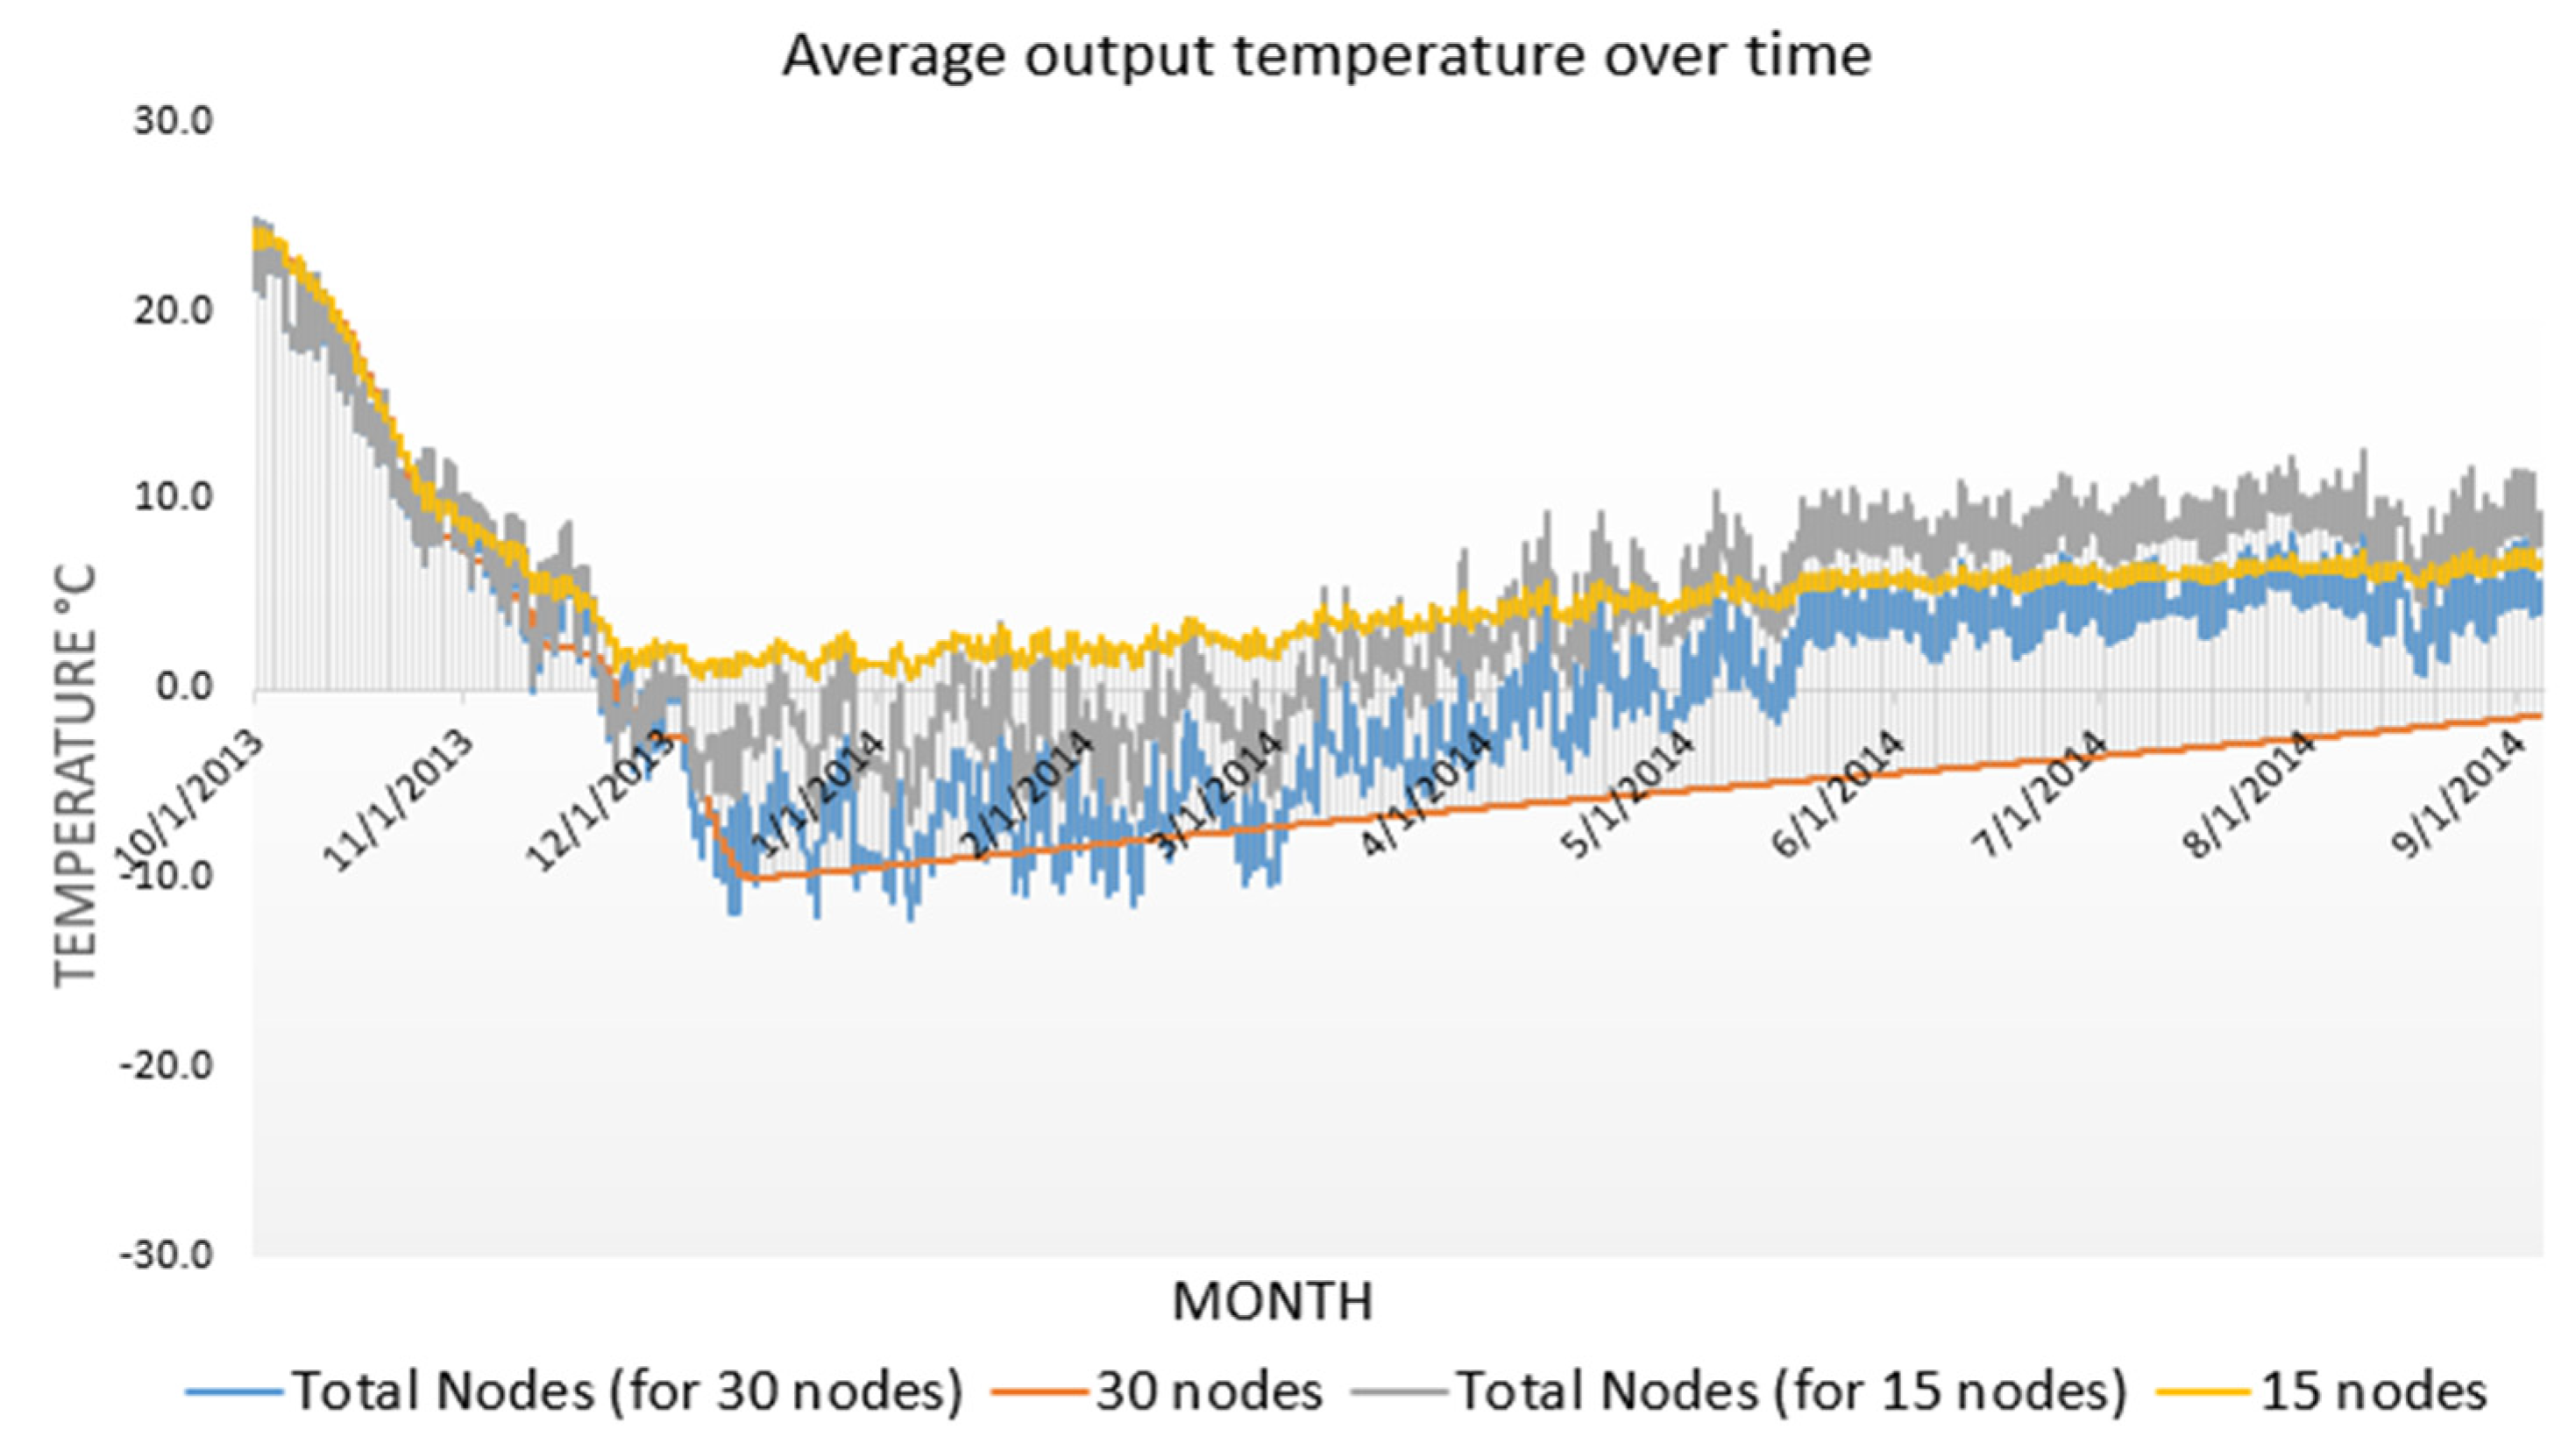
Average temperature values for 15 and 30 nodes versus the average temperature calculated for the numerical solution (total) when the fan was controlled by either 12 or 24 nodes for a one-year controlled aeration and storage simulation of 1765 Mg of maize in a 14.6x14.6 m silo beginning October 1, 2013. The fan was turned on whenever the ambient air temperature was cooler than the average temperature of either the 12 or 24 nodes in the grain mass. Additionally, when the average temperature of the top layer nodes reached 0°C, the fan was turned off and sealed for the rest of the simulation period. The aeration cool-down period ended on December 23, 2013.
Figure 10.
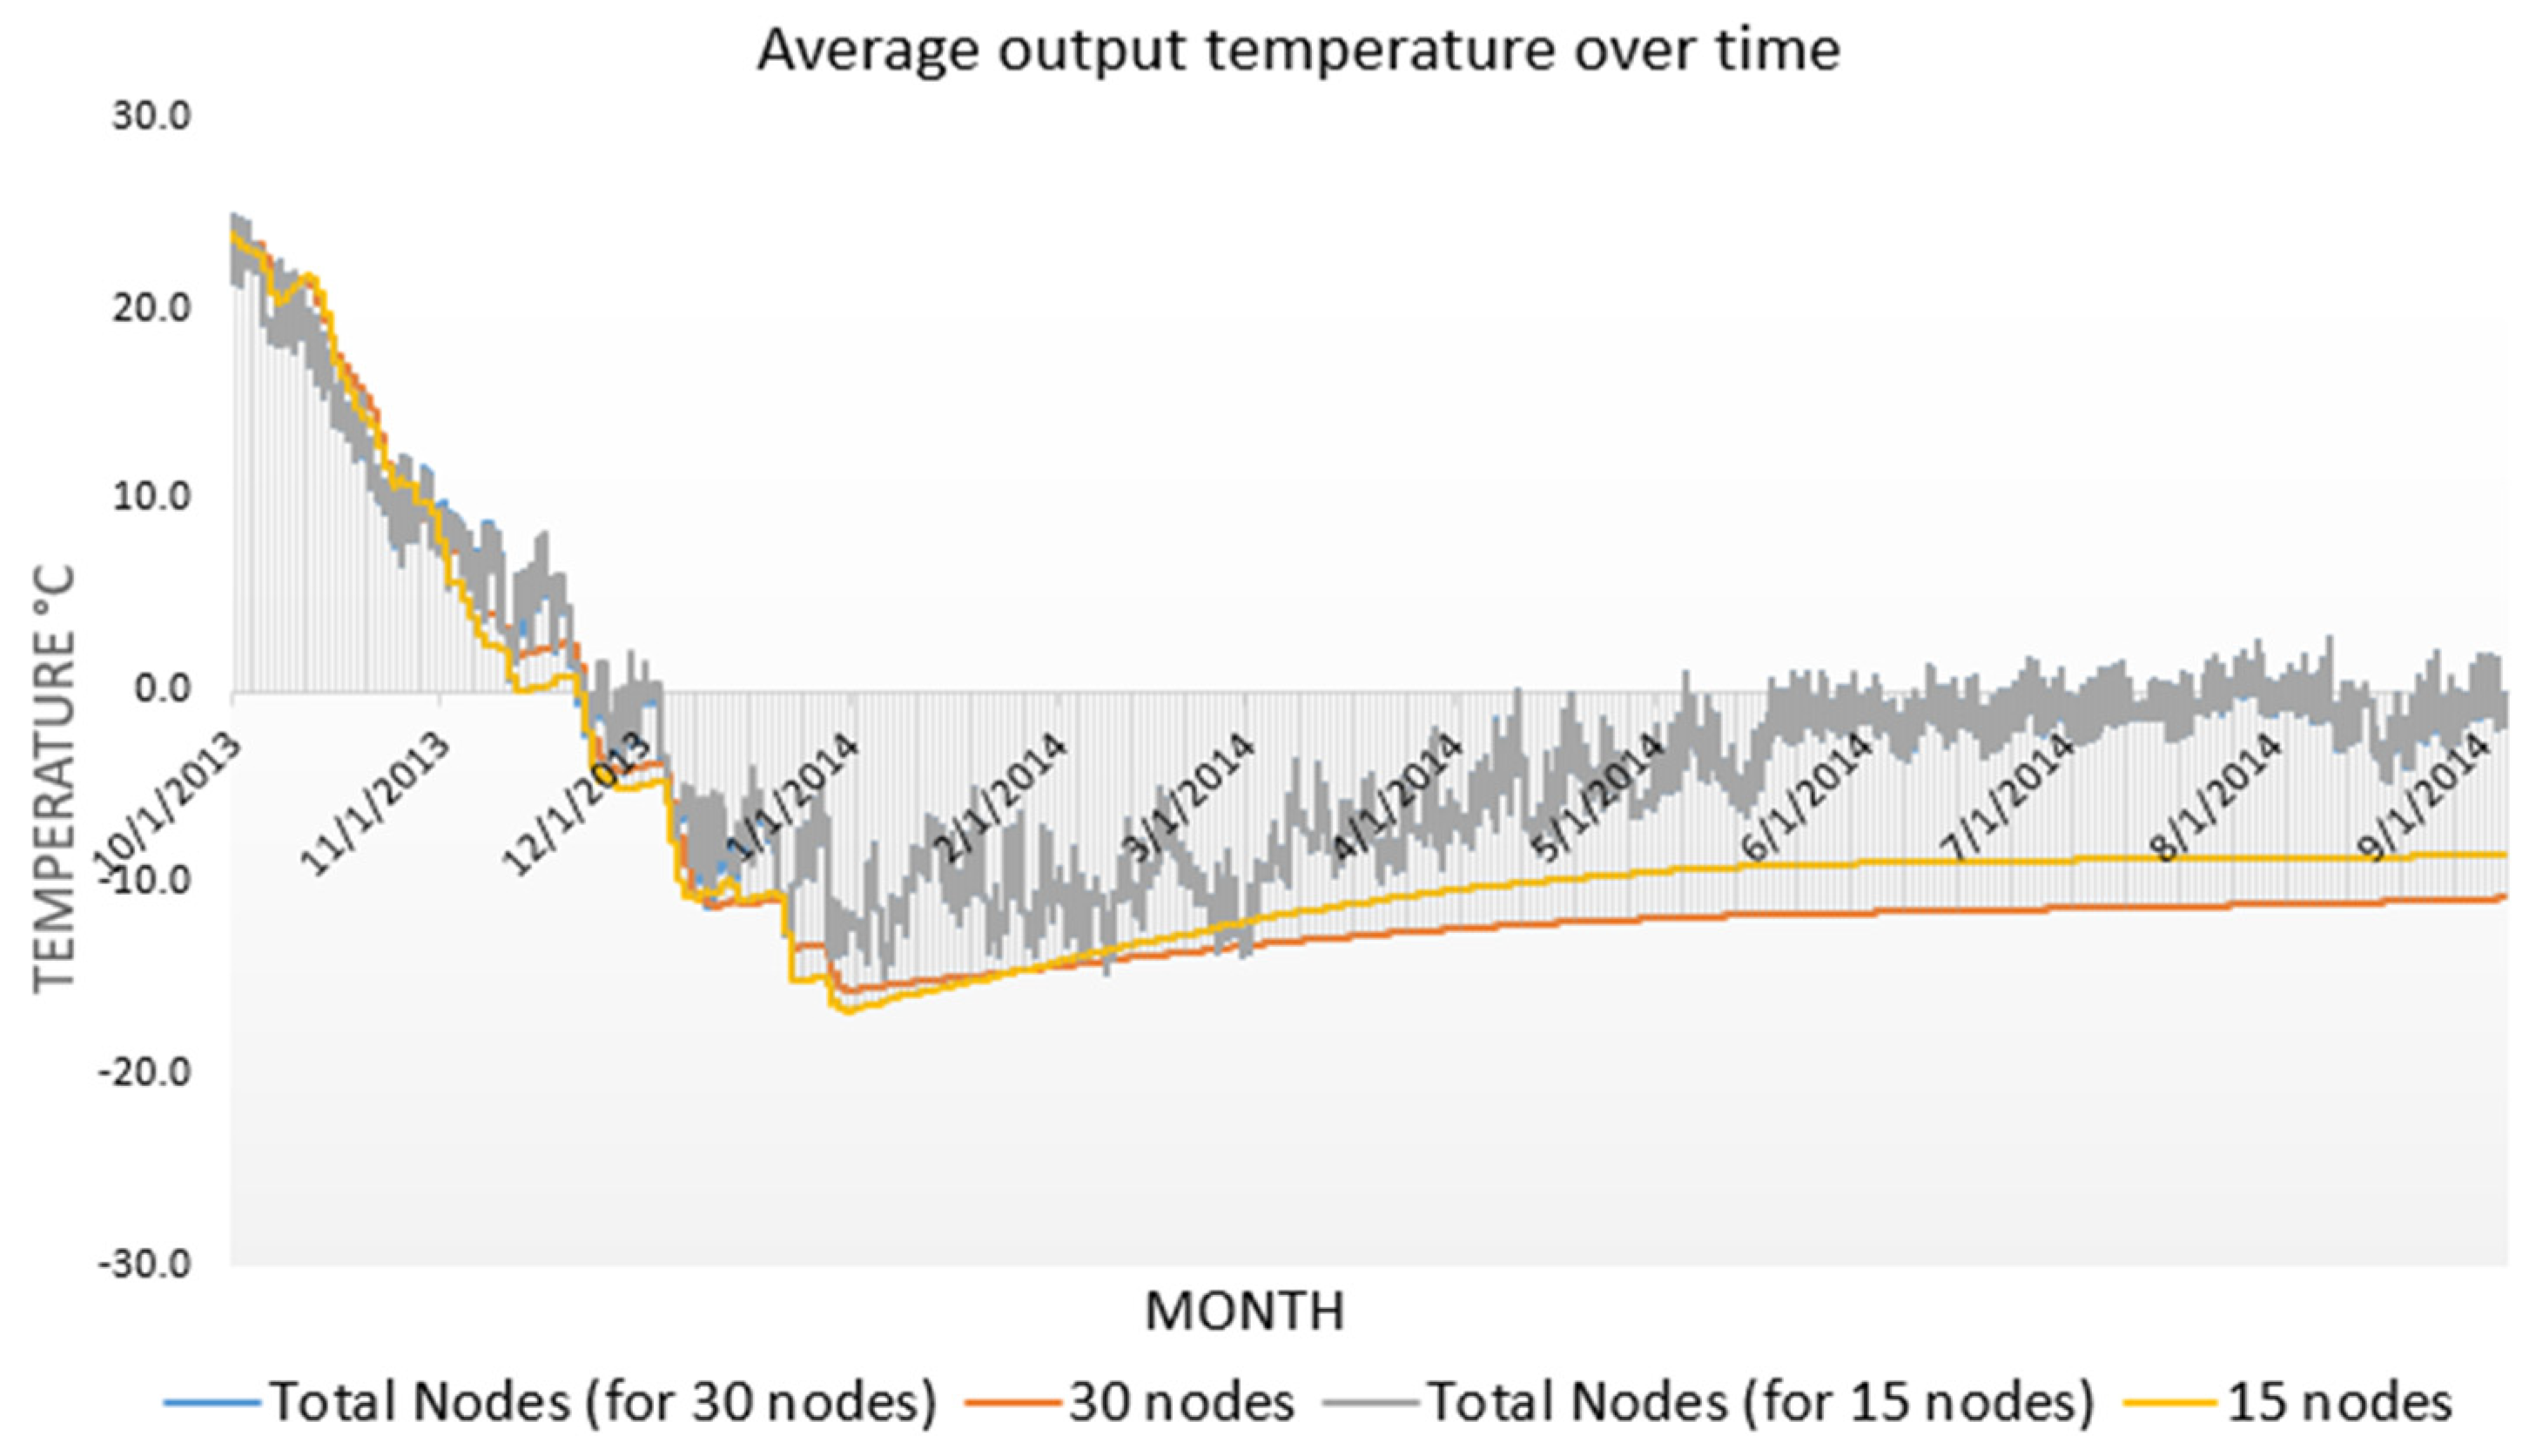
Average temperature values for 15 and 30 nodes versus the average temperature calculated for the numerical solution (total) when the fan was controlled by either 12 or 24 nodes for a one-year controlled aeration and storage simulation of 2206 Mg of maize in a 14.6x18.3 m silo beginning October 1, 2013. The fan was turned on whenever the ambient air temperature was cooler than the average temperature of either the 15 or 30 nodes in the grain mass. Additionally, when the average temperature of the top layer nodes reached 0°C, the fan was turned off and sealed for the rest of the simulation periods. The aeration cool-down period ended on December 23, 2013.
Figure 11.
Average temperature values for 15 and 30 nodes versus the average temperature calculated for the numerical solution (total) when the fan was controlled by either 15 or 30 nodes for a one-year controlled aeration and storage simulation of 745 Mg of maize in a 11x11 m silo beginning October 1, 2013. The fan was turned on whenever the ambient air temperature was cooler than the average temperature of either the 15 or 30 nodes in the grain mass. Additionally, when the average temperature of the top layer nodes reached -3°C, the fan was turned off and sealed for the rest of the simulation period. The aeration cool-down period ended on December 14, 2013.
Figure 12.
Average temperature values for 15 and 30 nodes versus the average temperature calculated for the numerical solution (total) when the fan was controlled by either 12 or 24 nodes for a one-year controlled aeration and storage simulation of 1765 Mg of maize in a 14.6x14.6 m silo beginning October 1, 2013. The fan was turned on whenever the ambient air temperature was cooler than the average temperature of either the 12 or 24 nodes in the grain mass. Additionally, when the average temperature of the top layer nodes reached -3°C, the fan was turned off and sealed for the rest of the simulation period. The aeration cool-down period ended on December 24, 2013.
Figure 13.
Average temperature values for 15 and 30 nodes versus the average temperature calculated for the numerical solution (total) when the fan was controlled by either 12 or 24 nodes for a one-year controlled aeration and storage simulation of 2206 Mg of maize in a 14.6x18.3 m silo beginning October 1, 2013. The fan was turned on whenever the ambient air temperature was cooler than the average temperature of either the 30 or 15 nodes in the grain mass. Additionally, when the average temperature of the top layer nodes reached -3°C, the fan was turned off and sealed for the rest of the simulation periods. The aeration cool-down period ended on January 3, 2014.
Figure 14.
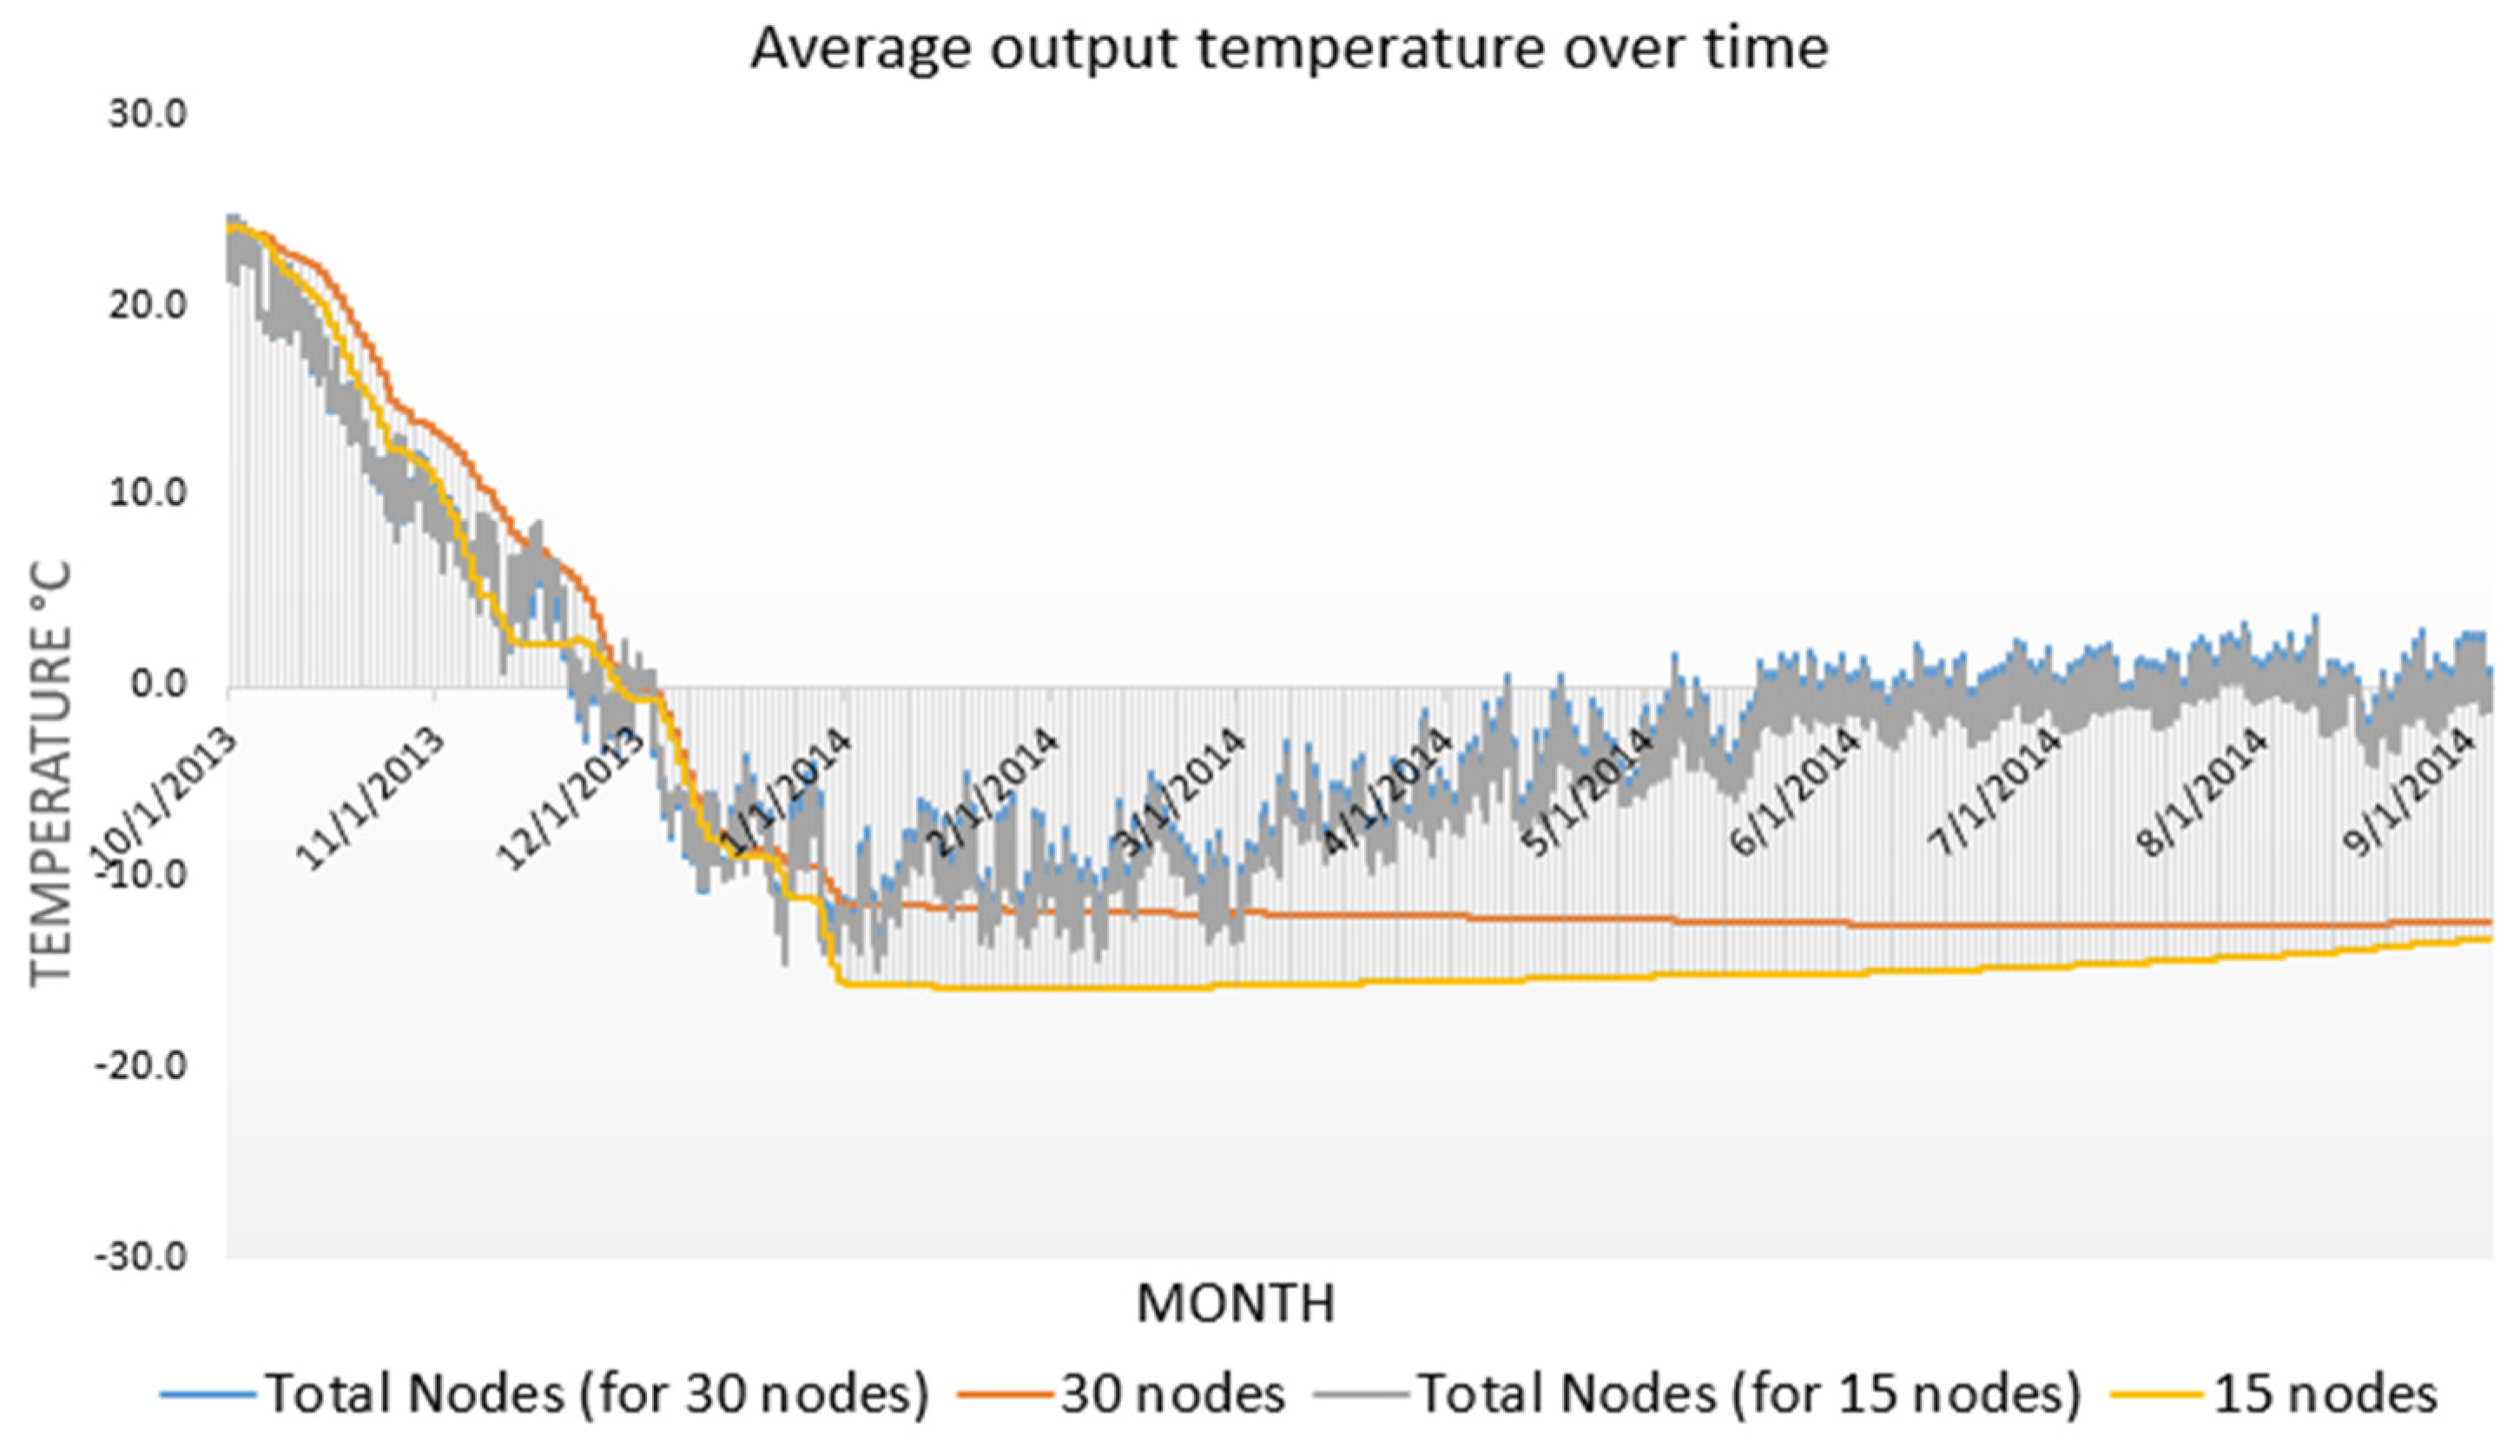
Average temperature values for 15 and 30 nodes versus the average temperature calculated for the numerical solution (total) when the fan was controlled by either 15 or 30 nodes for a one-year controlled aeration and storage simulation of 745 Mg of maize in a 11x11 m silo beginning October 1, 2013. The fan was turned on whenever the ambient air temperature was cooler than the average temperature of either the 15 or 30 nodes in the grain mass. The aeration cool-down period ended on March 3, 2014.
Figure 15.
Average temperature values for 15 and 30 nodes versus the average temperature calculated for the numerical solution (total) when the fan was controlled by either 12 or 24 nodes for a one-year controlled aeration and storage simulation of 1765 Mg of maize in a 14.6x14.6 m silo beginning October 1, 2013. The fan was turned on whenever the ambient air temperature was cooler than the average temperature of either the 12 or 24 nodes in the grain mass. The aeration cool-down period ended on March 2, 2014.
Figure 16.
Average temperature values for 15 and 30 nodes versus the average temperature calculated for the numerical solution (total) when the fan was controlled by either 12 or 24 nodes for a one-year controlled aeration and storage simulation of 2206 Mg of maize in a 14.6x18.3 m silo beginning October 1, 2013. The fan was turned on whenever the ambient air temperature was cooler than the average temperature of either the 12 or 24 nodes in the grain mass. The aeration cool-down period ended on March 2, 2014.
Table 1.
Error analysis of observed versus predicted grain temperatures of the cable-based sensor and silo mesh node pairs located at different depths within the grain mass above the perforated plenum floor and different cardinal locations.
Table 1.
Error analysis of observed versus predicted grain temperatures of the cable-based sensor and silo mesh node pairs located at different depths within the grain mass above the perforated plenum floor and different cardinal locations.
| Cable Sensor vs Node ID |
Standard Error of Estimate |
Sensor Pair Located 3.7 m above the Floor and Respective Cardinal Point: |
| |
data |
data |
| |
|
|
| M1S3 vs 1033 |
2.8 |
Center |
| M2S3 vs 814 |
3.1 |
North: 2/3 distance from center |
| M3S3 vs 795 |
3.3 |
East: 2/3 distance from center |
| M4S3 vs 815 |
3.2 |
South: 2/3 distance from center |
| M5S3 vs 797 |
3.1 |
West: 2/3 distance from center |
| M6S3 vs 956 |
3.7 |
South: 0.3 m distance from silo wall |
| |
|
Sensor pair located 2.5 m above the floor and respective cardinal point: |
| M1S2 vs 679 |
2.7 |
Center |
| M2S2 vs 618 |
2.9 |
North: 2/3 distance from center |
| M3S2 vs 637 |
3.0 |
East: 2/3 distance from center |
| M4S2 vs 619 |
2.8 |
South: 2/3 distance from center |
| M5S2 vs 620 |
3.1 |
West: 2/3 distance from center |
| M6S2 vs 602 |
3.7 |
South: 0.3 m distance from silo wall |
| |
|
Sensor pair located 1.3 m above the floor and respective cardinal point: |
| M1S1 vs 491 |
3.0 |
Center |
| M2S1 vs 283 |
3.1 |
North: 2/3 distance from center |
| M3S1 vs 346 |
3.2 |
East: 2/3 distance from center |
| M4S1 vs 338 |
2.0 |
South: 2/3 distance from center |
| M5S1 vs 344 |
2.9 |
West: 2/3 distance from center |
| M6S1 vs 425 |
3.3 |
South: 0.3 m distance from silo wall |
Table 2.
Average temperatures and standard deviations for 15 and 30 nodes versus the average temperature and standard deviations calculated for the numerical solution (total) for a three-month controlled aeration simulation of maize in a 11x11, 14.6x14.6 and 14.6x18.3 m silo beginning October 1, 2013. The fan was on during the entire period.
| |
15 Nodes |
30 Nodes |
Total Nodes |
11x11 m silo
|
Average (°C) |
4.3 |
4.8 |
4.2 |
| s.d. (°C) |
10.2 |
10.4 |
9.8 |
| |
14.6x14.6 m silo
|
Average (°C) |
2.2 |
2.4 |
4.7 |
| s.d. (°C) |
10.7 |
10.8 |
9.8 |
| |
14.6x18.3 m silo
|
Average (°C) |
2.2 |
3.5 |
4.3 |
| s.d. (°C) |
10.4 |
10.8 |
9.8 |
Table 3.
Average temperatures and standard deviations for 15 and 30 nodes versus the average temperature and standard deviations calculated for the numerical solution (total) for a nine -month controlled aeration simulation of maize in a 11x11, 14.6x14.6 and 14.6x18.3 m silo beginning January 1, 2014. The fan was off during the entire period.
| |
15 Nodes |
30 Nodes |
Total Nodes |
11x11 m silo
|
Average (°C) |
-4.7 |
-6.7 |
-0.8 |
| s.d. (°C) |
2.5 |
1.4 |
5.2 |
| |
14.6x14.6 m silo
|
Average (°C) |
-4.0 |
-5.9 |
-1.8 |
| s.d. (°C) |
3.0 |
2.6 |
4.5 |
| |
14.6x18.3 m silo
|
Average (°C) |
-4.5 |
-7.9 |
-2.8 |
| s.d. (°C) |
3.1 |
1.3 |
4.5 |
Table 4.
Average temperatures and standard deviations for 12 and 24 nodes versus the average temperature and standard deviations calculated for the numerical solution (total) for a three-month controlled aeration simulation of maize in a 14.6x14.6 and 14.6x18.3 m silo beginning October 1, 2013. The fan was on during the entire period.
| |
12 Nodes |
24 Nodes |
Total nodes |
14.6x14.6 m silo
|
Average (°C) |
4.3 |
4.7 |
-0.07 |
| s.d. (°C) |
9.9 |
9.9 |
7.01 |
14.6x18.3 m silo
|
Average (°C) |
3.9 |
4.3 |
-0.89 |
| s.d. (°C) |
9.9 |
10.1 |
7.12 |
Table 5.
Average temperatures and standard deviations for 12 and 24 nodes versus the average temperature and standard deviations calculated for the numerical solution (total) for a nine-month storage period simulation of maize in 14.6x14.6 and 14.6x18.3 m silos beginning January 1, 2014. The fan was off during the entire period.
| |
12 Nodes |
24 Nodes |
Total nodes |
14.6x14.6 m silo
|
Average (°C) |
-4.0 |
-5.7 |
-1.8 |
| s.d. (°C) |
3.1 |
2.7 |
4.5 |
14.6x18.3 m silo
|
Average (°C) |
-4.4 |
-7.7 |
-2.8 |
| s.d. (°C) |
3.1 |
1.4 |
4.5 |
Table 6.
Average temperatures and standard deviations for 15 and 30 nodes versus the average temperatures and standard deviations calculated for the numerical solution (total). The fan was controlled by either 15 or 30 nodes for a two-month (October 1 to November 21, 2013) controlled aeration simulation of 745 MT of maize in a 11x11 m silo. The fan was turned on whenever the ambient air temperature was cooler than the average temperature of either the 15 or 30 nodes in the grain mass. Additionally, when the average temperature of the top layer nodes reached 0°C, the fan was turned off.
| |
Average
Temperature (oC) |
Average s.d. (oC) |
| 15 nodes |
12.6 |
6.6 |
| 30 nodes |
10.4 |
8.0 |
| Total nodes (15 nodes controlled the fan) |
11.4 |
6.4 |
| Total nodes (30 nodes controlled the fan) |
9.9 |
7.4 |
Table 7.
Average temperatures and standard deviations for 15 and 30 nodes versus the average temperatures and standard deviations calculated for the numerical solution (total). The fan was controlled by either 12 or 24 nodes for a three-month (October 1 to December 23, 2013) controlled aeration simulation of 1765 Mg of maize in a 14.6x14.6 m silo. The fan was turned on whenever the ambient air temperature was cooler than the average temperature of either the 12 or 24 nodes in the grain mass. Additionally, when the average temperature of the top layer nodes reached 0°C, the fan was turned off.
| |
Average
Temperature (oC) |
Average s.d. (oC) |
| 15 nodes |
6.5 |
10.4 |
| 30 nodes |
7.5 |
10.8 |
| Total nodes (12 nodes controlled the fan) |
5.6 |
9.8 |
| Total nodes (24 nodes controlled the fan) |
5.3 |
9.8 |
Table 8.
Average temperatures and standard deviations for 15 and 30 nodes versus the average temperatures and standard deviations calculated for the numerical solution (total). The fan was controlled by either 12 or 24 nodes for a three-months (October 1 to December 23, 2013) controlled aeration simulation of 2206 Mg of maize in a 14.6x18.3 m silo. The fan was turned on whenever the ambient air temperature was cooler than the average temperature of either the 12 or 24 nodes in the grain mass. Additionally, when the average temperature of the top layer nodes reached 0°C, the fan was turned off.
| |
Average
Temperature (oC) |
Average s.d. (oC) |
| 15 nodes |
3.9 |
11.4 |
| 30 nodes |
3.4 |
11.6 |
| Total nodes (12 nodes controlled the fan) |
5.1 |
9.7 |
| Total nodes (24 nodes controlled the fan) |
4.9 |
9.8 |
Table 9.
Average temperatures and standard deviations for 15 and 30 nodes versus the average temperatures and standard deviations calculated for the numerical solution (total). The fan was controlled by either 12 or 24 nodes for a three-months (October 1 to December 23, 2013) controlled aeration simulation of 2206 Mg of maize in a 14.6x18.3 m silo. The fan was turned on whenever the ambient air temperature was cooler than the average temperature of either the 12 or 24 nodes in the grain mass. Additionally, when the average temperature of the top layer nodes reached 0°C, the fan was turned off.
| |
Average
Temperature (oC) |
Average s.d. (oC) |
| 15 nodes |
5.3 |
2.1 |
| 30 nodes |
1.6 |
1.7 |
| Total nodes (15 nodes controlled the fan) |
4.7 |
4.7 |
| Total nodes (30 nodes controlled the fan) |
3.7 |
5.0 |
Table 10.
Average temperatures and standard deviations for 15 and 30 nodes versus the average temperatures and standard deviations calculated for the numerical solution (total). The fan was controlled by either 12 or 24 nodes for a three-months (October 1 to December 23, 2013) controlled aeration simulation of 2206 Mg of maize in a 14.6x18.3 m silo. The fan was turned on whenever the ambient air temperature was cooler than the average temperature of either the 12 or 24 nodes in the grain mass. Additionally, when the average temperature of the top layer nodes reached 0°C, the fan was turned off.
| |
Average
Temperature (oC) |
Average s.d. (oC) |
| 15 nodes |
-8.4 |
0.7 |
| 30 nodes |
-8.2 |
1.3 |
| Total nodes (12 nodes controlled the fan) |
-3.2 |
4.7 |
| Total nodes (24 nodes controlled the fan) |
-2.3 |
4.6 |
Table 11.
Average temperatures and standard deviations for 15 and 30 nodes versus the average temperatures and standard deviations calculated for the numerical solution (total). The fan was controlled by either 12 or 24 nodes for a three-months (October 1 to December 23, 2013) controlled aeration simulation of 2206 Mg of maize in a 14.6x18.3 m silo. The fan was turned on whenever the ambient air temperature was cooler than the average temperature of either the 12 or 24 nodes in the grain mass. Additionally, when the average temperature of the top layer nodes reached 0°C, the fan was turned off.
| |
Average
Temperature (oC) |
Average s.d. (oC) |
| 15 nodes |
-9.5 |
1.8 |
| 30 nodes |
-9.0 |
2.3 |
| Total nodes (12 nodes controlled the fan) |
-4.4 |
4.7 |
| Total nodes (24 nodes controlled the fan) |
-3.3 |
4.6 |
Table 14.
Average temperatures and standard deviations for 15 and 30 nodes versus the average temperatures and standard deviations calculated for the numerical solution (total). The fan was controlled by either 15 or 30 nodes for an aeration simulation of 745 Mg of maize in a 11x11 m silo beginning October 1, 2013. The fan was turned on whenever the ambient air temperature was cooler than the average temperature of either the 15 or 30 nodes in the grain mass. Additionally, when the average temperature of the top layer nodes reached -3°C, the fan was turned off.
| |
Average
Temperature (oC) |
Average s.d. (oC) |
| 15 nodes |
12.3 |
6.8 |
| 30 nodes |
6.8 |
9.8 |
| Total nodes (15 nodes controlled the fan) |
11.0 |
6.7 |
| Total nodes (30 nodes controlled the fan) |
6.5 |
9.2 |
Table 15.
Average temperatures and standard deviations for 15 and 30 nodes versus the average temperatures and standard deviations calculated for the numerical solution (total). The fan was controlled by either 12 or 24 nodes for an aeration simulation of 1765 Mg of maize in a 14.6x14.6 m silo beginning October 1, 2013. The fan was turned on whenever the ambient air temperature was cooler than the average temperature of either the 12 or 24 nodes in the grain mass. Additionally, when the average temperature of the top layer nodes reached -3°C, the fan was turned off.
| |
Average
Temperature (oC) |
Average s.d. (oC) |
| 15 nodes |
6.3 |
10.5 |
| 30 nodes |
6.1 |
11.4 |
| Total nodes (12 nodes controlled the fan) |
5.3 |
9.9 |
| Total nodes (24 nodes controlled the fan) |
4.2 |
10.2 |
Table 16.
Average temperatures and standard deviations for 15 and 30 nodes versus the average temperatures and standard deviations calculated for the numerical solution (total). The fan was controlled by either 12 or 24 nodes for an aeration simulation of 2206 Mg of maize in a 14.6x18.3 m silo beginning October 1, 2013. The fan was turned on whenever the ambient air temperature was cooler than the average temperature of either the 12 or 24 nodes in the grain mass. Additionally, when the average temperature of the top layer nodes reached -3°C, the fan was turned off.
| |
Average
Temperature (oC) |
Average s.d. (oC) |
| 15 nodes |
1.9 |
12.3 |
| 30 nodes |
1.2 |
12.5 |
| Total nodes (12 nodes controlled the fan) |
3.5 |
10.3 |
| Total nodes (24 nodes controlled the fan) |
3.1 |
10.6 |
Table 17.
Average temperatures and standard deviations for 15 and 30 nodes versus the average temperatures and standard deviations calculated for the numerical solution (total). The fan was turned off and sealed from December 14, 2013 to September 30, 2014 for 745 Mg of maize stored in a 11x11 m silo.
| |
Average
Temperature (oC) |
Average s.d. (oC) |
| 15 nodes |
4.2 |
1.9 |
| 30 nodes |
-5.6 |
2.4 |
| Total nodes (15 nodes controlled the fan) |
3.6 |
5.1 |
| Total nodes (30 nodes controlled the fan) |
-0.5 |
5.4 |
Table 18.
Average temperatures and standard deviations for 15 and 30 nodes versus the average temperatures and standard deviations calculated for the numerical solution (total). The fan was turned off and sealed from December 24, 2013 to September 30, 2014 for 1765 Mg of maize stored in a 14.6x14.6 m silo.
| |
Average
Temperature (oC) |
Average s.d. (oC) |
| 15 nodes |
-14.9 |
0.9 |
| 30 nodes |
-12.1 |
0.5 |
| Total nodes (12 nodes controlled the fan) |
-4.5 |
4.5 |
| Total nodes (24 nodes controlled the fan) |
-3.9 |
4.4 |
Table 19.
Average temperatures and standard deviations for 15 and 30 nodes versus the average temperatures and standard deviations calculated for the numerical solution (total). The fan was turned off and sealed from December 24, 2013 to September 30, 2014 for 1765 Mg of maize stored in a 14.6x14.6 m silo.
| |
Average
Temperature (oC) |
Average s.d. (oC) |
| 15 nodes |
-10.5 |
2.3 |
| 30 nodes |
-12.3 |
1.3 |
| Total nodes (12 nodes controlled the fan) |
-4.6 |
4.3 |
| Total nodes (24 nodes controlled the fan) |
-4.6 |
4.3 |
Table 20.
Average temperatures and standard deviations for 12 and 24 nodes versus the average temperatures and standard deviations calculated for the numerical solution (total). The fan was controlled by either 12 or 24 nodes in the case of 14.6x14.6 and 14.6x18.3 m silos beginning October 1, 2013. The period from October 1 to December 24, 2013 was considered the cool down period in the case of the 14.6x14.6 m and from October 1, 2013 to January 3, 2014 in the case of the 14.6x18.3 m silo. The fan was turned on whenever the ambient air temperature was cooler than the average temperature of either the 12 or 24 nodes in the grain mass. Additionally, when the average temperature of the top layer nodes reached -3°C, the fan was turned off.
| |
14.6x14.6 m silo |
14.6x18.3 m silo |
| |
Average
Temperature (oC) |
Average s.d.
(oC) |
Average
Temperature (oC) |
Average s.d.
(oC) |
| 12 nodes |
6.3 |
10.2 |
2.8 |
11.4 |
| 24 nodes |
6.3 |
11.0 |
2.6 |
12.0 |
| Total nodes (12 nodes controlled the fan) |
5.3 |
9.9 |
3.5 |
10.3 |
| Total nodes (24 nodes controlled the fan) |
4.2 |
10.2 |
3.1 |
10.6 |
Table 21.
Average temperatures and standard deviations for 12 and 24 nodes versus the average temperatures and standard deviations calculated for the numerical solution (total). The fan was turned off and sealed from December 24, 2013 to September 30, 2014 in the case of the 14.6x14.6 silo m and from January 3, 2013 to September 30, 2014 in the case of the 14.6 x 18.3 m silo.
| |
14.6x14.6 m silo |
14.6x18.3 m silo |
| |
Average
Temperature (oC) |
Average s.d.
(oC) |
Average
Temperature (oC) |
Average s.d.
(oC) |
| 12 nodes |
-13.5 |
0.8 |
-8.4 |
2.1 |
| 24 nodes |
-11.6 |
0.3 |
-11.2 |
1.3 |
| Total nodes (12 nodes controlled the fan) |
-4.5 |
4.5 |
-4.6 |
4.3 |
| Total nodes (24 nodes controlled the fan) |
-3.9 |
4.4 |
-4.6 |
4.3 |
Table 22.
Average temperatures and standard deviations for 15 and 30 nodes versus the average temperatures and standard deviations calculated for the numerical solution (total). The fan was controlled by either 15 or 30 nodes in the case of 11x11 m silo and 12 or 24 in the case of 14.6x14.6 and 14.6x18.3 silo beginning October 1, 2013. The period from October 1, 2013 to March 3, 2014 was considered the cool down period in the case of the 11x11 m silo and from October 1, 2013 to March 2, 2014 in the case of the 14.6x14.6 and 14.6x18.3 silos.
| |
11x11 m silo |
| |
Average
Temperature (oC) |
Average s.d. (oC) |
| 15 nodes |
4.2 |
11.2 |
| 30 nodes |
3.8 |
11.3 |
| Total nodes (15 nodes controlled the fan) |
3.6 |
10.3 |
| Total nodes (30 nodes controlled the fan) |
3.8 |
10.3 |
| |
14.6x14.6 m silo |
| 15 nodes |
4.3 |
11.3 |
| 30 nodes |
6.8 |
11.5 |
| Total nodes (12 nodes controlled the fan) |
4.0 |
10.4 |
| Total nodes (24 nodes controlled the fan) |
4.0 |
10.3 |
| |
14.6x18.3 m silo |
| 15 nodes |
2.1 |
12.2 |
| 30 nodes |
2.9 |
12.1 |
| Total nodes (12 nodes controlled the fan) |
3.8 |
10.2 |
| Total nodes (24 nodes controlled the fan) |
3.6 |
10.3 |
Table 23.
Average temperatures and standard deviations for 15 and 30 nodes versus the average temperatures and standard deviations calculated for the numerical solution (total). The fan was controlled by either 15 or 30 nodes in the case of 11x11 m silo and 12 or 24 in the case of 14.6x14.6 and 14.6x18.3 silo beginning October 1, 2013. The period from March 3, 2014 to September 30, 2014 was considered the storage period in the case of the 11x11 m silo and from March 2, 2014 to September 30, 2014 in the case of the 14.6x14.6 and 14.6x18.3 silos.
| |
11x11 m silo |
| |
Average
Temperature (oC) |
Average s.d. (oC) |
| 15 nodes |
-14.8 |
1.1 |
| 30 nodes |
-16.4 |
1.1 |
| Total nodes (15 nodes controlled the fan) |
-6.0 |
5.1 |
| Total nodes (30 nodes controlled the fan) |
-6.3 |
5.1 |
| |
14.6x14.6 m silo |
| 15 nodes |
-19.5 |
0.9 |
| 30 nodes |
-18.1 |
1.4 |
| Total nodes (12 nodes controlled the fan) |
-7.3 |
4.4 |
| Total nodes (24 nodes controlled the fan) |
-7.3 |
4.4 |
| |
14.6x18.3 m silo |
| 15 nodes |
-19.5 |
0.9 |
| 30 nodes |
-18.1 |
1.4 |
| Total nodes (12 nodes controlled the fan) |
-7.3 |
4.4 |
| Total nodes (24 nodes controlled the fan) |
-7.3 |
4.4 |
Table 24.
Average temperatures and standard deviations for 12 and 24 nodes versus the average temperatures and standard deviations calculated for the numerical solution (total). The fan was controlled by either 12 or 24 nodes in the case of 14.6x14.6 and 14.6x18.3 silos beginning October 1, 2013. The period from October 1, 2013 to March 2, 2014 was considered the cool down period.
| |
14.6x14.6 m silo |
14.6x18.3 m silo |
| |
Average
Temperature (oC) |
Average s.d.
(oC) |
Average
Temperature (oC) |
Average s.d.
(oC) |
| 12 nodes |
4.9 |
10.8 |
3.0 |
11.3 |
| 24 nodes |
6.2 |
11.1 |
3.1 |
11.8 |
| Total nodes (12 nodes controlled the fan) |
4.0 |
10.4 |
3.8 |
10.2 |
| Total nodes (24 nodes controlled the fan) |
4.0 |
10.3 |
3.6 |
10.3 |
Table 25.
Average temperatures and standard deviations for 12 and 24 nodes versus the average temperatures and standard deviations calculated for the numerical solution (total). The fan was controlled by 12 or 24 nodes in 14.6x14.6 and 14.6x18.3 silos beginning October 1, 2013. The period from March 2, 2014 to September 30, 2014 was considered the storage period.
| |
14.6x14.6 m silo |
14.6x18.3 m silo |
| |
Average
Temperature (oC) |
Average s.d.
(oC) |
Average
Temperature (oC) |
Average s.d.
(oC) |
| 12 nodes |
-18.5 |
1.1 |
-17.7 |
1.6 |
| 24 nodes |
-17.0 |
1.2 |
-18.5 |
1.4 |
| Total nodes (12 nodes controlled the fan) |
-7.3 |
4.4 |
-8.3 |
4.3 |
| Total nodes (24 nodes controlled the fan) |
-7.3 |
4.4 |
-8.3 |
4.3 |
Table 26.
Average temperatures and standard deviations for 15 and 30 nodes versus the average temperatures and standard deviations calculated for the numerical solution (total) for a one-year controlled aeration and storage simulation of 745 Mg of maize in a 11x11 m silo beginning October 1, 2013 for four sets of simulation runs. The number of hours the fan operated are included in the last column.
| |
Average
Temperature (oC) |
Average s.d. (oC) |
Fan run hours |
| Simulation Set 1 |
| 15 nodes |
-2.27 |
7.01 |
|
| 30 nodes |
-3.59 |
7.58 |
|
| Total Nodes (1968) |
0.54 |
7.12 |
2208 |
| Simulation Set 2 |
| 15 nodes |
6.2 |
4.2 |
|
| 30 nodes |
3.1 |
4.9 |
|
| Total nodes (15 nodes controlled the fan) |
5.2 |
5.4 |
977 |
| Total nodes (30 nodes controlled the fan) |
4.8 |
6.0 |
974 |
| Simulation Set 3 |
| 15 nodes |
5.5 |
4.4 |
|
| 30 nodes |
-2.9 |
7.2 |
|
| Total nodes (15 nodes controlled the fan) |
4.7 |
6.0 |
1016 |
| Total nodes (30 nodes controlled the fan) |
1.0 |
7.0 |
1192 |
| Simulation Set 4 |
| 15 nodes |
-9.6 |
10.3 |
|
| 30 nodes |
-10.9 |
10.9 |
|
| Total nodes (15 nodes controlled the fan) |
-3.4 |
8.1 |
1952 |
| Total nodes (30 nodes controlled the fan) |
-3.5 |
8.2 |
1596 |
Table 27.
Average temperatures and standard deviations for 15 and 30 nodes versus the average temperatures and standard deviations calculated for the numerical solution (total) for a one-year controlled aeration and storage simulation of 1765 Mg of maize in a 14.6x14.6 m silo beginning October 1, 2013 for four sets of simulation runs. The number of hours the fan operated are included in the last column.
| |
Average
Temperature (oC) |
Average s.d. (oC) |
Fan run hours |
| Simulation Set 1 |
| 15 nodes |
-2.4 |
6.8 |
|
| 30 nodes |
-3.6 |
7.1 |
|
| Total Nodes (1968) |
-0.07 |
7.0 |
2208 |
| Simulation Set 2 |
| 15 nodes |
-4.7 |
8.3 |
|
| 30 nodes |
-4.3 |
8.7 |
|
| Total nodes (12 nodes controlled the fan) |
-1.1 |
7.4 |
1411 |
| Total nodes (24 nodes controlled the fan) |
-0.4 |
7.1 |
1478 |
| Simulation Set 3 |
| 15 nodes |
-9.6 |
10.6 |
|
| 30 nodes |
-7.0
|
10.4
|
|
| Total nodes (12 nodes controlled the fan) |
-2.1 |
7.6 |
1543 |
| Total nodes (24 nodes controlled the fan) |
-1.7 |
7.4 |
1590 |
| Simulation Set 4 |
| 15 nodes |
-12.9 |
12.3 |
|
| 30 nodes |
-11.4 |
12.7 |
|
| Total nodes (12 nodes controlled the fan) |
-4.2 |
8.3 |
1909 |
| Total nodes (24 nodes controlled the fan) |
-4.2 |
8.2 |
2058 |
Table 28.
Average temperatures and standard deviations for 15 and 30 nodes versus the average temperatures and standard deviations calculated for the numerical solution (total) for a one-year controlled aeration and storage simulation of 2206 Mg of maize in a 14.6x18.3 m silo beginning October 1, 2013 for four sets of simulation runs. The number of hours the fan operated are included in the last column.
| |
Average
Temperature (oC) |
Average s.d. (oC) |
Fan run hours |
| Simulation Set 1 |
| 15 nodes |
-2.7 |
6.7 |
|
| 30 nodes |
-4.8 |
7.6 |
|
| Total Nodes (1968) |
-0.89 |
7.1 |
2208 |
| Simulation Set 2 |
| 15 nodes |
-6.2 |
8.2 |
|
| 30 nodes |
-5.9 |
8.1 |
|
| Total nodes (12 nodes controlled the fan) |
-2.1 |
7.5 |
1217 |
| Total nodes (24 nodes controlled the fan) |
-1.2 |
7.3 |
1250 |
| Simulation Set 3 |
| 15 nodes |
-7.1 |
8.7 |
|
| 30 nodes |
-8.2 |
9.3 |
|
| Total nodes (12 nodes controlled the fan) |
-2.3 |
7.5 |
1295 |
| Total nodes (24 nodes controlled the fan) |
-2.4 |
7.5 |
1322 |
| Simulation Set 4 |
| 15 nodes |
-13.8 |
11.7 |
|
| 30 nodes |
-13.1 |
11.7 |
|
| Total nodes (12 nodes controlled the fan) |
-5.0 |
8.4 |
1588 |
| Total nodes (24 nodes controlled the fan) |
-5.0 |
8.4 |
1620 |
