Preprint
Review

Co-cultivation and Matching of Early- and Late-maturing Pearl Millet Varieties to Sowing Windows can Enhance Climate-Change Adaptation in Semi-arid Sub-Saharan Agroecosystems.

Altmetrics

Downloads

133

Views

91

Comments

0

A peer-reviewed article of this preprint also exists.

Submitted:

25 July 2023

Posted:

27 July 2023

You are already at the latest version

Alerts
Abstract
In semi-arid regions, climate change has affected crop growing season length and sowing time, potentially causing low yield of the rainfed staple crop pearl millet (Pennisetum glaucum L.) and food insecurity among smallholder farmers. In this study, we used 1994–2023 rainfall data from Namibia's semi-arid North-Central Region (NCR), receiving November–April summer rainfall, to analyze rainfall patterns and trends and their implications on the growing season to propose climate adaptation options for the region. The results revealed high annual and monthly rainfall variabilities, with nonsignificant negative trends for November–February rainfalls, implying a shortening growing season. Furthermore, we determined the effects of sowing date on grain yields of the early-maturing Okashana-2 and local landrace Kantana pearl millet varieties and the optimal sowing window for the region, using data from a two-year split-plot field experiment conducted at the University of Namibia-Ogongo Campus, NCR, during the rainy season. Cubic polynomial regression models were applied to grain yield data sets to predict grain production for any sowing date between January and March. Both varieties produced the highest grain yields under January sowings, with Kantana exhibiting a higher yield potential than Okashana-2. Kantana, sown by 14 January, had a yield advantage of up to 36.0% over Okashana-2, but its yield gradually reduced with delays in sowing. Okashana-2 exhibited higher yield stability across January sowings, surpassing Kantana’s yields by up to 9.4% following the 14 January sowing. We determined the pearl millet optimal sowing window for the NCR from 1–7 and 1–21 January for Kantana and Okashana-2, respectively. These results suggest that co-cultivation of early and late pearl millet varieties and growing early-maturing varieties under delayed seasons could stabilize grain production in northern Namibia and enhance farmers' climate adaptation. Semi-arid agro-region policymakers could utilize this information to adjust local seed systems and extension strategies.
Keywords: 
Subject: Biology and Life Sciences  -   Agricultural Science and Agronomy

1. Introduction

Dryland crop production depends entirely on prevailing rainfall conditions, influenced by global and regional climatic systems. Pearl millet (Pennisetum glaucum L.) is the staple food for resource-poor smallholder farmers in arid and semi-arid regions of sub-Saharan Africa (SSA) and South Asia (Kumara Charyulu et al., 2014; Porter et al., 2014). The crop is grown under marginal soil and rainfed conditions without supplemental fertilizer and irrigation inputs (Ausiku et al., 2020). However, its productivity level in SSA is much lower than in other regions (FAOSTAT, 2022); thus, SSA continues to suffer from poverty and food insecurity (Awala et al., 2016; Rockström et al., 2007). Recent demographic projections suggest that to feed the growing population, global agricultural production needs to increase by 60 to 100% by 2050; thus, in SSA, such production level requires investment in agriculture (Thornton et al., 2011). On the other hand, recent climate-change impact trends suggest that major cereal crop production in SSA could decrease by some 20% by mid-century (Azare et al., 2020; Boansi, 2017; Macauley & Ramadjita, 2015). Therefore, scientific research on pearl millet is needed to ensure sustainable production and bolster the food security levels in arid and semi-arid SSA regions amid climate change.
Climate change affects crop growth, development, yield, and quality (Porter, 2005; Porter & Semenov, 2005), reducing food and nutritional security. The phenomenon is associated with, among others, rising temperatures (Bale et al., 2002; Cai & Cowan, 2008; Hübler et al., 2008; Lloyd & Farquhar, 2008; Mongi et al., 2010; Song et al., 2023; Vicente-Serrano et al., 2014; Zhao et al., 2014), extreme or variable precipitation events (Esfandiari & Lashkari, 2021; Hao et al., 2017; Herrera-Pantoja & Hiscock, 2015; Oliveira et al., 2017; Tabari, 2020; Traore et al., 2013; Wu et al., 2020) and reduced growing season length (Mubvuma, 2013; Roshan et al., 2014; Sarr, 2012; Yamusa et al., 2015), disrupting agroecosystem processes (Serdeczny et al., 2017). Increased temperature is triggered by the atmospheric concentration of greenhouse gases (GHGs), for example, such as carbon dioxide (CO2) and methane (CH4), leading to global warming, which can reduce the net carbon gain through increased plant respiration rates, thus decreasing crop growth and productivity (van Oort & Zwart, 2018). High temperatures decreased the yield of sweet corn (Dhaliwal & Williams, 2022) and maize (Cudjoe et al., 2021; Huang et al., 2018) but insignificantly increased millet yield (Poudel & Shaw, 2016). Simulation studies have projected that future rise in temperatures would reduce yields in wheat and maize (Cammarano et al., 2016), rice (van Oort & Zwart, 2018), and maize, soya beans, dry beans, and sunflower (Kucharik & Serbin, 2008; Olabanji et al., 2021). Petersen (2019) projected that warming temperatures will significantly decrease corn and soybean yields but will not strongly influence rice.
Extreme rainfall events mainly affect crop performance in two ways, via drought or the lack of rainfall and through flood or too much rainfall. Both drought and flood are detrimental to most crop plants (Awala et al., 2016, 2019); they deprive plants of water or oxygen, decreasing leaf photosynthesis, transpiration, stomatal conductance, and water potential, thus suppressing growth and reducing productivity (Akhtar & Nazir, 2013; Barber & Müller, 2021; Jaiphong et al., 2016; McCarthy et al., 2021). However, in semi-arid regions, droughts are more common than floods (Awala, 2017). A study conducted by Mongi et al. (2010) in Tanzania showed declining rainfall trends with variable spatiotemporal distributions and increased duration and frequencies of intra-seasonal dry spells. However, other studies have projected positive correlations of maize yields with rainfall (Bello et al., 2020; Cudjoe et al., 2021; Traore et al., 2013).
Due to increased temperature projections, the length of growing seasons under future climate scenarios is expected to decline (Cook & Vizy, 2012; Pathak & Stoddard, 2018), accelerating crop maturity, thereby reducing plant biomass accumulation and total productivity (Yoon & Choi, 2020). In Tanzania, Kihupi et al. (2015) observed decreasing trends in the growing season length of the growing season and number of wet days as rainfall onset was delayed more recently than in the past. In Angola and the southern Congo basin, reductions in austral spring growing season days were associated with reduced precipitation and increased evapotranspiration (Cook & Vizy, 2012). However, Mupangwa et al. (2011) analyzed the end and start of the growing season in southern Zimbabwe but found no significant changes in the length of the growing seasons over the past 50–74 years.
Semi-arid and arid regions worldwide are most vulnerable to the effects of climate change (Connolly-Boutin & Smit, 2016; De Souza et al., 2015; Herrera-Pantoja & Hiscock, 2015; Herslund et al., 2016; Ramin & McMichael, 2009; Vicuña et al., 2012; Zhou et al., 2022). Namibia, a semi-arid SSA country where pearl millet is the staple food, has been affected by food insecurity since independence in 1990 (Awala et al., 2023; FAO et al., 2019; FSIN, 2020). The country is characterized by low and erratic rainfall, intense heat, and a high evapotranspiration rate (Heyns, 1991). The average annual rainfall for Namibia is 250 mm, but most rainfall is received in northern areas, which constitute Namibia’s major crop-growing zone (Awala et al., 2019; Mendelsohn et al., 2002). The North-Central Region (NCR), the country’s most densely populated area, is projected to experience a high increase in population, adding 85 860 more people by 2031 (Namibia Statistics Agency, 2014). Most inhabitants in the NCR are resource-poor subsistence farmers whose livelihoods mainly depend on agriculture (Awala et al., 2019; Mendelsohn & Firm, 2006).
In the NCR, most farming households cultivate crops, and pearl millet is the dominant crop in the local agroecosystem, primarily cultivated for its grain production for food (Matanyaire, 1996; Namibia Statistics Agency, 2013). Recent simulation studies revealed that, besides addressing the food security problem, millets can reduce the impact of agriculture on global warming since they release less greenhouse gases than other cereals (Wang et al., 2018). In the NCR, the pearl millet is cultivated under rainfed conditions during the summer months, between November and April (Awala et al., 2019). Ordinarily, the farmers use unimproved, local landrace varieties characterized by long growth durations, late maturity, and susceptibility to end-of-season drought (Matanyaire, 1998, 1996; Monyo et al., 2002). However, some farmers have recently adopted improved varieties, which are known to be drought tolerant, early maturing, high yielding, and have more stable yields than the traditional ones (Matanyaire, 1998, 1996; Mgonja et al., 2005; Monyo et al., 2002; Uno, 2005). The farmers who prefer traditional varieties over improved ones cited that they have a better taste and longer grain storability (Matanyaire, 1998).
Rainfall patterns in the NCR are changing due to the impact of global climate change. Recently, the arrival of the first rains can delay substantially; also, rainfall can cease abruptly before the typical ending of the growing season, potentially shortening the growing season length and affecting crop performance. The local rainfall is generally characterized by irregular rainfall events of variable amounts and intensity, resulting in inter-annual droughts, floods, or intra-season dry spells, consequently causing low crop yields or even complete crop failures (Awala et al., 2019, 2023). In other regions, farmers have perceived decreasing rainfall amounts, rising temperatures, and shortening of growing seasons’ length over the years, causing prolonged droughts, uneven rainfall distributions, and unpredictable onset and ending of rains, thus reducing agricultural productivity, food security, and income (Dhanya & Ramachandran, 2016; Kangalawe & Lyimo, 2013; Mongi et al., 2010). Therefore, the performance of traditional pearl millet varieties used in the NCR may be affected by new, climate change-induced growth conditions (Awala et al., 2019), which affect yields. Analysis of data from the FAOSTAT (2022) database revealed that the average pearl millet yield in Namibia for the past 10 years (2012–2021) was as low as 0.226 t/ha, three times lower than the SSA average yield of 0.758 t/ha and nearly six times lower than the South Asia average yield of 1.328 t/ha.
Various studies have shown that the growing season length and crop varieties of different maturity groups react differently to sowing dates. Studies by Nwajei et al. (2019) and Nwajei (2023) demonstrated that pearl millet varieties respond differently to sowing dates, and the early-sown crop has higher nutrient uptake, growth, and grain yield than the late-sown one. So far, agronomic information elucidating the yield potential of traditional pearl millet varieties relative to their improved counterparts across the growing season has yet to be established for the NCR. As such, during the growing season, local farmers tend to sow any pearl millet variety based on their wishes, seed availability, or soil moisture (rainfall conditions), regardless of the onset of the growing season, which can be early, normal, or late.
Farmers and scientists across the globe have proposed or developed various climate-change adaptation strategies, including adaptive cropping systems (Awala et al., 2016; Hirooka et al., 2019; Iijima et al., 2018), investment in low-cost irrigation for supplemental irrigation (Boansi, 2017), effective fertilization (Ausiku et al., 2020; Jha et al., 2016; Siyambango et al., 2022), adoption of newly adaptive crop varieties (Wang et al., 2018) and application of tied ridges with fertilizer micro-dosing (Silungwe et al., 2019). Adaptation strategies also entail growing drought-tolerant and early maturing crop varieties, increasing wetlands cultivation, water harvesting for small-scale irrigation, and livestock keeping (Dhanya & Ramachandran, 2016; Kangalawe & Lyimo, 2013). Some studies conducted in semi-arid regions highlight that sowing directly after the first rains poses a higher risk of water stress, hindering crop performance due to inadequate build-up of soil water reserve to overcome subsequent post-onset growing season dry spells (Agoungbome et al., 2023; Marteau et al., 2011). In contrast, other studies show that early planting gives high yields (Dera et al., 2014; Detroja et al., 2018). In Nigeria, a traditional pearl millet variety Gero Badeggi (Omoregie et al., 2020), produced 9.33 t/ha of grain under early sowing (Nwajei et al., 2019). It is, therefore, crucial to establish the optimal sowing window of common pearl millet varieties for the NCR to optimize production resources and increase grain production among local farming communities in the face of climate change.
Therefore, the objectives of this study were to i) analyze rainfall patterns and trends and their implications on the growing season, ii) evaluate the grain yield dynamics of Namibia’s popular pearl millet varieties under different sowing dates, and iii) determine the optimal sowing window for the semi-arid NCR to propose climate-smart adaptation options for smallholder farming households in northern Namibia.

2. Materials and Methods

2.1. Study Location and Environmental Conditions
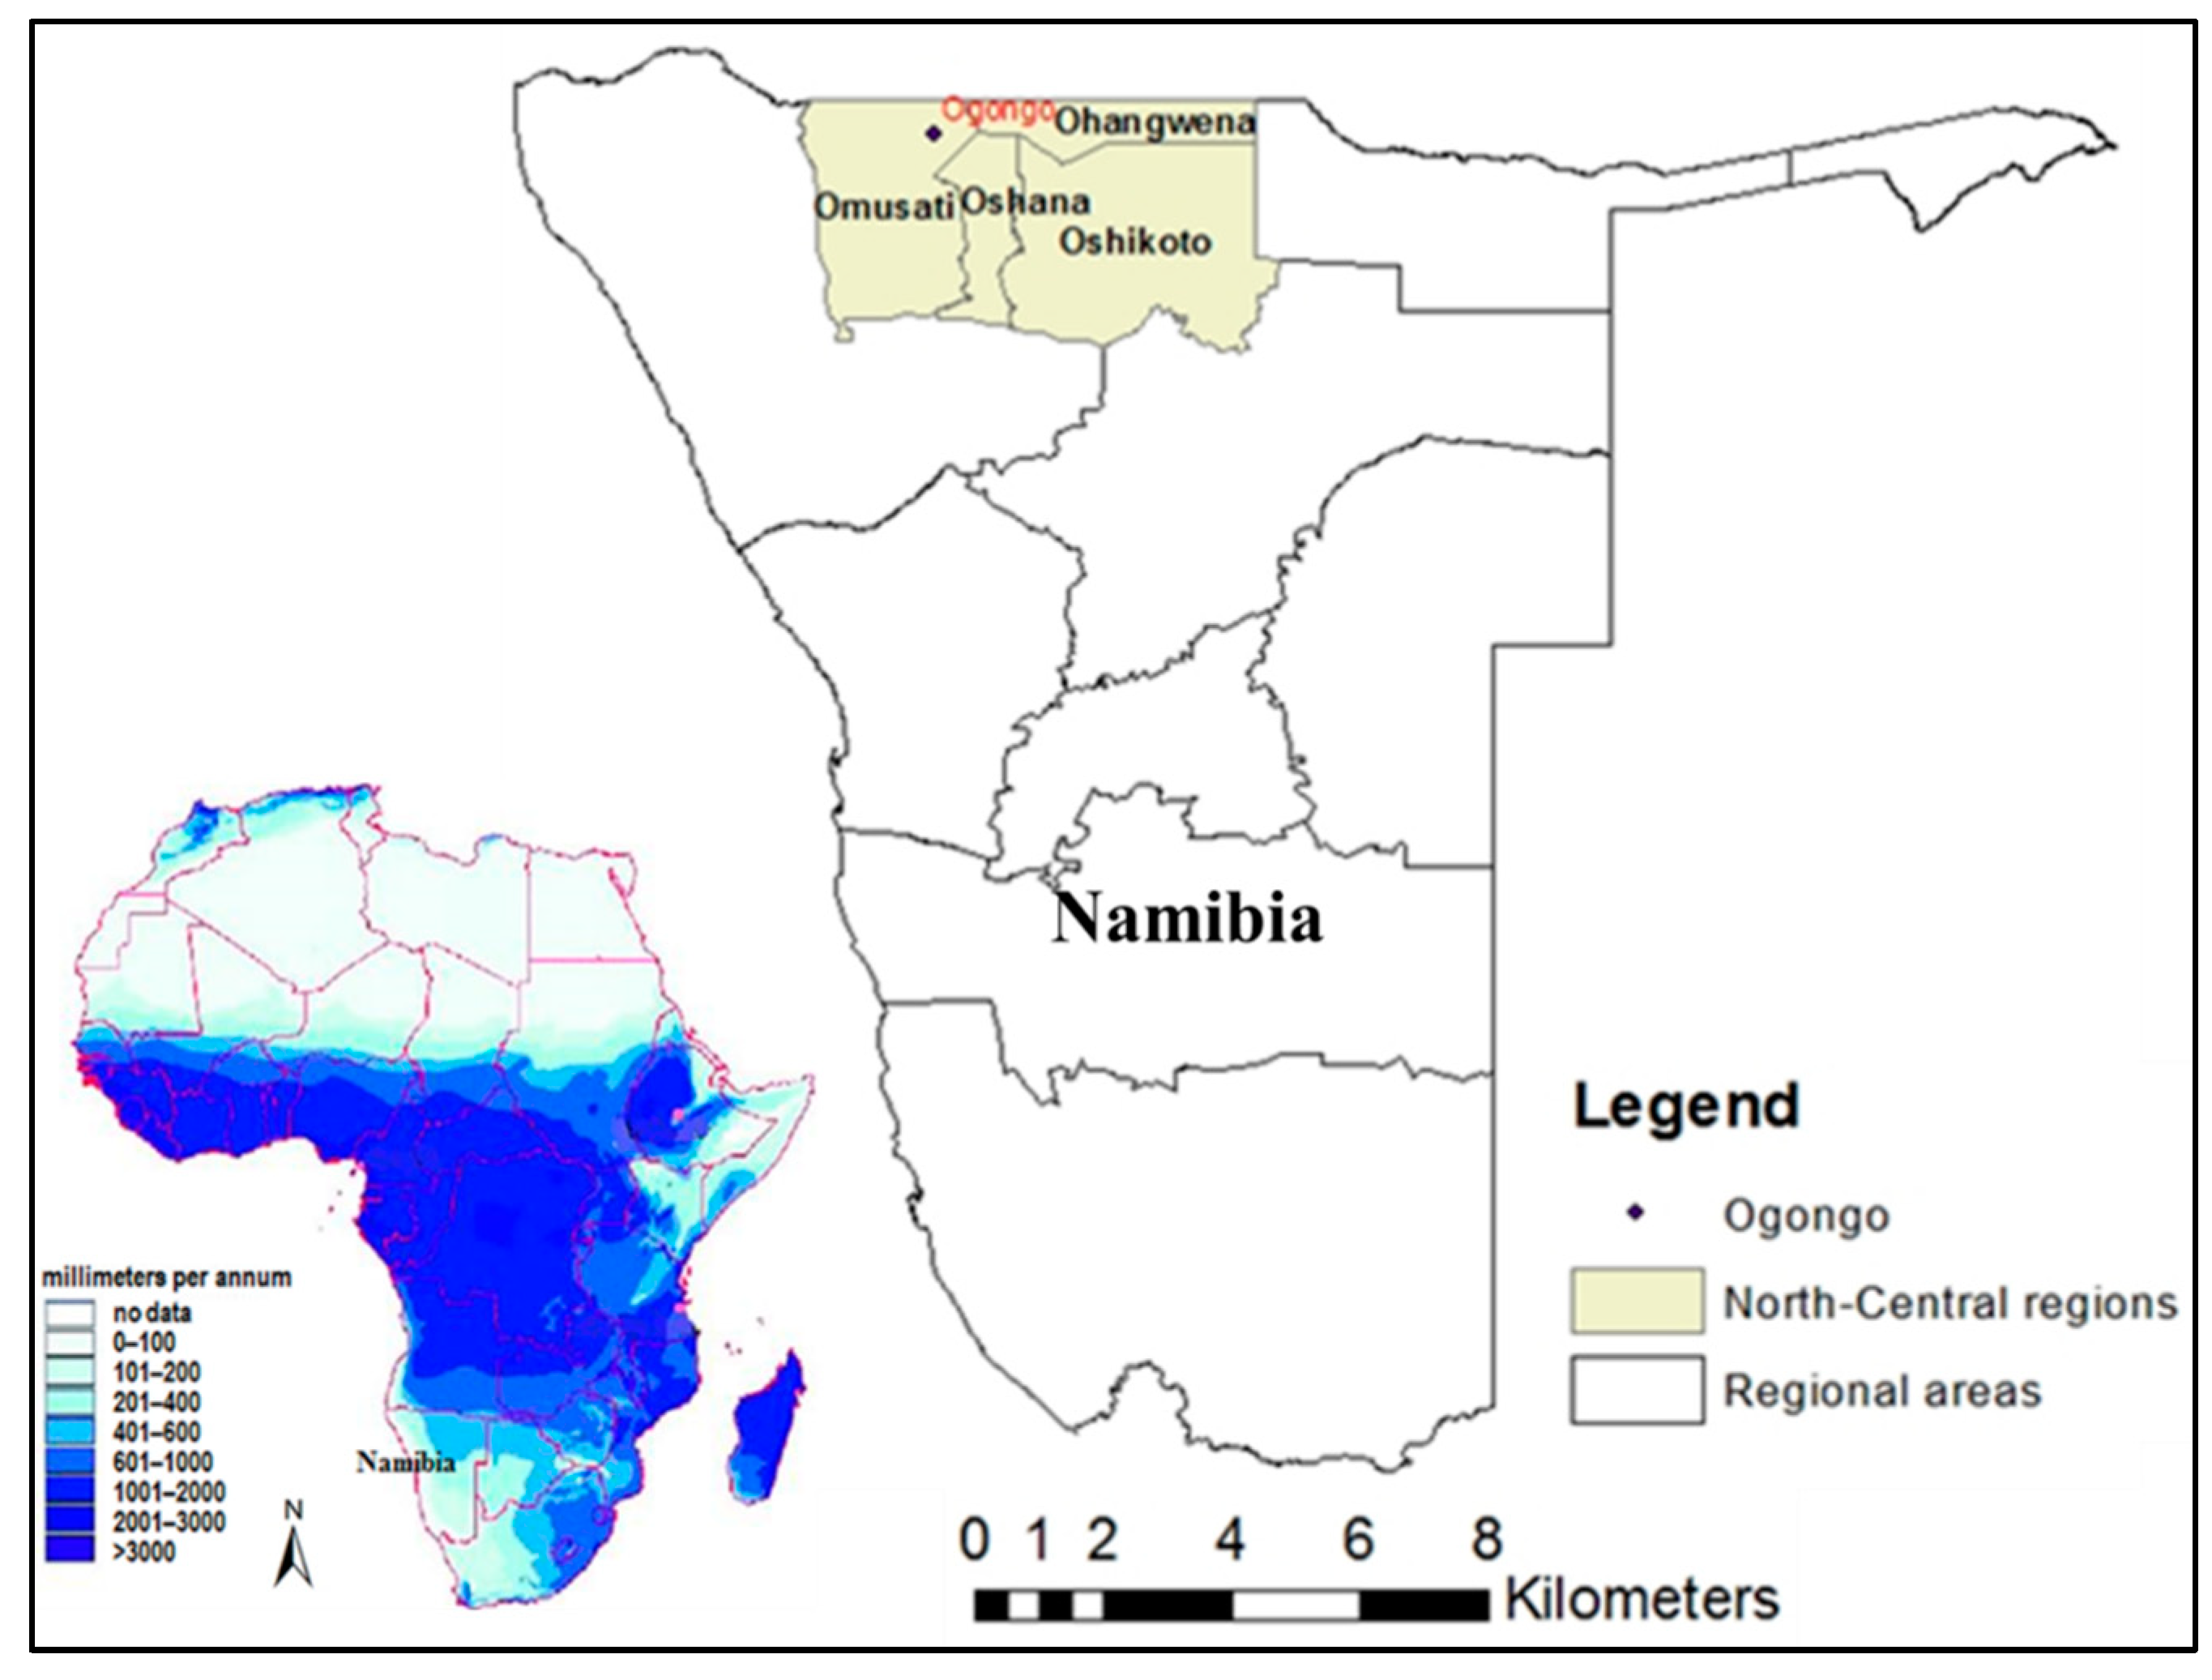
The pearl millet sowing-date field experiment was carried out for two summer-rainy seasons, 2017/2018 and 2019/2020, at the University of Namibia-Ogongo Campus Farm (17° 40′ S, 15° 18′ E, 1109 m ASL), North-Central Region (NCR), Namibia. With an area of 84 582 km2, accounting for 10% of the country’s land area [1], the NCR comprises four administrative regions, Ohangwena, Omusati, Oshana, and Oshikoto [2,3], characterized by a semi-arid climate (also see Error! Reference source not found.). Soils in the NCR are classified into three major groups: Cambic Arenosols, Eutric Cambisols, and Haplic Calcisols [4], with sand being the dominant soil fraction [5,6]. Most areas fall within the Cuvelai Drainage Basin, originating in southern Angola, where rainfall is higher than in Namibia (Error! Reference source not found.). The NCR is characterized by a semi-arid climate, with an average temperature of >22 °C [7] and receiving a summer rainfall with the average annual rainfall ranging from 450–500 mm, occurring during November–April period [8]. The remaining months represent the dry season.
Figure 1. A map showing the location of the University of Namibia-Ogongo Campus, North-Central Region (NCR), Namibia, situated in a semi-arid Sub-Saharan Region. Source: Adapted from FAO/Agrhymet Network and ESRI. .
Preprints 80510 g001
To expound on the historical and current rainfall behaviors and their impact on agriculture in the NCR, we analyzed the May 1994–April 2023 rainfall data for annual and monthly rainfall patterns and trends in the subsequent sub-section, using data from the Omahenene Research Station, a government station located nearby the experimental site. Additionally, we summarised rainfall and other weather data for the experimental years 2018 and 2020 obtained from the study site.

2.2. Rainfall Analysis

2.2.1. Standard Deviation and Mean

Rainfall data for the past 30 years, May 1994–April 2023, from the Omahenene Research Station, were analyzed for several parameters, including the average annual rainfall and average monthly rainfall and associated standard deviation (SD). The absolute dispersion of the data denotes the SD, while the data's average denotes the data's mean [9]. For a continuous random variable 𝑌, with moments existing up to order 4, let 𝜇 = (𝑌) be the mean of 𝑌, denoted by equation 1 as:
μ i = E ( y μ ) i , i = 2 , 3 , 4

2.2.2. Mann-Kendall (MK) Test

The rainfall data were analyzed for time-series annual and monthly trends. Mann [10] stated that given n consecutive observation of a time series   z t ,   t = 1 , , n , the Kendal rank correlation ( τ )   of z t with t = 1 , , n can be used to test for monotonic trends. The MK test evaluates the null hypothesis of no trend against the alternative hypothesis of an increasing or decreasing trend. In this study, we performed the MK trend test by computing the statistic (S) given by:
S = i = 1 n 1 j = i + 1 n s i g n ( y i y j ) ... j > 1
where y j denotes the sequential data values, n denotes the size of the time series sample and
s i g n ( y i y j ) = { 1 , y i y j < 0 0 , y i y j = 0 1 , y i y j > 0
Since in our study n > 8 , we obtained estimates of σ 2 also, μ for S as suggested in Mann [10] and Kendall and Stuart [11] that is:
E ( S ) = 0
V a r ( S ) = n ( n 1 ) ( 2 n + 5 ) g = 1 n q i ( g 1 ) ( 2 g + 5 ) g 18
q i is the number of ties of length   g . Then,
S N ( 0 , 1 )
The significance of standardized S in (6) was estimated from the Gaussian cumulative distribution function using the following equation:
Z = { S 1 var ( S ) , S > 0 0 , S = 0 S + 1 var ( S ) , S < 0
A positive Z value ( Z > 0 ) denotes an increasing trend, whereas a negative Z ( Z < 0 ) indicates a decreasing trend. In testing for the significance of increasing or decreasing monotonic trend at α level of significance, the decision rule here is to reject the null hypothesis ( H o ) if:   Z > Z 1 α 2 , with Z 1 α 2 obtained from the cumulative normal distribution tables. In the present study, we used an α value of 5%.

2.2.3. Sen’s Slope Estimate

The magnitude of the nonparametric trend in the time series is determined using Sen's estimator [12], used in hydro-meteorological time-series studies [13,14,15]. This method was therefore used in this study to estimate the magnitudes of the slope of annual and monthly trends based on the following equation:
s e n s l o p e = M e d i a n ( y a y b a b ) , b < a
with Y a and Y b being rainfall amounts measured in time a and b , respectively.

2.3. Agronomic Evaluation

2.3.1. Experimental Treatments, Design, and Management

The study used two open-pollinated pearl millet varieties, Okashana-2 (SDMV 92032) and Kantana, commonly cultivated in northern Namibia’s subsistence agriculture. Developed by ICRISAT for drought-prone, low-rainfall regions, Okashana-2 is an improved, early-maturing, and high-yielding variety (taking 40–55 days to flower) [16,17], while Kantana, is a tall, late-maturing local landrace, with 60–73 days to flowering [18,19]. The pearl millet seeds were acquired from a local seed retailer.
The field experiment was based on a split-plot design with five sowing dates, viz. the 1 January, 15 January, 1 February, 15 February, and 1 March, as the main plots and the two pearl millet varieties, Kantana and Okashana-2 as the subplots, arranged in four replications. The experiment was conducted in loamy sand. Each year, the experimental area was ripped to 30–50 cm soil depth to facilitate water infiltration and disc-harrowed to incorporate weed materials into the soil. The total experimental area was 741 m2 with individual plots (experimental units) measuring 12 m2, separated by a 1-m wide alleyway. Each plot received a pre-planting basal fertilizer at 30–45–30 N, P, and K kg/ha, respectively. Pearl millet was sown following the sowing date treatments. The seeds were initially over-sown on each hill, keeping 75 cm spacing between rows and 40 cm spacing between hills. Individual plots comprised four rows, each with 10 plants totaling a population of 40 plants.
The seedlings were thinned 2–3 weeks following field emergence to leave one plant per hill. Weed control was performed manually immediately after thinning and continued irregularly during the crop growth cycle to keep a weed-free experiment. No top dressing or pesticides were applied to the experiment. However, in the second year of the study, the experiment was given supplemental irrigation by applying approximately 10.0 mm twice in January to save the seedlings from a long dry spell. Bird scaring was done from the grain setting stage until harvest to minimize grain losses due to birds.
Grain yield data were collected using plants in the two center rows, leaving out all outermost plants to serve as borders. At crop maturity, a sampling area of 2.4 m2, ideally comprising eight plants, was established in each plot and then harvested for yield sampling. All panicles in each sampling area were harvested and air-dried for 3–4 weeks. The panicles were threshed and winnowed manually to obtain clean grains. The clean grains were weighed before testing their moisture contents using a Grain Moisture Tester (PM-830-2, Kett, Japan) to adjust the grain weights to 14% moisture content. The grain yield per hectare was finally determined.

2.3.2. Data Analysis

One of the objectives of this study was to analyze the grain yield data for two pearl millet varieties, Kantana and Okashana-2, and to explore the relationship between their sowing dates and grain yields using polynomial regression. Data were analyzed using Python programming language and the methodology described below. An initial ANOVA model was run in variation partitioning across years with years as a random effect. The year effect was not significant (p = 0.224); however, there were variations for the fixed effects of sowing date (p = 0.037), variety (p = 0.005), and their interaction (p = 0.001). For each variety, the grain yield data of the individual years were pooled; arranged according to the different sowing dates categorized into five-time points: 1-Jan, 15-Jan, 1-Feb, 15-Feb, and 1-Mar; and reprocessed using the NumPy and Pandas libraries in Python. The sowing dates and corresponding grain yields were organized into two separate arrays, one for each variety. Polynomial regression was chosen to model the relationship between the sowing dates and grain yields for each variety. The Polynomial Features and Linear Regression classes from the sci-kit-learn libraries were utilized. Different polynomial degrees were tested, and a degree of 3 was selected as the optimal fit for both varieties based on the mean squared error. Bootstrapping with 1000 iterations was performed to estimate the uncertainty in the regression models. Confidence intervals were computed for the predicted grain yields at each sowing date. The results were visualized using Matplotlib to create two subplots, each representing the grain yield data, the polynomial regression curve, and the associated confidence intervals for Kantana and Okashana-2 pearl millet varieties. Each variety's regression equations and correlation coefficients were calculated for each regression curve.
The correlation coefficient was calculated to evaluate the strength of the relationship between sowing dates and grain yields for each variety. The mathematical formulation of polynomial regression involves fitting a polynomial function to the data by estimating the polynomial coefficients. The general form of a polynomial regression model is:
y = β0 + β1 × x + β2 × x2 + ... + βn × xn + ε
where:
y is the dependent variable (in this case, the grain yield).
x is the independent variable (in this case, the sowing date).
β0, β1, β2, ..., βn are the coefficients of the polynomial, which represent the intercept and the slopes of the polynomial terms.
x2, x3, ..., xn are the higher-order polynomial terms.
ε is the error term, representing the deviation of the actual data points from the fitted polynomial curve.
In the specific case of the polynomial regression performed in the code, the third-degree polynomial (degree = 3) is used, so the mathematical formulation of polynomial regression models for each variety is presented below.
For Kantana:
y_K = β0_K + β1_K × x + β2_K × x2 + β3_K × x3 + ε_K
For Okashana-2:
y_Ok = β0_Ok + β1_Ok × x + β2_Oka × x2 + β3_Oka × x3 + ε_Oka
The goal of the polynomial regression is to estimate the coefficients β0, β1, β2, and β3 that best fit the data points, thus providing a polynomial curve that represents the relationship between the sowing date (x) and the grain yield (y) for each pearl millet variety. The correlation coefficient can be used to assess the goodness of fit of the polynomial regression model and quantify the strength of the relationship between the variables.
Based on the polynomial regression results, both Kantana and Okashana-2 pearl millet varieties produced the maximum grain yields in January. Therefore, the crop yield data from 1–28 January, which conformed to the normal distribution and equal variance assumptions, were used to predict the optimum sowing windows. Individual varieties' grain yield values were grouped within the four weeks of January, considered as sowing windows, viz. week 1 (1–7 days), week 2 (8–14), week 3 (15–21), and week 4 (22–28). Yield comparison within a variety across the weeks of January was done using box plots.

3. Results

3.1. Weather Conditions

3.1.1. Descriptive Statistics for Annual and Monthly Rainfall

The descriptive statistics for annual and monthly rainfall for May 1994–April 2023 are presented in Table 1. The long-term annual average rainfall was 475.3 mm, associated with a high standard deviation (SD) of 185.4 mm, implying high inter-annual rainfall variability. The long-term monthly rainfall distribution patterns depicted two distinctive seasons, the dry winter season, from May to October with literally no rainfall, and the summer rainy season, from November to April, accounting for 97.5% of the total annual rainfall (also see [8]). March had the highest average rainfall of 112.6 mm, followed by February, January, and December with 107.3, 103.4, and 71.6 mm, respectively. In contrast, April and November had the lowest average rainfall values of 29.7 mm and 38.5 mm. Rainfall variability within months was also high, being the highest for February (86.8 mm), followed by March (72.4 mm), January (66.4 mm), and December (65.3 mm). The descriptive statistics revealed that during the past 30 years, the NCR was characterized by highly variable annual and rainy season month rainfalls.
The time series annual rainfall variability patterns for 1994–2023 are shown in Figure 2. Inter-annual rainfall variability was relatively high. The highest rainfall during the last three decades was 907.8 mm recorded in 2011, followed by 822.8 mm in 2009 and 786.1 mm in 2008. These high-rainfall years were characterized by incidences of floods that struck the region. On the other hand, incidents of inter-annual droughts are common in the NCR; for example, annual rainfall was mostly below average (475. 1 mm) during the periods 1994–1999 and 2018–2023. The lowest rainfall of 134.3 mm was recorded in 2019, followed by 157.0 mm received in 2023 and 218.0 mm observed in 2013 and, noticeably falling in the last decade, all these years were associated with severe droughts. Other years with very low rainfalls were 2021 and 2022. The results demonstrated that droughts and floods occurred in the NCR during 1994–2023.
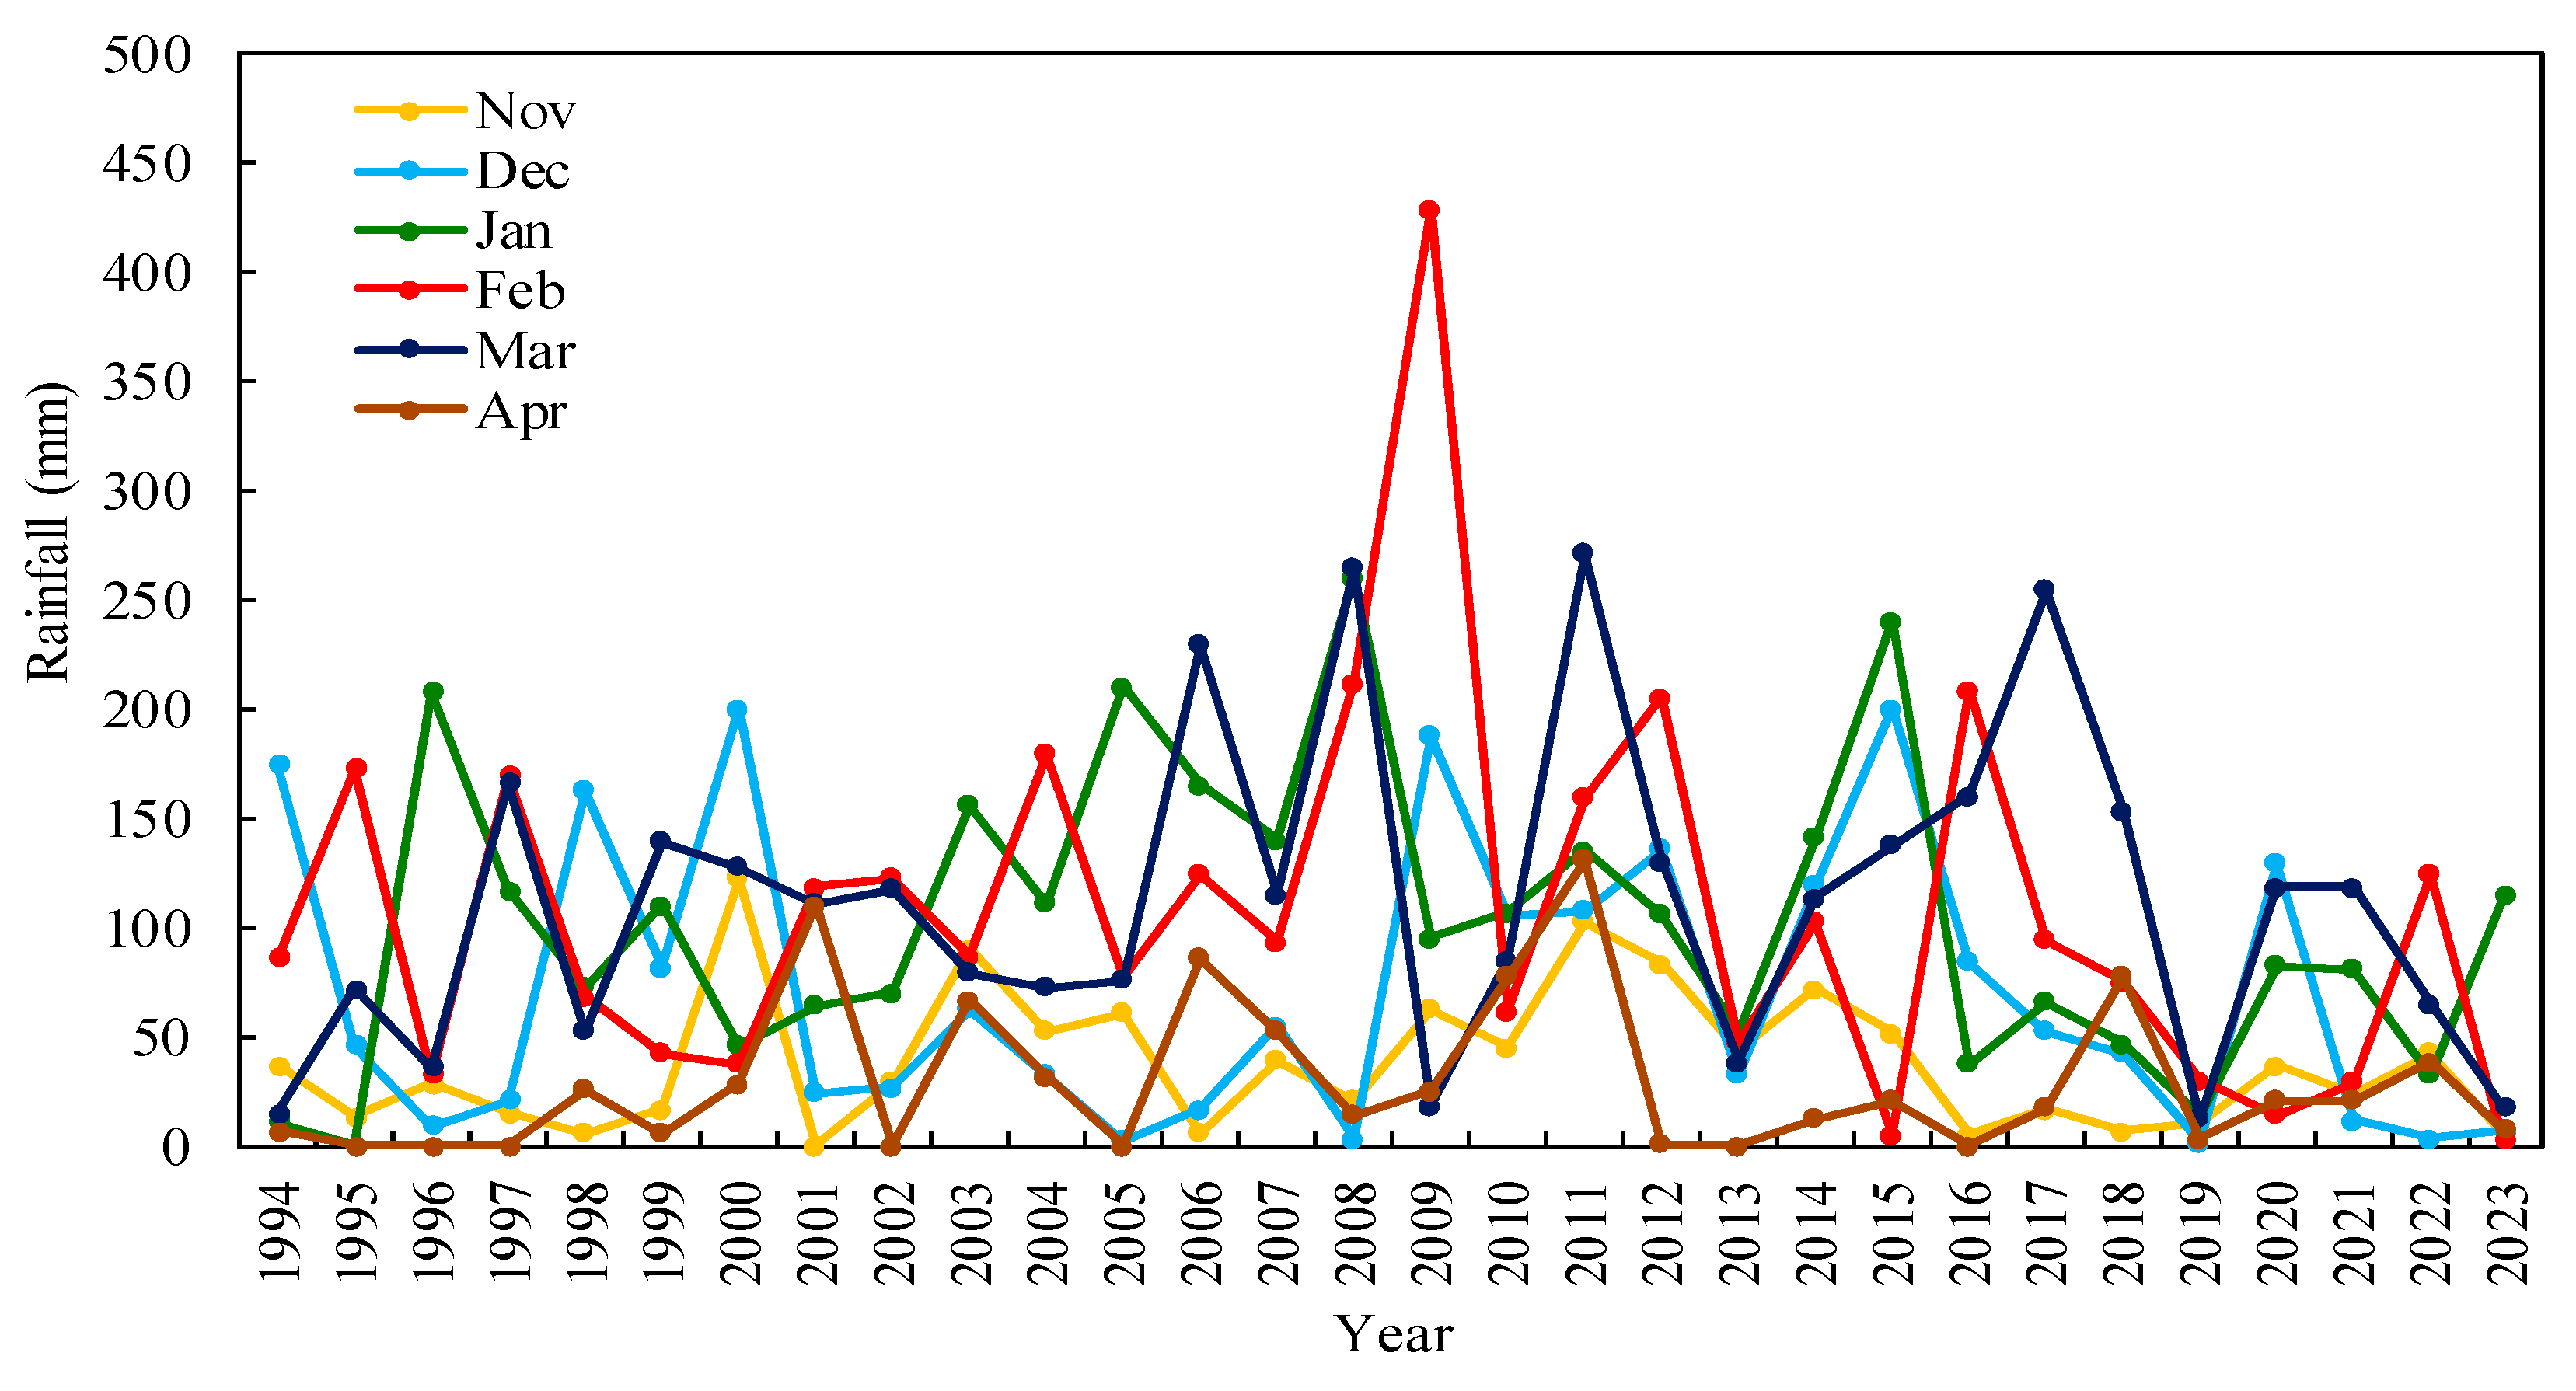
Figure 3 shows the monthly rainfall patterns from November to April for 1994–2023. Monthly rainfall distribution within years and from year to year displayed highly irregular patterns. Inter-annual variability may be well visible in February, which 2009 received a total of 429 mm, nearly four times more than the month’s long-term average of 107.3 mm. On the contrary, the same month received no rainfall in 2015 and 2023. Other months such as March, January, and December, also showed highly variable rainfall patterns. Only November and April months have displayed the lowest rainfall variability patterns. The months that received the highest rainfall, i.e., February, March, January, and December (Table 1), were seemingly associated with the highest rainfall variability compared with the months with the lowest rainfall, particularly November and April (Figure 3).

3.1.2. Annual and Monthly Rainfall Trends

Table 2 shows the Mann-Kendall statistic (ZMK) and Sen’s slope estimator for total annual and average monthly rainfall at the Omahenene Research Station, North-Central Namibia, from 1994–2023. Based on the MK-trend test and Sen’s slope estimator test results, annual rainfall showed a nonsignificant, marginal negative, or decreasing trend. From May to October, the dry-season months lacked trends due to the lack of rainfall, except October, which showed a nonsignificant negative rainfall trend. The November to April rainy season months showed nonsignificant (p > 0.05) heterogeneous rainfall trends, with decreasing trends, manifested in negative Z and Sen’s slope values, for November, December, January, and February, and increasing trends, denoted by positive Z and Sen’s slope values, for March and April. The negative rainfall trends associated with October–February months implied a reduction in rainfall in these months, while the increasing trends for March and April denoted an increase in rainfall in these two months. These results indicated that the long-term annual rainfall had a nonsignificant negative trend; also, for monthly rainfall, the first four rainy months (November–February) had nonsignificant negative trends, while March and April had positive trends.

3.1.3. Solar Radiation, Temperature, and Rainfall during the Experiment

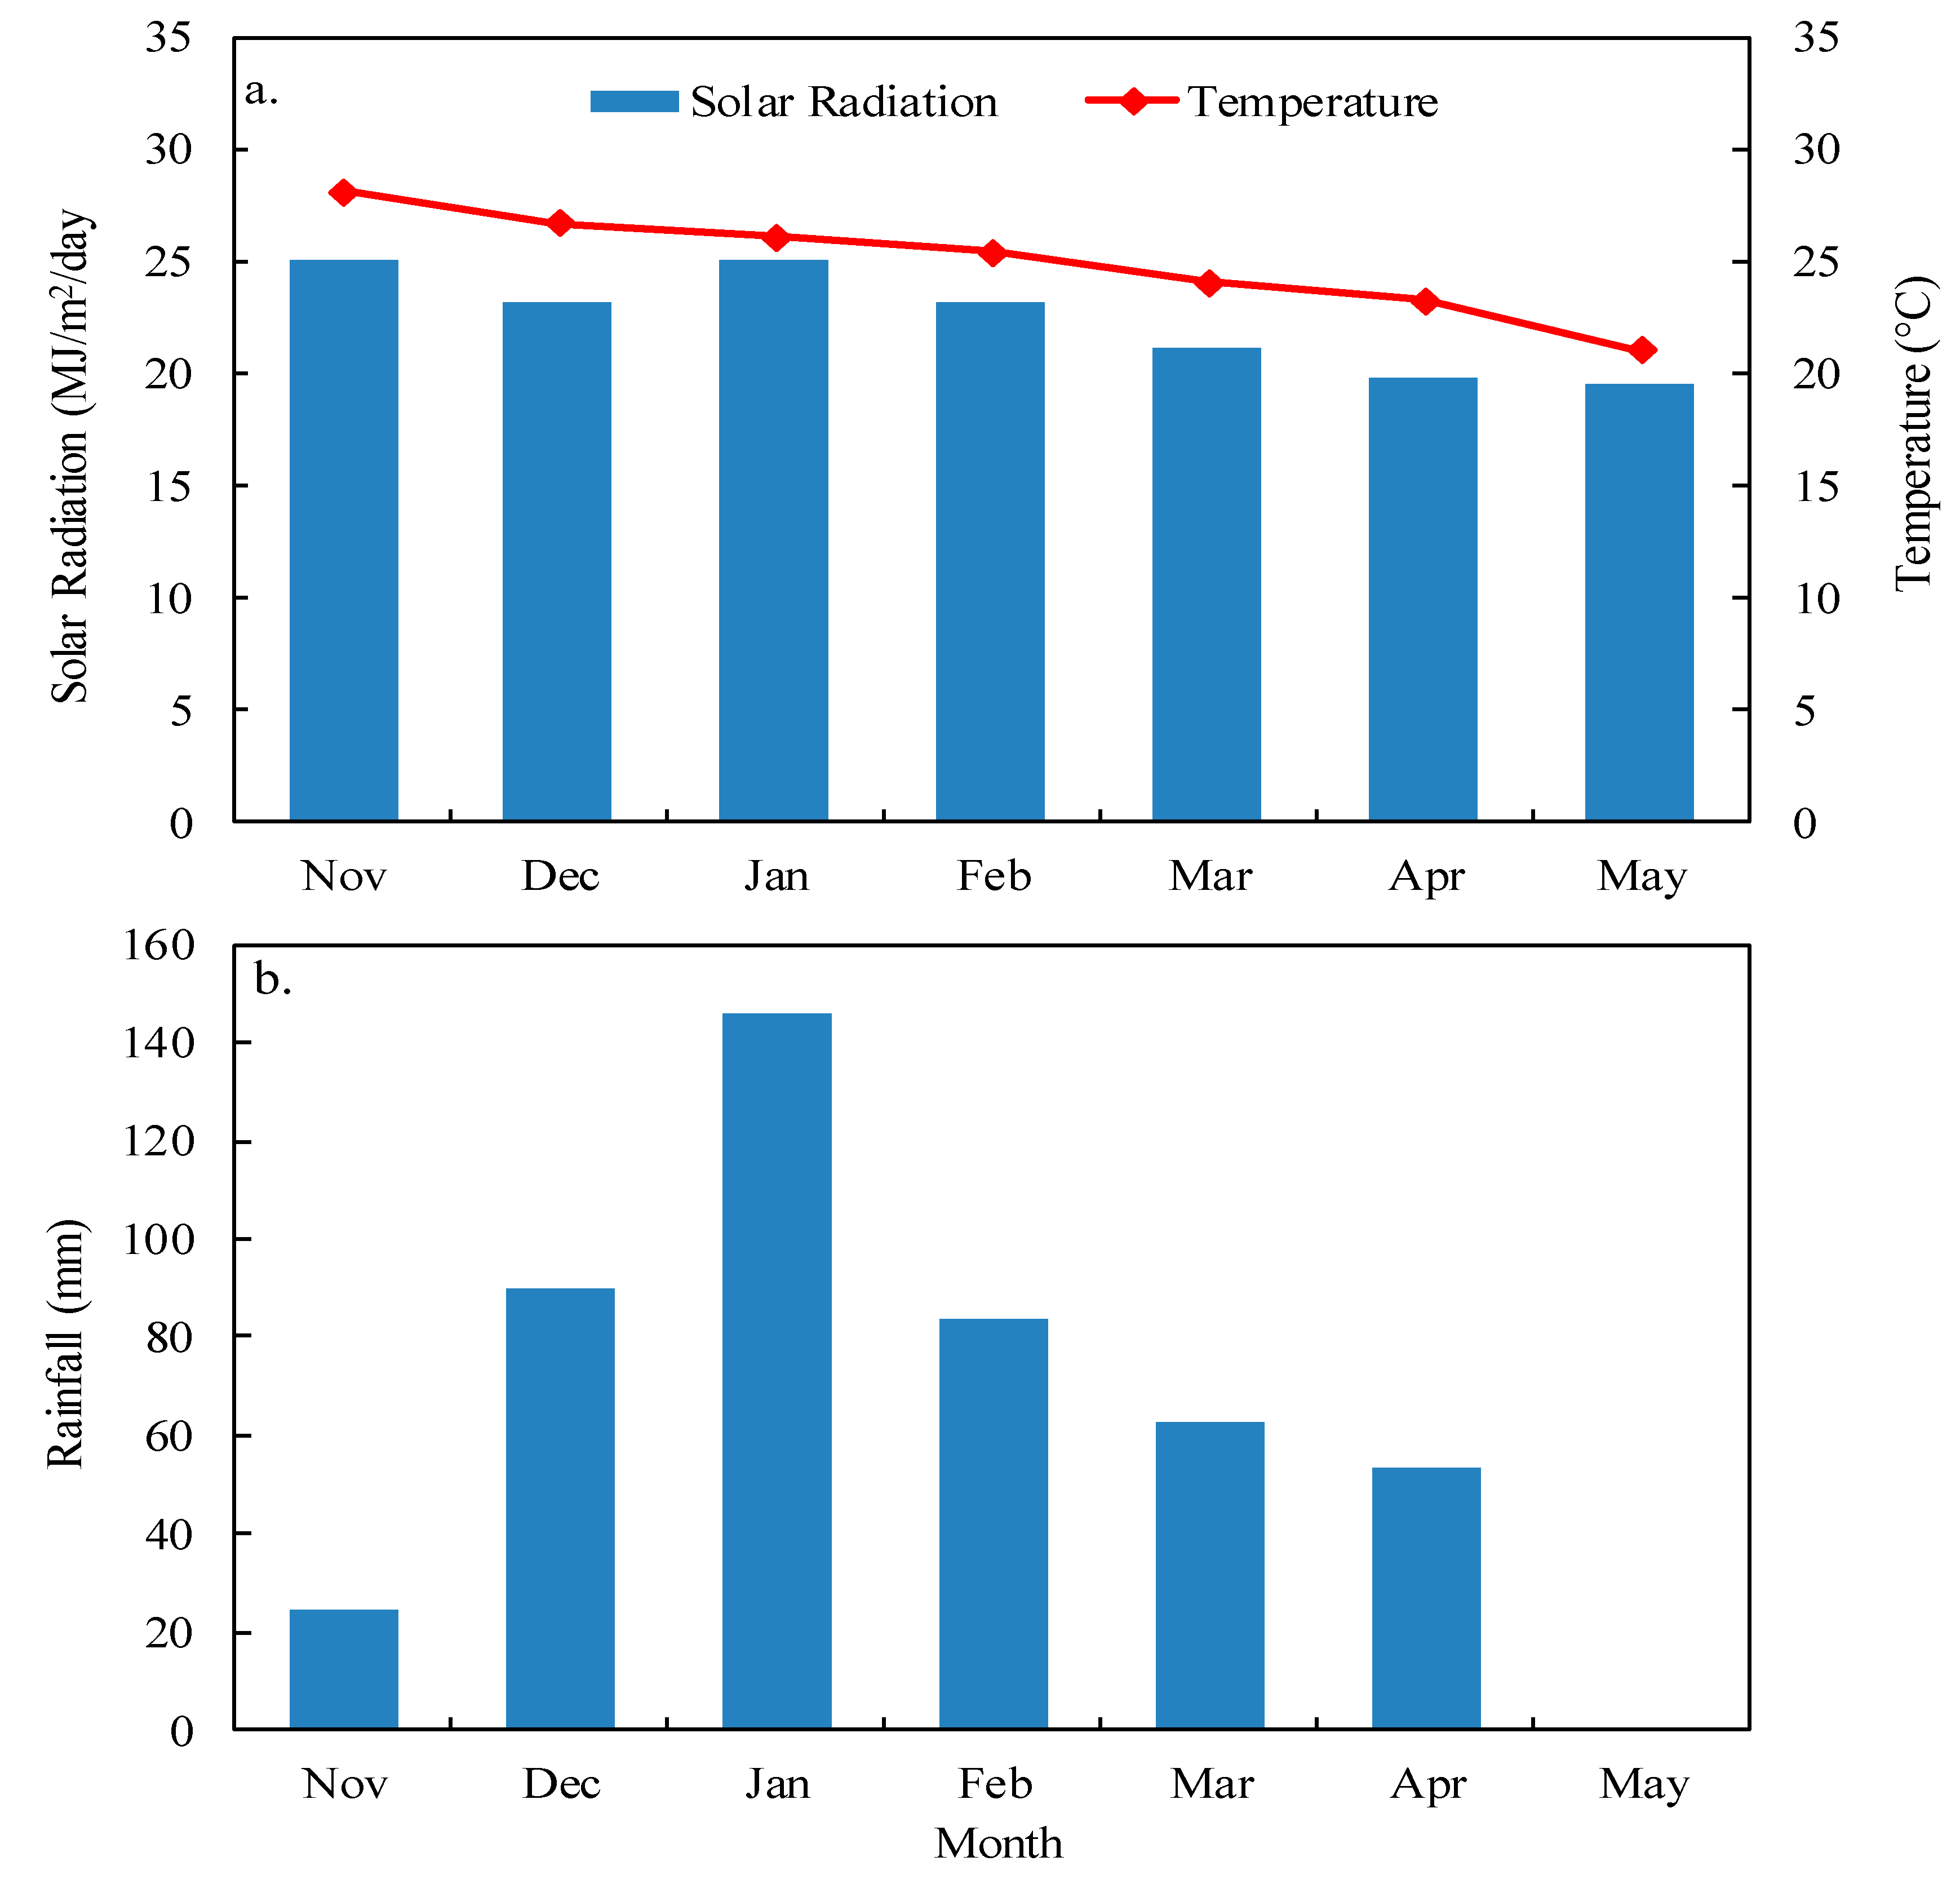
The patterns of 2017/2018 and 2019/2020 growing seasons’ pooled solar radiation, temperature, and rainfall data are illustrated in Figure 4. The monthly average solar radiation was 22.0 MJ/m2/day; however, solar radiation decreased by six units from 25.0 MJ/m2/day in November to 19.5 MJ/m2/day in May. The average temperature during the experiment was 25.0 °C, but the temperature decreased by four units across the rainy season, from 28.0 °C in November to 21.0 °C in May. The average total rainfall between November and May in the growing season was 460 mm. The average total rainfall gradually increased from 24 mm (5.2%) in November to 90 mm (19.6%) in December to reach the peak of 146 mm (31.7%) in January. After the peak, rainfall declined sharply through 84 mm (18.3%) in February and 63 mm (13.9%) in March, abruptly ceasing with 53 mm (11.5%) in April; no rainfall was received in May during the experiment. Further information on solar radiation and temperature during the experiment is presented in Figure 4a, while that for rainfall is illustrated in Figure 4b.

3.2. Grain-yield Dynamics

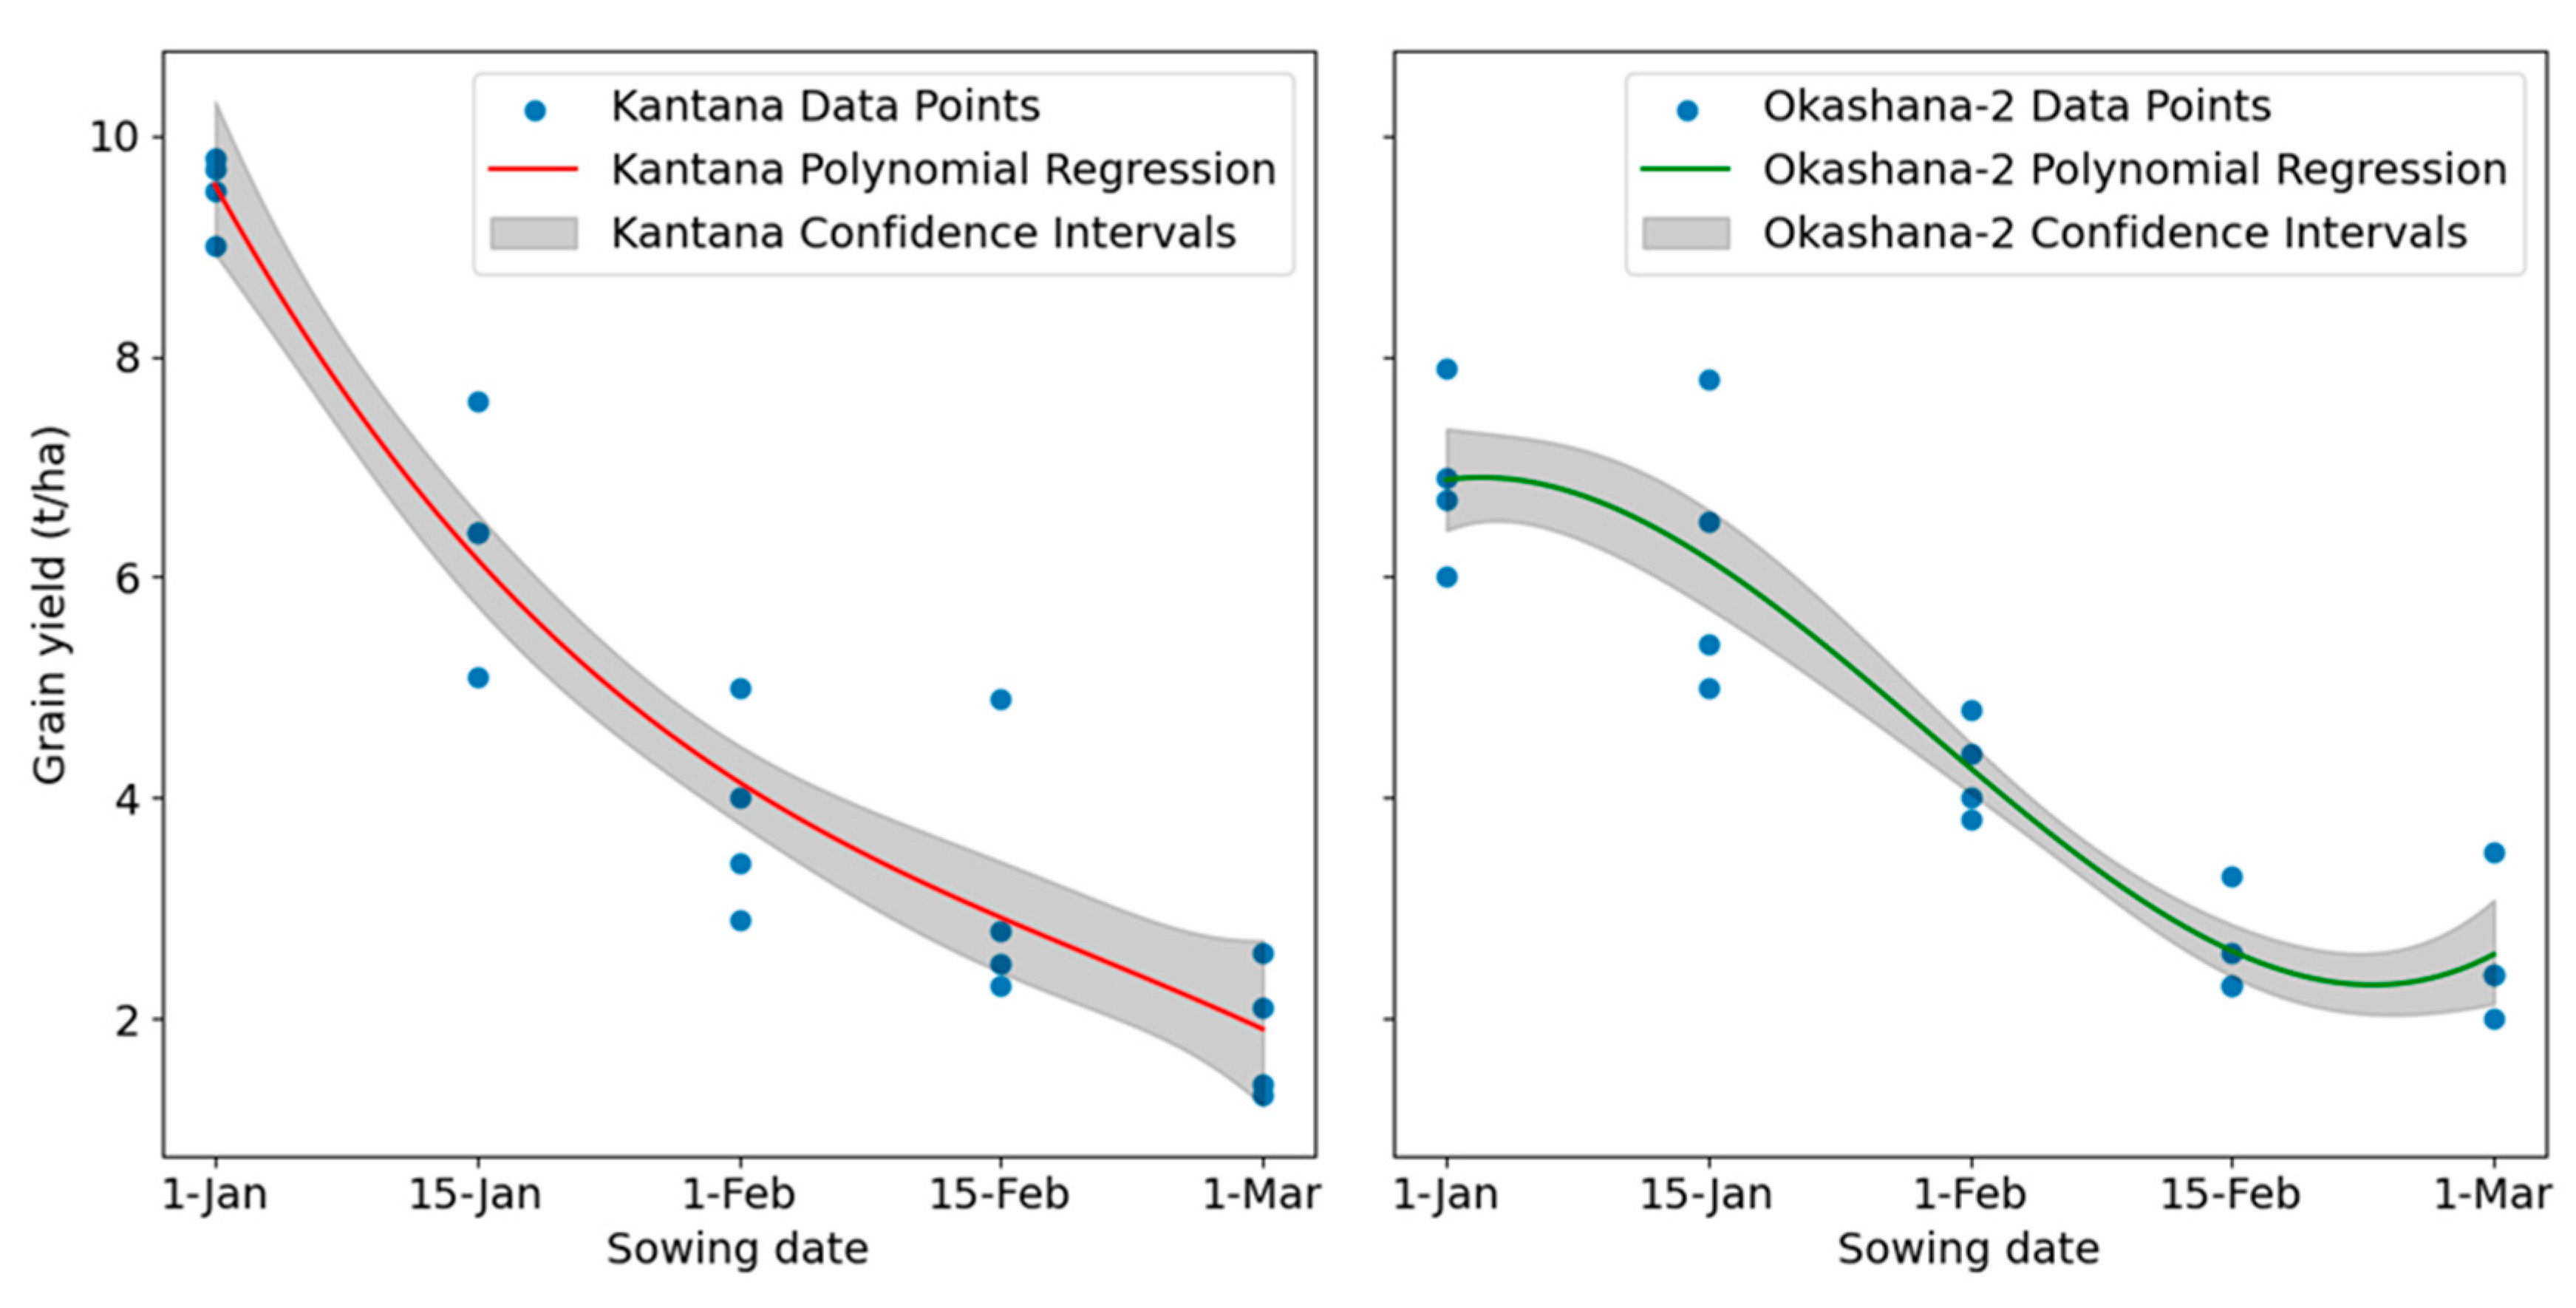
The cubic polynomial regression models of the grain yields and days of the year used to analyze the yield dynamics of Kantana and Okashana-2 pearl millet varieties are shown in Figure 5. Based on the models, the pearl millet optimal sowing date for the NCR happened to be calendar day 1 (1 January), in which Kantana produced the highest grain yields. The cubic polynomial regression models showed the best fit with an R2 of 0.9997 for Kantana and 0.9636 for Okashana-2. For Kantana, the model revealed strong relationships between later sowing regimes and reduced yields (Table 3). The experimental average maximum yield of 9.5 t/ha was attained with Kantana sown on 1 January, which according to the model, decreased to 82, 66, 55 and 47% of the maximum yield as the sowing dates were delayed from the 1 to 7, 14, 21 and 28 January, respectively. The corresponding relative yield of Okashana-2 fluctuated from 64% (1 January) to 67, 67, 63, and 57% of the maximum yield. Kantana sown between 1 and 14 January exhibited a yield advantage of up to 36.0% over Okashana-2. However, Okashana-2 grain yields were relatively stable across January sowings and even surpassed Kantana’s yield by up to 9.4% when sown between 14 January and 1 March. Both Kantana and Okashana-2 varieties had the lowest yields under the last sowing date of 1 March.
The cubic polynomial regression equations for the two varieties are given by:
YKantana = -0.0004x3 + 0.0622x2 - 3.4207x + 103.23 and
YOkashana-2 = 0.0006x3 - 0.0581x2 + 0.9222x + 63.418.

3.3. Variety Optimal Sowing Windows

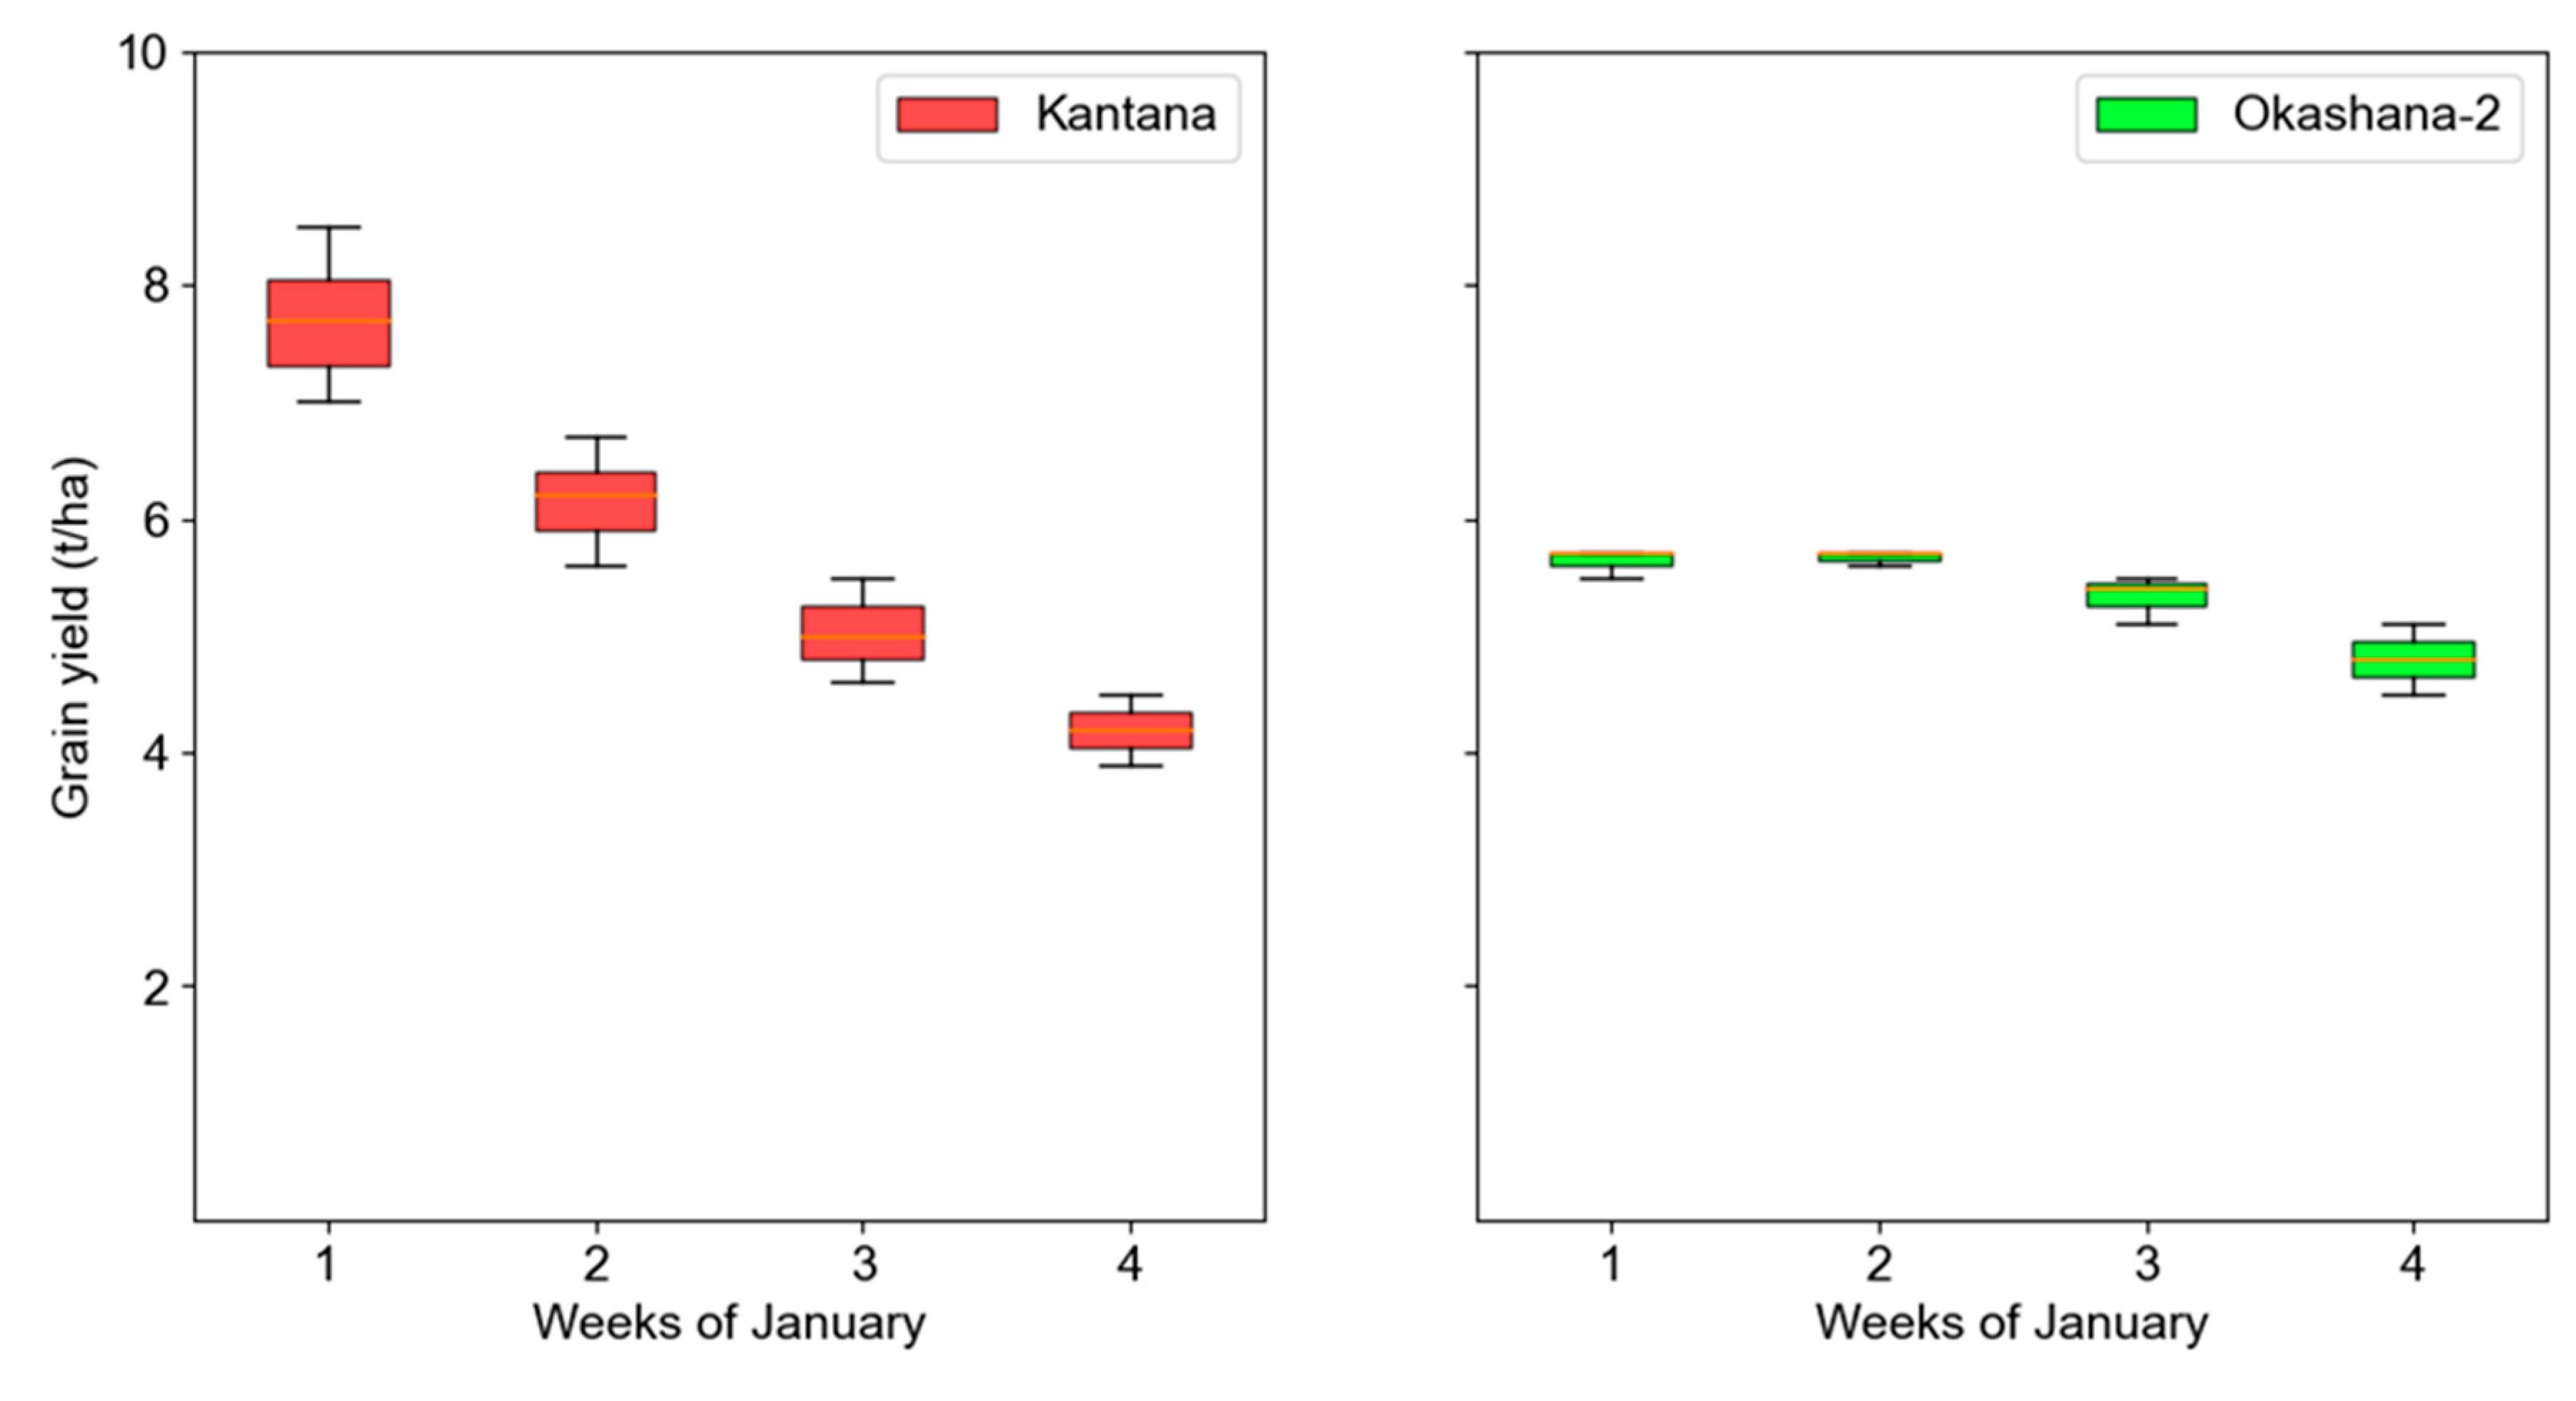
The effects of sowing windows (week 1, week 2, week 3, and week 4 January) on the grain yields of Kantana and Okashana-2 pearl millet varieties are demonstrated in Figure 6. The two varieties have different yield patterns across the sowing windows. For Kantana, the yield substantially declined with every week of delay in sowing, denoting the uniqueness of each sowing window studied. The highest average yield of 7.7 t/ha was attained with the crop sown in week 1, followed by 6.2 t/ha from week 2, 5.0 t/ha from week 3, while the lowest average yield of 4.2 t/ha was observed from the crop sown in week 4 January. The reduction in the average grain yield between weeks 1 and 2 was as high as 18%.
For Okashana-2, the first three sowing windows had similar grain yield levels; however, such yield levels were higher than the yield obtained from the last sowing window (week 4), implying two distinct sowing windows for this variety. Moreover, Okashana-2 had a lower but relatively stable yield than its counterpart Kantana, producing average yields of 5.6 t/ha, 5.7 t/ha, 5.4 t/ha, and 4.8 t/ha from sowings in weeks 1, 2, 3, and 4 of January, respectively. Thus Okashana-2 yield from week 4 was lower by 6–8% than that of the first three weeks. Based on these results, sowing Kantana during the first week of January resulted in the maximum grain yield, while Okashana-2 maintained its highest yield when it was sown across the first three weeks of January; therefore, their respective optimal sowing windows would be 1–7 January for Kantana and 1–21 January for Okashana-2.

4. Discussion

4.1. Weather conditions

The goal of the present study was to analyze rainfall patterns and trends and their implications on the growing season, evaluate pearl millet yield dynamics under different sowing dates and determine the optimal sowing window for Namibia's North-Central Region (NCR) to increase grain production, sustainability, and food security in the region. The descriptive statistics revealed that during the last 30 years, from May 1994–April 2023, annual rainfall in the NCR was characterized by irregular floods and droughts, with incidences of severe droughts observed mainly during the early and later years of the period studied (Table 1 and Figure 2). However, high rainfalls associated with deluges also occurred between 2008 and 2011. The irregular occurrence of drought and flood events, causing interannual rainfall variability, may be caused by regional and global climatic system changes [4,20,21]. In semi-arid SSA regions, including the NCR, rainfall variability is a natural phenomenon, usually manifested in various ways as a result of the erratic and unpredictable nature of weather conditions in these regions [8,22], resulting in both drought [23,24,25] and flood [7,8,26,27] events.
Like annual rainfall, monthly rainfalls were also highly variable, with the months having the highest rainfalls, i.e., February, March, January, and December, showing the highest variability compared with November and April, which received the lowest rainfall (Table 1 and Figure 3). These present results agree with previous studies performed in the NCR, showing variations and variability during the rainy months [4,7,8,28]. In semi-arid SSA regions, rainfall variability is a natural phenomenon, usually manifested in various ways [8,21], including delayed rainy season onset, early rainy season cessation, reduced length of the growing season, and frequent or prolonged intra-seasonal dry spells [23,29,30,31].
Time series analyses showed that the long-term annual rainfall in the NCR had a nonsignificant negative or downward monotonic trend, and the first four months of the rainy season (November–February) also had downward trends. However, March and April had nonsignificant positive or upward trends (Table 2). Although the decreases in annual and monthly rainfall trends were not statistically significant, they still require close attention. The months with negative trends within the growing season indicate a shift in rainfall distribution patterns such that the November, December, January, and February rainfall is decreasing while the March and April rainfall is increasing. These downward rainfall trends for November–February months imply that these months have recently become drier than before, which could result in delayed sowing as farmers would have to wait until they receive good showers that provide sufficient moisture to the soil to facilitate land preparation and sowing. When sowing is delayed, the growing season becomes shorter, decreasing crop growth, development, and final yield [32]. Farmers in other regions have observed, among others, decreasing rainfall amounts, rising temperatures, and shortening of growing seasons' length over the years, causing prolonged droughts, uneven rainfall distributions, and unpredictable onset and ending of rains [23,24,25], which have adverse effects on agricultural productivity, food security, and income.
The downward trend in annual rainfall indicates that total annual rainfall in the region is decreasing. Hence, water would become more limited in the local semi-arid environment of the NCR. Six out of 11 latest years (2013–2023) had rainfall values below the long-term average; additionally, three years were characterized by severe drought—2013, 2019, and 2023 (Figure 2). This situation has implications for local water resources and agricultural production as drought conditions could intensify, leading to water deficit, poor agricultural production, and food insecurity. The decrease in annual rainfall is also attributed to the reduction in the rainfall of the rainy season months (November–February). Climate-change-related decreases in annual rainfall trends have recently been reported in Namibia [33] and other sub-Saharan African (SSA) countries, such as Botswana [34,35], Zimbabwe [36], Mali [20] and Ethiopia [37,38].

4.2. Crop Performance

The sowing date significantly influences pearl millet performance [39,40]. The results from the grain yield dynamic analyses showed that Kantana, sown earlier by 14 January, had a yield advantage of up to 36% over Okashana-2; however, afterward, the yield dramatically decreased with subsequent delays in sowing (Table 3 andFigure 6). Superior grain production by Kantana under the early sowing dates demonstrates that the variety has a higher yield potential; thus, it can produce more grain yield if it is sown earlier in the season, despite having a more extended growth period than Okashana-2. Kantana is a long-duration variety, taking more days to head than Okashana-2 [18,19], thus matured later than its counterpart. The results are in line with those of other researchers, such as Nwajei et al. [39] and Nwajei [40], who demonstrated that different pearl millet varieties respond in various ways to sowing dates, and long-duration varieties can produce higher yields when they are sown earlier in the season. They attributed the superior performance of the early-sown crop to the more extended growth period with favorable conditions and better vegetative growth, allowing the accumulation and mobilization of photosynthetic assimilate for grain development.
The results (Table 3 andFigure 6) also revealed that Okashana-2 had more stable grain yields than Kantana, surpassing its counterpart by up to 9.4% when sown between 14 January and 1 March, despite having lower grain yield potential. These results demonstrate that Okashana-2 has mechanisms for setting and sustaining grain yields under variable rainfall conditions, such as alternating dry spells and flash floods during the growing season. According to Mgonja et al. [17] and Monyo et al. [16], Okashana-2 is a high-yielding, early-maturing improved variety developed for drought-prone, low-rainfall regions. Therefore, due to its fast growth characteristics, especially under harsh conditions, Okashana-2 physiologically adjusts to the prevailing moisture conditions. Such adjustment is attained by either setting the grain early when drought or flood stress is initiated or delaying the grain when the soil moisture is favorable, allowing more photosynthetic activities for normal plant growth and development, thereby maintaining a certain yield level under the prevailing rainfall conditions. Such yield adjustment may not be possible for the long-duration and late-maturing Kantana [18,19], which requires a longer growing season. Therefore, any delay in sowing means shortening the growing season for Kantana, adversely affecting its growth and yield.
The more stable yield observed in Okashana-2 may be explained by the factor that the variety is characterized by small-plant type, suggesting that it has lower water and nutrient requirements than Kantana, which bears bigger plants. For example, the low rainfall during February (Figure 4b) might have created severe moisture stress for Kantana but not necessarily for the smaller plants of Okashana-2, causing differential growth and yield responses between the varieties. However, the results revealed that local traditional pearl millet varieties do not have as low yield potential as perceived. However, their yield levels under semi-arid environments are chiefly controlled by the sowing date and available soil moisture during the crop growth cycle.
In Nigeria, a traditional pearl millet variety Gero Badeggi [41], produced a remarkably high grain yield in a sowing date experiment when it was sown earlier in the season [39]. The results further show that both Kantana and Okashana-2 varieties had the lowest yields under the last sowing date of 1 March, which may be related to the declining growth resources as the summer season was approaching the end. For example, some weather variables such as solar radiation, temperature, and rainfall, which are needed in sufficient amounts to promote normal plant growth, were diminishing as the season was advancing (see Figure 4a and b), slowing down plant physiological activities, growth and development, and thus limiting final yields.

4.3. Optimal Sowing Window for the NCR

Figure 6 shows that both Kantana and Okashana-2 produced the highest grain yields when they were sown during the first three weeks of January, with Kantana having a significant maximum yield when sown between 1 and 7 January and Okashana-2 having expressed its highest grain yield potential when sown between 1 and 21 January. The results demonstrate that the sowing of Okashana-2 can be delayed at least by two weeks without a significant reduction in yields, which is attributable to the variety’s early maturity characteristics [16,17].
For Kantana, the results showed the maximum grain yield when it was sown earlier, by 7 January, which may be ascribed to the variety’s long growth duration requirement [18,19]. The results also show that Kantana sown in week 1 of January still had a higher grain yield than Okashana-2; however, such a yield was 18% lower than the maximum yield attained by sowing the variety in week 1. This reduction in yield is quite huge; thus, local farmers who prefer Kantana over short-duration varieties are challenged to make tough decisions regarding whether they can still cultivate Kantana in week 2 January, given such a considerable reduction in yield and the general reduction and unreliability of local rainfall (Figure 3 and Table 2). Alternatively, the farmers should switch to improved short-duration varieties such as Okashana-2 and Kangara [16,17]. Nevertheless, one should consider simultaneous cultivation of both varieties in equal proportions to mitigate potential yield loss due to poor rainfall or to sowing an inappropriate variety.
Overall, the results suggest that the pearl millet optimal sowing window for the NCR is represented by the period from 1–21 January, such that Kantana can be safely sown from 1–7 January, while Okashana-2 can be sown from 1–21 January without incurring significant grain yield loss by delaying the sowing date. This method of determining a sowing window for a particular region has previously been used to determine rice planting windows by Cerioli et al. [42] and Slaton et al. [43].
As local rainfall in the NCR is low and highly unpredictable [7,8,28], both Kantana and Okashana-2 may be sown outside the proposed sowing windows, depending on the availability of rainfall, as farmers would be compelled to produce some grains for household food security. This scenario may be highly possible with Okashana-2, whose grain yield from week 4 January was lower by 6–8% than that of the first three weeks. However, there might be severe yield loss due to the late sowing, particularly for the late-maturing variety Kantana. Therefore, national and regional pearl millet breeding programs should develop or promote extra early-maturing, high-yielding varieties to extend the local sowing window to early February without incurring high-yield loss due to the late sowing.

4.4. Agronomic Significance

Namibia's current pearl millet yield level is relatively low [2,44], requiring scientific intervention to improve household food self-sufficiency and national food security. National production data show domestic grain production over the past 10 years (2012–2021) never reached 50% of the national cereal requirements; the shortfalls were covered with imported grains and grain products [44,45]. The present study demonstrated that matching specific varieties to sowing windows during the growing season could improve pearl millet grain production in the NCR (Figure 6 and Figure 6). Therefore, smallholder farmers adopting appropriate production strategies for major crops, such as pearl millet, could increase yields, thus improving household food security and socioeconomic status [46]. Applying the optimal sowing window production strategy could provide maximum pearl millet yield benefit in the NCR. This crop management strategy would be more effective if integrated with other improved production approaches proposed for the local agroecosystem. Such approaches include crop diversification and mixed planting [47,48], ridge-furrow tillage [49,50], and climate-smart agriculture (CSA), including conservation agriculture (CA) [51,52].
Nevertheless, some critical field management strategies for increasing pearl millet yields, such as supplemental fertilization and irrigation and optimal plant population, have not been scientifically determined for local conditions, despite existing scientific evidence that such strategies increase pearl millet productivity [53,54,55]. Nevertheless, it would be wise to sensitize local farmers regarding the beneficial effects of sowing the suitable pearl millet variety at the right time to maximize grain production and enhance farmers' living standards. In a way, the proposed crop management strategy would contribute to improved production efficiency and increased grain production, increased sales of surplus production, and improved farmers’ income from agriculture, ultimately leading to an enhanced socioeconomic situation for the farmers in the NCR.
Future studies aiming at improving pearl millet yields in the NCR should focus on determining the crop’s fertilizer requirements and optimal plant density to efficiently utilize production inputs and resources. It is also essential to translate the results of this study into economic value to encourage smallholder farmers in Namibia and elsewhere to adopt appropriate crop management techniques and produce surplus grains for food security and income generation.

5. Conclusions

Pearl millet grain production in Namibia's North-Central Region (NCR) can be increased by appropriately matching varieties to sowing time. The cubic polynomial regression models revealed a higher grain yield potential of the landrace variety Kantana compared with the improved Okashana-2 variety under early sowing and a negative relationship between delayed sowing and grain yields for Kantana. Kantana sown between the 1st and 14th of January exhibited a yield advantage over Okashana-2. By contrast, Okashana-2 sown across January displayed more stable grain yields than Kantana, surpassing that of its counterpart by up to 9.4% between 14 January and 1 March. Both varieties gave the lowest grain yields when sown in March, possibly due to resource decline as the summer growing season approaches cessation. The results suggest that the optimal sowing window for pearl millet in the NCR is from 1–21 January, with Kantana better sown between 1–7 January and Okashana-2 sown across the entire three weeks. Analyses of time series rainfall data revealed high annual and monthly rainfall variabilities, with insignificant monotonic negative trends for November–February rainfalls, implying a shortening growing season in the NCR. Future studies should investigate the economics of sowing dates to demonstrate to farmers and policymakers the potential financial benefits or losses associated with the different sowing dates and varieties. These results should be crucial for other semi-arid agroclimatic regions where pearl millet is cultivated for grain production.

Author Contributions

Conceptualization, SK. KH and JS; methodology, KH and SK; software, K.H.and SK; validation, SK., HN, ES, BC, LN, SA, LS and OD.; formal analysis, SK, KH, HN and OD.; investigation, SK, JS and BC; resources, SK, OD, and SA.; writing—original draft preparation, SK; writing—review and editing, KH, ES, JS, SA and LS; visualization, K.H. and SK; project administration, SK and OD; funding acquisition, SK and OD. All authors have read and agreed to the published version of the manuscript.

Funding

The publication of this article has been financially supported by the University of Namibia.

Data Availability Statement

The data for this study are available, from the authors, on request.

Acknowledgments

The authors thank the University of Namibia-Ogongo Campus students—T. Lukas, A. M. Haufiku, B. Angelius, and K. Murangi for assisting with data collection. We also thank the Ogongo Campus Management for availing of facilities and resources for the study. This study did not receive any funds from funding agencies.

Conflicts of Interest

The authors declare no conflict of interest.

References

  1. Namibia Statistics Agency Namibia 2011 Population & Housing Census - Main Report; Windhoek, 2013.
  2. Hirooka, Y.; Masuda, T.; Watanabe, Y.; Izumi, Y.; Inai, H.; Awala, S.K.; Iijima, M. Agronomic and Socio-Economic Assessment of the Introduction of a Rice-Based Mixed Cropping System to Cuvelai Seasonal Wetland System in Northern Namibia. Agrekon 2021, 60, 145–156. [Google Scholar] [CrossRef]
  3. Mendelsohn, J.; Weber, B. Cuvelai: The Cuvelai Basin, Its Water and People in Angola and Namibia; Development Workshop Angola: Luanda, 2011; ISBN 978-99916-780-7-8. [Google Scholar]
  4. Mendelsohn, J.; Jarvis, A.; Roberts, C.; Robertson, T. Atlas of Namibia: A Portrait of the Land and Its People; David Philip Publishers: Cape Town, 2002; ISBN 1435-1935. [Google Scholar]
  5. Hove, K.; Johannes, J.; Hatutale, G.; Awala, S.K.; Ausiku, P. Growth and Yield Response of Swiss Chard (Beta Vulgaris (L.) to Media Mixture Ratios of Sand, Acacia Soil, and Goat Manure. Magna Sci. Adv. Biol. Pharm. 2020, 1, 018–024. [Google Scholar] [CrossRef]
  6. McDonagh, J.F.; Hillyer, A.E.M. Grain Legumes in Pearl Millet Systems in Northern Namibia: An Assessment of Potential Nitrogen Contributions. Exp. Agric. 2003. [Google Scholar] [CrossRef]
  7. Mendelsohn, J.; Jarvis, A.; Robertson, T. A Profile and Atlas of the Cuvela - Etosha Basin; RAISON: Windhoek, 2013; ISBN 9991678077. [Google Scholar]
  8. Awala, S.K.; Hove, K.; Wanga, M.A.; Valombola, J.S.; Mwandemele, O.D. Rainfall Trend and Variability in Semi-Arid Northern Namibia: Implications for Smallholder Agricultural Production. Welwitschai Int. J. Agric. Sci. 2019, 1, 1–25. [Google Scholar]
  9. Brown, C.E. Coefficient of Variation. In Applied multivariate statistics in geohydrology and related sciences; Springer: Berlin, Heidelberg, 1998; pp. 155–157. [Google Scholar]
  10. Mann, H.B. Nonparametric Tests against Trend. Econom. J. Econom. Soc. 1945, 13, 245–259. [Google Scholar] [CrossRef]
  11. Kendall, M.G.; Stuart, A. The Advanced Theory of Statistics, Vol. 2: Inference and Relationship.; Waffler Publishing: New York, 1967; ISBN 0852640110. [Google Scholar]
  12. Sen, P.K. Estimates of the Regression Coefficient Based on Kendall’s Tau. J. Am. Stat. Assoc. 1968, 63, 1379–1389. [Google Scholar] [CrossRef]
  13. Hirsch, R.M.; Slack, J.R.; Smith, R.A. Techniques of Trend Analysis for Monthly Water Quality Data. Water Resour. Res. 1982, 18, 107–121. [Google Scholar] [CrossRef]
  14. Modarres, R.; de Paulo Rodrigues da Silva, V. Rainfall Trends in Arid and Semi-Arid Regions of Iran. J. Arid Environ. 2007, 70, 344–355. [Google Scholar] [CrossRef]
  15. Blain, G.C. The Mann-Kendall Test: The Need to Consider the Interaction between Serial Correlation and Trend. Acta Sci. Agron. 2013, 35, 393–402. [Google Scholar] [CrossRef]
  16. Monyo, E.S.; Gupta, S.C.; Muuka, F.; Ipinge, S.A.; Chambo, H.; Mpofu, L.; Chintu, E.; Mogorosi, M.; Mutaliano, J. Pearl Millet Cultivars Released in the SADC Region. ICRISAT, Bulawayo 2002. [Google Scholar]
  17. Mgonja, M.A.; Monyo, E.S.; Chandra, S. Enhancing Crop Breeding Programmes: The Case of Sorghum and Pearl Millet in Southern Africa. African Crop Sci. J. 2005, 13, 201–208. [Google Scholar]
  18. Ipinge, S.A. The Effects of Dates of Planting on Yield and Yield Components of Pearl Millet. Agricola 2001, 12, 50–51. [Google Scholar]
  19. Monyo, E.S. 15 Years of Pearl Millet Improvement in the SADC Region. Int. Sorghum Millet Newsl. 1998, 39, 17–33. [Google Scholar]
  20. Traore, B.; Corbeels, M.; van Wijk, M.T.; Rufino, M.C.; Giller, K.E. Effects of Climate Variability and Climate Change on Crop Production in Southern Mali. Eur. J. Agron. 2013, 49, 115–125. [Google Scholar] [CrossRef]
  21. Eckardt, F.D.; Soderberg, K.; Coop, L.J.; Muller, A.A.; Vickery, K.J.; Grandin, R.D.; Jack, C.; Kapalanga, T.S.; Henschel, J. The Nature of Moisture at Gobabeb, in the Central Namib Desert. J. Arid Environ. 2013, 93, 7–19. [Google Scholar] [CrossRef]
  22. Lu, X.; Wang, L.; Pan, M.; Kaseke, K.F.; Li, B. A Multi-Scale Analysis of Namibian Rainfall over the Recent Decade – Comparing TMPA Satellite Estimates and Ground Observations. J. Hydrol. Reg. Stud. 2016, 8, 59–68. [Google Scholar] [CrossRef]
  23. Mongi, H.; Majule, A.E.; Lyimo, J.G. Vulnerability and Adaptation of Rain Fed Agriculture to Climate Change and Variability in Semi-Arid Tanzania. African J. Environ. Sci. Technol. 2010, 4, 371–381. [Google Scholar] [CrossRef]
  24. Kangalawe, R.Y.M.; Lyimo, J.G. Climate Change, Adaptive Strategies and Rural Livelihoods in Semiarid Tanzania. Nat. Resour. 2013, 04, 266–278. [Google Scholar] [CrossRef]
  25. Dhanya, P.; Ramachandran, R. Farmers’ Perceptions of Climate Change and the Proposed Agriculture Adaptation Strategies in a Semi Arid Region of South India. J. Integr. Environ. Sci. 2016, 13, 1–18. [Google Scholar] [CrossRef]
  26. Tschakert, P.; Sagoe, R.; Ofori-Darko, G.; Codjoe, S.N. Floods in the Sahel: An Analysis of Anomalies, Memory, and Anticipatory Learning. Clim. Change 2010, 103, 471–502. [Google Scholar] [CrossRef]
  27. Anthonj, C.; Nkongolo, O.T.; Schmitz, P.; Hango, J.N.; Kistemann, T. The Impact of Flooding on People Living with HIV: A Case Study from the Ohangwena Region, Namibia. Glob. Health Action 2015, 8, 26441. [Google Scholar] [CrossRef] [PubMed]
  28. Mendelsohn, J. ; Obeid, el S.; Roberts, C. A Profile of North-Central Namibia, Ed.; Gamsberg Macmillan Publishers: Windhoek, 2000; ISBN 99916-0-215-1. [Google Scholar]
  29. Yamusa, A.M.; Abubakar, I.U.; Falaki, A.M. Rainfall Variability and Crop Production in the North-Western Semi-Arid Zone of Nigeria. J. Soil Sci. Environ. Manag. 2015, 6, 125–131. [Google Scholar] [CrossRef]
  30. Sarr, B. Present and Future Climate Change in the Semi-arid Region of West Africa: A Crucial Input for Practical Adaptation in Agriculture. Atmos. Sci. Lett. 2012, 13, 108–112. [Google Scholar] [CrossRef]
  31. Vicente-Serrano, S.M.; Cabello, D.; Tomás-Burguera, M.; Martín-Hernández, N.; Beguería, S.; Azorin-Molina, C.; Kenawy, A. El Drought Variability and Land Degradation in Semiarid Regions: Assessment Using Remote Sensing Data and Drought Indices (1982-2011). Remote Sens. 2015, 7, 4391–4423. [Google Scholar] [CrossRef]
  32. Kihupi, N.I.; Tarimo, A.K.P.R.; Masika, R.J.; Boman, B.; Dick, W.A. Trend of Growing Season Characteristics of Semi-Arid Arusha District in Tanzania. J. Agric. Sci. 2015, 7, 45–55. [Google Scholar] [CrossRef]
  33. Persendt, F.C.; Gomez, C.; Zawar-Reza, P. Identifying Hydro-Meteorological Events from Precipitation Extremes Indices and Other Sources over Northern Namibia, Cuvelai Basin. Jàmbá J. Disaster Risk Stud. 2015, 7, 18. [Google Scholar] [CrossRef]
  34. Mphale, K.M.; Dash, S.K.; Adedoyin, A.; Panda, S.K. Rainfall Regime Changes and Trends in Botswana Kalahari Transect’s Late Summer Precipitation. Theor. Appl. Climatol. 2014, 116, 75–91. [Google Scholar] [CrossRef]
  35. Batisani, N.; Yarnal, B. Rainfall Variability and Trends in Semi-Arid Botswana: Implications for Climate Change Adaptation Policy. Appl. Geogr. 2010, 30, 483–489. [Google Scholar] [CrossRef]
  36. Chikodzi, D.; Murwendo, T.; Simba, F.M. Climate Change and Variability in Southeast Zimbabwe: Scenarios and Societal Opportunities. Am. J. Clim. Chang. 2013, 02, 36–46. [Google Scholar] [CrossRef]
  37. Kiros, G.; Shetty, A.; Nandagiri, L. Extreme Rainfall Signatures under Changing Climate in Semi-Arid Northern Highlands of Ethiopia. Cogent Geosci. 2017, 3, 1353719. [Google Scholar] [CrossRef]
  38. Addisu, S.; Selassie, Y.G.; Fissha, G.; Gedif, B. Time Series Trend Analysis of Temperature and Rainfall in Lake Tana Sub-Basin, Ethiopia. Environ. Syst. Res. 2015, 4, 25. [Google Scholar] [CrossRef]
  39. Nwajei, S.E.; Omoregie, A.U.; Ogedegbe, F.O. Effects of Planting Dates on the Growth and Grain Yield of Two Indigenous Varieties of Pearl Millet (Pennisetum Glaucum (L.) R.Br.) in a Forest-Savanna Transition Zone of Edo State, Nigeria. Acta Agric. Slov. 2019, 114, 169–181. [Google Scholar] [CrossRef]
  40. Nwajei, S.E. Effects of Planting Dates on the Crude Protein and Nutrient Uptake of Two Varieties of Millet ( Pennisetum Typhoides ( Burm. f.)) Stapf & Hubbard in a Forest-Savanna Transition Zone of Edo State. Sustain. Agri, Food Environ. Res. 2023, 11, 1–14. [Google Scholar] [CrossRef]
  41. Omoregie, A.U.; Nwajei, S.E.; Iredia, B.E. Effects of Planting Density on the Growth and Forage Yield of Two Varieties of Millet (Pennisetum Typhoides Burm. F.) Grown in Ekpoma, Nigeria. Sustain. Agri, Food Environ. Res. 2020, 8, 118–128. [Google Scholar] [CrossRef]
  42. Cerioli, T.; Gentimis, T.; Linscombe, S.D.; Famoso, A.N. Effect of Rice Planting Date and Optimal Planting Window for Southwest Louisiana. Agron. J. 2021, 113, 1248–1257. [Google Scholar] [CrossRef]
  43. Slaton, N.A.; Linscombe, S.D.; Norman, R.J.; Gbur, E.E. Seeding Date Effect on Rice Grain Yields in Arkansas and Louisiana. Agron. J. 2003, 95, 218. [Google Scholar] [CrossRef]
  44. FAOSTAT Food and Agriculture Organization of the United Nation Statistics Available online:. Available online: https://www.fao.org/faostat/en/#data (accessed on 8 January 2023).
  45. 2018.
  46. Awala, S.K.; Hove, K.; Shivute, V.; Valombola, J.S.; Nanhapo, P.I.; Hirooka, Y.; Mwandemele, O.D.; Iijima, M. Growth and Productivity Assessment of Short-Duration Rice (Oryza Sativa L. and Upland NERICA) Genotypes in Semiarid North-Central Namibia. Adv. Agric. 2021, 2021, 1–10. [Google Scholar] [CrossRef]
  47. Iijima, M.; Awala, S.K.; Watanabe, Y.; Kawato, Y.; Fujioka, Y.; Yamane, K.; Wada, K.C. Mixed Cropping Has the Potential to Enhance Flood Tolerance of Drought-Adapted Grain Crops. J. Plant Physiol. 2016, 192, 21–25. [Google Scholar] [CrossRef]
  48. Awala, S.K.; Yamane, K.; Izumi, Y.; Fujioka, Y.; Watanabe, Y.; Wada, K.C.; Kawato, Y.; Mwandemele, O.D.; Iijima, M. Field Evaluation of Mixed-Seedlings with Rice to Alleviate Flood Stress for Semi-Arid Cereals. Eur. J. Agron. 2016, 80, 105–112. [Google Scholar] [CrossRef]
  49. Hirooka, Y.; Shoji, K.; Watanabe, Y.; Izumi, Y.; Awala, S.K.; Iijima, M. Ridge Formation with Strip Tillage Alleviates Excess Moisture Stress for Drought-Tolerant Crops. Soil Tillage Res. 2019, 195, 1–8. [Google Scholar] [CrossRef]
  50. Iijima, M.; Awala, S.K.; Nanhapo, P.I.; Wanga, A.; Mwandemele, O.D. Development of Flood-and Drought-Adaptive Cropping Systems in Namibia. In Crop Production under Stressful Conditions; Springer, 2018; pp. 49–70. [Google Scholar]
  51. Siyambango, N.; Togarepi, C.; Mudamburi, B.; Mupambwa, H.A.; Awala, S. Climate-Smart Agriculture: Perspectives for Subsistence Crop Farming in Namibia. In Food Security for African Smallholder Farmers; Springer, 2022; pp. 251–266. [Google Scholar]
  52. Mudamburi, B.; Ogunmokun, A.A.; Kachigunda, B. A Comparison of the Effects of Conventional and Namibia Specific Conservation Tillage Methods Used in Ogongo, Namibia on Root Development and Yield of Pearl Millet. Volume 1. Am. Sci. Res. J. Eng. Technol. Sci. 2018, 40, 27–39. [Google Scholar]
  53. Ajeigbe, H.A.; Akinseye, F.M.; Kunihya, A.; Abdullahi, I.; Kamara, A.Y. Response of Pearl Millet (Pennisetum Glaucum L.) to Plant Population in the Semi-Arid Environments of Nigeria. Net J. Agric. Sci. 2019, 7, 13–22. [Google Scholar] [CrossRef]
  54. Ausiku, A.P.; Annandale, J.G.; Steyn, J.M.; Sanewe, A.J. Improving Pearl Millet (Pennisetum Glaucum) Productivity through Adaptive Management of Water and Nitrogen. Water 2020, 12, 422. [Google Scholar] [CrossRef]
  55. Reddy, S.B.P.; Madhuri, K.V.N.; Venkaiah, K.; Prathima, T. Effect of Nitrogen and Potassium on Yield and Quality of Pearl Millet ( Pennisetum Glaucum L.). Int. J. Agric. Innov. Res. Vol. 2016, 4, 678–681. [Google Scholar]
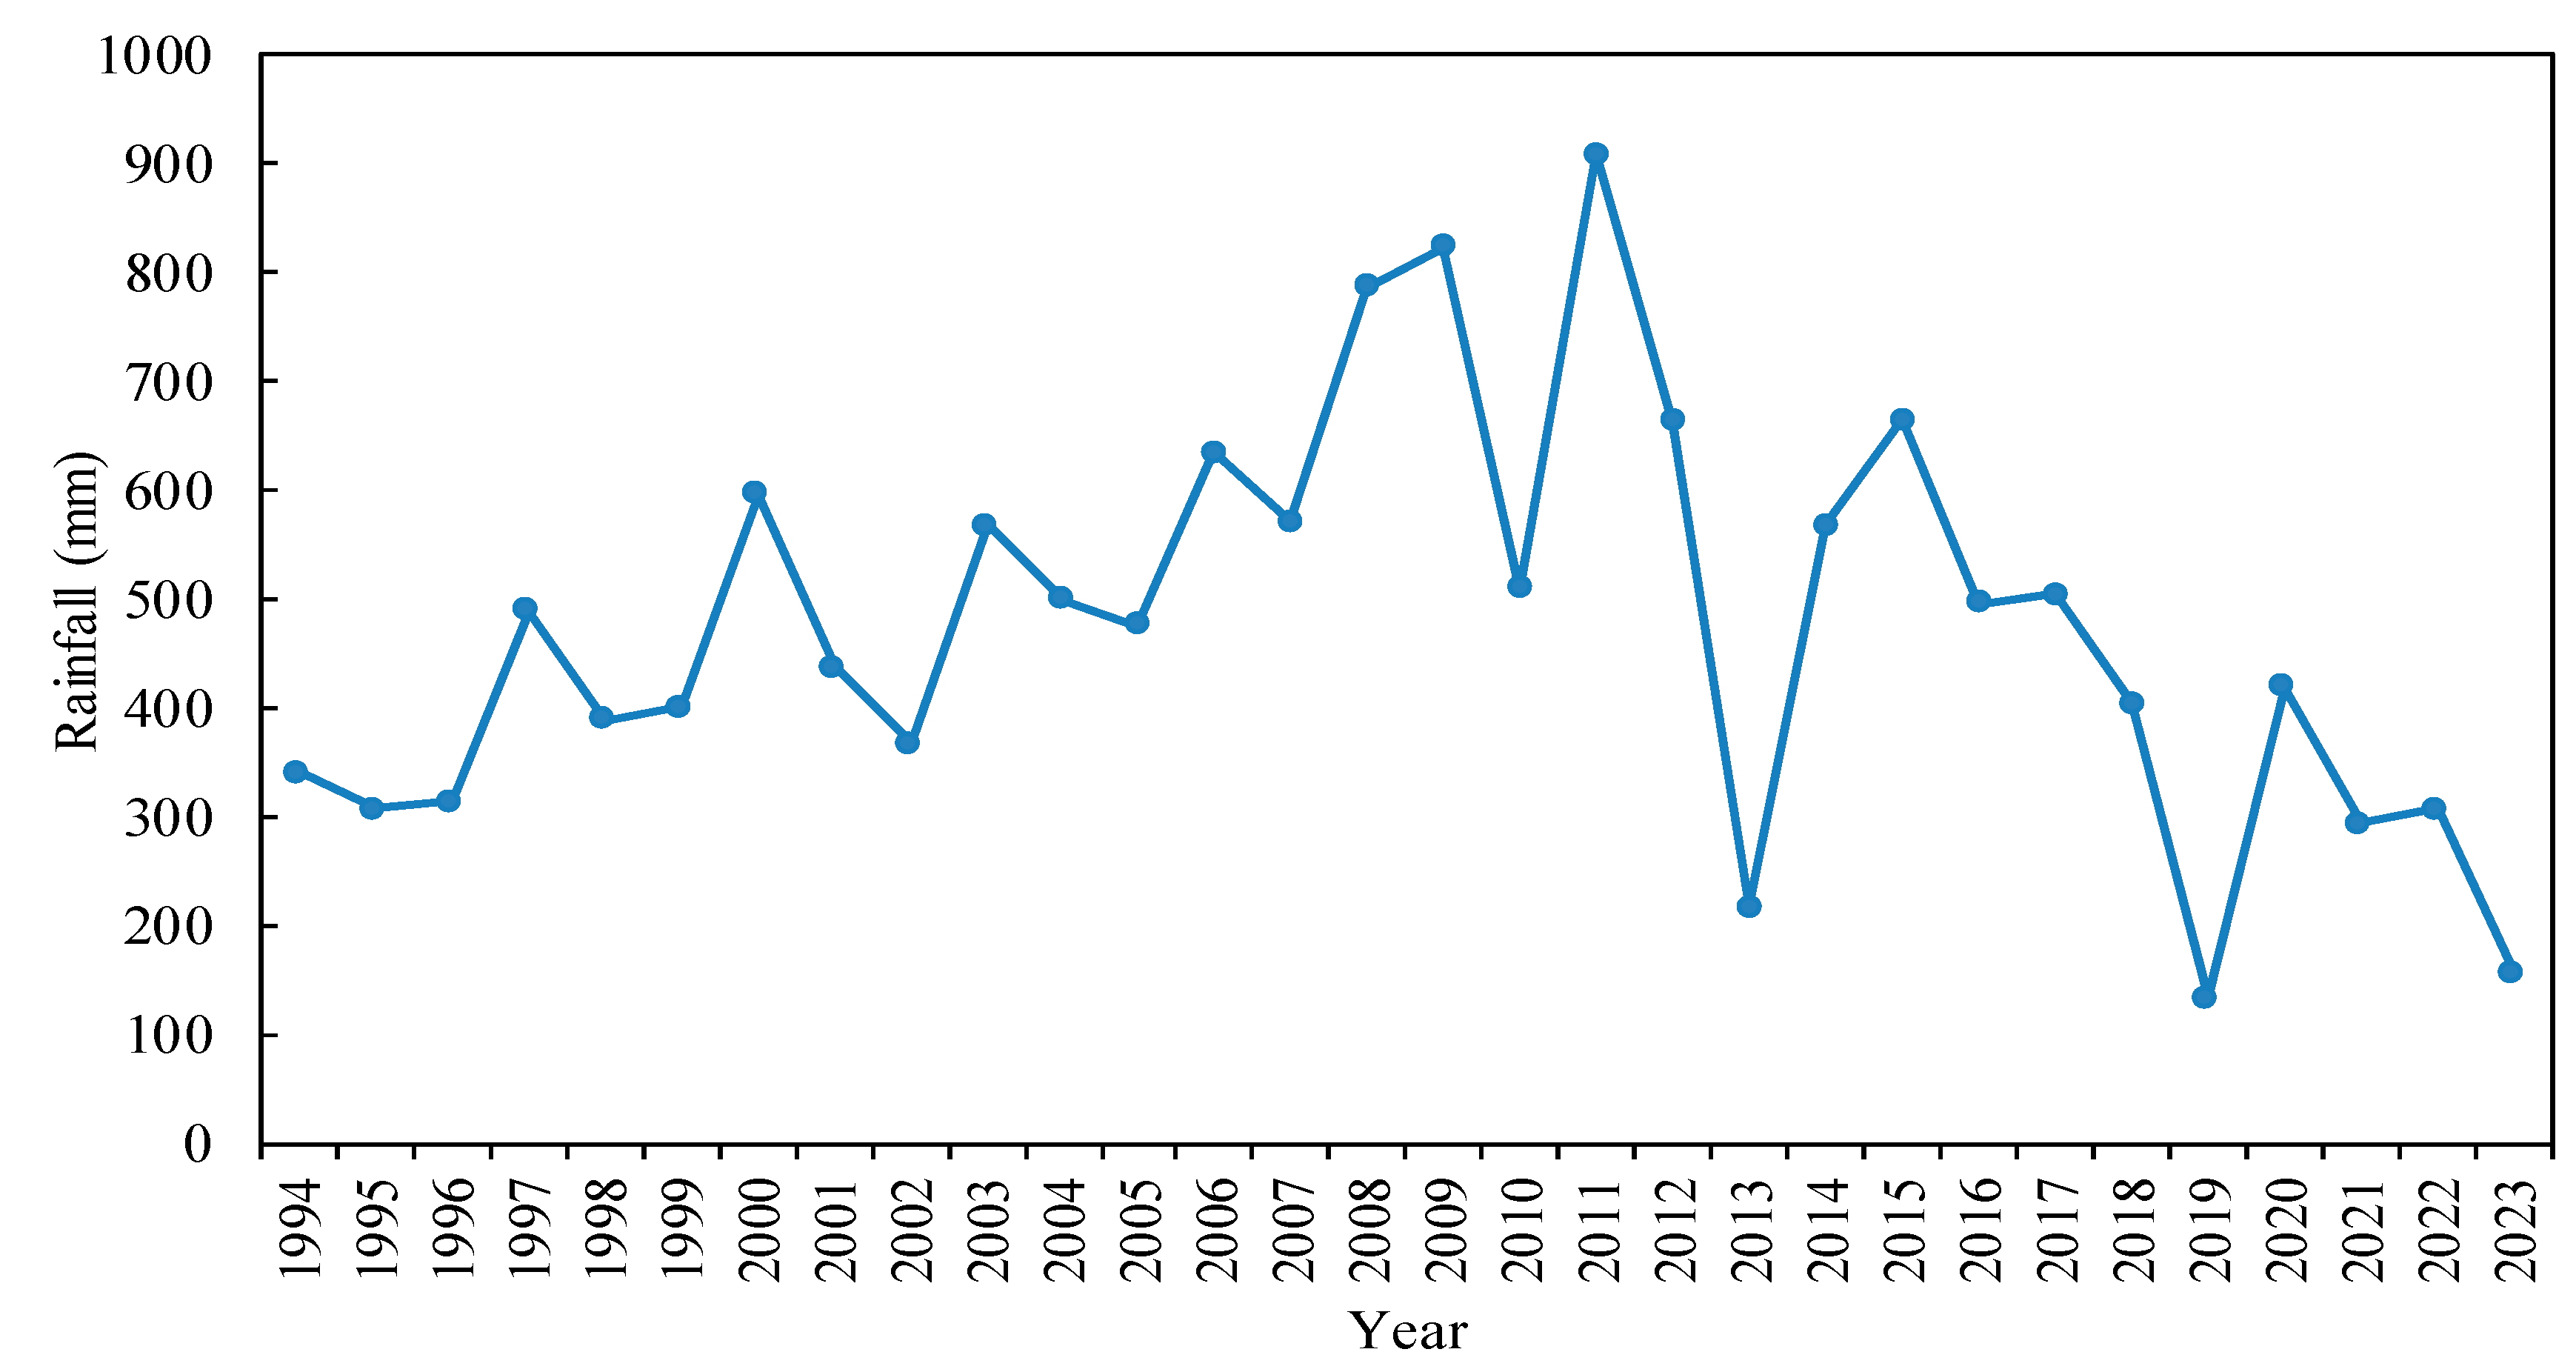
Figure 2. Annual rainfall patterns at Omahenene Research Station, North-Central Namibia, during 1994–2023.
Preprints 80510 g002
Figure 3. Patterns of monthly rainfall, November–April, at Omahenene Research Station, North-Central Namibia, 1994–2023.
Preprints 80510 g003
Figure 4. Patterns of the (a) monthly average solar radiation and temperature and (b) monthly average total rainfall for pooled data of the 2017/2018 and 2019/2020 growing seasons.
Preprints 80510 g004
Figure 5. Pooled grain yield response of Kantana and Okashana-2 pearl millet varieties to sowing date at the University of Namibia-Ogongo Campus.
Preprints 80510 g005
Figure 6. Box plots showing average grain yields of Kantana and Okashana-2 pearl millet varieties as influenced by delaying sowing by weeks across January at the University of Namibia-Ogongo Campus.
Preprints 80510 g006
Table 1. Statistical characteristics of annual and monthly rainfall at Omahenene Research Station, North-Central Namibia during 1994–2023.
Statistic Annual Month
May Jun Jul Aug Sep Oct Nov Dec Jan Feb Mar Apr
Mean (mm) 475.1 1.5 0.0 0.0 0.0 0.2 10.3 38.5 71.6 103.4 107.3 112.6 29.7
SD 185.4 5.7 0.0 0.0 0.0 1.1 18.5 31.6 65.3 66.4 86.8 72.4 35.6
Table 2. Mann-Kendall statistic (ZMK) and Sen’s slope estimator for total annual and average monthly rainfall at Omahenene Research Station, North-Central Namibia, 1994–2023.
Statistic Annual Dry season Rainy season
May Jun Jul Aug Sep Oct Nov Dec Jan Feb Mar Apr
ZMK -0.002 0.000 0.000 0.000 0.000 0.116 -0.094 -0.011 -0.097 -0.062 -0.140 0.083 0.102
P-value 1.000 0.000 0.000 0.000 0.000 0.488 0.498 0.943 0.464 0.643 0.284 0.532 0.442
Sen's slope (mm/year) -0.036 0.000 0.000 0.000 0.000 0.000 0.000 -0.033 -0.800 -0.833 -1.727 0.763 0.194
Table 3. Relative grain yield prediction for Kantana and Okashana-2 pearl millet varieties with the cubic polynomial regression models of days of the year.
Day of the year Calendar date Relative yield (%)
Kantana Okashana-2
1 1-Jan 100 64
7 7-Jan 82 67
14 14-Jan 66 67
21 21-Jan 55 63
28 28-Jan 47 57
35 4-Feb 43 50
42 11-Feb 40 44
49 18-Feb 38 40
56 27-Feb 36 38
Data represent combined relative average values for the 2017/2018 and 2019/2020 growing seasons.
Disclaimer/Publisher’s Note: The statements, opinions and data contained in all publications are solely those of the individual author(s) and contributor(s) and not of MDPI and/or the editor(s). MDPI and/or the editor(s) disclaim responsibility for any injury to people or property resulting from any ideas, methods, instructions or products referred to in the content.
Copyright: This open access article is published under a Creative Commons CC BY 4.0 license, which permit the free download, distribution, and reuse, provided that the author and preprint are cited in any reuse.
Prerpints.org logo

Preprints.org is a free preprint server supported by MDPI in Basel, Switzerland.

Subscribe

© 2024 MDPI (Basel, Switzerland) unless otherwise stated