
Submitted:
26 July 2023
Posted:
27 July 2023
You are already at the latest version
Abstract
The variability observed in the annual seed production of perennial plants can be seen as an indication of changes in the allocation of resources between growth and reproduction, which can be attributed to fluctuations in the environment. However, a significant knowledge gap exists concerning the impacts of nitrogen addition on the interannual seed production patterns of perennial plant. We hypothesized that the addition of nitrogen would impact the annual variations in the seed production of perennial plants, ultimately affecting their overall reproductive efficiency. A multiyear field experiment was conducted to investigate the effects of varying nitrogen supply levels (e.g., 0, 4, 8 kg N ha−1 yr−1 of N0, N4, and N8) on the vegetative and floral traits, pollinator visitation rates, and seed traits over a period of four consecutive years. The results showed that the N0 treatment exhibited the highest levels of seed production and reproductive efficiency within the initial two years. In contrast, the N4 treatment displayed its highest level of performance in these metrics in the second and third years, whereas the N8 treatment showcased its most favorable outcomes in the third and fourth years. The similar patterns were found in the number of flowers per capitulum and the number of capitula per plant. There exists a positive correlation between aboveground biomass and several factors, encompassing the number of flowers per capitulum, the number of capitula per plant, the volume of nectar per capitulum, and the seed production per plant. This implies that the addition of N affected the maintenance of plant aboveground biomass, flower traits stability and, subsequently, the frequency of seed production, and the reproductive efficiency. Our results suggest that augmenting the nitrogen content in the soil may have the capacity to modify the inherent variability in seed production that is observed across various years. These findings have the potential to enhance our comprehension of the impact of nitrogen addition on the reproductive performance of perennial herbaceous plants, and the underlying mechanisms of biodiversity in the context of global environmental changes.
Keywords:
Reproductive success
; Biodiversity
; Plant-pollinator interactions
; Nitrogen applies
; Alpine meadow
1. Introduction
The fundamental principle underlying life-history theory revolves around the notion of trade-offs and the allocation of scarce resources to either reproduction or growth and maintenance necessary for survival [1]. Furthermore, a considerable portion of perennial species demonstrate the ability to undergo multiple cycles of growth and reproduction, enabling them to reproduce across multiple seasons. However, it is imperative to recognize that there exists notable year-to-year variability in the seed production of perennial herbs in response to the prevailing growth conditions [1,2]. Plants exhibit enhanced seed production when subjected to favorable years, which encompass optimal soil moisture and nutrient levels as well as suitable weather conditions [3,4]. In light of unfavorable years, there is a decrease in the overall yield of seeds [1,3]. Thus, there is a diverse range of interannual variation in seed production that is associated with different growth years.
The global distribution of resources is undergoing substantial changes due to the increasing levels of carbon dioxide (CO2), deposition of nutrients, and alterations in land use. Predictive models indicate that multiple factors associated with global change have the potential to modify interannual variation in seed output [3]. The introduction of nitrogen into the soil has a significant influence on the nutrient cycle, particularly in relation to the plant's ability to obtain readily available resources [5,6]. In theory, the introduction of nitrogen presents a challenge in allocating resources between growth and reproduction, thereby influencing the annual fluctuations in the seed production capacity of perennial plants. As a result, this phenomenon leads to an increase in their overall reproductive efficiency. Nonetheless, there is a notable deficiency in our understanding of the effects of nitrogen supply on the interannual variations in seed production patterns of perennial plant.
The impact of nitrogen on the annual fluctuations in reproductive allocation is regulated by its influence on the composition of soil nutrients [1,3]. During the early stages of development, plants that are grown in adequate-N habitats allocate a higher proportion of their resources towards the growth and development of their vegetative organs [7,8]. Subsequently, plants demonstrate an increased allocation of biomass towards their reproductive structures, resulting in an amplified production of flowers [9,10]. Additionally, the influence of nitrogen is a significant factor in the annual fluctuations of plant biomass, as it affects the storage of carbohydrates and the distribution of carbon resources [11,12]. This phenomenon possesses the capacity to induce annual variations in seed production. Additionally, the introduction of nitrogen has the potential to impact both the flower production and the nectar secretion [13,14,15]. The alterations in floral traits have the potential to influence the pollinator foraging behavior, resulting in changes to the reproductive output of self-incompatibility species [9,16]. Therefore, we speculated that the addition of nitrogen would have an impact on the floral traits of perennial plants, leading to fluctuations in seed production and reproductive efficiency on an annual basis.
Based on the available empirical data, it can be deduced that there has been a significant increase in global atmospheric nitrogen inputs [16]. In Europe and North America, the nitrogen (N) addition rate commonly observed ranges from 10 to 25 kg N ha-1 year-1 [17]. However, it is important to acknowledge that in China, the yearly rate of nitrogen addition is approximately 50 kg N ha-1 year-1 [18]. The critical load of nitrogen (N) required to elicit a response from alpine meadow communities has been determined to be 10 kg N ha−1 yr−1 [19]. The wet deposition of nitrogen has been observed to vary across different regions, with 6.69 kg N ha−1 yr−1 on the western Tibetan Plateau and 7.55 kg N ha−1 yr−1 on the eastern Tibetan Plateau [20]. The examination of the responses exhibited by high-altitude ecosystems to elevated nitrogen deposition is highly appropriate for investigation on the Tibetan Plateau.
Herein, we proposed the hypothesis that the addition of nitrogen would have an impact on the annual fluctuations in the seed production of perennial plants, consequently leading to an improvement in their overall reproductive efficacy. In order to evaluate the veracity of this hypothesis, a multiyear field experiment was conducted utilizing the S. nigrescens in Tibetan meadow. The species under investigation exhibits a perennial life cycle and is dependent on honey bees for the purpose of pollination [21]. The objective of this study is to investigate the impacts of nitrogen supplementation on various aspects of plant traits, including the aboveground biomass, patterns of resource allocation, production of flowers and nectar, pollinator visitation, and seed production over multiple years. The expectation was that these factors would collectively have an impact on the interannual variation in seed production. The results of our study hold promise for advancing our understanding of the effects of nitrogen addition on the reproductive efficiency of perennial herbaceous plants, as well as the underlying mechanisms that regulate biodiversity in the context of global environmental changes.
2. Materials and methods
2.1. Study site and species
The research was carried out within the permanent plots of the Hongyuan Alpine Meadow Ecosystem Research Station, which is affiliated with the Chinese Academy of Sciences. The station is situated on the eastern Tibetan Plateau, specifically at coordinates 32°48′–32°52′N and 102°01′–102°33′E, with an altitude of 3500 m. The average annual temperature is recorded at 0.9 °C, with the highest temperature occurring in July at 10.9 °C and the lowest temperature occurring in January at -10.3 °C. The yearly average precipitation amounts to 690 mm, with approximately 80% occurring during the period from May to October. In pastures, it is common for sedges, grasses, and forb species to exhibit predominance. The overall vegetation coverage exceeds 95%, while the height of plants remains below 30 cm [21].
The grassland being studied has been subjected to yak grazing for a period of less than twenty years, specifically occurring during the winter seasons. In addition to the practice of cattle grazing, this land does not exhibit any other agricultural uses. Since the year 1981, beekeepers have been transferring substantial quantities of Apis mellifera colonies, which consist of more than 80 million honey bees, to a specifically designated study site area for the purpose of honey production. The aforementioned colonies are consistently sustained within this particular region on an annual basis, specifically from the months of May to September.
The species under investigation in our study is S. nigrescens, which belongs to the perennial herbs of the Asteraceae family. The species frequently exhibits growth patterns within altitudinal ranges spanning from 2900 to 4300 m. The species typically attains reproductive maturity approximately three years following the process of seed germination. The height of the plants ranges from 15 to 40 cm, and they produce 2 to 5 capitula. Each capitulum contains 20 to 55 florets, specifically mono-ovulated florets. The annular nectary is composed of a bowl-shaped tissue located at the upper region of the ovary, positioned between the ovary and the anther. The bowl's diameter ranges from 1.5 to 2.0 mm, while the style's diameter ranges from 0.3 to 0.5 mm. The observed species exhibits self-incompatibility and initiates its growth phase in the middle of May annually, while undergoing senescence in the middle of September [21]. Plants frequently undergo the process of flowering during the period spanning from late July to August, followed by the subsequent development of fruits occurring in early September. Honey bees (Apis mellifera) are the primary pollinators [22].
2.2. Nitrogen addition experiment
In this study, we present three levels of nitrogen (0, 4, and 8 g N m−2 yr−1) addition experiment conducted in an alpine meadow located on the eastern Tibetan Plateau [18]. The study employed a fully randomized block design, incorporating three distinct treatments: control (0 g N m−2 yr−1), N4 (4 g N m−2 yr−1), and N8 (8 g N m−2 yr−1). The three treatments were allocated randomly within a block design and replicated six times [23]. A matrix configuration comprising of 18 plots (2 × 2 m) was established. The arrangement of the plots adhered to a 3 × 6 grid pattern. The distance between adjacent plots was measured to be 3 m. The nitrogen supply was carried out using the CO(NH2)2. In light of the frequent incidence of N wet deposition, particularly during the summer season in the specified geographical area, a solution comprising CO (NH2) 2 was administered to the plots via a sprayer, specifically in the initial week of May [18]. Following the fertilization process, the vegetation underwent a thorough irrigation using water. The cumulative amount of water dispensed corresponded to approximately 2 m of precipitation. In the experimental configuration, a standardized quantity of water was evenly dispersed among the control plots [18]. Fertilization was applied to the experimental plots during the corresponding growing seasons from 2019 to 2022.
2.3. Measurements of vegetative and flower trait
In late July 2018, 8-10 seedlings were selected at random for each plot. Following that, a protective framework comprising six iron wires measuring 1mm in diameter was constructed around each individual plant, which stood at a height of 5m. During the initial flowering period, 5 plants of selection in each plot were labeled with the tags. During the period of peak flowering, we conducted the number of capitula per plant, as well as the number of flowers per capitulum from 2019 to 2022 [21].
In order to quantify the volume and concentration of nectar, a method was employed where selected plants were subjected to a 24-hour period of coverage using cylindrical metal netting [24]. This was done with the intention of preventing the access of pollinators to the plants under investigation. The volume of nectar per flower was measured using micropipettes with a capacity of 1 or 2 µl. Concurrently, a hand refractometer with a precision of 0.5% was employed to quantify the concentration of nectar (Eclipse, Stanley and Bellingham, Basingstoke, UK). Measurements were conducted during the time interval of 08:00 to 14:30. Based on our empirical observations, it was found that the presence of pale to white anthers in flowers was indicative of the highest level of nectar volume production [21]. We conducted measurements on a range of 3- 5 flowers per capitulum. Nectar volume per capitulum was calculated as nectar volume per flower multiple numbers of capitula per plant. Number of flowers per plant was calculated as the number of capitula per plant multiple numbers of flowers per capitulum.
At the end of the experiment, the aerial parts of each plant were collected and divided into leaf, capitulum, and stem. The plant materials that were collected were segregated into individual the paper bags and over-dried at 75 °C for 48 hours, and subsequently measured using a precision balance with an accuracy of 0.001g.
2.4. Measurements of pollinator visitation
Field observations were carried out during the peak blooming period of S. nigrescens spanning from 2019 and 2022, with the aim of investigating the rates of pollinator visitation. The capitula number of each sampled plant in each plot was initially recorded. Honey bee visitation to the capitula was monitored by observers at a distance of 3 m. The observation periods were evenly distributed throughout the day, occurring between 9:00 and 17:00. During each hour period, a single observer viewed each individual plant for a duration of two minutes from a stationary position. There were three observers, resulting in each individual plant being observed twice per hour. The observations documented number of capitula for each individual plant that was visited by honey bees during the observation period [25]. The observations were exclusively conducted during the sunny days and were repeated nine days per plant per year, spanning from 2019 to 2022. A cumulative duration of 144 minutes of field observations was recorded annually for each individual plant. Visitation rates (R) per capitulum per hour were calculated as the total number of visits (Nv) per hour divided by the number of capitula (Nc), i. e. R=Nv/Nc [26].
2.5. Measurements of seed traits
In the middle of September, ripened capitula were dissected to determine the number of ovules, unfertilized ovules, and viable seeds (which corresponded to the number of ovules per capitulum). The ratio of viable seeds to the total number of ovules was referred to as the seed set, i.e., seed set=seed number per capitulum/total ovule number per capitulum [21]. The number of viable seeds stands for the number of seeds per capitulum. The seeds per capitulum was also measured using a balance (0.001g) as seed yield.
Seed yield per plant was calculated as seed yield per capitulum multiple number of capitula per plant. Reproductive efficiency was calculated as the seed yield per plant divided by the sum of aboveground biomass.
2.6. Data analysis
For the purpose of analysis, the data pertaining to each trait was first averaged for every plot in this study. The statistical analyses were conducted using the R software (R Development Core Team 2020). The R software can be accessed at http://www.R-project.org/.
The data was analyzed using generalized linear mixed models (GLMMs). The fixed effects in the study encompassed N addition treatments (N0, N4, and N8) and the experimental years spanning from 2019 to 2022, while the plot was considered as a random effect. The above-ground biomass, nectar concentration, and pollinator visitation rate were modeled using a Gaussian model with an identity-link function. Next, we employed a Gamma model (with a Logit-link) and utilized the Laplace approximation to estimate parameters in order to model various factors including the number of capitula per plant, number of flowers per capitulum or per plant, nectar volume per capitulum or per plant, seed set, number of seeds per capitulum or per plant, reproductive efficiency, and reproduction allocation. The parameters were estimated using the Laplace approximation method, specifically utilizing the glm.nb function in the 'lme4' package. Upon examination of the residuals, it was determined that a normal error distribution was suitable. Following the identification of a notable impact on the N addition and the experimental year, subsequent post-hoc LSD tests were employed to conduct pairwise comparisons between N addition and the years. Calculations were performed using the glmer function from the lme4 package [27].
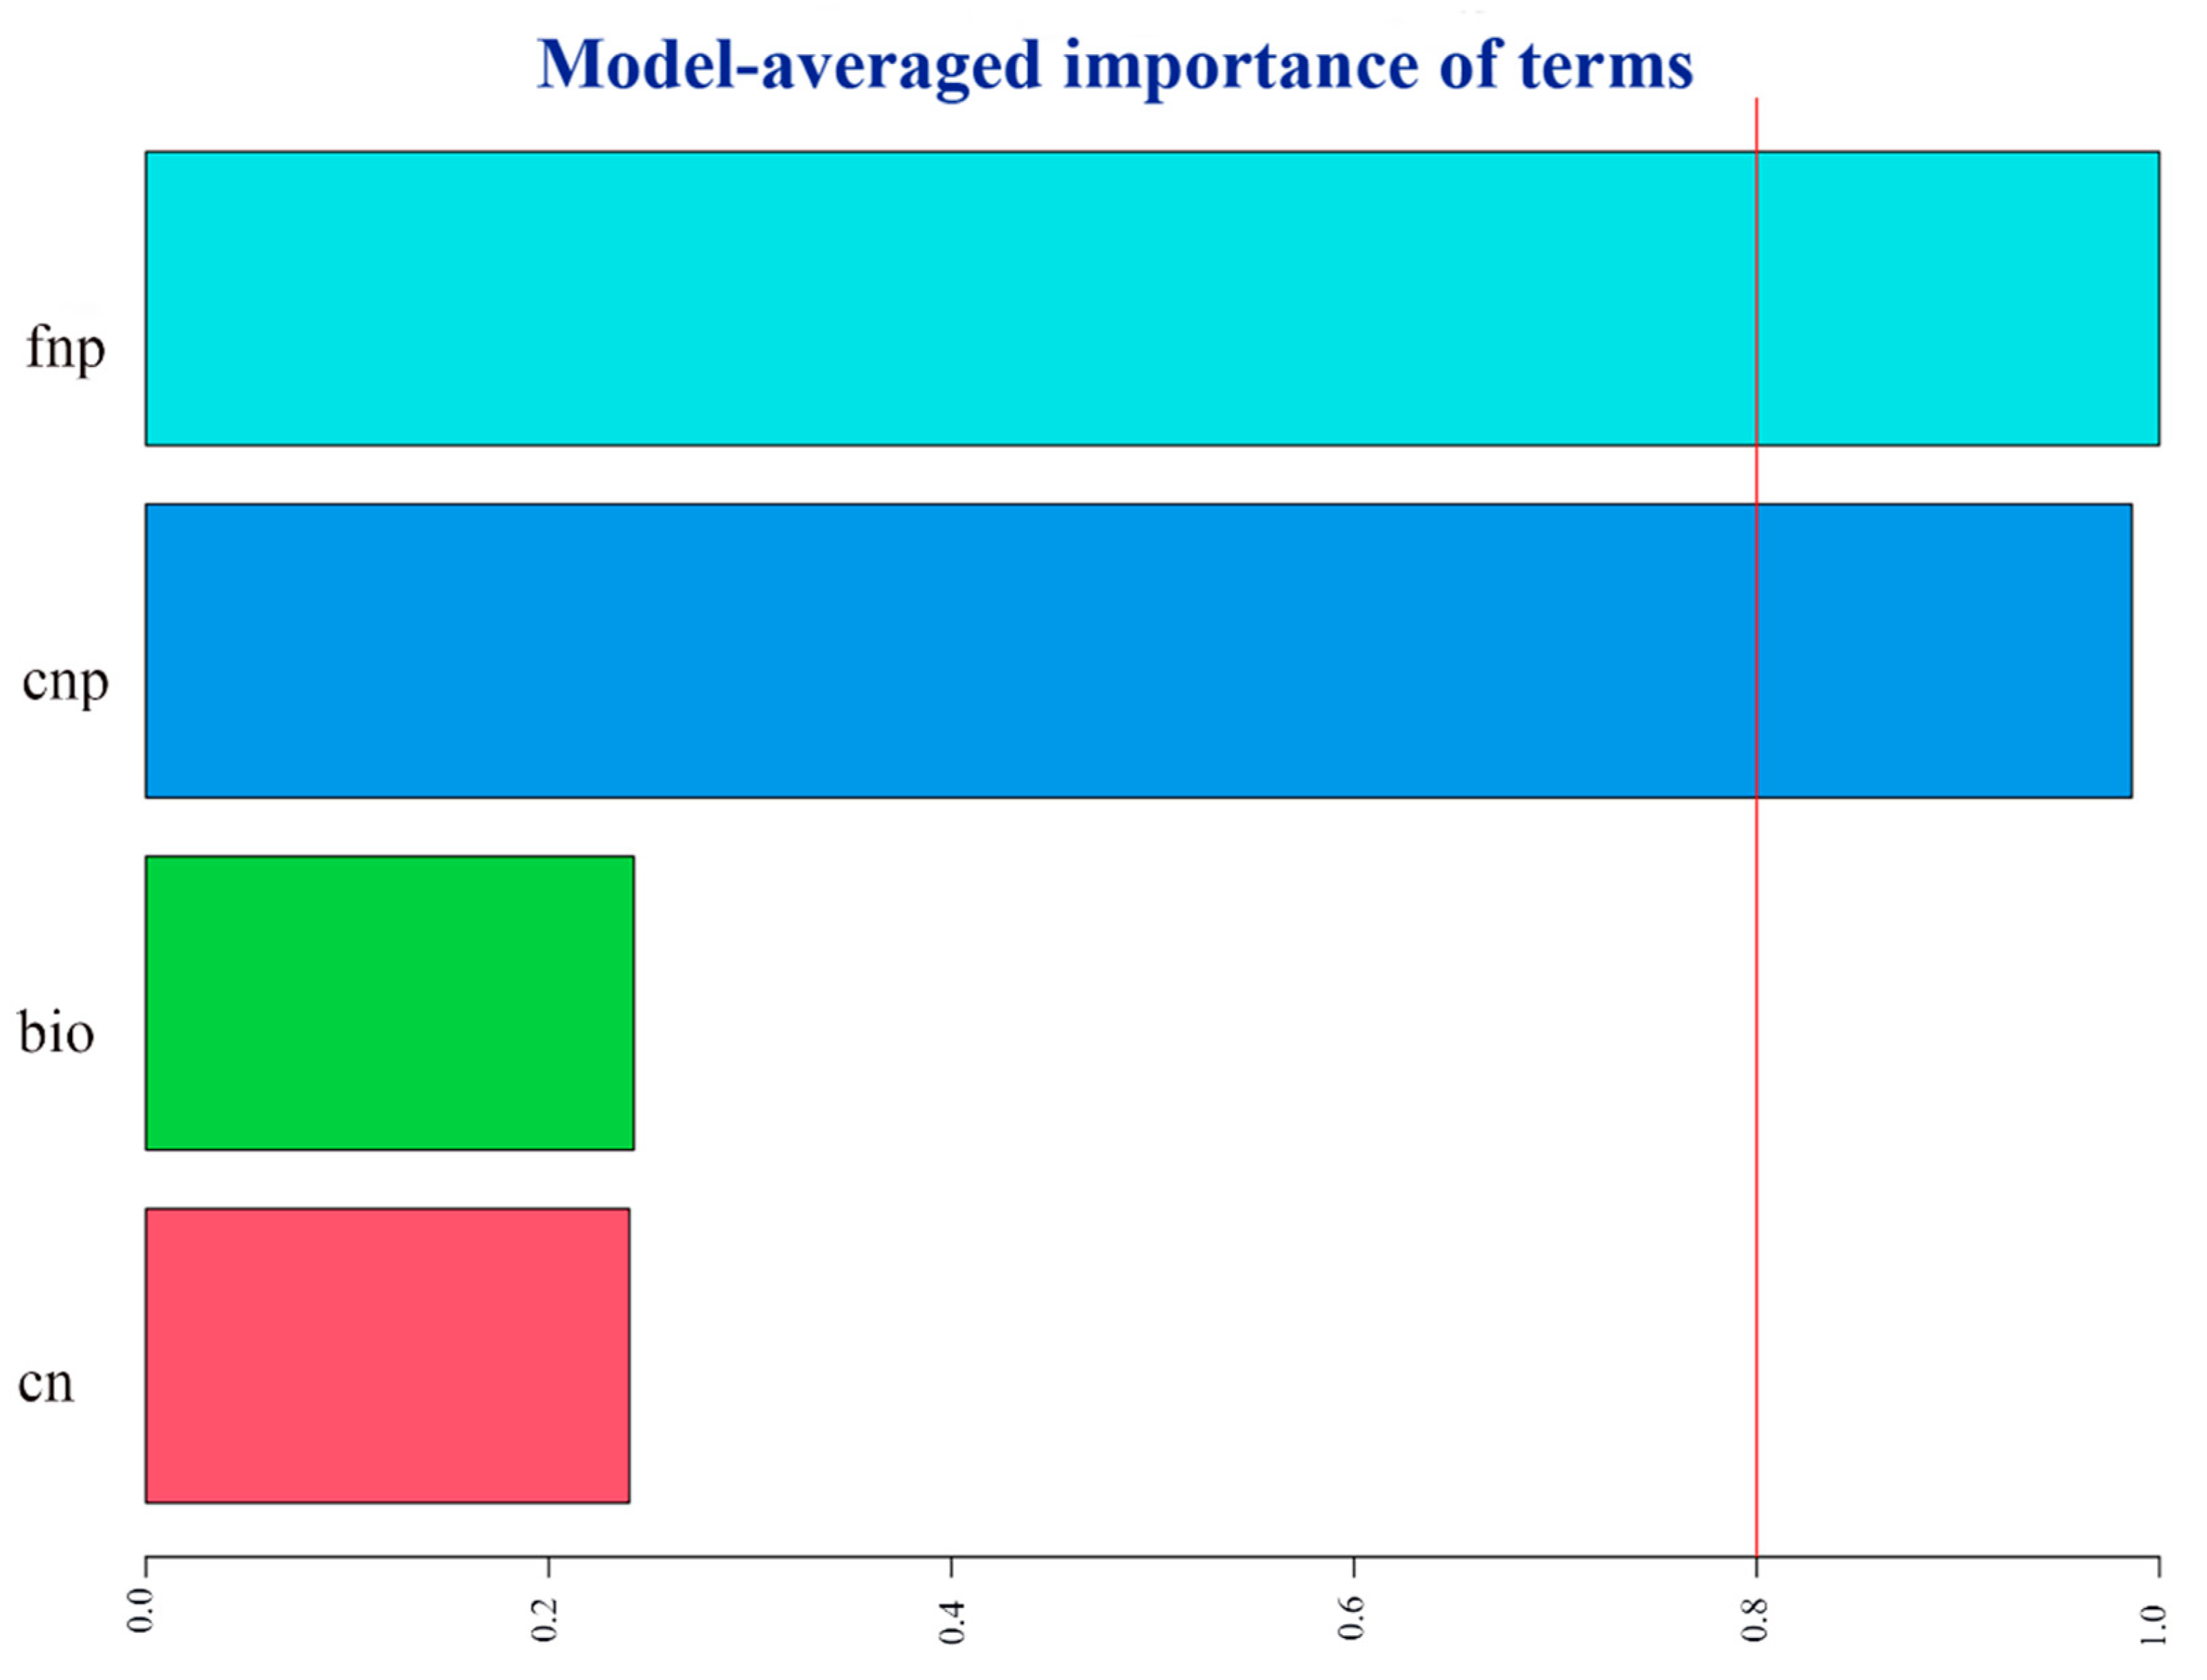
The study aimed to examine the association between flower traits, and pollinator visitation rate at the individual plant level. This investigation utilized the automated model selection method provided by the R package glmulti. The pollinator visitation rates can be influenced by several factors, including the nectar volume per capitula, nectar concentration, number of flowers per plant, and above-ground biomass. In this study, we used a random effect model with a random intercept for each plot (random = 1|plot) to account for potential variability between plots. The authors of the study conducted an analysis to determine the relative significance of each predictor in influencing the outcome [28]. A threshold value of 0.8 in order to identify the variables are deemed most significant [29].
The R package "lares" was utilized to examine the ranked cross-correlations among all plant and pollinator variables (laresbernardo.github.io/lares/reference/corr_cross.html).
3. Results
The vegetative and floral traits of S. nigrescens exhibited interannual variability, which was found to be influenced by the amount of nitrogen in the soil (Figures S1 and S2, and Tables S1 and S2). The N4 and N8 treatments exhibited the greatest aboveground biomass, stem mass and capitulum mass in the third and fourth years, whereas no significant variation in above-ground biomass was observed across the years for the N0 treatment (Figure S1). The number of capitula per plant and the number of flowers per capitulum reached their highest levels during the second and third years for the N4 treatment and in the third and fourth years for the N8 treatment. The highest recorded nectar volume per capitulum was observed in the first three years for the N0 treatment, while for the N8 treatment, it was observed in the third and fourth years. On the other hand, there was no statistically significant variation in nectar volume per capitulum for the N4 treatment across different years (Figure S2). The addition of nitrogen did not result in any year-to-year variation in nectar concentration (Figure S2).
The introduction of nitrogen had an impact on both the rate of pollinator visitation and seed set (Figure S3, Table S3). Peak pollinator visitation and seed set were observed during the initial two years for the N0 treatment and in the third and fourth years for the N8 treatment. Conversely, no discernible differences in these variables were found among the years of the N4 treatment (Figure S1).
The reproductive efficiency and seed production per capitulum or plant were found to be influenced by the nitrogen supply in the soil (Figure 1a,b; Figure S4; Table S3). The N0 treatment exhibited the highest reproductive efficiency and the greatest number of seeds per capitulum during the initial two years. Similarly, the N4 treatment demonstrated these characteristics in the second and third years, while the N8 treatment displayed them in the third and fourth years.
The introduction of nitrogen had varying effects on the correlations between different traits (Figure 2). The study revealed a positive correlation between seed production per plant and both flower production per capitulum and capitulum production per plant (Figure 2). There exists a positive correlation between the number of seeds per capitulum, the frequency of pollinator visits, and the quantity of nectar produced by each capitulum. The study revealed a positive correlation between above-ground biomass and various factors, including reproductive efficiency, seed set, pollinator visitation frequency, and the number of capitula per plant (Figure 2).
The plant's overall seed production was observed to be significantly impacted by both the seed number per capitulum and the total number of capitula (Figure 1c). Both the level of nitrogen addition and the experimental year had an impact on the quantity of seeds that a plant produced (Figure 1c).
The results of model selection indicated a positive relationship between pollinator visitation rates and the number of flowers and capitula on a plant (Figure 3).
4. Discussion
The findings indicated that increasing the nitrogen content in the soil has the potential to alter the natural fluctuations in seed production and reproductive efficiency that occur over different years of S. nigrescens. Nitrogen has been found to alter the interannual variations in the number of flowers per capitulum as well as the number of capitula per plant, consequently affecting the annual frequency of seed production. However, the introduction of nitrogen had an impact on the fluctuation of flower rewards from year to year. This included changes in nectar production per capitulum and the number of flowers per plant. Additionally, the patterns of pollinator visitation rate and seed set were also altered throughout the duration of the experiment. A positive correlation has been observed between the quantity of seeds produced per plant and several factors, such as the number of flowers per capitulum, the number of capitula per plant, the volume of nectar per capitulum, and the rate of visitation by pollinators. A significant positive correlation was identified between aboveground biomass and several factors, encompassing the allocation of biomass to stem, the number of flowers per capitulum, the number of capitula per plant, the volume of nectar per capitulum, and the seed production per plant. This implies that the incorporation of element N significantly influences the maintenance of aboveground biomass and flower traits, resulting in alterations in the frequency of pollinator visits and the interannual variability in seed production. The findings of this research have the potential to enhance our comprehension of the impacts of nitrogen supply on the reproductive efficacy of perennial herbs, as well as the underlying mechanisms that influence biodiversity in alpine meadows amidst global environmental changes.
The presence of nitrogen significantly influences plant biomass through the alteration of carbohydrate reserves and the allocation of carbon resources [11,12]. Plants that are grown in habitats that have an adequate nitrogen supply often exhibit a greater allocation of biomass towards the stem [30,31]. This allocation is necessary to provide mechanical support for the increased aboveground biomass of S. nigrescens. In addition, the introduction of nitrogen addition resulted in an increase in community height (30~35 cm). This increase in height can be attributed to the promotion of stem growth, which enables S. nigrescens to better compete for light resources [32,33]. Moreover, the highest aboveground biomass was observed during the third and fourth years of our study (Figure S1). We postulated that a higher percentage of underground resources experienced a transformation resulting in the production of a greater amount of aboveground biomass over the course of the latter two years [31].
Furthermore, plants frequently allocate a greater number of resources towards the development of their reproductive organs, including the production of a larger quantity of flowers and the provision of increased flower rewards [9,10]. This relationship is exemplified by a positive association between the aboveground biomass and several floral traits, such as the number of capitula per plant, the number of flowers per capitulum, and the amount of nectar per capitulum (Figure 2). Both the N4 and N8 treatments exhibited an increase in aboveground biomass, as well as an increase in the flower mass fraction (Figure S2). This implies that an augmentation in aboveground biomass has the potential to enhance the quantity of flowers and nectar [13,35]. Furthermore, our study revealed a positive correlation between nectar and flower production, and aboveground biomass fluctuations over consecutive years. The flower or capitulum number and nectar production of the plant and capitulum exhibit interannual variation, which is influenced by changes in aboveground biomass over the course of the experimental years. This finding suggests that the addition of nitrogen not only alters the year-to-year fluctuations in aboveground biomass [31], but also affects the allocation of resources towards flower and nectar production, consequently leading to annual changes in flower and nectar abundance.
In a research investigation examining the impacts of nutrient supply on nectar traits, the addition of nitrogen did not result in an increase in nectar secretion for Trifolium pratense, however, it did lead to an increase in the rate of nectar secretion for Antirrhinum majus [36]. Nevertheless, the augmentation in nectar secretion of A. majus and Ipomopsis aggregata was solely observed under conditions of minimal nitrogen supplementation (10 kg N ha−1 year−1). At elevated levels of nitrogen addition (200 kg N ha−1 year−1), there was a notable reduction in nectar secretion for both species [13,36]. This suggests that the influence of nitrogen supplementation on nectar production is dependent on both the dosage of nitrogen and the particular plant species. The nectar secretion of S. nigrescens was found to be enhanced by both the N4 and N8 treatments. The extent to which the dose of nitrogen reduces nectar production remains unknown. Indeed, numerous studies have demonstrated that the introduction of nitrogen has a positive impact on the overall concentration of amino acids [37,38,39]. The presence of nitrogen addition has been frequently observed to result in an increase in the levels of asparagine and glutamine, among the various individual amino acids [15,37,39]. The disparity in nectar concentration (e.g., sugar content) was not identified in S. nigrescens. The concentration of nectar is subject to influence by microclimate factors, particularly relative humidity [40]. The available evidence indicates that the concentration of nectar is often influenced by its water content. The evaporation rate is influenced by the humidity gradient, which in turn affects the exchange of water between nectar and air [41], ultimately impacting the concentration of nectar. The study site where three treatments were conducted exhibited similar levels of humidity. The plants exhibited uniform growth under equivalent relative humidity conditions, leading to nectar concentrations that were indistinguishable.
Bees derive their energy from the consumption of nectar and pollen. The provision of protein and other essential nutrients is imperative for the optimal growth and development of larvae. Plants that exhibit a high production of nectar in substantial quantities have the potential to attract a greater number of visits from pollinators, as well as prolong the duration of the visits [21,42,43]. Within the designated study areas, it has been observed that honey bees play a predominant role as the principal pollinators of S. nigrescens. There was a correlation between honey bee visitation and nectar production [44]. Plants that thrive in N4 and N8 habitats, characterized by the presence of nectar-rich flowers, exhibit a higher frequency of pollinator visits. Conversely, plants inhabiting the N0 habitat, which is characterized by the absence of nectar-poor flowers, tend to attract fewer pollinators (Figures S2 and S3). A positive correlation has been observed between the overall sugar concentration in nectars and specific pollinators [45]. As an illustration, honey bees exhibit a preference for nectar characterized by a diminished sugar concentration [46], while bumble bees display a preference for nectar characterized by an elevated sugar concentration [47]. The sugar concentration of S. nigrescens exhibited a range of 37% to 50%, aligning with the nectar concentration preferences observed in honey bees. The frequency of flower visits is impacted by the level of flower production. The findings from our model selection analysis indicated that both the quantity of nectar produced per plant and the number of capitula per plant are significant factors in determining the visitation of pollinators. It is imperative to acknowledge that floral scents have a significant impact on the attraction of pollinators [48]. Nevertheless, the impact of nitrogen supplementation on the olfactory traits of flowers and the preferences exhibited by pollinators remains uncertain. The visitation rate is contingent upon the combined factors of species richness and abundance of pollinators [49]. The honey bee population size exhibited no discernible variation among the study sites, as a result of the substantial release of honey bees by beekeepers in the designated study areas [21,22].
The introduction of nitrogen has the potential to modify the inherent variations in seed production, and reproductive efficiency observed across different years in S. nigrescens. The presence of nitrogen has been observed to have an impact on the interannual variations in both the quantity of flowers per capitulum and the number of capitula per plant (Figure 2). The seed yield per plant is influenced by two factors: the number of capitula per plant and the number of seeds per capitulum (Figure 1). S. nigrescens exhibits self-incompatibility, with honey bees serving as the primary pollinators for the purpose of fertilization [21]. This deduction is supported by the demonstrated the positive correlation between seed set and pollinator visitation. The introduction of nitrogen resulted in a notable augmentation in the quantity of flowers and capitula, as well as an increase in nectar production and pollinator visitation [13,14,16], consequently leading to an enhanced seed output. Moreover, there exists a correlation between aboveground biomass and the annual variation in seed production. A positive correlation has been identified between above-ground biomass and various reproductive traits, including seed quantity per plant, flower quantity per capitulum, and capitulum quantity per plant. This implies that the addition of nitrogen has the potential to modify the year-to-year fluctuations in aboveground biomass, resulting in changes in the number of flowers per capitulum, the number of capitula per plant, nectar production, and pollinator visitation across various years. Consequently, this can also impact the interannual seed output and reproductive efficiency.
Interannual variations in seed yield exert a significant impact on the sustainability of perennial plant populations [1,31]. In light of an uncertain environment, plants undertake a thorough evaluation of the benefits and costs linked to various reproductive strategies. Under optimal circumstances, plants exhibit a tendency to produce a larger number of seeds, thereby providing benefits for the replenishment of populations. Plants demonstrate a reduction in resource allocation towards reproduction when confronted with adverse circumstances [50], opting to prioritize resource allocation towards survival. Our study suggests that over the course of the first two years of nitrogen supplementation, plants exhibited a preference for allocating resources towards vegetative tissue [51]. This allocation strategy ultimately resulted in a significant improvement in seed yields during the subsequent third and fourth years for N4 and N8 plants.
The presence of soil nutrients has the potential to influence reproductive processes [9]. For example, the presence of mycorrhizal infection in soil with high phosphorus content has the potential to enhance seed production [52]. The present study did not observe the variation in soil nitrogen (N) and the other element levels among the different nitrogen supply treatments. It was found that soil nutrients exerted a notable impact on the secretion and concentration of nectar in flowers. Consequently, these factors influenced the rates of visitation by pollinators and the production of seeds [13]. Further investigation would be required to conduct a comprehensive examination.
In general, augmenting the nitrogen composition in the soil possesses the capacity to modify the inherent variations in seed yield and reproductive efficacy observed across various years of S. nigrescens. However, the potential effects of nitrogen addition on the processes of seed germination and seeding establishment have yet to be investigated. The impact on plant abundance and community composition remains uncertain. The results of this study possess the capacity to augment our understanding of the effects of nitrogen supplementation on the reproductive efficiency of perennial herbaceous plants, as well as the fundamental mechanisms that impact biodiversity in alpine meadows in the face of global environmental changes.
Supplementary Materials
The following supporting information can be downloaded at the website of this paper posted on Preprints.org. Figure S1: Comparison of above-ground biomass (a) and biomass allocation to stem (b), capitulum (c), and leaf (d) across N0, N4 and N8 treatments for each year. Figure S2: Comparison of number of capitula per plant (a), number of flowers per capitula (b), nectar volume per capitula (c), and nc, nectar concentration (d) across N0, N4 and N8 treatments for each year. Figure S3: Comparison of number of pollinator visitation rate (a), and seed set (b) across N0, N4 and N8 treatments for each year. Figure S4: Comparison of number of seeds per capitula across N0, N4 and N8 treatments for each year. Table S1: Effects of nitrogen addition and each year on vegetative and flower traits. Table S2: Effects of nitrogen addition and each year on nectar volume and nectar concentration. Table S3: Effects of nitrogen addition and each year on visitation rate, seed set, number of seeds per capitula, and reproductive efficiency.
Author Contributions
Conceptualization, J.P.M., Y.X.L and C.Z.; methodology, J.P.M., Y.X.L and C.Z.; software, J.P.M., Y.X.L. and R.L.W; validation, J.P.M. and Y.X.L.; formal analysis, R.L.W and Y.X.L.; investigation, Y.X.L, J.P.M., R.L.W., P.C.Y., Y.H.S.Y, and C.Z.; resources, Y.X.L; data curation, J.P.M; writing—original draft preparation, Y.X.L.; writing—review and editing, J.P.M., Y.H.S.Y., and C.Z.; visualization, Y.X.L.; supervision, J.P.M.; project administration, J.P.M.; funding acquisition, J.P.M. All authors have read and agreed to the published version of the manuscript.
Funding
This study was funded by National Natural Science Foundation of China (31870393), and by Natural Science foundation of Sichuan Province (22NSFSC0242), and the open project from the Ecological Security and Protection Key Laboratory of Sichuan Province (ESP1806).
Institutional Review Board Statement
Not applicable.
Informed Consent Statement
Not applicable.
Data Availability Statement
Not applicable.
Acknowledgments
We thank Jia Liu, Wenfei Dai, Rui Gao, Baoshuang Hu, Hao Lin, Lijun Wu, Chuan Yuan, Hong Yang, Cuomu Baima, Xinlin Wang for the field and lab assistance.
Conflicts of Interest
The authors declare no conflict of interest.
References
- Friedman, J. The Evolution of Annual and Perennial Plant Life Histories: Ecological Correlates and Genetic Mechanisms. Annu. Rev. Ecol. Evol. Syst. 2020, 51, 461–481. [Google Scholar] [CrossRef]
- Herrera, C.M. Population-level estimates of interannual variability in seed production: what do they actually tell us? Oikos 1998, 82, 612–616. [Google Scholar] [CrossRef]
- Pearse, I.S.; LaMontagne, J.M.; Koenig, W.D. Inter-annual variation in seed production has increased over time (1900–2014). Proc. R. Soc. B: Boil. Sci. 2017, 284, 20171666. [Google Scholar] [CrossRef] [PubMed]
- Dai, W.; Yang, Y.; Patch, H.M.; Grozinger, C.M.; Mu, J. Soil moisture affects plant–pollinator interactions in an annual flowering plant. Philos. Trans. R. Soc. B: Biol. Sci. 2022, 377, 20210423. [Google Scholar] [CrossRef] [PubMed]
- Lu, M.; Zhou, X.; Luo, Y.; Yang, Y.; Fang, C.; Chen, J.; Li, B. Minor stimulation of soil carbon storage by nitrogen addition: A meta-analysis. Agric. Ecosyst. Environ. 2011, 140, 234–244. [Google Scholar] [CrossRef]
- Deng, Q.; Hui, D.; Dennis, S.; Reddy, K.C.; Xu, X. Responses of terrestrial ecosystem phosphorus cycling to nitrogen addition: A meta-analysis. Glob. Ecol. Biogeogr. 2017, 26, 713–728. [Google Scholar] [CrossRef]
- Grechi, I.; Vivin, P.; Hilbert, G.; Milin, S.; Robert, T.; Gaudillère, J.P. Effect of light and nitrogen supply on internal C: N balance and control of root-to-shoot biomass allocation in grapevine. Environ. Exp. Bot. 2007, 59, 139–149 101016/jenvexpbot200511002. [Google Scholar] [CrossRef]
- Metay, A.; Magnier, J.; Guilpart, N.; Christophe, A. Nitrogen supply controls vegetative growth, biomass and nitrogen allocation for grapevine (cv. Shiraz) grown in pots. Funct. Plant Biol. 2015, 42, 105–114. [Google Scholar] [CrossRef]
- Vaudo, A.D.; Erickson, E.; Patch, H.M.; Grozinger, C.M.; Mu, J. Impacts of soil nutrition on floral traits, pollinator attraction, and fitness in cucumbers (Cucumis sativus L.). Sci. Rep. 2022, 12, 1–12. [Google Scholar] [CrossRef]
- Wang, R.; Lou, Y.; Deng, D.; Che, P.; Zhao, C.; Yang, Y.; Mu, J. Summer grazing change fitness in a Tibetan lotus. Glob. Ecol. Conserv. 2023, 44. [Google Scholar] [CrossRef]
- Bobbink, R.; Lamers, L.P.M. Effects of increased nitrogen deposition. In Air Pollution and Plant Life. Chichester, UK, 2002; pp. 201–235.
- Drewniak, B.; Gonzalez-Meler, M.A. Earth System Model Needs for Including the Interactive Representation of Nitrogen Deposition and Drought Effects on Forested Ecosystems. Forests 2017, 8, 267. [Google Scholar] [CrossRef]
- Burkle, L.A.; Irwin, R.E. Beyond biomass: measuring the effects of community-level nitrogen enrichment on floral traits, pollinator visitation and plant reproduction. J. Ecol. 2010, 98, 705–717. [Google Scholar] [CrossRef]
- Hoover, S.E.R.; Ladley, J.J.; Shchepetkina, A.A.; Tisch, M.; Gieseg, S.P.; Tylianakis, J.M. Warming, CO2, and nitrogen deposition interactively affect a plant-pollinator mutualism. Ecol. Lett. 2012, 15, 227–234. [Google Scholar] [CrossRef]
- Ceulemans, T.; Hulsmans, E.; Ende, W.V.; Honnay, O. Nutrient enrichment is associated with altered nectar and pollen chemical composition in Succisa pratensis Moench and increased larval mortality of its pollinator Bombus terrestris L. PLOS ONE 2017, 12, e0175160. [Google Scholar] [CrossRef]
- David, T.I.; Storkey, J.; Stevens, C.J. Understanding how changing soil nitrogen affects plant–pollinator interactions. Arthropod-Plant Interactions 2019, 13, 671–684. [Google Scholar] [CrossRef]
- Bleeker, A.; Hicks, W.K.; Dentener, F.; Galloway, J.N.; Erisman, J.W. Nitrogen Deposition as a Threat to the World’s Protected Areas Under the Convention on Biological Diversity (CBD). 2014, 295–303. [CrossRef]
- Liu, X.; Zhang, Y.; Han, W.; Tang, A.; Shen, J.; Cui, Z.; Vitousek, P.; Erisman, J.W.; Goulding, K.; Christie, P.; et al. Enhanced nitrogen deposition over China. Nature 2013, 494, 459–462. [Google Scholar] [CrossRef]
- Bowman, W.D.; Cleveland, C.C.; Halada, .; Hreško, J.; Baron, J.S. Negative impact of nitrogen deposition on soil buffering capacity. Nat. Geosci. 2008, 1, 767–770. [CrossRef]
- Lü, C.; Tian, H. Spatial and temporal patterns of nitrogen deposition in China: Synthesis of observational data. J. Geophys. Res. Atmos. 2007, 112. [Google Scholar] [CrossRef]
- Mu, J.; Peng, Y.; Xi, X.; Wu, X.; Griffin, J.N.; Niklas, K.J.; Sun, S. Domesticated honeybees evolutionarily reduce flower nectar volume in a Tibetan lotus. Ecology 2014, 95, 3161–3172. [Google Scholar] [CrossRef]
- Su, R.; Dai, W.; Yang, Y.; Wang, X.; Gao, R.; He, M.; Zhao, C.; Mu, J. Introduced honey bees increase host plant abundance but decrease native bumble bee species richness and abundance. Ecosphere 2022, 13. [Google Scholar] [CrossRef]
- Xia, J.; Wan, S. Independent effects of warming and nitrogen addition on plant phenology in the Inner Mongolian steppe. Ann. Bot. 2013, 111, 1207–1217. [Google Scholar] [CrossRef]
- Real, L.A.; Rathcke, B.J. Individual Variation in Nectar Production and Its Effect on Fitness in Kalmia Latifolia. Ecology 1991, 72, 149–155. [Google Scholar] [CrossRef]
- Vaudo, A.D.; Patch, H.M.; Mortensen, D.A.; Grozinger, C.M.; Tooker, J.F. Bumble bees exhibit daily behavioral patterns in pollen foraging. Arthropod-Plant Interactions 2014, 8, 273–283. [Google Scholar] [CrossRef]
- Arroyo, M.T.K.; Armesto, J.J.; Primack, R.B. Community studies in pollination ecology in the high temperate Andes of central Chile II. effect of temperature on visitation rates and pollination possibilities. Plant Syst. Evol. 1985, 149, 187–203. [Google Scholar] [CrossRef]
- Bates, D.M.; Maechler, M. Lme 4: Linear mixed-effects models using S4 classes. R package version. 2011, 0.999375-42 [Computer software]. Available at http://cran.r-project.org/web/packages/lme4.
- Chen, J.; Luo, Y.; Van, Groenigen, K.J.; Hungate, B.A.; Cao, J.; Zhou, X.; Wang, R.W. A keystone microbial enzyme for nitrogen control of soil carbon storage. Sci. Adv. 2018, 4(8), eaaq1689. [CrossRef]
- Terrer, C.; Vicca, S.; Hungate, B.A.; Phillips, R.P.; Prentice, I.C. Mycorrhizal association as a primary control of the CO 2 fertilization effect. Science 2016, 353, 72–74. [Google Scholar] [CrossRef]
- Niu, S.; Wu, M.; Han, Y.; Xia, J.; Zhang, Z.; Yang, H.; Wan, S. Nitrogen effects on net ecosystem carbon exchange in a temperate steppe. Glob. Chang. Biol. 2010, 16, 144–155. [Google Scholar] [CrossRef]
- Yan, Z.; Eziz, A.; Tian, D.; Li, X.; Hou, X.; Peng, H.; Han, W.; Guo, Y.; Fang, J. Biomass Allocation in Response to Nitrogen and Phosphorus Availability: Insight From Experimental Manipulations of Arabidopsis thaliana. Front. Plant Sci. 2019, 10. [Google Scholar] [CrossRef]
- Leith, I.D.; Hicks, W.K.; Fowler, D.; Woodin, S.J. Differential responses of UK upland plants to nitrogen deposition. New Phytol. 1999, 141, 277–289. [Google Scholar] [CrossRef]
- Verma, P.; Sagar, R.; Verma, H.; Verma, P.; Singh, D.K. Changes in species composition, diversity and biomass of herbaceous plant traits due to N amendment in a dry tropical environment of India. J. Plant Ecol. 2014, 8, 321–332. [Google Scholar] [CrossRef]
- Mu, J.; Peng, Y.; Xi, X.; Wu, X.; Li, G.; Niklas, K.J.; Sun, S. Artificial asymmetric warming reduces nectar yield in a Tibetan alpine species of Asteraceae. Ann. Bot. 2015, 116, 899–906. [Google Scholar] [CrossRef]
- Burkle, L.A.; Irwin, R.E. The importance of interannual variation and bottom–up nitrogen enrichment for plant–pollinator networks. Oikos 2009, 118, 1816–1829. [Google Scholar] [CrossRef]
- Shuel, R.W. SOME ASPECTS OF THE RELATION BETWEEN NECTAR SECRETION AND NITROGEN, PHOSPHORUS, AND POTASSIUM NUTRITION. Can. J. Plant Sci. 1957, 37, 220–236. [Google Scholar] [CrossRef]
- Gardener, M.C.; Gillman, M.P. The effects of soil fertilizer on amino acids in the floral nectar of corncockle, Agrostemma githago (Caryophyllaceae). Oikos 2001, 92, 101–106. [Google Scholar] [CrossRef]
- Gijbels, P.; Ende, W.V.D.; Honnay, O. Landscape scale variation in nectar amino acid and sugar composition in a Lepidoptera pollinated orchid species and its relation with fruit set. J. Ecol. 2013, 102, 136–144. [Google Scholar] [CrossRef]
- Gijbels, P.; Ceulemans, T.; Van den Ende, W.; Honnay, O. Experimental fertilization increases amino acid content in floral nectar, fruit set and degree of selfing in the orchid Gymnadenia conopsea. Oecologia 2015, 179, 785–795. [Google Scholar] [CrossRef]
- Búrquez, A.; Corbet, S.A. Do flowers reabsorb nectar? Funct. Ecol. 1991,5, 369–379. [CrossRef]
- Castellanos, M.C.; Wilson, P.; Thomson, J.D. Dynamic nectar replenishment in flowers of Penstemon (Scrophulariaceae). Am. J. Bot. 2002, 89, 111–118. [Google Scholar] [CrossRef]
- Mitchell, R.J.; Irwin, R.E.; Flanagan, R.J.; Karron, J.D. Ecology and evolution of plant–pollinator interactions. Ann. Bot. 2009, 103, 1355–1363. [Google Scholar] [CrossRef]
- Zhao, Y.-H.; Ren, Z.-X.; Lázaro, A.; Wang, H.; Bernhardt, P.; Li, H.-D.; Li, D.-Z. Floral traits influence pollen vectors’ choices in higher elevation communities in the Himalaya-Hengduan Mountains. BMC Ecol. 2016, 16, 1–8. [Google Scholar] [CrossRef]
- Sponsler, D.; Iverson, A.; Steffan-Dewenter, I. Pollinator competition and the structure of floral resources. Ecography 2023, e06651, 1–16. [Google Scholar] [CrossRef]
- Wright, G.A.; Nicolson, S.W.; Shafir, S. Nutritional Physiology and Ecology of Honey Bees. Annu. Rev. Èntomol. 2018, 63, 327–344. [Google Scholar] [CrossRef]
- Waller, G.D. Evaluating responses of honeybees to sugar solutions using an artificial-flower feeder. Ann. Entomol. Soc. Am. 1972, 65, 857–862. [Google Scholar] [CrossRef]
- Crane, E. Bee products. Bee World 1972, 53: 38–39.
- Burkle, L.A.; Runyon, J.B. Floral volatiles structure plant–pollinator interactions in a diverse community across the growing season. Funct. Ecol. 2019, 33, 2116–2129. [Google Scholar] [CrossRef]
- Mu, J.; Wu, Q.; Yang, Y.; Huang, M.; Grozinger, C.M. Plant reproductive strategies vary under low and high pollinator densities. Oikos 2018, 127, 1081–1094. [Google Scholar] [CrossRef]
- Vico, G.; Manzoni, S.; Nkurunziza, L.; Murphy, K.; Weih, M. Trade-offs between seed output and life span – a quantitative comparison of traits between annual and perennial congeneric species. New Phytol. 2015, 209, 104–114. [Google Scholar] [CrossRef] [PubMed]
- Delph, L.F.; Meagher, T.R. Sexual Dimorphism Masks Life History Trade-Offs in the Dioecious Plant Silene Latifolia. Ecology 1995, 76, 775–785. [Google Scholar] [CrossRef]
- Poulton, J.L.; Bryla, D.; Koide, R.T.; Stephenson, A.G. Mycorrhizal infection and high soil phosphorus improve vegetative growth and the female and male functions in tomato. New Phytol. 2002, 154, 255–264. [Google Scholar] [CrossRef]
Figure 1.
Interannual variation in the number of seeds produced per plant (a) and the reproductive efficiency (b) of Saussurea nigrescens among the N0 (0 g·m-2 N), N4 (4 g·m-2) and N8 (8 g·m-2) treatments; and the effects of nitrogen addition and each experimental year on the number of seeds per plant (c) was analyzed using generalized linear mixed models (GLMMs). Ends of the boxes represent the 25th and 75th percentiles of the data, while ends of whiskers represent the minimum and maximum of the data. Line within the box represents the median of the responses and green circle within the box represent the mean of the responses. Different letters above the boxes denote significant differences among treatments (P < 0.05). The effect of nitrogen addition and each experimental year on number of seeds per plant indicated by values and 95% confidence interval (CI) of estimated slopes from GLMM, with significant (95% CI not overlap with zero, * P < 0.05, ** P < 0.01, *** P < 0.001) positive (blue) and negative (red) effect highlighted by colored values with * and CI of the estimated slopes, and values without * and CI (overlap with zero) indicated non-significant difference across the N0, N4 and N8 treatments. The variable “cnp” represents the number of capitula per plant, while the variable “snc” represents the number of seeds per capitula.
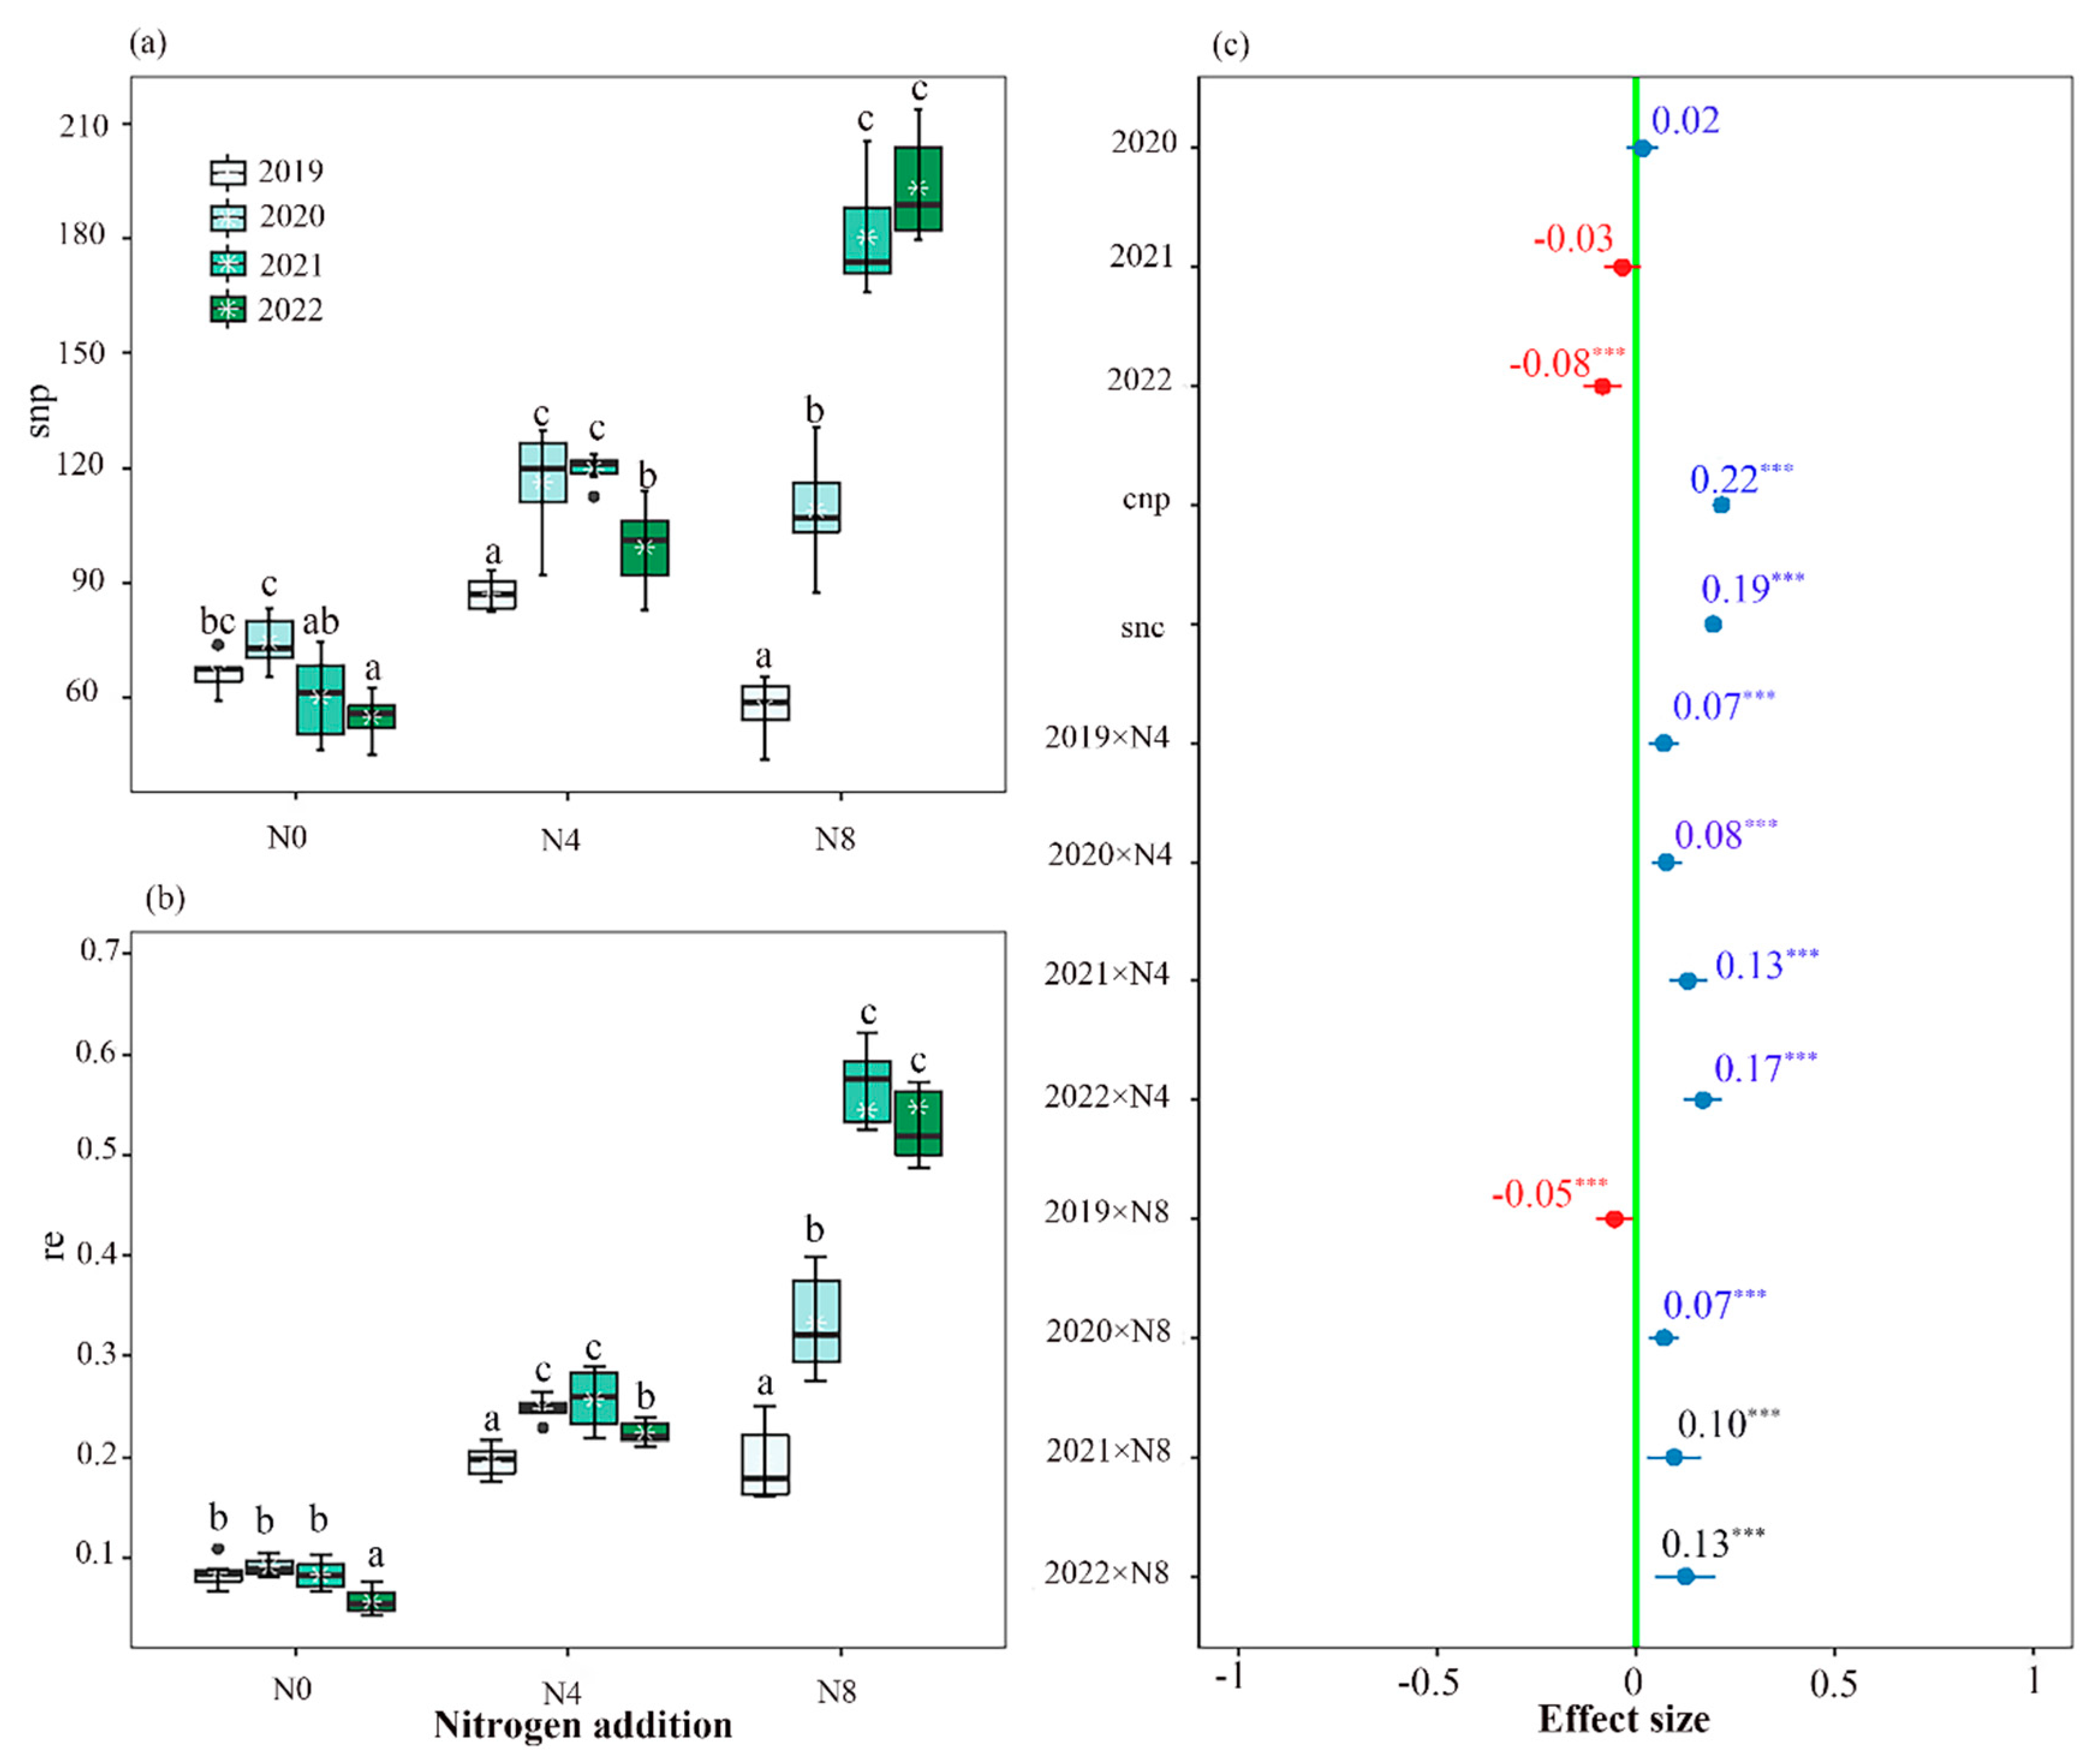
Figure 2.
Ranked Cross-correlations for variables of vegetative and floret traits, seed traits, and pollinator visitation rate of Saussurea nigrescens. Blue colors correspond to positive correlations. Size of the bar was proportional to the correlation coefficients. 44 most relevant reflected significant correlations of variables. NAs removed reflect the insignificant correlations did not present. bio, above-ground biomass; cnp, number of capitula per plant; fnc, number of flowers per capitula; fnp, number of flowers per plant; nc, nectar concentration; nvc, nectar volume per capitula; nvp, nectar volume per plant; snc, number of seeds per capitula; snp, number of seeds per plant; ssr, seed set; vr, pollination visitation rate. nvc+vr represent the relationship between nectar volume per capitula and pollinator visitation rate.
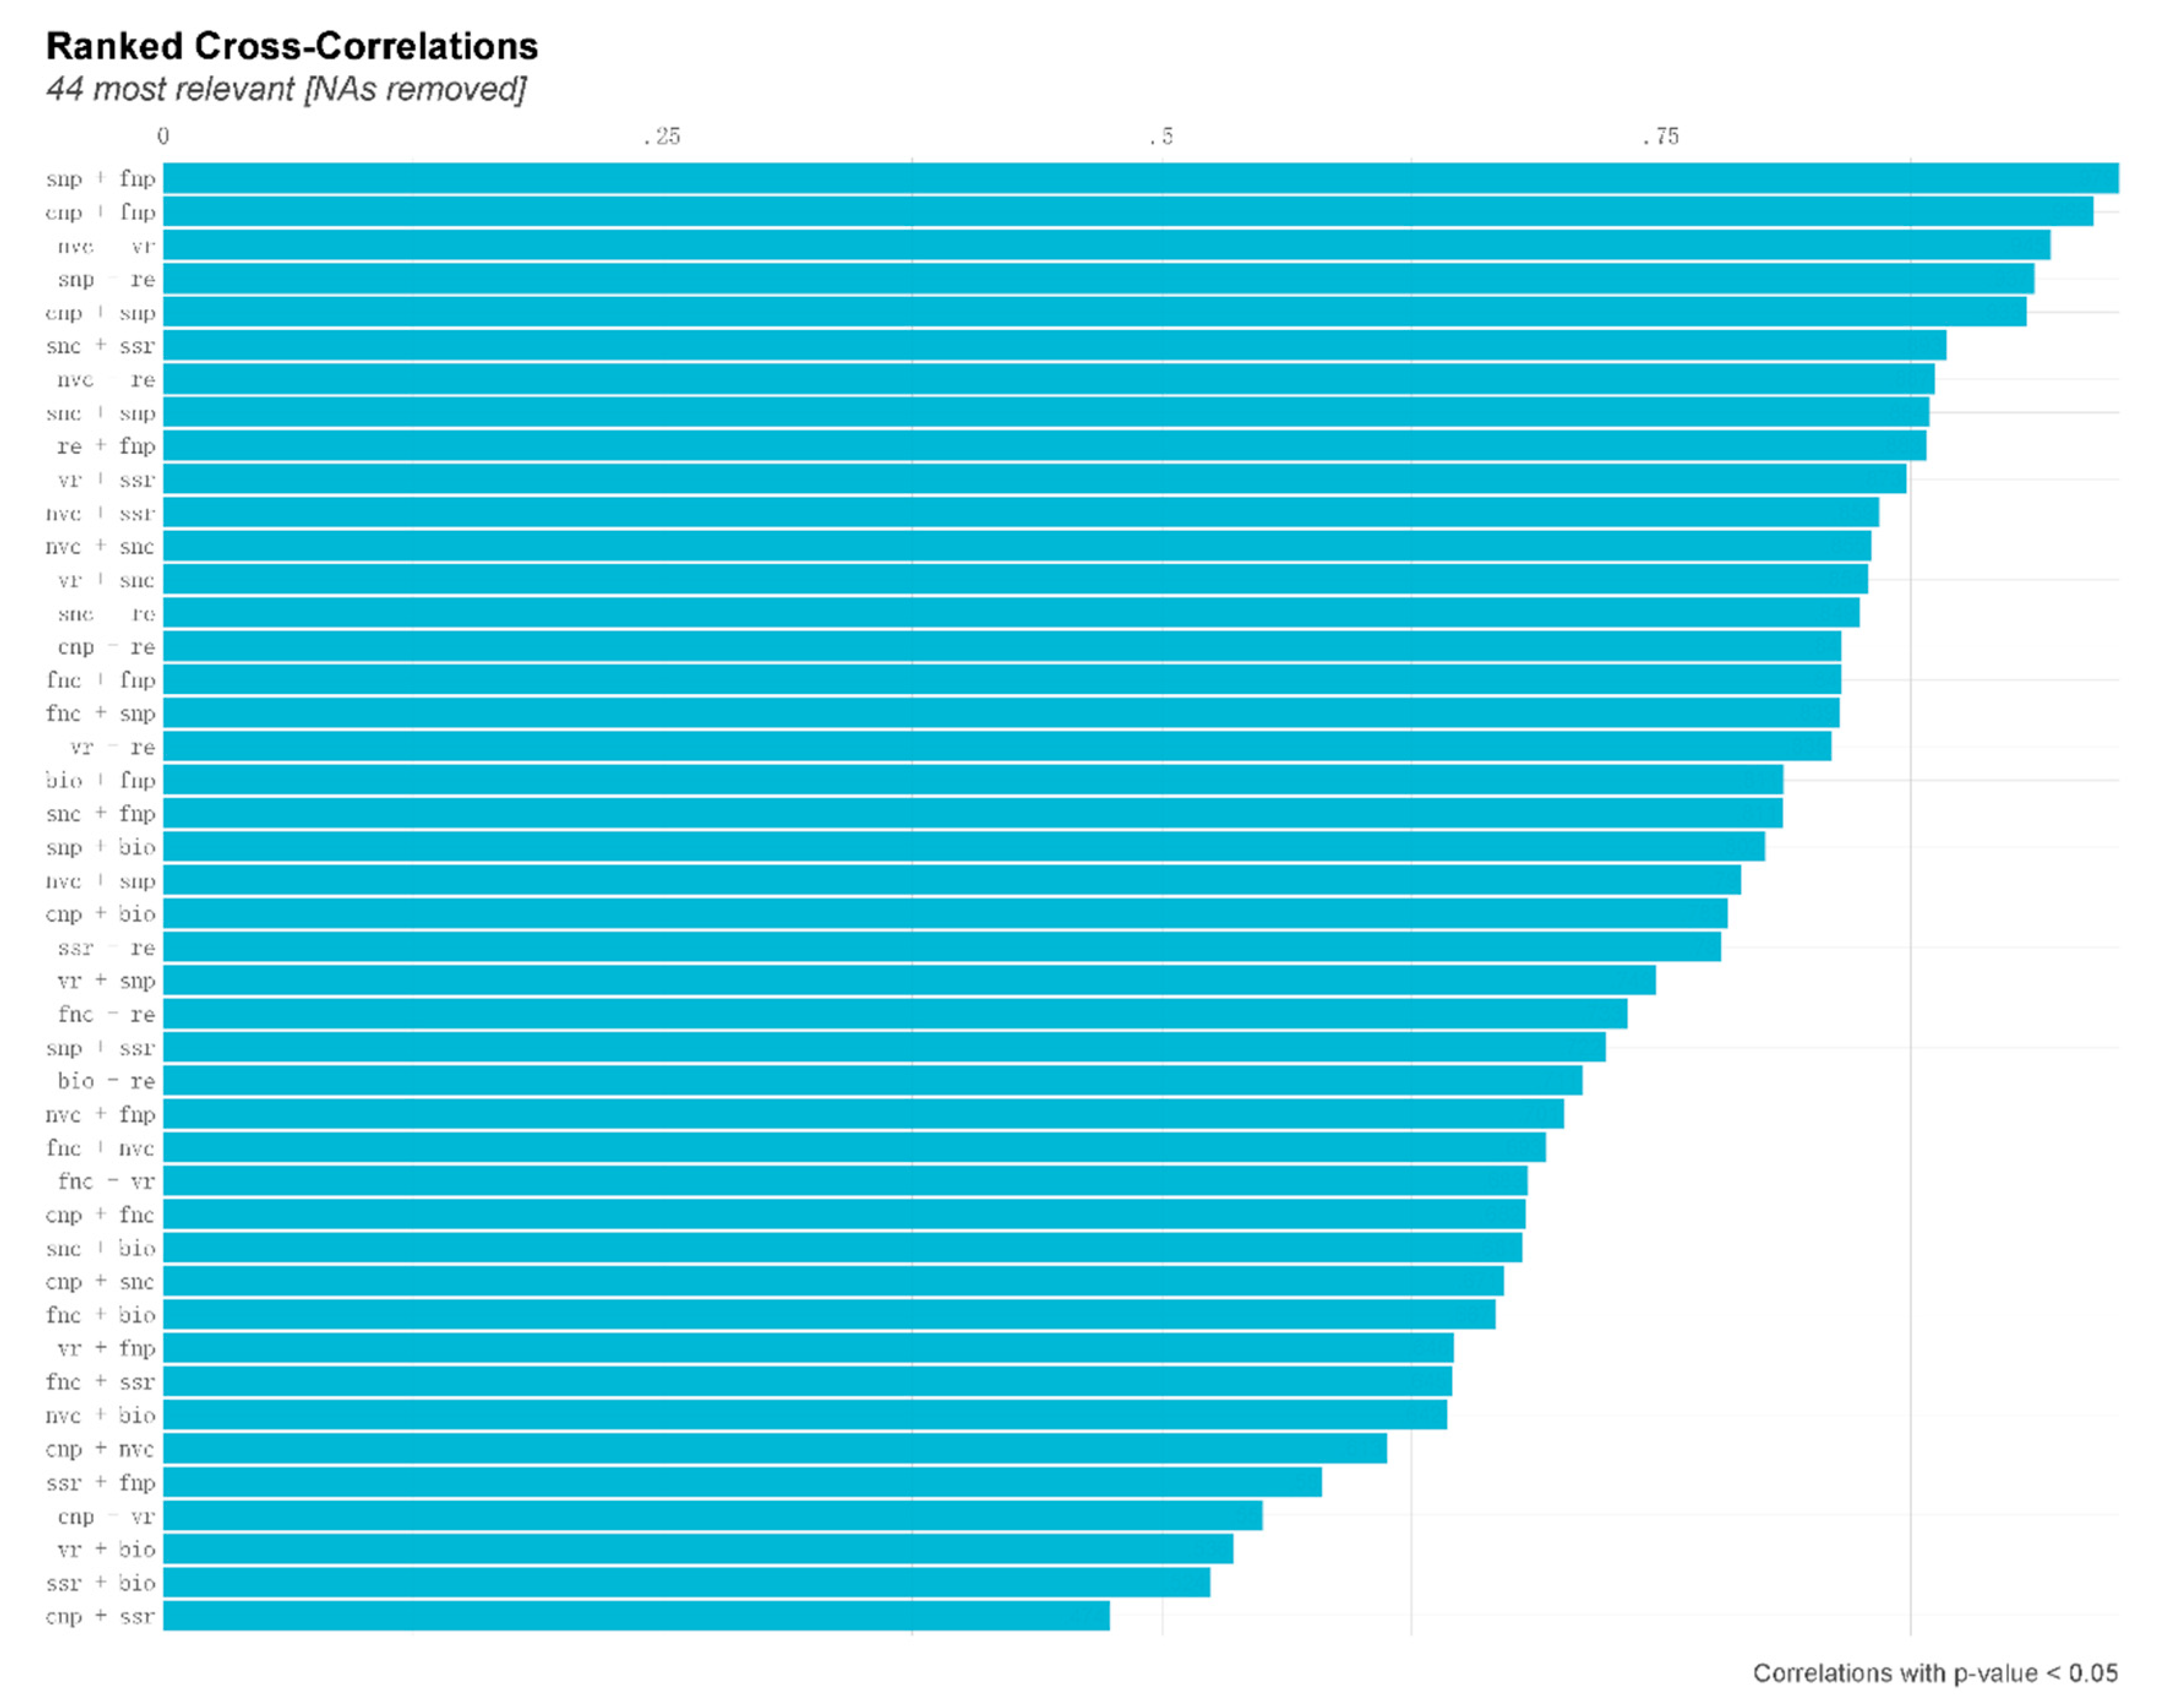
Figure 3.
Relative importance of flower traits on pollinator visitation rate of Saussurea nigrescens. fnp, cnp, bio, nc see Figure 2. The figure shown the result of best model selection.
Figure 3.
Relative importance of flower traits on pollinator visitation rate of Saussurea nigrescens. fnp, cnp, bio, nc see Figure 2. The figure shown the result of best model selection.
Disclaimer/Publisher’s Note: The statements, opinions and data contained in all publications are solely those of the individual author(s) and contributor(s) and not of MDPI and/or the editor(s). MDPI and/or the editor(s) disclaim responsibility for any injury to people or property resulting from any ideas, methods, instructions or products referred to in the content. |
© 2023 by the authors. Licensee MDPI, Basel, Switzerland. This article is an open access article distributed under the terms and conditions of the Creative Commons Attribution (CC BY) license (http://creativecommons.org/licenses/by/4.0/).
Copyright: This open access article is published under a Creative Commons CC BY 4.0 license, which permit the free download, distribution, and reuse, provided that the author and preprint are cited in any reuse.


