1. Introduction
The middle-upper atmosphere is a part of the Earth’s atmosphere, including the near space and thermosphere. As we know, the periodic and explosive solar activity has a remarkable effect on the thermosphere, especially the significant 27-day and 11-year periodic variations (Qian et al., 2011; Emmert, 2015a; Weng, 2019). However, the response of middle-upper atmosphere to disturbances in the lower atmosphere has been gradually investigated by using the increased observational data and developed theoretical model. For instance, the negative long-term trend of thermospheric density should be attributed to the increased warm gas in the troposphere (Emmert., 2015b; Weng et al., 2020). In addition, the middle-upper atmosphere exhibits various long-term oscillations, including the annual oscillation (AO), semi-annual oscillation (SAO), quasi-biennial oscillation (QBO) and solar cycle (Emmert, 2015a; Calabia et al., 2016, 2019). Among these oscillations, the QBO is a special and interesting phenomenon, which alternates easterly and westerly winds in the stratosphere near the tropical region, with a period of 22-34 months.
Some studies (Dunkerton et al., 1991; Labitzke et al., 1999; Matthes et al., 2010; Sağır etal., 2018; Yu, 2019; Koval et al., 2022a, 2022b; Yue et al., 2022) presents that the amplitude of the QBO shows a maximum value at the equatorial stratosphere (30-40 km). However, the QBO signal in the mesosphere or thermosphere is still uncertain because of the limited observational data and weak signal. In recent years, some researchers have studied the impact of QBO periodic variations in the upper atmospheric and ionospheric parameters. Kane (1995) and Tang et al (2014) found the ionospheric foF2 and hmF2 parameters exhibit 26-27 month periodic variations. Using the WACCM model, Yu (2017) studied the role of the QBO phenomenon in the stratospheric and mesospheric wind field, and analyzed the effects of gravity wave parameterization, model vertical resolution and numerical calculation methods. Particularly, Liu (2016) used the thermospheric density, ENSO, and QBO data from 1967 to 2012 to discuss the potential connection features with each other, with the help of common MSIS00 empirical model and wavelet periodic analysis method. The results showed that the thermospheric density has 64-month and 28-month periodic variations superimposing on the 11-year period, and the impact of QBO signal on the upper atmosphere is more significant around 1972, 1982, and 2002. Moreover, the author also pointed out that both solar activity and QBO may contribute to the 28-month periodic characteristics of the upper atmosphere. Sağır et al (2018) compared the QBO and solar activity effects on total mass density obtained from MSIS-00 model for 90 km altitude. It was observed that QBO and F10.7 solar flux have an effect on density, and about 69% of the variations in TMD could be explained by F10.7 and QBO. However, the total mass density is derived from the empirical model, so this conclusion is subject to deliberation. Recently, Yue et al (2022) discussed the contribution of the lower atmosphere to the day-to-day variation of thermospheric density by using the SD-WACCM-X model. They find that the density variation at 300 km is mainly driven by geomagnetic and solar forcing while at 120 km it is exclusively controlled by the lower atmosphere. Koval et al (2022a) used a 3-dimensional nonlinear mechanistic model of middle and upper atmosphere to simulate the dynamical effect of the QBO on the planetary waves up to thermosphere. They found that the stratospheric QBO causes statistically significant changes in the amplitudes of individual wave components up to 25% in the mesosphere-lower thermosphere and 10% changes above 200 km, and this conclusion is especially noticeable under low solar activity. Therefore, it is a critical issue to distinguish the solar and QBO signals among the similar periodic variations in the thermosphere. In other words, the QBO signal in the thermospheric density needs further investigation and more solid evidence.
In this study, we will use GAMDM model, a more precise empirical model rather than MSIS00 model (Emmert, 2015b), to remove solar and geomagnetic activities, annual/semi-annual variations in the thermosphere. Moreover, we also discuss the impact of ratio or residual between the observed and modeled density on extracting the QBO signal. Finally, we will confirm that whether the thermospheric density is affected by the QBO signal or not, and discuss the possible reason.
2. Datasets
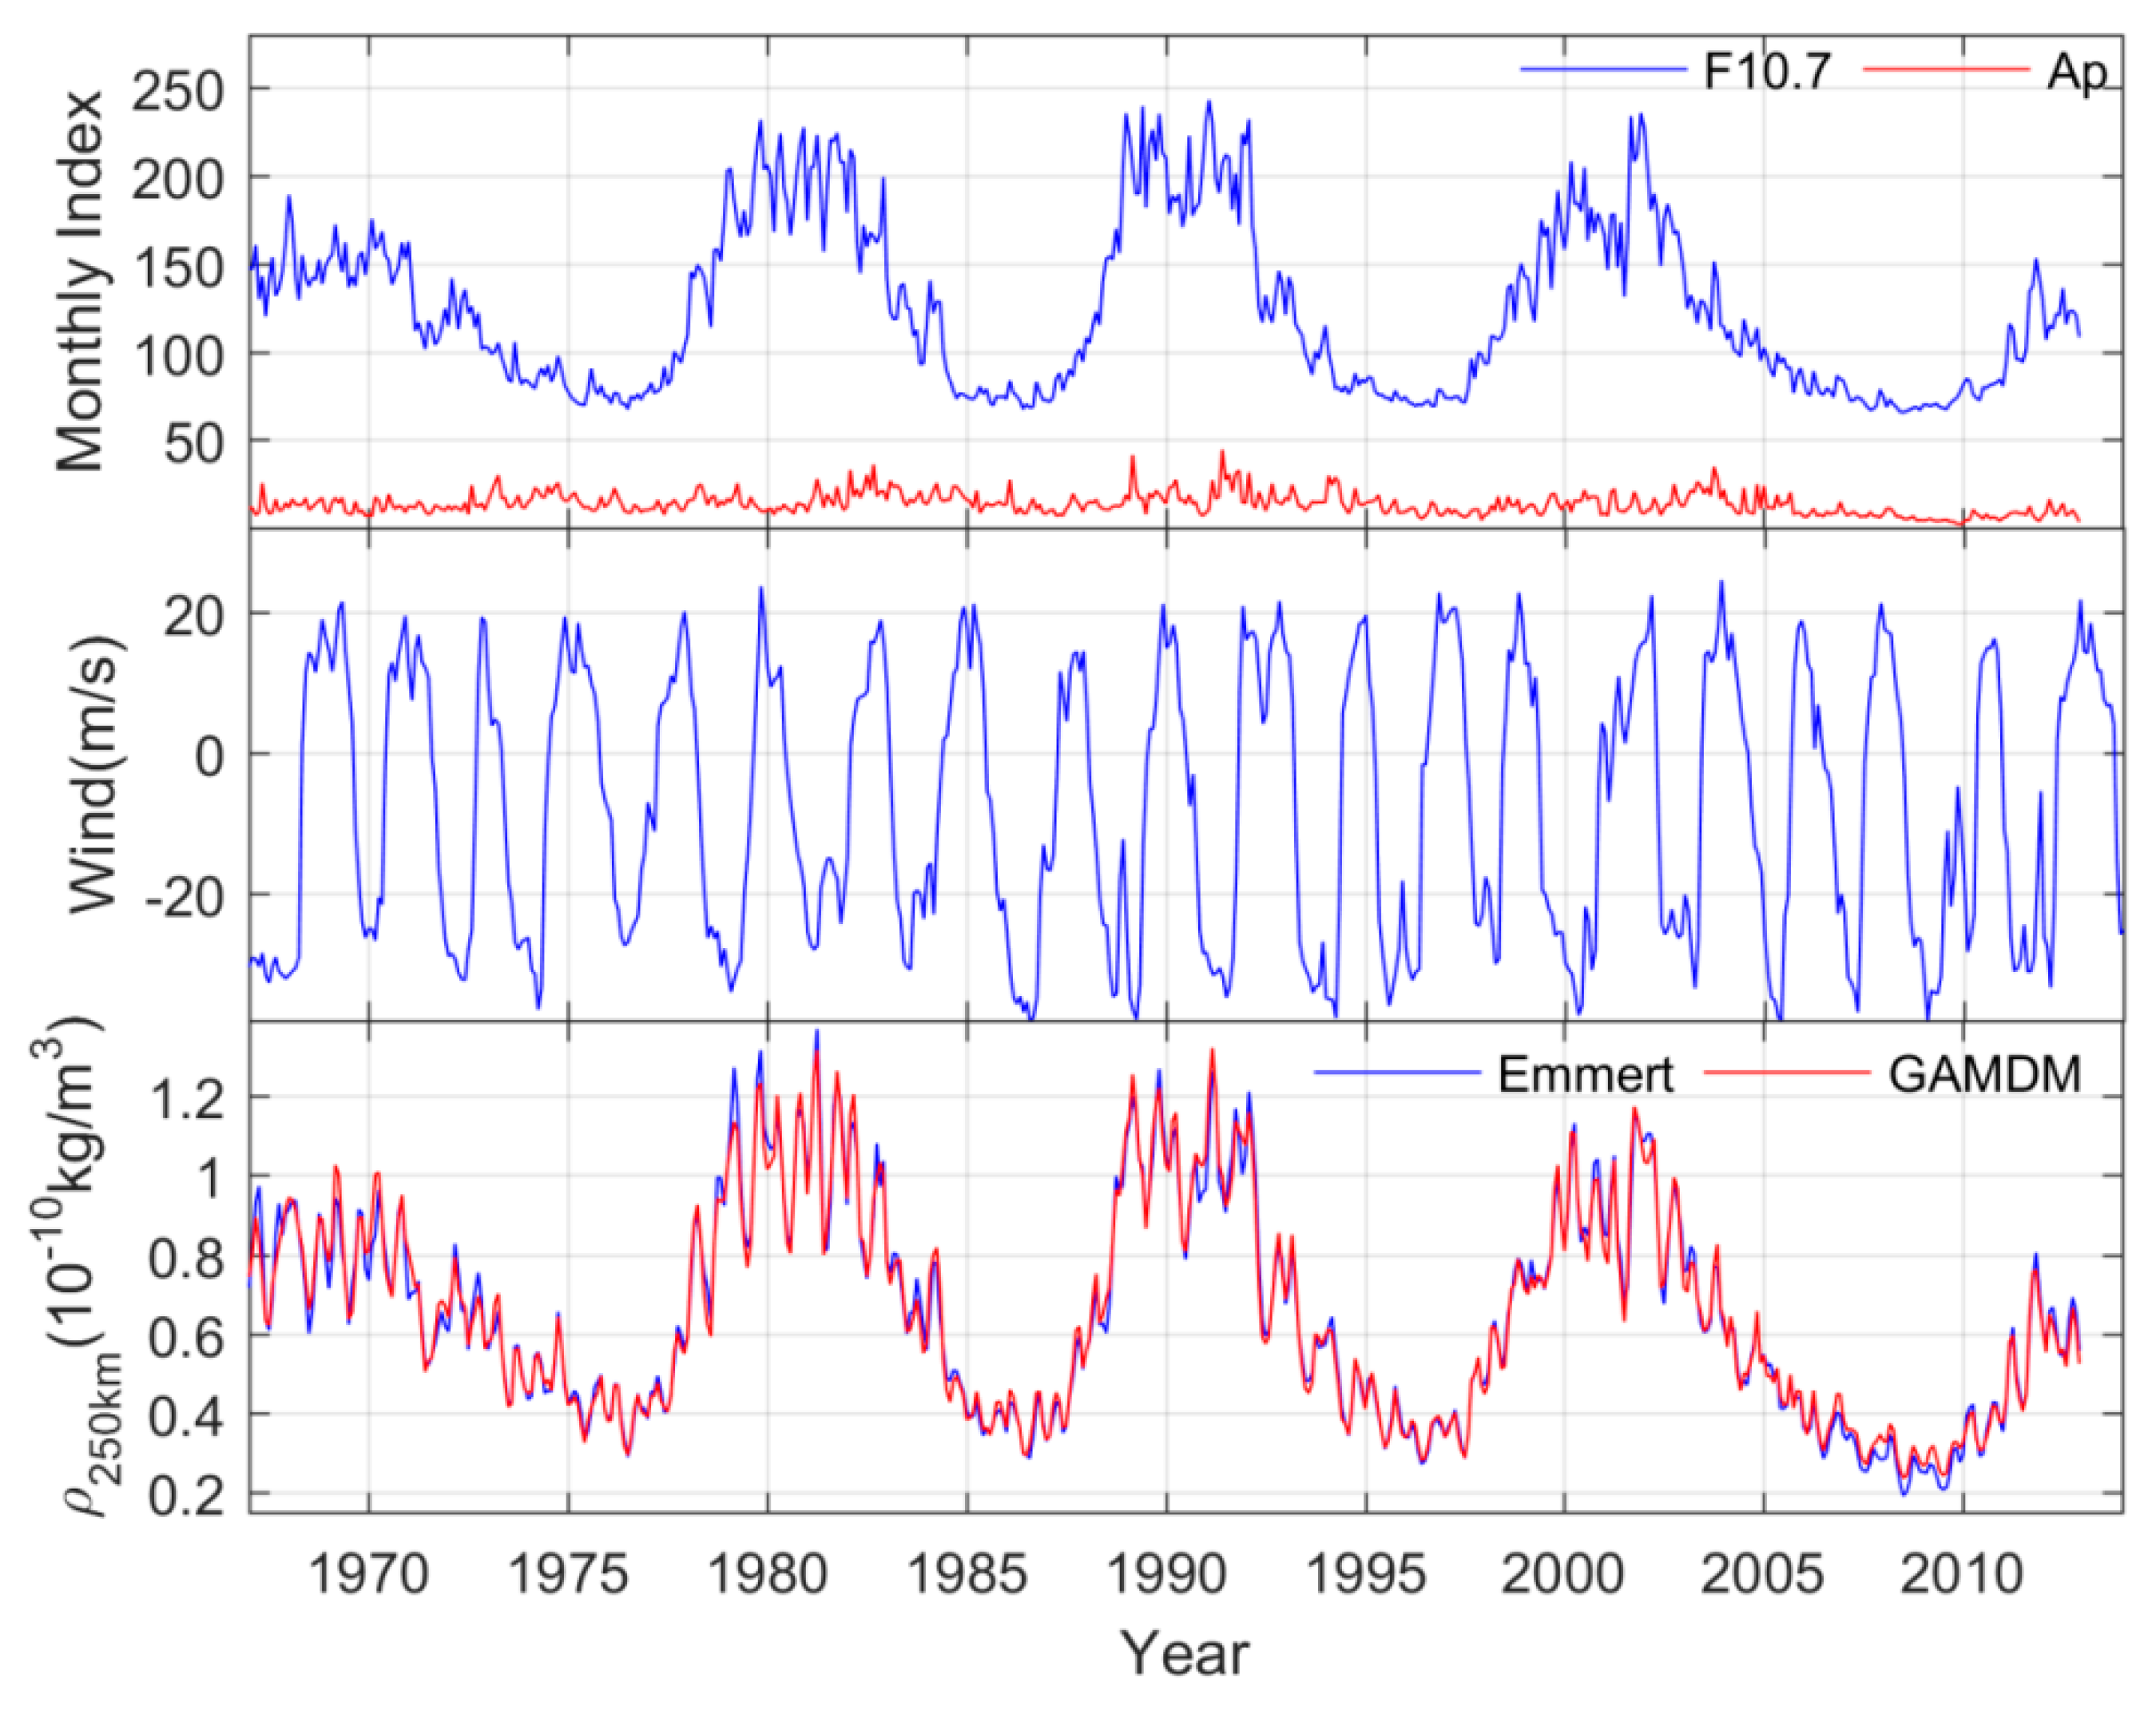
Figure 1 shows the monthly solar F10.7 and geomagnetic Ap indices, QBO zonal wind velocity, and thermospheric density at 250km altitude from 1967 to 2013. Obviously, the solar activity has a significant 11-year periodic variation. Moreover, the monthly solar F10.7 can reach over 200 sfu under high solar activity conditions, but it is around 70 sfu during low solar activity periods. Meanwhile, the monthly geomagnetic Ap index is generally below 40, showing a positive correlation with the solar activity. Furthermore, the geomagnetic activity is generally greater during the declining phase of solar activity. For the QBO signal, the zonal wind velocity at 10 hPa varies from -370 to 200m/s, along with a quasi-biennial periodic variation. In this study, the daily averaged thermopsheric density is obtained from orbital decay measurements of about 5000 space objects by Emmert (2010). Clearly, the thermospheric density has a strong correlation with solar F10.7 index, and the correlation coefficient is over 0.9. In other words, the solar activity has a critical influence on the density. Therefore, in order to study the effect of QBO, it is necessary to effectively eliminate the influence of solar activity and other factors. In this study, we use the GAMDM model to achieve our purpose, because of that this empirical model is more generally consistent with the observed density than MSIS00 model (Picone et al., 2002). Obviously, the GAMDM model can effectively remove the influence of seasonal variations, solar and geomagnetic activities, and the reserved residuals may be more suitable for discuss the QBO signal.
3. Results and Discussion
3.1. Period Analysis
The wavelet analysis can reveal more accurate information on the periodicities and temporal evolution of the space weather (Torrence et al., 1998), and
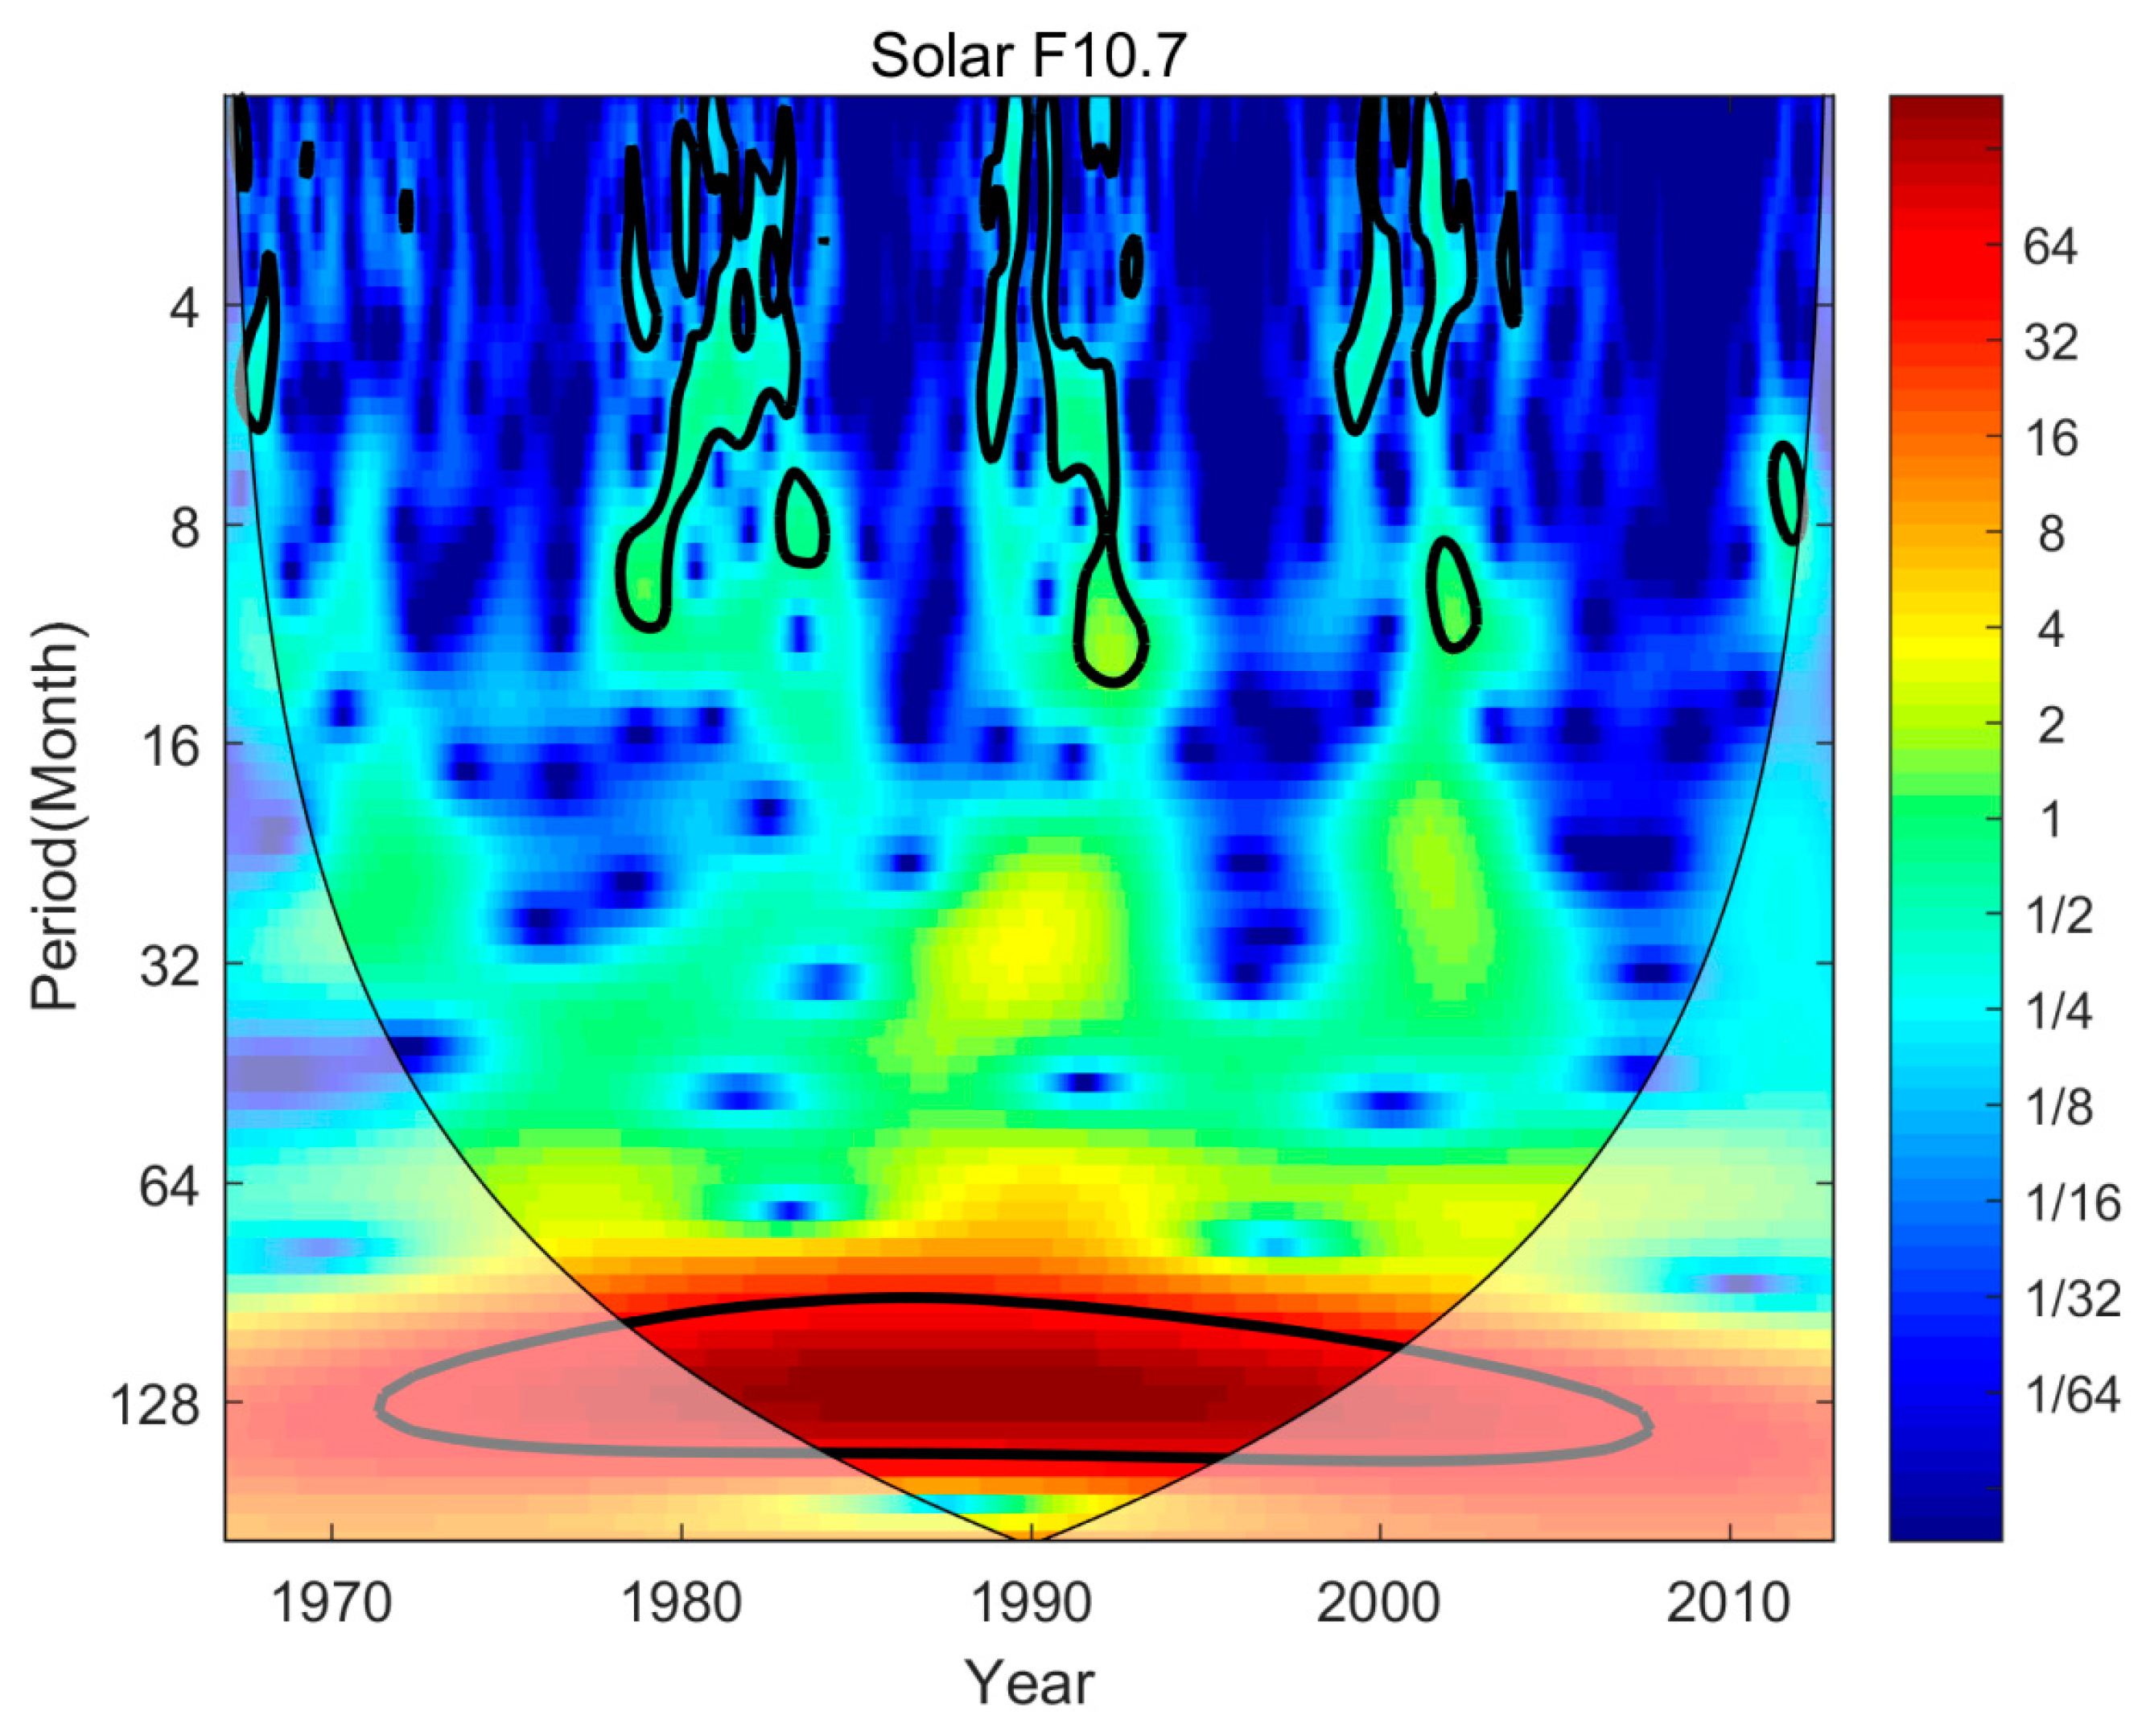
Figure 2 shows the wavelet power spectrum of the solar F10.7 index during 1967-2013. It can be seen that the periodicity of solar activity exhibits is centered around 11 years with a range of 110-140 months throughout all years. In addition, during high solar activity, F10.7 also exhibits significant oscillations with a period of 6-12 months, but there has almost no periodicity feature under low solar activity conditions. Noteworthy, there seems to have a periodic signal of 25-30 months under high solar activity conditions, especially during 1990 and 2000, but it does not pass the significance test. This may overlap with the QBO signal and lead to some uncertainty in the thermospheric period.
We also analyze the period of geomagnetic activity, and the result is presented in
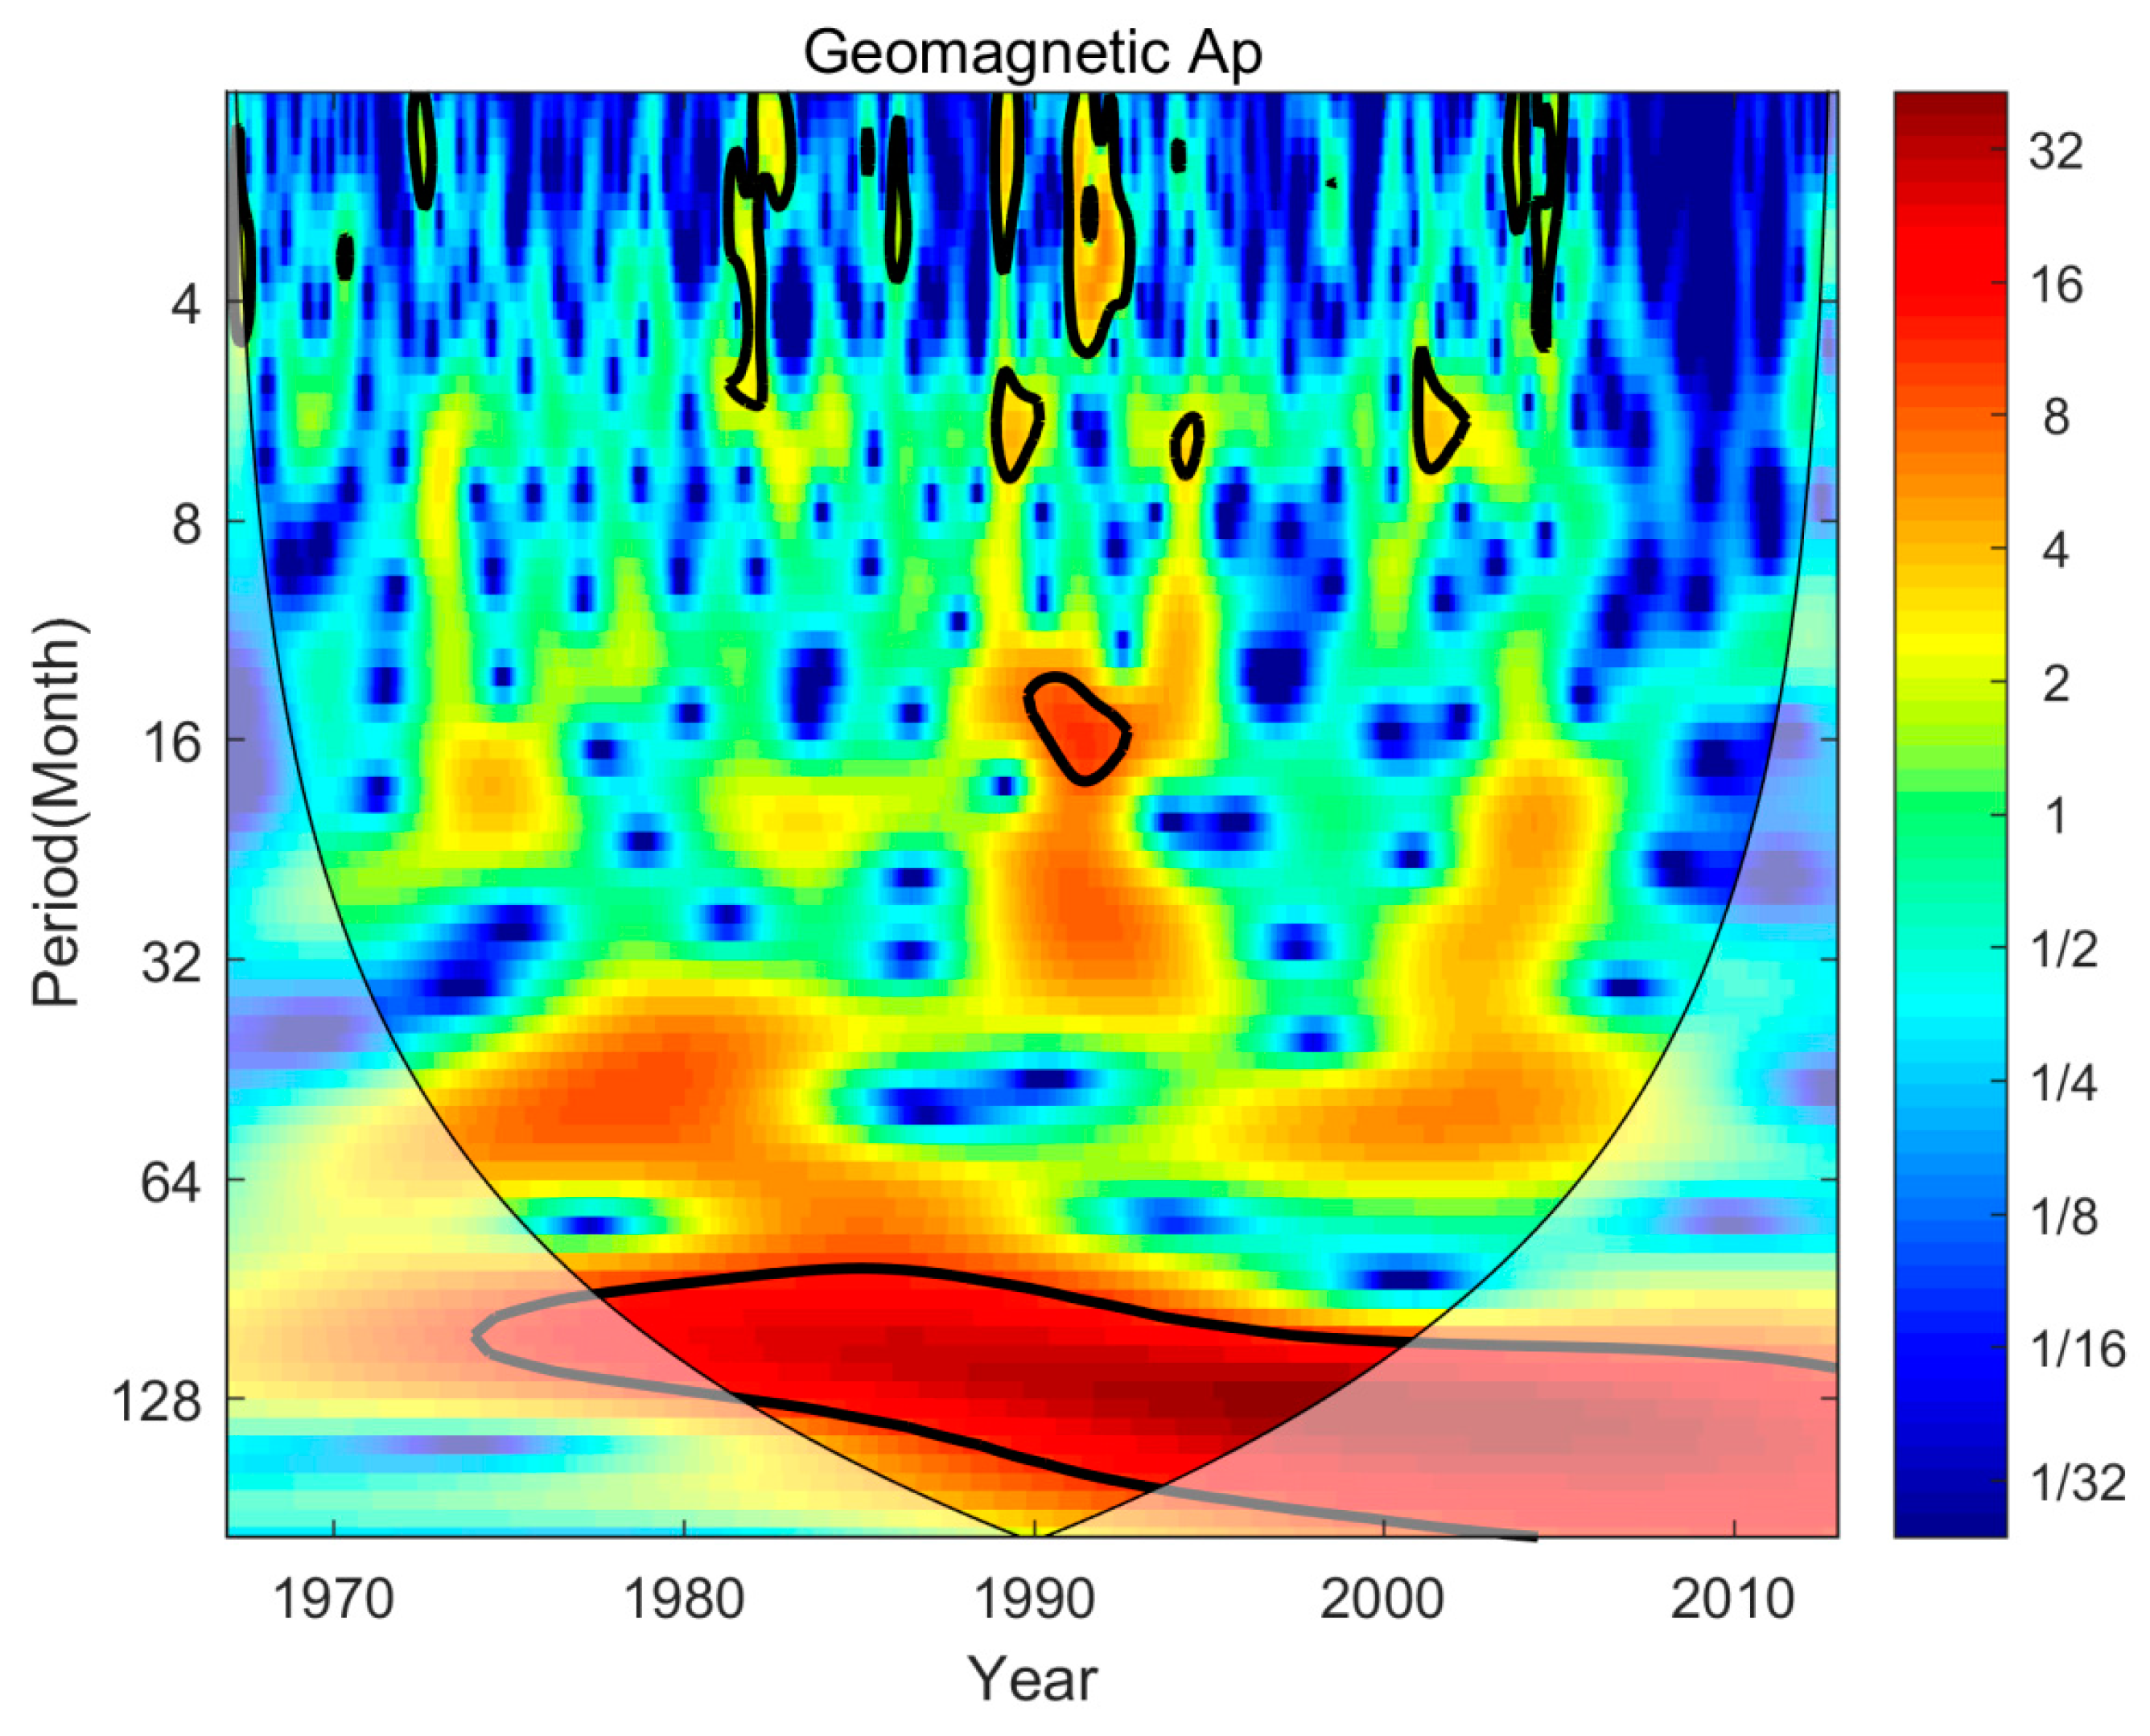
Figure 3. Obviously, the geomagnetic Ap index exhibits a period of about 11 years. Noteworthy, there seems to have ~6 month period in the geomagnetic activity, which may lead to the seasonal variations of thermospheric density. Similar with the F10.7 index, the geomagnetic Ap index also reveals a period of 20-32 months during high solar activity, and it does not pass the significance test.
Emphatically, we investigate the zonal wind speed at 10 hPa by using the wavelet power spectrum decomposition. As seen in
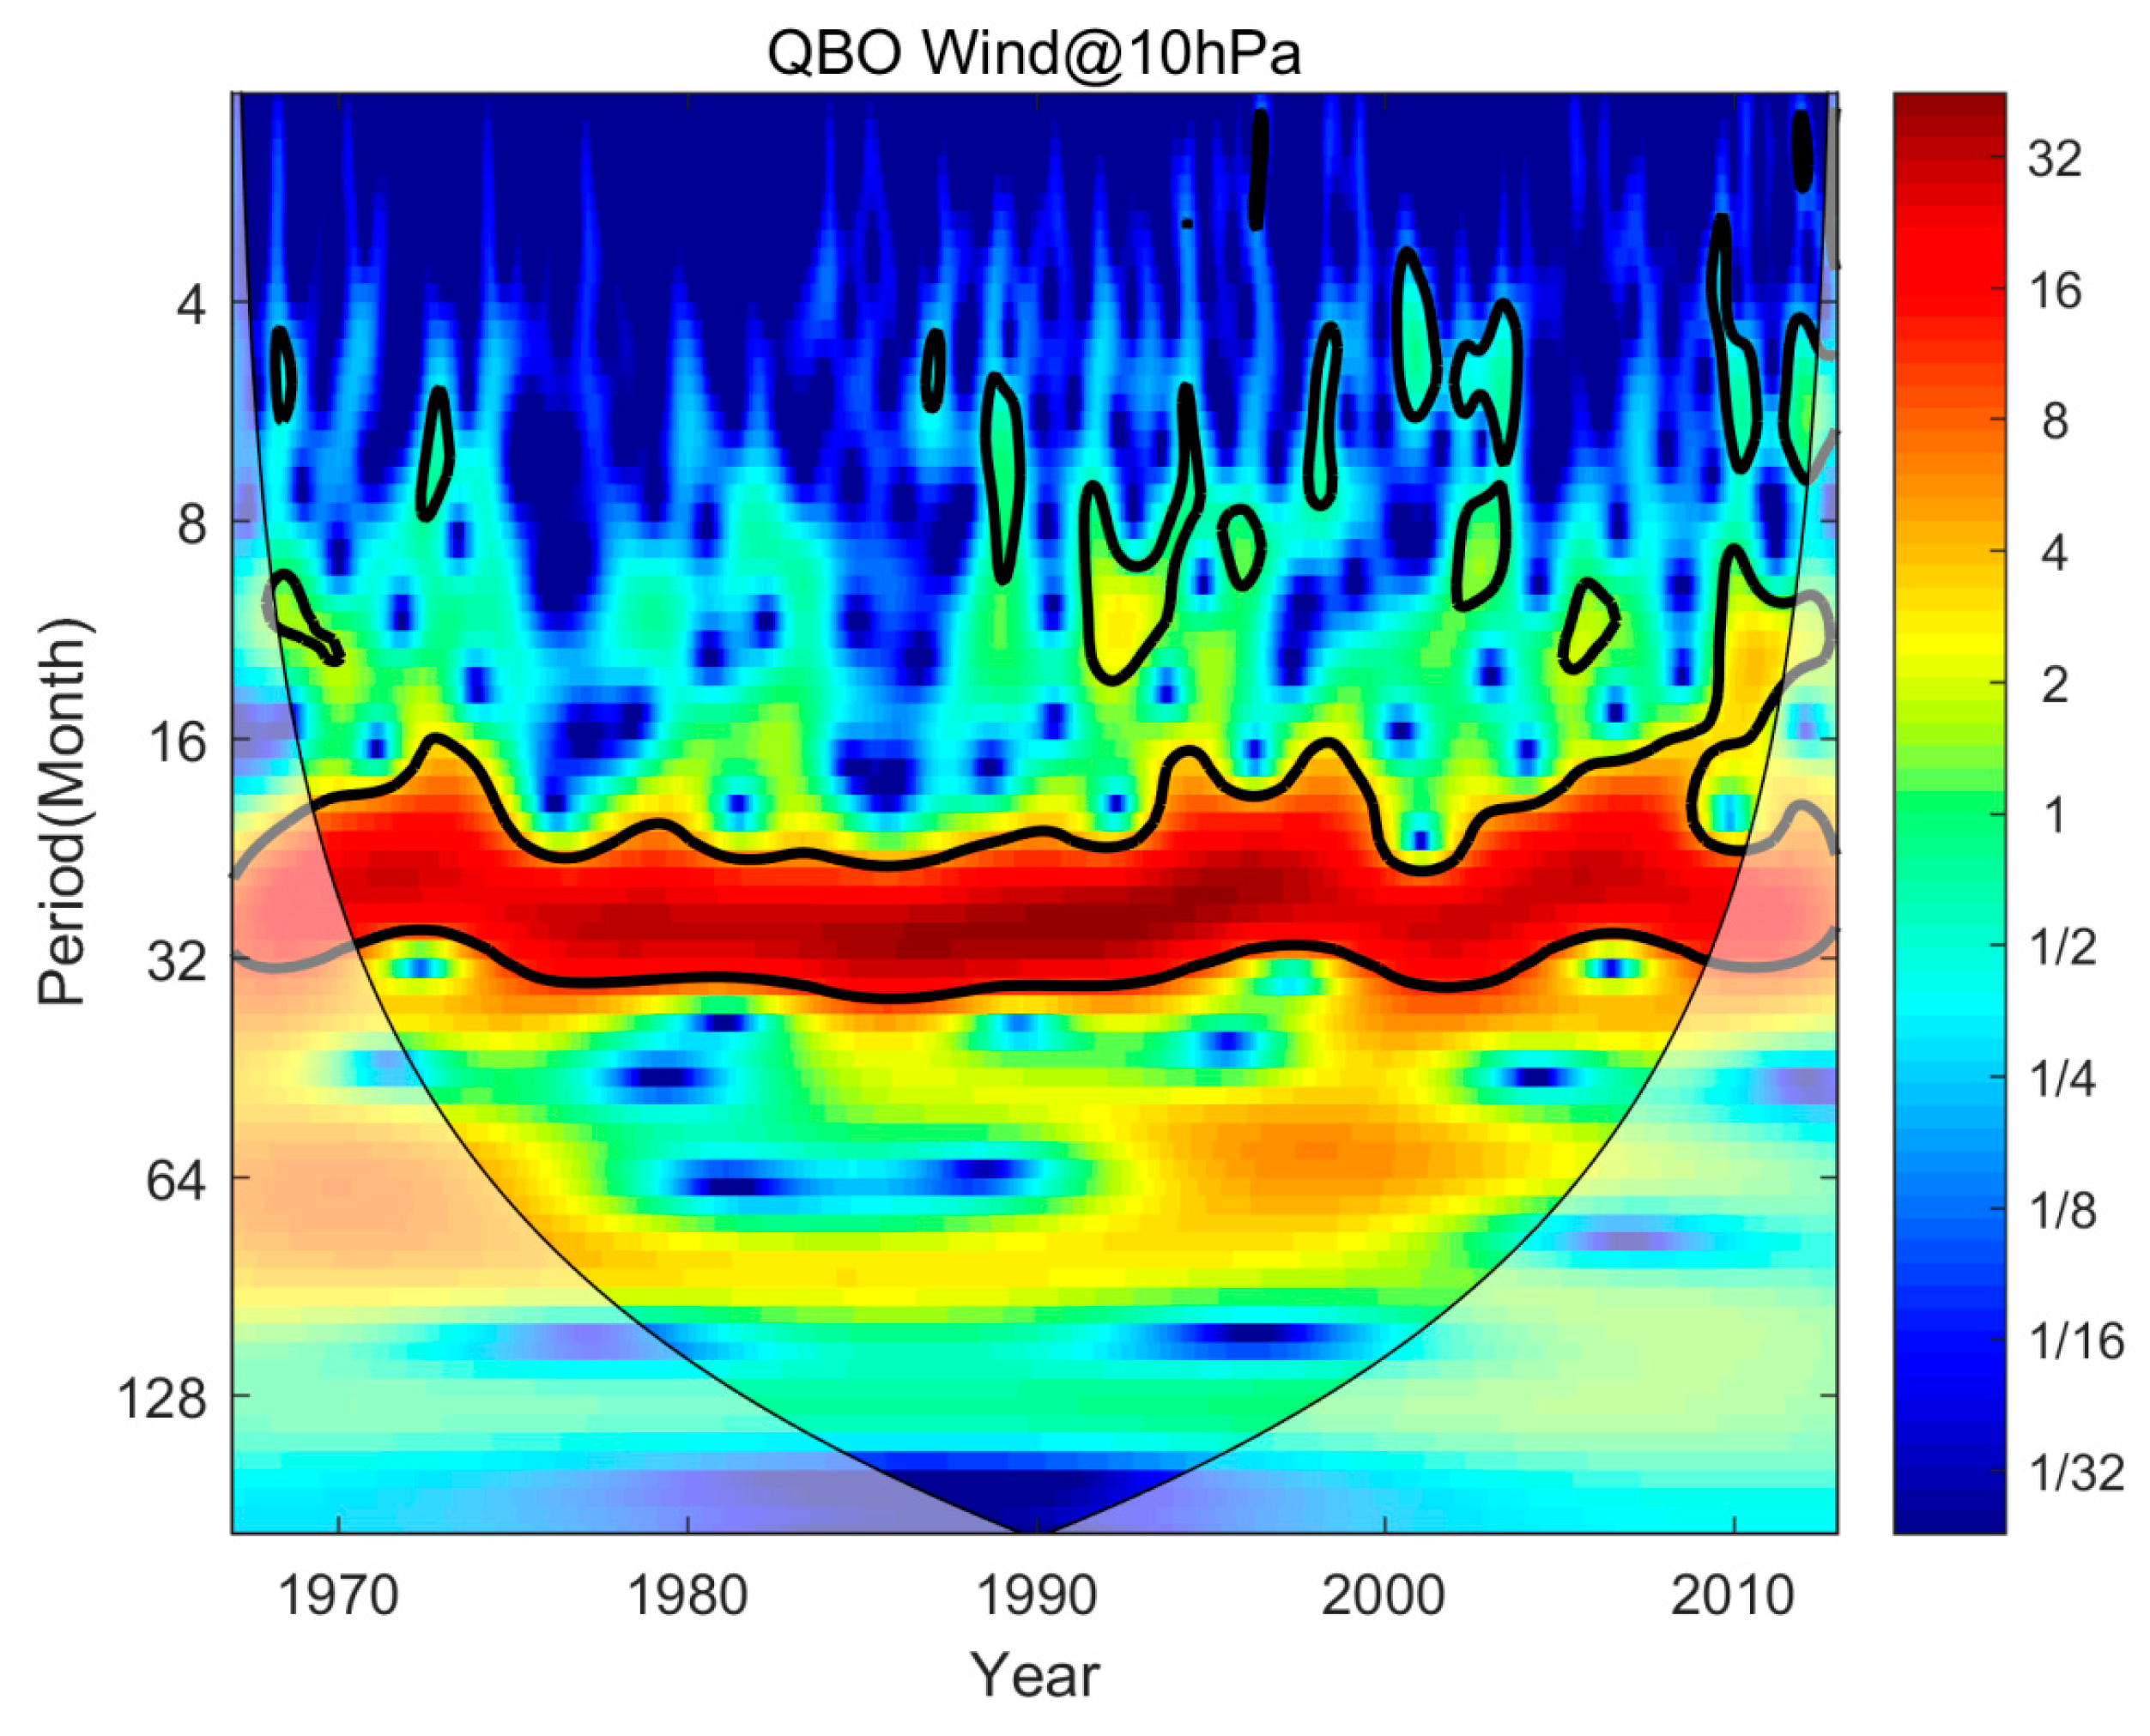
Figure 4, there is a very significant oscillation period of 24-32 months throughout the covered time, corresponding to the QBO signal. Particularly, the 11-year periodic variation, existed in the solar and geomagnetic activities, does not appear in the zonal wind. In other words, this indicates that the QBO phenomenon should be not modulated or influenced by the long-term variation of solar and geomagnetic activity.
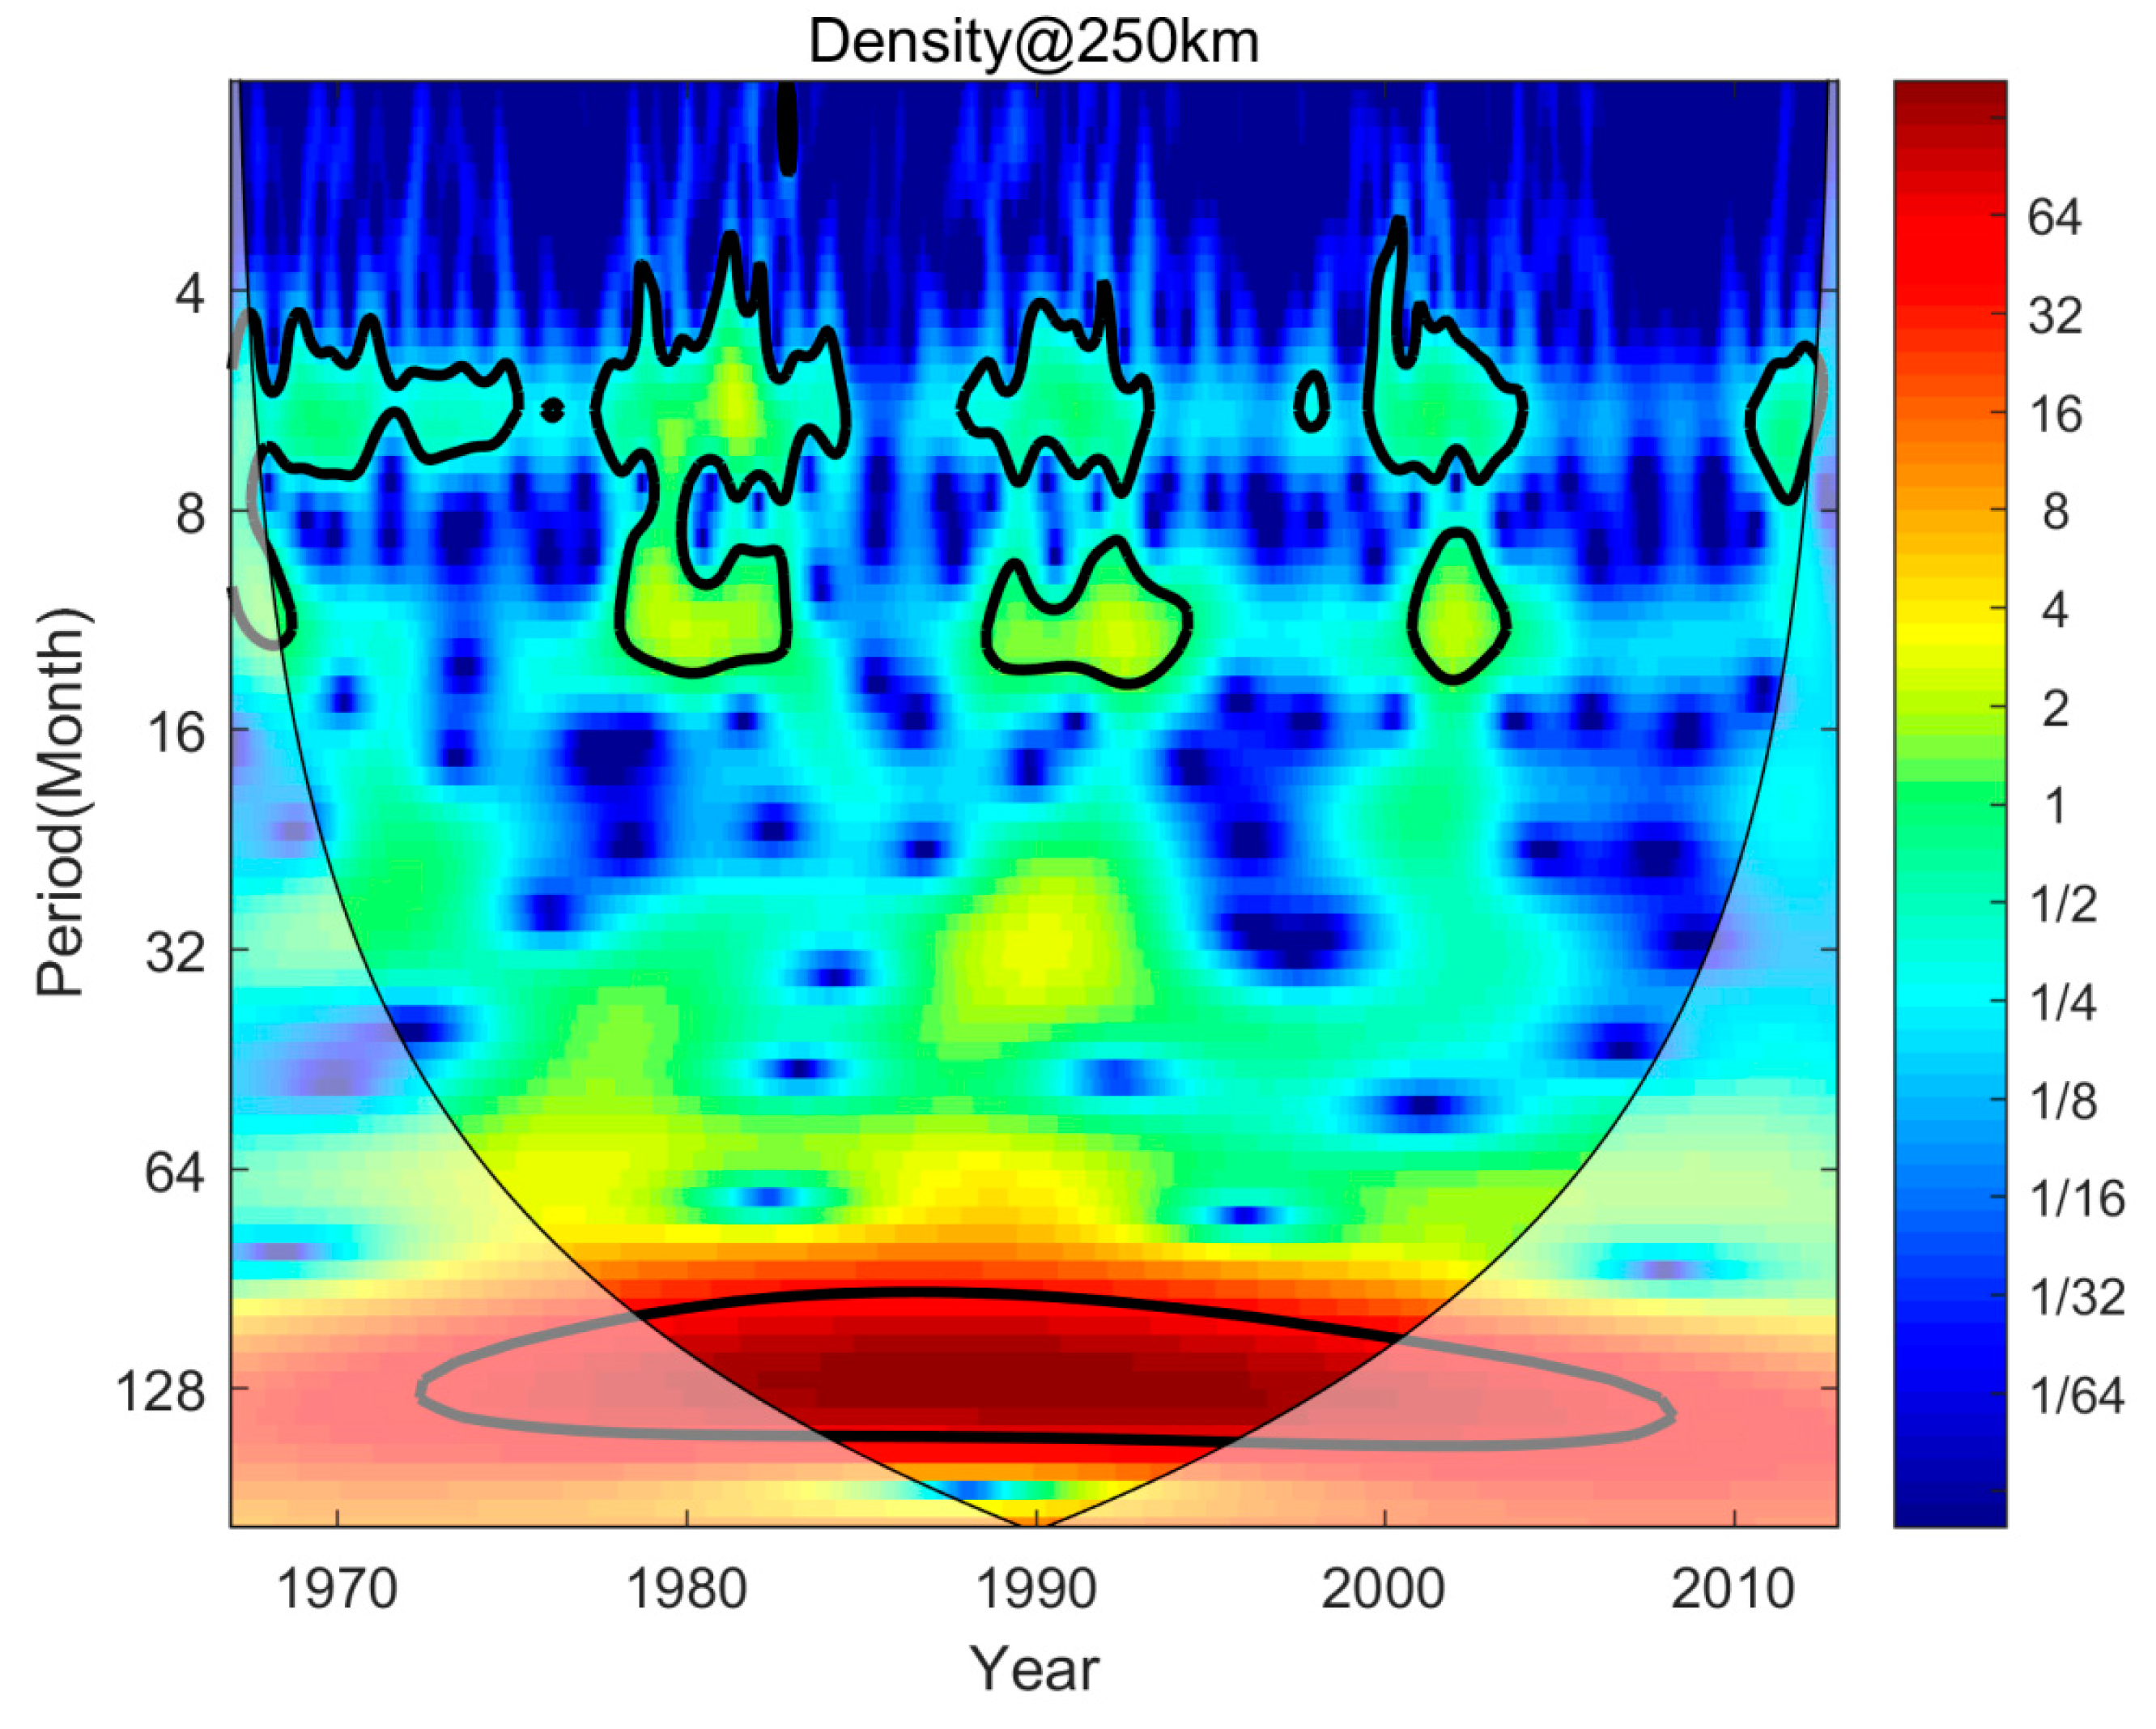
Many studies have shown that the thermospheric density exhibits semi-annual, annual and solar cycle variations (Qian et al, 2011; Emmert, 2015a). We analyze the thermospheric density at 250 km by using the wavelet analysis, and show the results in
Figure 5. Clearly, the density at 250 km has a ~11 years period during 1967 and 2013. This is mainly due to the effect of solar activity, which can account for over 90% of the variance in the thermospheric density (Emmert et al., 2010). In addition, the density also exhibits significant seasonal variations, including semiannual (6 month) and annual (12 month) variations, under high solar activity conditions, but the significance is weak during lower solar activity. Recently investigations suggest that the annual and semiannual variations in the upper atmosphere are related to both solar activity and lower atmosphere (Qian et al, 2019; Emmert, 2015a; Yue et al, 2022). Furthermore, during high solar activity, the thermospheric density also exhibits a 20-30 month periodic signal, but it does not pass the 95% significance.
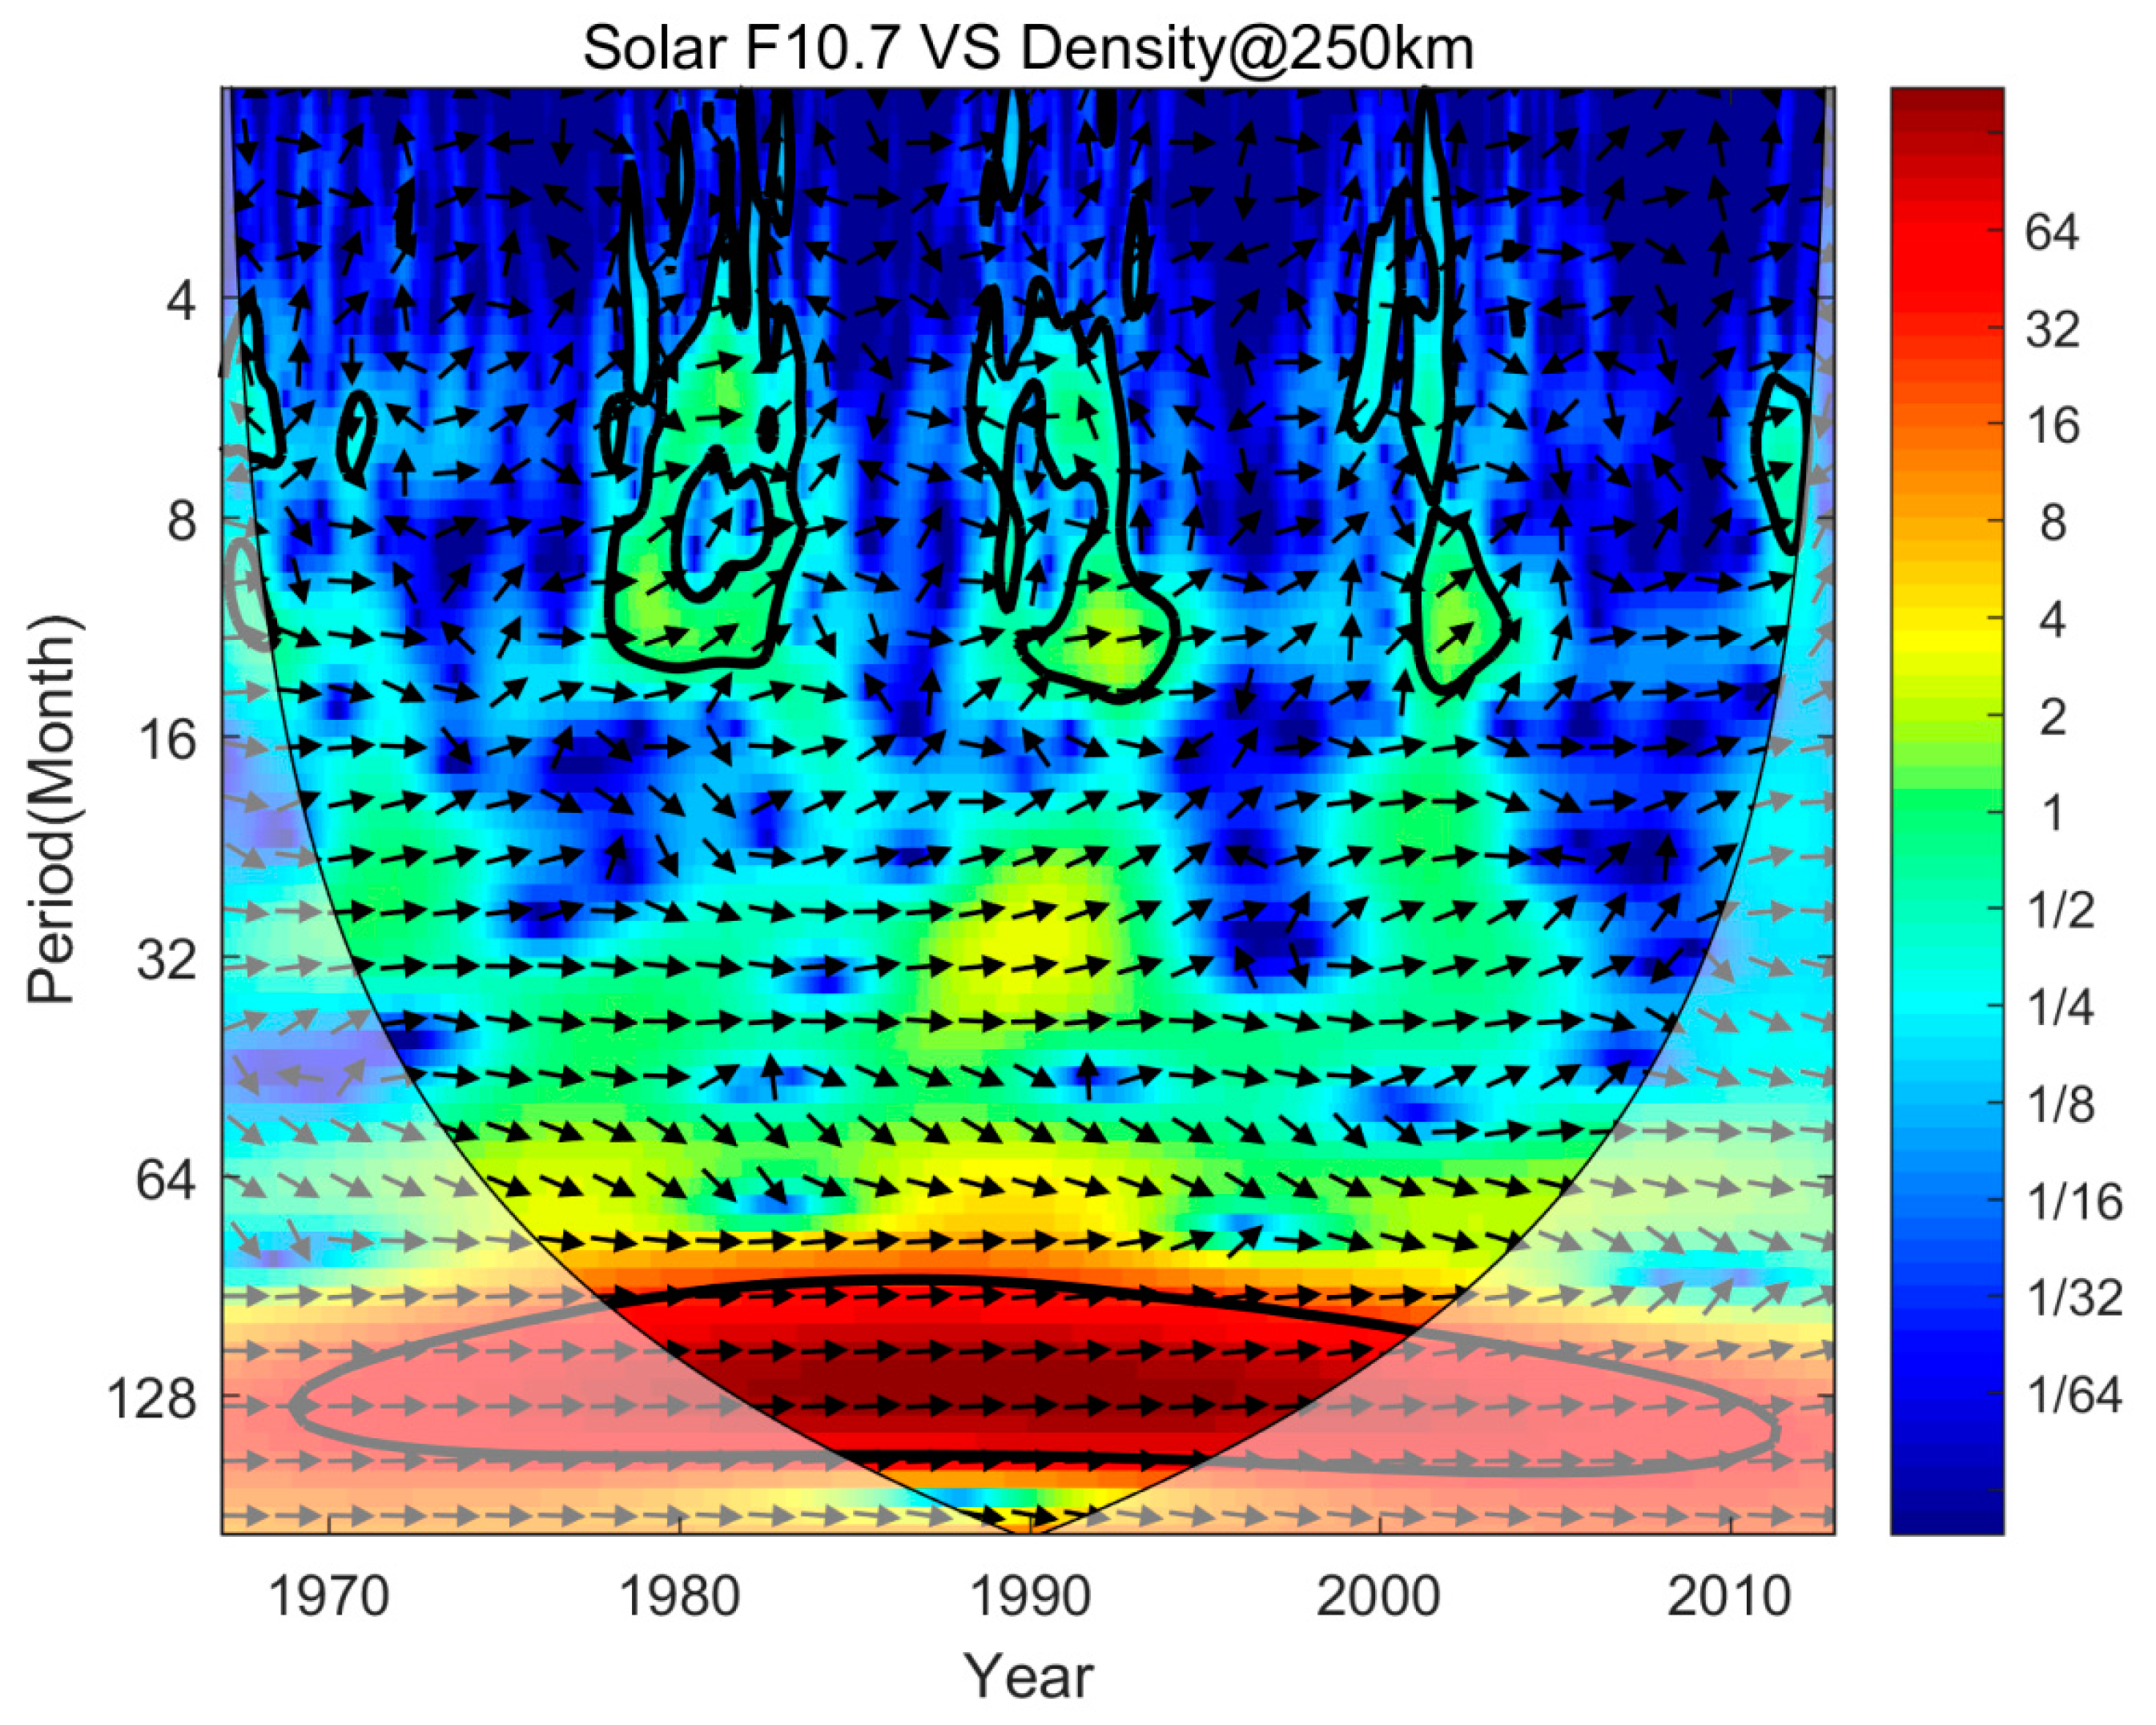
To further investigate how coherently these oscillations vary with each other, we used the cross-wavelet method, which combines cross-spectral analysis with wavelet transformation, to analyze the variations of thermospheric density and solar activity. As seen in
Figure 6, the density varied with the 11 years solar cycle, and there is almost no time lag with each other. In the other periods, the black arrow shows disorganized, meaning that the semiannual and annual variations of thermospheric density should be not directly affected by the solar activity. Moreover, the variations of thermospheric density at higher altitude are similar with the results in
Figure 5 and
Figure 6.
3.2. QBO signal diagnosis
In order to investigate the QBO signal in the upper atmosphere, we used the wavelet method based on the residuals, including the ratio or difference between the observed density and GAMDM model.
Figure 7 presents the period result of density ratio at 250 km, and many short-term scale variations are existed, but the semi-annual, annual and solar cycle periods are absent. Especially, the QBO signal is not observed under high and low solar activities, meaning that the upper atmosphere density should be not affected by the QBO signal. On the other hand,
Figure 6 also confirms that the GAMDM model can better reproduced the thermospheric density that other empirical models.
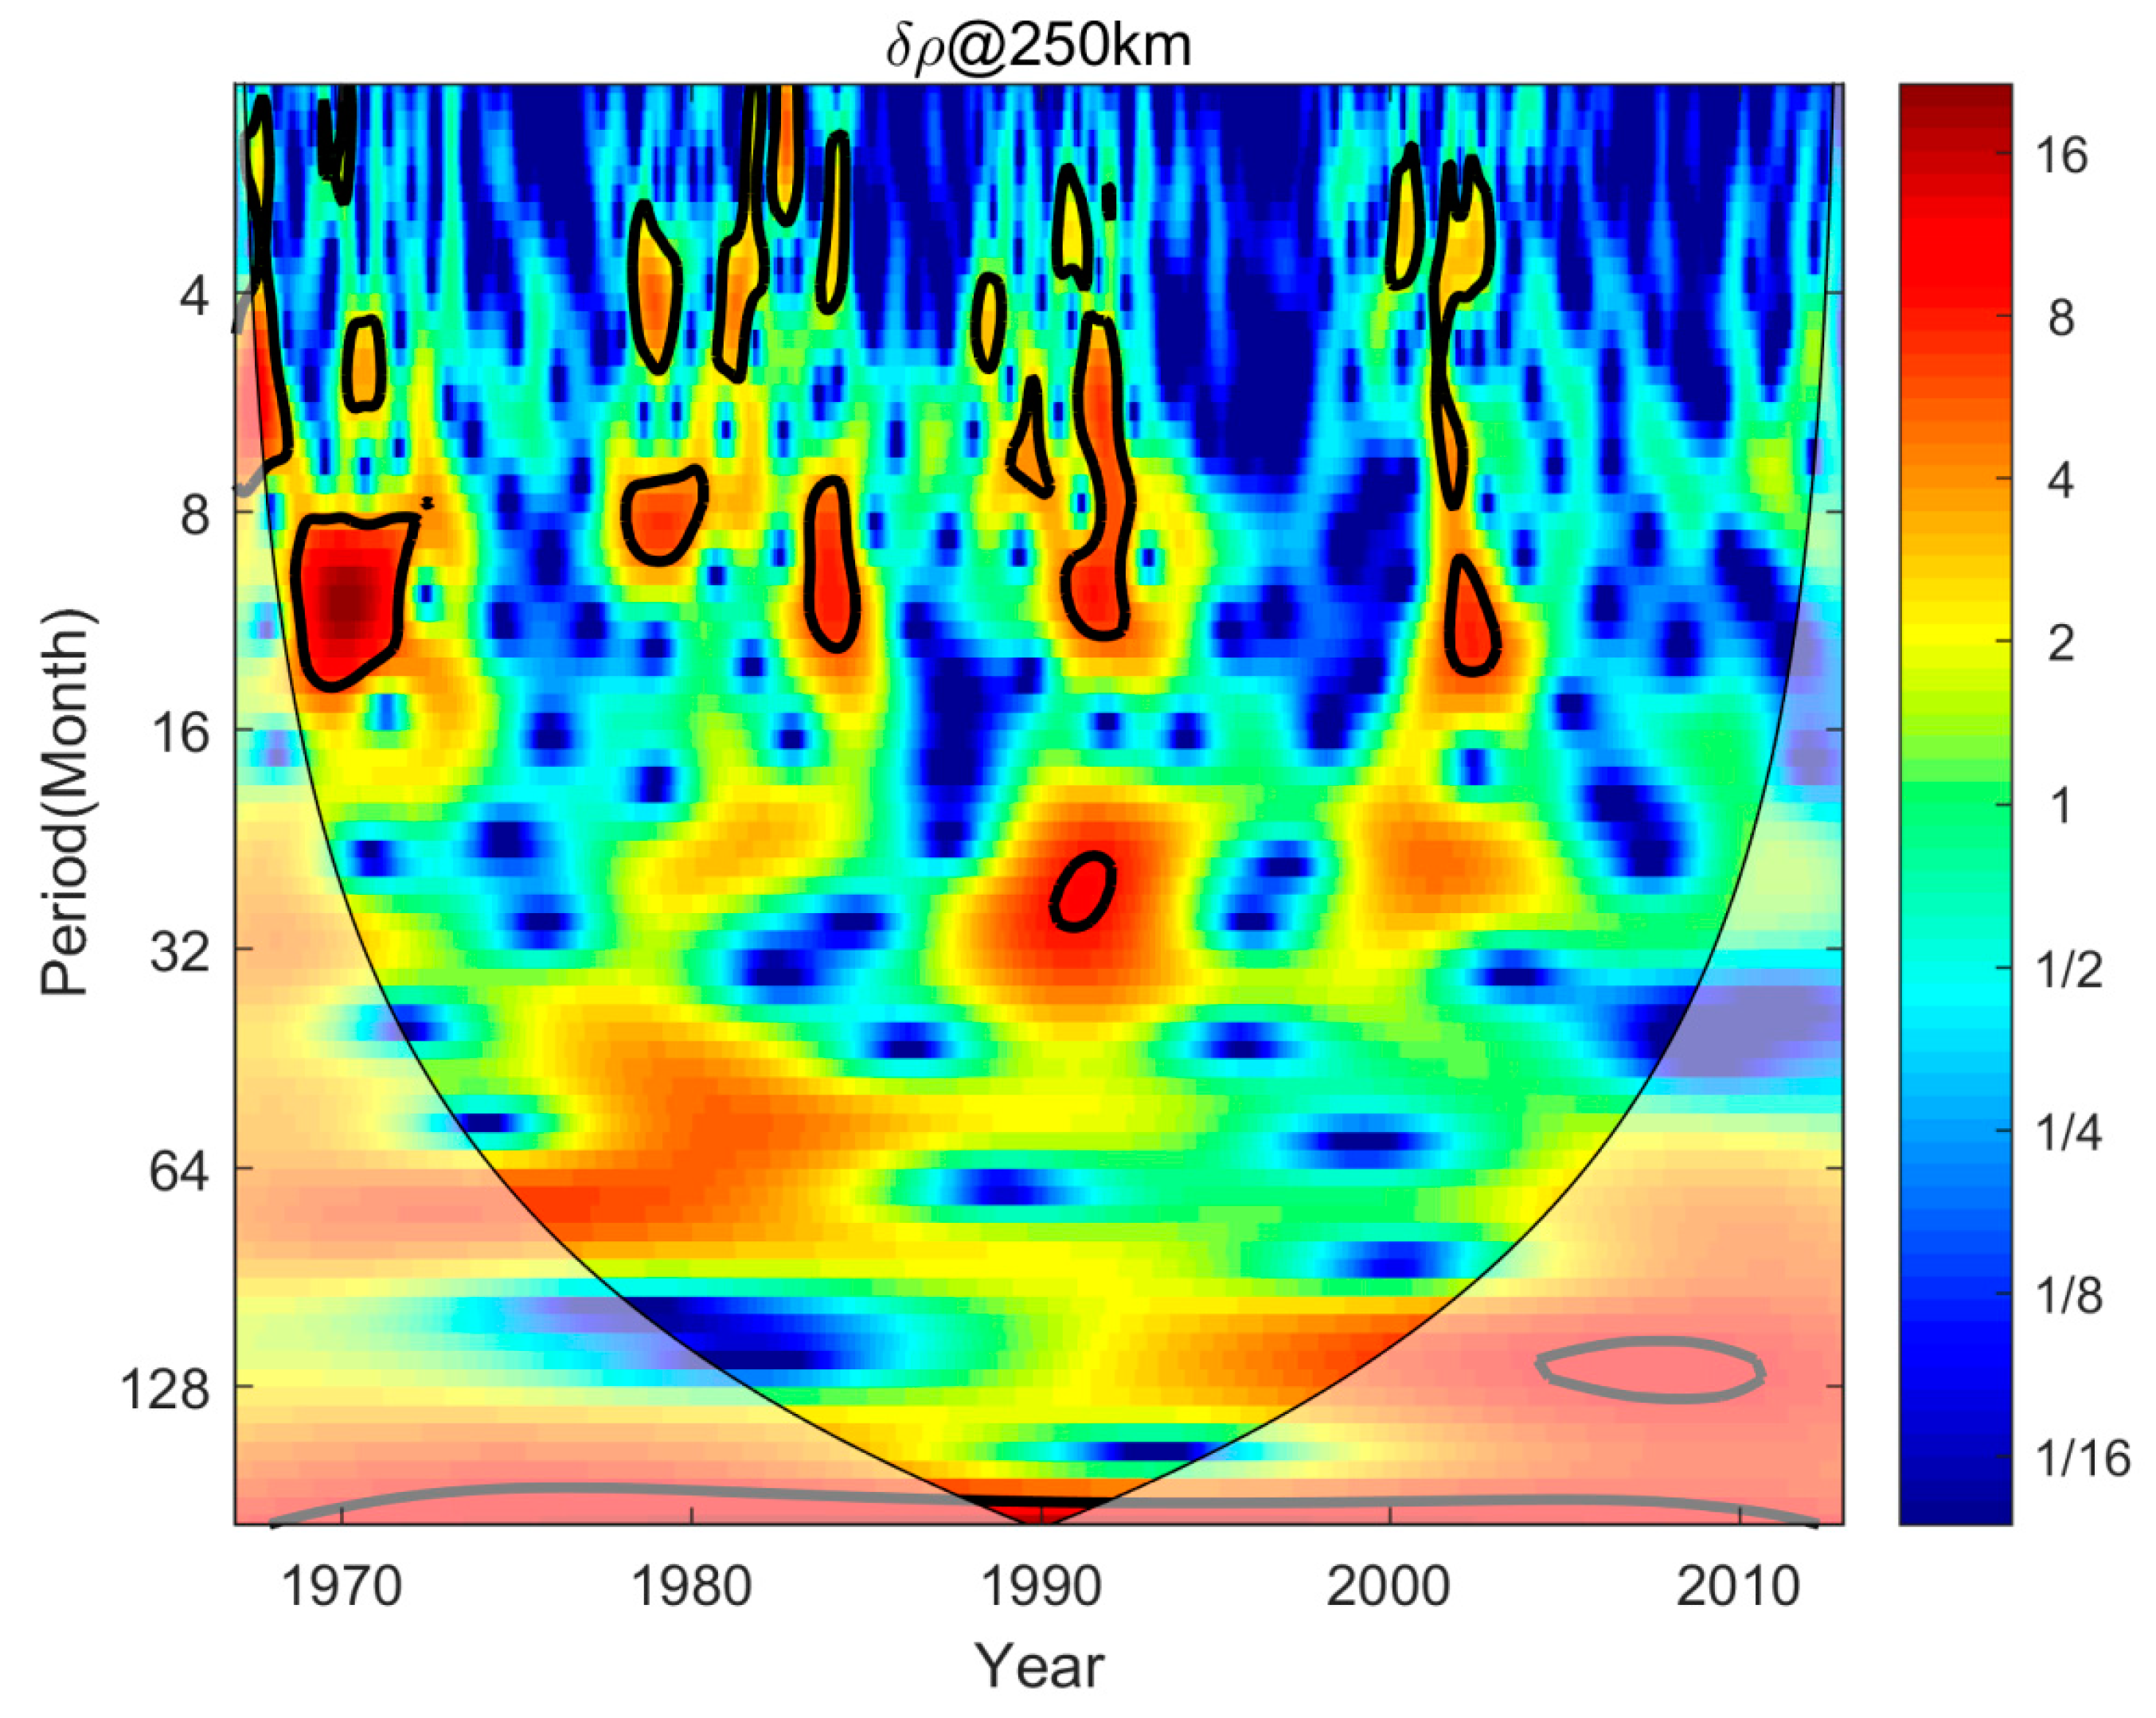
Figure 8 presents the wavelet power spectrum analysis results of the difference density at 250 km. As seen in this figure, the difference data shows periods of 25–32 months around 1990, corresponding to the QBO period. Obviously, this conclusion is consistent with the results of Liu (2016), while the signal intensity in this study is much weaker than
Figure 3 for Liu (2016). Namely, a reasonable existence of QBO signal in the thermospheric density requires a highly accurate model, which can remove the seasonal variations, solar and geomagnetic activities as far as possible.
Compared
Figure 7 and
Figure 8, the density ratio did not show any QBO signal period, while the density residual under high solar activity still has some semiannual and annual oscillations, accompanied by the QBO period. In other words, the analysis results are directly affected by the empirical model and residuals. However, we conclude that the QBO signal does not exist in the thermospheric density.
4. Conclusion
In this study, we discuss the periodic variations between solar activity, QBO and daily averaged thermospheric density by using the wavelet power spectrum method. Clearly, the QBO shows a very significant oscillation period of 24-32 months, while the solar and geomagnetic activities present a period of ~11 year. In addition, the thermospheric density has semiannual, annual and 11 year variations, and the role of solar activity is dominant. In addition, the semiannual and annual variations of thermospehric density usually more significant during high solar activity levels than the lower solar activity conditions. However, the thermospheric intra-annual variation is still not fully explained, but several mechanisms have been proposed, and the details can be found in Qian et al (2011) and Emmert (2015a).
Liu (2016) pointed out that strong coherence between the density residual and the solar activity makes difficult to tell whether there is a direct link between the density and the QBO. In order to investigate this issue, the GAMDM model, a more precise empirical model than previous, is used to get the residual between the observed and modeled thermospheric density. As a result, the conclusion of the issue is sensitive to the empirical model and analysis method. As we know, the MSIS00 empirical can capture most solar and seasonal driven variabilities in the thermospheric density, but its error between measurements even has strong coherence between the solar activity (Picone et al, 2002; He et al., 2018; Calabia et al., 2020). Namely, the MSIS00 can not only drastically remove the effects of solar activity, but also introduce the signals of solar activity into the residual of thermospheric density. However, the GAMDM can represent the semiannual and annual variations, solar and geomagnetic activities better than the MSIS00 model (Emmert, 2015b), and
Figure 1,
Figure 7 and
Figure 8 also prove this opinion. As for the results of ratio and difference density, we thought the ratio between GAMDM and measured density basically remains around 1, but the difference with each other can reach to 5 times under low and high solar activity conditions. Naturally, the periodic signals of latter are more intense than the previous, and this is consistent with the results in
Figure 7 and
Figure 8. In other words, the ratio and difference between observed density and different empirical model directly lead different results. In general, we thought that the QBO signal does not exist in the thermospheric density. However, more data and numerical modeling are needed for further investigating this issue.
Acknowledgments
This work was supported by the National Natural Science Foundation of China (42104162), the Provincial Natural Science Foundation of Hunan (2021JJ40670) and the Research Project of National University of Defense Technology (ZK20-45).
References
- Calabia, A., Jin, S., 2016. New modes and mechanisms of thermospheric mass density variations from GRACE accelerometers. J. Geophys. Res.: Space Phys.. 121(11), 11-191. [CrossRef]
- Calabia, A., Jin, S., 2019. Solar cycle, seasonal, and asymmetric dependencies of thermospheric mass density disturbances due to magnetospheric forcing. Ann. Geophys.. 37, 989–1003. [CrossRef]
- Calabia A., Tang G., Jin S., 2020. Assessment of new thermospheric mass density model using NRLMSISE-00 model, GRACE, Swarm-C, and APOD observations. J. Atmos. Sol.-Terr. Phys.. 199, 105207. [CrossRef]
- Dunkerton, T. J., Baldwin, M. P., 1991. Quasi-biennial Modulation of Plantary-wave Fluxes in the Northern Hemisphere Winter. Journal of the Atmospheric Sciences. 48(8), 1043-1061. [CrossRef]
- Emmert, J. T., Picone, J. M., 2010. Climatology of globally averaged thermospheric mass density. J. Geophys. Res.: Space Phys.. 115, A09326. [CrossRef]
- Emmert, J. T., 2015a. Thermospheric mass density: a review. Adv. Space Res.. 56, 773-824. [CrossRef]
- Emmert, J. T., 2015b. Altitude and solar activity dependence of 1967-2005 thermospheric density trends derived from orbital drag. J. Geophys. Res.: Space Phys.. 120(4), 2940–2950. [CrossRef]
- He, C., Yang, Y., Carter, B., Kerr, E., Wu, S., Deleflie, F., Cai, H., Zhang, K., Sagnières, L., Norman, R., 2018. Review and comparison of empirical thermospheric mass density models. Prog. Aerosp. Sci.. 103(6), 31-51. [CrossRef]
- Kane, R. P., 1995. Quasi-biennial oscillation in ionospheric parameters measured at Juliusruh (55°N, 13°E). J. Atmos. Sol.-Terr. Phys.. 1995, 75(4), 415-419. [CrossRef]
- Koval, A. V., Gavrilov, N. M., Kandieva, K. K., Ermakova, T. S., Didenko, K. A., 2022a. Numerical simulation of stratospheric QBO impact on the planetary waves up to the thermosphere. Sci. Rep.. 12, 21701. [CrossRef]
- Koval, A., Gavrilov, N. M., Pogoreltsev, A., Kandieva, K., 2022b. Dynamical Impacts of Stratospheric QBO on the Global Circulation up to the Lower Thermosphere. J. Geophys. Res: Atmospheres. 127, e2021JD036095. [CrossRef]
- Labitzke, K. G., Loon, H. V., 1999. The Quasi-Biennial Oscillation (QBO). The Stratosphere. Springer Berlin Heidelberg.
- Liu, H., 2016. Thermospheric inter-annual variability and its potential connection to ENSO and stratospheric QBO. Earth Planet Sp.. 68:77. [CrossRef]
- Matthes, K., Marsh, D. R., Garcia, R. R., Kinnison, D. E., Sassi, F., Walters, S., 2010. Role of the QBO in modulating the influence of the 11 year solar cycle on the atmosphere using constant forcings. J. Geophys. Res.. 115, D18110. [CrossRef]
- Picone, J. M., Hedin, A. E., Drob, D. P., 2002. NRLMSISE-00 empirical model of the atmosphere: Statistical comparisons and scientific issues. J. Geophys. Res.. 107 (A12)1468. [CrossRef]
- Qian, L., Solomon, S. C., Kane, T. J., 2009. Seasonal variation of thermospheric density and composition. J. Geophys. Res.. 114, A01312. [CrossRef]
- Qian, L., Solomon, S. C., 2012. Thermospheric density: an overview of temporal and spatial variations. Space Science Review. 168, 147–173. [CrossRef]
- Sağır, S., Atıcı, R., 2018. Comparison of the QBO and F10.7 Solar Flux Effects on Total Mass Density. Geomagn. Aeron.. 58, 841–845. [CrossRef]
- Tang, W., Xue, X. H., Lei, J., Dou, X. K., 2013. Ionospheric quasibiennial oscillation in global TEC observations. J. Atmos. Sol.-Terr. Phys.. 107, 36–41. [CrossRef]
- Torrence, C., Compo, G. P., 1998. A Practical Guide to Wavelet Analysis. Bulletin of the American Meteorological Society. 79, 61-78. [CrossRef]
- Weng, L., 2019. Characterization and modeling of thermospheric density variations. University of Science and Technology of China.
- Weng, L., Lei, J., Zhong, J., Dou, X., Fang, H., 2020. A machine-learning approach to derive long-term trends of thermospheric density. Geophys. Res. Lett., 47, e2020GL087140. [CrossRef]
- Yu, C., 2019. Simulation of the Stratospheric Wind Quasi-bienniaI Oscillation in the Whole Atmosphere Community Climate Model. University of Science and Technology of China.
- Yue, J., Yu, W., Pedatella, N., Bruinsma, S., Wang, N., Liu, H., 2022. Contribution of the lower atmosphere to the day-to-day variation of thermospheric density. Adv. Space Res. [CrossRef]
|
Disclaimer/Publisher’s Note: The statements, opinions and data contained in all publications are solely those of the individual author(s) and contributor(s) and not of MDPI and/or the editor(s). MDPI and/or the editor(s) disclaim responsibility for any injury to people or property resulting from any ideas, methods, instructions or products referred to in the content. |
© 2023 by the authors. Licensee MDPI, Basel, Switzerland. This article is an open access article distributed under the terms and conditions of the Creative Commons Attribution (CC BY) license (http://creativecommons.org/licenses/by/4.0/).
