Preprint
Article

Optimization of the Flexural Strength of Biocomposite Samples Reinforced With Resin For Engineering Applications

Altmetrics

Downloads

186

Views

28

Comments

0

Submitted:

25 July 2023

Posted:

27 July 2023

You are already at the latest version

Alerts
Abstract
This study focused on the optimization of the flexural strength of bio-composite samples of palm kernel, whelks, clams, periwinkles shells and bamboo fiber, reinforced with resin for engineering applications. The aim of the study was to: formulate different samples of bio-composite reinforce with resin for engineering applications and to evaluate the flexural strength, of the fabricated composite. The hand lay-up technique was used for the composites produced by incorporating different percentage compositions of the shells/fiber (10%, 15%, 20%, 25% and 30%) into varied proportions of epoxy resin and catalyst. The cured samples after 24hours were subjected to tensile, impact, flexural and water absorption test. The experiments were conducted using Taguchi optimization method L25 (5x5) with five design parameters and five level combinations in Minitab 18 statistical software. The results showed that the average values of flexural was 114.87MPa when compared to the unreinforced of 72.33MPa bio-composite. The study recommended that agricultural waste like palm kernel shells, whelk shells, clams, periwinkle shells and bamboo fiber, should be converted into important engineering applications.
Keywords: 
Subject: Engineering  -   Industrial and Manufacturing Engineering

1. Introduction

Composite materials are made from natural fibers or man-made materials obtained from the combination of two or more constituent materials with significantly different physical or chemical properties (Ngo et al., 2018). Today these fibers are considered as environment friendly materials owing to their biodegradability and renewable characteristics (Razavi et al., 2022). Natural fibers such as sisal, jute, coir, oil palm fiber have all been proved to be good reinforcement (Yao et al., 2021). Nowadays, the use of natural fibers reinforced composites is gaining popularity in automotive, cosmetic, and plastic lumber applications because it offers an economical and environmental advantage over traditional inorganic reinforcements and fillers (Achukwu et al., 2020).
Interest in the use of natural fibers or particles as reinforcements in polymers to substitute the conventional synthetic reinforcements in some structural and other engineering applications has continued to grow (Oromiehie et al., 2019). This is because even though synthetic fiber or particle reinforced polymer composites such as aramid fibers, glass fibers, carbon fibers etc. have several advantages (high stiffness, high strength-to-weight ratio, etc.) as compared with conventional materials like steel, wood concrete, their high initial cost and adverse environmental impact is limiting their use (Akindapo et al., 2017).
Currently, composites development is changing from synthetic fibers to natural fibers. This is because the composites with synthetic fibers such as glass fibers are not environmentally friendly, leading to problems of waste glass fiber, which cannot be decomposed by nature. Composites developed with natural fibers have many significant advantages over composites made of synthetic fibers (Sanjay et al., 2016). These advantages include: low cost, lighter weight, do not cause skin irritation, high strength- to-weight ratio, high stiffness- to- weight ratio, elimination of corrosion and stress corrosion, available in the form of plants and wastes, non-toxicity, improved control of surface contour and smoothness, higher fatigue endurance limit (up to 60% of ultimate tensile stress), 30-40% lighter than any particular aluminum, structure designed to the same functional requirements, less noisy while in operation and provide lower vibration transmission than metals, more versatile than metals and can be tailored to meet various performance needs and complex design requirements (Mousavi et al., 2021).
The convenience of developing composites with natural fibers lies in the fact that the ingredients are obtained easily from natural or agricultural wastes and hence the composites can be relatively easily manufactured (Estaji et al., 2021). Natural fibers can be cultivated so that their availability is sustainable. However, natural fibers also have many weaknesses such as irregular dimensions, stiffness, susceptibility to heat, ease of water absorption, and quick obsolescence (Ghanbari et al., 2020). Ideally, composite materials are used in structures where strength-to-weight ratio is a major consideration. Attempts have equally been made to use natural fiber composites in non-structural applications.
Currently, a number of automotive components previously made with glass fiber composites are now being manufactured using environmentally friendly composites. The use of natural fiber composites in the automotive industry has two main advantages, namely, vehicle becomes lighter which means improved fuel efficiency, and improvement in the sustainability of production because natural fibers can be cultivated (Ghanbari et al., 2020). Agricultural products such as: groundnuts, coconut and palm kernel, periwinkle, whelks and clams are widely grown in the tropical countries like Nigeria, but less than 10% of the wastes generated are used domestically as fuel with the larger percentage of the wastes yet to find global sustainable application. In addition, studies have shown that the burning of composite components with natural fibers produced lower air emissions due to their reduced energy consumption when compared to equivalent synthetic fiber composites (Achukwu et al., 2020).
Natural fiber-reinforced polymer composites are desirable structural materials due to their biodegradability (Shi et al., 2021). Among natural fibers, bamboo has attracted much interest as a promising reinforcement for different polymer matrices because of its favorable mechanical properties of a hybrid biocomposite. A hybrid biocomposites utilizes more than one type of reinforcement and/or matrix.
Hybrid biocomposites have full applications in engineering where the benefits of ease in manufacturing, strength-to-weight ratio, and low cost are required. Hybridization ensures joint properties, including impact strength, tensile strength, and compressive modulus, among others, which may be absent in mono-composite materials. Thus, hybrid materials are usually employed in designs where combinations of different fiber properties need to be used. Through innovative applications, hybrid composites have been of intense interest to researchers from antiquity. It is against this background that this study intends to explore the development and characterization of biocomposites (palm kernel shells, periwinkle shells, whelk shells, clams and bamboo fiber reinforced Epoxy composite) for engineering applications (Safi et al., 2015)
Lack of desired properties of conventional materials for materials technology relating polymer matrix composite manufacturing has called for the introduction of natural fiber as a fiber-reinforced material among researchers and industry players (Ikumapayi et al., 2018; Alias et al., 2018). In countries where agricultural activities are the mainstay of the economy, natural fiber as agricultural waste is abundant, creating environmental menace. One way by which ecological pollution can be reduced, if not curtailed, is the application of technology to convert waste into economic wealth. Fibrous agricultural waste available includes rice husk, bagasse, oil palm fiber, palm kernel shells, whelk shells, clams and bamboo fiber, among others.
Engineering materials selection poses a great influence in the operational life and effectiveness of structures and machine components. Locally sourcing of engineering materials that will stand the test of time when compared to synthetic materials is a growing interest. These engineering materials must possess mechanical properties that will make them compete favorably with the underlying environmental and operating conditions. In this study, the flexural strength of bamboo fiber reinforced Epoxy composite when reinforced with palm kernel shells, Whelk shells and clams were investigated to see how it solves the above underlying problems.

2. Methodology

2.1. Materials

In this study, all the materials used were sourced locally. Palm kernel shell, periwinkle shell, clam and whelk shells as a waste agricultural product were purchased from Cross River State Market and was grinded into fine powder prepared from properly cleaned palm kernel, periwinkle, clam and whelk shells (PPCWS).
Bamboo fibers are materials consisting of numerous and extremely fine fibers. Bamboo fiber has roughly comparable mechanical properties to other fibers such as glass fiber and carbon fiber. Although not as rigid as carbon fiber, it is much cheaper and significantly less brittle when used in composites. The bamboo fiber was obtained from building materials market at Umuahia.
The Epoxy resin used in this study was (Epochem 105 - Part A), which is also known as an accelerator. The epoxy resin is a fast setting and strong adhesive which was used to bond the bamboo fibers with the shells. The Epoxy resin and hardener were obtained from Enugu market.
The catalyst (Epochem 205 – Part B) also known as a hardener was used with the epoxy resin for the encapsulation or coating of the composite. The catalyst has good mechanical strength, good resistance to the atmosphere and chemical degradation. Other ancillary materials include distilled water, petroleum jelly, rollers, clamps, hand brush, plies, paper tape, nose mask, measuring cylinder, weighing balance, hand glove, scissors, transparent containers, knife, test tube, beaker, and stop watch.

2.2. Methods

2.2.1. Preparation of the Biocomposite
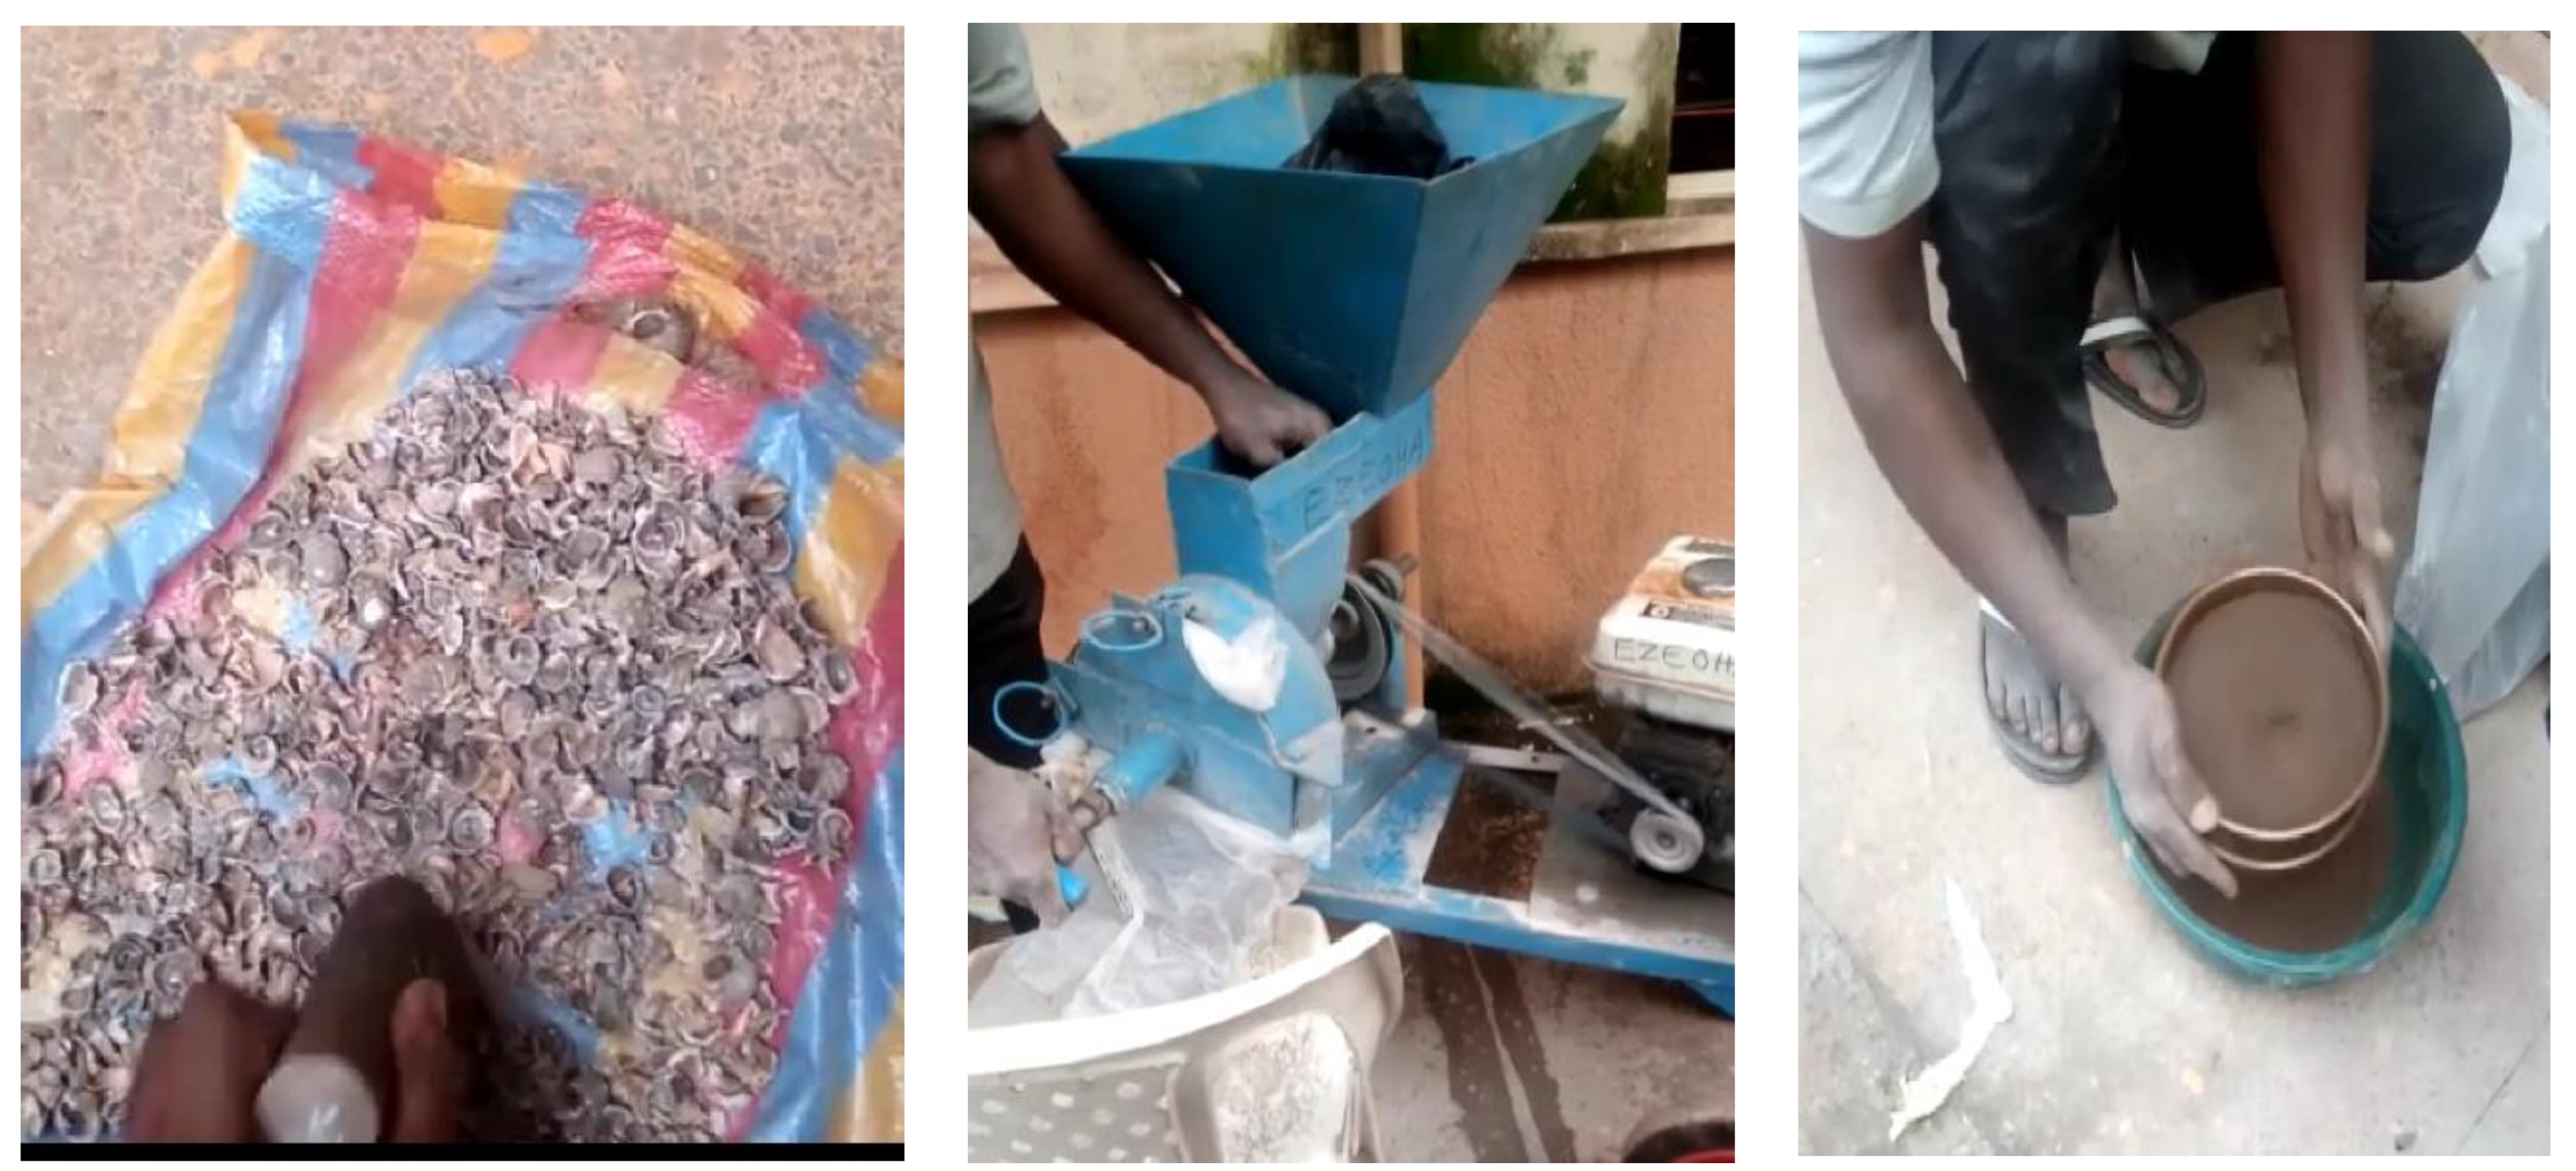
The palm kernel shell, periwinkle shell, clam shell, whelk shell and bamboo fiber were collected from the wild. It was first cleaned with water, and later, it was washed with sodium hydroxide (1% conc. NaOH) in other to remove dirt and sap in the case of the bamboo fibers. After washing with NaOH, they were rinsed with distilled water in other to maintain the PH of the specimens at 7. The shells were then crushed with hard object before with was then taken to the grinding machine for grinding. The reason for crushing is to ensure easy grinding with the machine. After the grinding, the samples were sieved at 300micron and this was done for the palm kernel shell, periwinkle shell, clam shell, and whelk shell respectively. Figures 2.1, 2.2 and 2.3 shows the crushing, grinding and sieving of the shells respectively.
Figure 2.1. crushing of the shells. Figure 2.2 Grinding of the shells. Figure 2.3 sieving of the shells.
Preprints 80515 g001

2.2.2. Composite Fabrication

The epoxy was mixed according to the manufacturer's specifications, which was 2:1 for part A and part B, respectively. The molds for producing the samples were made based on flat test specimen dimensions and tolerances following ASTM E8 standard, and the composite was laminated using a hand-layup technique. Before the mold was filled with epoxy resin, it was waxed with a releasing agent (petroleum jelly). This helps to prevent the sample from sticking in the mold and subsequently makes it easier to remove the samples when they have hardened. Under randomized loading of the fiber, the composite was made with 30% volume percentage of the fiber. The volume percentage of the fiber/shell used was calculated using Equation 1.
Samples were prepared for both reinforced and unreinforced with the shells and fiber. Based on literature, the prepared samples were left to cure under room temperature for 24hours before it was removed from the mold for cutting.
        V f     = ( W f / ρ f ) [ ( W f / ρ f )     +   ( W m / ρ m ) ]
where V f is the fiber volume fraction (%), W m   and W f   are the weights of matrix and fiber respectively, ρ m and   ρ f are the densities (g/ c m 2 ) of the matrix and fiber respectively.

2.2.3. Taguchi Design

Genechi Taguchi, a statistician and engineer, created the Taguchi technique by introducing the loss function and extending trials with an outer array. Taguchi design was adopted because it helps to minimize the number of test and then maximize the effects of factors that cannot be controlled during the BSF surface treatment. For each level of treatment, the signal-to-noise (S/N) ratio was calculated using the S/N ratio formula developed by Taguchi from loss function. The goal is to maximize the treatment parameters. Therefore, the larger-the-better quality characteristic was used as shown in Equation 2.
S / N = - 10 l o g 10 1 n ( i = 1 n 1 μ 2 )
where μ is the responses for the given factor level combination,nis the number of responses in the factor level combination. Minitab 18 statistical software was used for the analysis. Taguchi L 25 orthogonal array of experimental design was used for this experiment. Table 1 shows the values of the percentage weight of the shells/fiber which was used in the experiment. Each experimental run was carried out three times and then the average value taken which was used in the analysis.

2.3. Determination of the Flexural Strength
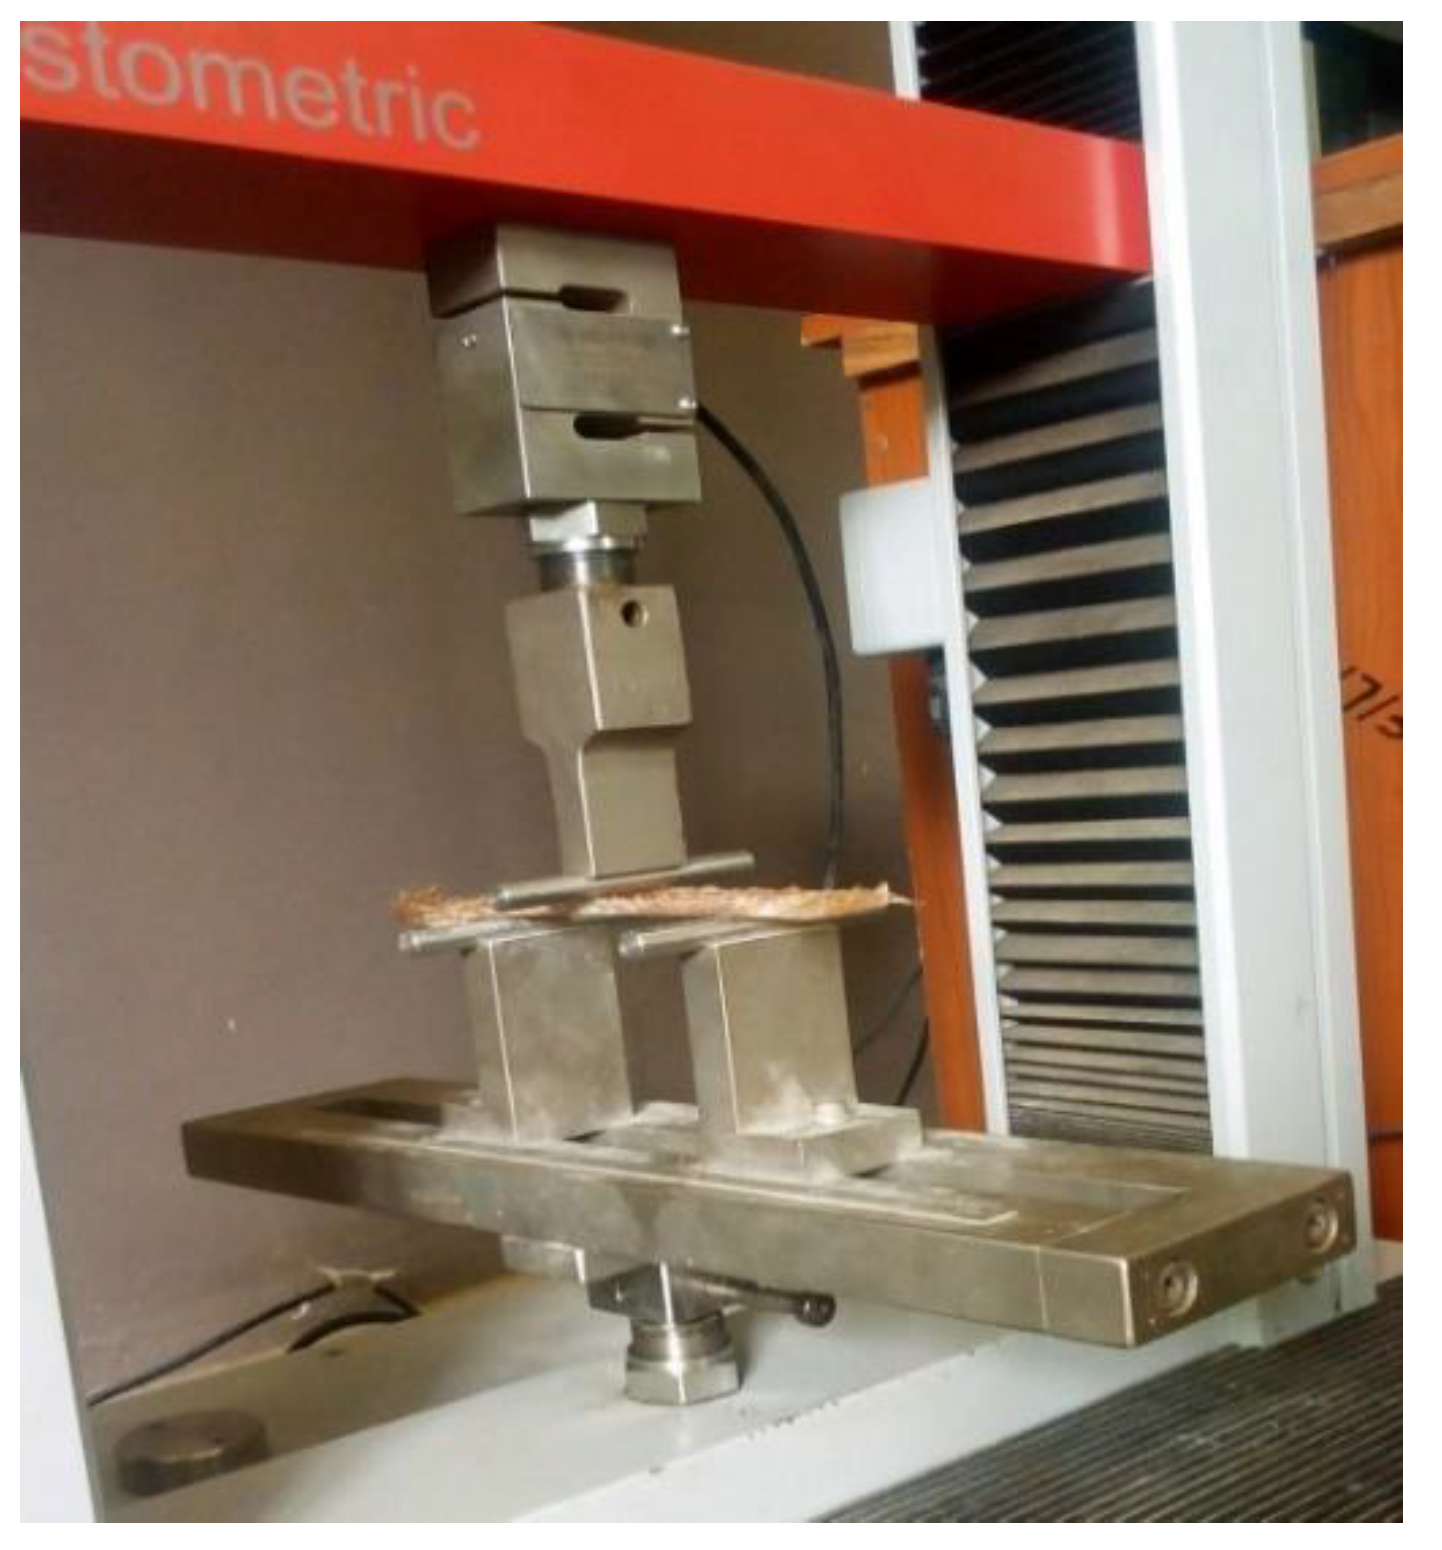
The specimen sizes for the flexural test were formed according to the requirements of the flexural strength testing equipment, which are 200mm X 30mm X 4mm. The test was carried out in a Universal Testing Machine (UTM) with model number M500-25CT, according to ASTM D7264M-15 (Rochdale England). The samples were placed in the machine and then subjected to a force of 50N till they fractured. For each test, three samples were generated, and the average was used to discuss the results. The maximal bending strength was recorded, which was used for the studies. Figure 2.4 depicts the setup for the samples' flexural tests.
Figure 2.4. Flexural test setup.
Preprints 80515 g002

3. Results

Variations in the mass of the palm kernel shell, periwinkle shell, clam shell, whelk shell, and bamboo fiber were considered at five levels each, using the Taguchi L25 orthogonal array of experimental design. The influence of the independent variables on the mechanical characteristics of the shells/fiber in a reinforced epoxy composite was investigated in twenty-five runs of the experiment. Individual qualities such as flexural strength, impact strength, tensile strength, and water absorption were evaluated after the samples were tested in their respective testing machines. Each test was repeated three times, with the average results calculated. The experimental results (Table 2 and Table 3) were analyzed using Minitab 18 statistical software.

3.1. Flexural Strength of the Biocomposite

The flexural strength of each experimental run of the Taguchi L 25 orthogonal array was conducted in a universal testing machine and the bending strength at peak recorded which was used in the analysis.Table 2 shows the Taguchi experimental matrix, flexural strength responses, and S/N ratio for each of the twenty-five experimental runs. The results were analyzed using Minitab 18 statistical software.
The optimal mass reinforcement parameters that gave the highest flexural strength properties in a reinforced epoxy composite were calculated using the larger-the-better S/N ratio in equation 4. This was used because an optimal value of the flexural strength properties of the composite is desired. For each level of the treatment parameters, the S/N ratio is calculated based on the S/N analysis developed by Taguchi.
Analysis of the effect of each control factor via, mass of the palm kernel shell, periwinkle shell, clam shell, whelk shell and bamboo fiber on the flexural strength of the biocomposite was performed with the S/N response table shown in Table 3. This table which was generated using the Taguchi technique shows the optimal levels of the control factors for the flexural strength. The table also includes the ranks based on delta statistics, which shows the relative effects of each factor on the response. It is calculated by taking the difference between the highest and lowest averages for the factor chosen. The level values of the control factors in table 4.1.2 are shown clearly in graph form in Figure 3. The optimal mass percentage parameters can be easily determined from these graphs. The best level for each control factor was found according to the highest S/N ratio level of that factor. According to this, the levels and S/N ratios for the factors giving the best flexural strength were specified as Palm kernel (Level 3, S/N 40.82), periwinkle (Level 4, S/N = 40.80), clam shell (Level 1, S/N =40.58), whelk shell (Level 2, S/N = 40.59), bamboo fiber (Level 1, S/N = 40.70). In other words, the optimum mass reinforcement of the shell/fiber which gave the best flexural strength in a reinforced epoxy composite were 20wt% palm kernel shell, 25wt% periwinkle, 10wt% clam shell, 15wt% whelk shell and 10wt% bamboo fiber. This can be clearly seen in Figure 3.1.

3.2. ANOVA of the Flexural Strength

ANOVA was used to analyze the significance of the treatment parameters on the flexural strength. The ANOVA results are shown in Table 4. This analysis was done at a significance level of 5% and was determined by comparing the F-values of each treatment parameter used. The F-ratio was basically used to measure the significance of the treatment parameter on the flexural strength, at the desired significance level (5%).
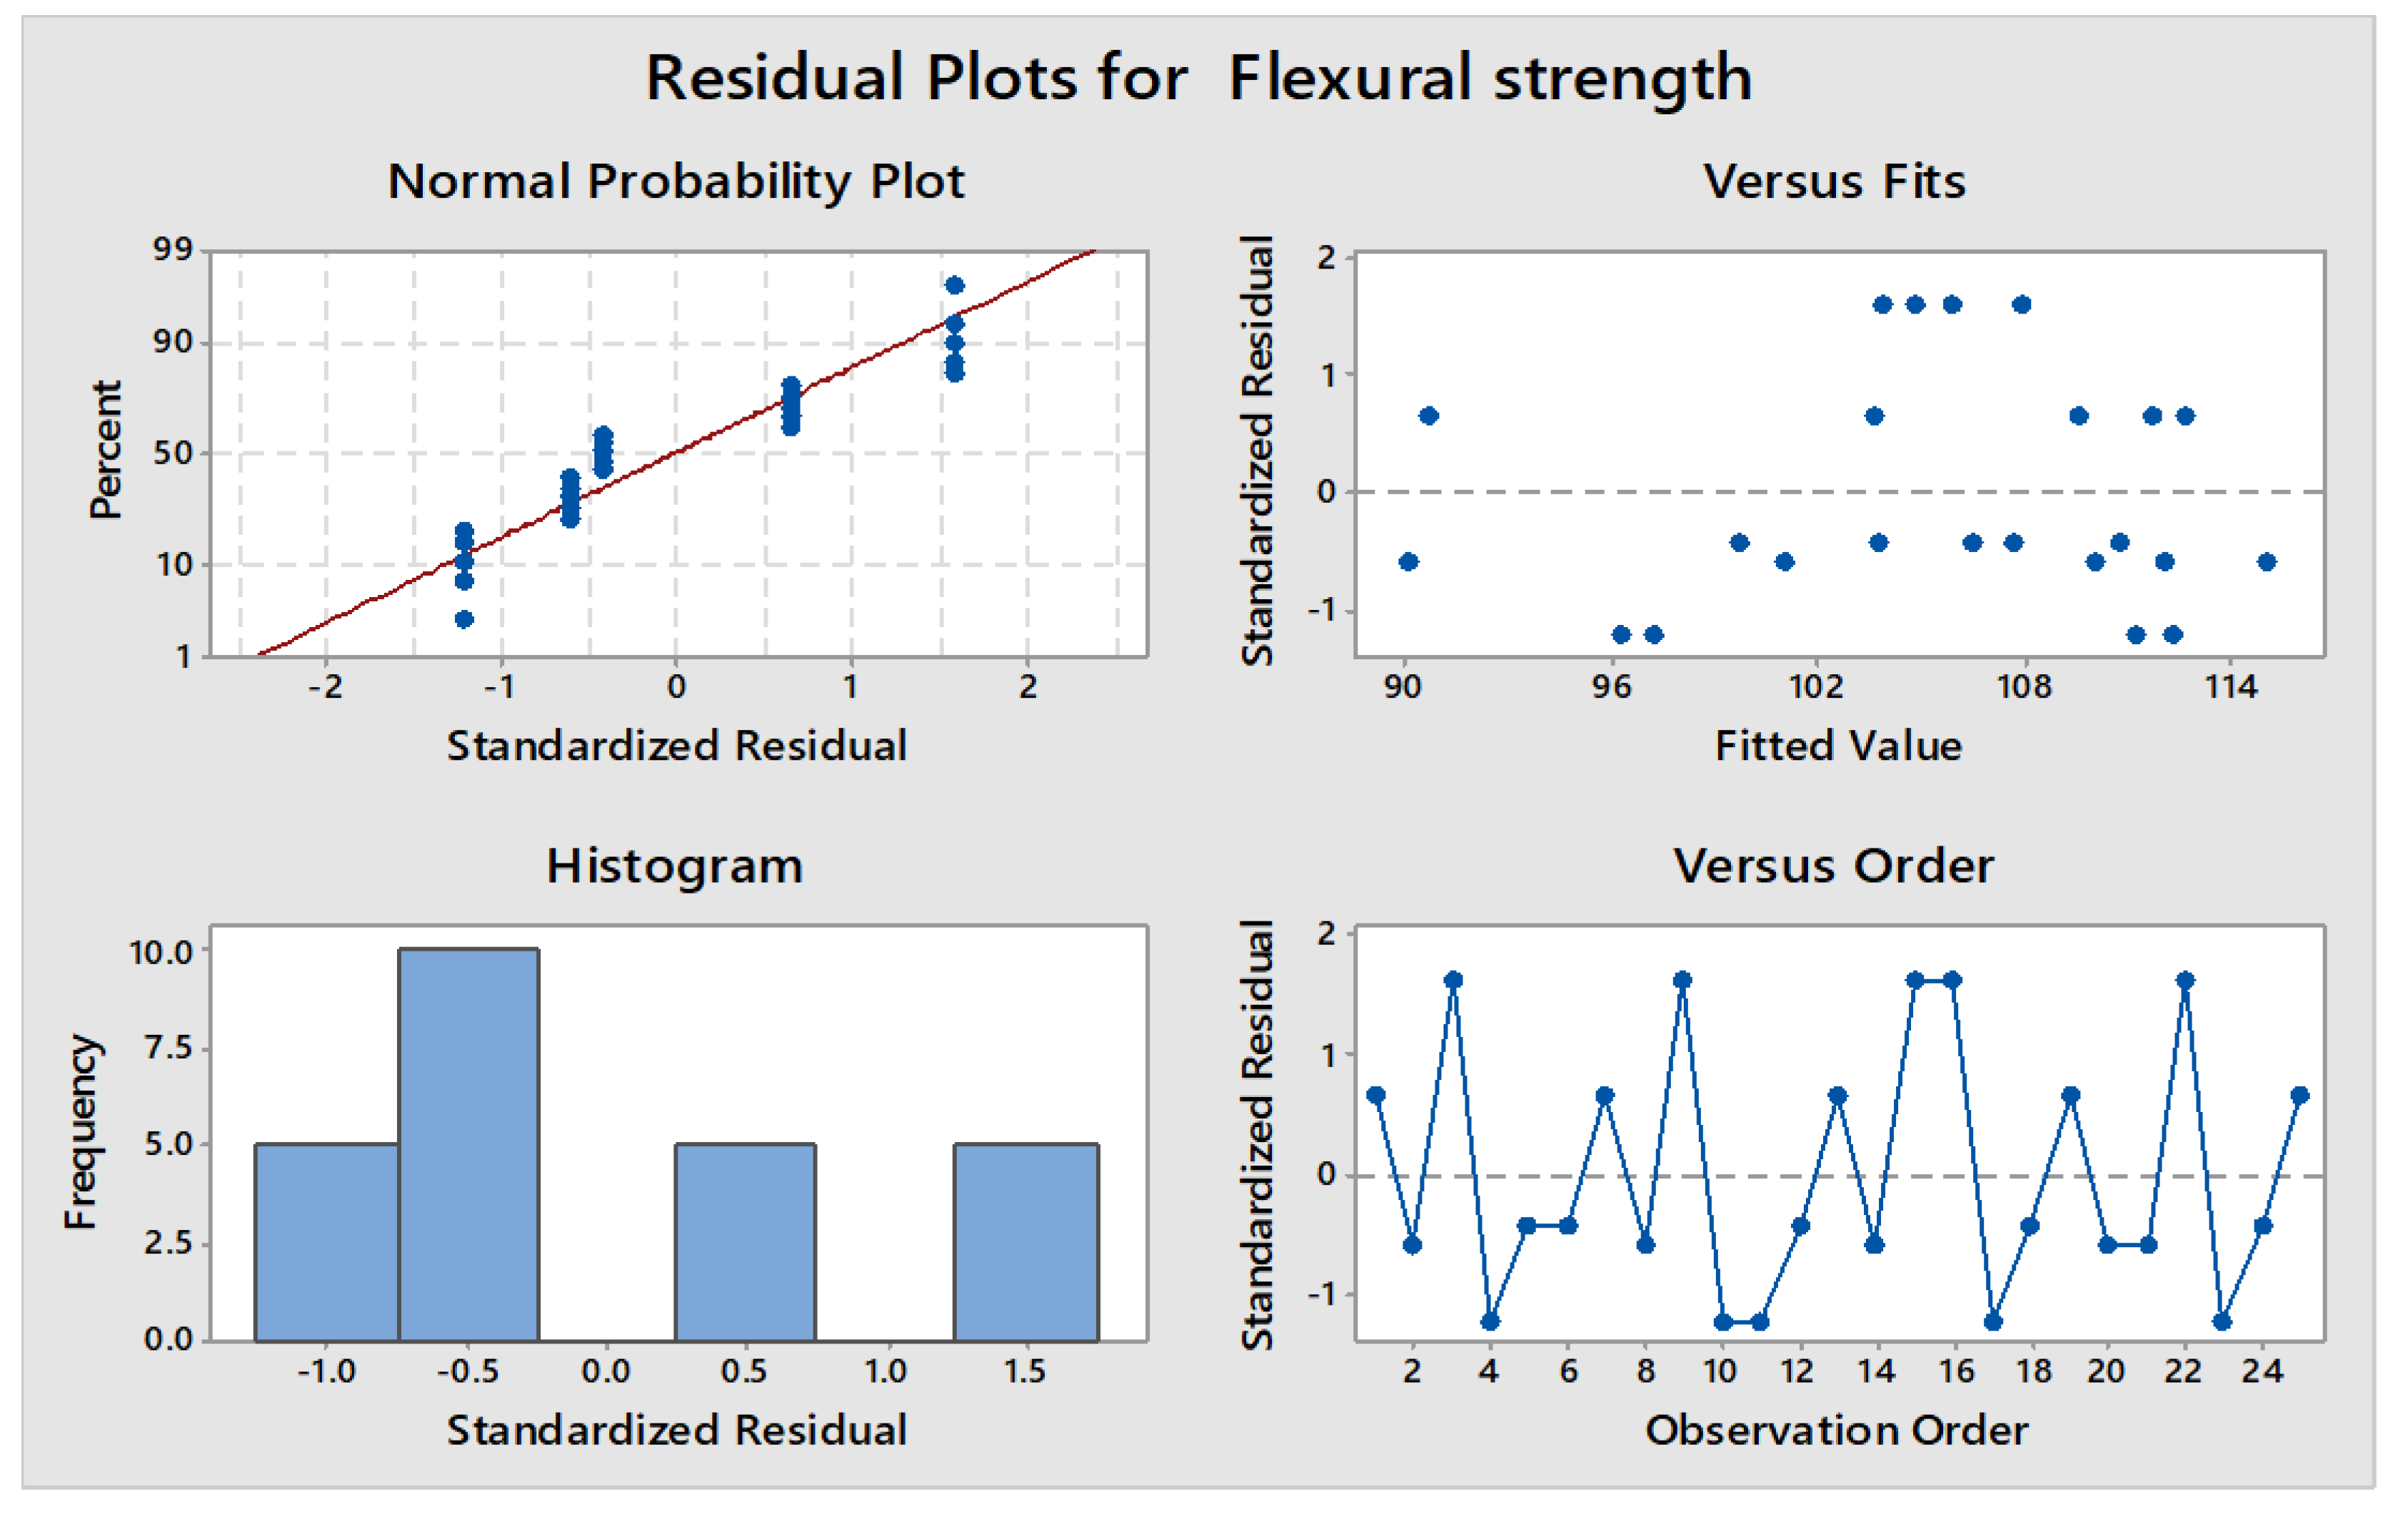
From Table 4 results, the P-values shows that the periwinkle shell has statistical and physical significance on the flexural strength of the reinforced epoxy composite. Based on the F-values, the periwinkle was the most primary significant factor in the composite with a contribution of 44.90% followed by palm kernel with a contribution of 28.13%. The clam shell is less significant with a contribution of 3.45% and this can be seen from the P-value which is greater than the significance level of 5%. An R-sq value in the model summary shows that palm kernel Shell, periwinkle shell, clam shell, whelk shell and bamboo fiber gives details to 92.24% of the total variation in flexural strength response of the composite. This means that 7.76% of variations are due to other factors which are not considered in the research such as shell particulate size etc. The residual plots of the flexural strength are shown in Figure 3.2. From the normal probability plot of the residuals at top left, it is seen that the residuals are normally distributed, since the plot follow approximately a straight line. Hence, there are no violations of the ANOVA assumptions. The residuals versus observation order plot at the bottom right corner shows no pattern or trend. This means that the residuals are independent of one another. Similarly, the residuals versus fitted value plot at the top right corner shows that the residuals have constant variance and are randomly distributed.
Figure 3.2. Residual plots for flexural strength.
Preprints 80515 g004

3.3. Regression Analysis of the Flexural Strength Response

Regression analysis was conducted in other to obtain a predictive equation for the flexural strength under the influence of the independent variables, variations in mass of the palm kernel shell, periwinkle shell, clam shell, whelk shell and bamboo fiber only. These predictive equations were made for both multiple linear and quadratic regression models and were both conducted with Minitab 18 statistical software. The predictive equation which was obtained by the linear regression model and quadratic regression model are shown in equations 3 and 4 respectively.
Y = 123.52   0.357   X 1     0.366 X 2   0.043   X 3 + 0.158   X 4     0.283   X 5
R-sq   =   38.78 %         R-sq(adj)   =         22.66 %
Y = 100.8     0.400   X 1 + 0.667 X 2 + 1.173 X 3 + 0.500 X 4     0.283 X 5     0.0477 X 2 2 + 0.0438 X 2 X 4     0.0608 X 3 X 4
R-sq   =   77.30 %         R-sq(adj)   =         23.54 %
where Y = Flexural Strength (MPa), X 1 = palm kernel shell,   X 2 = Periwinkle shell,   X 3 Clam shell,   X 4 Whelk shell   X 5 Bamboo fiber.
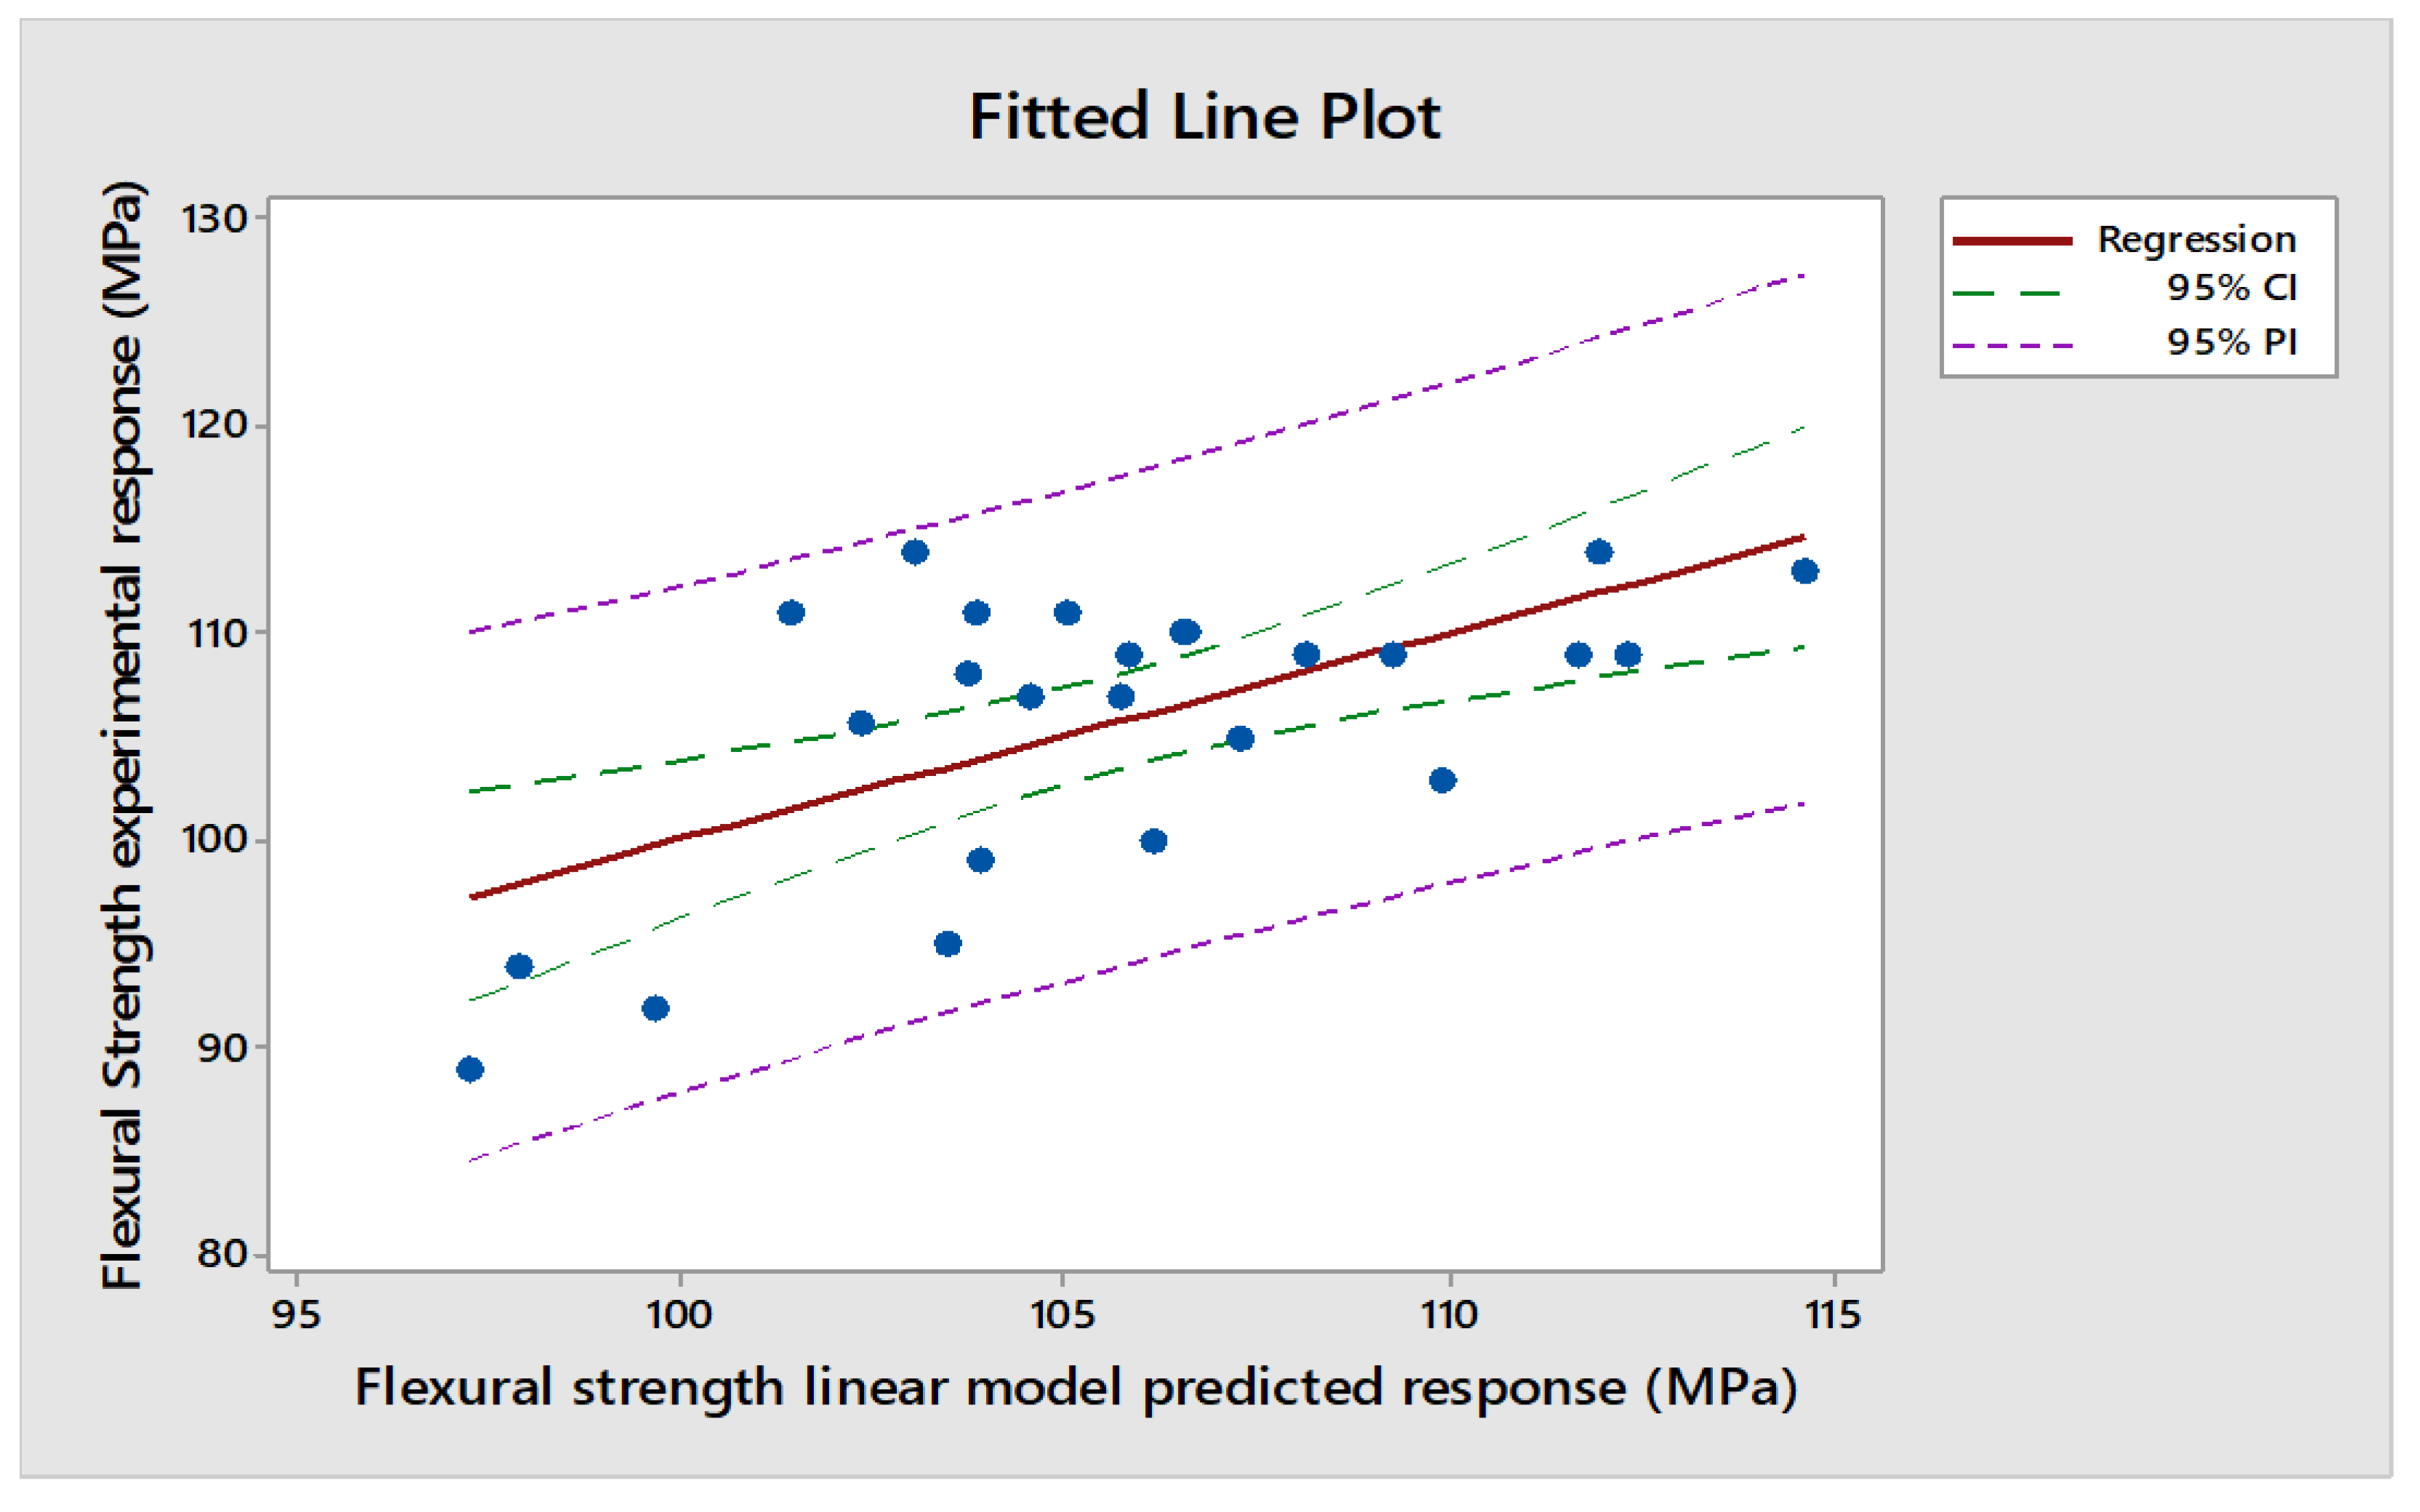
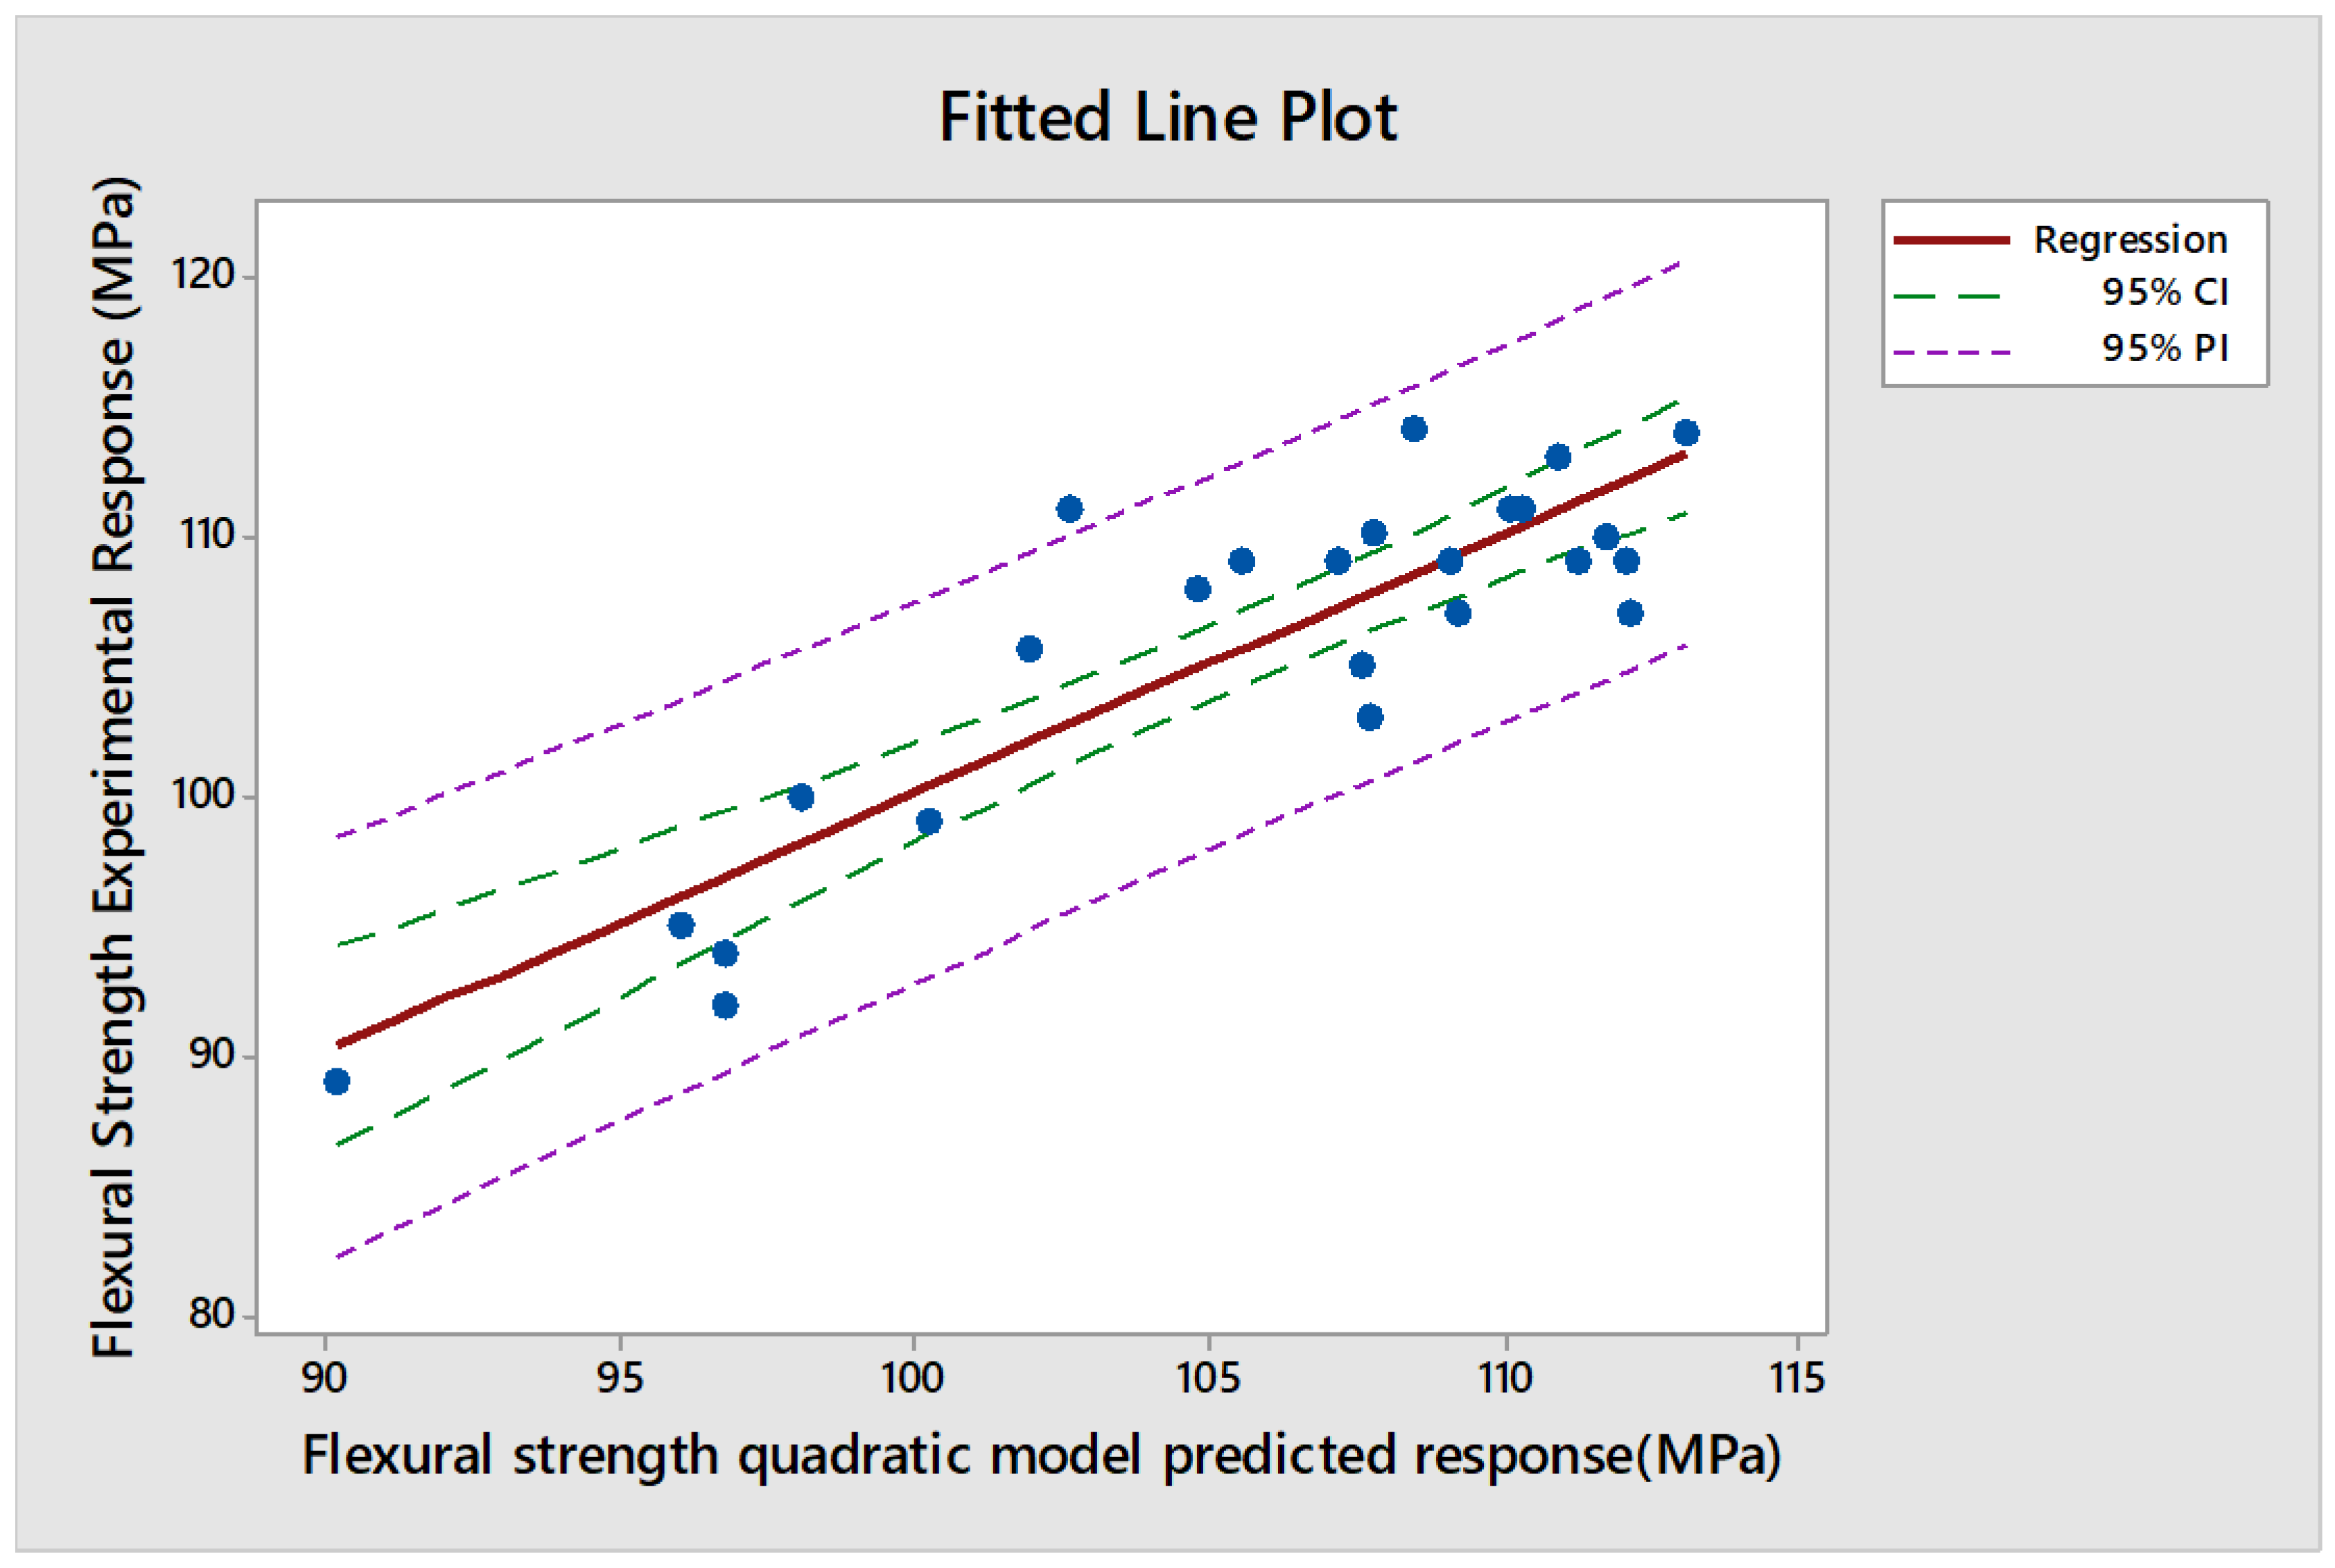
The R-sq value for both the linear and quadratic regression models are 38.78% and 77.30% respectively. This means that 38.78% of the total variation in flexural strength is being predicted by the linear regression model while 77.30% of variation in flexural strength is predicted by the quadratic regression model. In Figure 3.2 and Figure 3.3 the actual experimental test responses are compared with the predicted responses for both linear and quadratic regression models respectively. Table 5 shows the actual experimental and predicted linear and quadratic regression model values which was used for computation of the correlation coefficients.
The Pearson correlation of coefficient of the actual experimental results and the predicted linear regression results is given by as 0.623 with a P-Value of 0.001.
The Pearson correlation of coefficient of the actual experimental results and the predicted quadratic regression model results is given by as 0.879 with a P-Value of 0.000
As seen from the fitted line plot in Figure 3.2 and Figure 3.3, more intensive predicted values were obtained by the quadratic regression model as compared with the linear regression model. The R-sq(adj) value of the quadratic regression model is higher than the linear regression model, hence the quadratic regression model is best in estimating the effect of the reinforcement parameters on the flexural strength of the composite. The developed quadratic regression model shows a good relationship with the experimental results with a correlation coefficient of 0.879.

3.4. Confirmation Experiment for Flexural Strength

Based on the Taguchi analysis results, it is identified that the optimal conditions with the reinforcement which gave the best flexural strength response in the epoxy composite are 20wt% palm kernel shell, 25wt% Periwinkle, 10wt% clam shell, 15wt% whelk shell and 10wt% bamboo fiber. This prediction was verified through a confirmation test. Here, a new composite was molded as per the predicted results while maintaining the necessary composite molding conditions. Four samples were prepared for the confirmation test and the average value of the flexural strength taken. The result showed a higher flexural strength of 114.87MPa. When compared to the unreinforced of 72.33MPa, it shows that there is 58.81% increase in the flexural strength, hence there is an improvement in the flexural strength of matrix after reinforcement.

4. Conclusions

The optimal mass reinforcement parameters that gave the highest flexural strength properties in a reinforced epoxy composite were 20wt% palm kernel shell, 25wt% periwinkle shell, 10wt% clam shell, 15wt% whelk shell and 10wt% bamboo fiber. The P-values of the ANOVA result showed that the periwinkle shell has statistical and physical significance on the flexural strength of the reinforced epoxy composite. The F-values, revealed that the periwinkle shell was the most primary significant factor in the composite with a contribution of 44.90% followed by palm kernel with a contribution of 28.13%. The clam shell is less significant with a contribution of 3.45%.
Finally, the produced biocomposite had an improved mechanical properties compared to the individual constituent materials. The biocomposite is cheap and biodegradable as compared to the conventional ones. The study added to existing literature on how to convert agricultural waste into engineering application with wealth creation potentials.

References

  1. Achukwu, E.O.; Barnabas, A.M.; Mamman, A.; Uzochukwu, M.I. Fabrication of Palm Kernel Shell Epoxy Composites and Study of Their Mechanical Properties. Nigerian Journal of Materials Science and Engineering 2020, 6, 32. [Google Scholar]
  2. Akindapo, J.O.; Agov, E.T.; Garba, D.K.; Ogabi, R.O. Comparative Assessment of Mechanical Properties of Groundnut Shell and Rice Husk Reinforced Epoxy Composites. American Journal of Mechanical Engineering 2017, 5, 76–86. [Google Scholar]
  3. Alias NS Ismail HWahab, M.K.; Ragunathan SArdhyananta, H.; Ting, S.S. Development of new material based on polyvinyl alcohol//palm kernel shell powder biocomposites. Advances in Environmental Studies 2018, 2, 98–107. [Google Scholar]
  4. Estaji, S.; Paydayesh, A.; Mousavi, S.R.; Khonakdar, H.A.; Abiyati, M.M. Polycarbonate/poly (methyl methacrylate)/silica aerogel blend composites for advanced transparent thermal insulations: mechanical, thermal, and optical studies. Polym Compos 2021, 42, 5323. [Google Scholar] [CrossRef]
  5. Ghanbari, A.; Sadat Jalili, N.; Haddadi, S.A.; Arjmand, M.; Nofar, M. Mechanical properties of extruded glass fiber reinforced thermoplastic polyolefin composites. Polym Compos 2020, 41, 3748. [Google Scholar] [CrossRef]
  6. Ikumapayi, O.M.; Akinlabi, E.T. Composition, Characteristics and Socioeconomic benefits of palm kernel shell exploitation – An overview. Journal of Environmental Science and Technology 2018, 1, 220–232. [Google Scholar] [CrossRef]
  7. Mousavi, S.R.; Faraj Nejad, S.; Jafari, M.; Paydayesh, A. Polypropylene/ethylene propylene diene monomer/cellulose nanocrystal ternary blend nanocomposites: effects of different parameters on mechanical, rheological, and thermal properties. Polym Compos 2021, 42, 4187. [Google Scholar] [CrossRef]
  8. Ngo, T.D. Natural fibers for sustainable bio-composites. In Natural and Artificial FiberReinforced Composites as Renewable Sources; Gunay, E., Ed.; IntechOpen: Croatia, 2018. [Google Scholar]
  9. Oromiehie, E.; Gangadhara, P.; Compston, P.; Rajan, G. Automated fiber placement based composite structures: Review on the defects, impacts and inspections techniques. Composite Structures. 2019, 110987, 224. [Google Scholar] [CrossRef]
  10. Razavi, M.; Sadeghi, N.; Jafari, S.H.; Khonakdar, H.A.; Wagenknecht, U.; Leuteritz, A. Thermo-rheological probe of microstructural evolution and degradation pathway in the flame-retarded PP/EVA/NOR/clay nanocomposites. Rheologica Acta 2022, 61, 25. [Google Scholar] [CrossRef]
  11. Safi, B.; Saidi, M.; Daoui, A.; Bellal, A.; Mechekak, A.; Toumi, K. The use of seashells as a fine aggregate (by sand substition) in selfcompacting mortar (SCM). Construction Building Materials 2015, 78, 430–438. [Google Scholar] [CrossRef]
  12. Sanjay, M.R.; Arpitha, G.R.; Naik, L.L.; Gopalakrishna, K.; Yogesha, B. Applications of natural fibers and its composites: An overview. Natural Resources. 2016, 7, 108–114. [Google Scholar] [CrossRef]
  13. Shi, J.; Yao, R.; Kong, Z.; Ni, F.; Zheng, J. Strength analysis on hybrid welding interface of polymer and short carbon fiber reinforced composite. Journal of Mater Sci 2021, 1. [Google Scholar] [CrossRef]
  14. Yao, X.; Raine, T.P.; Liu, M.; Zakaria, M.; Kinloch, I.A.; Bissett, M.A. Effect of graphene nanoplatelets on the mechanical and gas barrier properties of woven carbon fiber/epoxy composites. J Mate Sci 2021, 1. [Google Scholar] [CrossRef]
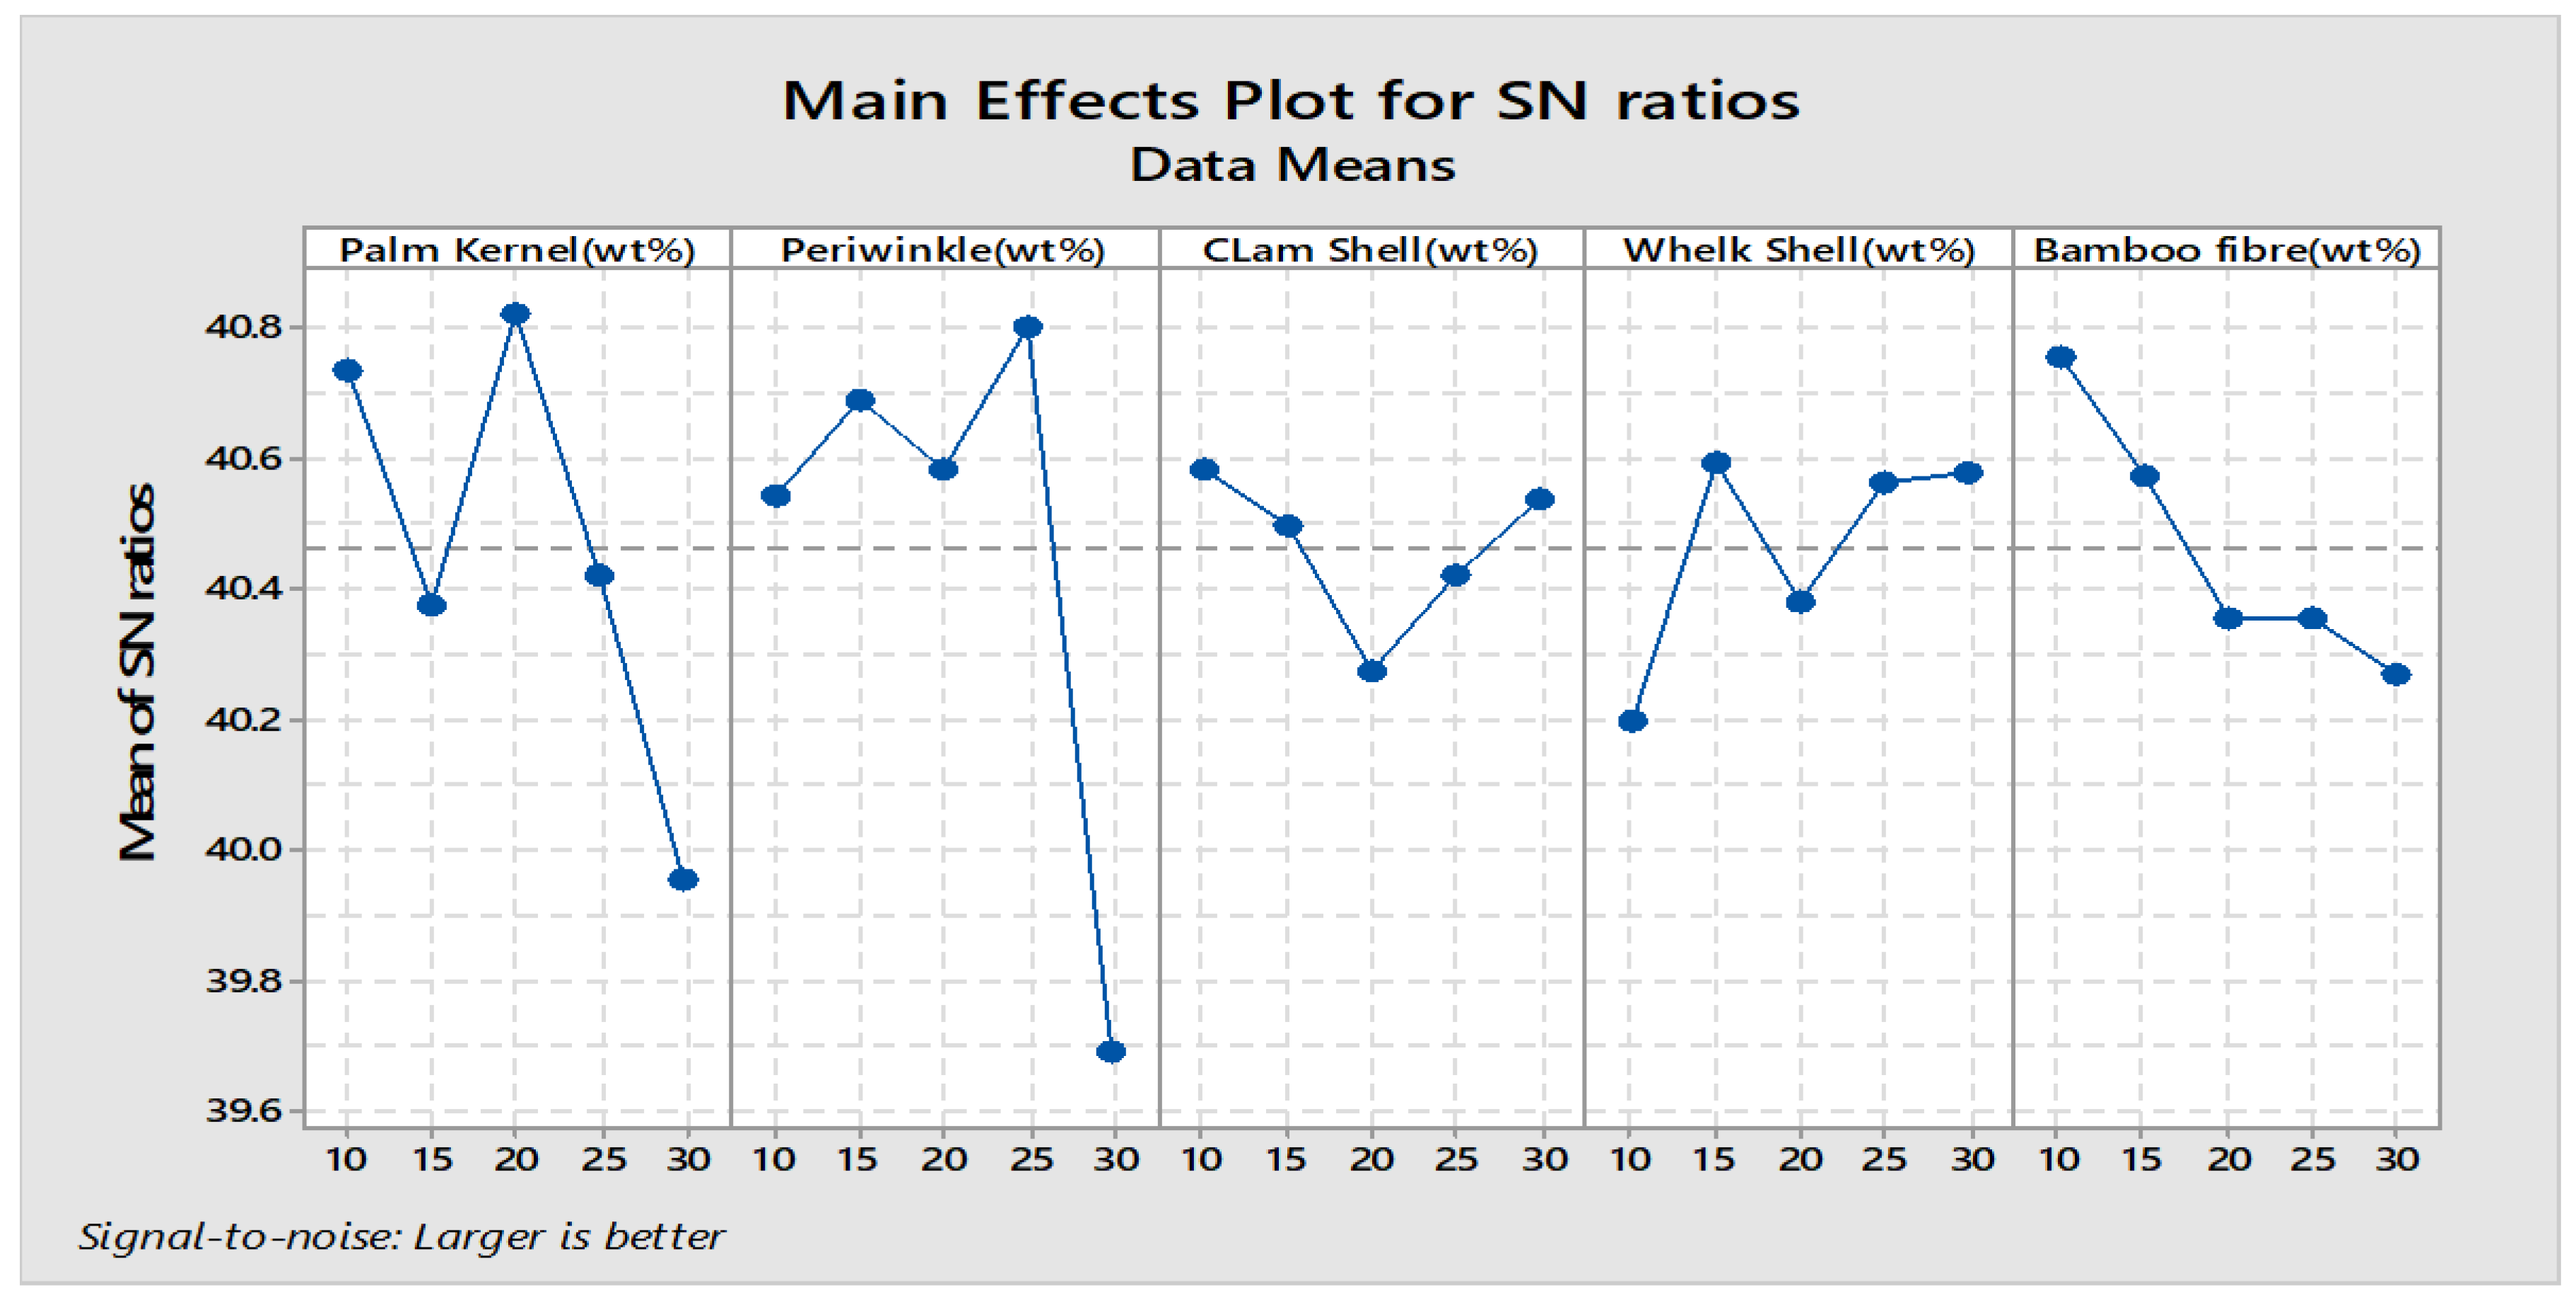
Figure 3.1. Effect of reinforcement parameters on S/N ratio for flexural strength.
Preprints 80515 g003
Figure 3.3. Comparison of the experimental results with the predicted linear regression model for flexural strength.
Preprints 80515 g005
Figure 3.4. Comparison of the experimental results with the predicted quadratic regression model for flexural strength.
Preprints 80515 g006
Table 1. Experimental factors and levels.
S/N Factors Level (wt%)
1 Palm Kernel Shell 10 15 20 25 30
2 Periwinkle Shell 10 15 20 25 30
3 Clam Shell 10 15 20 25 30
4 Whelk Shell 10 15 20 25 30
5 Bamboo Fiber 10 15 20 25 30
Table 2. Taguchi Orthogonal Array Flexural Test Result of the biocomposite.
S/N Palm Kernel Shell Periwinkle Shell Clam Shell Whelk Shell Bamboo Fiber Flexural Strength (MPa) S/N Ratio for
Flexural Strength
1 10 10 10 10 10 112.99 41.0608
2 10 15 15 15 15 113.98 41.1366
3 10 20 20 20 20 108.96 40.7453
4 10 25 25 25 25 110.07 40.8334
5 10 30 30 30 30 98.94 39.9074
6 15 10 15 20 25 102.94 40.2517
7 15 15 20 25 30 104.95 40.4196
8 15 20 25 30 10 108.99 40.7477
9 15 25 30 10 15 110.98 40.9049
10 15 30 10 15 20 94.91 39.5462
11 20 10 20 30 15 108.99 40.7477
12 20 15 25 10 20 106.96 40.5844
13 20 20 30 15 25 113.99 41.1373
14 20 25 10 20 30 110.94 40.9018
15 20 30 15 25 10 108.97 40.7461
16 25 10 25 15 30 107.96 40.6653
17 25 15 30 20 10 108.92 40.7422
18 25 20 10 25 15 109.97 40.8255
19 25 25 15 30 20 110.92 40.9002
20 25 30 20 10 25 88.89 38.9771
21 30 10 30 25 20 99.93 39.9939
22 30 15 10 30 25 106.96 40.5844
23 30 20 15 10 30 93.92 39.4552
24 30 25 20 15 10 105.66 40.4782
25 30 30 25 20 15 91.92 39.2682
Unreinforced with shell/fiber - - - - - 72.33 -
Confirmation test.
Table 3. Flexural strength response Table for Signal to Noise Ratios (Larger is better).
Level Palm Kernel Shell Periwinkle Shell Clam Shell Whelk Shell Bamboo Fiber
1 40.74 40.54 40.58 40.20 40.76
2 40.37 40.69 40.50 40.59 40.58
3 40.82 40.58 40.27 40.38 40.35
4 40.42 40.80 40.42 40.56 40.36
5 39.96 39.69 40.54 40.58 40.27
Delta 0.87 1.11 0.31 0.40 0.49
Rank 2 1 5 4 3
Table 4. Analysis of variance results for flexural strength.
Source DF Seq SS Contribution Adj SS Adj MS F-Value P-Value
Palm Kernel(wt%) 4 333.78 28.13% 333.78 83.45 3.62 0.120
Periwinkle(wt%) 4 532.90 44.90% 532.90 133.23 5.79 0.045
CLam Shell(wt%) 4 40.97 3.45% 40.97 10.24 0.44 0.774
Whelk Shell(wt%) 4 74.77 6.30% 74.77 18.69 0.81 0.578
Bamboo fiber(wt%) 4 112.27 9.46% 112.27 28.07 1.22 0.426
Error 4 92.10 7.76% 92.10 23.03
Total 24 1186.79 100.00%
S 4.79849
R-sq 92.24%
Table 5. Actual experimental and predicted linear and quadratic regression model values.
S/N Palm Kernel Shell Periwinkle Shell Clam Shell Whelk Shell Bamboo Fiber Actual Flexural Strength (MPa) Predicted linear Flexural Strength (MPa) Predicted quadratic Flexural Strength (MPa
1 10 10 10 10 10 112.99 114.61 110.90
2 10 15 15 15 15 113.98 111.94 113.10
3 10 20 20 20 20 108.96 109.27 112.06
4 10 25 25 25 25 110.07 106.60 107.79
5 10 30 30 30 30 98.94 103.93 100.28
6 15 10 15 20 25 102.94 109.95 107.74
7 15 15 20 25 30 104.95 107.28 107.57
8 15 20 25 30 10 108.99 111.68 111.24
9 15 25 30 10 15 110.98 105.06 110.32
10 15 30 10 15 20 94.91 103.47 96.04
11 20 10 20 30 15 108.99 112.36 105.58
12 20 15 25 10 20 106.96 105.74 112.11
13 20 20 30 15 25 113.99 103.07 108.46
14 20 25 10 20 30 110.94 101.47 102.64
15 20 30 15 25 10 108.97 105.88 107.20
16 25 10 25 15 30 107.96 103.74 104.81
17 25 15 30 20 10 108.92 108.15 109.09
18 25 20 10 25 15 109.97 106.55 111.75
19 25 25 15 30 20 110.92 103.88 110.09
20 25 30 20 10 25 88.89 97.26 90.25
21 30 10 30 25 20 99.93 106.15 98.08
22 30 15 10 30 25 106.96 104.56 109.20
23 30 20 15 10 30 93.92 97.94 96.81
24 30 25 20 15 10 105.66 102.34 101.98
25 30 30 25 20 15 91.92 99.67 96.84
Unreinforced with shell/fiber - - - - - 72.33
Confirmation test. 20 25 10 15 10 114.87
Disclaimer/Publisher’s Note: The statements, opinions and data contained in all publications are solely those of the individual author(s) and contributor(s) and not of MDPI and/or the editor(s). MDPI and/or the editor(s) disclaim responsibility for any injury to people or property resulting from any ideas, methods, instructions or products referred to in the content.
Copyright: This open access article is published under a Creative Commons CC BY 4.0 license, which permit the free download, distribution, and reuse, provided that the author and preprint are cited in any reuse.
Prerpints.org logo

Preprints.org is a free preprint server supported by MDPI in Basel, Switzerland.

Subscribe

© 2024 MDPI (Basel, Switzerland) unless otherwise stated