1. Introduction
Winter rapeseed (
Brassica rapa L), a type of rapeseed that can withstand winter conditions in northern China, played a crucial role in ensuring a stable supply of edible oil and improving economic benefits[
1,
2]. The cold-resistant variety known as Longyou-7 had demonstrated its ability to survive extreme temperatures as low as -30℃, indicating the presence of numerous cold resistance genes within it[
3,
4]. Consequently, Longyou-7 served as a valuable resource for investigating and understanding the mechanisms underlying cold resistance in winter Brassica rapa(
B.rapa).
Cold stress had been found to have a significant impact on various aspects of plant physiology, biochemistry, metabolism, and molecules, ultimately affecting the growth and development of plants[
5,
6]. Specifically, the activities of antioxidant enzymes, including superoxide dismutase, glutathione transferase, glutathione reductase, glutathione peroxidase, ascorbate peroxidase, and catalase, had been observed to increase under cold stress. Additionally, the involvement of non-enzymatic antioxidants, such as tripeptide mercaptan and ascorbic acid, has been shown to directly contribute to the stability of cell membranes[
7,
8,
9,
10,
11,
12]. It was worth noting that glutathione transferase (GSTs) was a highly conserved and widely distributed protein family with multifunctional properties, suggesting its ancient origins and broad significance in various biological processes[
13].
The GSTs, a multifunctional protein family, had been identified in numerous plant species, with 55 genes found in
Arabidopsis[
14], 179 in
Brassica napus[
15], 84 in
Hordeum vulgare[
16], 59 in
Gossypium raimondii[
17], 75 in
Brassica rapa[
18], 65 in
Brassica oleracea[
19] and 23 in
Citrus sinensis [
20]. These
GSTs gene played a crucial role in plant secondary metabolism, growth, and development, particularly in response to biotic and abiotic stress[
21,
22]. For instance, the
AtGSTU17 gene in Arabidopsis thaliana regulates seed development, including hypocotyl elongation and anthocyanin accumulation[
16]. Additionally, the transfer of the
VvGSTF13 gene enhances its tolerance to salt and drought in
Grape[
23]. The
ThGSTZ1 gene has been found to have a dual role in enhancing tolerance to drought and salt stress, as well as improving antioxidant activity through the regulation of reactive oxygen species (ROS) metabolism in plants[
24,
25]. GSTs have been extensively studied for their involvement in gene expression related to salt stress tolerance[
26].
While there is substantial research on the impact of GSTs genes on oxidative and temperature stress tolerance, limited research has been conducted on their role in cold resistance in winter B.rapa. This study aims to comprehensively analyze the expression and function of GSTs genes, including GSTF2, under low temperature stress conditions. The purpose of this study was to conduct a comprehensive analysis of the number of GSTs gene family and the function of BraGSTF2 gene under low temperature stress in winter B.rapa at the whole genome level. This research aimed to establish a theoretical foundation for analyzing the regulatory mechanism of the gene family under cold stress and abiotic stress in winter B.rapa.
2. Results
2.1. Identification and protein characterization of BraGSTs Gene Family
The present study focused on the identification and characterization of the
BraGSTs gene family in
B.rapa. A comprehensive search was conducted using specific keywords and the Pfam number in the
B.rapa database. These proteins were identified as having the reported peroxidase domains after sequence analysis using the SMART, CDD, Pfam. As a result, a total of 70 members belonging to the
BraGSTs gene family were successfully identified. Additionally, the members of the
BraGSTs gene family were named based on their respective chromosomal positions. Furthermore, an analysis of the physical and chemical properties of all BraGSTs proteins was conducted. This analysis revealed that the number of amino acids in these proteins ranged from 114aa to 600aa. Moreover, the theoretical isoelectric point (PI) of BraGSTs proteins varied from 4.84 to 9.54. The stability index exhibited a range of values spanning from 27.07 to 95.27. Similarly, the fat index displayed a range from 70.12 to 106.00. The hydrophilic and hydrophobic range encompassed values ranging from -0.52 to 0.16. The primary constituents of the BraGSTs protein were identified as carbon (C), hydrogen (H), nitrogen (N), oxygen (O), and sulfur (S). The analysis of protein secondary structure prediction revealed that the BraGSTs proteins predominantly consisted of α helices, β sheets, random coils, and extended chains(
Supplementary Table S1).
Table 1.
The BraGSTs gene family were classified based on their domain and phylogenetic in B.rapa.
Table 1.
The BraGSTs gene family were classified based on their domain and phylogenetic in B.rapa.
| Subfamilies |
Number of identified genes |
| Phi |
18 |
| Tau |
39 |
| Zeta |
2 |
| Theta |
2 |
| Lambda |
2 |
| DHAR |
4 |
| EF1G |
2 |
| TCHQD |
1 |
| Total |
70 |
2.2. Phylogenetic Analysis, Chromosome Distribution and Gene Duplication in BraGSTs gene family
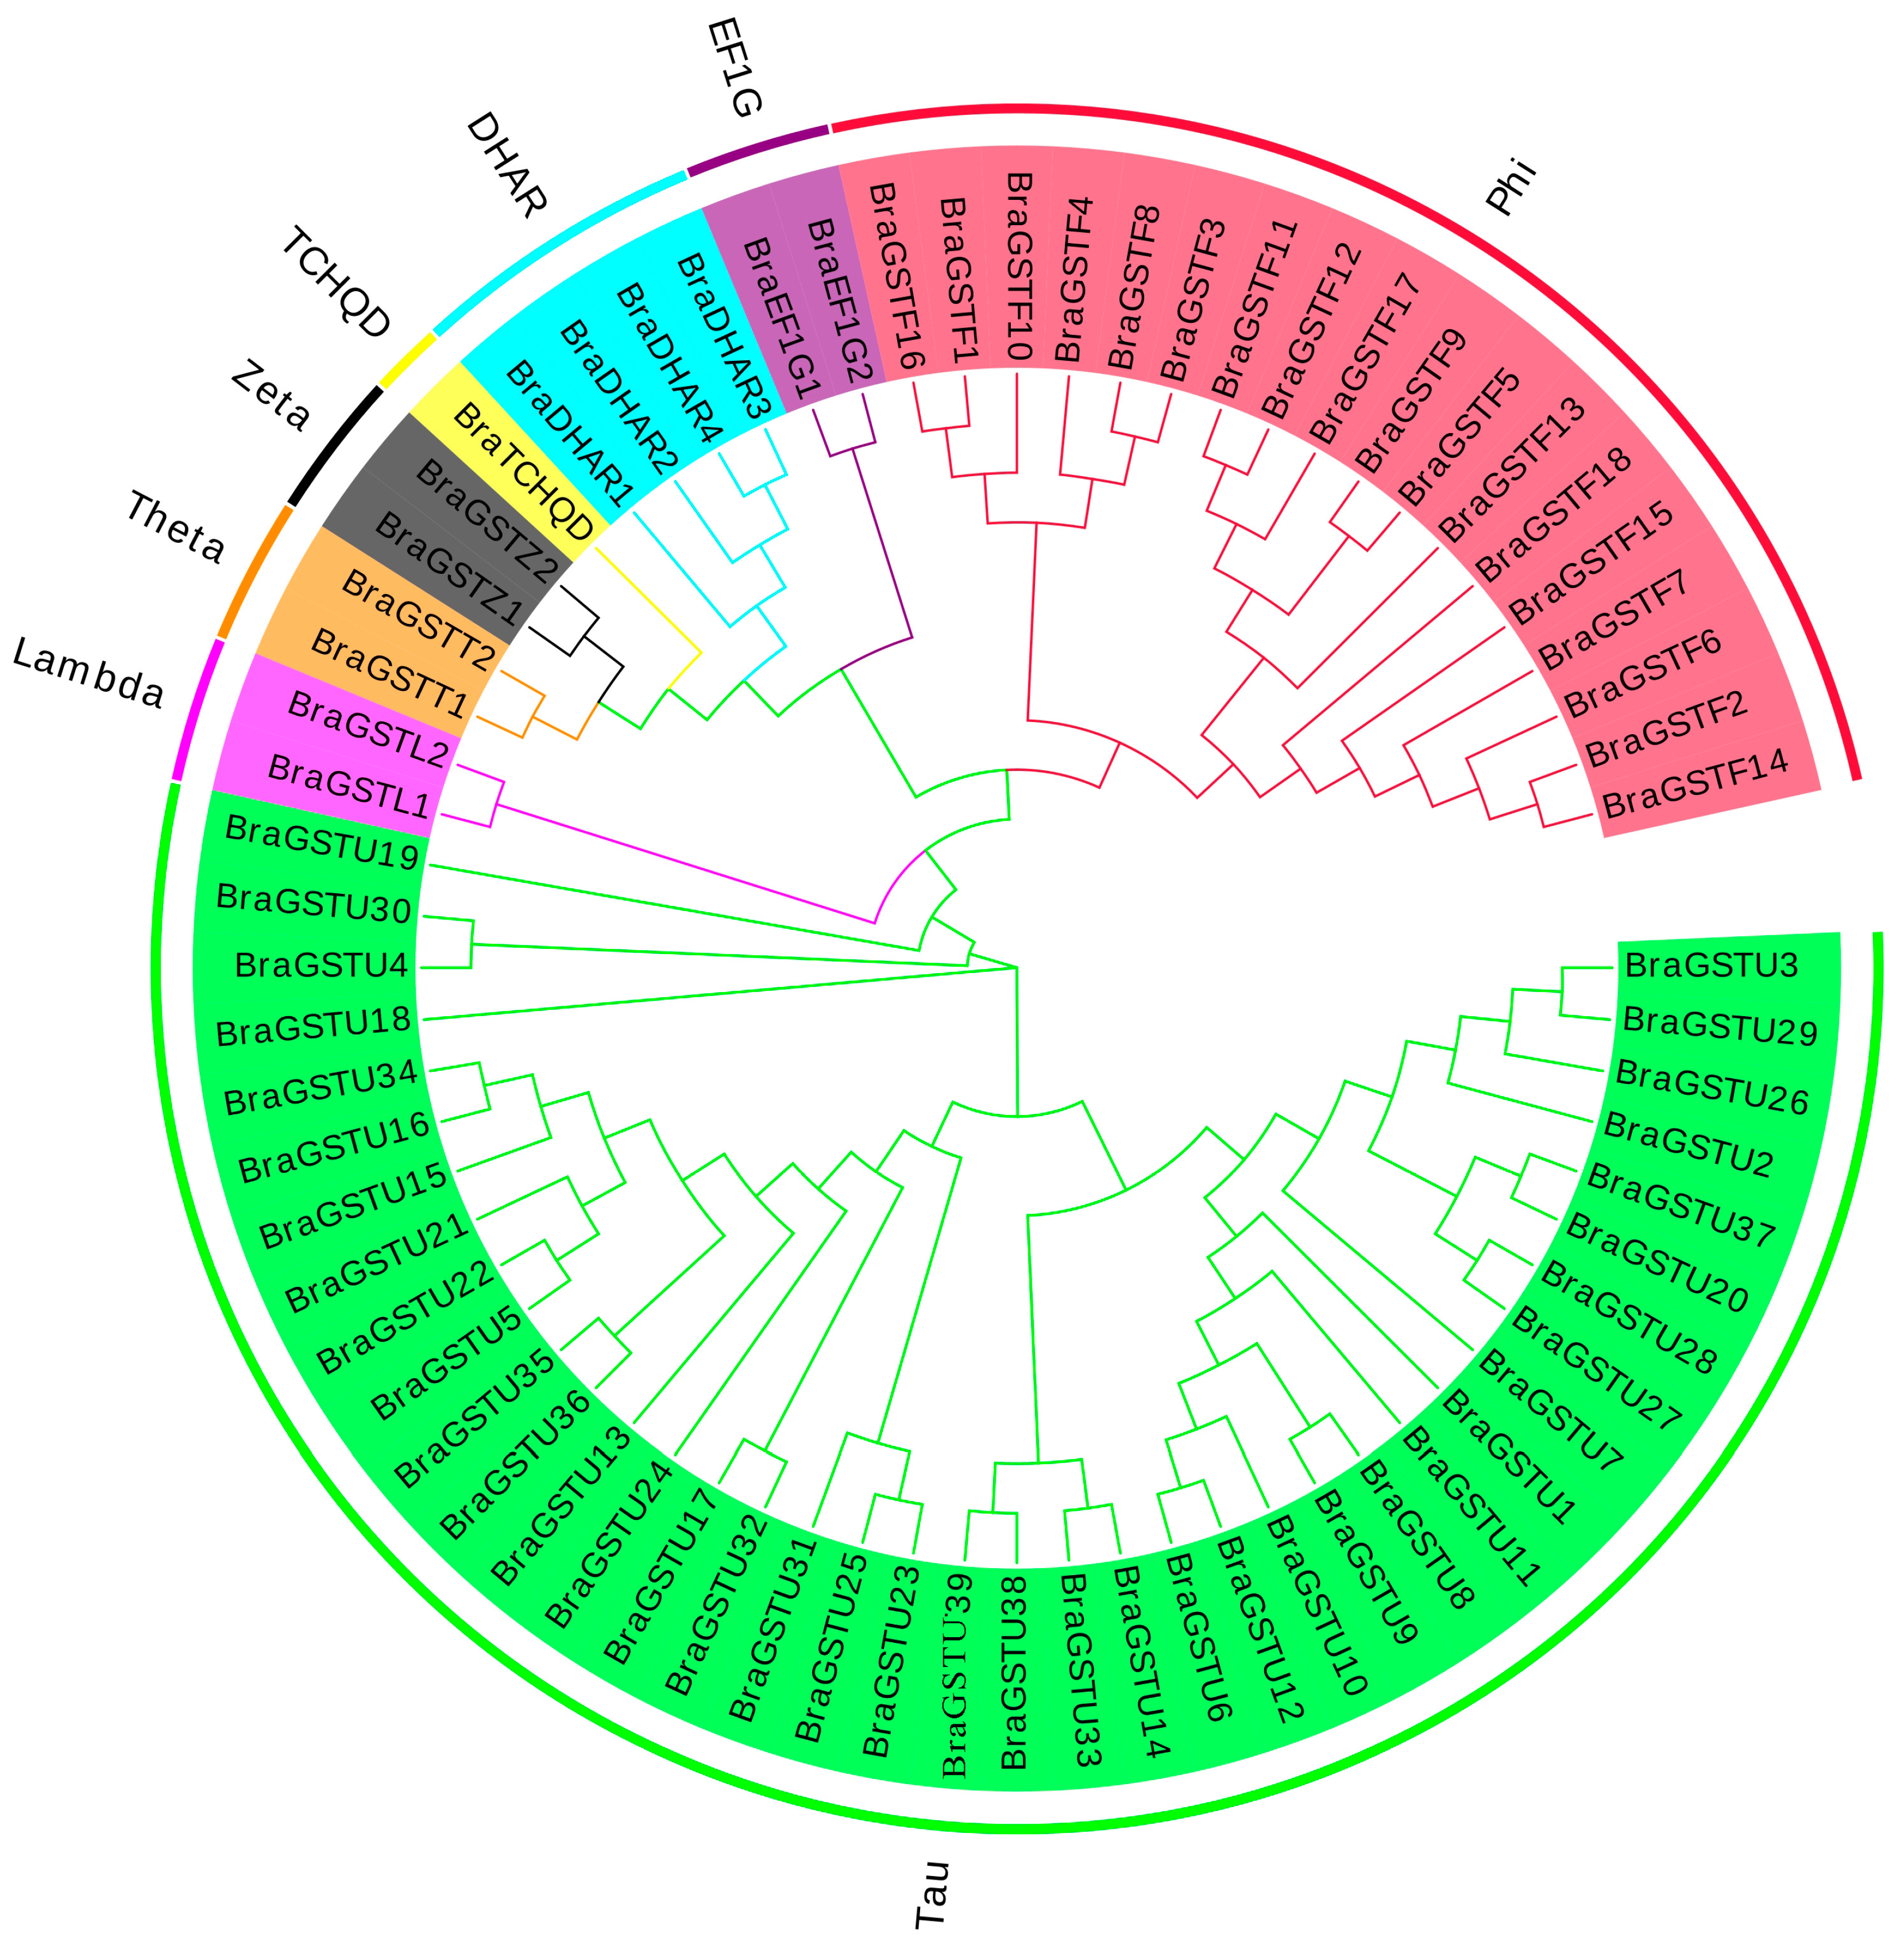
The NJ method was used to construct a cluster map which divided 70
GSTs genes into 8 main subfamilies in
B.rapa (
Figure 1). These subfamilies include the 𝛾-subunit of translation elongation factor (EF1G), Phi (GSTF), Tau (GUTF), Zeta (GSTZ), DHAR, Lambda (GSTL), Theta (GSTT), and TCHQD. Among these subfamilies, the 18
BraGSTs genes were classified as Phi (GSTF), the 39
BraGSTs genes as Tau (GSTU), the 4
BraGSTs genes as DHAR, and 1
BraGSTs gene as TCHQD. Additionally, the 2
BraGSTs genes were divided into Zeta, Lambda, Theta, and EFIG subfamilies, respectively.
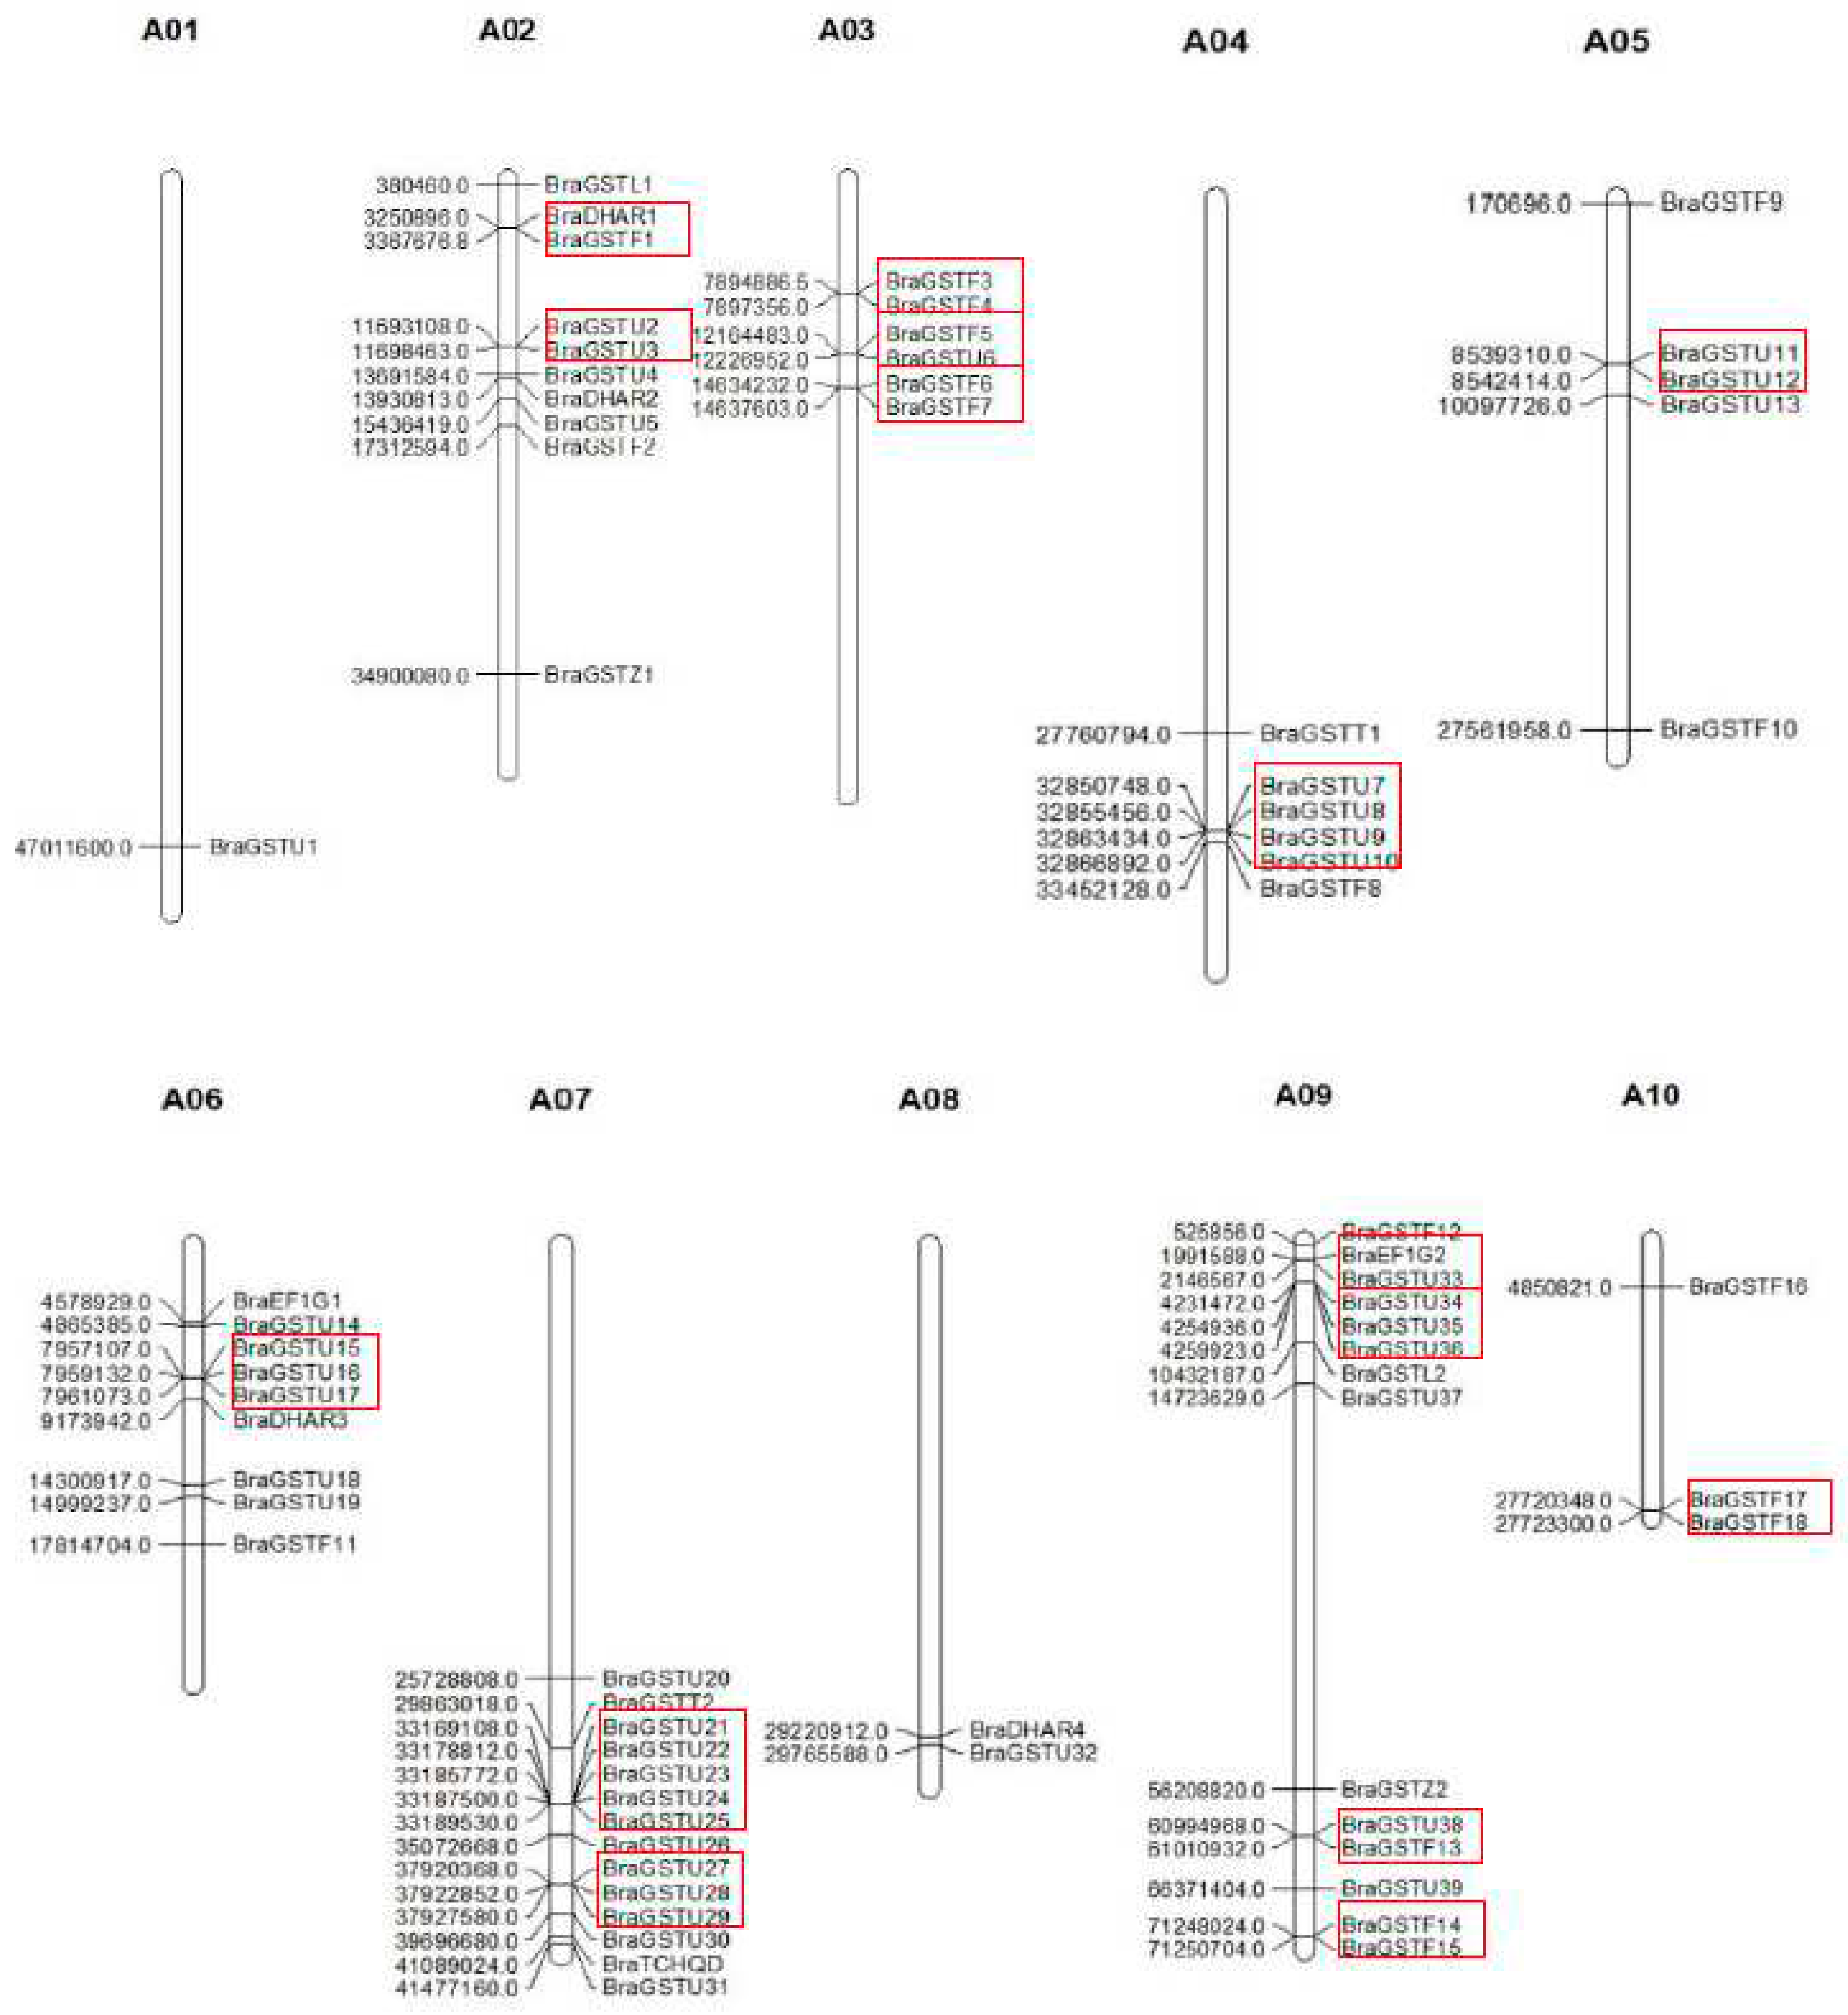
Based on the distribution map of the
BraGSTs gene family on chromosomes in
B.rapa, as depicted in
Figure 2, it is evident that the genes are dispersed across 10 distinct chromosomes. Notably, Chromosome 7 exhibits the highest number of gene distributions, with 14
BraGSTs genes, while Chromosome 1 harbors only one
BraGSTs gene. In comparison to other subfamilies, the Tau family members display a wide distribution pattern, spanning 9 chromosomes (A01, A02, A03, A04, A05, A06, A07, A08, A09).
2.3. Conservative Structure and Gene Structure Analysis of BraGSTs gene family
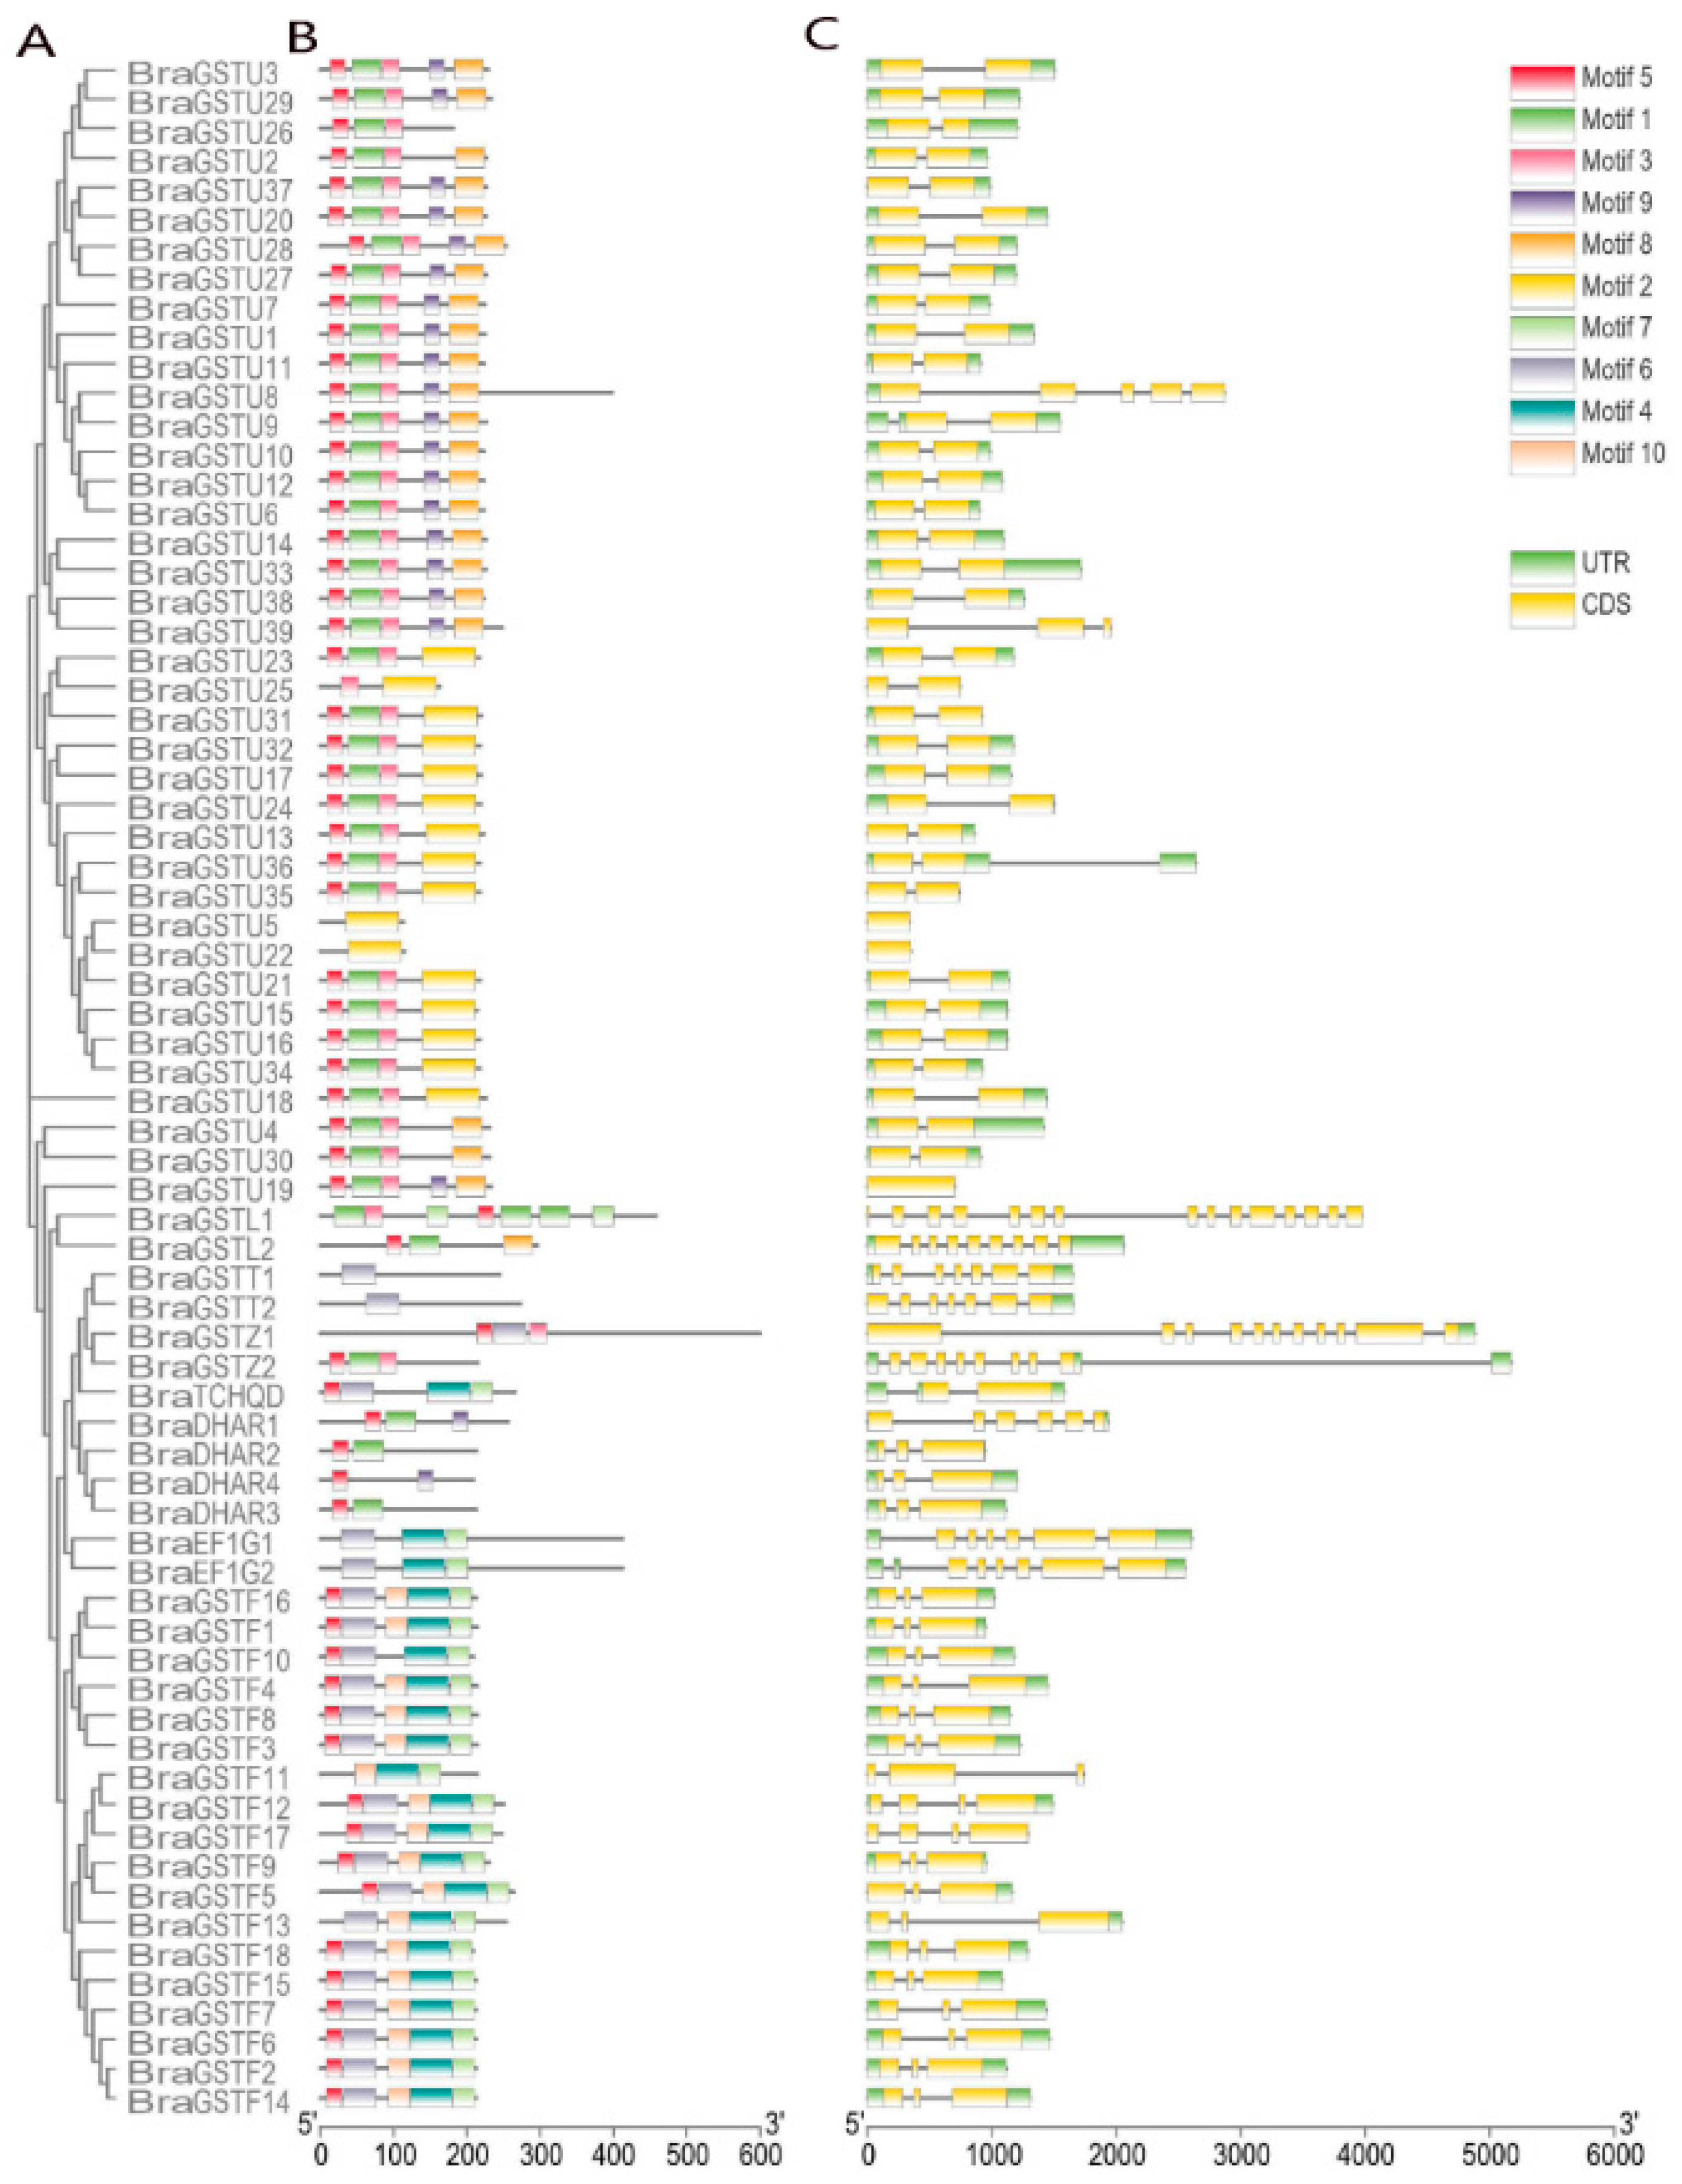
The conserved motifs in
B.rapa were analyzed using the Meme online tool(MEME - Submission form (meme-suite.org)) (
Figure 3B). The analysis predicted a maximum of 10 conserved motifs, with all other settings set to default values. A total of 10 conserved motifs were identified in
B.rapa. The
BraGSTs gene family was also identified, and the amino acid length of each motif ranged from 15 to 64 amino acids (
Table 2). Among these motifs, Motif 5 was found to be highly conserved and present in almost all members of the
BraGSTs gene family. This result suggests that Motif 5 plays an essential role and has important functions in the
BraGSTs gene family.
The gene structure maps of BraGSTs were generated using Tbtools software. BraGSTU8 lacked a UTR, while BraGSTF11 contained one UTR. All members of the BraGSTs gene family possessed a coding sequence (CDS). The quantity of CDS varied significantly among different BraGSTs genes. Specifically, BraGSTU19 had one CDS, BraGSTL1 within the Lambda subfamily had 15 CDS, and BraGSTL2 had 8 CDS, making it the subfamily with the highest intron distribution. These results indicate that the DHAR and Phi subfamilies in B.rapa exhibit greater conservation.
2.4. Analysis of cis-acting elements in BraGSTs gene family
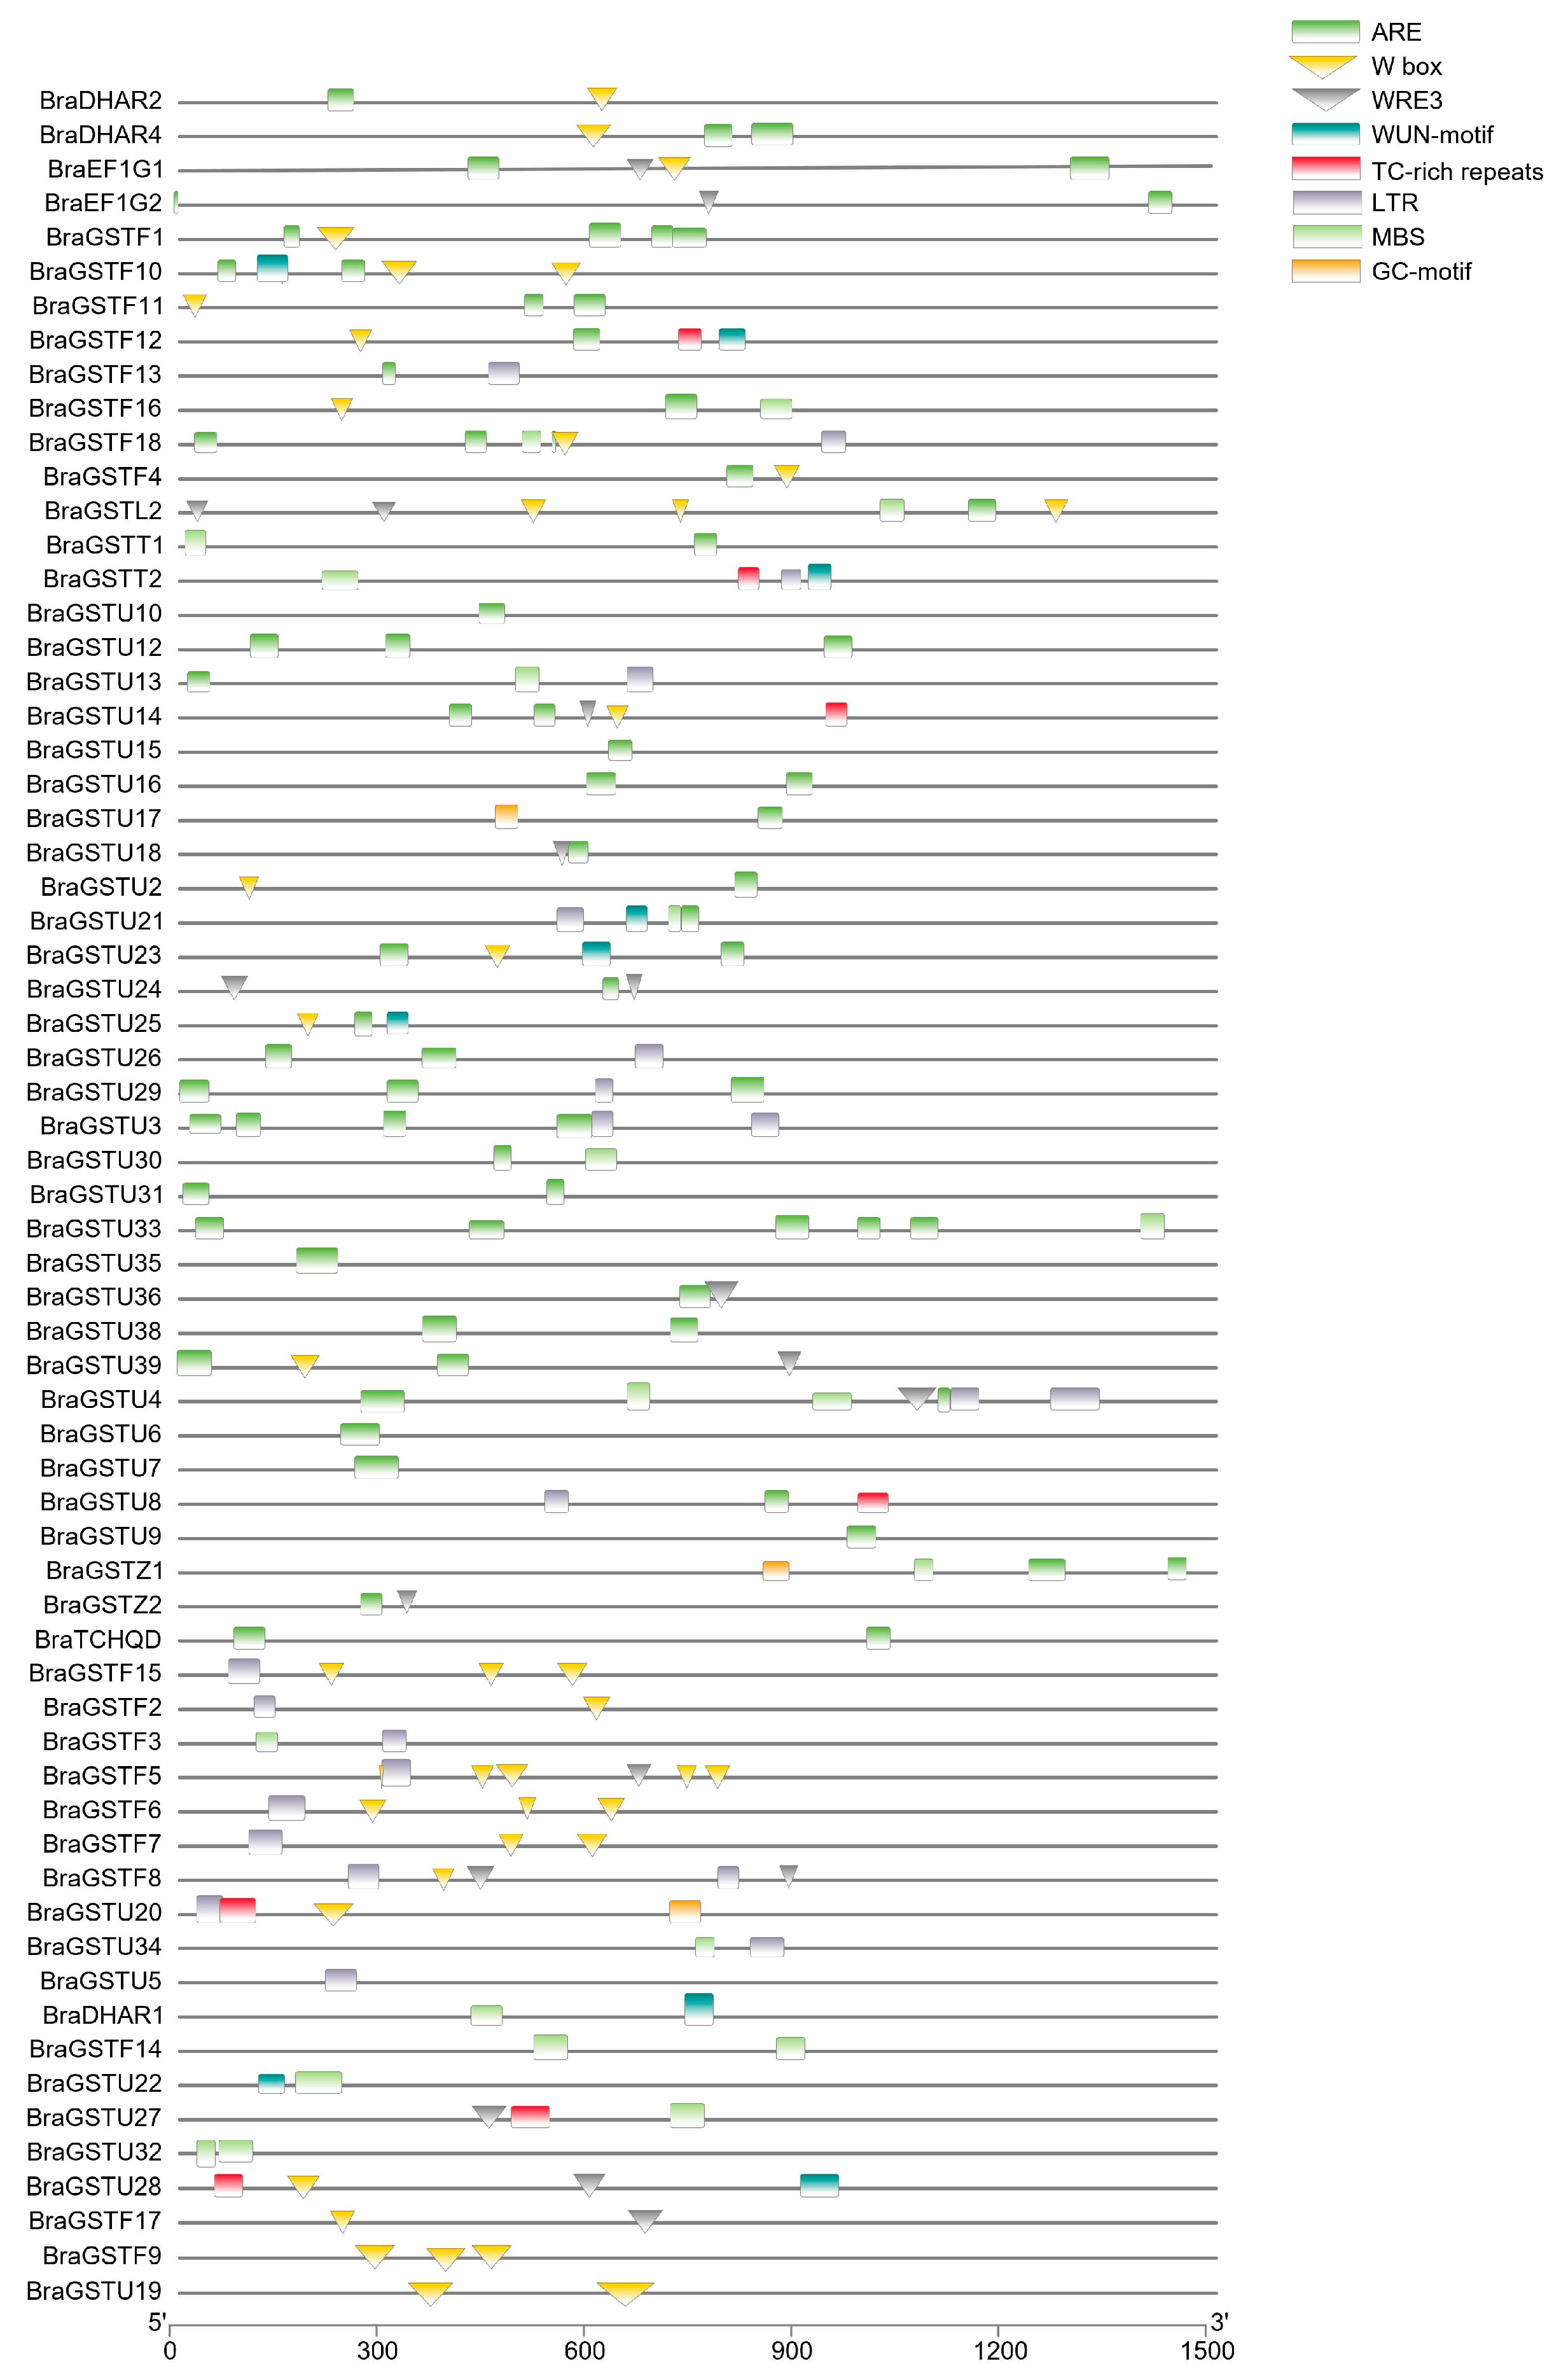
A total of 63 cis-acting elements were identified within the promoter region of the BraGSTs gene family. These elements were categorized into nine functional groups, with light response elements comprising the majority, followed by promoter and enhancer elements, low temperature stress response elements, and plant hormone response elements (
Figure 4). Notably, CAAT-box and TATA-box were identified as the most significant elements within promoters and enhancers, while LTR and ARE constituted the largest proportion of cryogenic response components. The ABRE and CGTCA-motif response elements were the most prevalent in plant hormone responses. The presence of MYB, MYC, and MYB-like response elements was abundant in both biotic and abiotic stress responses. Certain genes exhibit endosperm-specific expression elements, namely GCN4-motif and AACA-motif. Additionally, there were genes with meristem-specific expression elements, such as CAT-box and RY-element. Some genes possess protein binding sites, including AT-rich element and BOX III. The response elements associated with low temperature stress encompass ARE, GC-motif, GTGGC-motif, LTR, MBS, TC-rich, W box, and WUN-motif.
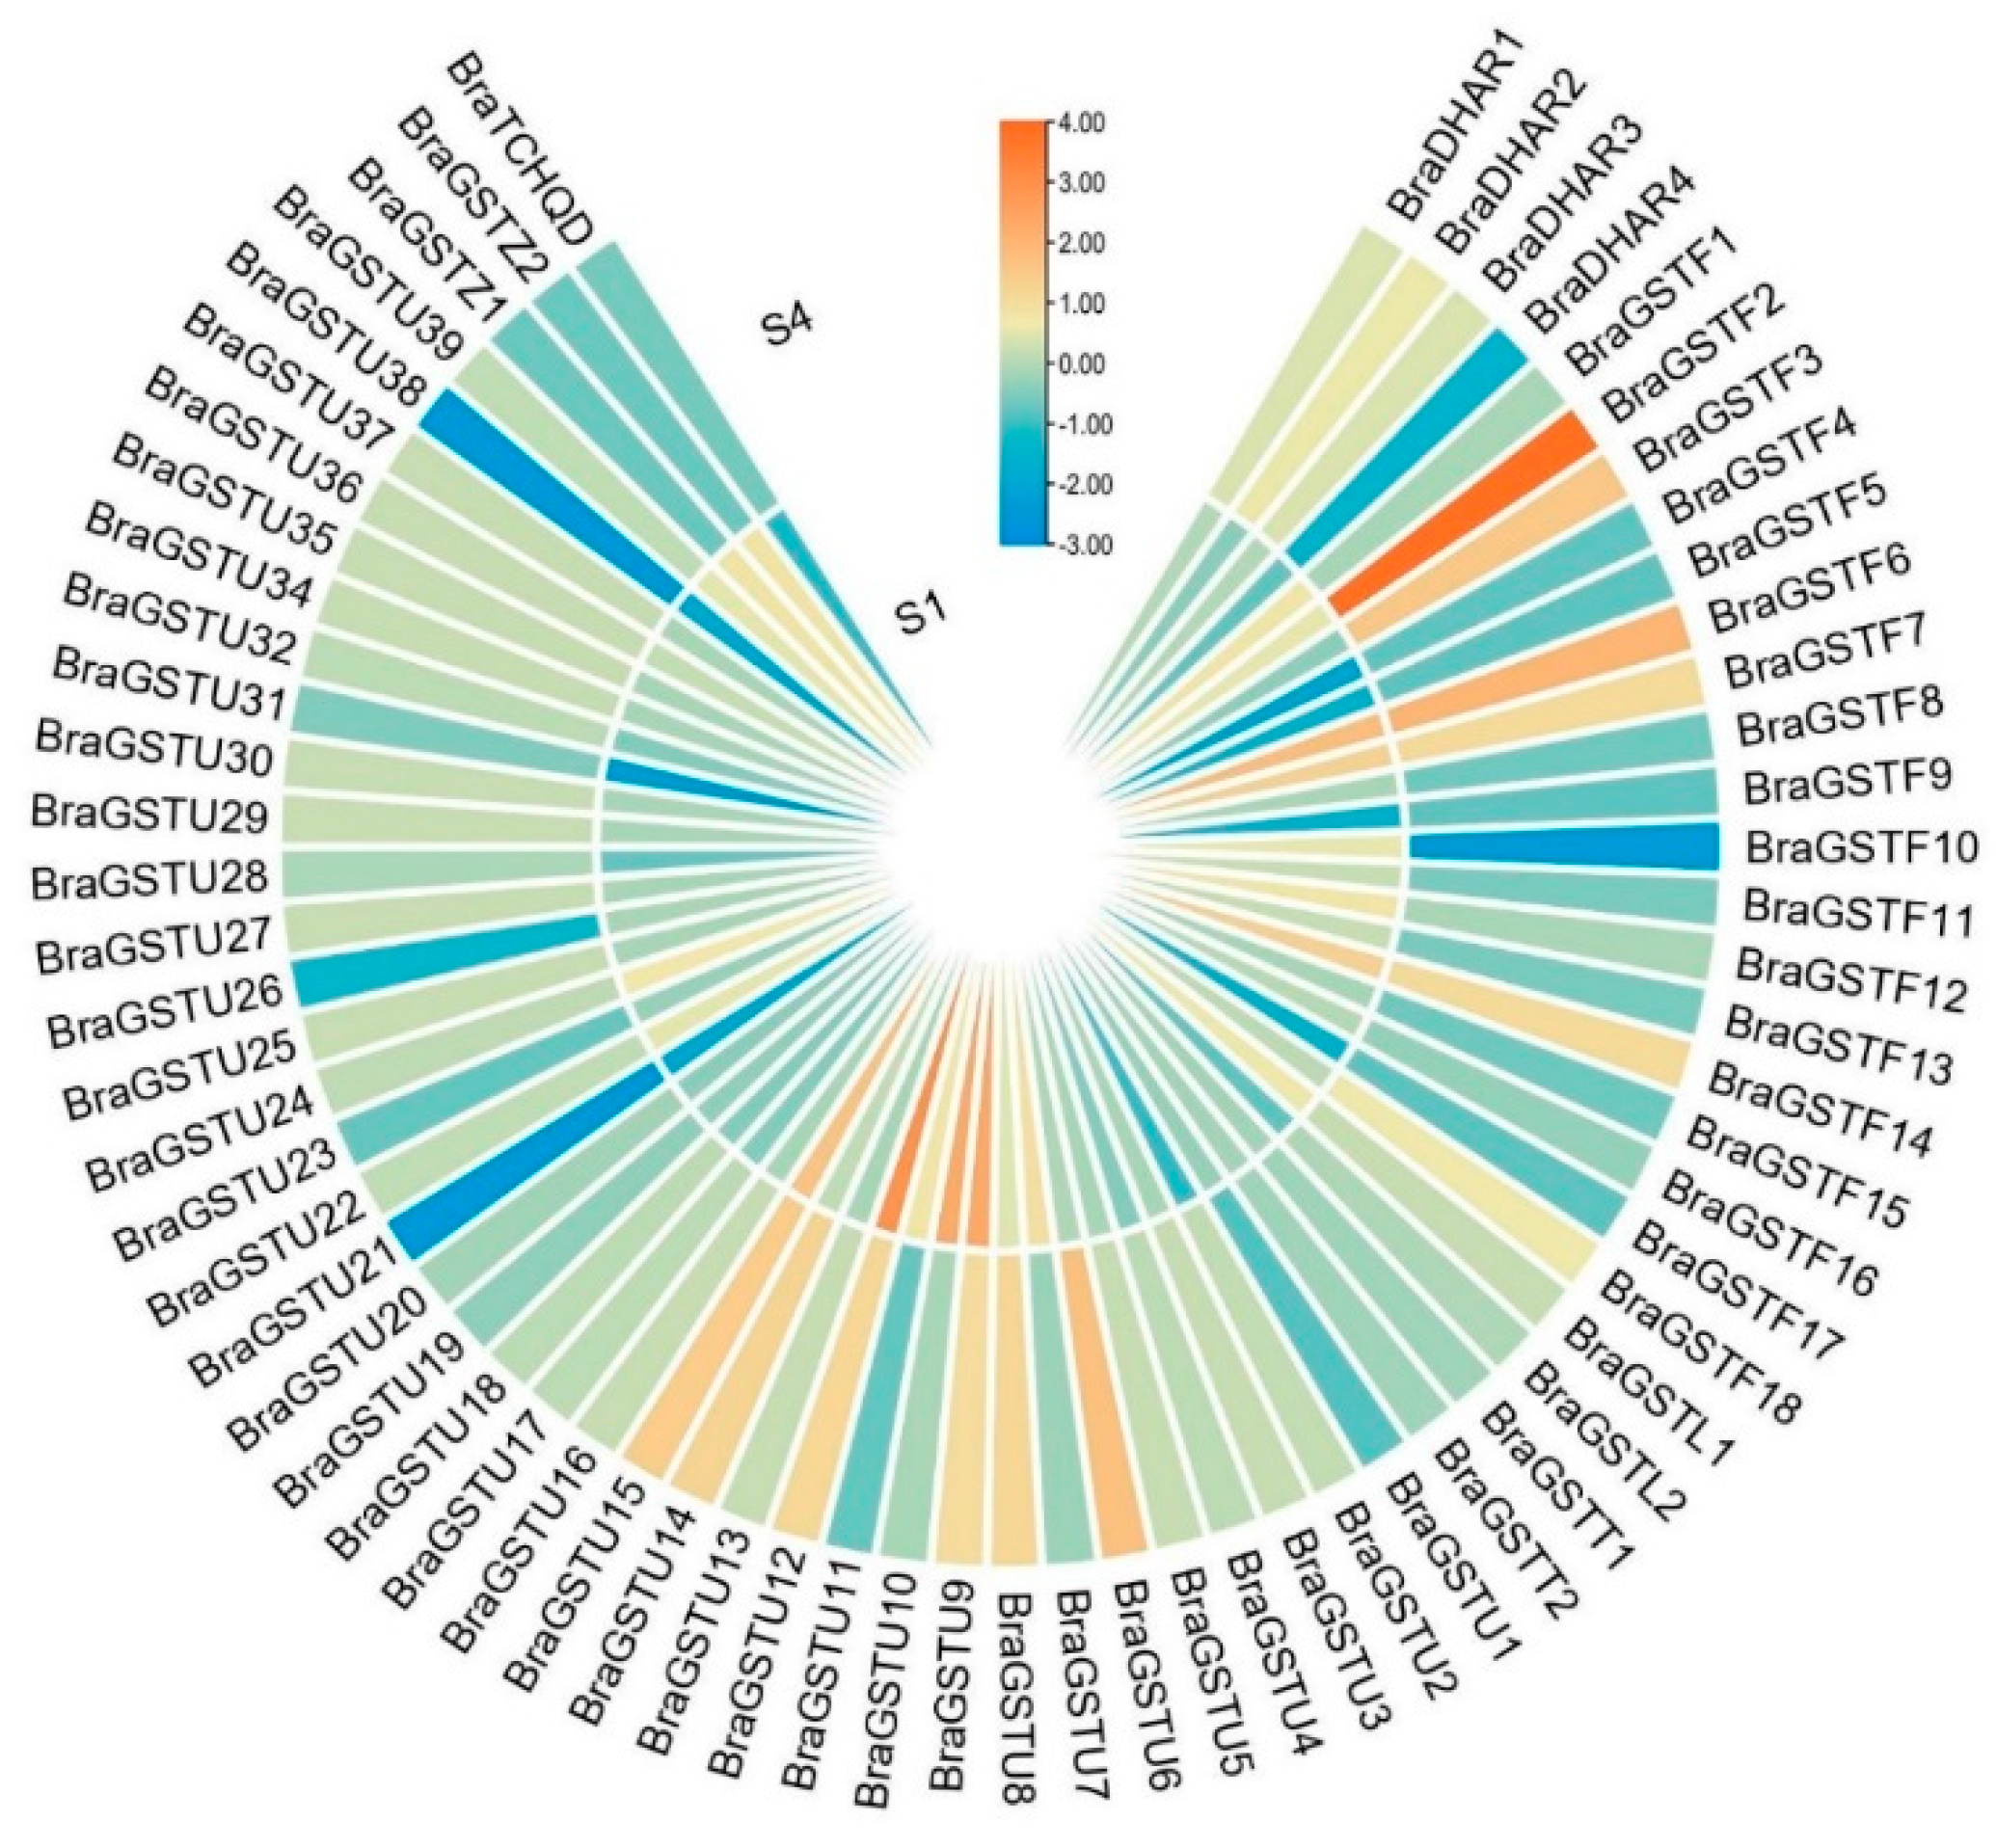
2.5. Expression of BraGSTs gene family in B.rapa under low temperature stress
During the early stage of laboratory experimentation, RNA-seq analysis revealed that the majority of
BraGSTs genes exhibited no response. However, a subset of 15
BraGSTs genes demonstrated involvement in low temperature stress (|log2FC|>1). Among these, six genes (
BraGSTF6,
BraGSTF7,
BraGSTF14,
BraGSTU9,
BraGSTU12, and
BraGSTU15) exhibited significant up-regulation at both the S1 and S4 stages. Additionally,
BraGSTF2,
BraGSTF3,
BraGSTF18,
BraGSTU14,
BraDHAR2, and
BraDHAR3 were significantly up-regulated at S4. Conversely,
BraGSTF10 and
BraDHAR4 were significantly down-regulated at S4, while
BraGSTU10 demonstrated significant up-regulation at S1 (see
Figure 5).
2.6. Subcellular localization of BraGSTF2 protein
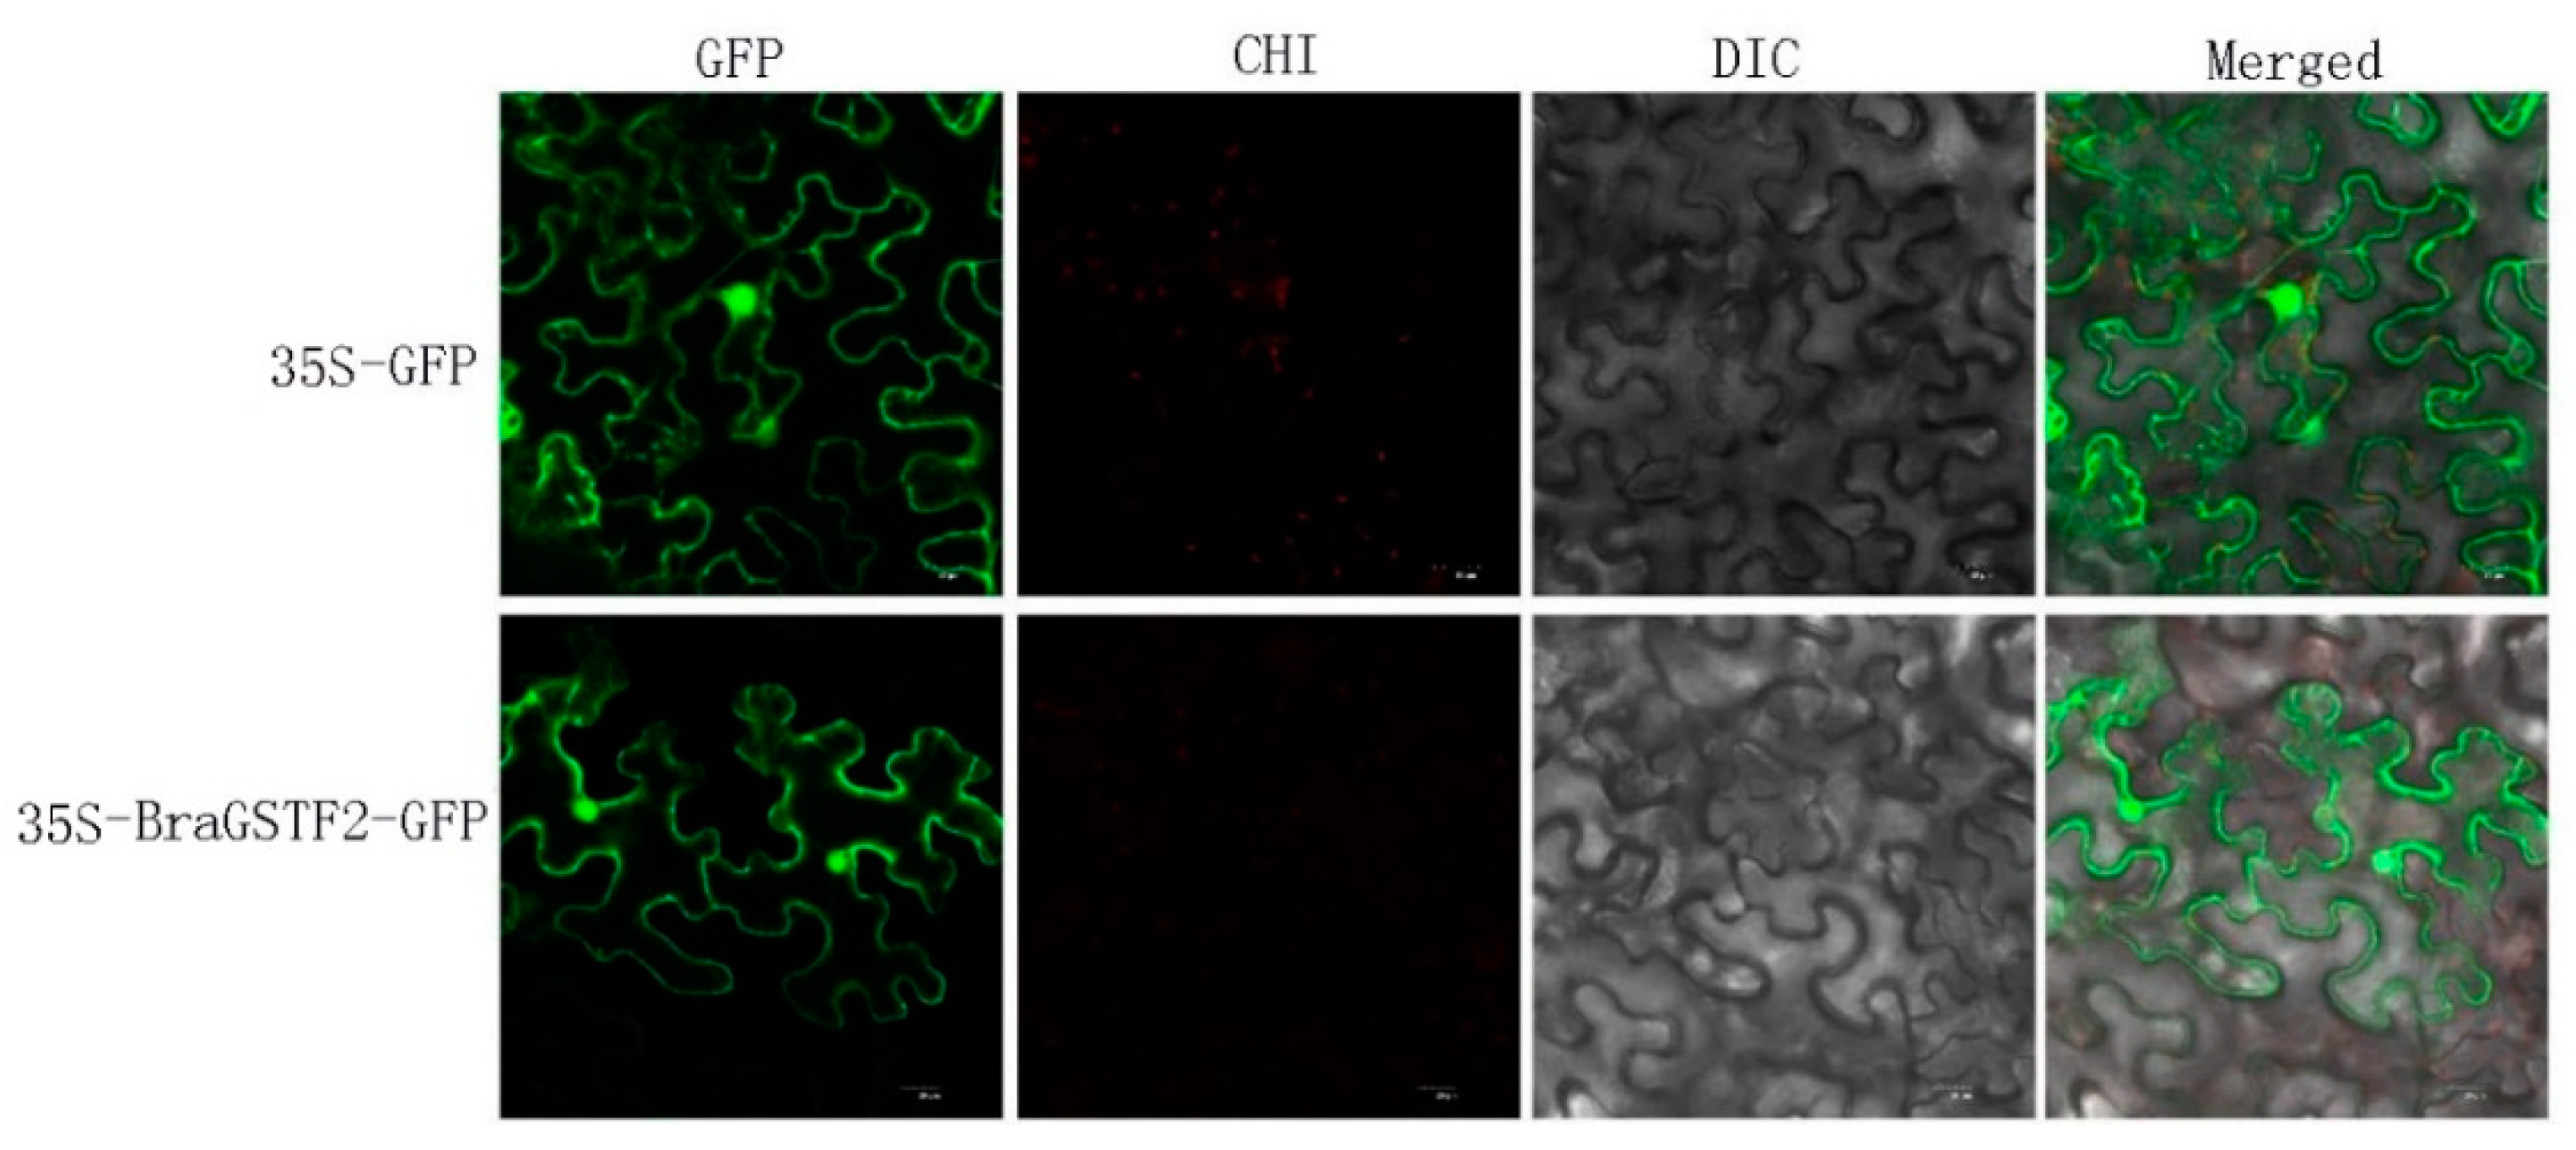
The tissue and cell sites where the BraGSTF2 protein were predicted using an online website(https: //wolfport. hgc. jp /). The prediction results indicate that the BraGSTF2 protein is localized in the cytoplasm and cell membrane. To further investigated its subcellular localization, the 35S-BraGSTF2-GFP subcellular localization vector was introduced into tobacco plants, while the 35S-GFP empty vector served as the control. The plants were incubated overnight for documentation purposes. After 2-3 days, the epidermis was dissected, and the fluorescence was visualized using a laser confocal microscope. The obtained results are presented in
Figure 6. Furthermore, alongside the conspicuous green fluorescence observed in the cell membrane, the BraGSTF2 protein exhibits evident fluorescence within the nucleus, while no fluorescence is detected in other cellular compartments. These findings indicate that the expression of the BraGSTF2 protein in tobacco leaves is likely localized within the cell membrane and nucleus, aligning with the anticipated outcomes. However, additional validation of alternative techniques is warranted in subsequent investigations.
2.7. Svreening and identifivation of transgenic Arabidopsis in BraGSTF2 gene
Following the infestation of Arabidopsis, the plants were subjected to antibiotic treatment for three successive generations. The T3 generations of transgenic Arabidopsis plants were subsequently transplanted into flowerpots, where they exhibited normal growth for the subsequent experiment (
Supplementary Figure S1 A, B). Positive plants with overexpression of
BraGSTF2 yielded target bands of approximately 700 bp, whereas wild-type Arabidopsis thaliana plants and water samples did not exhibit band amplification. This observation confirmed the successful transfer of the
BraGSTF2 target gene into Arabidopsis thaliana, resulting in the generation of a positive transgenic plant (
Supplementary Figure S2).
The RNA of four transgenic single plants overexpressing
BraGSTF2 was extracted and quantitatively analyzed using fluorescence. The results demonstrated that the relative expression of the
BraGSTF2 gene in the overexpressed plants was significantly higher compared to the WT. Notably, the G1 single plant exhibited the highest relative expression, which was 22.9 times that of the wild type. Conversely, the G3 single plant displayed the lowest relative gene expression, being 6.8 times that of the wild type. The relative gene expression of
GSTF2 in the G3 single plant was found to be the lowest, measuring 6.8 times that of the WT. This observation, along with the fact that the other three single plants exhibited a relative gene expression of
GSTF2 22.9 times that of the WT, suggests that all four single plants can be classified as
BraGSTF2 overexpressed plants (
Supplementary Figure S3).
2.8. Phenotypic and survival analysis of wild and BraGSTF2 transgenic Arabidopsis thaliana under low temperature stress
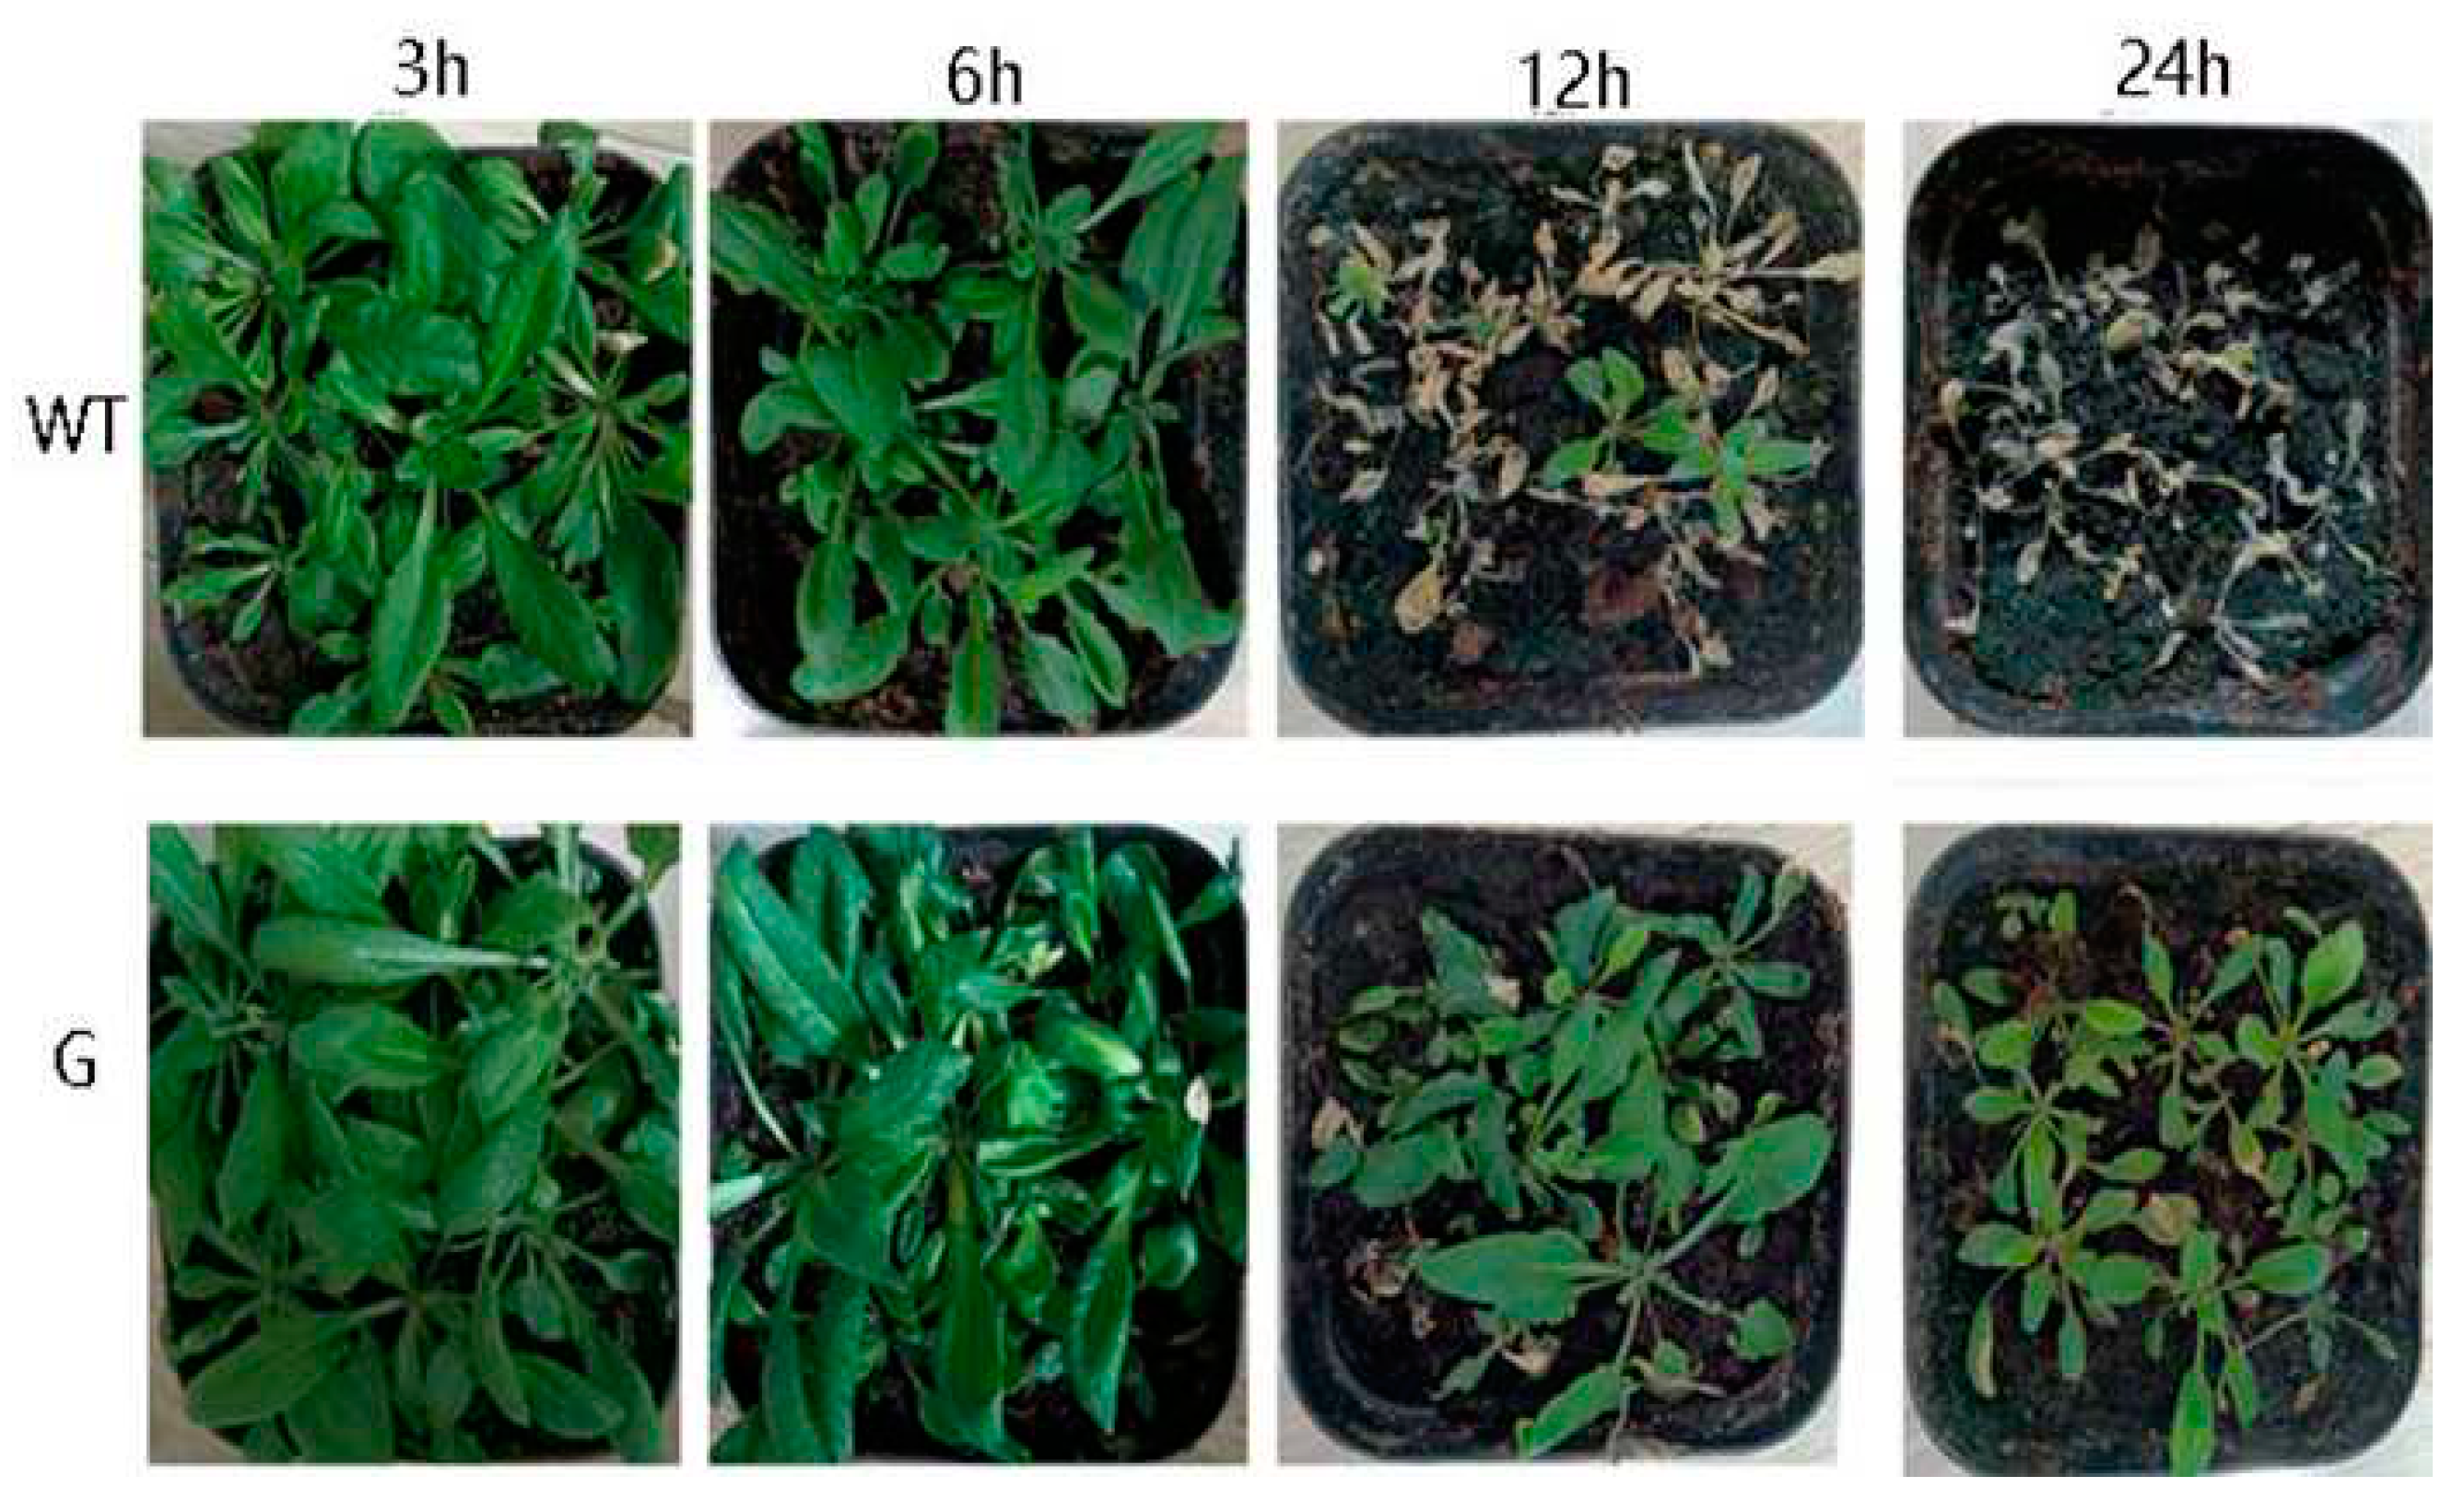
WT and transgenic plants were subjected to a -4 °C treatment for varying durations of 3 h, 6 h, 12 h, and 24 h, followed by normal growth conditions for a period of 7 days. The results depicted in
Figure 8 demonstrate that both WT and transgenic plants exhibited normal growth after being exposed to low temperatures for 3 h and 6 h. However, the WT plants subjected to a 12 h treatment experienced significant mortality, whereas a majority of the transgenic plants managed to survive under the same low temperature conditions. Furthermore, a small proportion of transgenic plants exhibited survival even after a 24 h exposure to low temperatures, as illustrated in
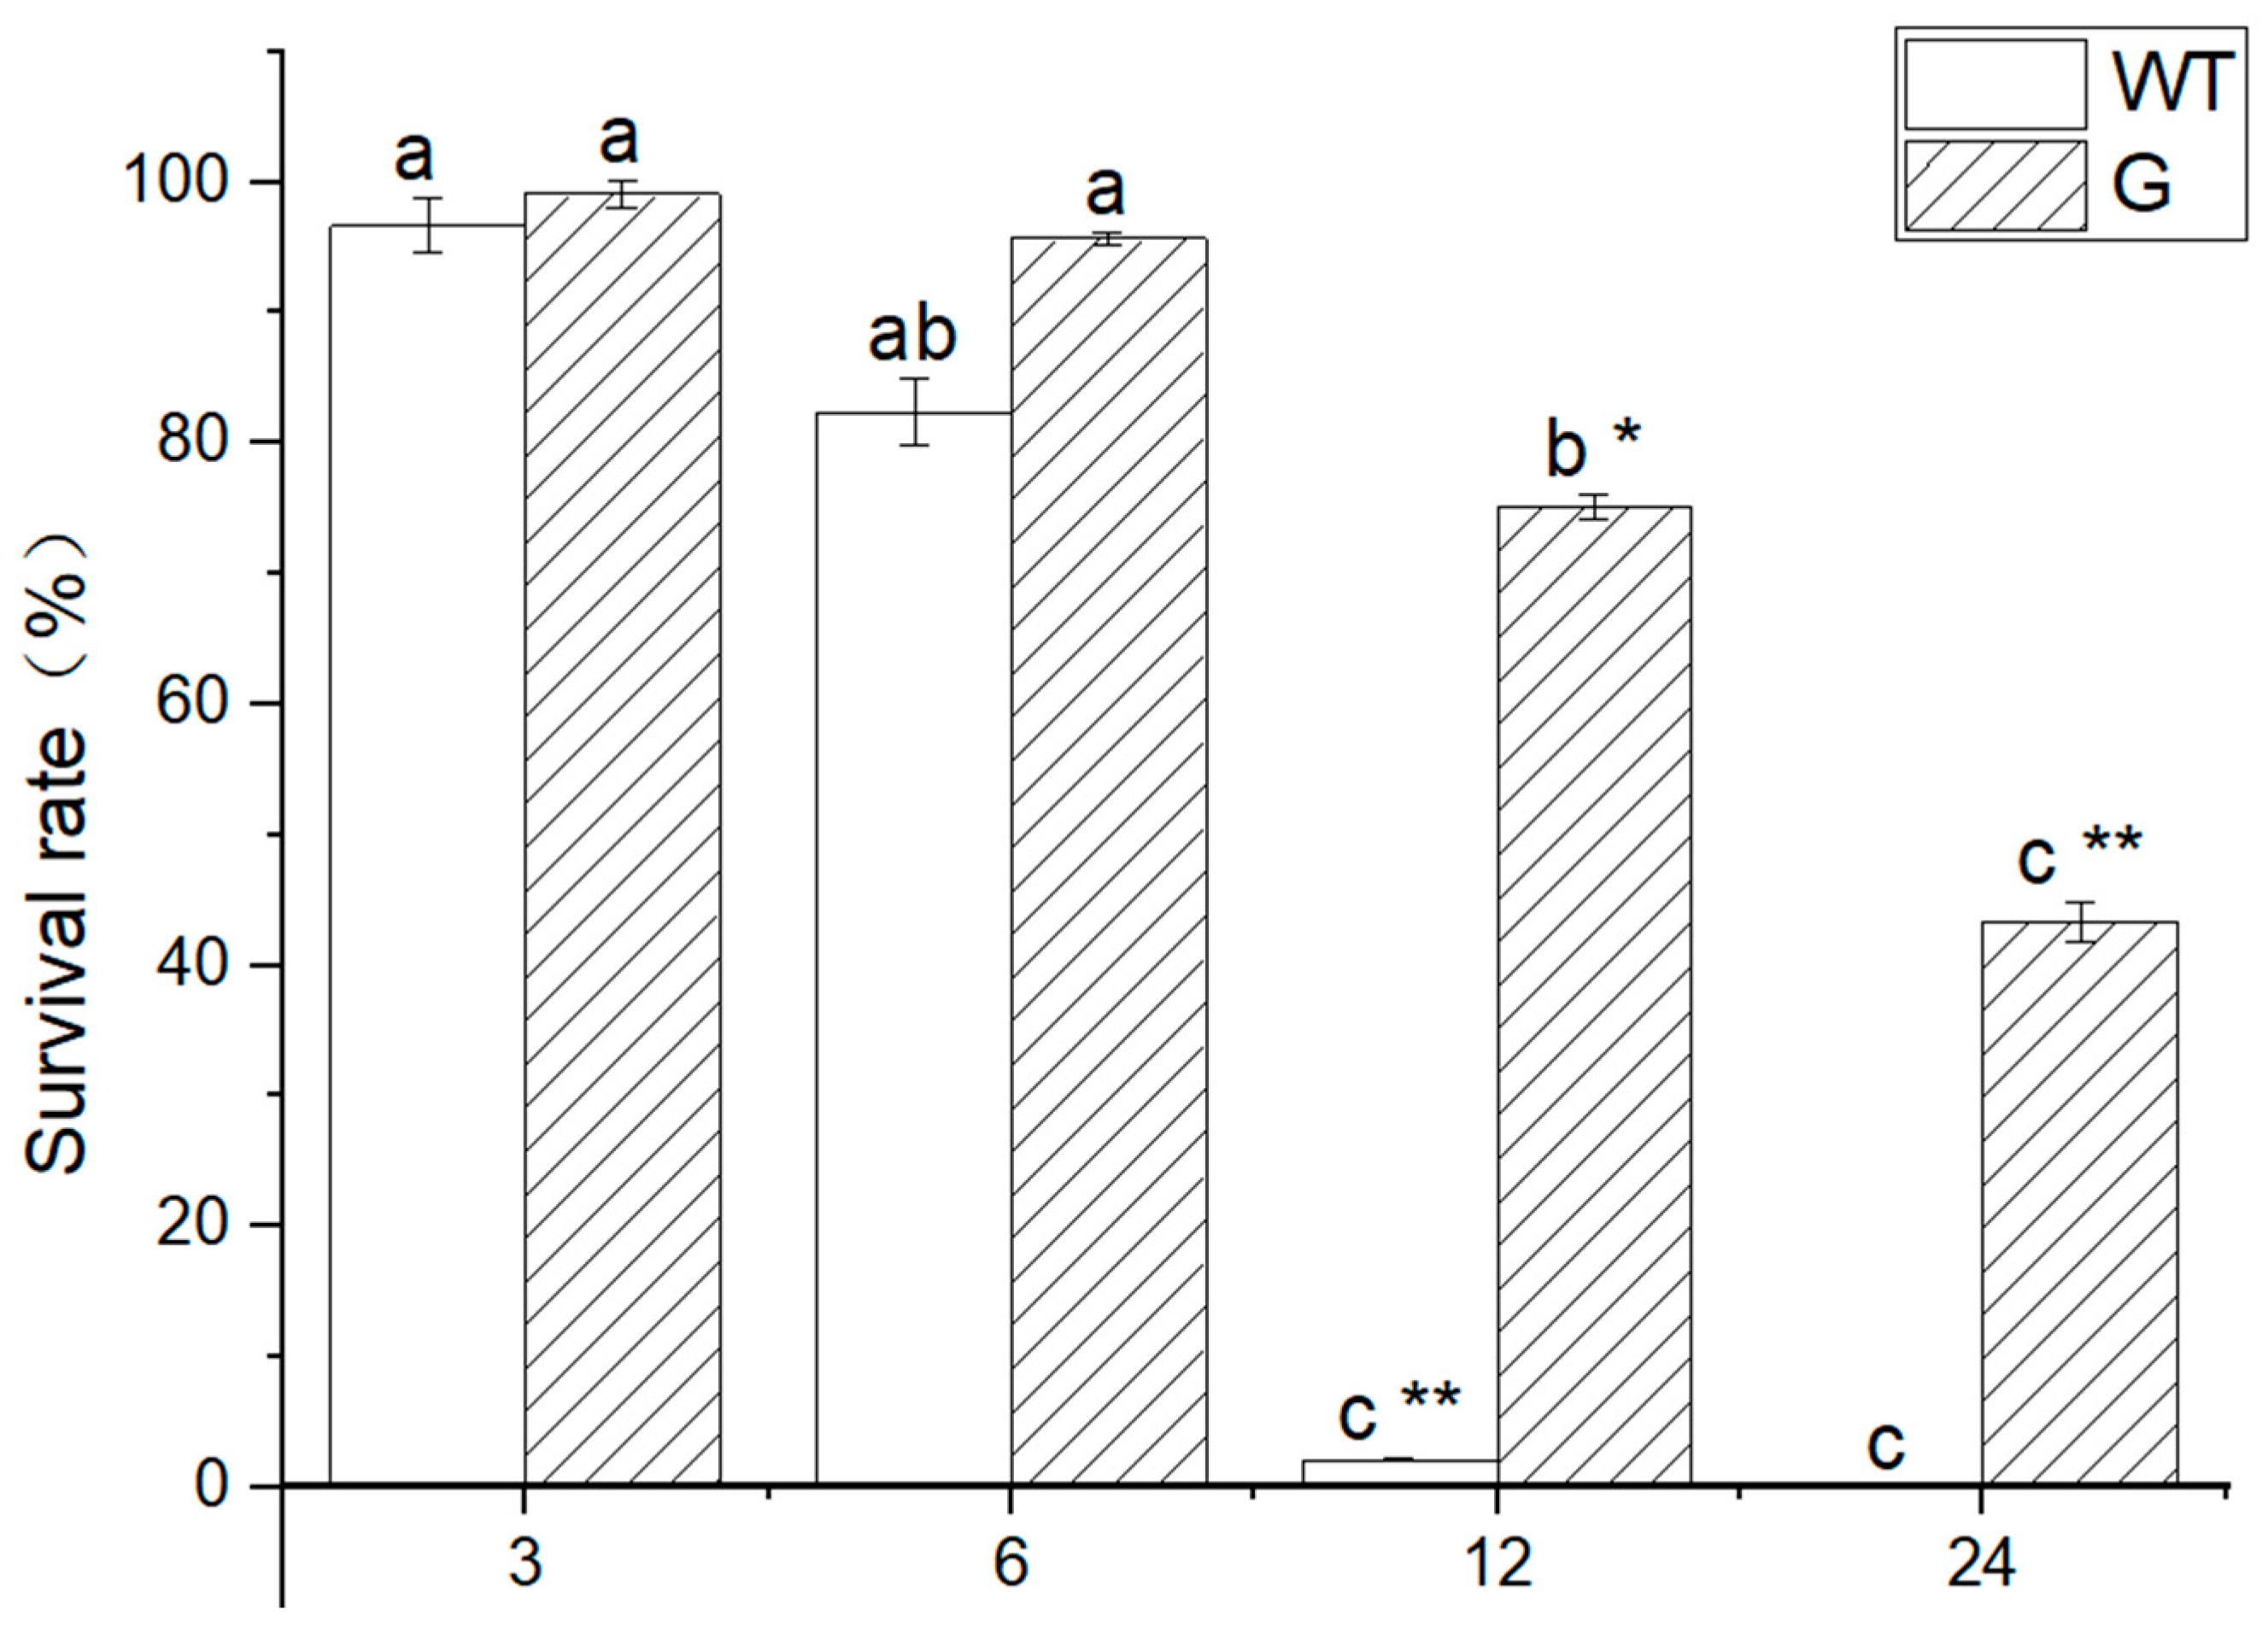
Figure 7. The results of the statistical analysis conducted on the survival rate of seedlings subjected to low temperature stress indicate that both WT and transgenic plants treated at -4 °C for 3 h and 6 h exhibited normal growth. However, a significant disparity in survival rates was observed between WT and transgenic plants after 12 h of treatment. Specifically, the survival rate of WT plants was recorded at 2.1%, whereas the survival rate of transgenic plant seedlings reached 75.1% (
Figure 8). Furthermore, all WT plants perished after 24 h, while the survival rate of transgenic plants was measured at 43.3%.
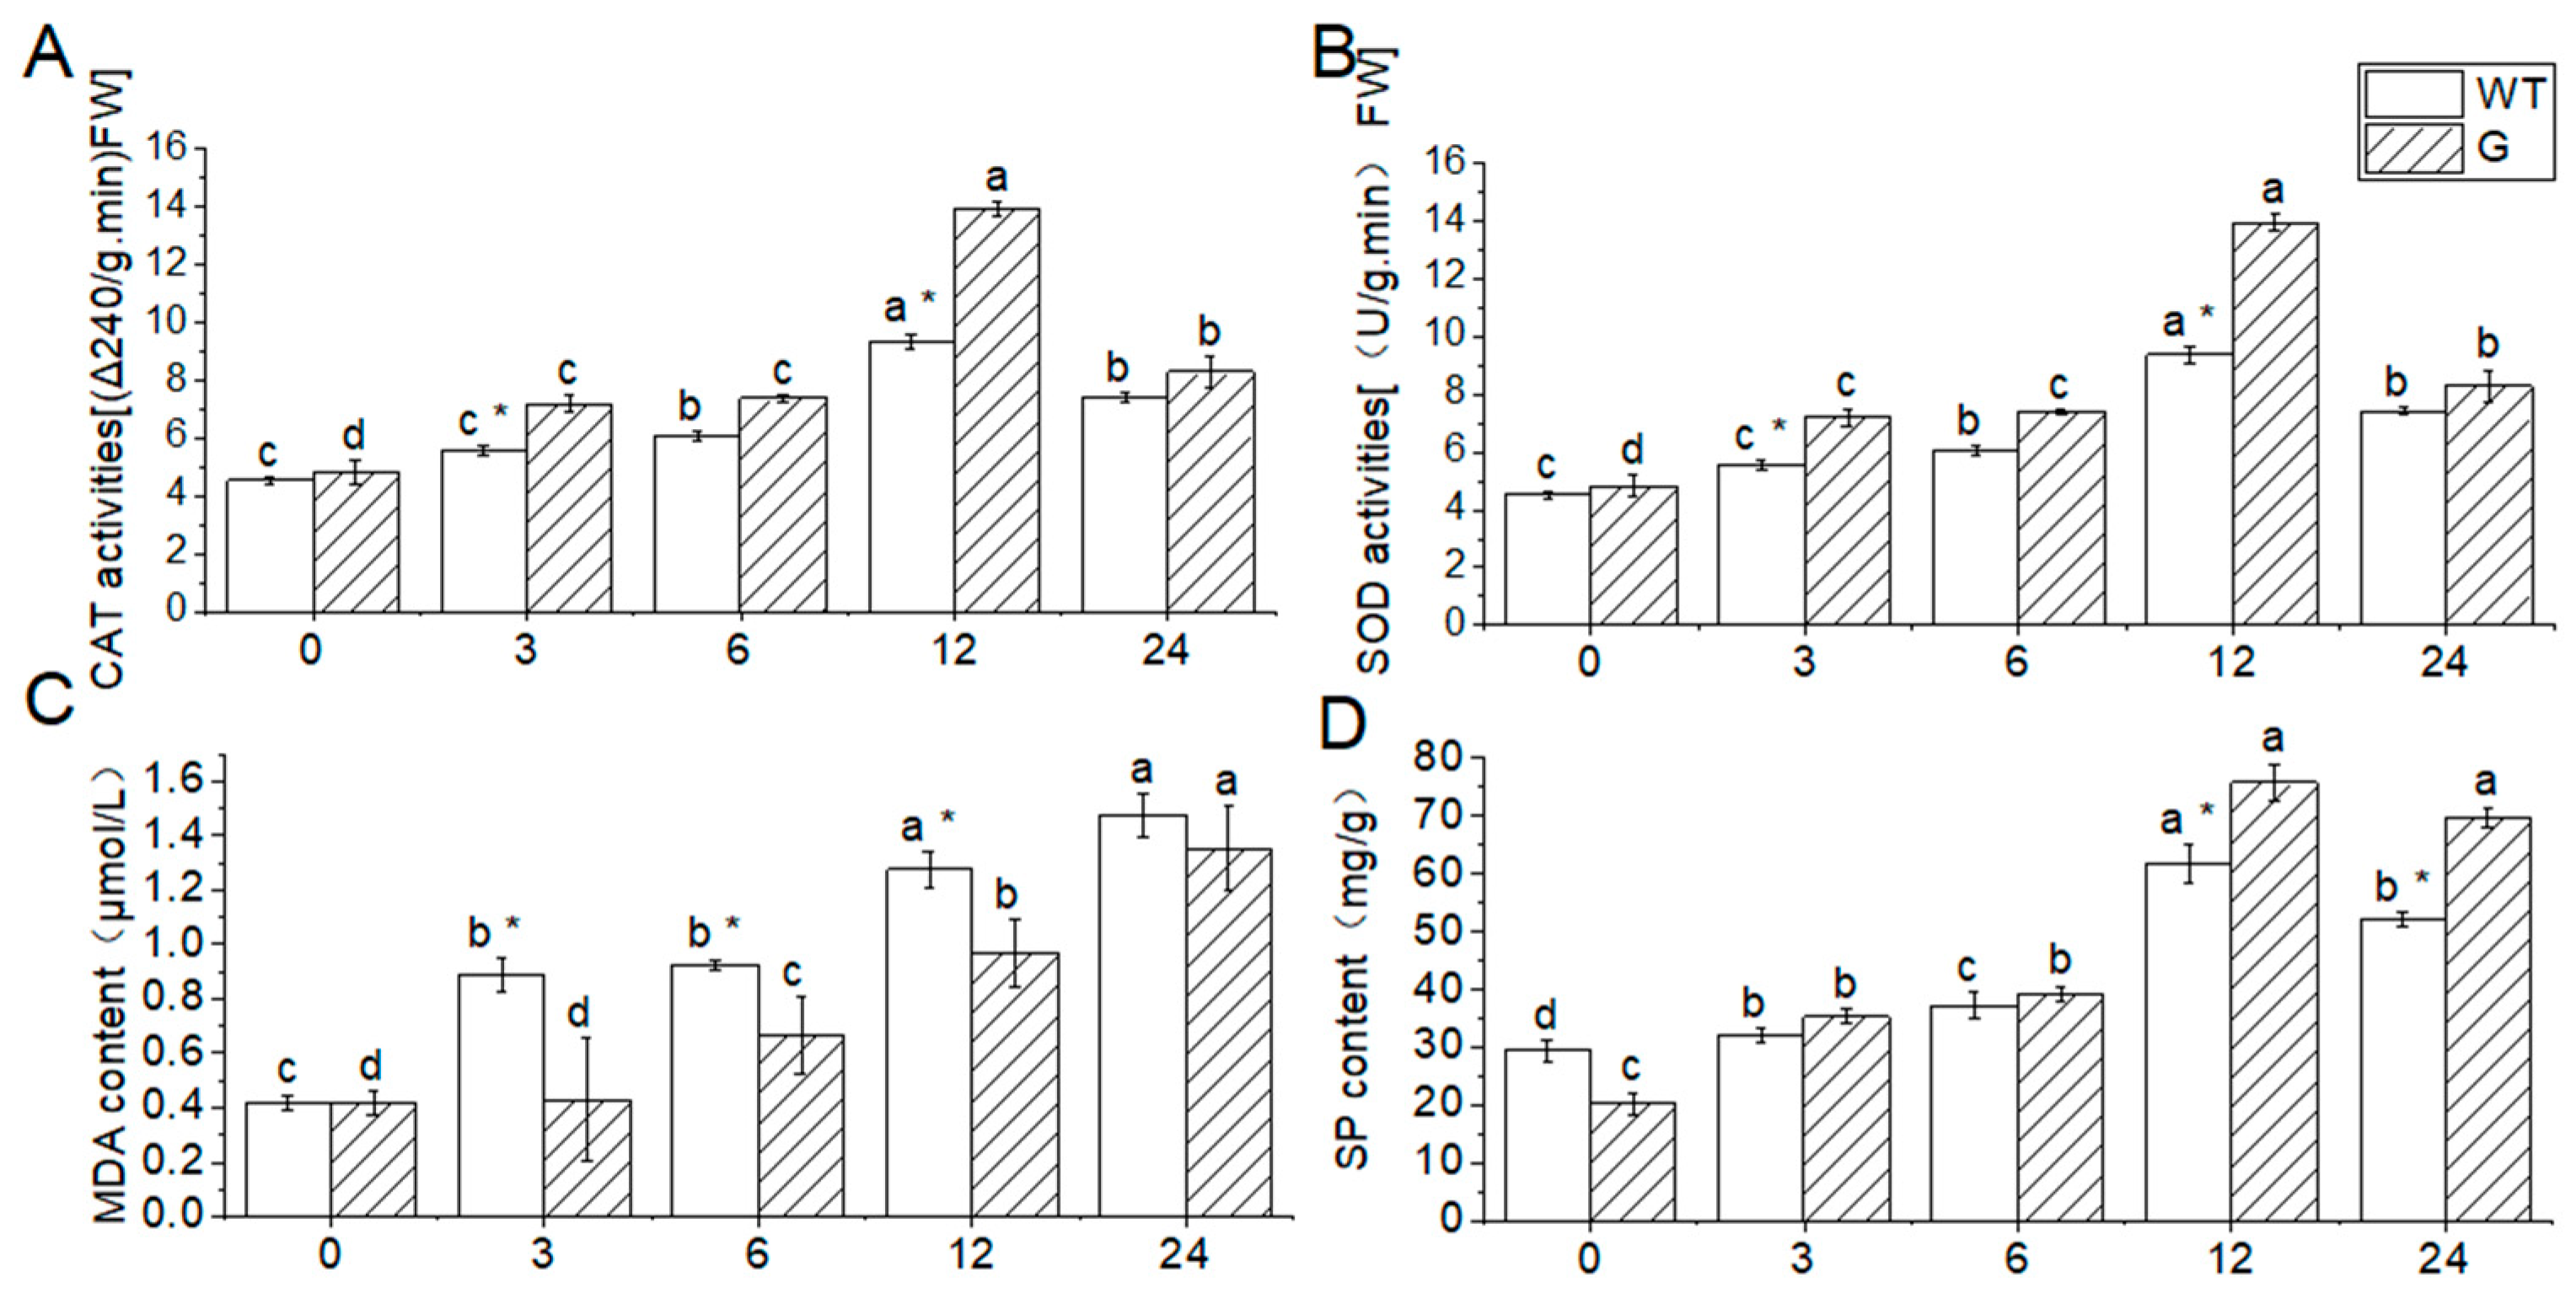
2.9. Physiological and Biochemical indexes Analysis of Arabidopsis thaliana under low temperature stress
In this study, Arabidopsis leaves were utilized to assess physiological and biochemical indicators in order to evaluate the impact of low temperature treatment at -4 ℃ on plant damage. The findings revealed that the activities of CAT and SOD, as well as the SP content, initially increased and subsequently decreased in both wild-type (WT) and transgenic plants. Conversely, the MDA content consistently increased throughout the duration of the low temperature stress. At 25℃, the CAT activity, SOD activity, and MDA content of the WT plants exhibited minimal changes in comparison to the transgenic plants. However, the SP content of the WT plants was higher than that of the transgenic plants.
After a 3h low-temperature treatment, the catalase (CAT) activity, superoxide dismutase (SOD) activity, and soluble protein (SP) content of the wild type (WT) were found to be higher than those of the transgenic plant (G), exhibiting a 52.6% increase compared to the initial measurement. Conversely, the malondialdehyde (MDA) content of the WT was significantly higher, with a 51.5% difference compared to the transgenic plant (G). However, the CAT activity, SOD activity, and SP content did not show a significant increase after 6 hours of low-temperature treatment compared to the initial measurement. Following a 6-hour low-temperature treatment, the WT exhibited a 12.2% increase in CAT activity, a 16.7% increase in SOD activity, and an increase in SP content compared to the transgenic plant (G).
Following a 12htreatment at -4 ℃, the activities of CAT, POD, and the content of SP reached their peak values, exhibiting a respective increase of 16.1%, 32.8%, and 11.4% compared to the WT. However, as the processing time prolonged, the activities of CAT, SOD, and the content of SP declined, while the content of MDA continued to rise (
Figure 9).
3. Discussion
Glutathione S-transferase played an important role in plant growth and development and stress management[
27]. Genome-wide analysis indicated that 70
GSTs gene from
B.rapa were divided into eight subclass based on the domain information and phylogenetic analysis. Tau subclass was the numerous with 37 number of genes and Phi with 22(
Figure 1 and
Table 1). All genes are unevenly distributed on ten chromosomes(
Figure 2). Most genes in the same evolutionary branch contained the same conserved motif, which was similar to that of
B.rapa(
Figure 3B).
The subclass of exon and intron in the
GSTs gene family was determined through cluster analysis and gene structure analysis (
Figure 3C). Previous studies have demonstrated the significant involvement of these two types of
GSTs genes in plant resistance to abiotic stress[
28]. Furthermore, a hormone stress-specific cis regulatory element was identified in the promoter region of the
GSTs gene, suggesting its involvement in hormone regulation, as illustrated in
Figure 4. These findings establish a theoretical foundation for future investigations into the functionality of the
GSTs gene family, particularly in eukaryotes.
In order to comprehend the reaction of GSTs genes to low temperature stress, the expression levels of 15 genes were observed to be significantly altered, either upregulated or downregulated (
Figure 5). Cold-tolerant varieties exhibited elevated GST enzyme activity and expression levels of 28 stress-related genes when subjected to low temperature stress. Certain
CmGSTs, specifically those classified as Tau, Phi, and DHAR, were found to play a crucial role in response to cold stress. The study suggests that the
JrGSTU1 transgenic walnut has the potential to enhance its cold tolerance by upregulating the expression of the
GSTs gene and increasing GST enzyme activity under cold stress conditions[
29]. Additionally, Ma et al.[
4] observed a significant upregulation of BnaA02g35760D, BnaC06g20450D, BnaC06g35490D, BnaA02g03230D, and BnaA02g35980D genes in strong cold-resistant walnut varieties, with expression levels 7-12 times higher compared to weak cold-resistant varieties under cold stress. The study found that Arabidopsis plants overexpressing
GSTF2 under low tempera-ture stress were stronger than WT plants, and overexpressing
GSTF2 in Korean rape enhanced the tolerance of plants[
30]. Harshavardhanan et al. found that under low temperature stress, the expression of
BoGSTF10 and
BoGSTU24 genes in cabbage was up-regulated[
31]. In the third chapter, the proteomic study found that the protein expression abundance of
GSTF2 gene in Longyou-7 was 1.6.
GSTF2 gene also participated in the response to low temperature stress, but its functional mechanism needs further study.
The subcellular localization findings indicated that GSTF2 exhibited presence in both the cell membrane and the nucleus, as depicted in
Figure 6. Consequently, further investigation is required to elucidate its specific functionalities. To this end, the
GSTF2 gene was introduced into Arabidopsis, resulting in overexpression. Subsequent exposure to low temperature stress revealed that the transgenic plants exhibited a higher survival rate in comparison to the wild type, as illustrated in
Figure 7 and
Figure 8. Subsequent analysis of physiological and biochemical parameters in the transgenic plants subjected to low temperature stress demonstrated a significant increase in enzyme activity and soluble protein content, relative to the overexpressed plants(
Figure 9). Previous research conducted on Arabidopsis has demonstrated that AtGSTF2 lacks enzymatic catalytic activity, but functions as a ligand protein by directly binding with auxin. This interaction plays a crucial role in regulating the distribution and accumulation of auxin within plants. Furthermore, this finding provides evidence for the association between auxin and the differentiation of stem tip meristem. Additionally, it was observed that these plants exhibit remarkable tolerance to freezing conditions, enabling them to adapt effectively to such harsh environmental circumstances.
The findings of this study demonstrate that the expression of
GSTF2 gene in transgenic plants was significantly elevated compared to the wild type under low temperature stress[
35]. This study further supports the notion that
GSTF2 gene plays a crucial role in enhancing the cold resistance of plants. Consequently, these results offer valuable insights into the underlying mechanisms of cold resistance in winter
B.rapa and provide a foundation for enhancing the cold resistance of northern winter rapeseed.
4. Materials and Methods
4.1. Identification of members of BraGSTs Gene Family in B.rapa
The
B.rapa genome and gene structure annotation information, exhibiting significant homology, were acquired from the
B.rapa Database (
http://brassicadb.org/brad/ index.php/)[
35]. The BraGSTs domain (PF00043 and PF02798) was obtained from the Pfam database (
http://pfam.xpfam.org)[
24]. The hmmer software was utilized to search the Longyou-7 database, resulting in the retrieval of protein sequences containing the PF00043 and PF02798 domains[
35]. At the same time, the online software ExPASy (
http://web.expasy.org/protparam/) was used to predict the amino acid number, molecular weight, isoelectric point, hydrophilicity and fat index of all family members[
36,
37]. ClustaW was used for multi-sequence alignment of BraGSTs amino acid sequences. On the basis of multiple sequence alignment, the clus-ter diagram is constructed by adjacency method (Neighbor-Join,NJ) in MEGA7.0 soft-ware[
38].
The initial coordinates of each
BraGSTs gene on the chromosome, along with other pertinent details, were acquired from the
B.rapa genome database. The physical positioning of these genes on the chromosome was then mapped using MapChart software[
39]. The
BraGSTs gene sequences were obtained, and the promoter sequences of candidate
BraGSTs genes in
B.rapa, spanning 2000bp upstream, were extracted. The cis-acting elements were subsequently analyzed using the PlantCARE database (
http://bioinformatics.psb.ugent.be/webtools/plantcare/html/), and the corresponding charts were generated[
40]. The conserved motif of the BraGSTs protein in
B.rapa was examined using the online analysis tool MEME (
http://meme-suite.org). A maximum of 10 motifs were considered, while the default parameters were utilized for all other settings[
41].
4.2. Prediction of BraGSTs expression under low temperature stress
The expression of the
BraGSTs gene family was predicted and analyzed using the transcriptome data of "Longyou-7" provided by the rape laboratory of Gansu Agricultural University. Additionally, the heat map was generated using TBtools software[
42]. The time points S1 and S4 corresponded to the overwintering period on October 13th (0℃) and December 16th (-11℃), respectively.
4.3. Preliminary verification of BraGSTF2 gene function
The BraGSTF2 gene was cloned by PCR based on specific primers(BraGSTF2-F: ATGGCAGGTATCAAAGTTTTCG; BraGSTF2-R: CTGAAGGATCTTCTGTGAAGC). With reference to Homologous Recombination technology , PCR amplification was carried out using primers(BraGSTF2-F:CGGGGGACGAGCTCGGTACCATGGCAG GTATCAAAGTTTTCG; BraGSTF2-R:ACCATGGTGTCGACTCTAGACTG AAGGAT CTTCTGTGAAGC). and the recovered products were ligated with BP Clonase enzyme (Invitrogen,Carlsbad, CA, USA) and the pDONR vector. After transforming into coliform bacteria(DH5α), the positive clones were screened by smear sequencing. The positive clones were selected to interact with LR Clonase enzyme (Invitrogen, Carlsbad, CA, USA) to connect to the overexpression vector pEarly-Gate101, following the instructions for Agrobacterium tumefaciens GV3101 (Anyu Biotechnology Co., Ltd., Shanghai, China). After the bacteria were picked out from the coated plate, colony PCR was carried out and the positive bacterial solution was selected and preserved[
43].
Transgenic Arabidopsis was obtained by the floral-dip method. The T3 seeds were obtained by screening by antibiotic. The T3 seeds of transgenic Arabidopsis lines and WT Arabidopsis were sown in pots according to the experimental requirements. The phenotypes of WT and transgenic Arabidopsis thaliana plants treated at-4℃ were observed at seedling stage. WT and transgenic plant grown for about 30 days were treated in -4℃ incubator for 3h, 6h, 12h and 24h, respectively. 4 plants were taken in each pot, and the other part resumed normal growth, and the plant phenotype and survival rate were observed and counted after 1 week. Primers (BraGSTF2-pcr-F:GCGAACTGTCTGATGCTC; BraGSTF2-pcr-R: CGTATCGGTGAGCTATGTACTG) were used toperform qRT-PCR on Arabidopsis. AtActin2 (F: TGTGCCAATCTACGAGGGTTT; R: TTTCCCGCTCTGCTGTTGT) was used as an internal control for Arabidopsis.. The leaves of the plants were frozen in liquid nitrogen and stored in cryogenic refrigerator. The SOD activity and POD activity, MDA content and SP content were determined, and the rest of Arabidopsis thaliana recovered. One week later, the plant survival rate was observed and counted[
44,
45]. Three biological replicates were set up for each of the above experimental treatments.
4.4. RNA Isolation, Reverse T ranscription, qRT-PCR, and T ranscriptome Expression Analysis
RNA Extraction Kits (TIANGEN Biotech Co., Ltd., DP432, Beijing, China) were employed to extract total RNA from both wild-type (WT) and transgenic plants, ensuring the elimination of genomic DNA contamination. The cDNA synthesis was carried out using the PrimeScript™ RT Master Mix (Vazyme, Nanjing, China) following the provided instructions. Subsequently, the quality and concentration of the obtained cDNA were assessed using an ultra-trace UV-visible spectrophotometer (NanoVueTM Plus, Wilmington, DE, USA), and it was stored in a standby state.
Genes within the transcriptome data were chosen and specific primers were designed for qRT-PCR based on the guidelines provided by the ChamQ Universal SYBR qPCR Master Mix (Shanghai, China). The reaction procedure consisted of an initial denaturation step at 95 ◦C for 10 minutes, followed by 40 cycles of denaturation at 95 ◦C for 30 seconds and annealing/extension at 60 ◦C for 1 minute. Subsequently, a melting curve analysis was conducted within the temperature range of 65–95 ◦C. The qRT-PCR efficiency of the genes was determined by evaluating the standard curve derived from the gradient dilution of cDNA. To normalize the quantity of template cDNA, the gene fragment encoding Arabidopsis actin RNA was utilized as an internal control. The relative expression values of each gene were calculated using the comparative 2−∆∆CT method [
46]. The RNA-seq libraries (SRP179662) and (SRP211768) were selected for gene-expression analysis [
44,
45]. Three biological replicates were set up for each experimental treatment.
4.5. Subcellular localization of BraGSTF2 protein in tobacco
Agrobacterium tumefaciens strains containing the PCAMBIA2300-BraGSTF2-GFP construct and the pCAM-BIA2300-GFP empty vector were transiently introduced into Benji tobacco leaves. The tobacco plants were cultured at a temperature of 23℃ under dark conditions for a duration of 24 hours. Subsequently, small sections of tobacco leaves were excised to create thin slices for analysis. The fluorescence patterns of the pCAMBIA2300-BraGSTF2-GFP and pCAM-BIA2300-GFP constructs were visualized using a laser scanning confocal microscope (LSCM 800, Germany) with an excitation wavelength of 488nm[
46].
5. Conclusions
In this study, a total of 70 members of the BraGSTs gene family were identified and classified into 8 subfamilies. It was observed that members within the same subfamily exhibited identical gene structure and functional motif. Furthermore, the distribution of these genes across 10 chromosomes was found to be uneven. Based on these findings, it is hypothesized that the BraGSTF2 gene plays a significant role in mitigating the effects of low temperature stress. Additionally, the subcellular localization of the BraGSTF2 protein was determined to be in the nucleus and cell membrane. Further investigation revealed that the over-expression of the over-Arabidopsis BraGSTF2 gene resulted in higher levels of CAT, SOD activity, and SP content compared to the wild type, while the MDA content was lower under low temperature stress conditions. These results suggest that the BraGSTF2 gene may have a regulatory function in response to low temperature stress.
Supplementary Materials
The following supporting information can be downloaded at the website of this paper posted on Preprints.org, Table S1: Prediction of physicochemical properties and secondary structure of BraGST gene.
Author Contributions
Conceptualization, Z N. L L and W.S.; methodology, Z N. L L and S.Y.; formal analysis, Z.N., L.L. data curation, J.W., X.L. and Y.P.; writing—original draft preparation, Z.N. and L.L.; writing—review and editing, L.L. Y.L. and Z.N.; project administration, W.W, L.M. and Y.F. All authors have read and agreed to the published version of the manuscript.
Funding
This work was supported by State Key Laboratory of Aridland Crop Science, Gansu Agricultural University (No. GSCS-2020-Z1); the Major Science and Technology Project of Gansu Province(22ZD6NA009), Modern Cold and Arid Agricultural Science and Technology support in Gansu Province (KJZC-2023-12), the National Natural Science Foundation of China (No. 31960435,32260519), the China Agriculture Research System of MOF and MARA (CARS-12).
Institutional Review Board Statement
Not applicable.
Informed Consent Statement
Not applicable.
Data Availability Statement
Acknowledgments
We would like to acknowledge all researchers in our laboratory for their help.
Conflicts of Interest
The authors have no conflict of interest to declare in relation to this article.
References
- XU Y Z, SUN W C, FANG Y, SUN B L. Matter transport, photosynthetic characteristics and fluorescence dynamics of 2 Brassica rapa cultivars with different freezing-tolerance in Northwest China[J]. Chinese Journal of Oil Crop Sciences, 2020,42(1):91-101.
- YUAN J H, GU X P, LI T, LI Z F, JIA X L, LU L L, MA L J. Research Progress on Cold Resistance of Chinese Winter rapeseed(Brassica rapa L.)[J]. China Seed Industry, 2017(12):5.
- MA L, SUN W C,LIU Z G. Study of Difference in Mechanism of Cold Resistance of Winter Rapeseed of Brassica rape and Brassica napus[J]. Acta AgriculturAge Boreali-sinica,2016,31(1):147-154.
- MA L, BAI J, ZHAO YH et.. Protein and physiological differences under cold stress, and identification and analysis of BnGSTs in Brassica napus L. [J]. Acta Agronomica Sinica, 2023, 49(1): 153-166.
- Mudgal V, Madaan N, Mudgal A. Biochemical Mechanisms of Salt Tolerance in Plants: A Review[J]. International Journal of Botany, 2010, 6(2).
- Qin C, Weifu K, Pengfei W, et al. Plant freezing tolerance and genes express in cold acclimation: a review [J]. Acta Ecologica Sinica, 2004, 24(4):806-811.
- Lee S C, Huh K W, An K, et al. Ectopic Expression of a Cold-inducible Transcription Factor, CBF1/DREB1b, in Transgenic Rice (Oryza sativa L.)[J]. Molecules and Cells, 2004, 18(1):107-114.
- Huang C, Guo T, Zheng S C, et al. Increased cold tolerance in -transferase gene[J]. Biologia Plantarum, 2009, 53(1):183-187.
- Chen Z Y, Wang Y T, Pan X B, et al. Amelioration of cold-induced oxidative stress by exogenous 24-epibrassinolide treatment in grapevine seedlings: Toward regulating the ascorbate–glutathione cycle[J]. Scientia Horticulturae, 2019, 244:379-387.
- Liu H M, Fang L, Che Y S, et al. Protein expression patterns in two Spiraea species in response to cold treatment[J]. Molecular Biology Reports, 2014.
- Wang Q, Bohn P W. Active Spatiotemporal Control of Arg-Gly-Asp-Containing Tetradecapeptide Organomer captans on Gold with In Plane Electrochemical Potential Gradients[J]. Journal of Physical Chemistry B, 2003, 107(46):12578-12584.
- Taha M O, Fraga M M, Fagundes D J, et al. Ascorbic acid prevents autonomic dysfunction in rat jejunal submitted to cold ischemic preservation for transplantation[J]. Transplantation Proceedings, 2004, 36(2):289-292.
- Gong H, Jiao Y, Hu W W, et al. Expression of Glutathione-S-transferase and its Role in p; Plant Growth and Development in Vivo and Shoot Morphogenesis in Vitro[J]. Plant Molecular Biology. 2005, 57(1):53-61.
- Jiang H W, Liu M J, Chen I C, et al. A Glutathione S-transferase Regulated by Light and Hormones Participates in the Modulation of Arabidopsis Seedling Development[J]. Plant Physiology. 2010, 154(4):1646-1657.
- Lijuan, Wei, Yan, et al. Genome wide identification and comparative analysis of glutathione transferases (GST) family genes in Brassica napus.[J]. Scientific reports, 2019, 9(1):9196-9196.
- Mohammad K R, Zahra S S, Maryam S, et al. Glutathione S-transferase (GST) family in barley: Identification of members, enzyme activity, and gene expression pattern[J]. Journal of Plant Physiology, 2013, 170(14):1277-1284.
- Casati P, Rius S P, Zhang C, et al. Citation: glutathione s-transferase gene family in gossypium raimondii and g. arboreum: comparative genomic study and their expression under salt stress[J]. Frontiers in Plant Science, 2017,7:139.
- Nadeem K, Chun-Mei H, Waleed A K. Genome-Wide Identification, Classification, and Expression Divergence of Glutathione-Transferase Family in Brassica rapa under Multiple Hormone Treatments[J]. Biomed Research International, 2018, 2018:1-19.
- Harshavardhanan V, Senthil K T, Ashokraj S, et al. Glutathione Transferases Superfamily: Cold-Inducible Expression of Distinct GST Genes in Brassica oleracea[J]. International Journal of Molecular Sciences, 2016, 17(8).
- Concetta L,Nunzio D A, Alessandra T, Giuseppe R R, et al. Characterization of the glutathione S-transferase gene family through ESTs and expression analyses within common and pigmented cultivars of Citrus sinensis (L.) Osbeck[J]. Bmc Plant Biology, 2014, 14(1):39-39.
- Pljesa-Ercegovac M, Savic-Radojevic A, Matic M, et al. Glutathione Transferases: Potential Targets to Overcome Chemoresistance in Solid Tumors[J]. International Journal of Molecular Sciences, 2018, 19(12).
- MD Hossain, Rohman M M, Fujita M. A Comparative investigation of glutathione S-transferases, glyoxalase-I and alliinase activities in different vegetable crops[J]. Journal of crop science and Biotechnology, 2007(1):10.
- Xu J, Qing A, et al. Transgenic Arabidopsis Plants Expressing Grape Glutathione S-Transferase Gene ( VvGSTF13) Show Enhanced Tolerance to Abiotic Stress[J]. Biochemistry, 2018.
- Gao C, Yang G, Guo Y, et al. Overexpression of ThGSTZ1 from Tamarix Hispida Improves Tolerance to Exogenous ABA and Methyl Viologen[J]. Trees. 2016, 30(6):1935-1944.
- Sappl P G, Carroll A J, Clifton R, et al. The Arabidopsis Glutathione Transferase Gene Family Displays Complex Stress Regulation and Co-silencing Multiple Genes Results in Altered Metabolic Sensitivity to Oxidative Stress[J]. Plant Journal. 2010, 58(1):53-62.
- Jha B, Sharma A, Mishra A. Expression of SbGSTU (tau class glutathione S-transferase) gene isolated from Salicornia brachiata in tobacco for salt tolerance[J]. Molecular Biology Reports, 2011, 38(7):4823-4832.
- Song W, Zhou F K, Shan C H, Zhang Q, et al. Identification of glutathione S-transferase genes in hami melon (Cucumis melo var. saccharinus) and their expression analysis under cold stress. Front Plant Sci, 2021, 12: 672017.
- Islam S, Sajib S D, Jui Z S, Arabia S, et al. Genome-wide identification of glutathione S-transferase gene family in pepper, its classification, and expression profiling under different anatomical and environmental conditions. Sci Rep, 2019, 9: 9101.
- Yang G Y, Xu Z G, Peng S B, et al. In planta characterization of a tau class glutathione S-transferase gene from Juglans regia (JrGSTTau1) involved in chilling tolerance. Plant Cell Rep, 2016, 35: 681–692.
- Jeong Y J, Choy Y H, Joo H J, et al. Identification and analysis of cold stress-inducible genes in Korean rapeseed varieties[J]. Journal of Plant Biology, 2012, 55(6):498-512.
- Harshavardhanan V, Senthil T, Ashokraj S, et al. Glutathione Transferases Superfamily: Cold-Inducible Expression of Distinct GST Genes in Brassica oleracea[J]. International Journal of Molecular Sciences. 2016, 17(8).
- Edwards R, Dixon D P. Plant Glutathione Transferases[J]. Methods in Enzymology. 2005, (401):169-178.
- Yang G Y Reade J P H, Hull M R, Cobb A H. A Role for glutathione-S-transferase in Herbicide Resistance in Black-grass (Alopecurus myosuroides)[J]. Plant Physioloy. 2004(8):468-477.
- Smith A P, Deridder B P, Guo W J, et al. Proteomic Analysis of Arabidopsis GlutathioneS-transferases from Benoxacor- and Copper-treated Seedlings[J]. Journal of Biological Chemistry. 2004,8(1):205-219.
- Finn R D, Coggill P, Eberhardt R. Y, et al. The Pfam Protein Families Database: Towards a More Sustainable Future. Nucleic Acids Res. 2016, 44, D279–D285.
- Mistry J, Finn R D, Eddy S R. Bateman, et al. Challenges in Homology Search: HMMER3 and Convergent Evolution ofCoiled-Coil Regions. Nucleic Acids Res. 2013, 41, e121.
- Marchler-Bauer A, Bo Y, Han L. et al. CDD/SPARCLE: Functional Classification of Proteins via Subfamily Domain Architectures. Nucleic Acids Res. 2017, 45, D200–D203.
- Kumar, S, Stecher, G. ; Tamura, K. MEGA7: Molecular Evolutionary Genetics Analysis Version 7.0 for Bigger Datasets. Mol. Biol. Evol. 2016, 33, 1870–1874.
- Chen C, Chen H, Zhang. Y. et al. TBtools: An Integrative Toolkit Developed for Interactive Analyses of Big Biological Data. Mol. Plant 2020, 13, 1194–1202.
- Lescot M, Déhais P, Thijs G. et al. PlantCARE, a Database of Plant Cis-Acting Regulatory Elements and a Portal to Tools for in Silico Analysis of Promoter Sequences. Nucleic Acids Res. 2002, 30, 325–327.
- Bailey T L, Mikael B, Buske F A, et al. MEME SUITE: tools for motif discovery and searching[J]. Nucleic Acids Research, 2009, 37(Web Server issue):W202-8.
- Liu L, Pu Y, Niu Z. et al. Brassica rapaTranscriptomic Insights Into Root Development and Overwintering Transcriptional Memory of L. Grown in the Field[J]. Front Plant Sci.,2022,13:13-15.
- Ma L, Bai J, Xu J. et al. Identification of proteins involved in response to cold stress and genome-wide identification and analysis of the APX gene family in winter rapeseed (Brassica rapa L.)[J].2021.
- Ma, L.; Coulter, J.A.; et al. Transcriptome Analysis Reveals Key Cold-Stress-Responsive Genes in Winter Rapeseed (Brassica Rapa L. ). Int. J. Mol. Sci. 2019, 20, 1071. [Google Scholar] [CrossRef] [PubMed]
- Fang Y, Coulter J. A, Wu J. et al. Identification of Differentially Ex pressed Genes Involved in Amino Acid and Lipid Accumulation of Winter Turnip Rape (Brassica Rapa L.) in Response to Cold Stress. PLoS ONE 2021, 16, e0245494.
- Livak, K.J.; Schmittgen, T.D. Analysis of Relative Gene Expression Data Using Real-Time Quantitative PCR and the 2-∆∆CT Method. Methods 2001, 25, 402–408. [Google Scholar] [CrossRef] [PubMed]
- X Rovira-Clavé, Jiang S, Bai Y, et al. Subcellular localization of biomolecules and drug distribution by high-definition ion beam imaging[J]. Nature Communications, 2021, 12(1).
Figure 1.
Clustering analysis of BraGSTs gene family in B.rapa. Note:Eight subfamilies and branches are marked with different colors.
Figure 1.
Clustering analysis of BraGSTs gene family in B.rapa. Note:Eight subfamilies and branches are marked with different colors.
Figure 2.
Chromosomal location and gene duplication in B.rapa. Note: The tandem duplicated genes are marked with red rectangles.
Figure 2.
Chromosomal location and gene duplication in B.rapa. Note: The tandem duplicated genes are marked with red rectangles.
Figure 3.
Clustering analysis, conserved structure and gene structure analysis of the BraGSTs gene in B.rapa. Note: (A) Use MEGA7 to draw a clustering analysis using the maximum likelihood method with default parameters in BraGSTs proteins. (B) Distribution of conserved motifs in the BraGSTs proteins. Boxes of different colors represent 10 putative motifs. (C) Exon/intron organization of the BraGSTs genes. The yellow box indicates the CDS, the green box indicates the UTR and the black line indicates the intron.
Figure 4.
Frequency of cis-regulatory elements in the upstream regions of BraGSTs protein in B.rapa. Note: The pie chart depicts the categorized ten types of cis-regulatory elements, and the corresponding colored bar chart represents the occurrence of different cis-elements.
Figure 4.
Frequency of cis-regulatory elements in the upstream regions of BraGSTs protein in B.rapa. Note: The pie chart depicts the categorized ten types of cis-regulatory elements, and the corresponding colored bar chart represents the occurrence of different cis-elements.
Figure 5.
The heat map of BraGSTs genes expression profile under freezing stress in B.rapa. Note: The values of RNA-seq were transformed using log2 and the heat map were generated by TBtools software. The S1 and S4 were represented the overwintering period on October 13th(0℃) and December 16th(-11℃). The color scale represents the relative expression levels from low (blue) to high (red).
Figure 6.
Subcellular localization of BraGSTF2 protein in tobacco. Note: The above figures, from left to right, the subcellular localization observation of 35S-GFP empty vector in dark field, bright field and merged field respectively, and the below figures, from left to right, are the subcellular localization observation of 35S-BraGSTF2-GFP recombinant vector in three fields respectively. Scale bars represent 20 μm. GFP was green fluorescent protein, DIC was bright field. Merged was overlay photo of two channels.
Figure 7.
Phenotype of WT and BraGSTF2 transgenic Arabidopsis after low temperature stress. Note: WT: wild type, G: transgenic Arabidopsis thaliana.
Figure 7.
Phenotype of WT and BraGSTF2 transgenic Arabidopsis after low temperature stress. Note: WT: wild type, G: transgenic Arabidopsis thaliana.
Figure 8.
Survival rate of plant after low temperature stress. Note: WT: wild type, G: over expression plants; Different lowercase letters represent significant differences in different time of low temperature treatment. * it indicated that there were significant differences among varieties (P < 0.05), and * * indicated that there were extremely significant differences among varieties (P < 0.01). The error bar represents the standard error of the average of the sample.
Figure 9.
Effect of low temperature stress on physiological indexs in transgenic and WT plant. Note: WT: wild type, G: over expression plants; Different lowercase letters represent significant differences in different time of low temperature treatment. * indicated that there were significant differences among varieties (P < 0.05), and * * indicated that there were extremely significant differences among varieties (P < 0.01). The error bar represents the standard error of the average of the sample.
Table 2.
Amino acid sequence and amino acid number of Motif.
Table 2.
Amino acid sequence and amino acid number of Motif.
| Motif |
Amino acid sequence |
Number of amino acid |
| Motif 1 |
EEDLGNKSELLLESNPVHKKIPVLIHNGKPICESLIIVEYIDETWP |
46 |
| Motif 2 |
FGYVDIALIGFYSWFDAYEKFGNFSIEAECPKLIAWAKRCLKRESVAKSLPDSEKVVEYVPELR |
64 |
| Motif 3 |
GNPJLPSDPYERAQARFWADFIDEKV |
26 |
| Motif 4 |
FKPVYGLTTDQAVVKEEEAKLAKVLDVYEARLKESKYLAG
DTFTLADLHHJPVIQYLL |
58 |
| Motif 5 |
SPFSRRVRJALELKGVPYE |
19 |
| Motif 6 |
KZFDELLKTLESELGDKPYFGGET |
24 |
| Motif 7 |
AKKEFIELLKTLEKELGDKTYFGGET |
26 |
| Motif 8 |
EEVKLLGYWPSPFSM |
15 |
| Motif 9 |
TPTKKLFEERPHVNEWVAEITARPAW |
26 |
| Motif 10 |
CLALLEEAFQKSSKGKGFFGGENIGFLDIACGSFLG |
36 |
|
Disclaimer/Publisher’s Note: The statements, opinions and data contained in all publications are solely those of the individual author(s) and contributor(s) and not of MDPI and/or the editor(s). MDPI and/or the editor(s) disclaim responsibility for any injury to people or property resulting from any ideas, methods, instructions or products referred to in the content. |
© 2023 by the authors. Licensee MDPI, Basel, Switzerland. This article is an open access article distributed under the terms and conditions of the Creative Commons Attribution (CC BY) license (http://creativecommons.org/licenses/by/4.0/).
