1. introduction
Water-jet pumps are widely used in military ships and weapon launchers. the water-jet pump uses the reaction force of the water-jet from the pump to propel the ship forward. the mixed flow pump is widely used in the field of water-jet. As a core component of the water-jet propulsion system, it directly affects the overall propulsion performance of the ship. Although the water-jet pump is required to operate in a relatively narrow range of working conditions, its design is very challenging. Specifically, because the propulsion efficiency is directly proportional to the efficiency of the pump, the water-jet pump must ensure efficient hydrodynamic performance, and the fluid output of the water-jet pump must be uniform, axial flow, and no circulation to achieve water spray the thrust is maximized [
1].Cavitation will cause the hydraulic performance of hydraulic machinery to drop sharply, that is, cavitation fracture, and also lead to the destruction of the material surface [
2].
the improvement of water-jet technology is based on the development of high efficiency and high cavitation resistance of water-jet pumps. the design of the water-jet pump is not only limited by the space size of the ship, but also to ensure efficient and low noise operation at high speed.
At present, there are two main approaches to blade design methods for rotating machinery, namely positive design and inverse design. the positive design refers to obtaining the 3D flow field through a given blade, while the inverse design refers to calculating the corresponding blade geometry by specifying the flow field distribution. in recent years, with the development of CFD, great progress has been made in the numerical calculation of the design of rotating machinery blades. It is indeed an effective method to modify the blade shape and apply the CFD method to predict the hydraulic characteristics of rotating machinery. However, there are actually many difficulties in determining the magnitude and direction of blade shape modification. This difficulty mainly reflects that small changes in any position of the blade will affect the flow distribution of other parts of the blade, and the relationship between the geometric parameters of the blade and the flow field is complicated. therefore, it is a more reasonable way to design the rotating machinery blades by the 3D inverse design method.
in recent years, advances in experimental techniques and numerical calculations have facilitated a better understanding of the flow mechanism. in order to suppress the secondary flow in the impeller, Zangeneh [
3,
4] proposed a compressible full three-dimensional inverse design method for the design of centrifugal and mixed flow rotating machinery in 1991, which defined the impeller. the distribution of the circumferential average velocity circulation on the meridian flow channel, and the corresponding blade shape is solved iteratively. the inverse design method is based on the non-stick slip condition to make the flow depend on the surface of the blade. This method is widely used in the secondary flow suppression of the mixed-flow pump impeller [
5,
6,
7,
8,
9].
Automatic optimization technology can reduce the development time in the design process and explore the design space in a more systematic way. Automatic optimization technology has been widely used in the design of aerodynamics and rotating machinery, but considering its high computational cost, its application is only limited to simple applications in industry. the automatic optimization technology of rotating blades relies on three main modules: geometric parameterization, performance evaluation and optimization algorithms. A good geometric parameterization method must represent the widest design space with the fewest parameters. the shape of the blade is usually characterized by direct geometric shapes, the most famous of which are simple B-spline curves [
10,
11,
12,
13,
14], NURBS (non-uniform rational B-spline) surfaces [
15] and quasi three-dimensional sections defined by Bezier curves [
16]. in order to reduce the computational complexity and avoid invalid blades, it is generally possible to reduce the degree of freedom of design parameters as much as possible, that is, to fix some parameters, such as stacking, bone lines [
12], the thickness of the inlet and outlet edges of the blade, the inclination angle, etc. [
16]. the optimization algorithm must be able to seek the world's largest multi-dimensional, multi-mode, nonlinear and discontinuous design space, avoiding local maxima or noise. Due to robustness and simple theory, evolutionary algorithms (EA) are the most popular, including evolutionary strategies (ES) [
12], genetic algorithms (GA) [
10,
15] and multi-objective genetic algorithms (MOGA) [
11,
12,
17]. Adaptive simulated annealing algorithm [
15] is also an effective method. Another method based on experimental design and agent model coupling is also gradually mature, such as response surface [
18] or artificial neural algorithm [
19]. Bonaiuti and Zangeneh [
18] proposed an optimization strategy, that is, to realize three-dimensional inverse design method, response surface method, multi-objective optimization algorithm and CFD analysis coupling optimization. the parameterization of the blade is realized through a three-dimensional inverse design method, and the dynamic characteristics and performance are controlled by optimizing the parameterized blade, and the optimized blade performance is significantly improved. the coupling of response surface method and inverse three-dimensional design method can also be used to analyze the sensitivity of various parameters to performance, which will provide guidance for design and improvement. Boselli and Zangeneh [
20] proposed a 3D multi-objective multidisciplinary design method that combines a 3D inverse design method and a multi-objective genetic algorithm, and is applied to the design of axial-flow turbine blades. the blade is parameterized by the blade load parameters, span load distribution and maximum thickness, and the sample space is constructed from these few parameters. Huang [
21] uses a modified NSGA-Ⅱ algorithm coupled with a dynamic crowding distance (DCD) to achieve multi-objective optimization of water-jet propellant mixed-flow pumps. the meridian flow channel of the fixed pump uses ten-dimensional inverse design methods to select ten variables of the rim and hub to control the blade load. the optimization goals are hydraulic efficiency and impeller head. the radial basis neural network (RBNN) is used to approximate the objective function with 82 training samples. Local sensitivity analysis shows the impact of key variables on pump performance. the optimized model impeller reaches 92%, and the high efficiency area is wider, and the suction surface speed gradient is smoother.
Bonaiuti [
22] believes that the CFD method and the automatic optimization method are becoming more and more popular, but the traditional design method based on the physical analysis of flow development and the subsequent modification of geometric parameters is still widely used in industrial design because of the characterization of design quality. there are still great difficulties in converting a large number of factors into mathematical parameters. It adopts CFD method for hydrodynamic design of mixed-flow pump, and its purpose is to improve the efficiency and head of the pump in the whole working range. the geometry of the impeller and guide vane is controlled in a parameterized manner, that is, the influence of key parameters on performance is analyzed simultaneously through several parameters and Bezier curves.
in summary, the 3D inverse design method can effectively suppress the secondary flow of the impeller and obtain a hydraulic model with better performance. Parameterizing the blades and flow channels, coupled with optimization algorithms and numerical calculations, can achieve fast and efficient optimization of the impeller. the initial model of the pump is designed using a 3D inverse design method. by parameterizing the geometry of the impeller and guide vane, coupling optimization based on multi-parameters, multi-objectives and optimization algorithms is an efficient and feasible method.
This paper will take the water-jet pump as the research object, and choose the comparison of traditional axial flow blade design method, modern blade ternary design theory, and parameterized 3D inverse design method for the design method of the water-jet pump impeller hydraulic model. An optimized design and optimization strategy for the impeller of water-jet pump based on multi-parameter and multi-object genetic algorithm was constructed, and a set of hydraulic models with better performance was obtained, and the feasibility of the optimized design strategy was verified through experiments. the optimized model will be used for the follow-up visualization test and numerical calculation method of water-jet pump cavitation.
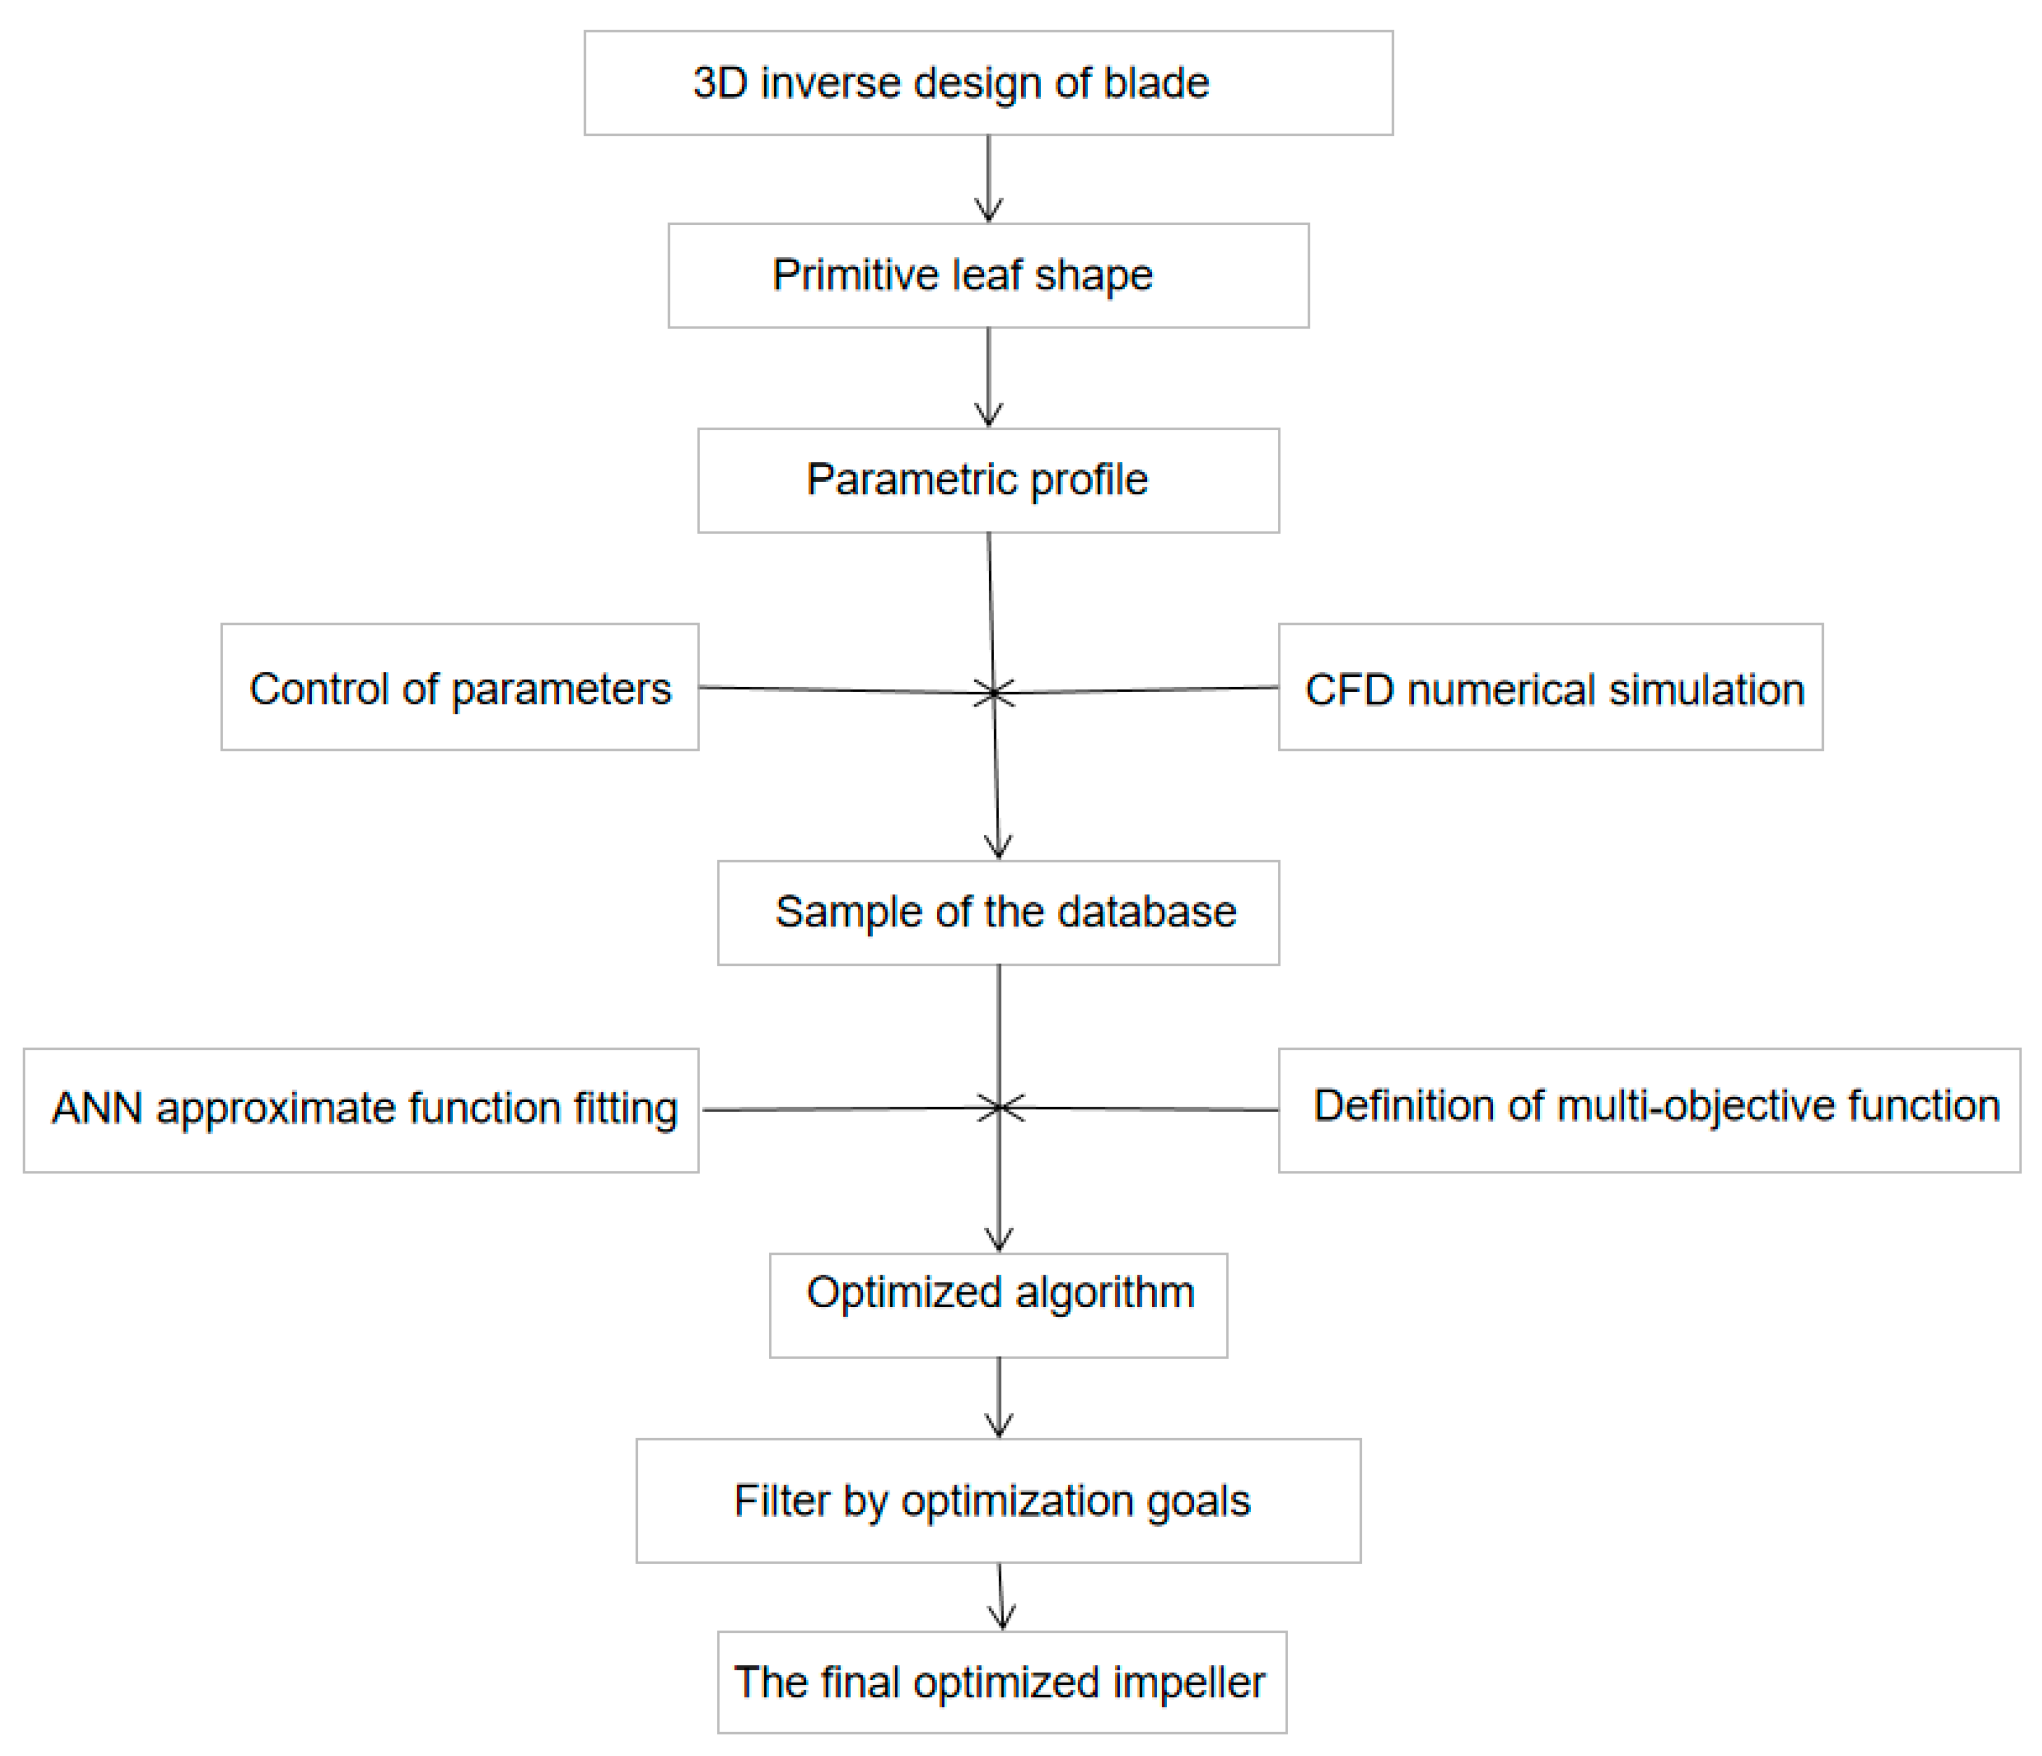
Figure 1.
Water-jet pump hydraulic model design process.
Figure 1.
Water-jet pump hydraulic model design process.
5. Verification of Optimization Results
According to the optimization parameters in
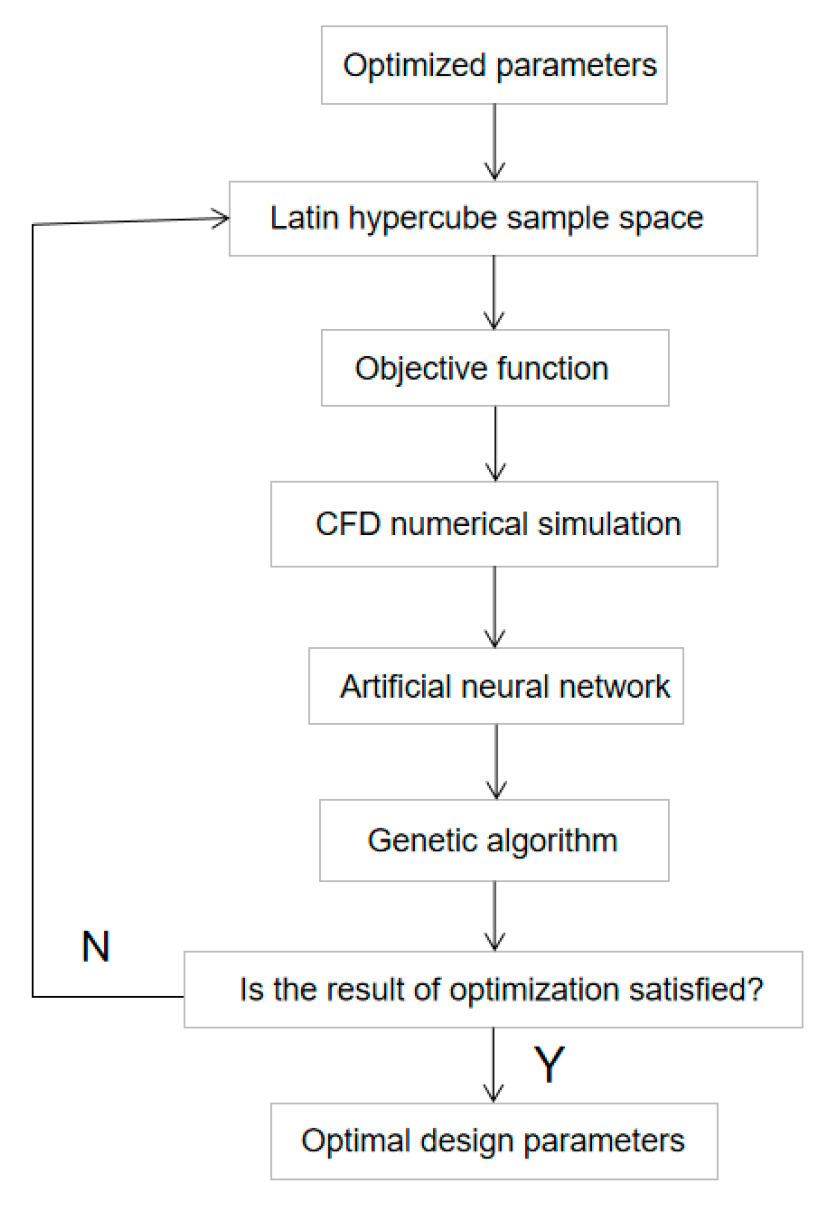
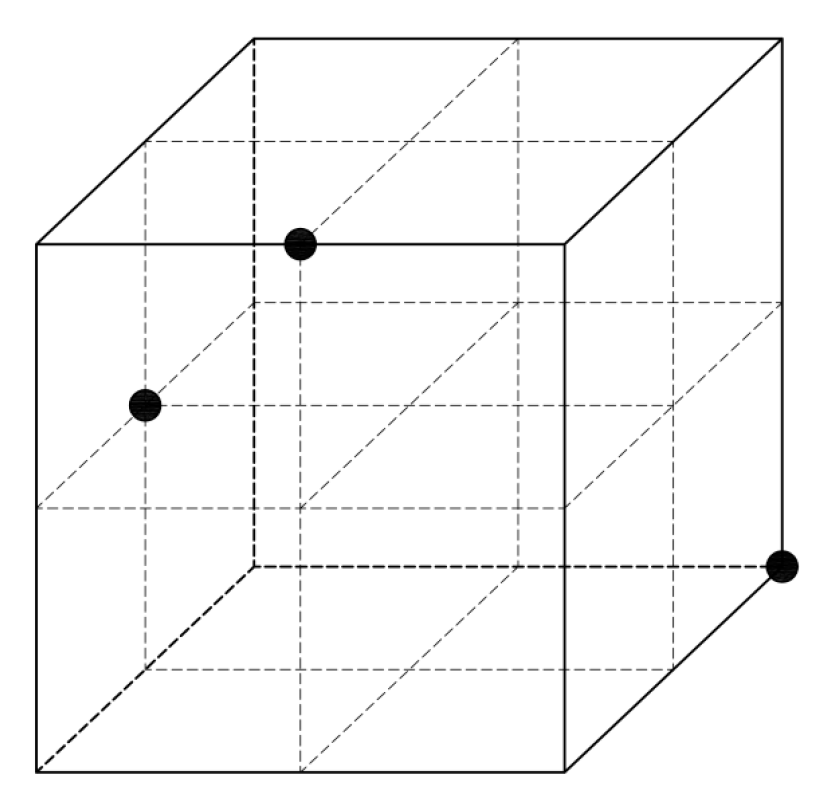
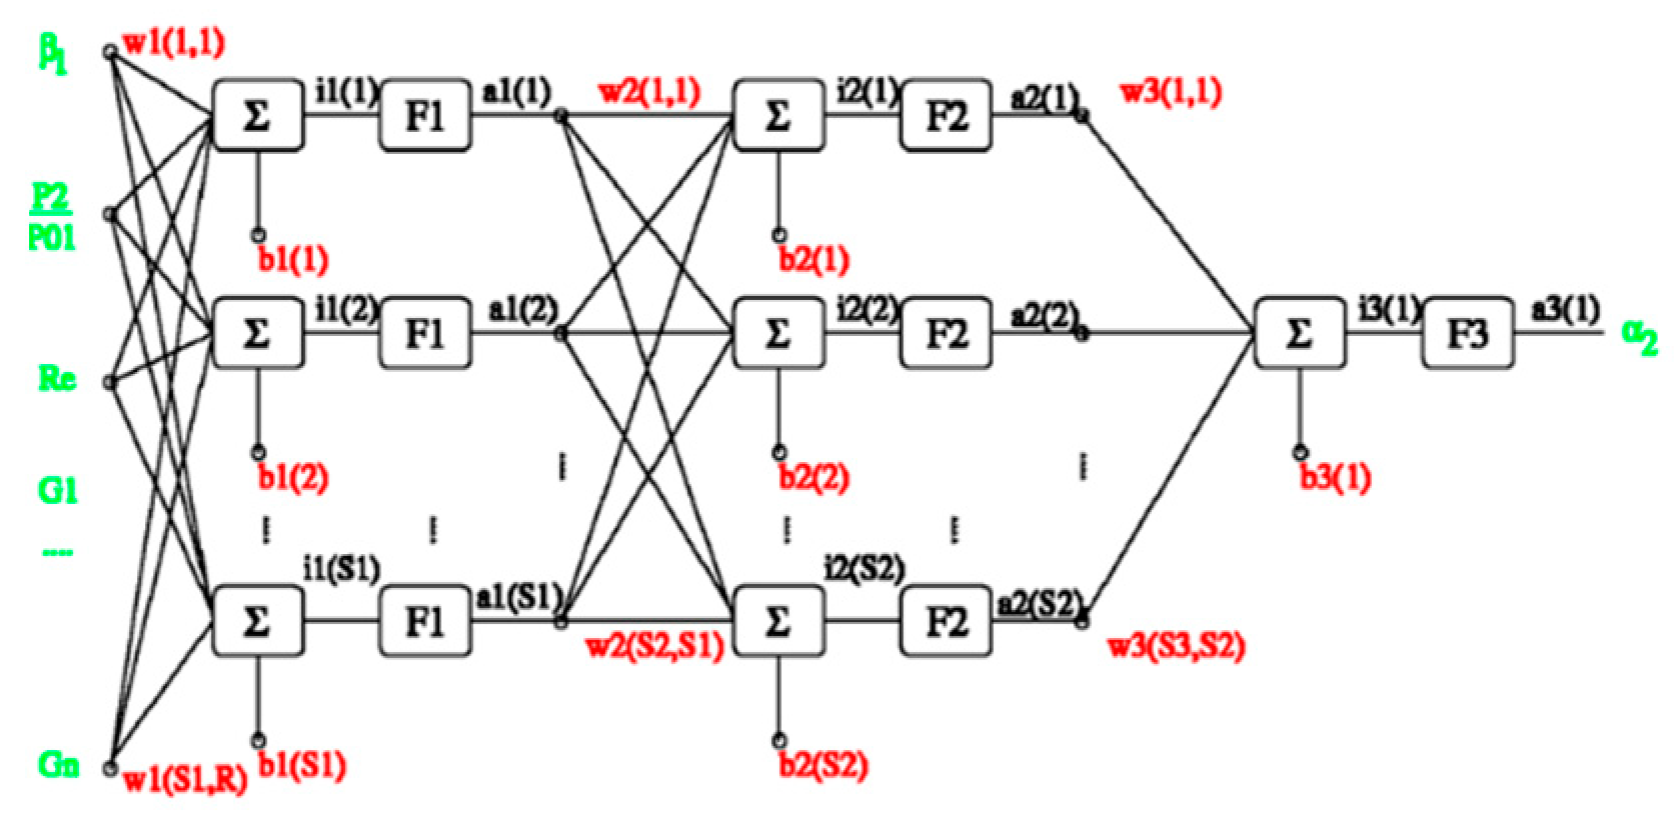
Table 2, Latin hypercube is used to construct the optimization parameter sample space. Numerical calculations are carried on the constructed samples to obtain the optimization target head, efficiency and minimum pressure. the artificial neural network is used to establish an approximation function model between the optimization target and the optimization parameters. Topological structure is 2 layers. NSGA-Ⅱ genetic algorithm is used to optimize the approximate function model. After 10,000 iterative calculations, the optimized blade geometry parameters and performance are finally obtained.
5.1. Comparison of Blade Geometry and Performance between Original Model and Optimized Model
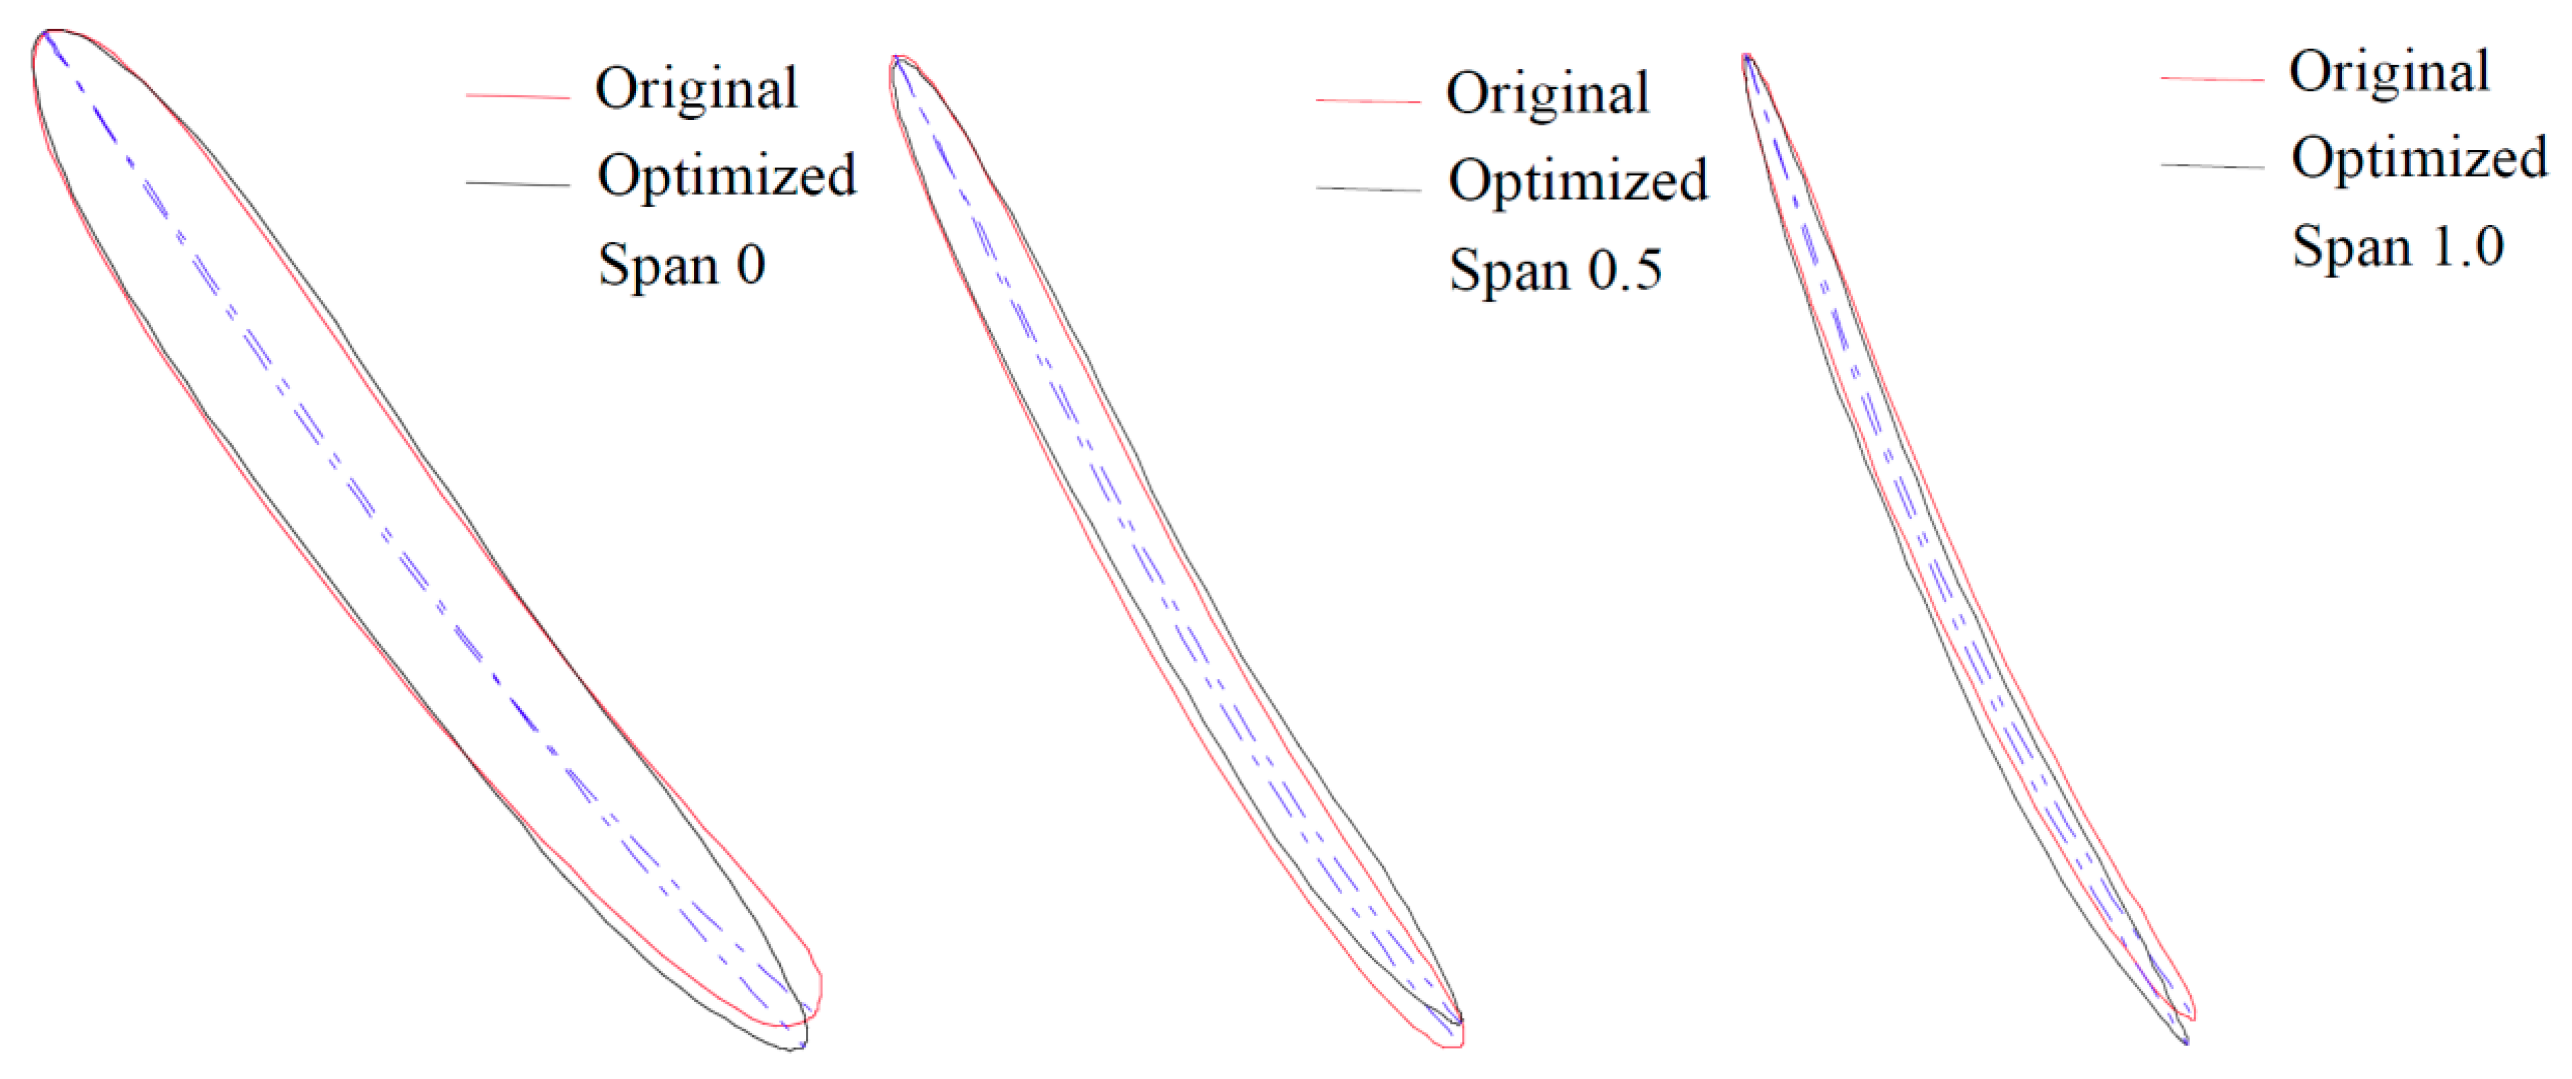
the geometric shapes of the blades of the original model and the optimized model in different directions are shown in
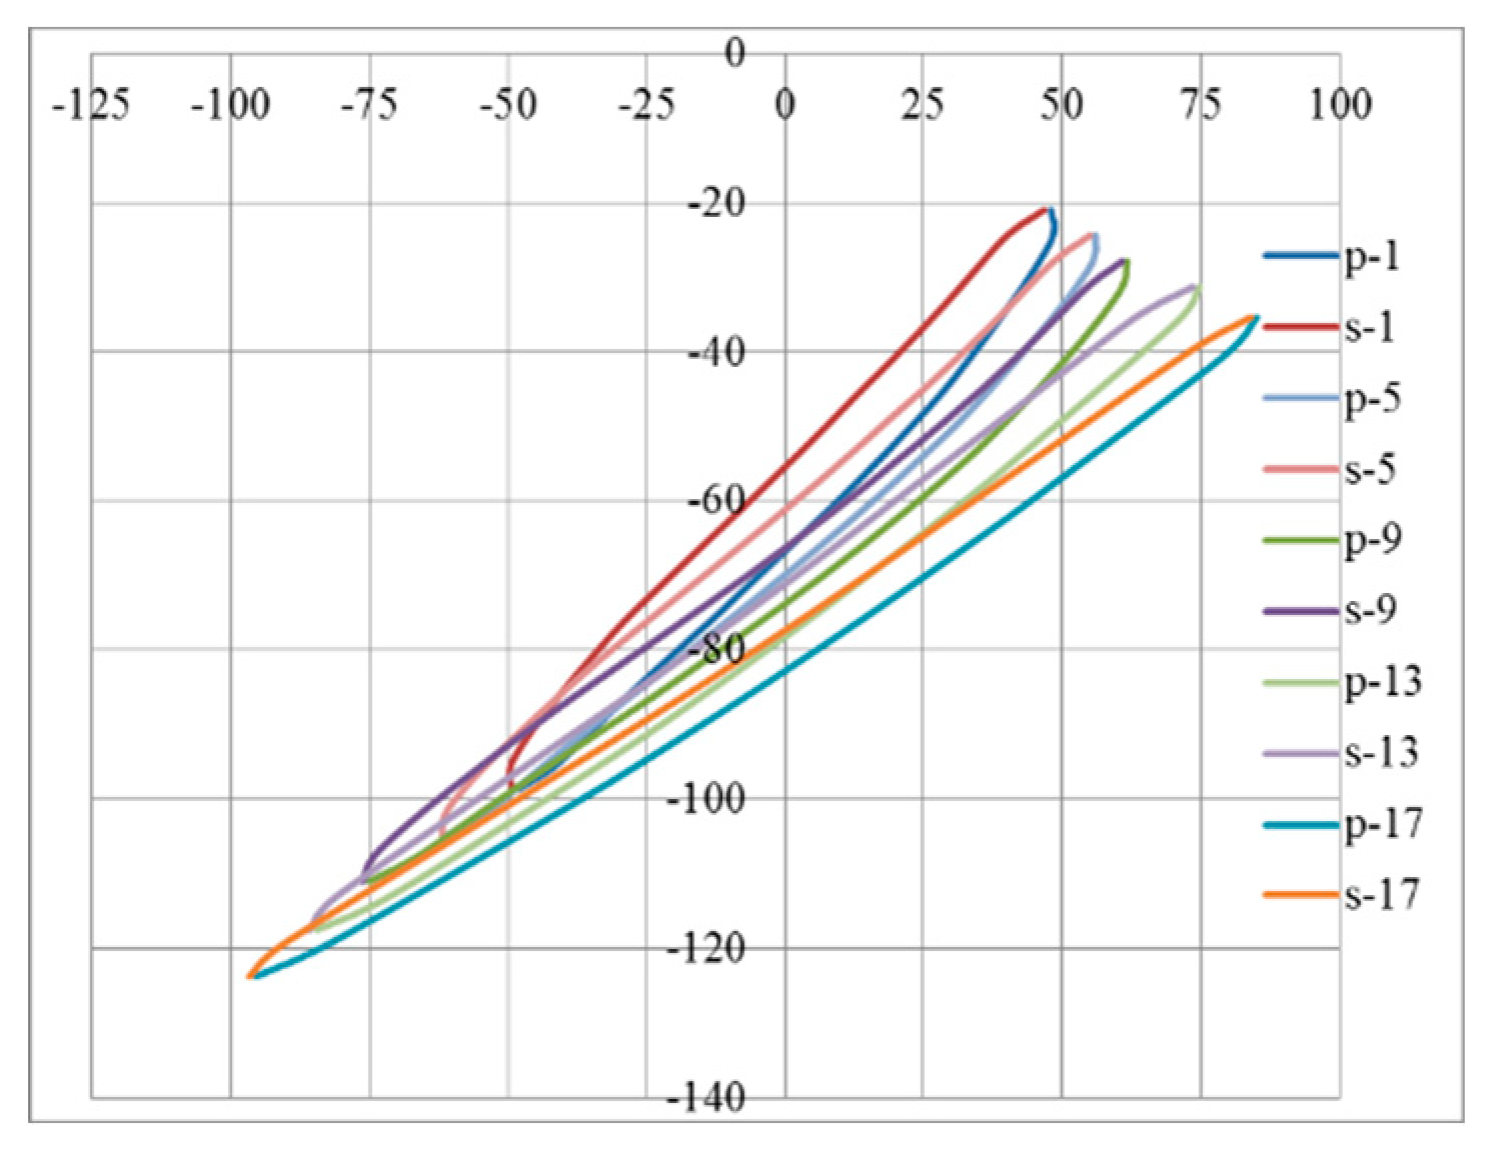
Figure 14. From the figure, it can be found that compared with the original model, the optimized blade shape changes mainly at the trailing edge angle β
2, the stagger angle γ and the stacking laws.
5.1.1. Numerical Simulation Method
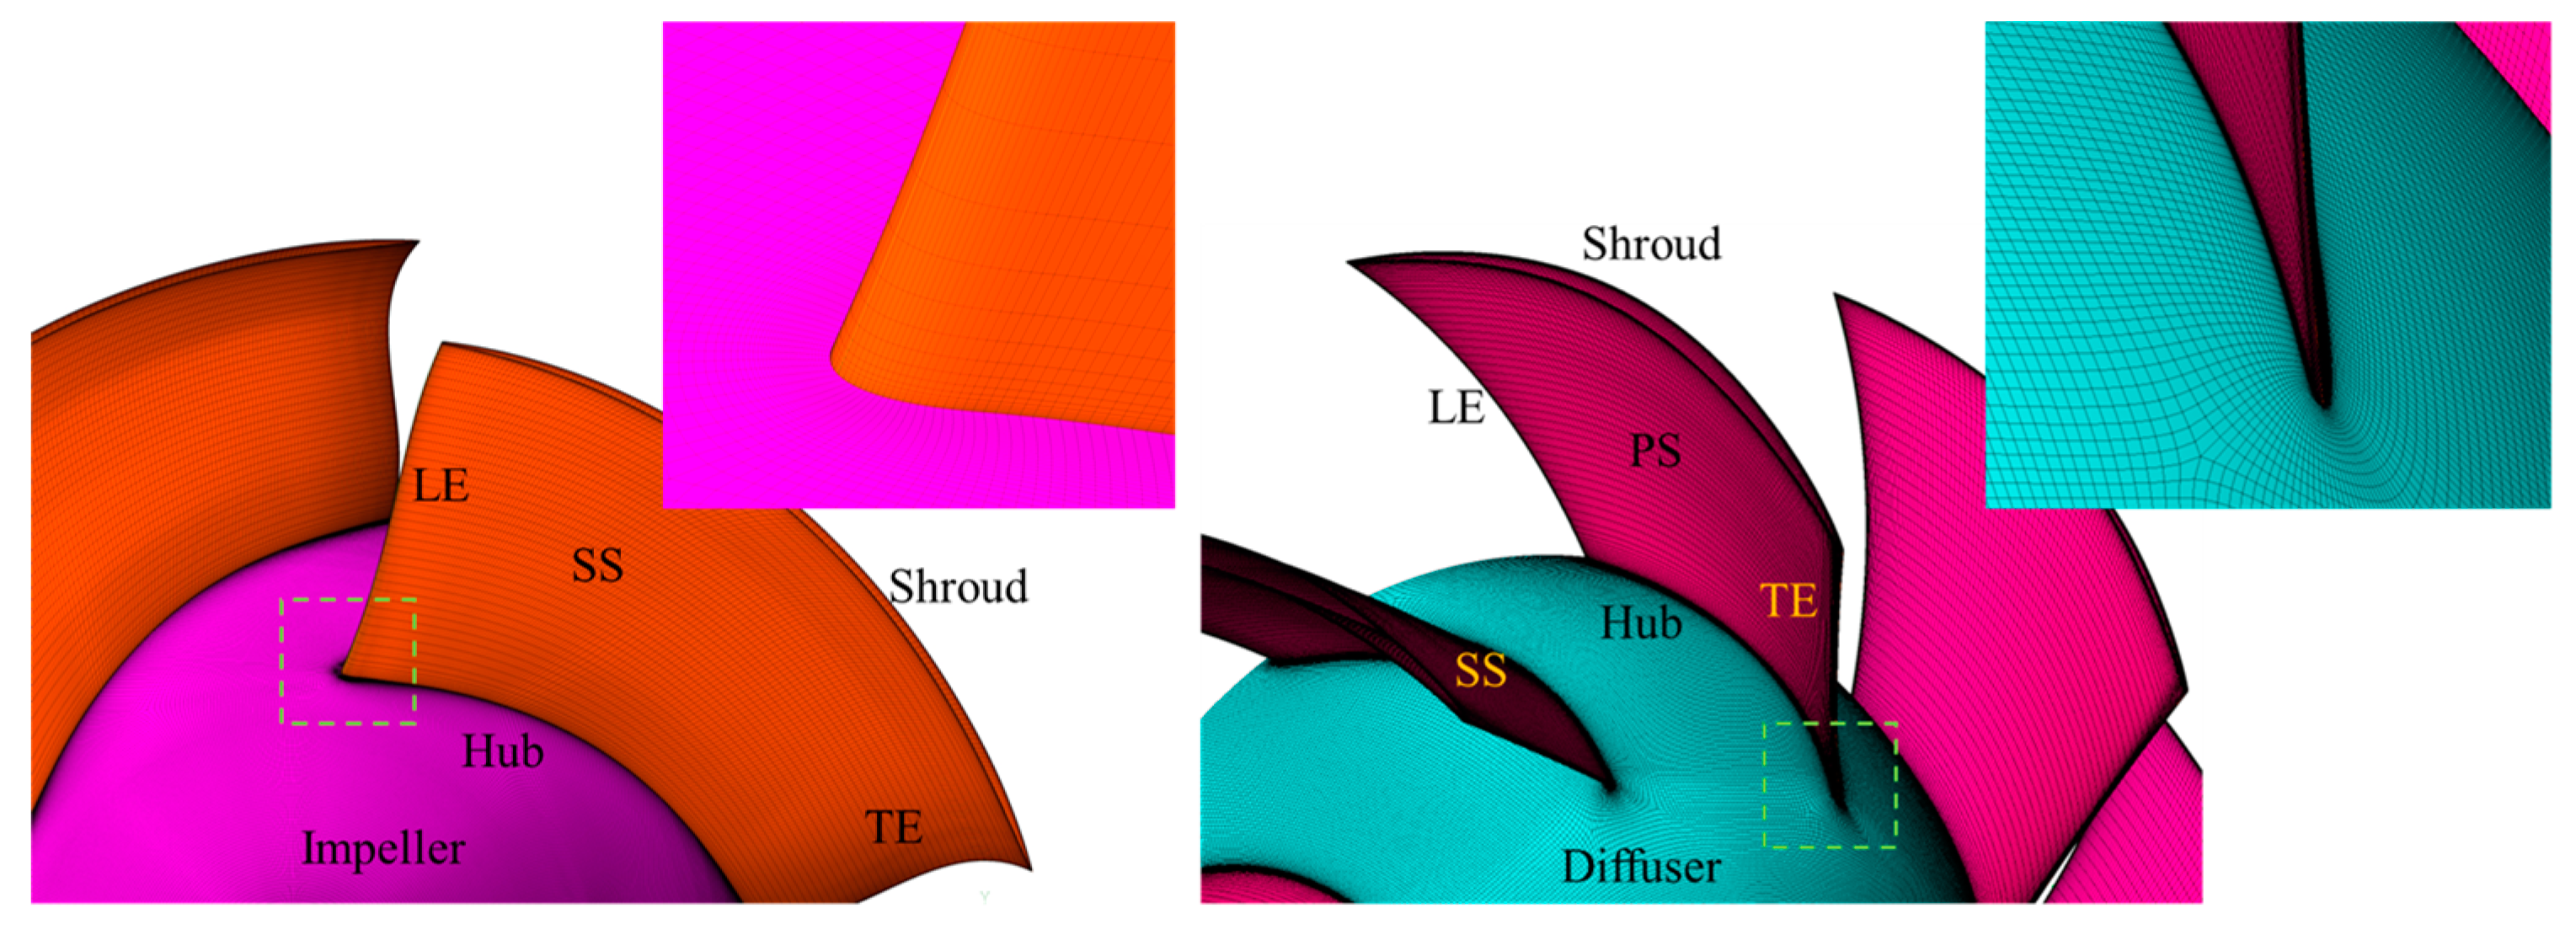
the mesh of the impeller is shown in
Figure 15. the tip clearance of the grid is set to Nomal Distance = 0.3 mm. the mesh of the tip clearance is crucial for accurately predicting the cavitation in the tip clearance. A 25 layers grid is used to divide the tip clearance region to obtain a better flow field. the number of grids of each hydraulic component is: 1.27 million grids in the impeller, 2.04 million grids in the diffuser, 450,000 grids in suction pipe, and 370,000 grids in outpipe. the total grid number is about 4.13 million. the mesh meets with the mesh-independence requirement.
the commercial software ANSYS CFX was used to calculate the internal flow the mixed flow in the pump[
32,
33,
34]. the liquid phase was 25 °C water with a density of 997 kg/m
3 and a kinematic viscosity of 8.899×10
−4 kgm
−1s
−1. When the cavitation occurs, the vapor phase uses 25 °C water vapor, the density is 0.02308 kg/m
3, and the dynamic viscosity is 9.8626×10
−6 kgm
−1s
−1. the convergence residual is set to 10
-5. the inlet boundary condition is pressure inlet and the import turbulence is set to Medium (intensity=5%). the outlet boundary condition is mass outflow. the non-slip wall is used for the solid wall. the impeller domain rotates with a speed of 1450 r/min. the blade and hub are arranged to rotate, and the shroud wall speed is set to Counter rotating wall. the interface between the rotating part and the stationary part is set to the Frozen Rotor interface. High Resolution is selected for the Advection Scheme Option, and the preset iteration step is 3000.
5.1.2. Performance Comparison by CFD
the hydraulic performances of original model and optimized model are shown in
Table 3. the efficiency of the pump automatically optimized by artificial neural network and genetic algorithm reaches 89.28%, which is 1.24% higher than the efficiency of the original hydraulic model. the head of the optimized pump is 13.51 m, which is 0.39 m higher than the original hydraulic model. After the optimization, the efficiency of the impeller reached 96.33%, which is 0.35% higher than the original hydraulic model. the optimized impeller head reached 14.54 m, which is 0.272 m higher than the original hydraulic model. the optimized pump power reached 67.91 kW, an increase of 1.03 kW compared to the original hydraulic model. After optimization, the lowest pressure point on the blade reaches -291232 Pa.
5.2. Comparison of Original Model and Optimized Model Flow Field
Figure 16 shows the meridian pressure distribution of the original model and the optimized model. It can be seen from the figure that the pressure distribution of the original model and the optimized model on the meridian surface is consistent as a whole. That is, along the flow direction, the pressure gradually increases from the inlet to the outlet. Locally, in the area close to the hub on the meridian surface and before the leading edge of the blade, the area of the relatively higher pressure area existing in the original model is larger than the optimized model. This means the optimized impeller will generate greater suction near the blade inlet, which makes the impeller head higher and more powerful. It is consistent with the performance of the impeller of the original and optimized model shown in
Table 3.
Figure 17 shows the meridian velocity distribution of the original model and the optimized model. It can be seen from the figure that the velocity distribution on the meridian surface before and after optimization is slightly different, but not obvious.
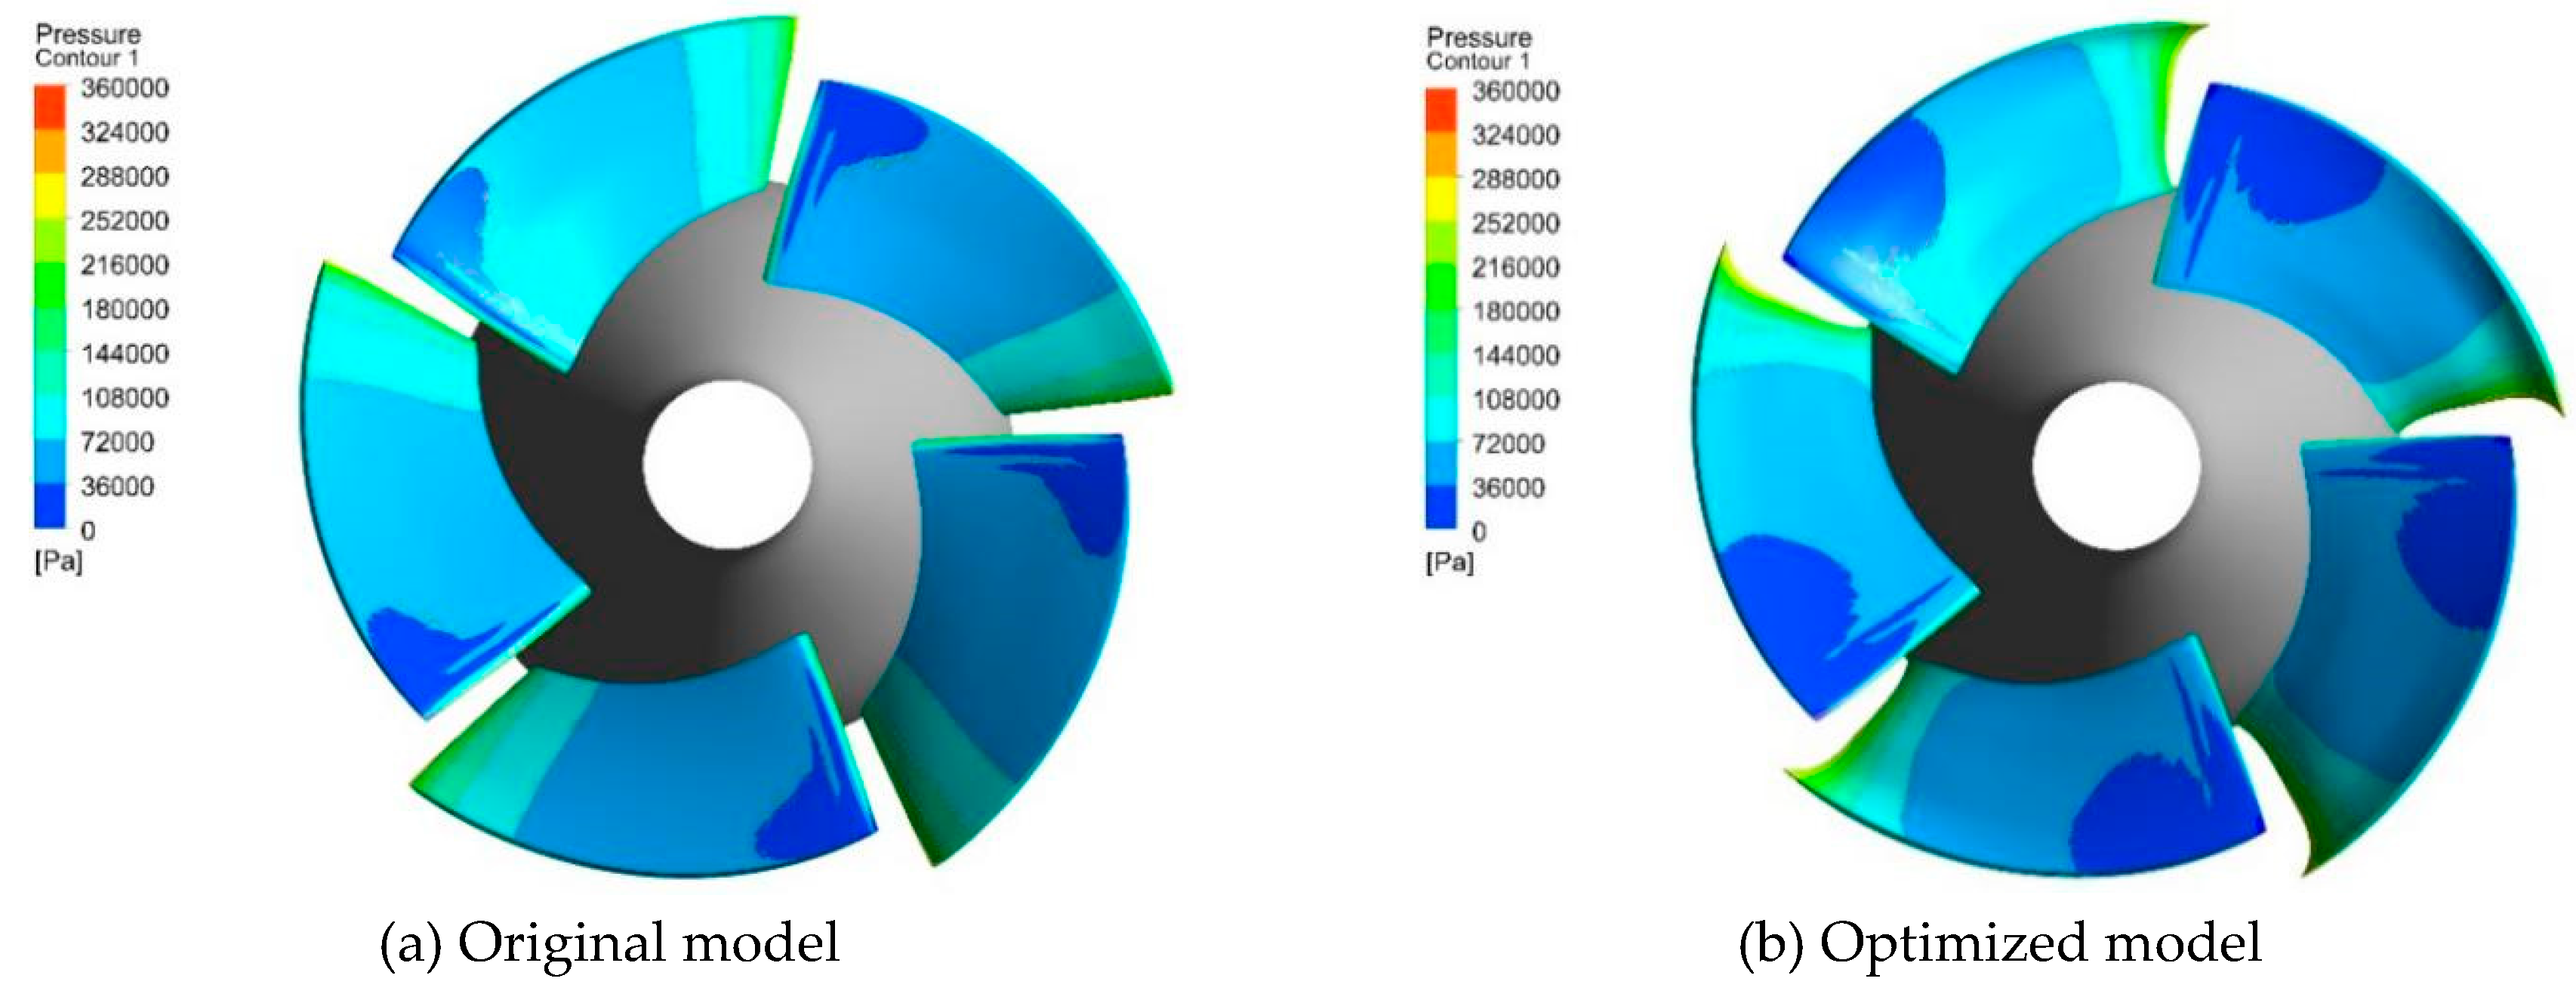
Figure 18 shows the blade pressure distribution of the original model and the optimized model. Along the flow direction, the pressure on the suction surface of the blade increases gradually from the inlet side to the outlet side. Locally, the suction surface of the blade is close to the low-pressure area at the leading edge and rim of the blade. the area of the low-pressure area of the optimized model is larger than that of the original model, and the low-pressure area extends toward the outlet. Usually cavitation will occur and develop in the low-pressure area. From this perspective, the cavitation performance of the optimized impellerhas not been significantly improved.
the difference simply seen from the cloud is too intuitive, and a more detailed comparison of the pressure distribution in different spans is needed.
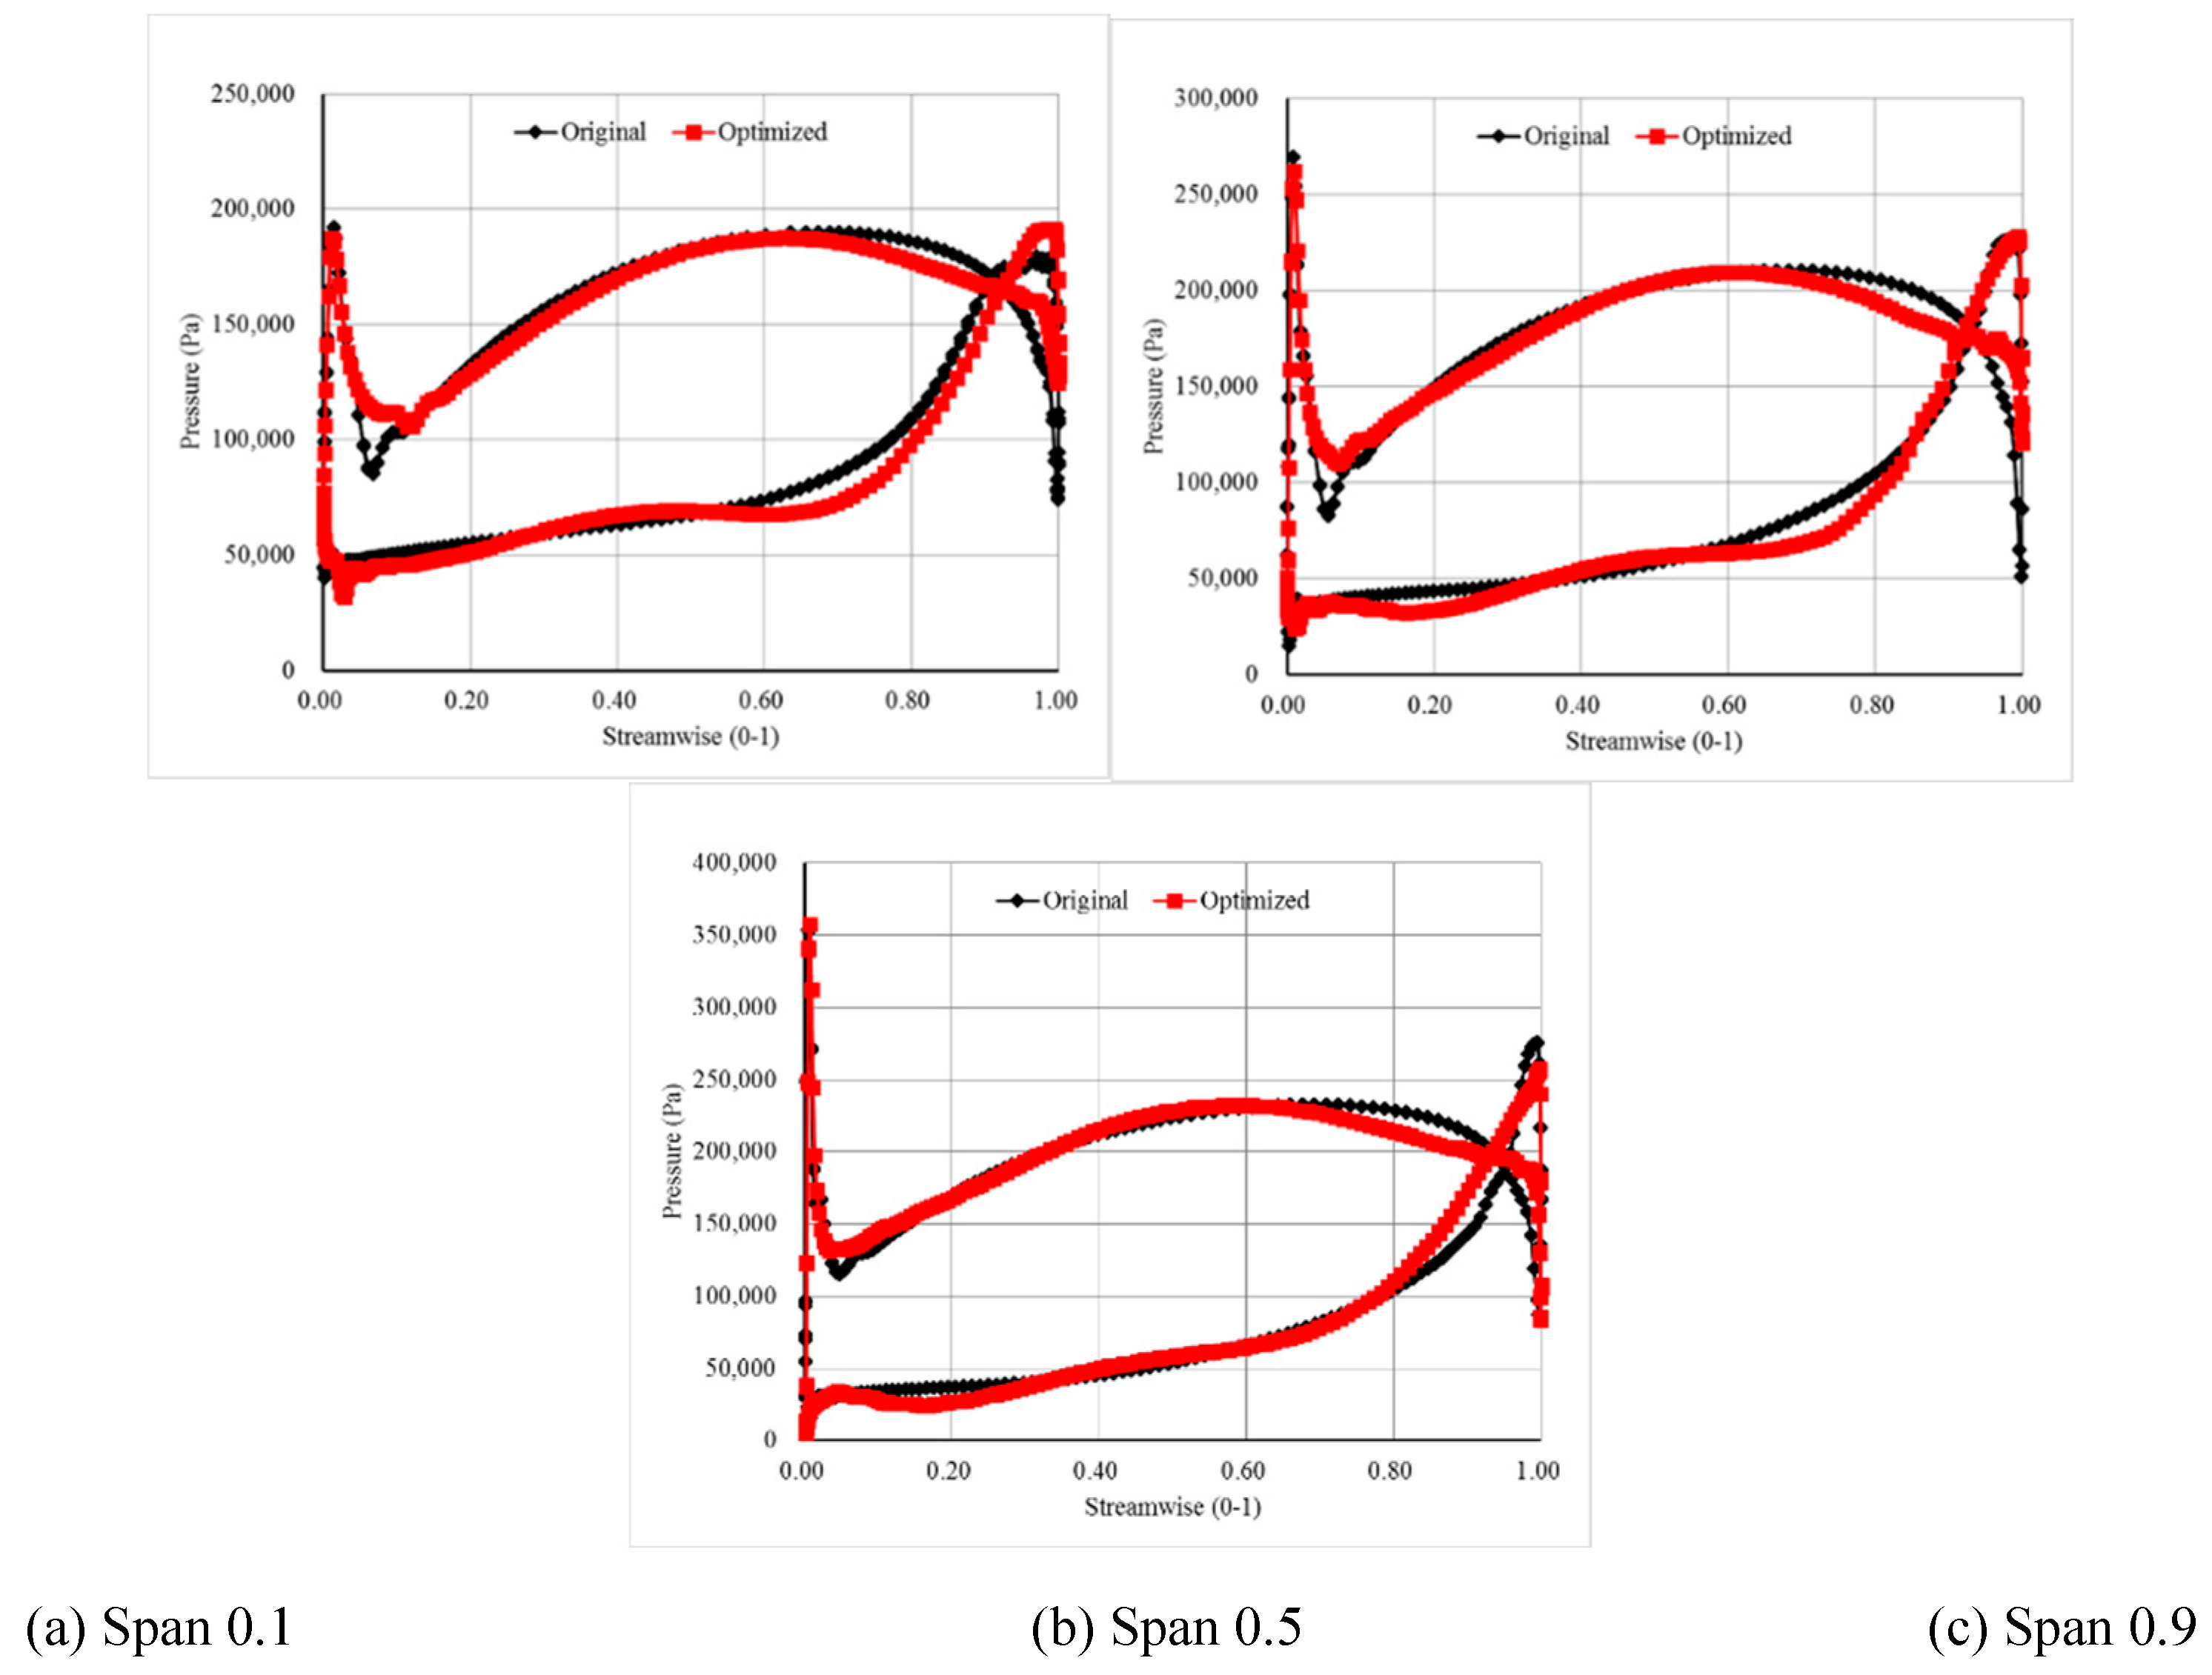
Figure 19 shows the blade pressure distribution in different directions for both the original model and the optimized model.
Figure 19a shows the pressure distribution on the blade at span = 0.1. the abscissa is the dimensionless position in the flow direction of the blade, and the ordinate is the static pressure on the blade. It can be seen that on the pressure surface, the pressure distribution of the optimized model is very close to that of the original model in the streamline direction of 0-0.05. in the streamline direction of 0.05-0.15, the pressure of the optimized model is higher than that of the original model, and the pressure change of the optimized model in this range is relatively slow. in the streamline direction of 0.2-0.4, the pressure of the optimized model is slightly lower than that of the original model, but the difference is not obvious, and presents a very similar upward trend along the flow direction, which keeps close to the streamline direction of 0.6. in the streamline direction of 0.6 ~ 0.9 area, the geometric difference between the optimized model and the original model has a significant impact on the pressure field of the blade. the pressure of the optimized model is significantly smaller than the original model. in the streamline direction of 0.9 ~ 1.0 area, the pressure of the optimized model is obvious. It is significantly higher than the original model. That is, the pressure of the original model drops sharply in this area, forming a larger pressure gradient, while the optimized model leaves a high pressure in this area. therefore, the pressure at the outlet of the blade keeps a higher value, and can make the blade pressure more smooth transition. On the suction surface, the pressure of the optimized model is significantly lower than that of the original model in the 0-0.3 area of the streamline direction, i.e. at the leading edge of the inlet of the blade, which means that in this area where cavitation is most likely to occur, the optimized model is more likely to have cavitation in this area than the original model. in the 0.55-0.9 area of the streamline direction, the pressure distribution of the optimized model suction surface is lower than that of the original model. the overall pressure difference between the suction side and the pressure side of the optimized model is larger than that of the original model. This shows that the optimized blade has better performance and the efficiency of the impeller is higher.
Figure 19b shows the pressure distribution of blade pressure surface and suction surface at span = 0.5 in spanwise direction, and the distribution is similar to that of blade at span = 0.1 in spanwise direction in
Figure 19a. the difference is obvious that the optimized model extends backward in the low-pressure region of the suction surface of the blade with span = 0.5.
Figure 18c shows the pressure distribution of blade pressure surface and suction surface at span = 0.9 in spanwise direction, which is similar to the distribution law of blade in span = 0.1 in spanwise direction in
Figure 19a. the obvious difference is that the pressure distribution of the suction surface of the optimized model is higher than that of the original model in the area of 0.6-0.9 streamline direction. the pressure difference between the suction surface and the pressure surface of the optimized model is smaller than that of the original model. This shows that the work done by the blade in the optimized model in the tip region is smaller than that of the original model, which is beneficial to reduce the speed of the blade tip near the outlet and avoid the flow separation caused by a large speed difference.
5.3. Numerical Calculation and Test Verification of Optimized Model Performance
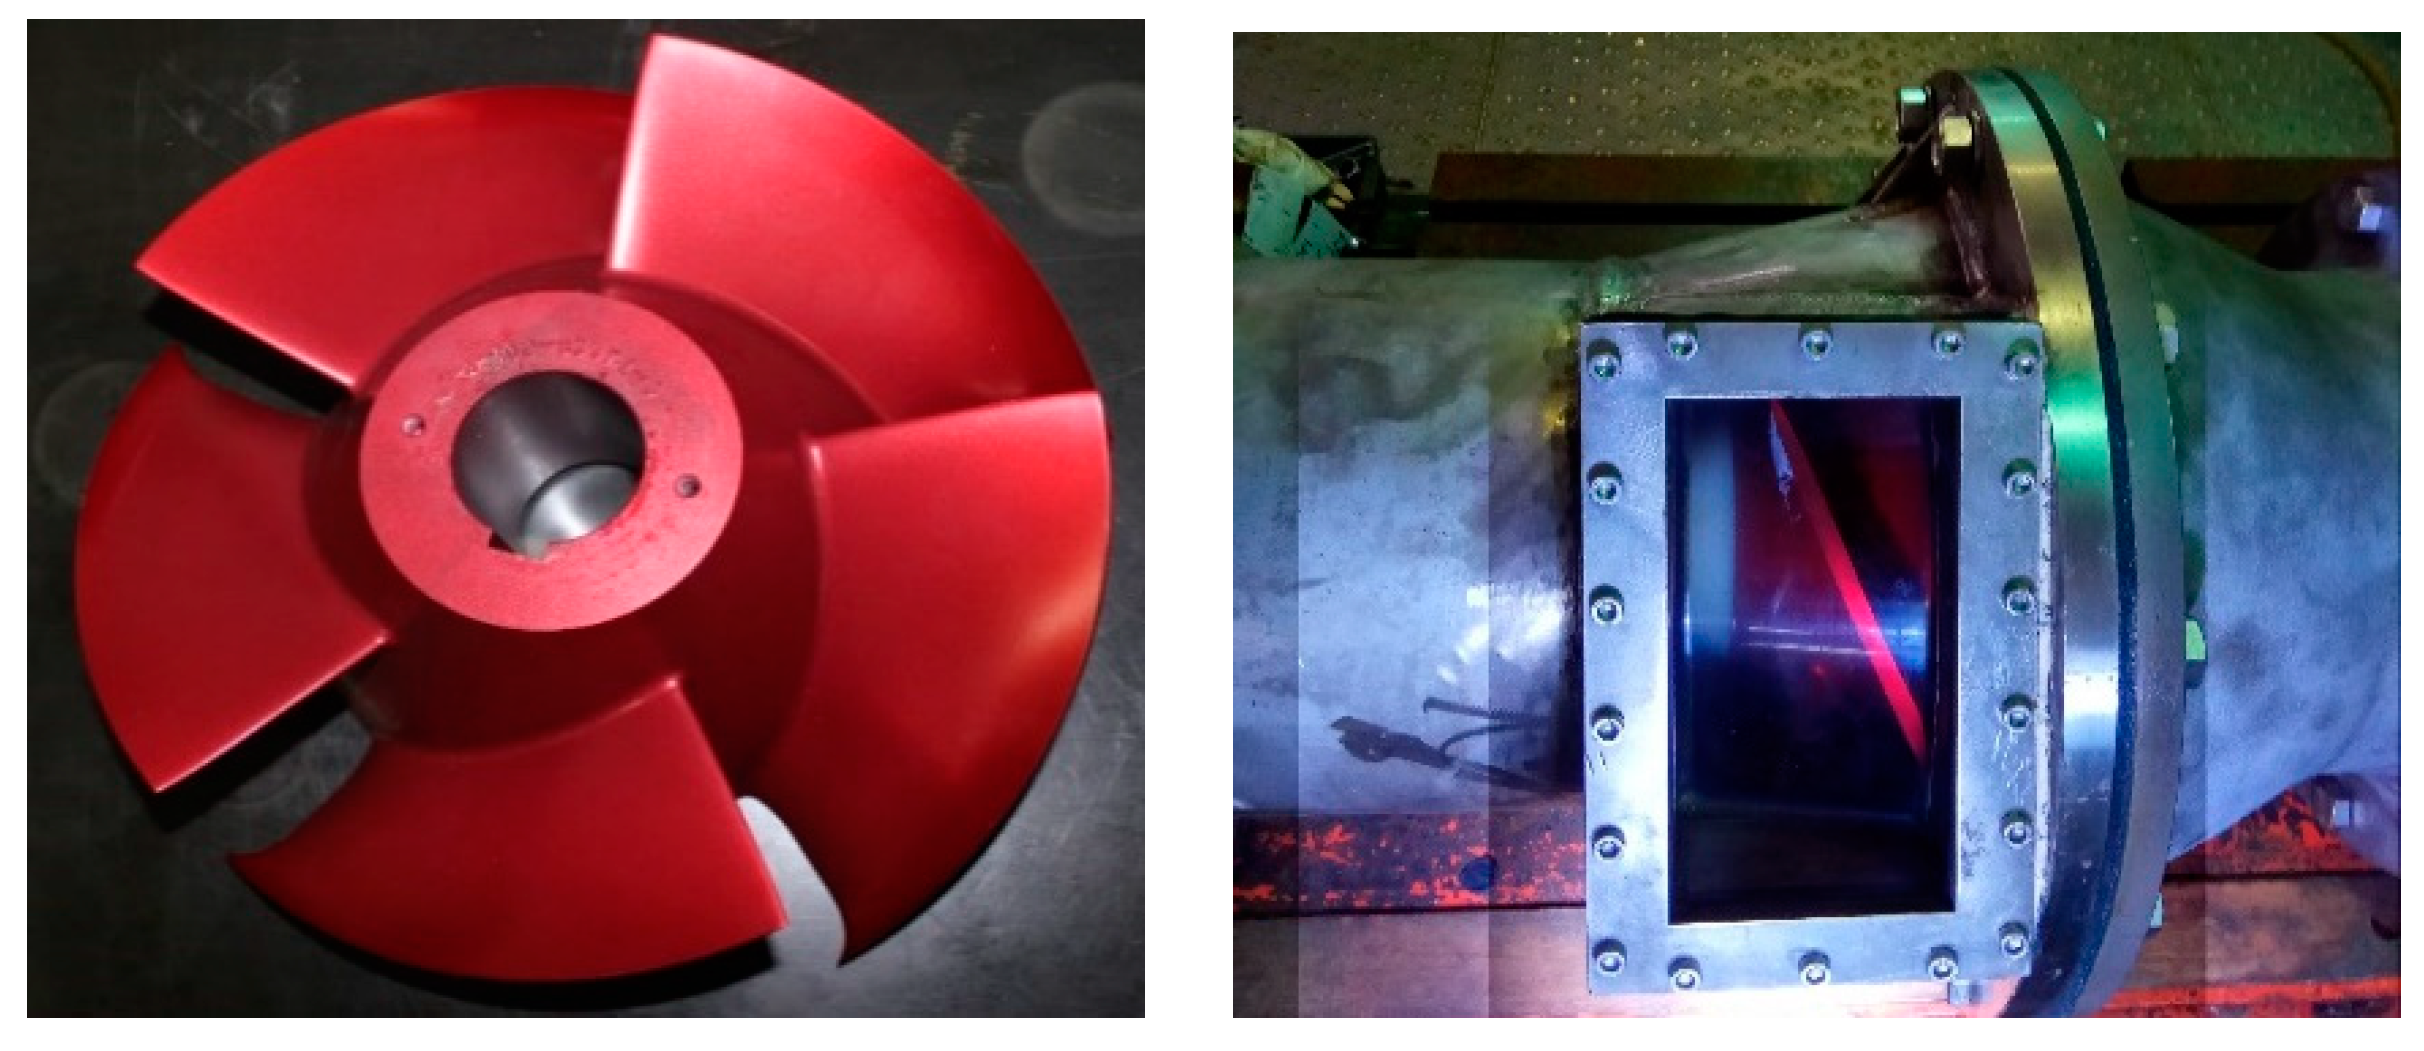
According to the optimized parameters, a three-dimensional prototype of the impeller is manufacture, as shown in
Figure 20. the model pump test was carried out on standard pump performance test bench [
32,
33,
34]
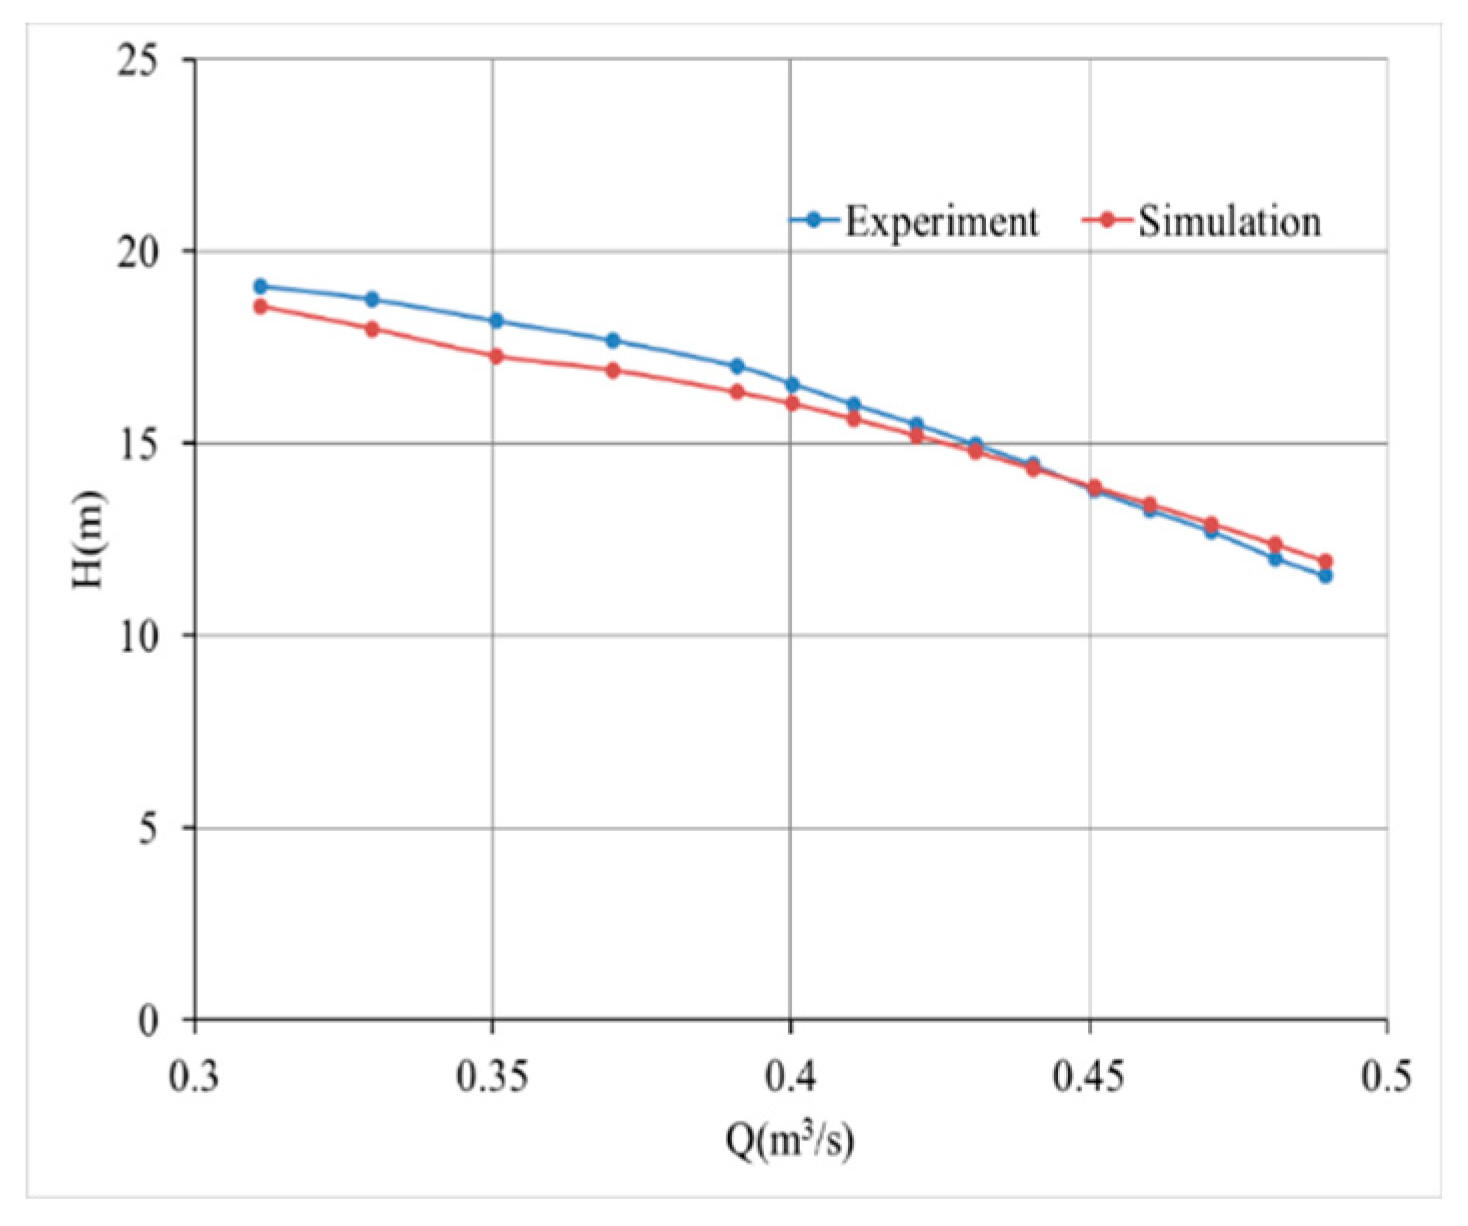
Figure 21 shows the comparison between the numerical results of the flow head curve of the optimized model and the test results. It can be seen from the comparison that the numerical results in the small flow rates are lower than the test results, while the numerical results in the large flow rates are slightly higher than the test results. in the design condition test, the measured head is 13.26 m, and the numerically calculated head is 13.51 m. the head error of numerical calculation and experiment is 1.89%.
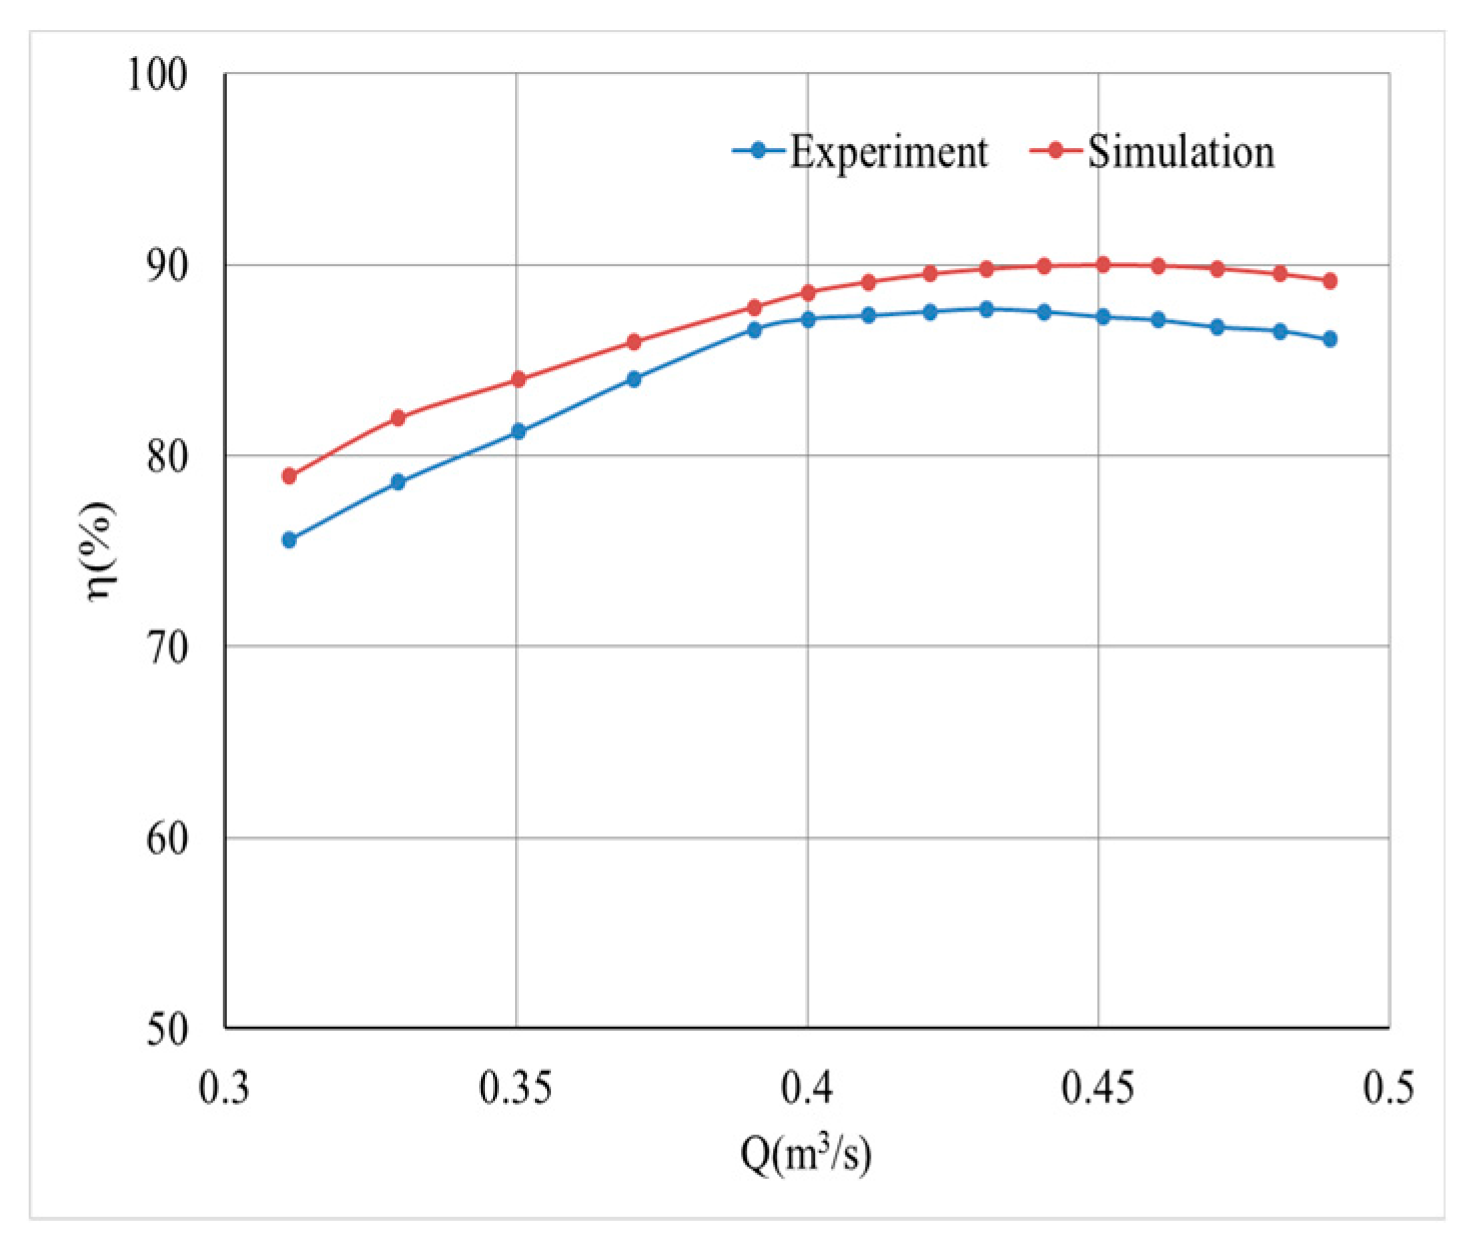
Figure 22 is the comparison between the numerical results and the experimental results of the flow efficiency of the optimized model. the efficiency measured in the test under design condition is 87.1%, while the efficiency calculated by simulation is 89.28%. the efficiency error of numerical calculation and experiment is 2.5%. From the comparison of experimental results and numerical calculations, it can be known that the optimization method is feasible and a better hydraulic model is obtained.
5.4. Cavitation Performance Verification
the basic equation of pump cavitation can be constructed[
33,
34] as Equation (3).
Where, pv is saturated vapour pressure, Pa; pK is pressure at K point near leading edge, Pa; pc is pressure at suction fluid surface, Pa; vc is velocity at suction fluid surface, m/s; zc is the height at fluid surface, m; zK is the height at K point, m; hc-k is the hydraulic loss of c-k, m; v1 is absolute speed, m/s; w1 is relative speed, m/s.
the items in the square brackets on the left are determined by the device, representing the energy of the liquid at the pump inlet minus the energy that is rich in overcoming the head of the vaporization pressure. This is called the available Net Positive Suction Head (NPSHa). the defined equation is as follows,
According to Equation (4), it is possible to derive the condition that the pump has a critical cavitation state, pK = pV,NPSHa = NPSHr. NPSHa can be calculated by the follow Equation (7)
in the process of cavitation development, the head decreases with the dropping of NPSHa until the head curve breaking, so NPSHa corresponds to different inlet total pressure and cavitation generation region and state. Usually when the head drops to 3%, the corresponding NPSHa is considered as the pump required NPSHr. This condition is defined as the critical cavitation condition. At this state, NPSHr = NPSHa = NPSHc, NPSHc is defined as critical Net Positive Suction Head.
Figure 23 displays cavitation performance comparison between calculated value and test results. It can be seen from the figure that measured head first presents an approximate horizontal state with the decrease of NPSHa of the device. When the cavitation curve of the pump approaches the first critical cavitation point or approaches the fractured cavitation state, the head rises briefly with the further decrease of NPSHa of the device, When the cavitation curve of the pump approaches the first critical cavitation point or the fractured cavitation state, with the further reduction of the NPSH of the device, the head of the pump rises briefly, and then increases with the NPSH of the device. As the volume decreases, the head begins to drop sharply, which means that the cavitation in the pump begins to have a significant impact on the performance of the pump, and it enters a state of fractured cavitation. This type of pump fracture cavitation characteristic curve belongs to E-type cavitation curve. the definition and explanation of this type are detailed in section 5.52 of pump cavitation foundation published by Pan [
2]. in the book, it is pointed out that the increase of head in the first critical cavitation point area is due to the increase of head caused by cavitation in the blade. With the decrease of NPSHa, the cavitation performance curve obtained by numerical calculation keeps the approximate horizontal state of head first, without obvious fluctuation. With the further reduction of NPSHa, the head drops slowly when approaching the state of fracture cavitation, and starts to drop sharply when entering the state of critical cavitation. the fracture cavitation type of this pump belongs to B-type cavitation curve. the critical NPSHr of the pump can be determined according to the 3% drop of the head. From the cavitation performance curve in the figure, the critical NPSH measured by the test is 7.58 m, and the critical NPSH calculated by the numerical value is 7.36 m. the critical NPSHr measured by the experiment is 2.99% higher than that calculated by the numerical method.
5.5. Numerical Calculation of Cavitation Flow in the Evolution of Cavitation
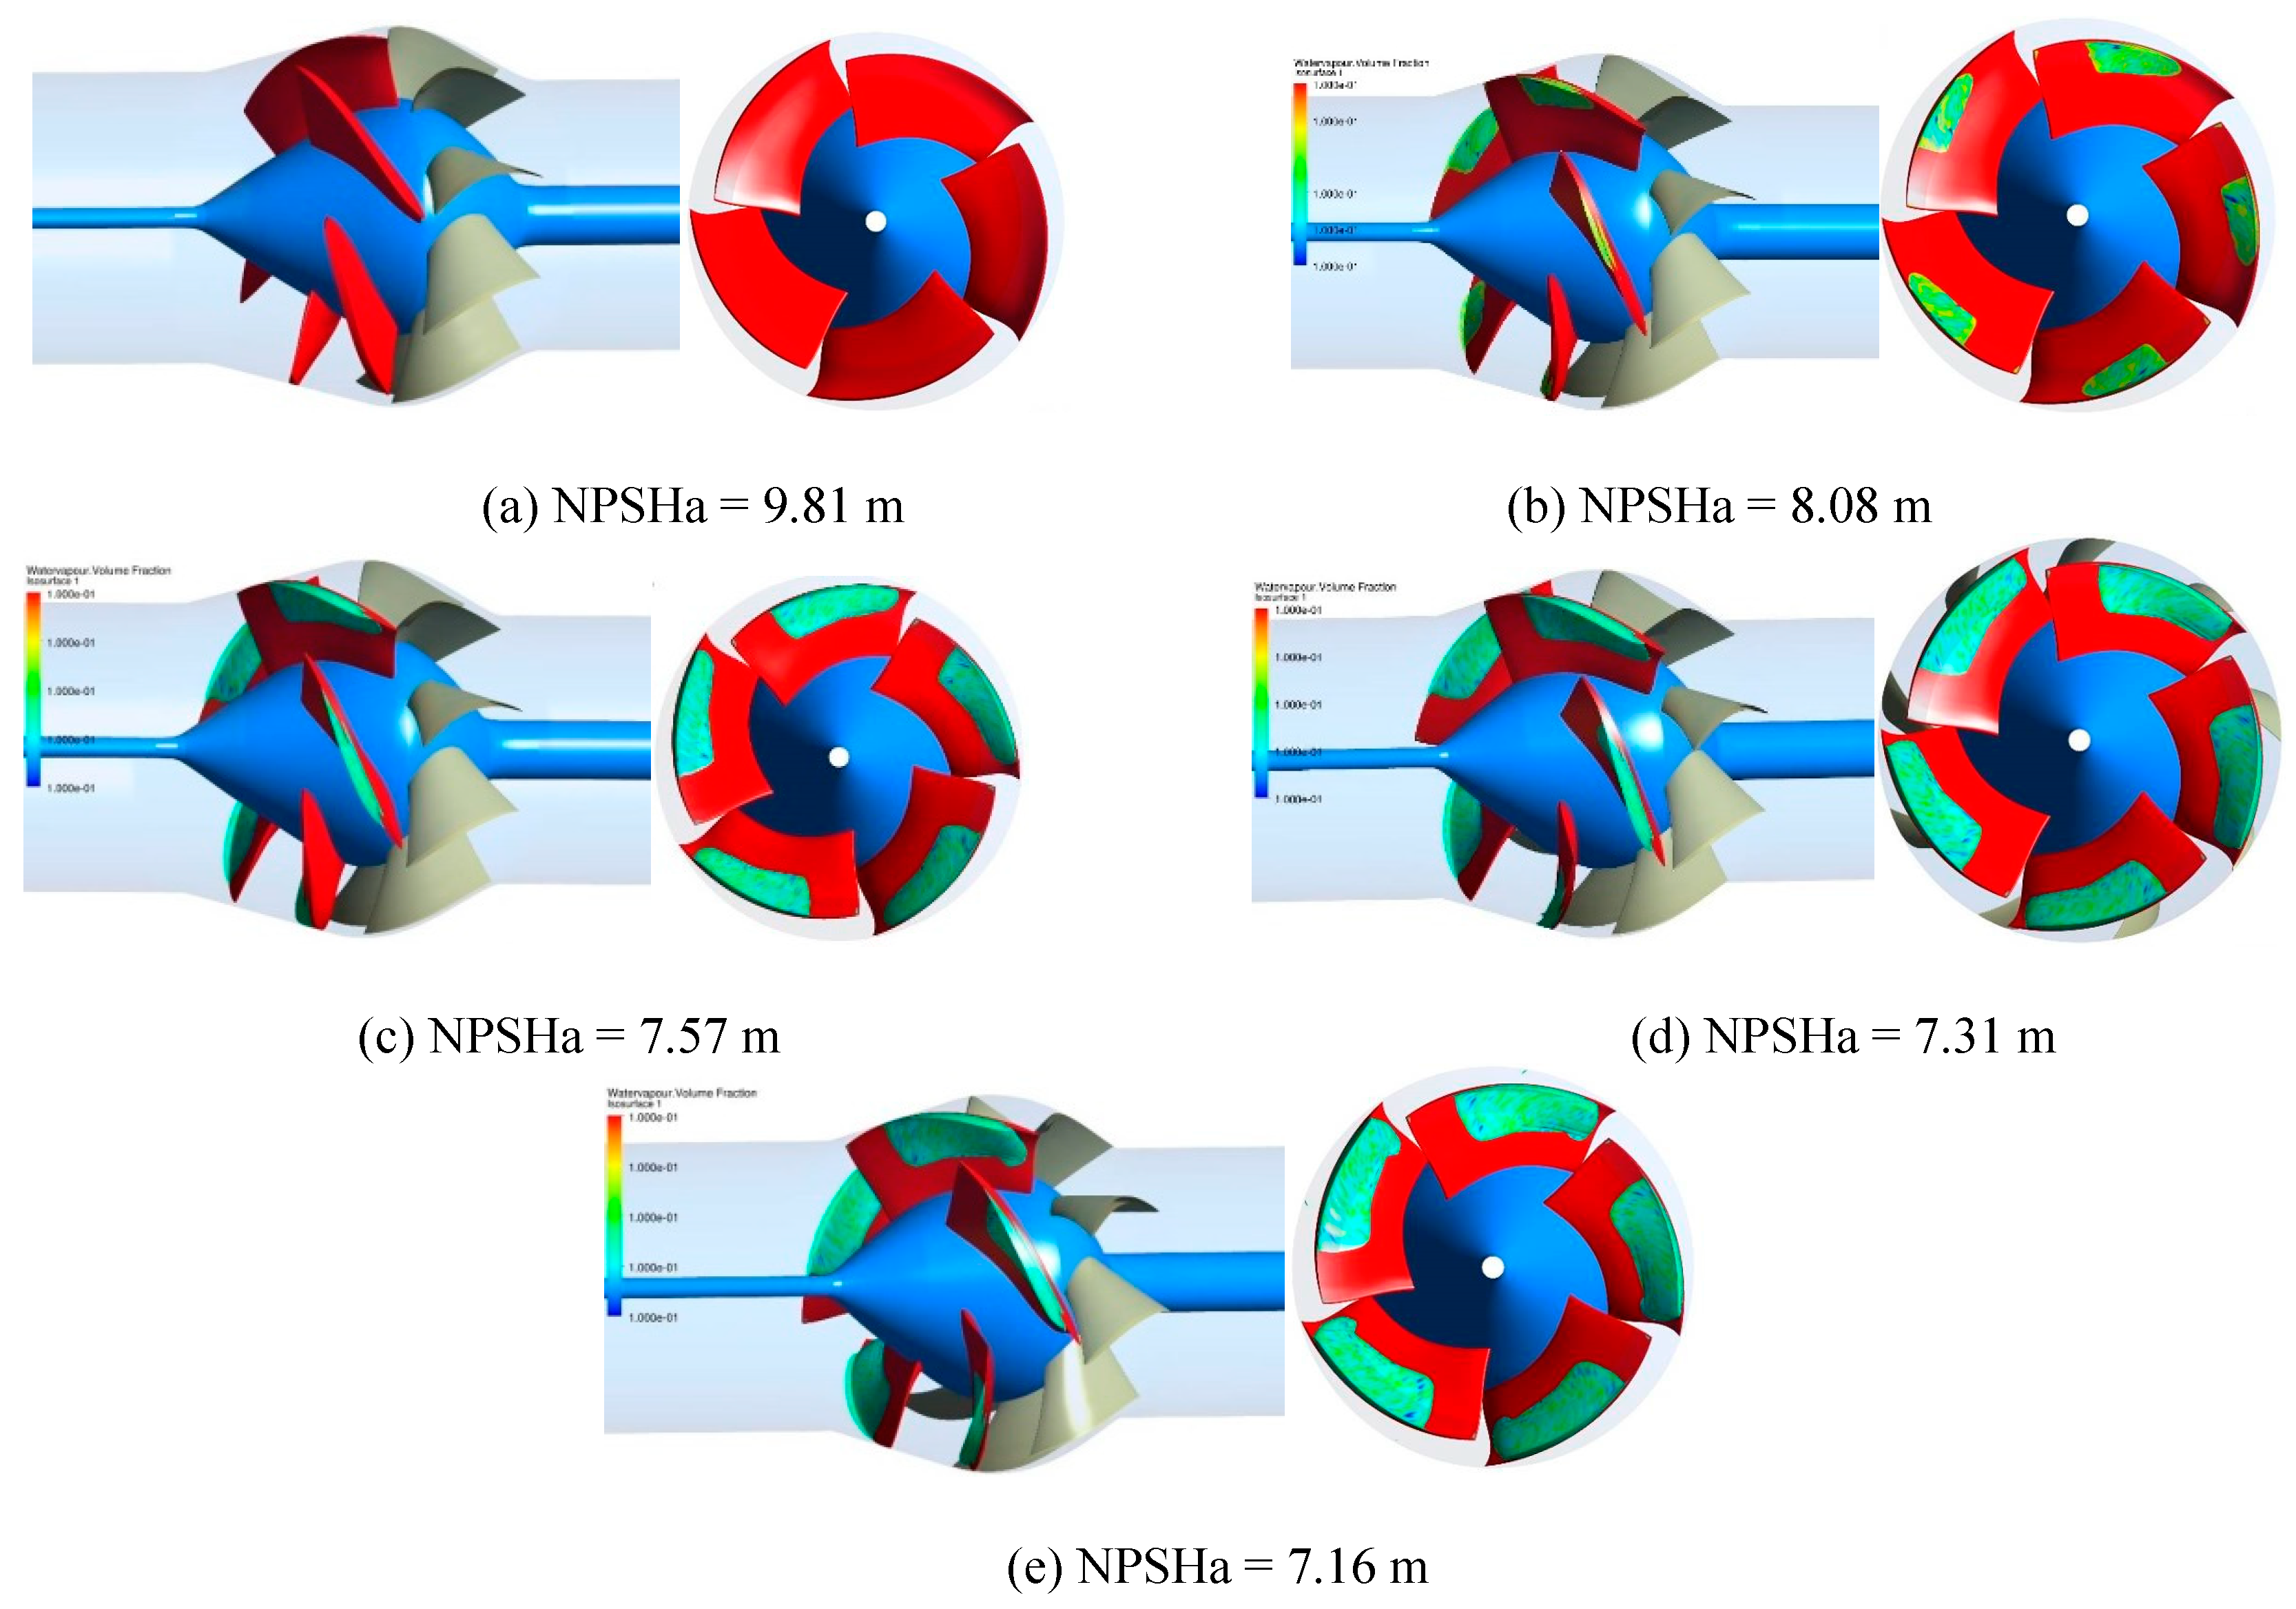
the conditions of cavitation flow structure comparison between numerical calculation and experiment are shown in
Figure 24. the selected operating conditions are the key operating points in the development of the cavitation process.
Figure 24 shows the cavitation isosurface with a vapor volume fraction of 0.1 during the evolution of cavitation. It can be seen that at the initial stage, when NPSHa = 9.81 m, the inlet pressure of the pump is high and the pressure inside the pump is high. there is no cavitation in the impeller flow passage and the blade surface. With the decrease of the inlet pressure, when NPSHa = 8.08 m, cavitation appears in local region, where is about 0.7~1.0 span at the blade suction surface near the tip, and is about 0.3~0.6 chord at the blade tip. From the top view, there is the elongate cavitation zone adjacent to the suction surface and the tip of the blade. With the inlet pressure is further reduced, when NPSHa = 7.57 m, it can be found that cavitation has developed to a certain level, and it begins to occupy a part of the suction surface of the blade, mainly distributed in about 0.6~1.0 span, and in about 0.25~0.85 chord. Compared with NPSHa = 8.08 m, the cavitation area is larger, cavitation region extends to the leading edge, extends to the trailing edge and extends to the hub. From the view of the axial plane, the cavitation zone in the tip region occupies more chord length region, and the cavitation attached to the blade suction surface is thicker. That is, the cavitation extends toward the blade flow passage. When the cavitation develops to a critical cavitation condition, the pump performance begins to decrease. At this moment, NPSHa = 7.31 m. the area covered by the sheet cavitation has approached the trailing edge of the blade, and approaches the 0.5 span direction. But the sheet cavitation does not extend forward to leading edge region. From the view of the axial plane, the cavitation area in the tip region increases, and the cavitation is further thickened. As the inlet pressure is further reduced, when NPSHa = 7.16 m, the cavitation phenomenon is serious, and the cavitation area has covered the trailing edge of the blade, which seriously affects the work of the blade, which directly leads to a steep drop in the performance of the pump.
6. Conclusions
in order to obtain a set of high-performance water-jet pumps, this paper mainly focuses on the mixed flow impeller design of water-jet pumps based on multi-parameter and multi-objective genetic algorithm. the main work and conclusions are as follows:
(1) Regarding the water-jet pump, an initial model is designed by the parametric 3D inverse design method. then a multi-parameter and multi-objective genetic algorithm optimization design strategy for the impeller water-jet is constructed, and a water-jet pump with better performance is designed.
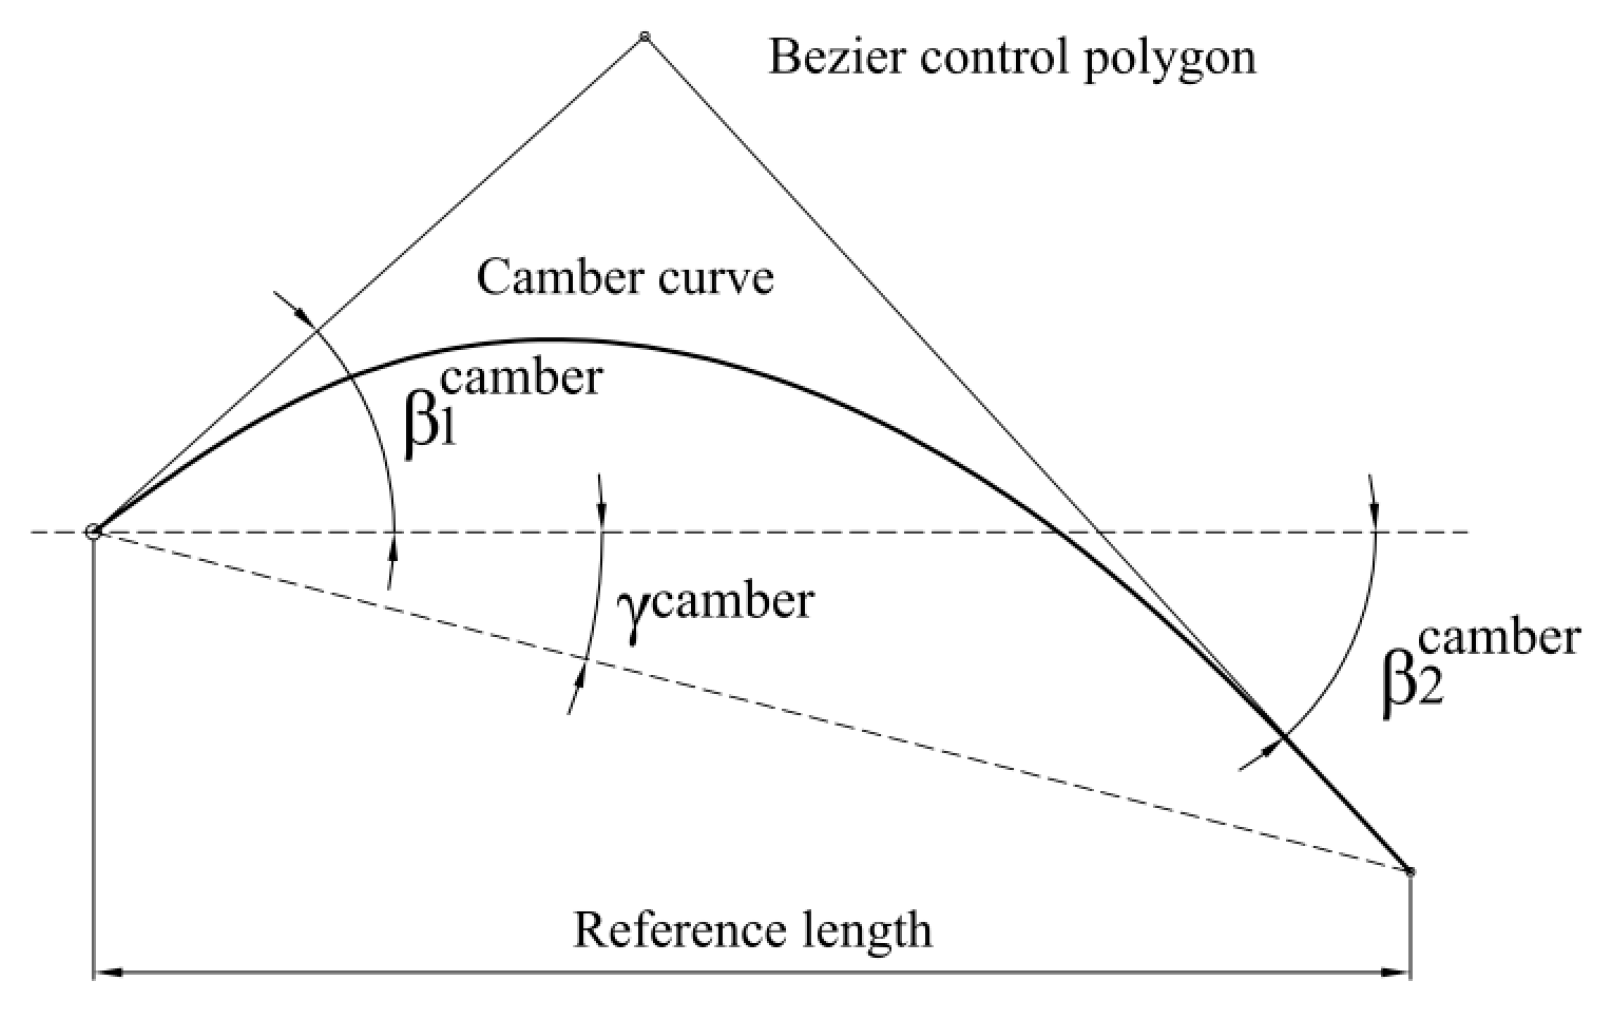
(2) in the parameterized optimization, the shape of the blade is mainly controlled to achieve the flow control to meet the performance requirements. the cross-section control parameters of each layer of the blade are staggered angle γ, leading edge angle β 1, trailing edge angle β 2 and lean angle β. there are 4 parameters and 16 variables in total. the Latin hypercube is used to construct the sample space of optimization parameters. Numerical calculations are carried out for the constructed samples to obtain the optimization target head, efficiency and minimum pressure point of the design point of the pump. the approximate function model between the optimization target and the optimization parameters is established by the artificial neural network. NSGA - Ⅱ genetic algorithm is used to optimize the approximate function model. Finally, the optimized blade geometry and performance are obtained.
(3) the efficiency of the optimized pump is 89.28%, which is 1.24% higher than that of the original model. the head of the optimized pump is 13.51 m, which is 0.39 m higher than that of the original model. From the comparison of experimental results and numerical calculations, it can be known that the optimization method is feasible and a better hydraulic model is obtained.
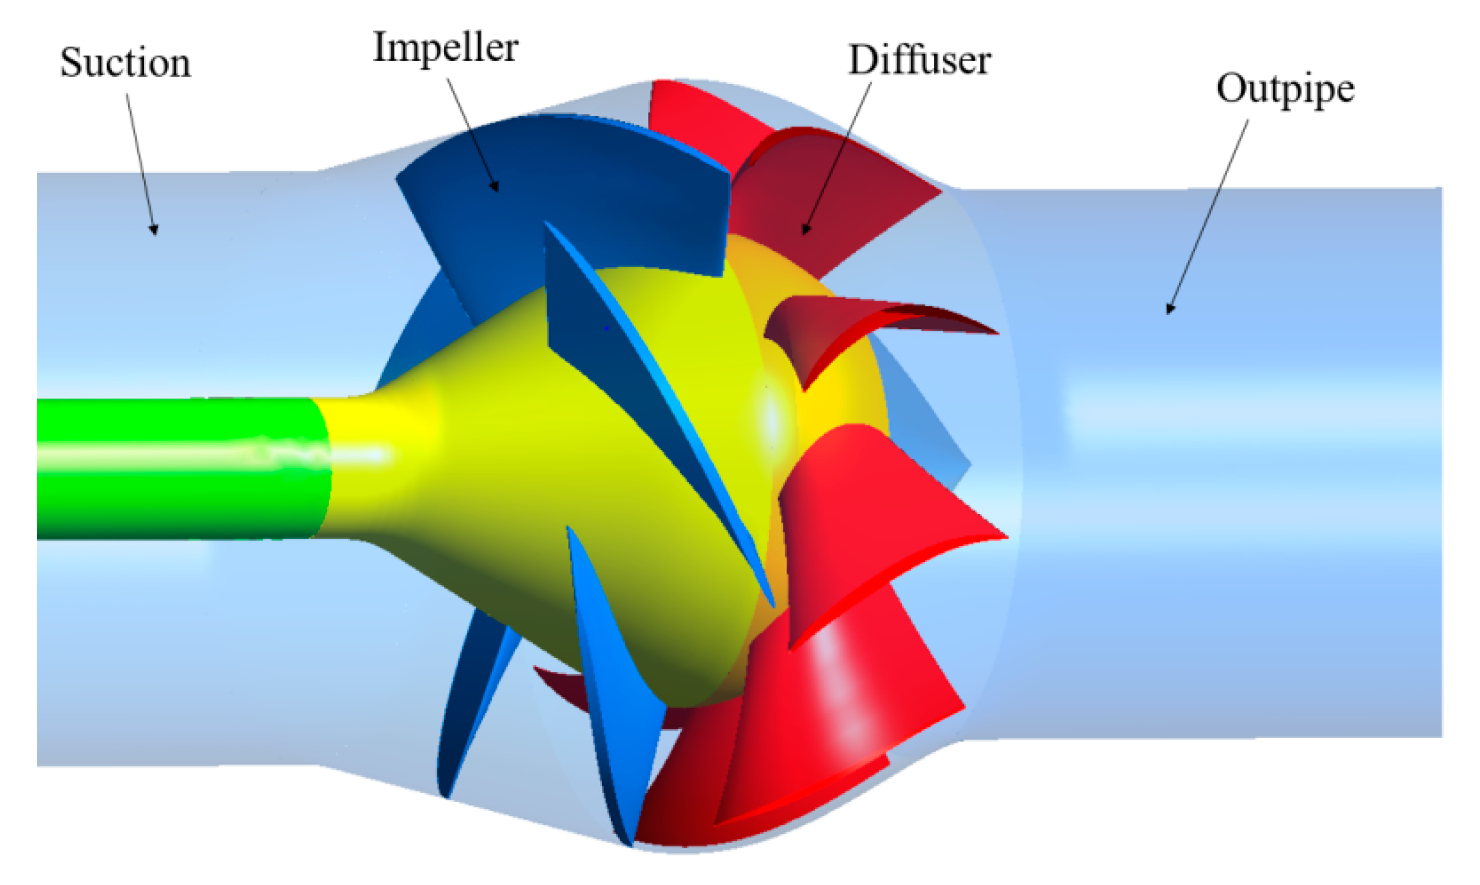
Figure 2.
Water-jet mixed flow pump hydraulic components.
Figure 2.
Water-jet mixed flow pump hydraulic components.
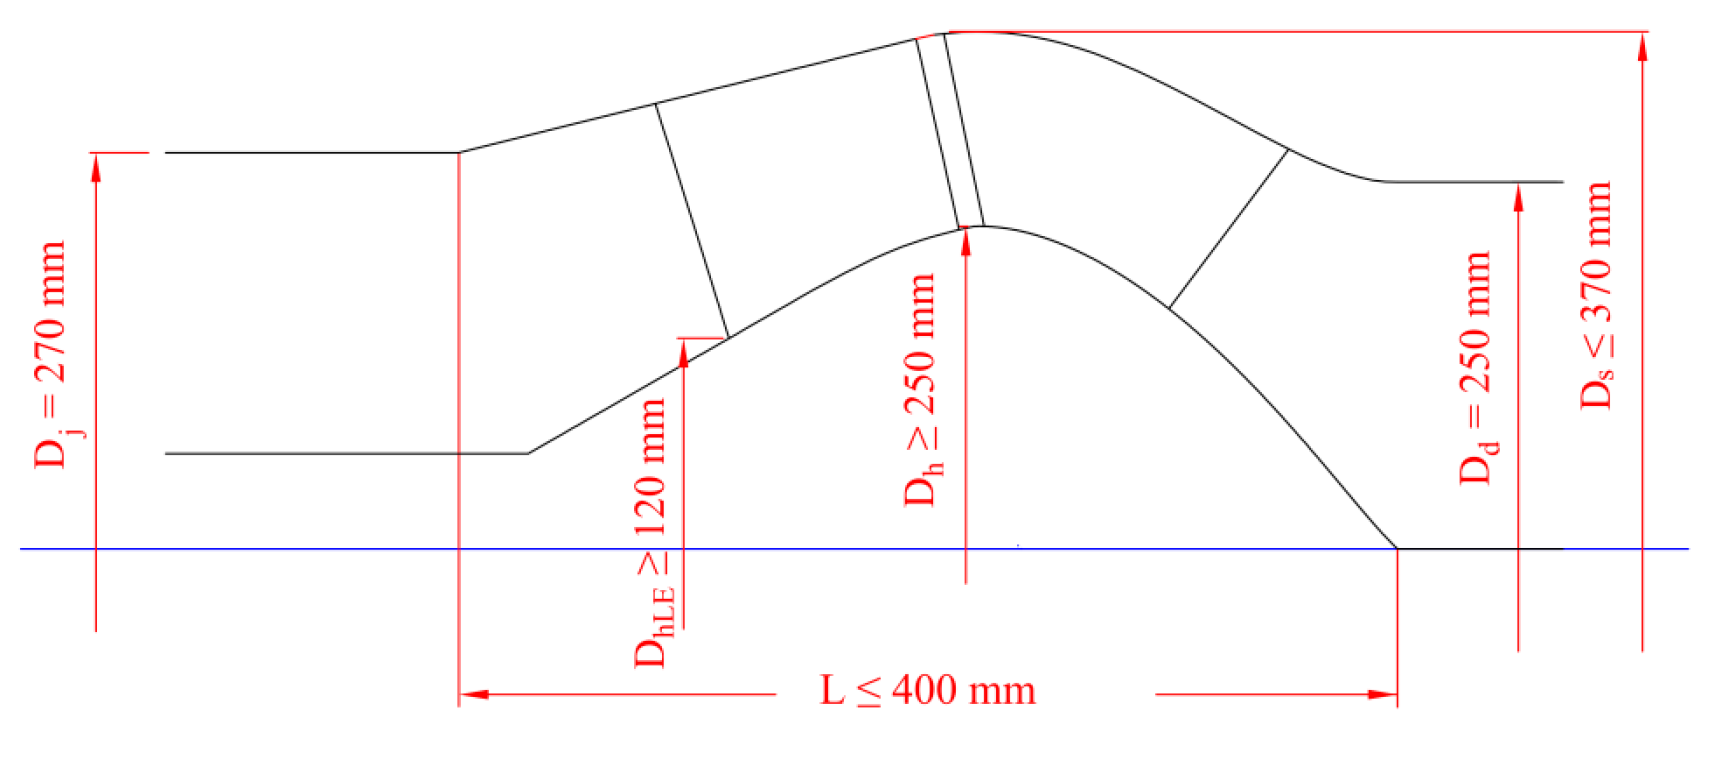
Figure 3.
Parameters of flow passage.
Figure 3.
Parameters of flow passage.
Figure 4.
3D blade shape of water-jet pump initial hydraulic model.
Figure 4.
3D blade shape of water-jet pump initial hydraulic model.
Figure 5.
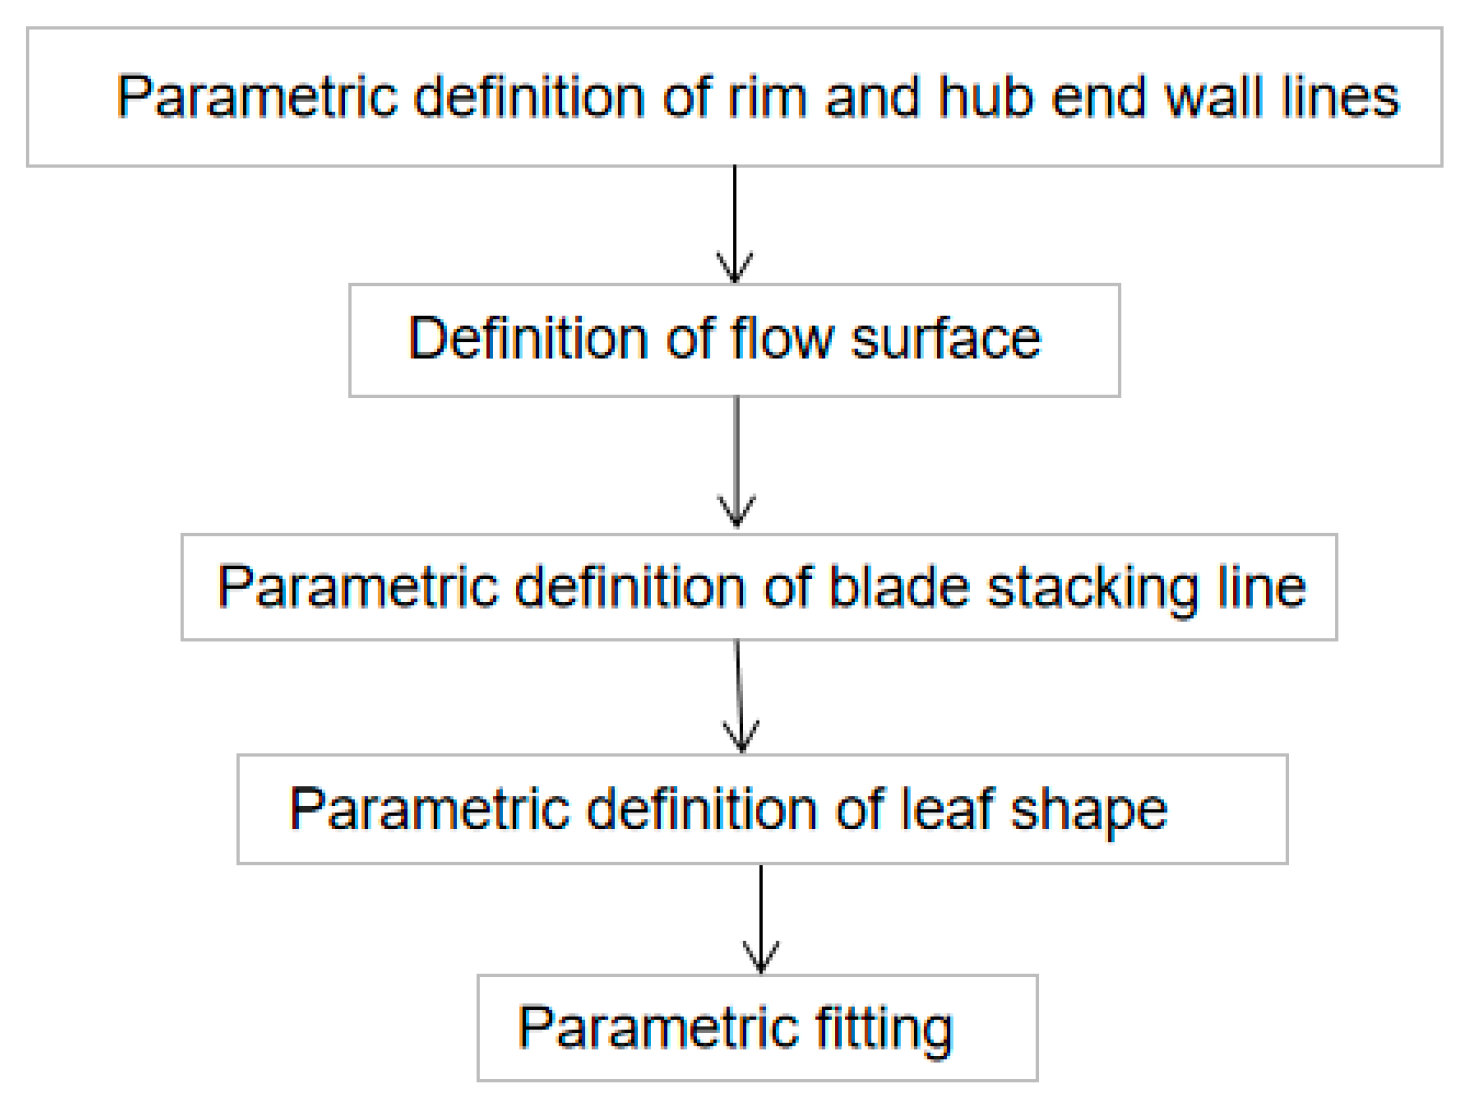
Blade parameterization process.
Figure 5.
Blade parameterization process.
Figure 7.
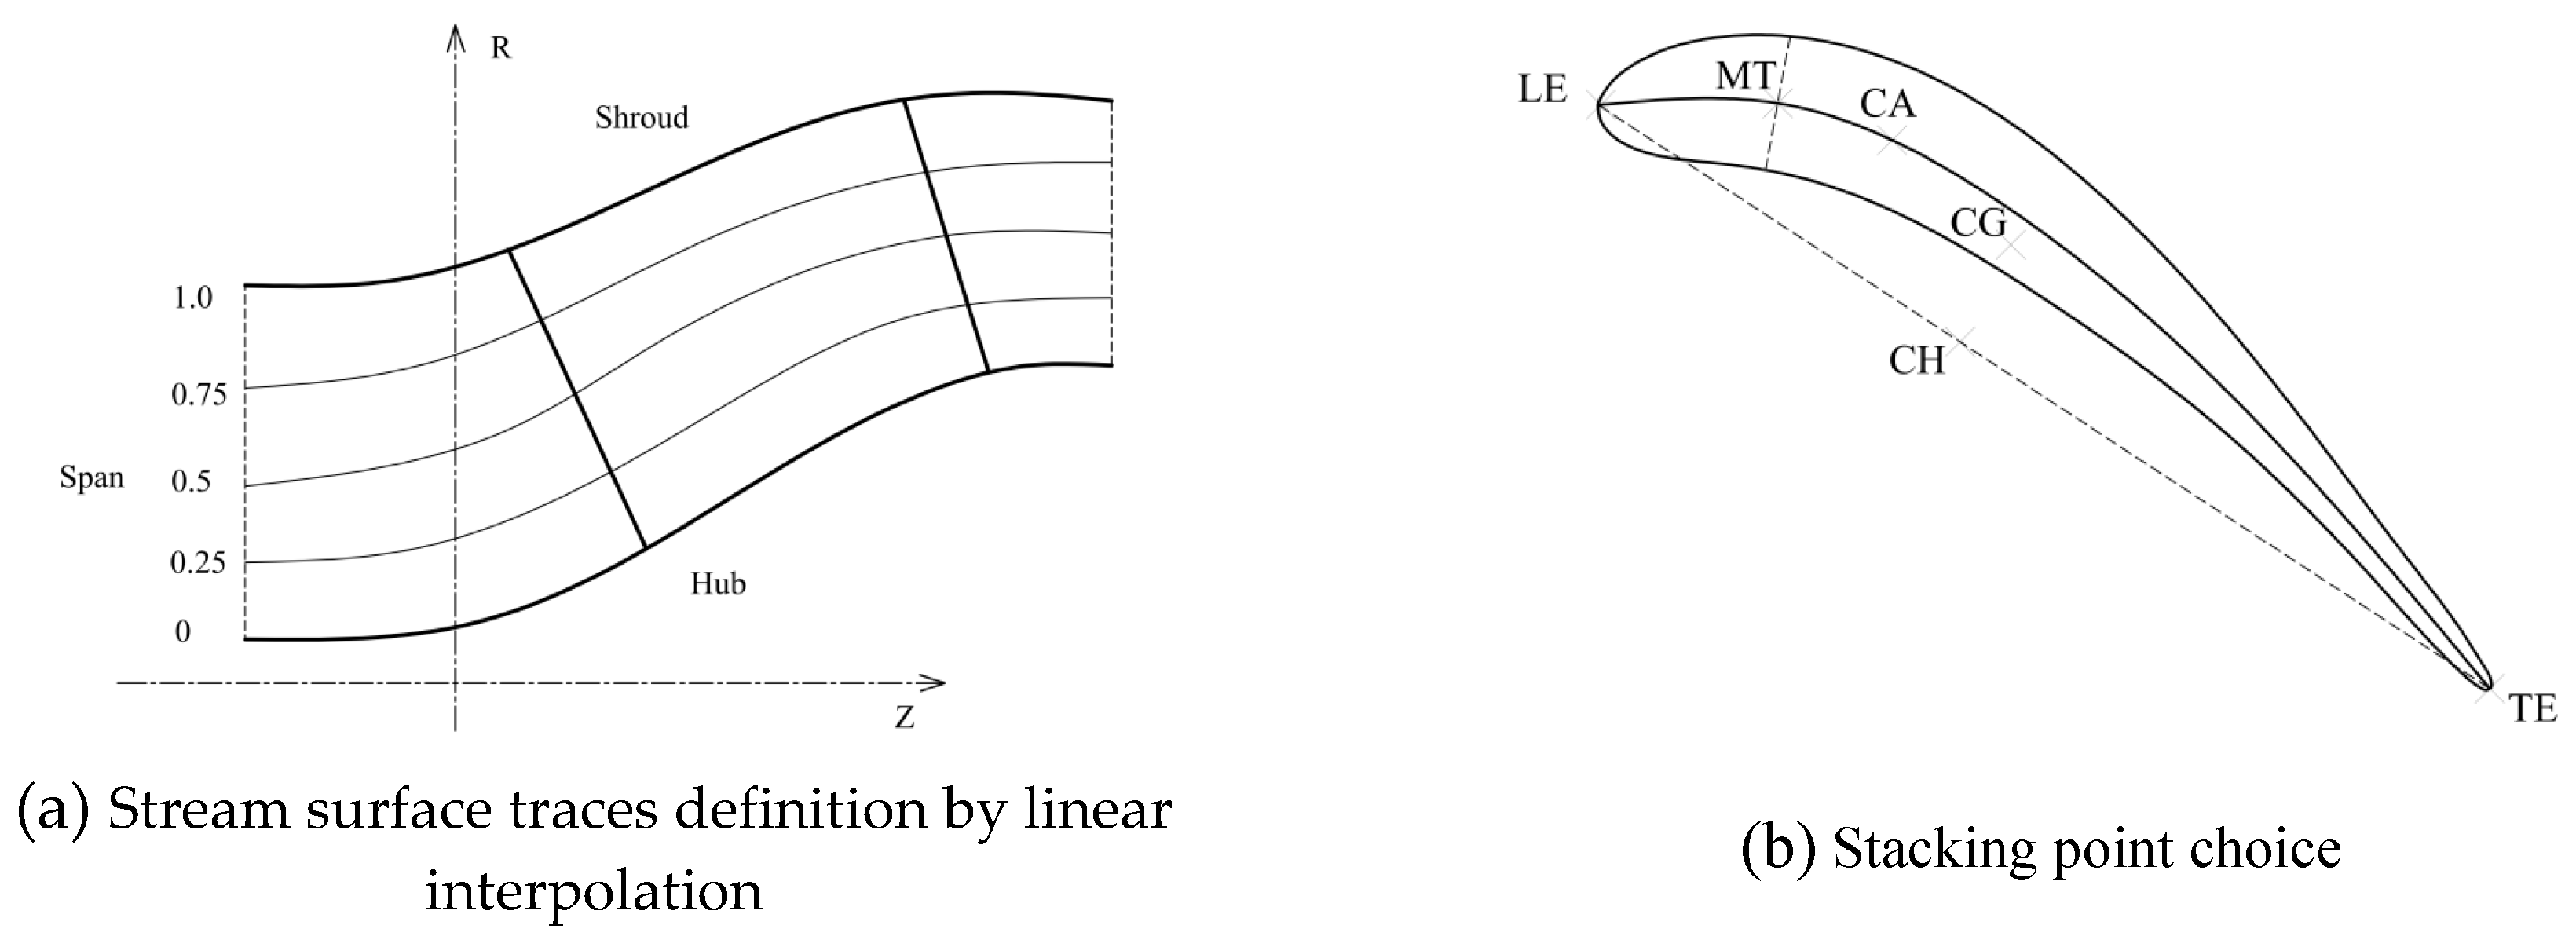
Stream surface traces definition.
Figure 7.
Stream surface traces definition.
Figure 8.
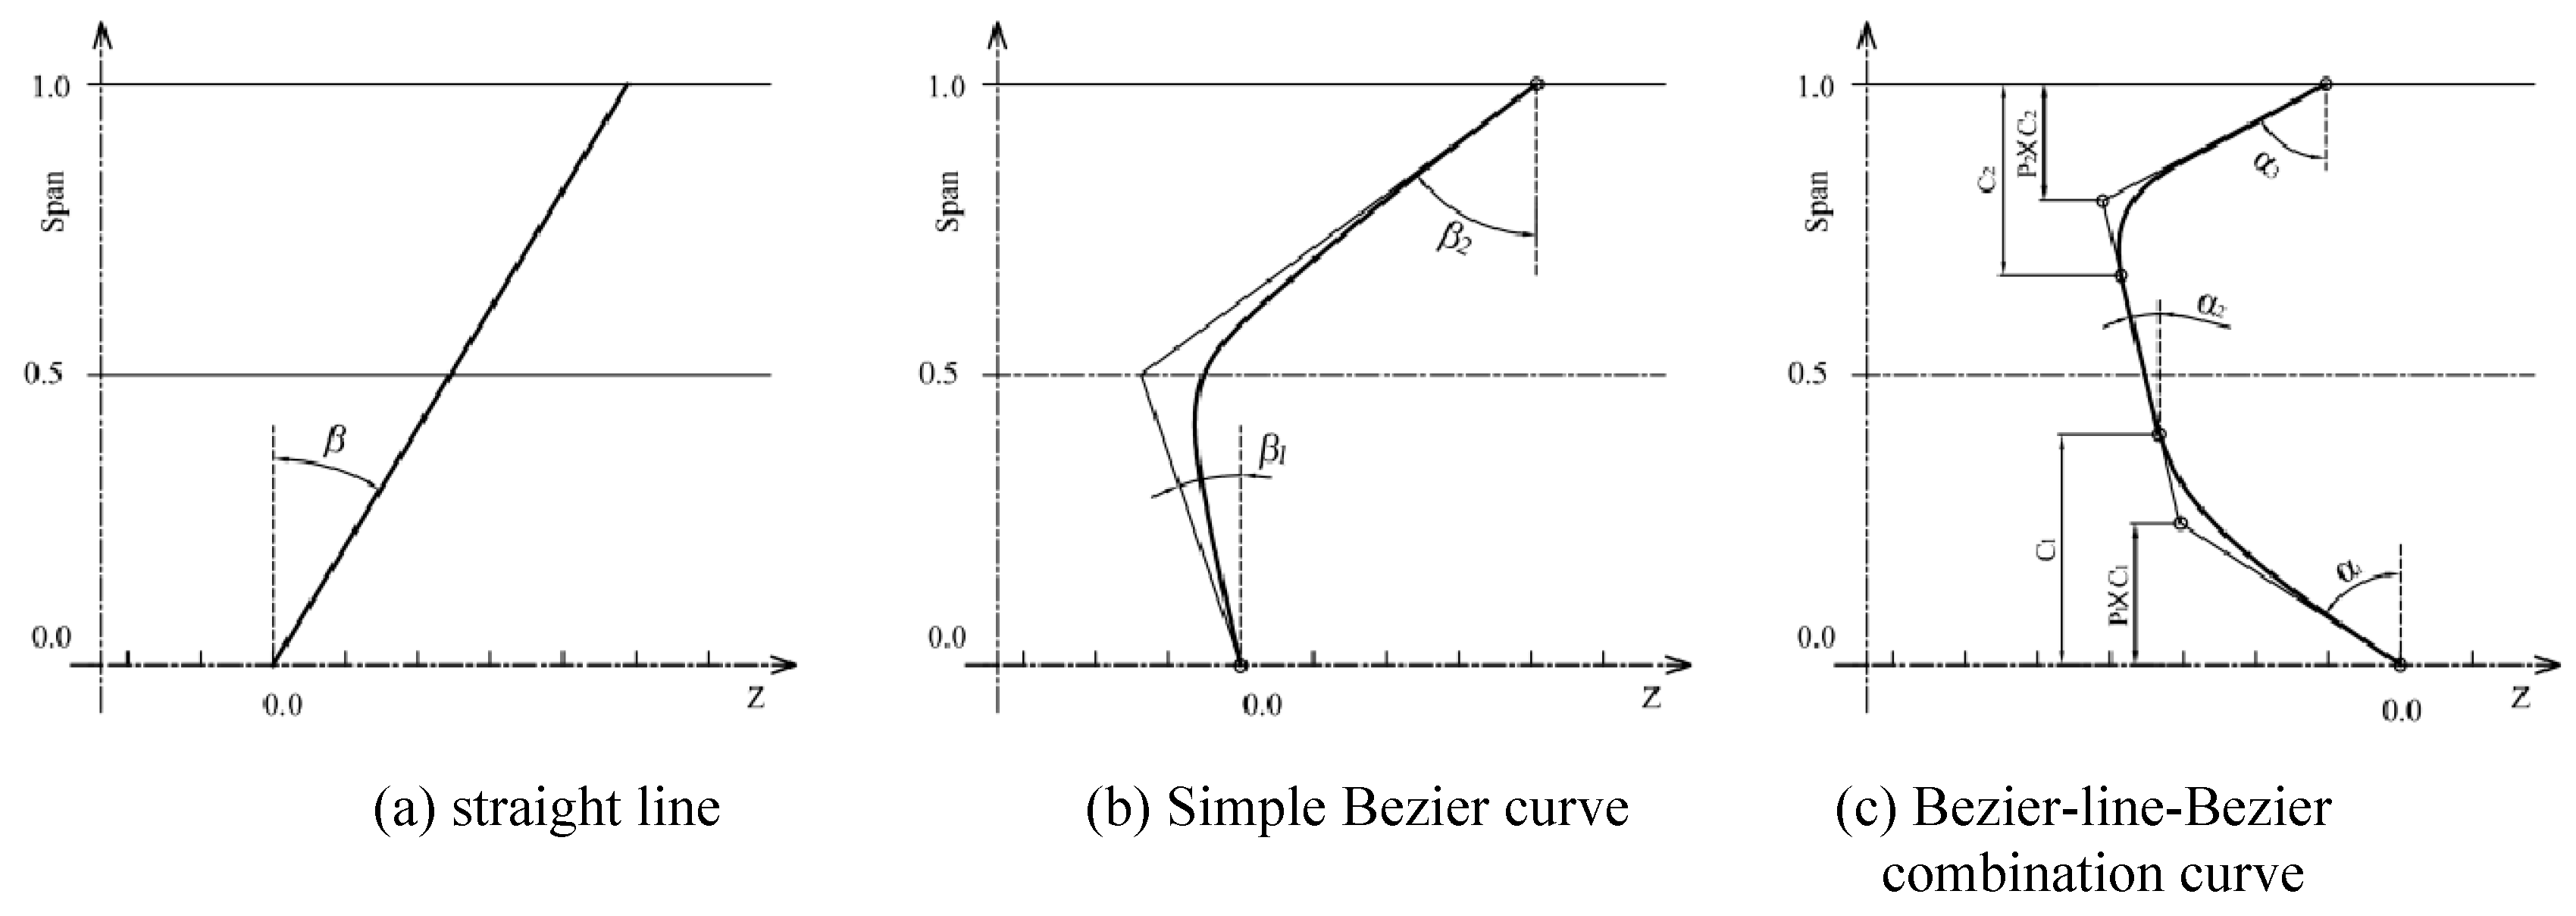
Available sweep law.
Figure 8.
Available sweep law.
Figure 9.
Definition of the camber curve.
Figure 9.
Definition of the camber curve.
Figure 10.
Technical route for optimized design.
Figure 10.
Technical route for optimized design.
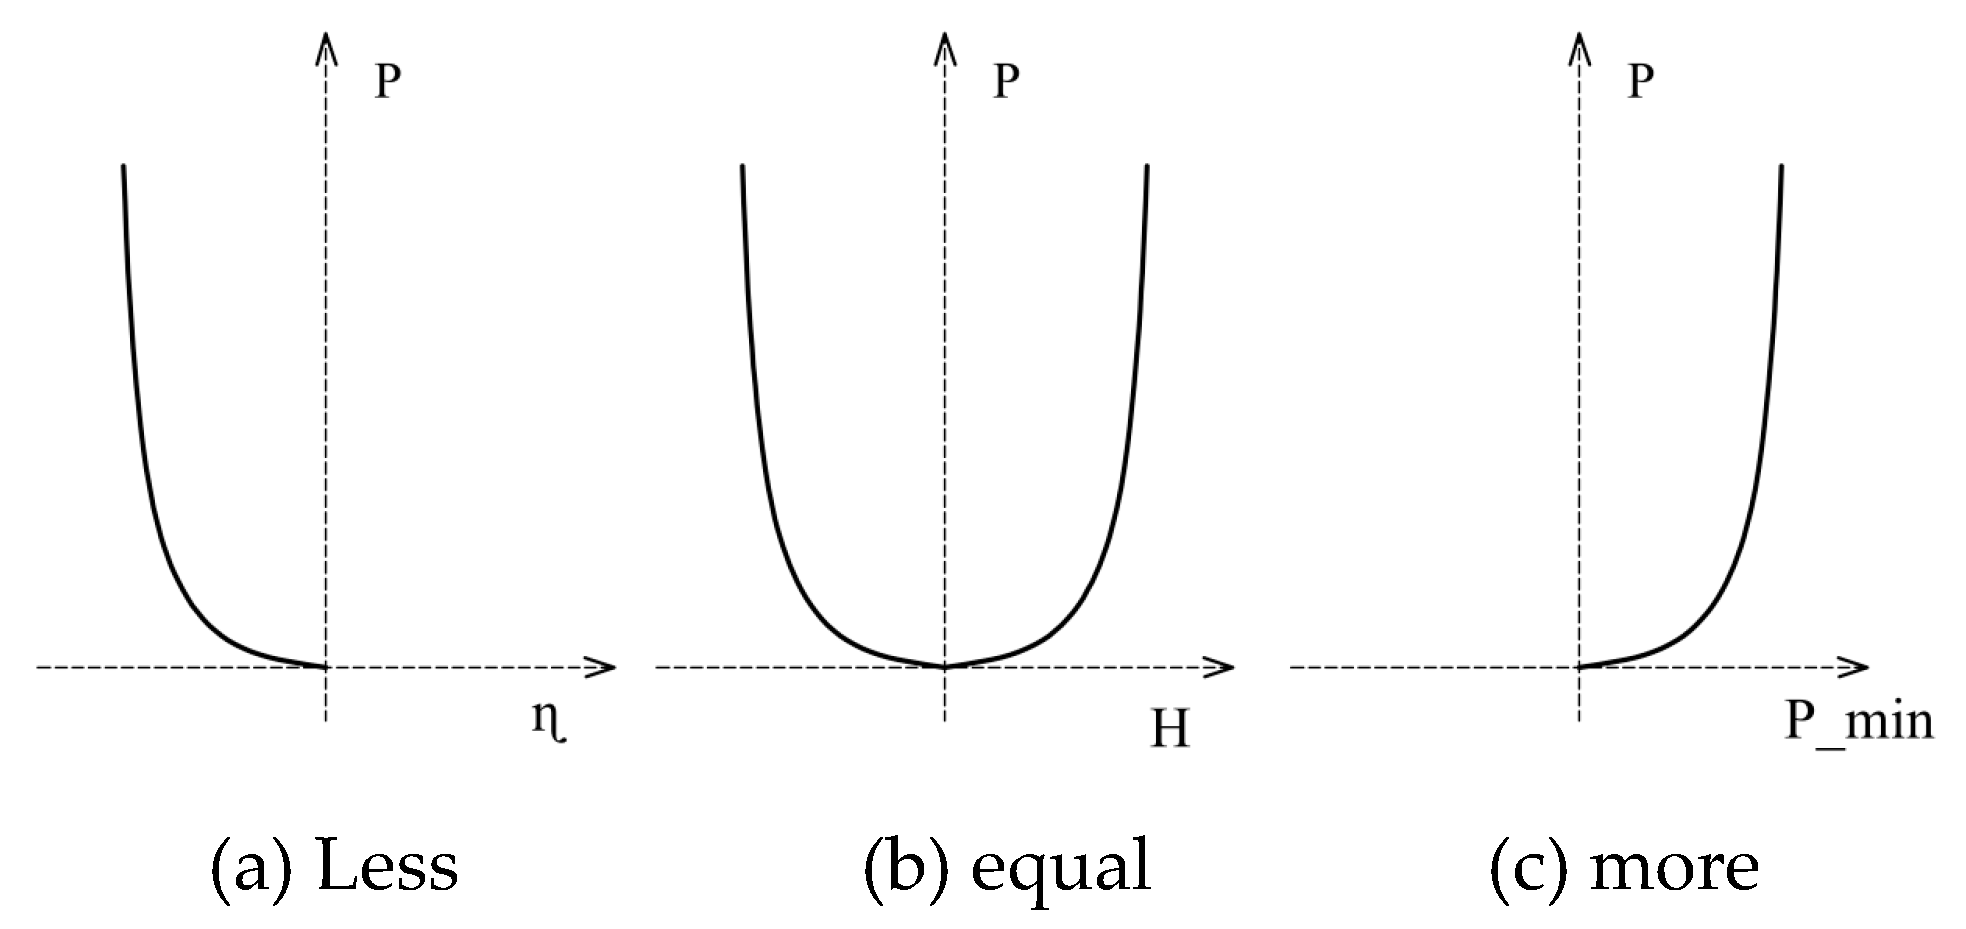
Figure 11.
Penalty objective function.
Figure 11.
Penalty objective function.
Figure 12.
DOE for Latin Hypercube of 3 parameters.
Figure 12.
DOE for Latin Hypercube of 3 parameters.
Figure 13.
Artificial Neural Network.
Figure 13.
Artificial Neural Network.
Figure 14.
Blade geometry of the original impeller and the optimized impeller.
Figure 14.
Blade geometry of the original impeller and the optimized impeller.
Figure 15.
Impeller and diffuser mesh [
32].
Figure 15.
Impeller and diffuser mesh [
32].
Figure 16.
the pressure distribution of Meridian plane.
Figure 16.
the pressure distribution of Meridian plane.
Figure 17.
the velocity distribution of Meridian plane.
Figure 17.
the velocity distribution of Meridian plane.
Figure 18.
the pressure distribution on the blade.
Figure 18.
the pressure distribution on the blade.
Figure 19.
the pressure distribution on different span.
Figure 19.
the pressure distribution on different span.
Figure 20.
Real optimized impeller.
Figure 20.
Real optimized impeller.
Figure 21.
the flow-head curve of CFD and experiment.
Figure 21.
the flow-head curve of CFD and experiment.
Figure 22.
the flow-efficiency curve of CFD and experiment.
Figure 22.
the flow-efficiency curve of CFD and experiment.
Figure 23.
Cavitation performance curves of CFD and experiment.
Figure 23.
Cavitation performance curves of CFD and experiment.
Figure 24.
Cavitation volume fraction αv = 0.1 isosurface in the process of cavitation.
Figure 24.
Cavitation volume fraction αv = 0.1 isosurface in the process of cavitation.
Table 1.
Design Parameters of Water-jet Pump.
Table 1.
Design Parameters of Water-jet Pump.
| Parameter |
Variables |
| Flow rate |
Q = 0.46 m3/s |
| Head |
H ≥ 13 m |
| Rotating speed |
n = 1450 rpm |
Table 2.
Variables, original value and boundary of blade parameters.
Table 2.
Variables, original value and boundary of blade parameters.
| Parameters |
Variables |
Lower bound |
Original value |
Upper bound |
| Γ |
S1_CAMBER_GAMMA |
54.3856 |
56.3856 |
58.3856 |
| S2_CAMBER_GAMMA |
57.8627 |
59.8627 |
62.8627 |
| S3_CAMBER_GAMMA |
60.4048 |
62.4048 |
65.4048 |
| S4_CAMBER_GAMMA |
62.4439 |
64.4439 |
66.4439 |
| S5_CAMBER_GAMMA |
64.0463 |
66.0463 |
68.0463 |
| β1
|
S1_CAMBER_BETA1 |
55.0341 |
58.0341 |
61.0341 |
| S2_CAMBER_BETA1 |
58.8031 |
61.8031 |
64.8031 |
| S3_CAMBER_BETA1 |
62.1567 |
65.1567 |
68.1567 |
| S4_CAMBER_BETA1 |
61.4439 |
64.4439 |
67.4439 |
| S5_CAMBER_BETA1 |
65.7197 |
68.7197 |
71.7197 |
| β2
|
S1_CAMBER_BETA2 |
45.5651 |
48.5651 |
51.5651 |
| S2_CAMBER_BETA2 |
50.6644 |
53.6644 |
56.66436 |
| S3_CAMBER_BETA2 |
53.3824 |
56.3824 |
59.3824 |
| S4_CAMBER_BETA2 |
57.3875 |
60.3875 |
63.3875 |
| S5_CAMBER_BETA2 |
55.6307 |
58.6307 |
61.6307 |
| β |
LEAN_BETA |
1.5408 |
2.5408 |
4.5408 |
Table 3.
Comparison of the hydraulic performance between with Original and Optimized model.
Table 3.
Comparison of the hydraulic performance between with Original and Optimized model.
| Parameter |
Pump Head H |
Pump Efficiency η |
Impeller Head Hi |
Impeller Efficiency ηi
|
Pump Power P |
| unit |
M |
% |
m |
% |
kW |
| Original model |
13.12 |
88.04 |
14.27 |
95.98 |
66.88 |
| Optimized model |
13.51 |
89.28 |
14.54 |
96.33 |
67.91 |
